Bay Area Real Estate Market Survey: September 2022

Compass early September 2022 San Francisco Bay Area real estate survey, with a Golden Gate Bridge panorama and market-data overview.
Satellite map of the San Francisco Bay Area with Compass branding.
Bay Area August 2022 real estate market summary, with statistics on prices, listings, sales, and days on market.
Bay Area home prices and year-over-year appreciation rates
Chart of Bay Area median house prices by month, 2018–2022, with peaks in spring 2022.
Chart of Bay Area home price appreciation, peaking at 23% in spring 2021 before dropping to -2% in July and August 2022.
Chart of Bay Area median condo prices, January 2018–August 2022, with monthly values and pandemic-era price trends.
Real estate market survey slide explaining overbidding, buyer demand, and strategic underpricing.
Chart of Bay Area home sales over list price, peaking in April 2022 before declining to 44% by August.
Bar chart of Bay Area sale prices versus list prices, peaking above 111% in April 2022 before falling below asking by August.
Chart of Bay Area average days on market from 2018 to 2022, with monthly bars and spring and pandemic markers.
Active listings and price reductions: market factors, a cooling-market indicator, and a data disclaimer.
Line chart comparing Bay Area new listings in 2021 and 2022; August 2022 listings were down about 22%.
Line chart comparing Bay Area active listings in 2021 and 2022 from January through August.
Line chart of Bay Area active listings, showing monthly inventory trends from 2018 to 2022.
Chart comparing Bay Area monthly listing price reductions in 2021 and 2022; 2022 peaks at 3,460 in July.
Listings accepting offers are explained as a forward indicator of real estate market activity and demand.
Chart comparing Bay Area pending home listings in 2021 and 2022, showing a 34% year-over-year August decline.
Line chart comparing Bay Area listings going into contract in 2021 and 2022; 2022 falls to 29% in July.
Market survey slide explaining that closed sales lag offers by three to six weeks and sales volume follows seasonal trends.
Bay Area monthly home sales chart comparing 2021 and 2022, with sales rising in August 2022 after a July low.
Line chart of monthly Bay Area home sales from 2019 to 2022, with the June 2021 peak circled.
Luxury home sales market-survey slide discussing high-price segments and seasonal Bay Area sales activity.
Chart comparing monthly Bay Area home sales over $3 million in 2021 and 2022, with August sales down 31% year over year.
Chart of Bay Area luxury home sales over $3 million from January 2018 to August 2022.
Line chart comparing monthly Bay Area home sales over $5 million in 2021 and 2022, with August sales down 26%.
Market data slide titled “Longer-Term Trends & Additional Market Context Data,” with a disclaimer and Compass branding.
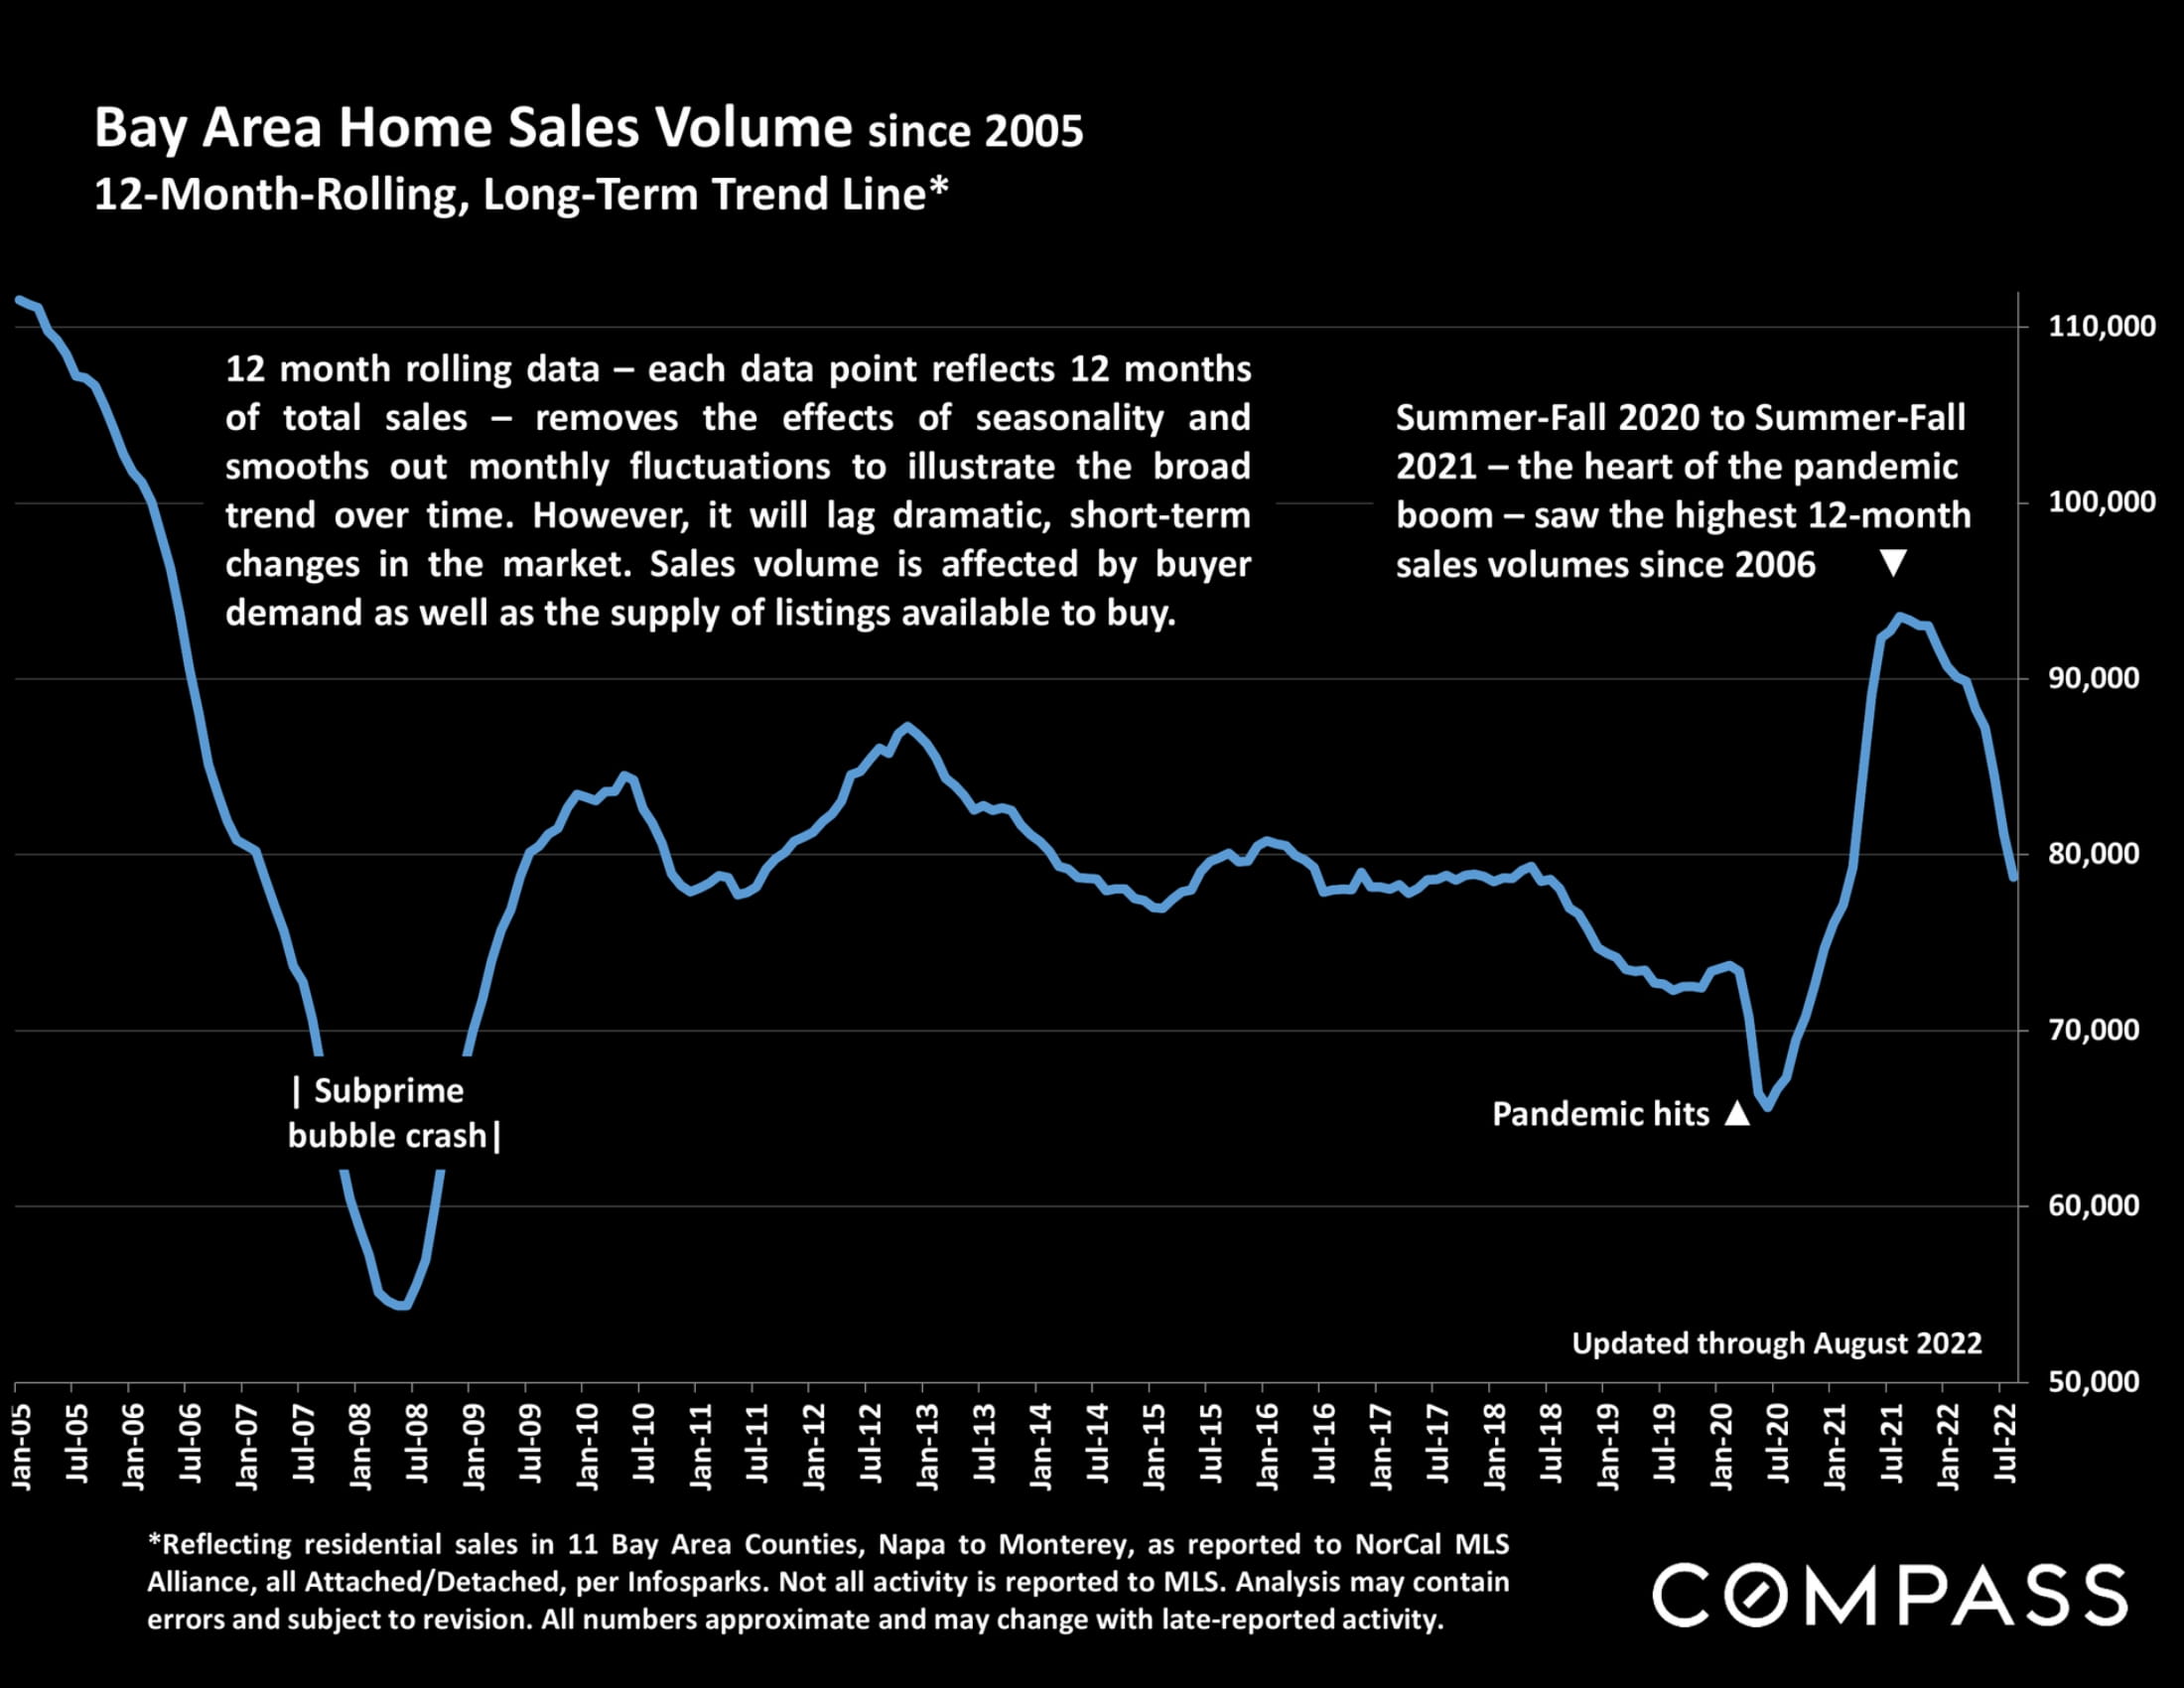
Bay Area home sales volume chart from 2005 to 2022, with the pandemic-era surge and later decline highlighted.
Chart of Bay Area median home prices from 1990 to 2022 YTD, with green bars and annotations for market cycles.
Chart tracking Bay Area home price appreciation from 1990 to 2022, highlighting the 2000 and 2013 peaks.
Bar chart of Q2 2022 median home prices across 11 Bay Area counties, from $2.27 million in San Mateo to $625,000 in Solano.
Chart comparing minimum income to buy a median-priced house by county or region in Q2 2022 and Q2 2021.
Bay Area housing affordability trend chart, 1991–Q2 2022, with recessions and housing market cycles marked.
Line chart of median Bay Area home sale prices by county, 1990–2022 YTD, showing sharp recent increases.
Line chart comparing annual median single-family home sale prices across five Bay Area counties, 1990–2022 YTD.
Bay Area home value table comparing median prices, square footage, and price per square foot across eleven counties.
Bay Area median home values table comparing condo and townhouse sales across counties, May–July 2022.
Bay Area county housing-unit estimates shown in a pie chart, with Santa Clara and Alameda as the largest slices.
Bar chart comparing 2010–2021 population estimates across ten Bay Area counties; Santa Clara has the largest population.
Pie chart comparing Bay Area county land areas in square miles, with Monterey largest at 3,281 and San Francisco smallest at 47.
Infographic comparing population density across Bay Area counties, with San Francisco far above the others.
San Francisco Bay Area luxury home market report promotion with an ornate garden gate and report link.
Bay Area real estate market infographic with charts on mortgage rates, consumer sentiment, financial markets, inflation, and local market factors.
San Francisco Bay Area home price appreciation report, illustrated with city, vineyard, bridge, and hillside views.
Bay Area market reports webpage promoting Compass reports, with regional report previews and Bay Area landscape photos.
Chart comparing San Francisco Bay Area brokerage market share, with Compass leading by dollar-volume MLS sales.
Market report disclaimer page defining real estate statistics and data limitations, with the Compass wordmark at bottom right.


WORK WITH US

We offer the highest level of service and expertise to our clients. Our team has built a reputation for consistently representing the finest real estate in San Francisco and Napa Valley. Results driven and dedicated to your success, whether buying, selling, renting or investing. Contact us today for a private consultation.

Contact Us