Diablo Valley Real Estate

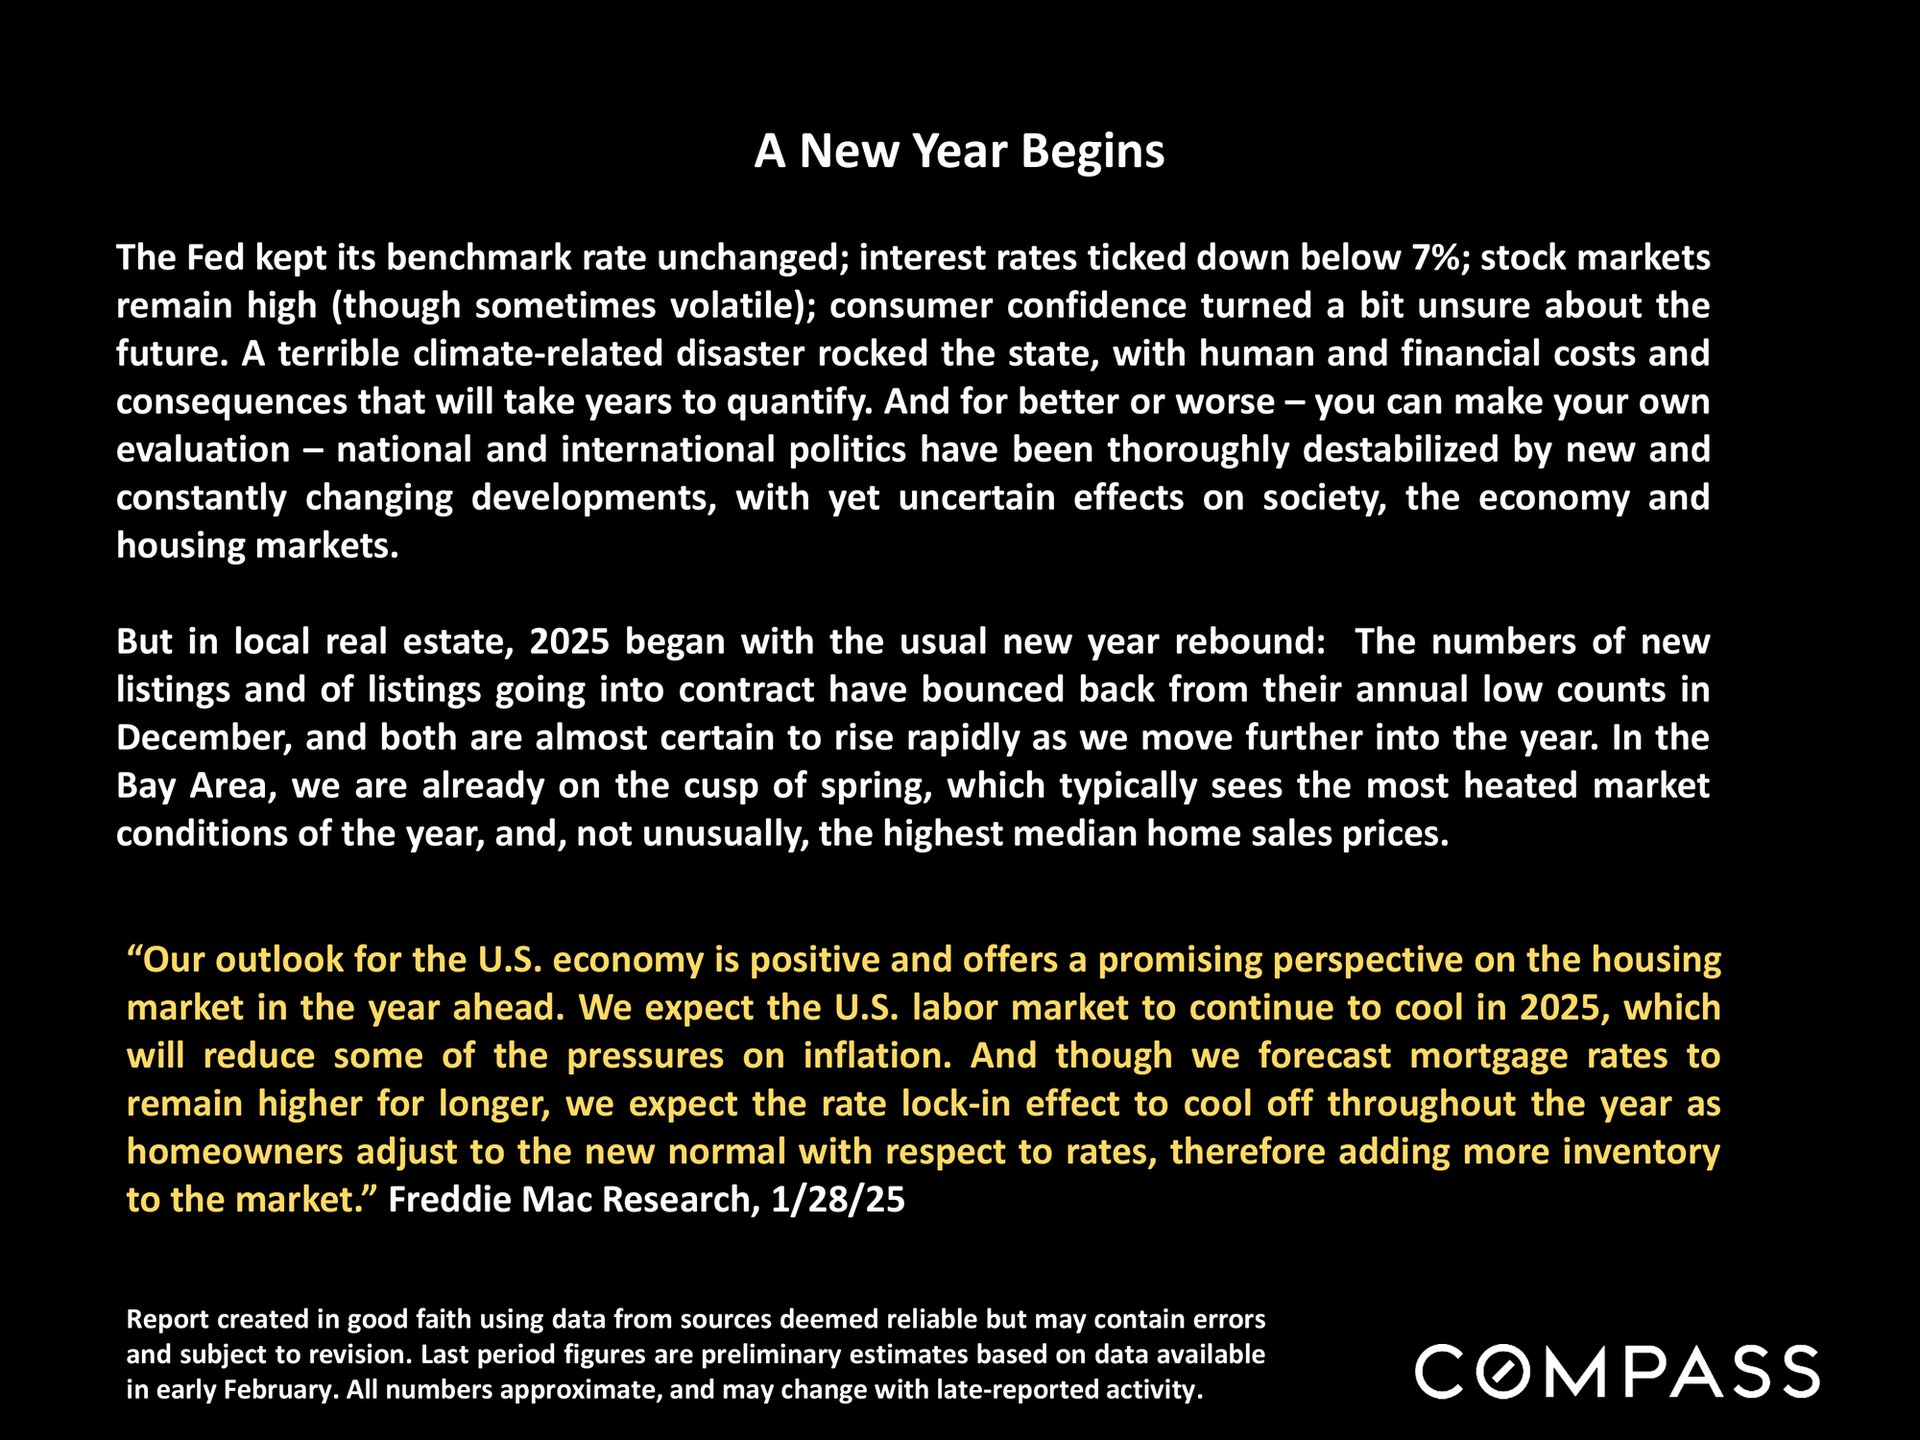
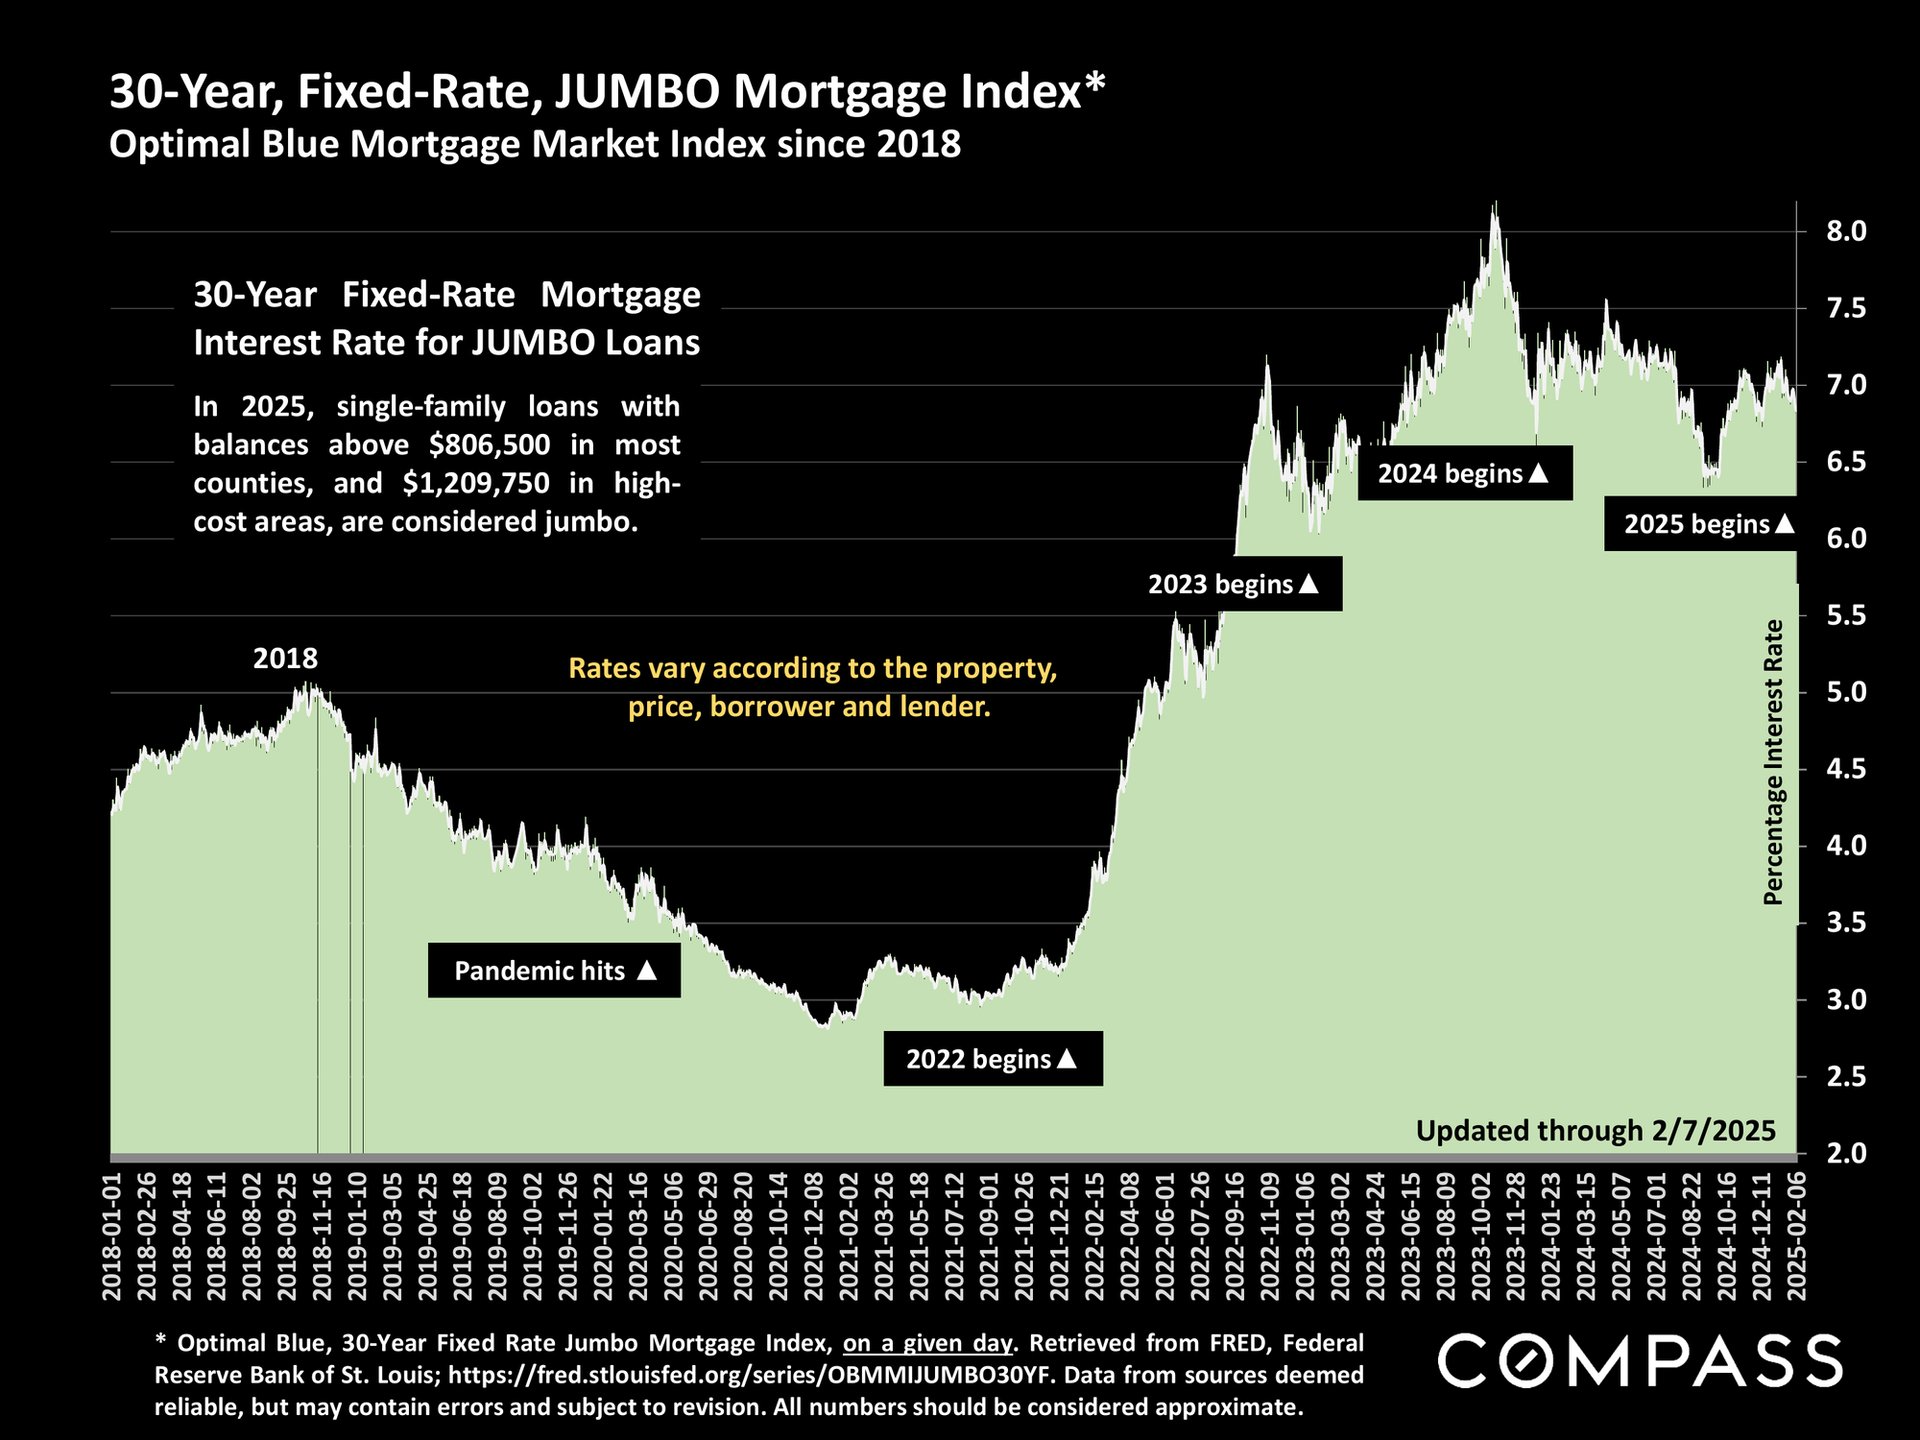
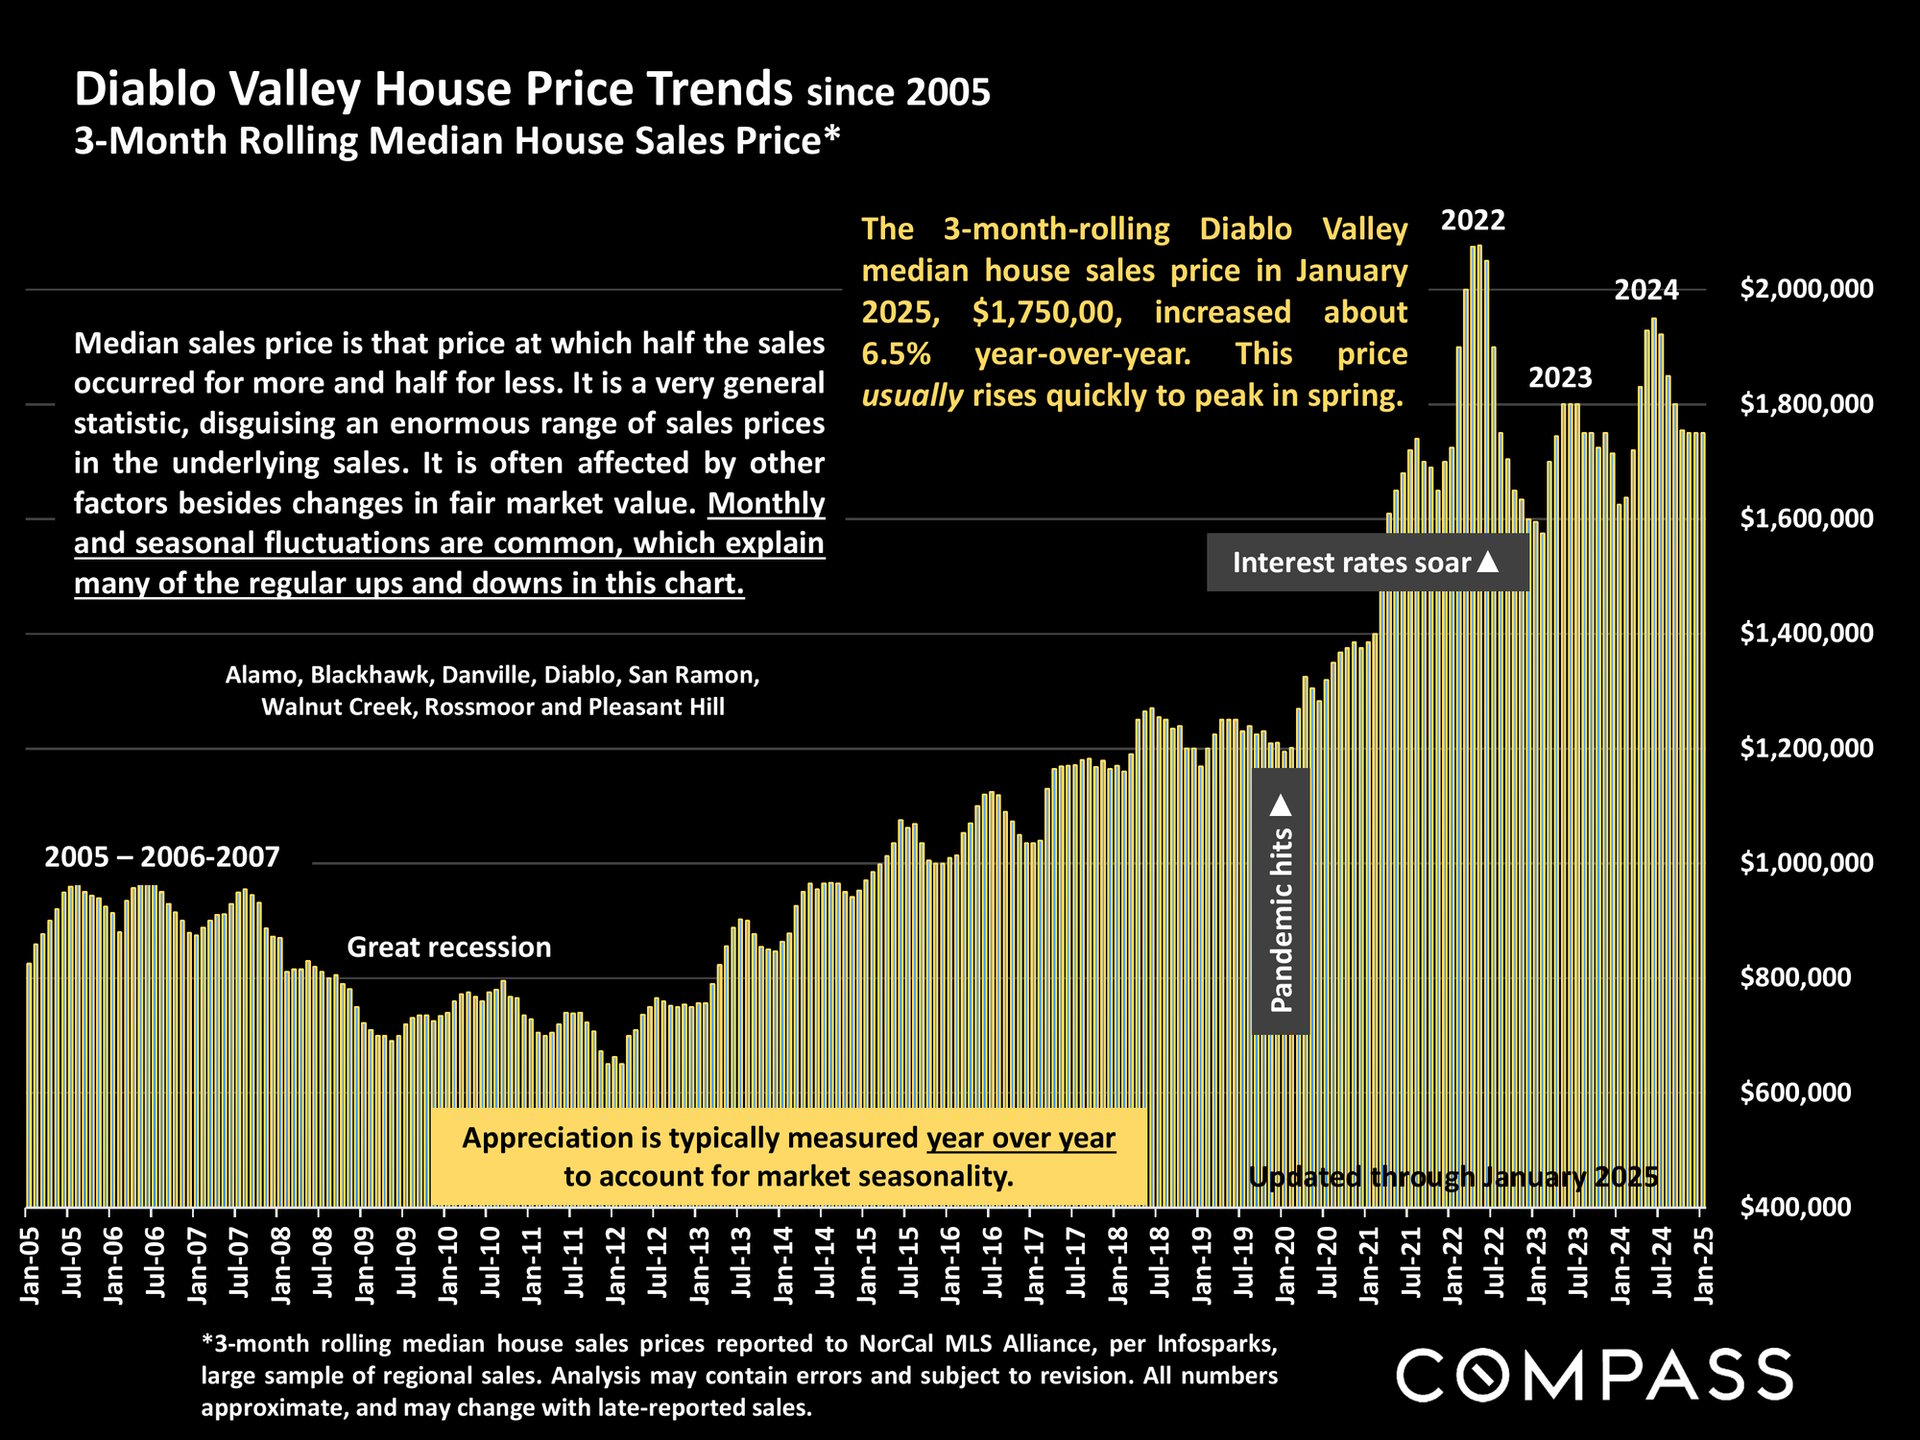
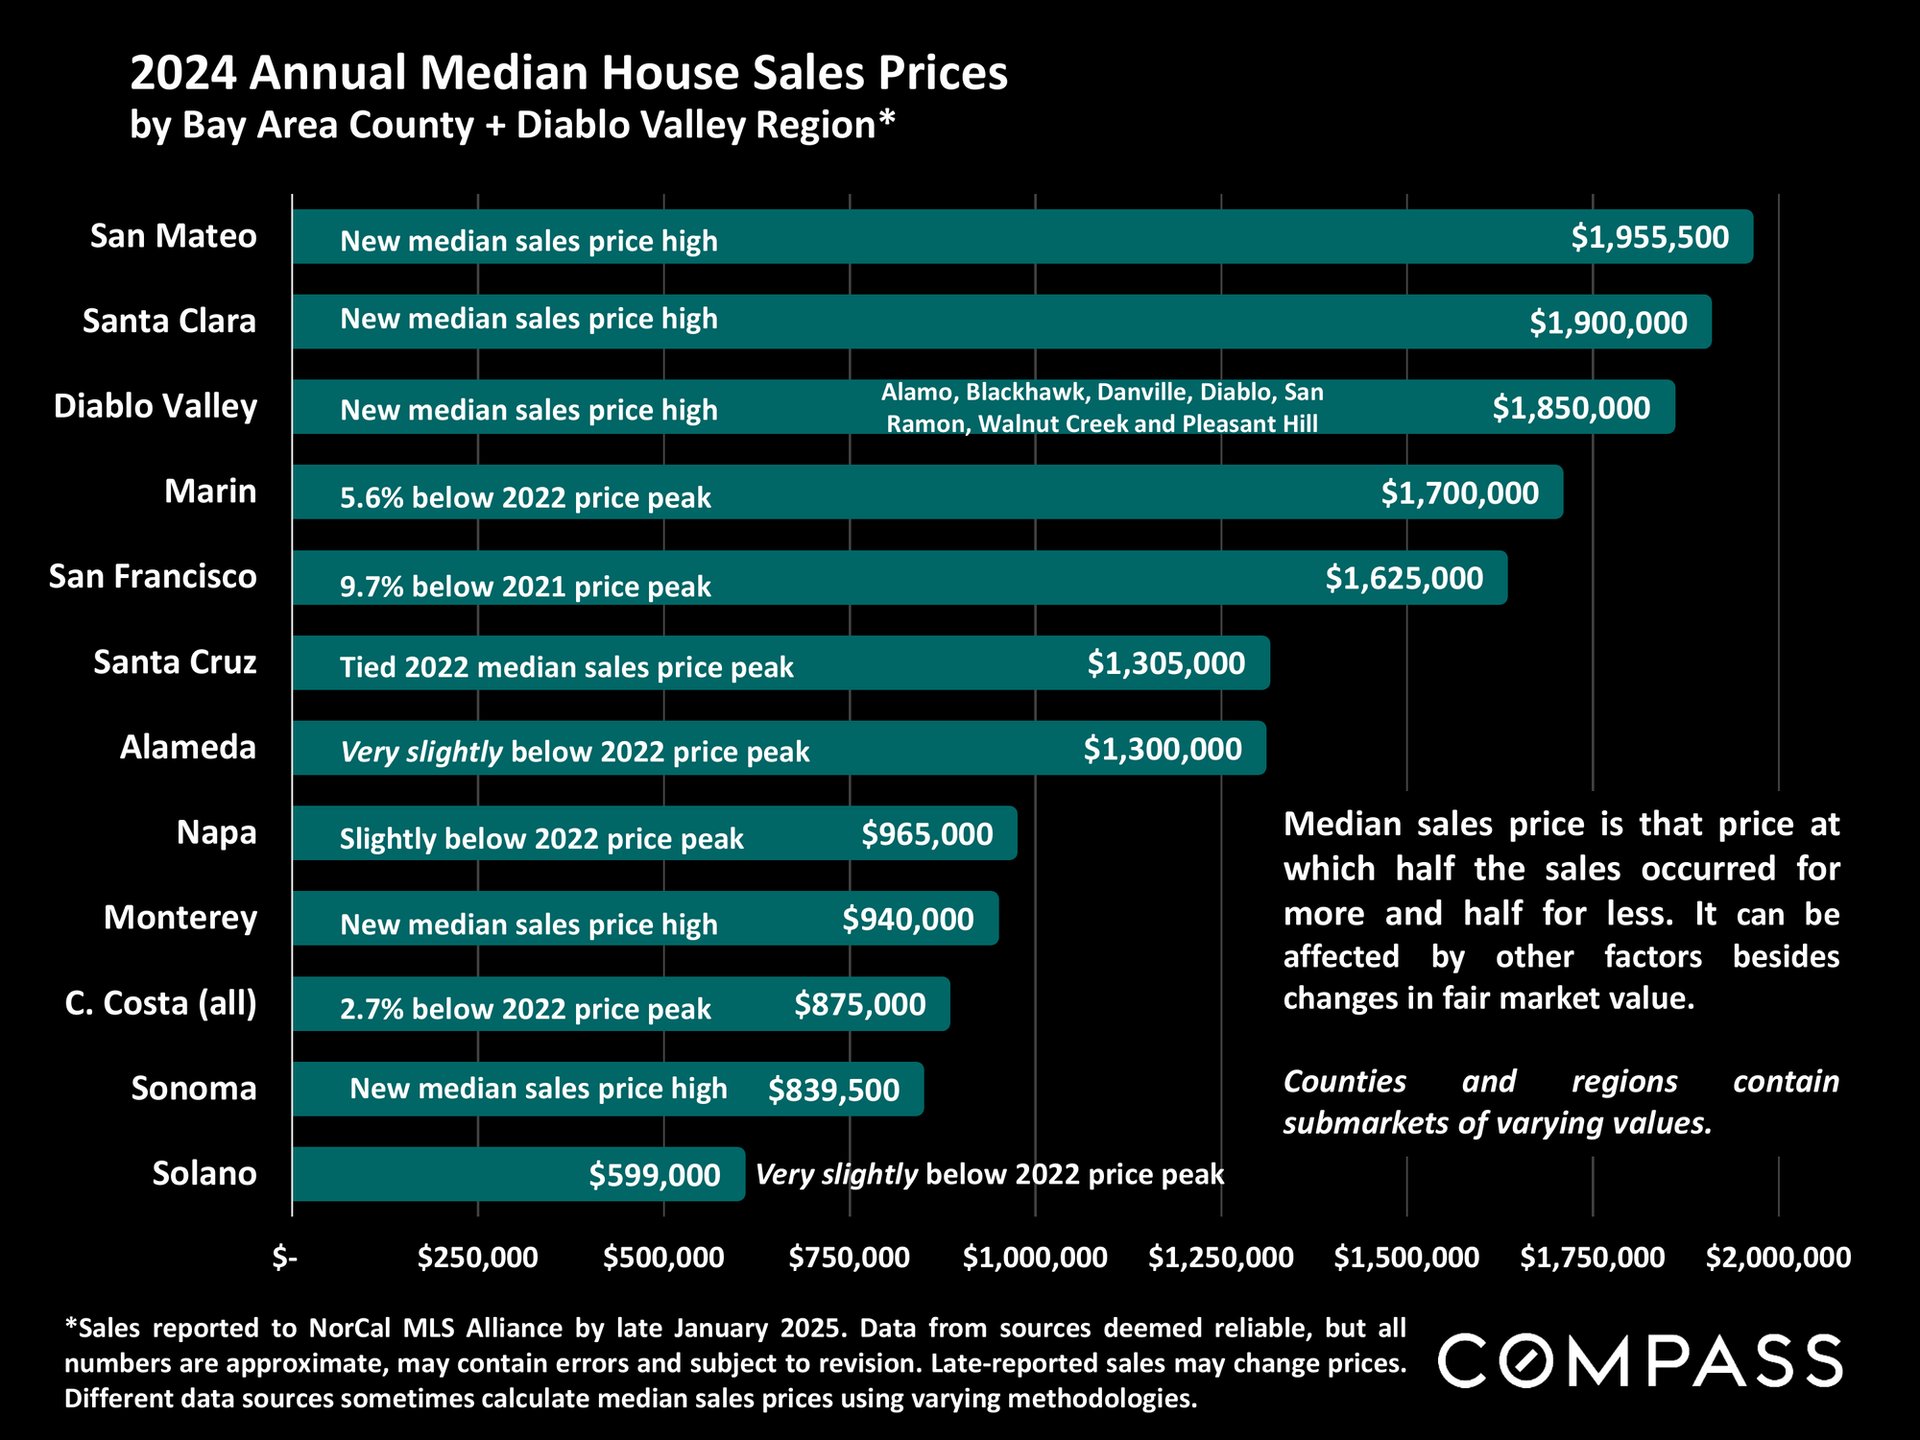
Diablo Valley Real Estate February 2025 report cover, featuring a wooded ravine waterfall.Real estate market update on 2025 listings, Bay Area prices, interest rates, and the economic outlook.Compass chart of 30-year fixed-rate jumbo mortgage rates from 2018 to February 2025.Diablo Valley home-price infographic charts median sale prices from 2005 to January 2025, with recession and pandemic annotations.Chart comparing 2024 median home sale prices across Bay Area counties and the Diablo Valley region.
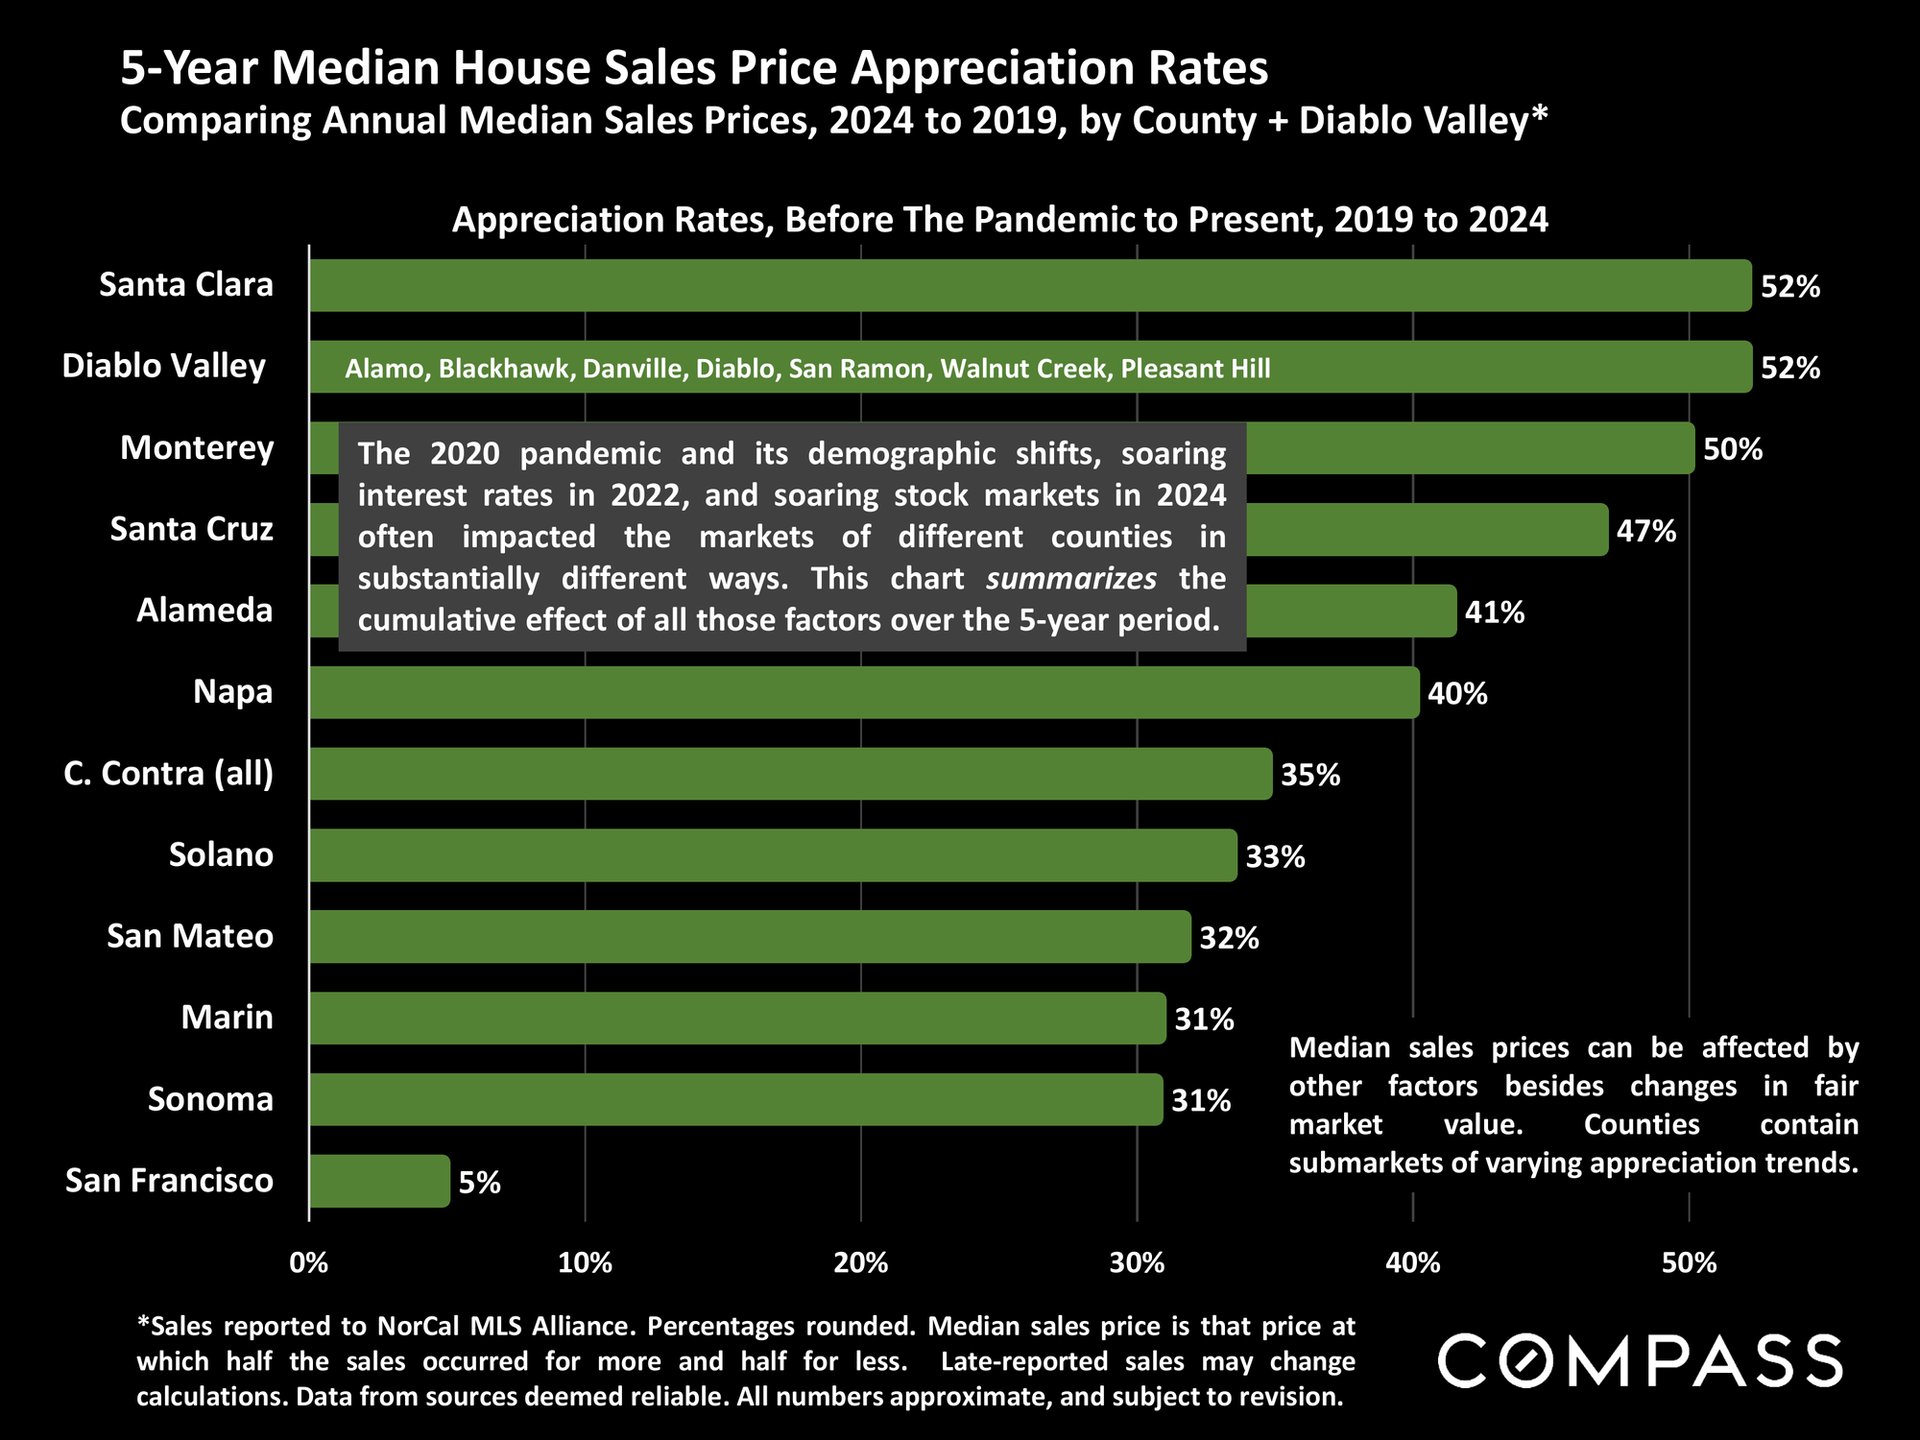
Chart comparing 2019–2024 home price appreciation, led by Santa Clara and Diablo Valley at 52%.
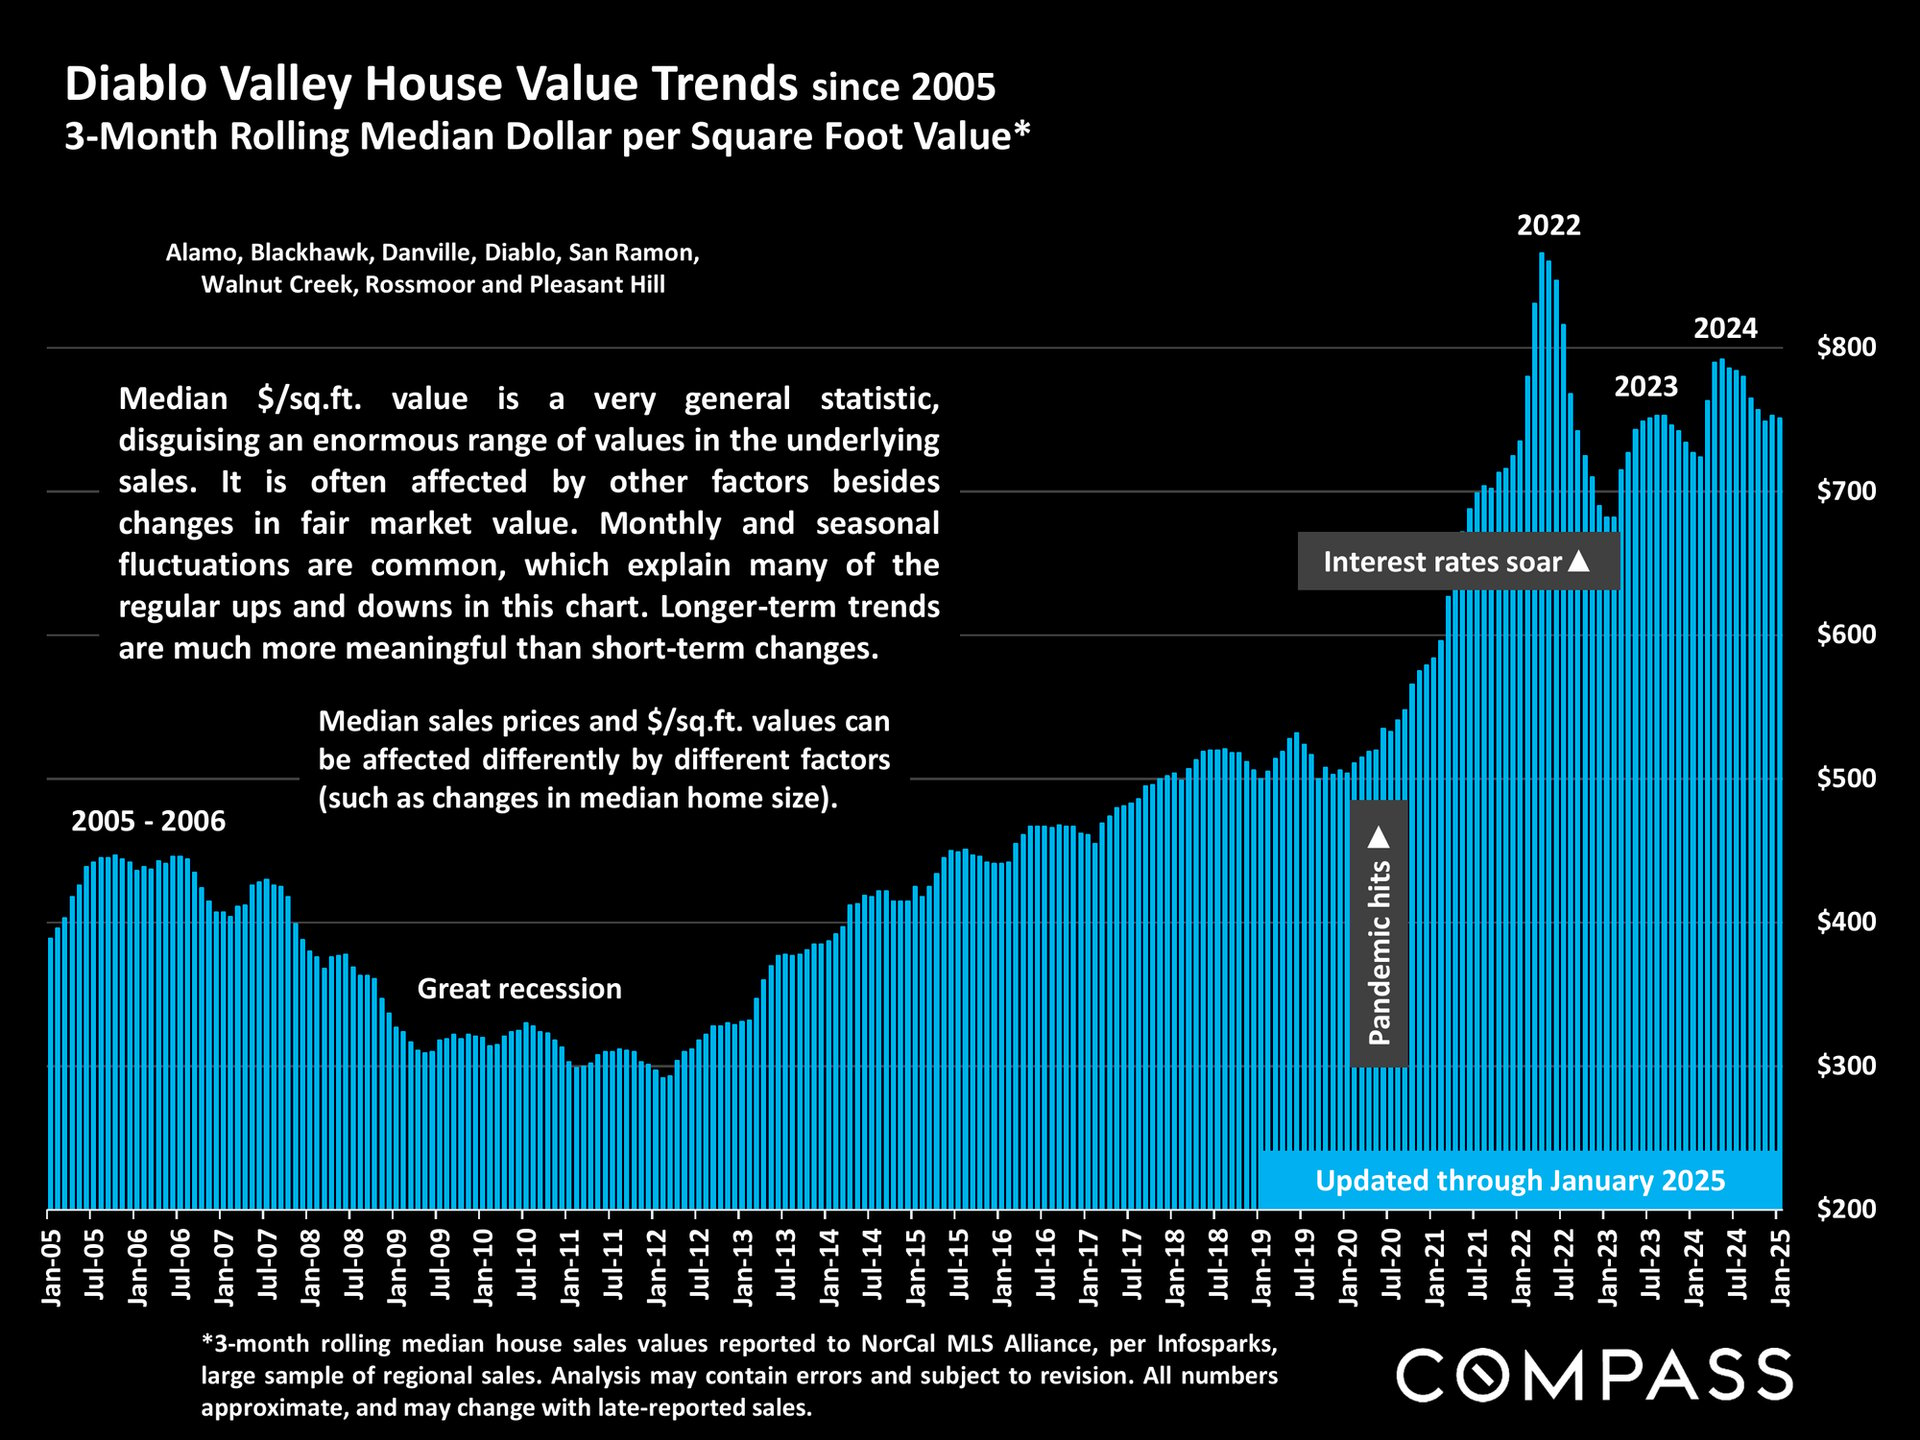
Diablo Valley home value chart, showing per-square-foot trends from 2005 through January 2025.
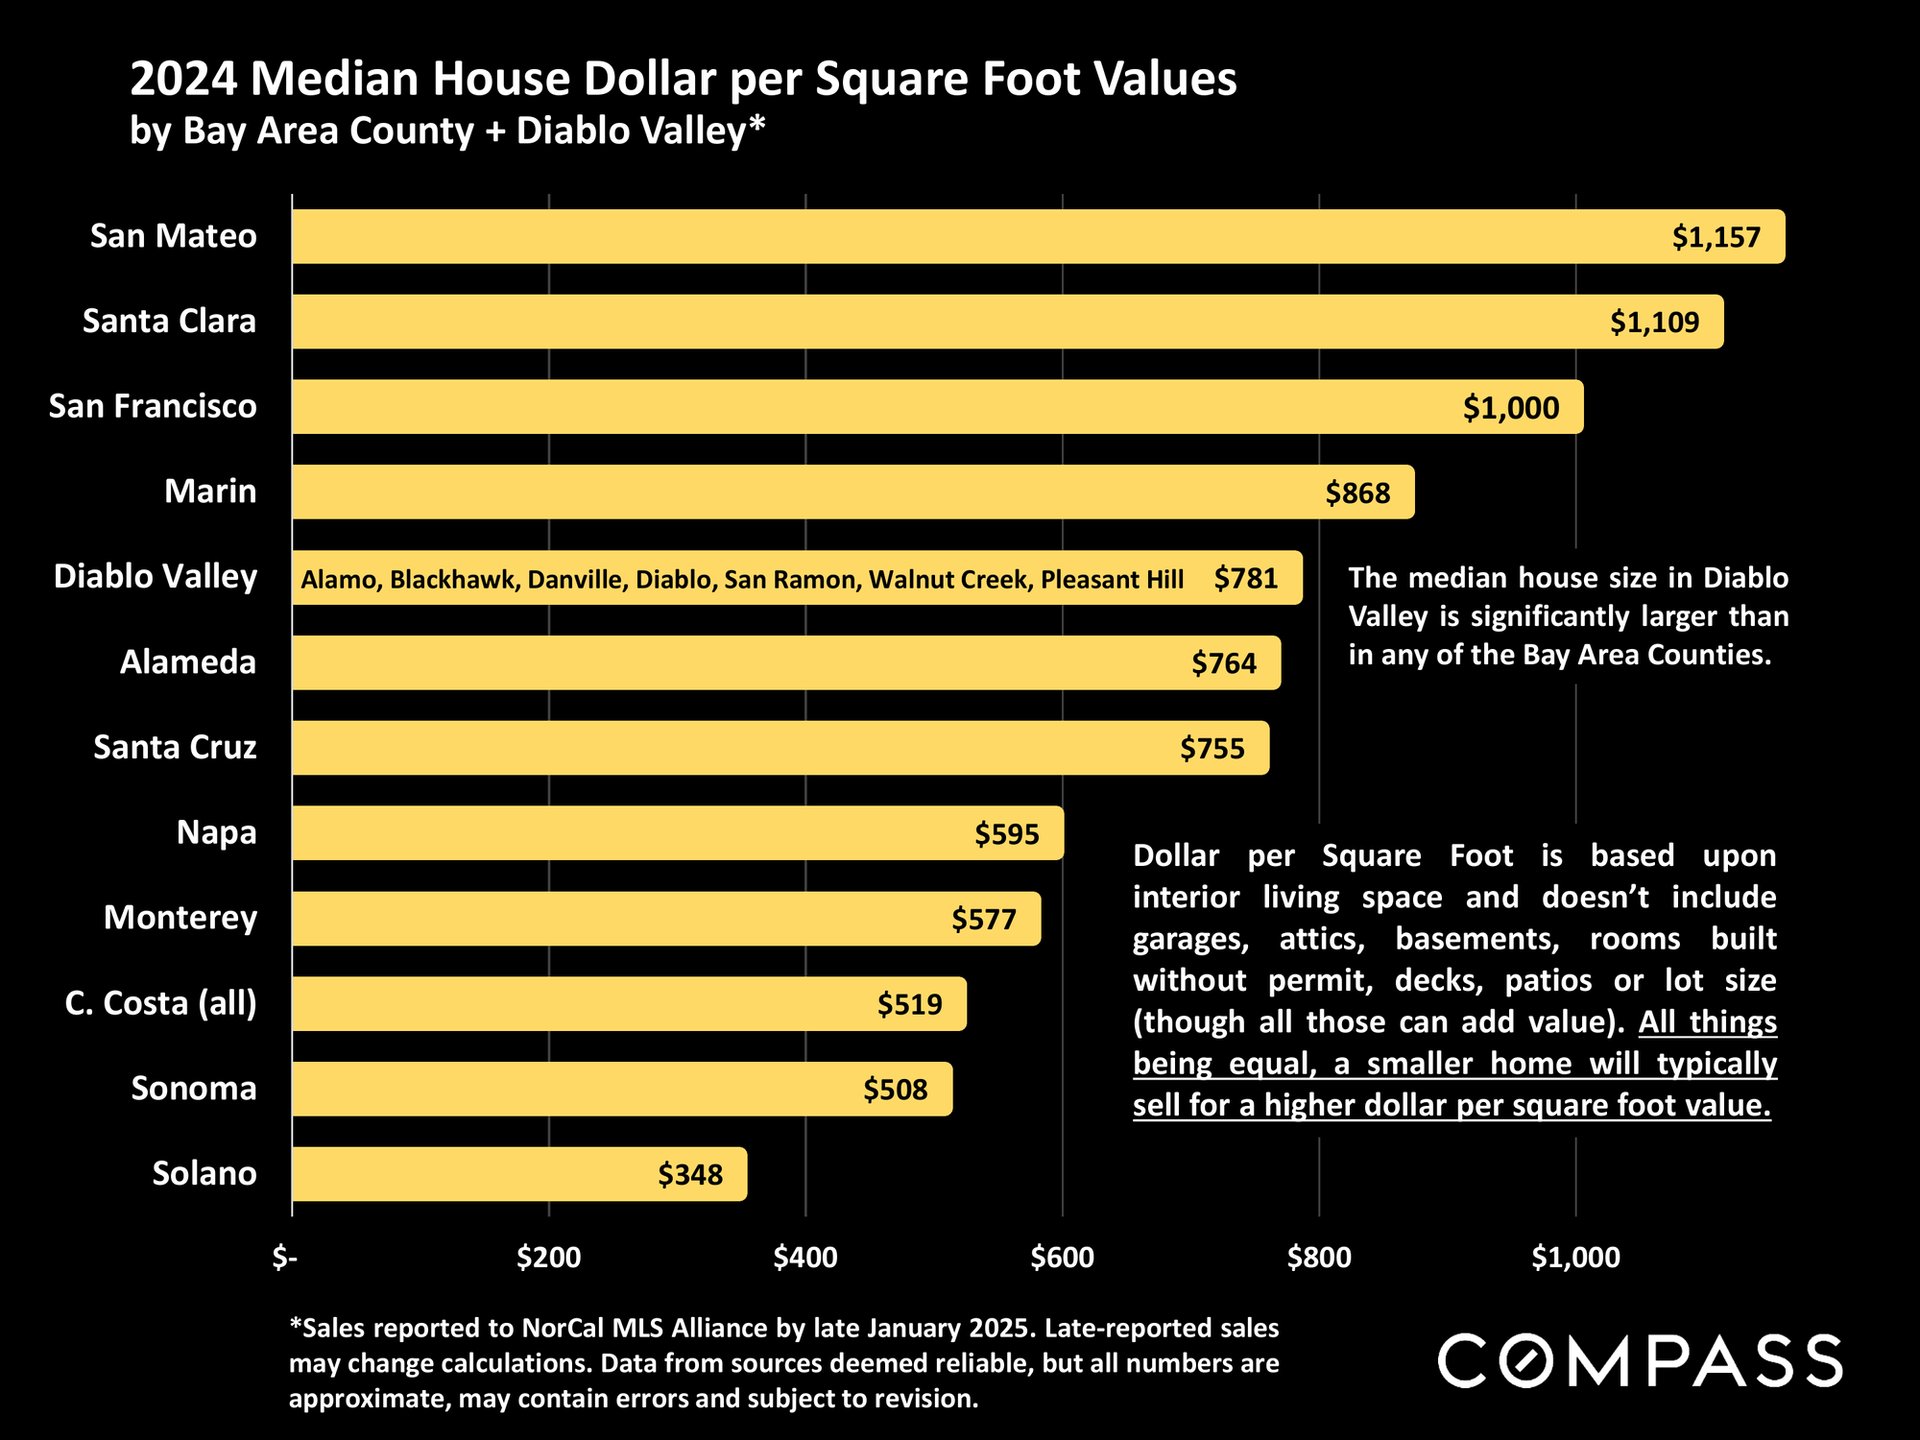
2024 median house price per square foot chart: Diablo Valley $781, below Marin and above Alameda.
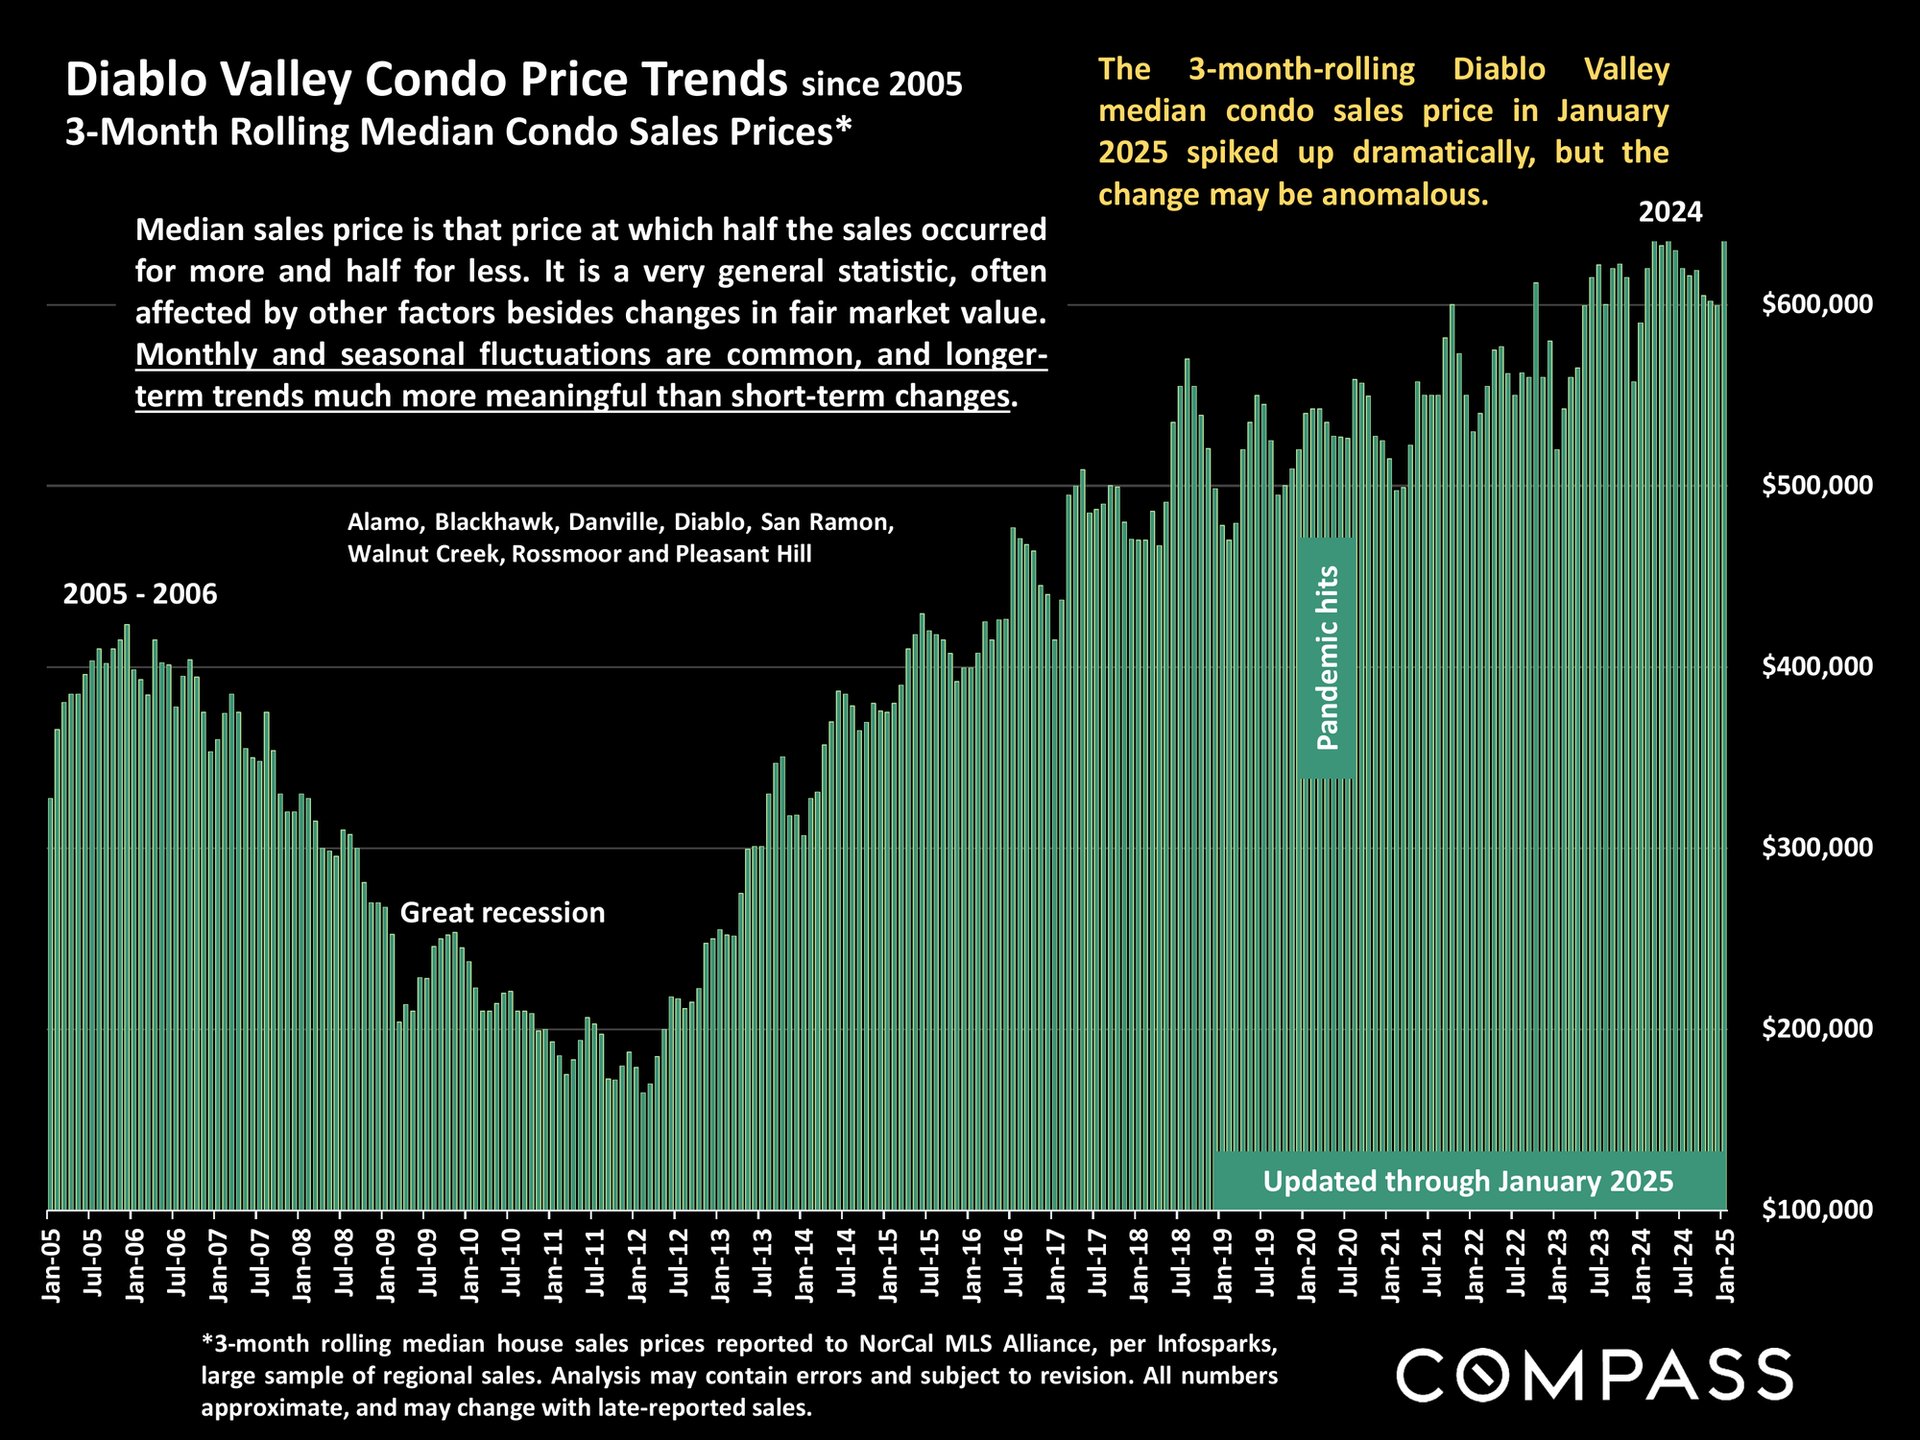
Chart of Diablo Valley median condo prices, 2005–2025, showing a recession-era decline and long-term rise.
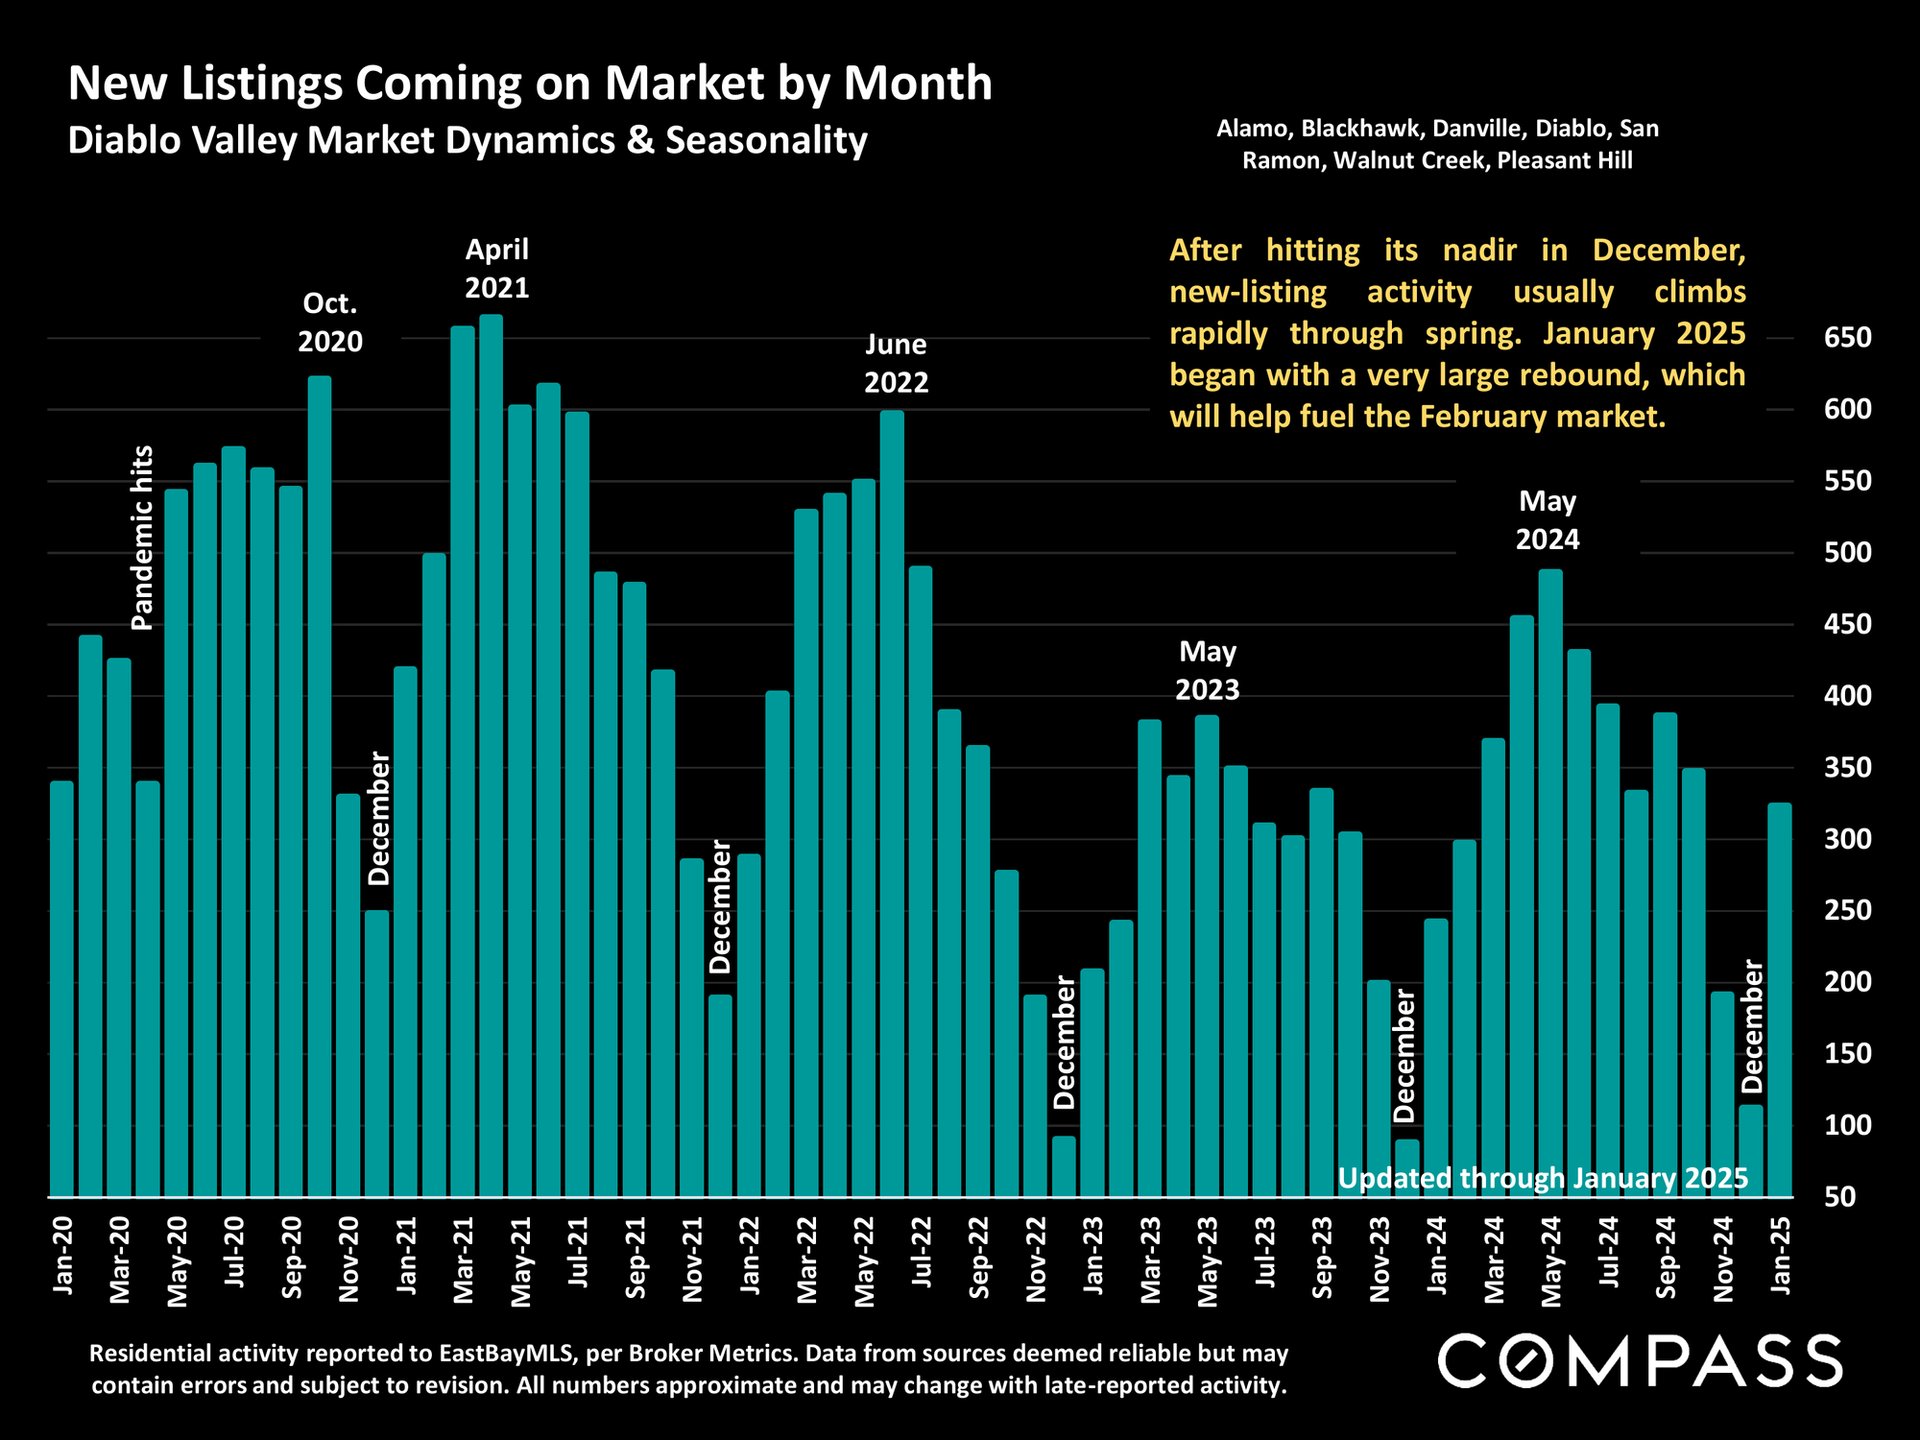
Bar chart of monthly Diablo Valley new listings, January 2020–January 2025, with spring peaks and December lows.
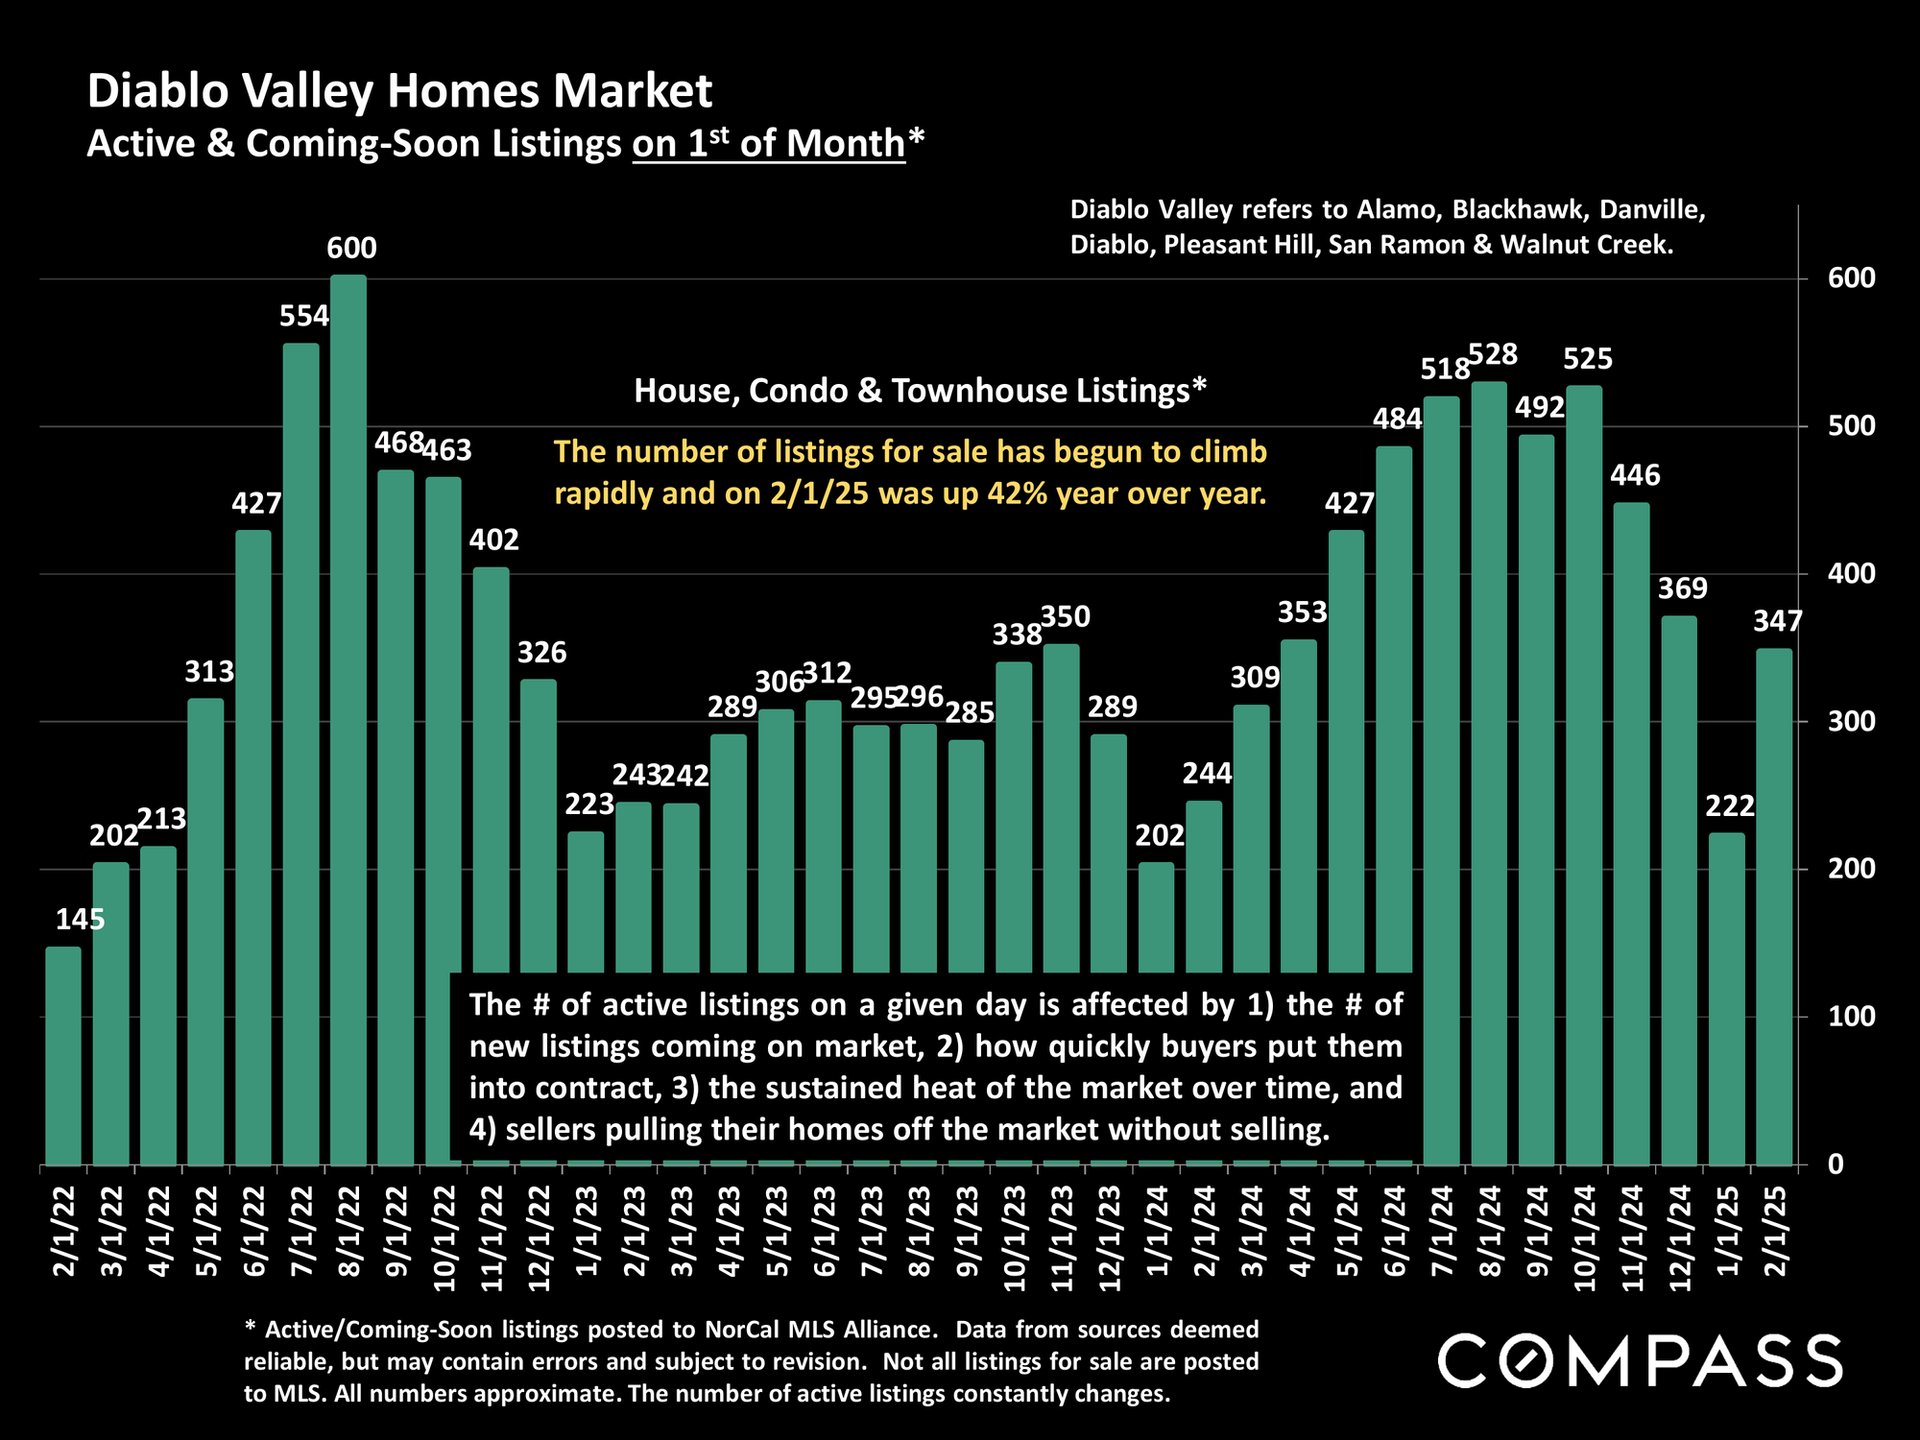
Diablo Valley home listing chart, showing monthly active and coming-soon listings from February 2022 to February 2025.
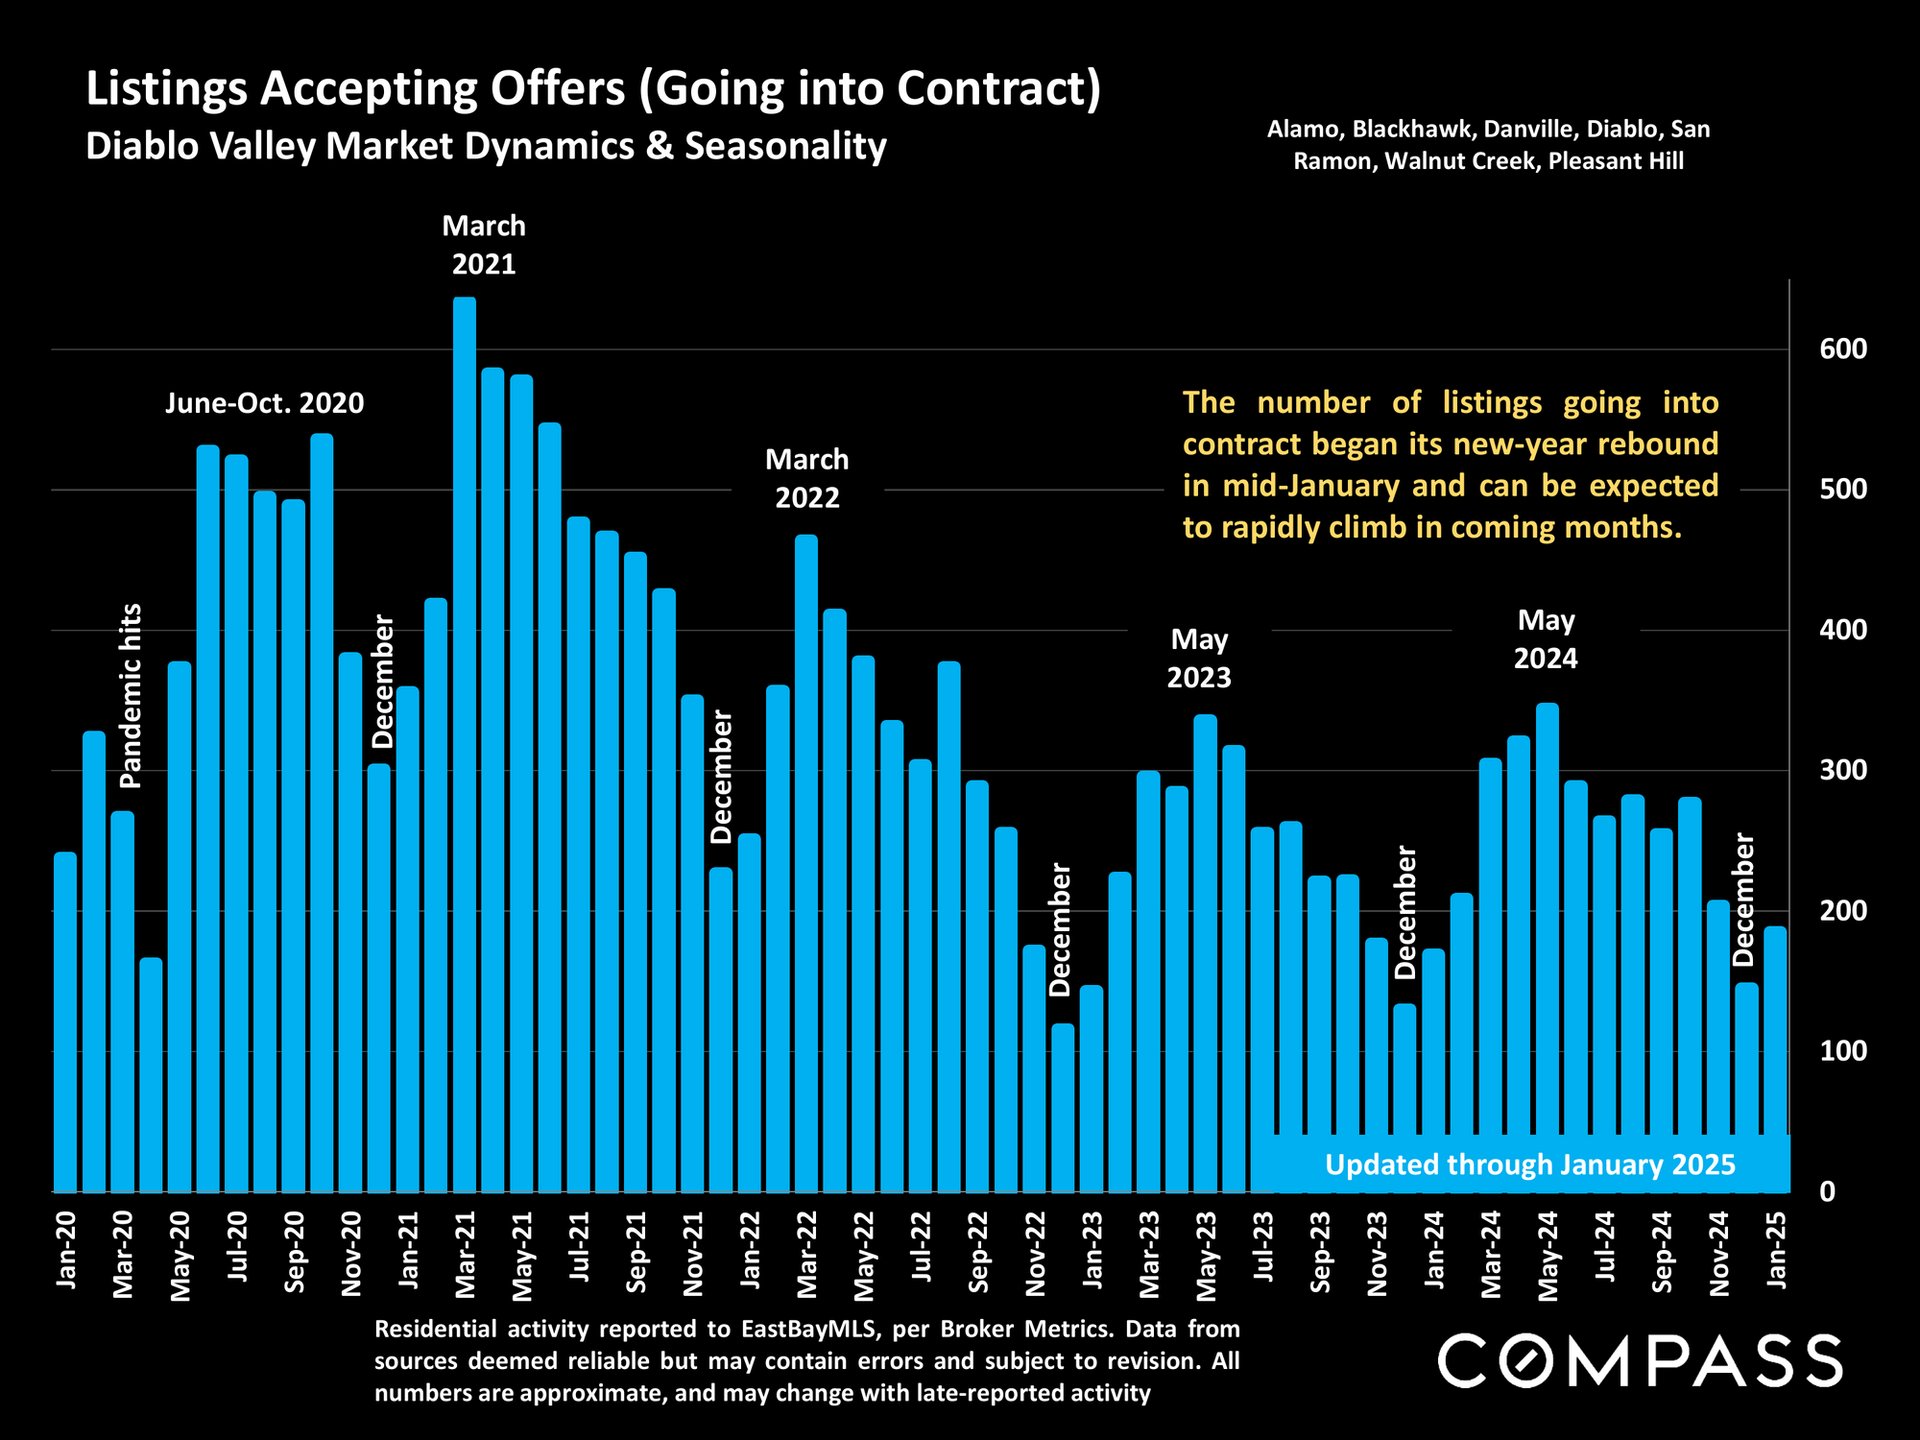
Diablo Valley listings-under-contract chart, January 2020–January 2025, with monthly cyan bars and seasonal trend annotations.
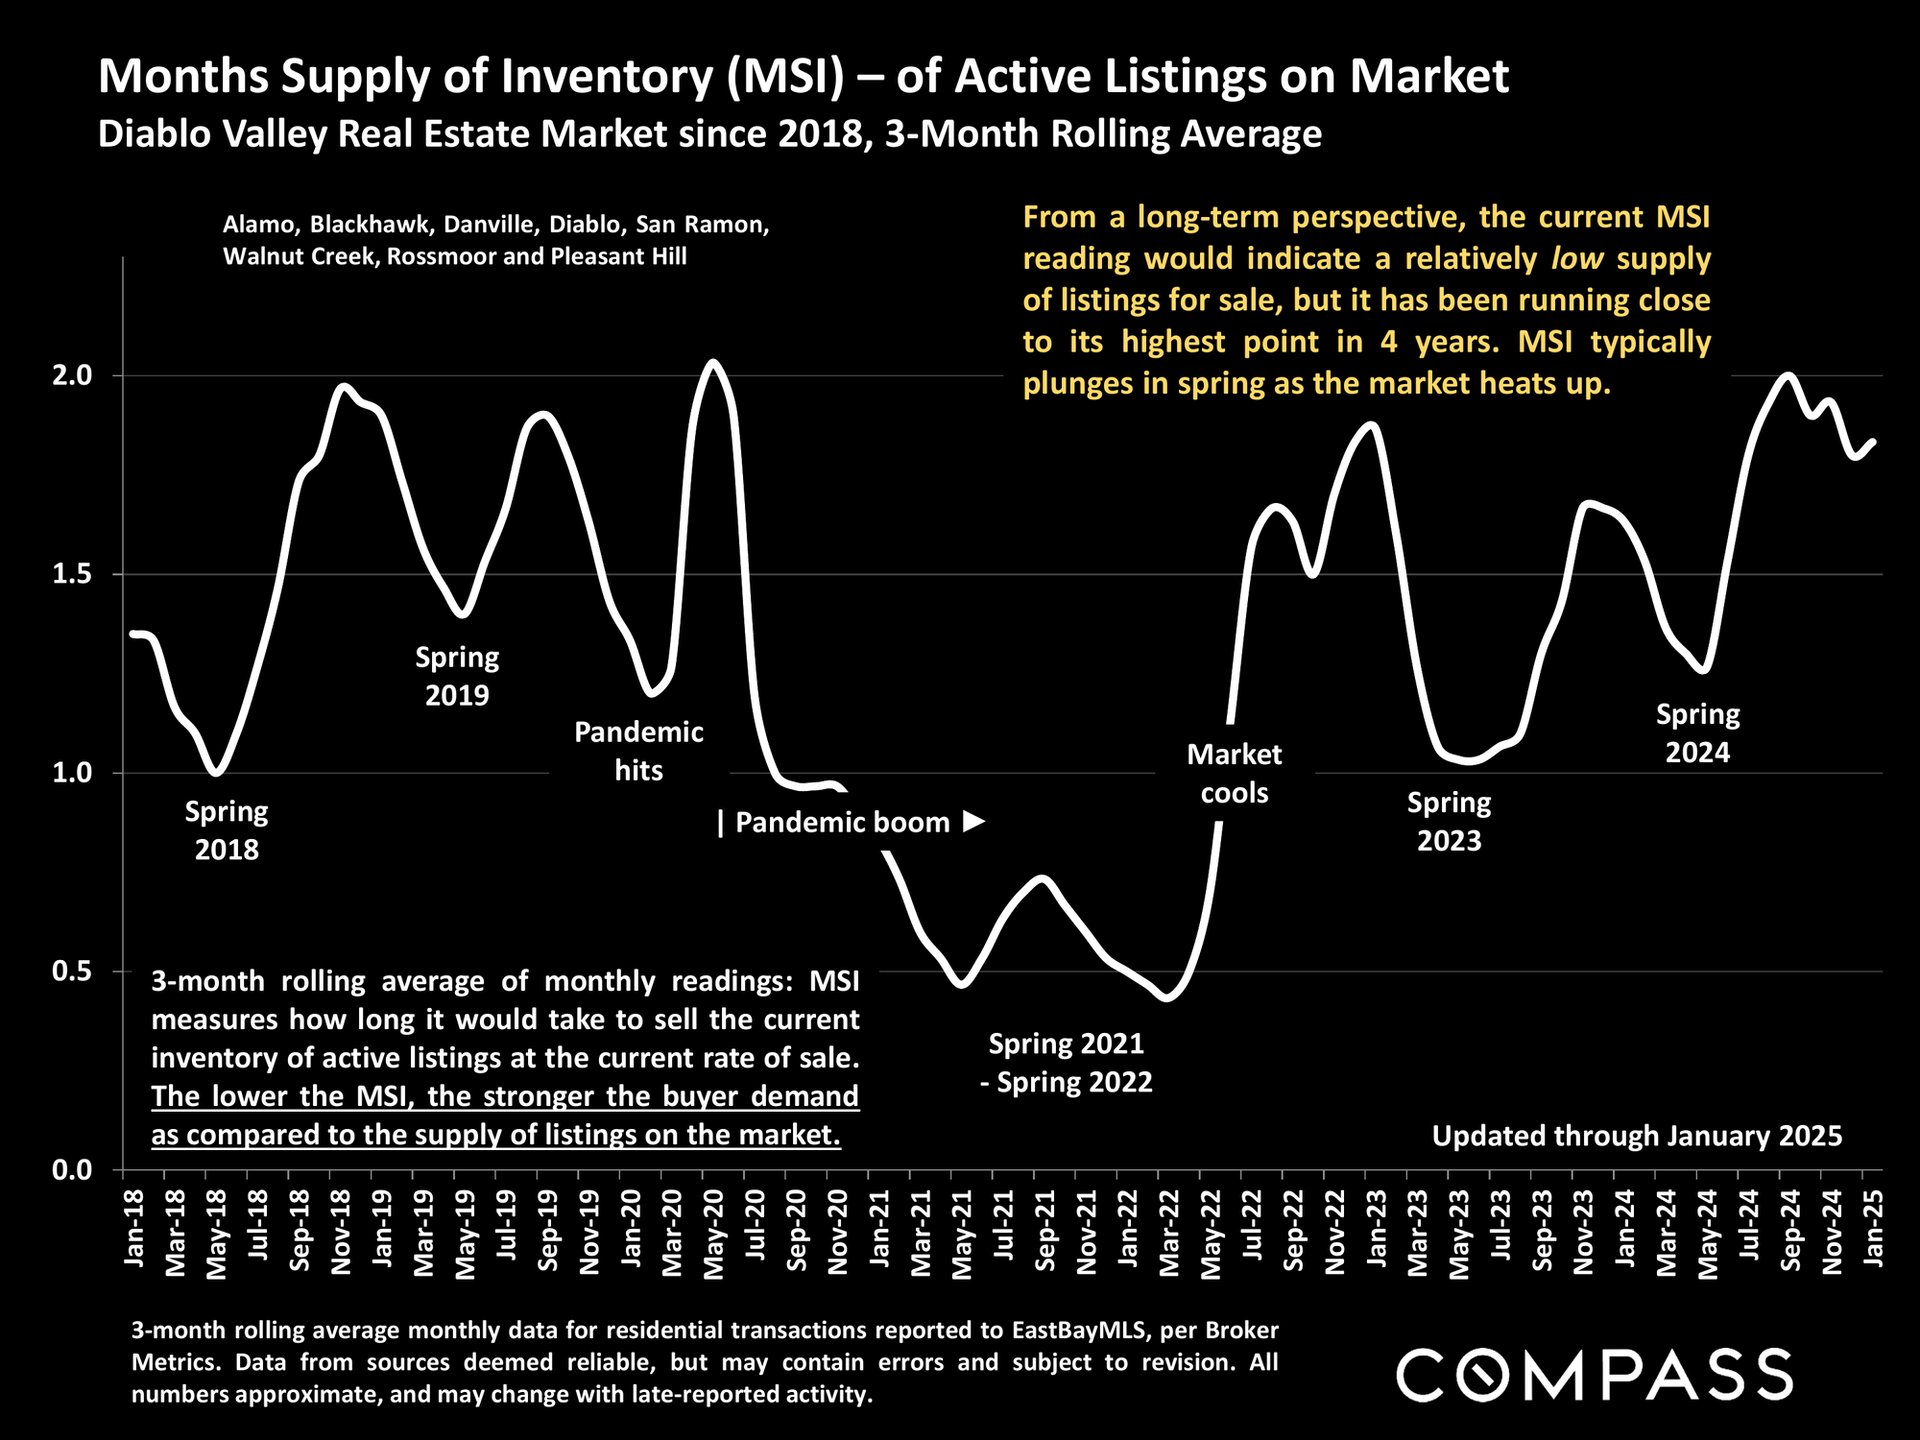
Diablo Valley months-supply chart, 2018–2025, showing inventory near a four-year high in January 2025.
Diablo Valley monthly listing absorption-rate bar chart, December 2018–December 2024, with market annotations.
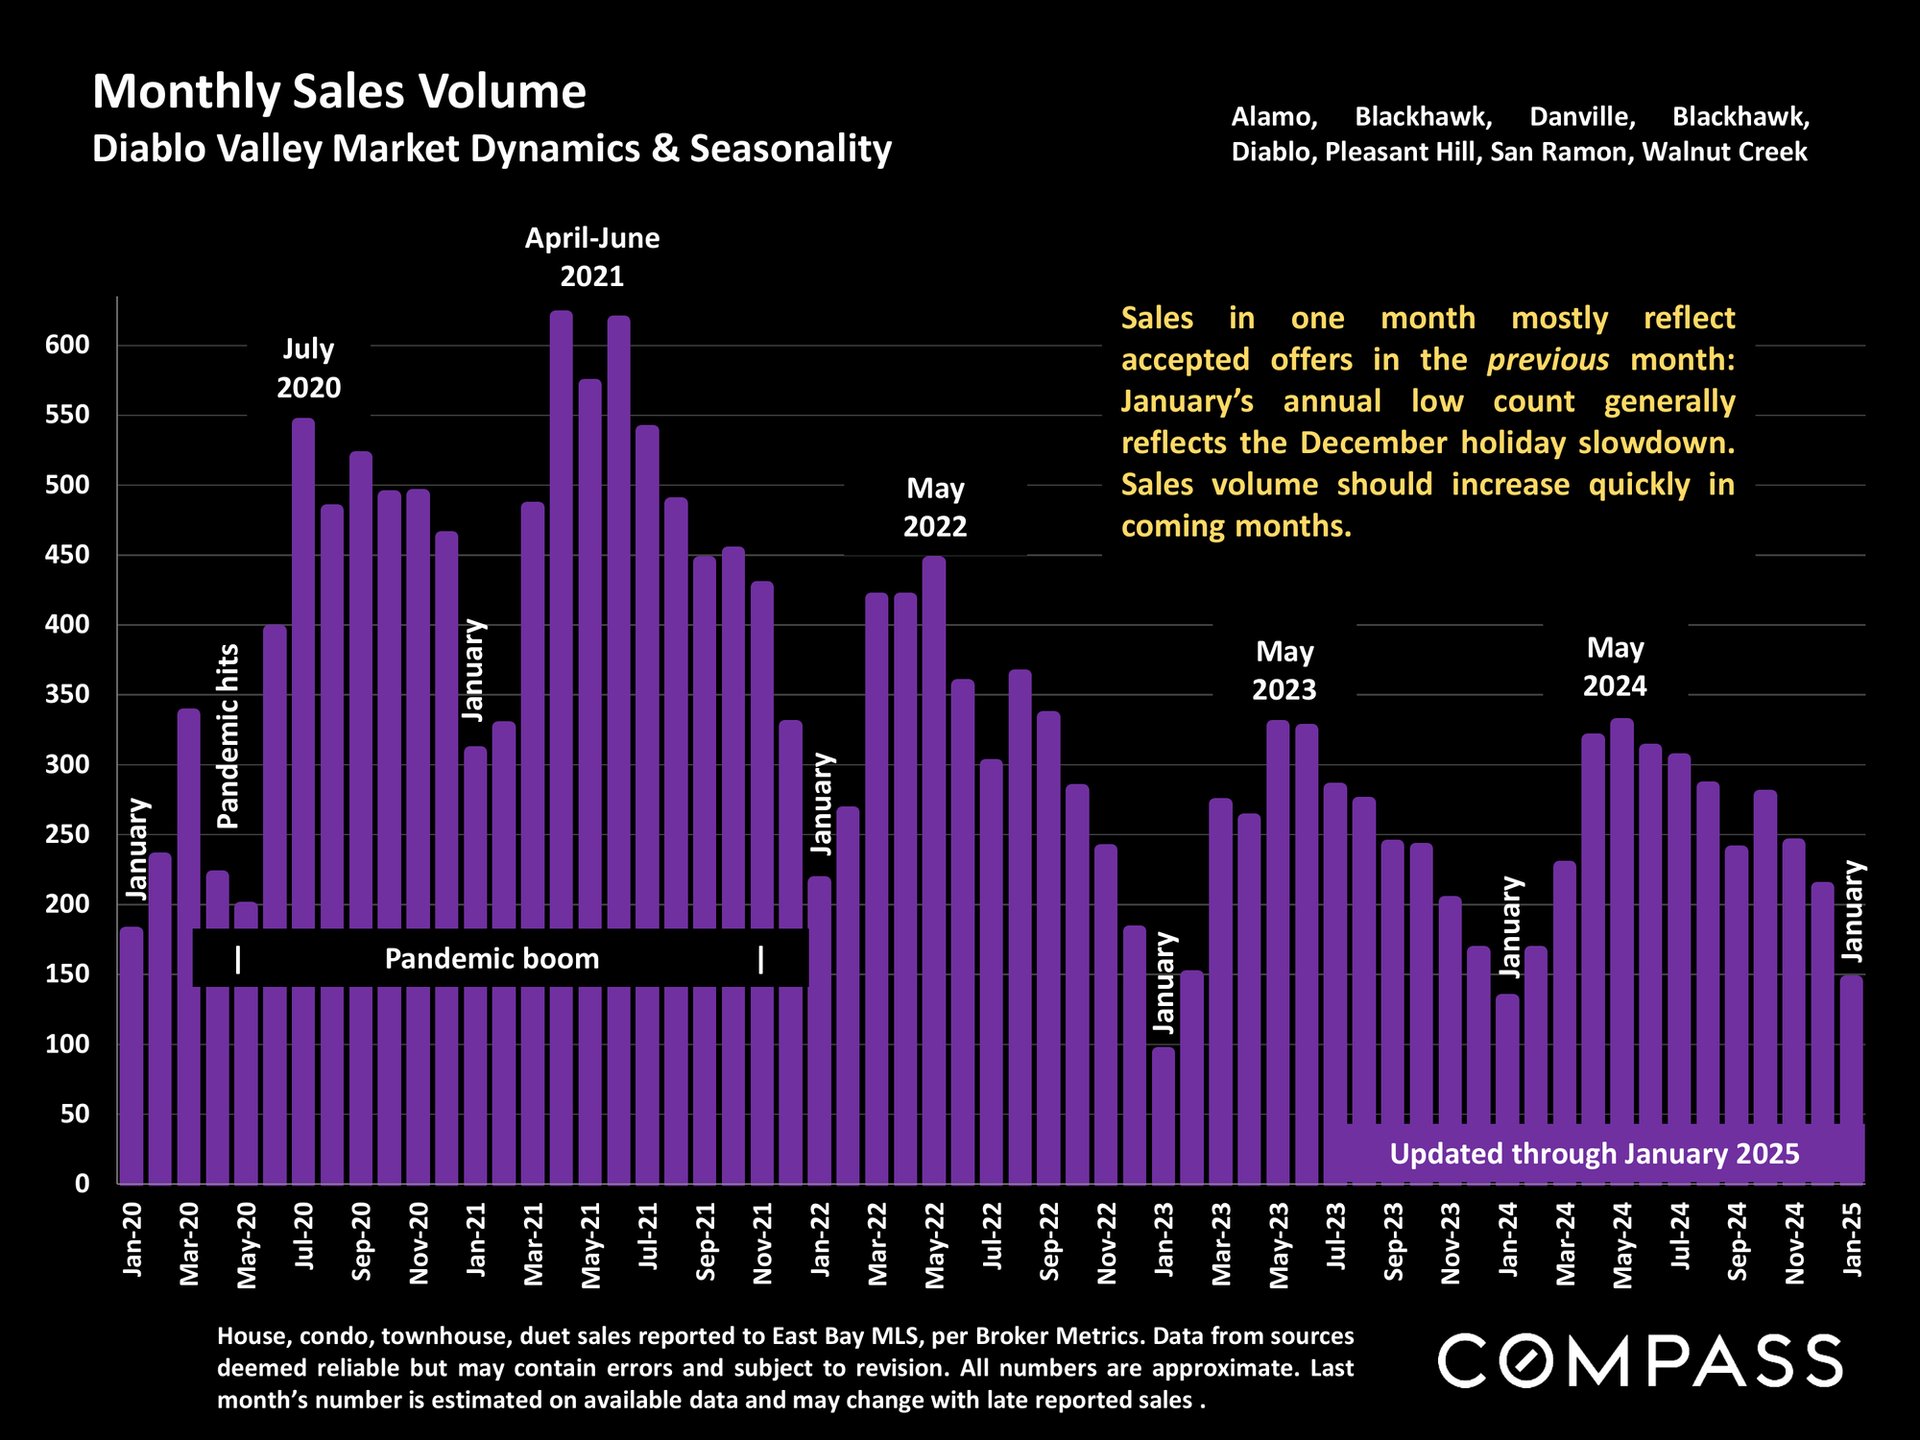
Diablo Valley monthly sales volume chart, January 2020–January 2025, highlighting pandemic-era sales and seasonal variation.
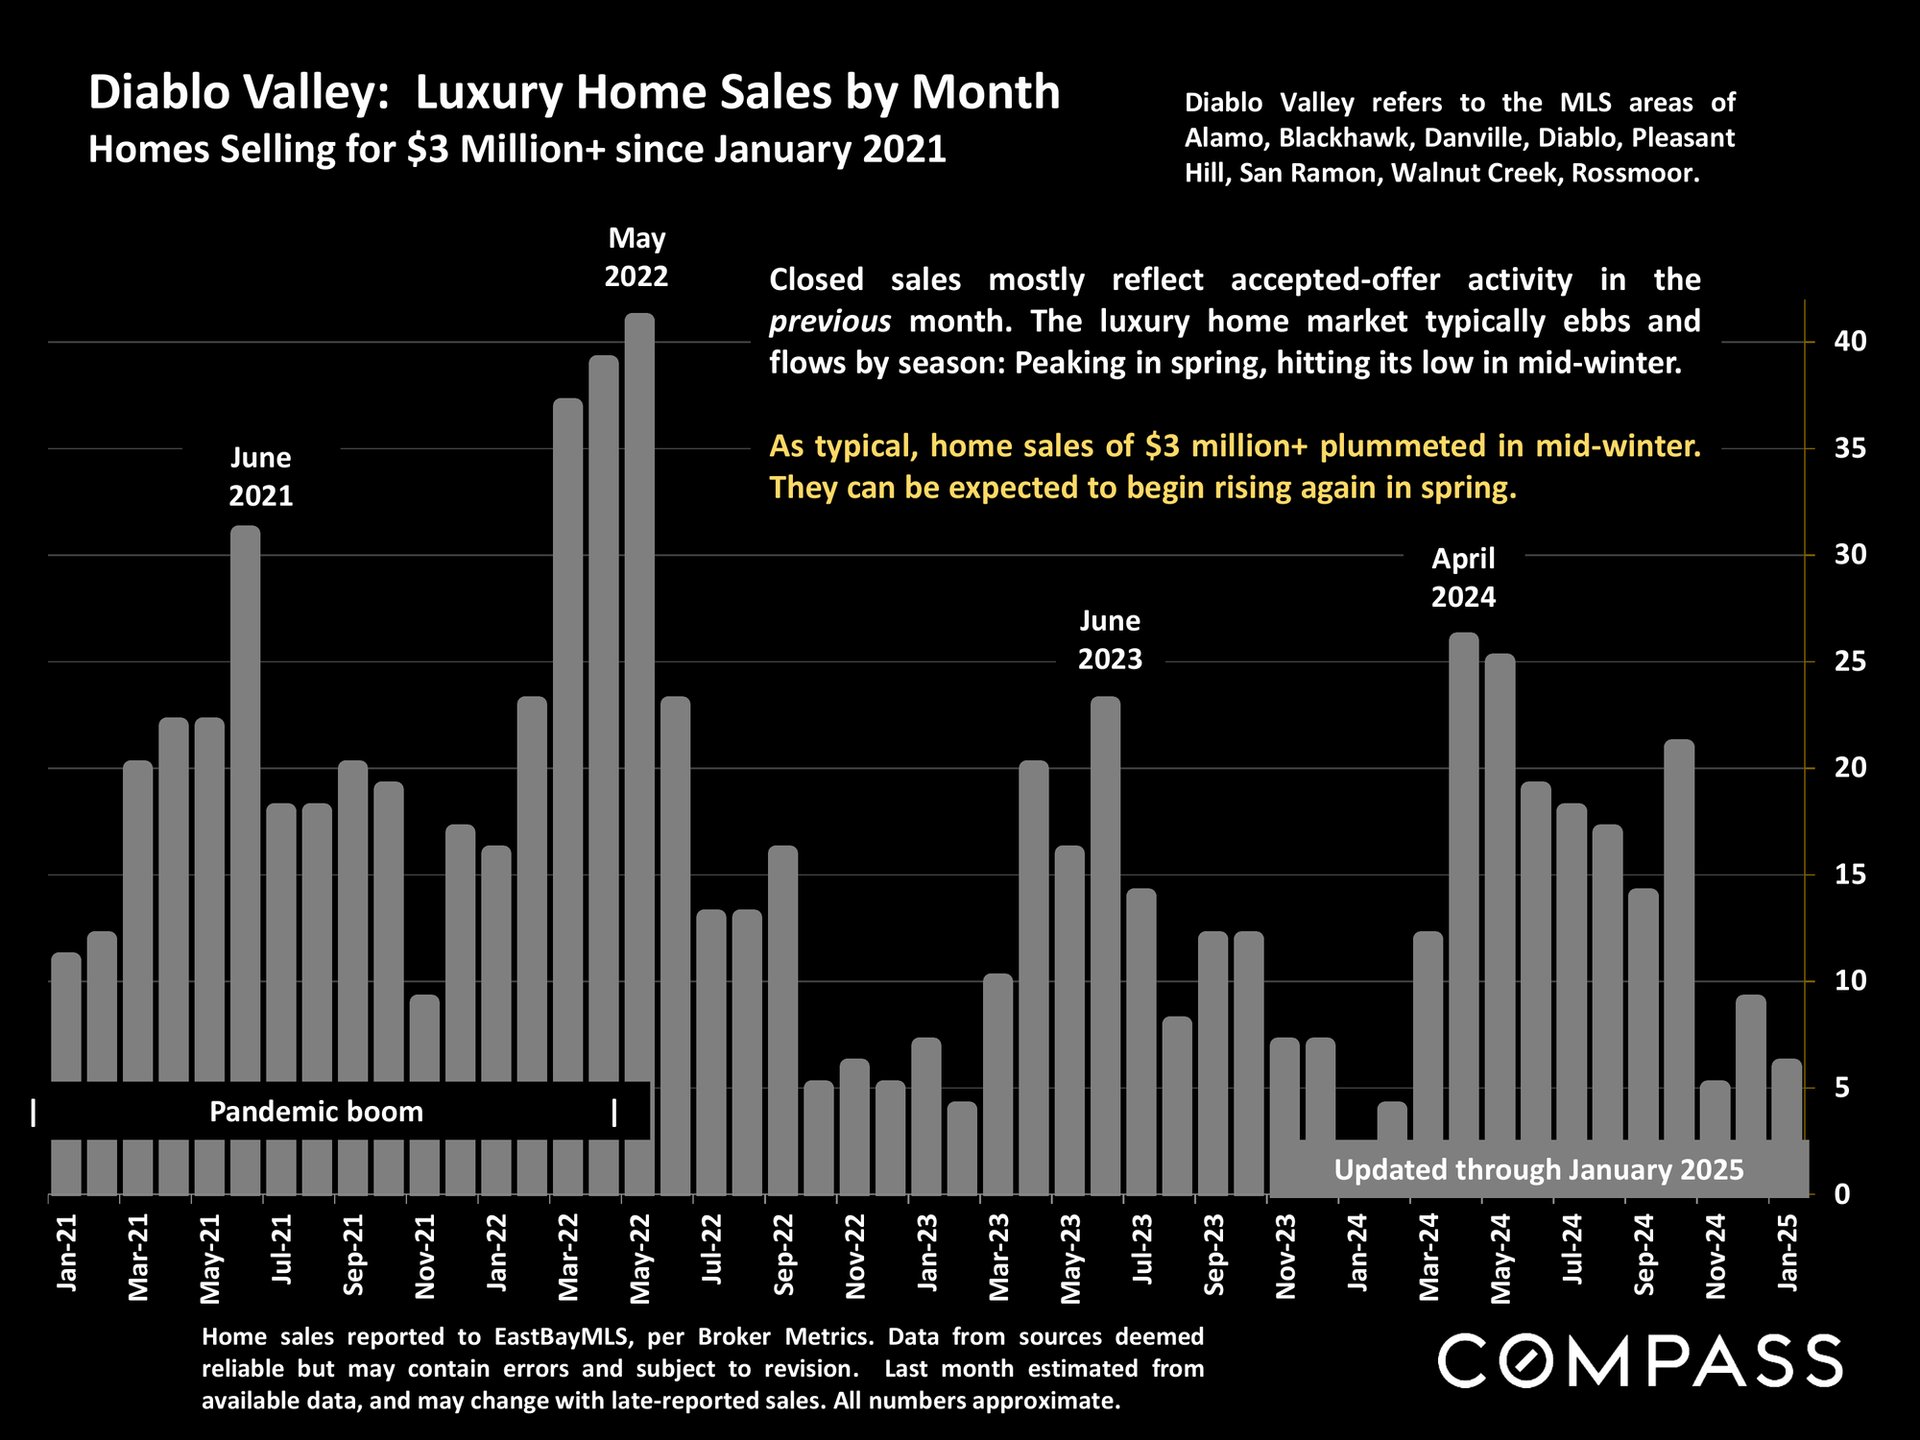
Chart of monthly Diablo Valley home sales over $3 million, January 2021 to January 2025, with seasonal trends.
Chart of Diablo Valley home sales closing over list price, showing seasonal fluctuations from 2019 through January 2025.
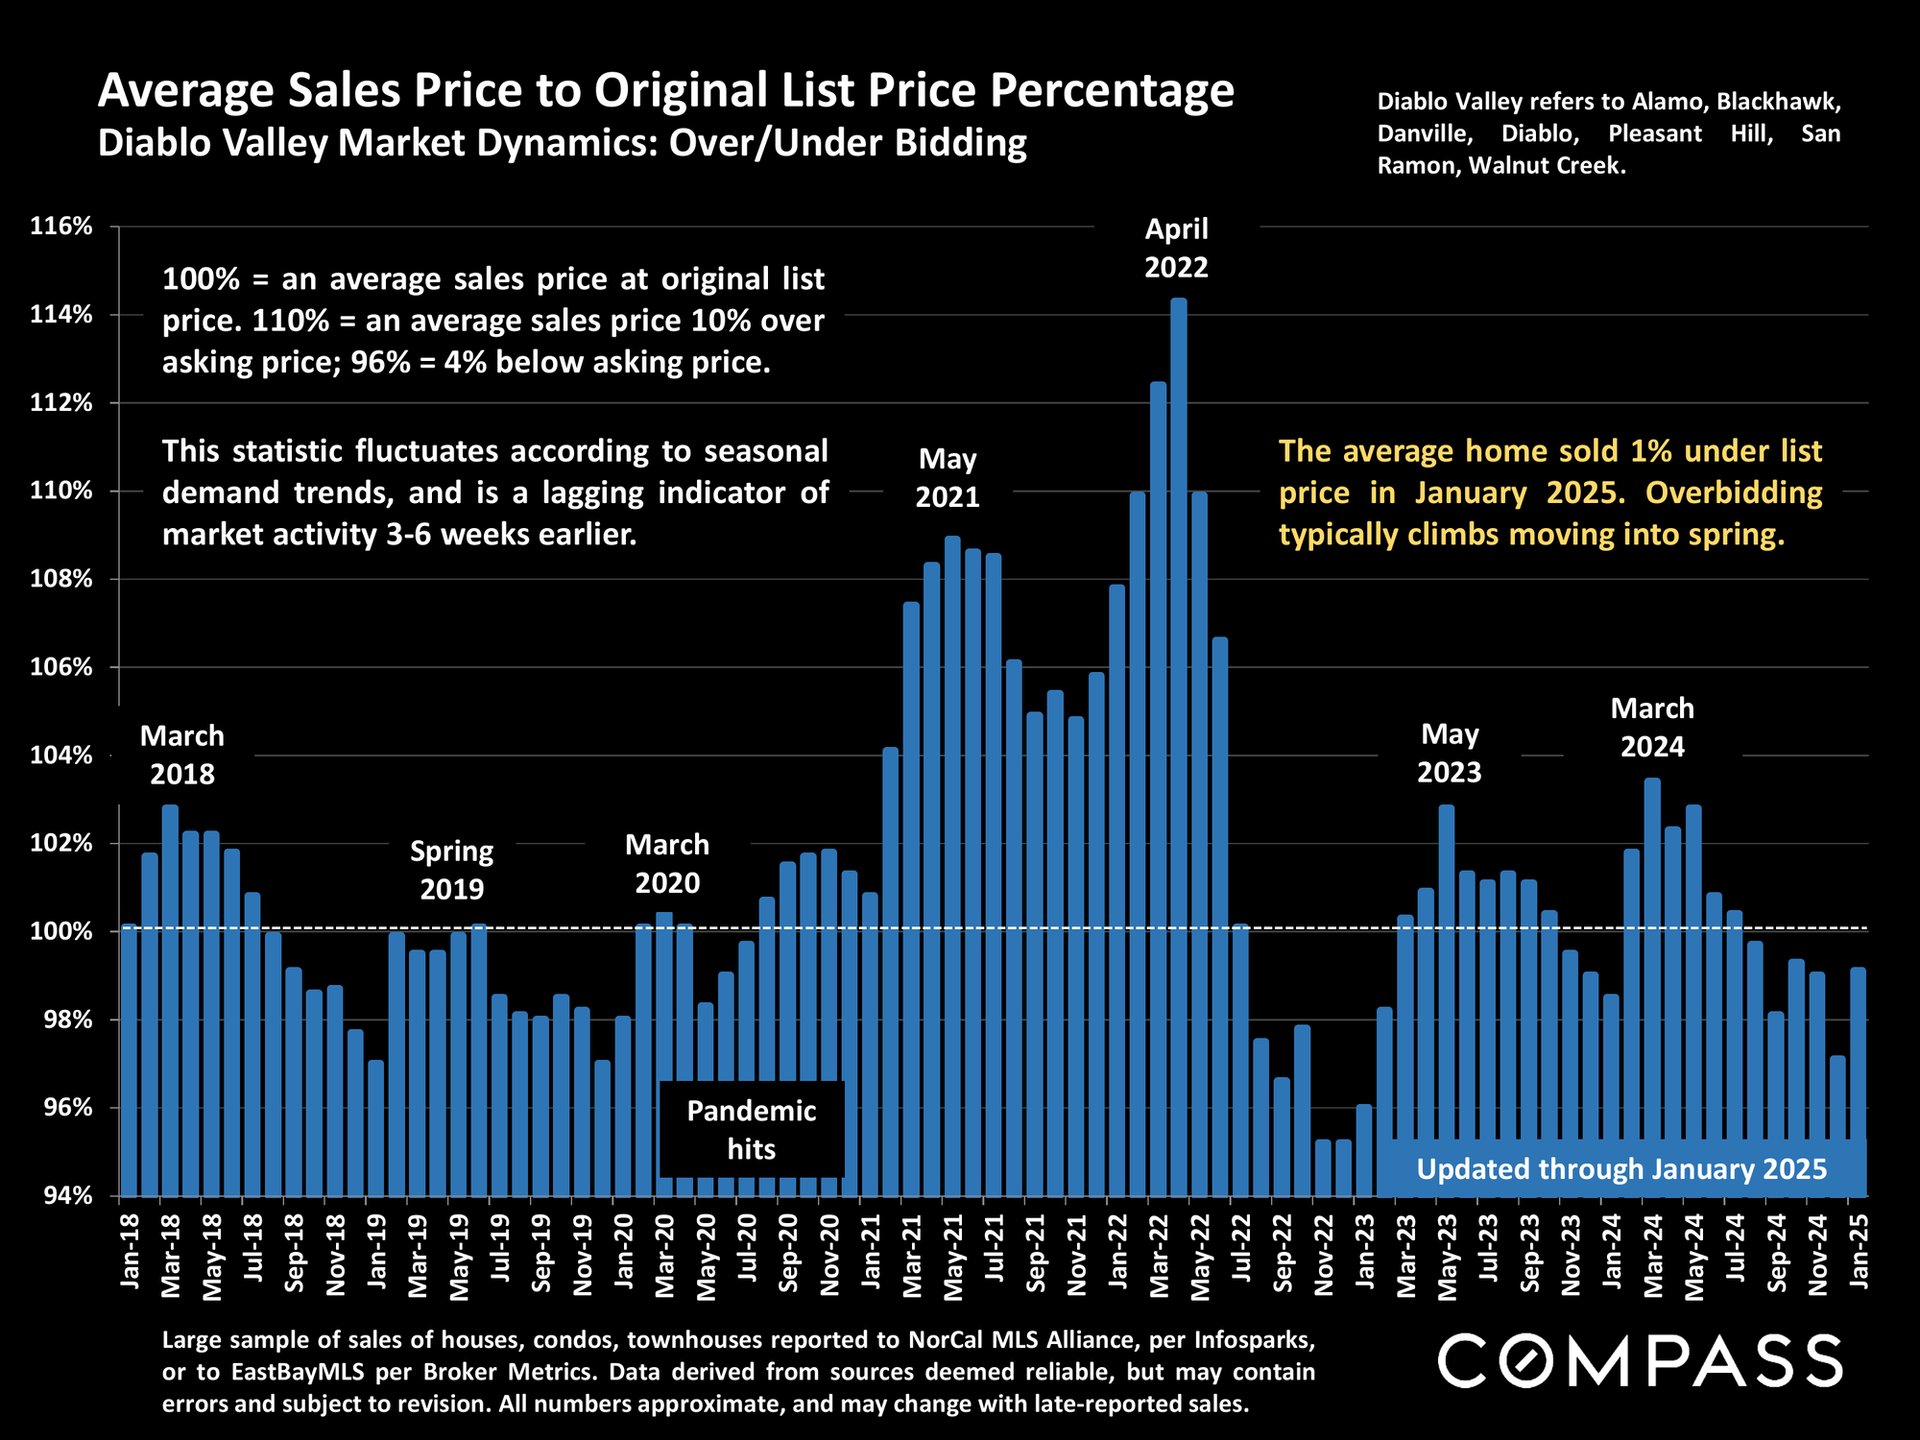
Diablo Valley home sale prices compared with original list prices from 2018 to January 2025, with a January 2025 average 1% below list.
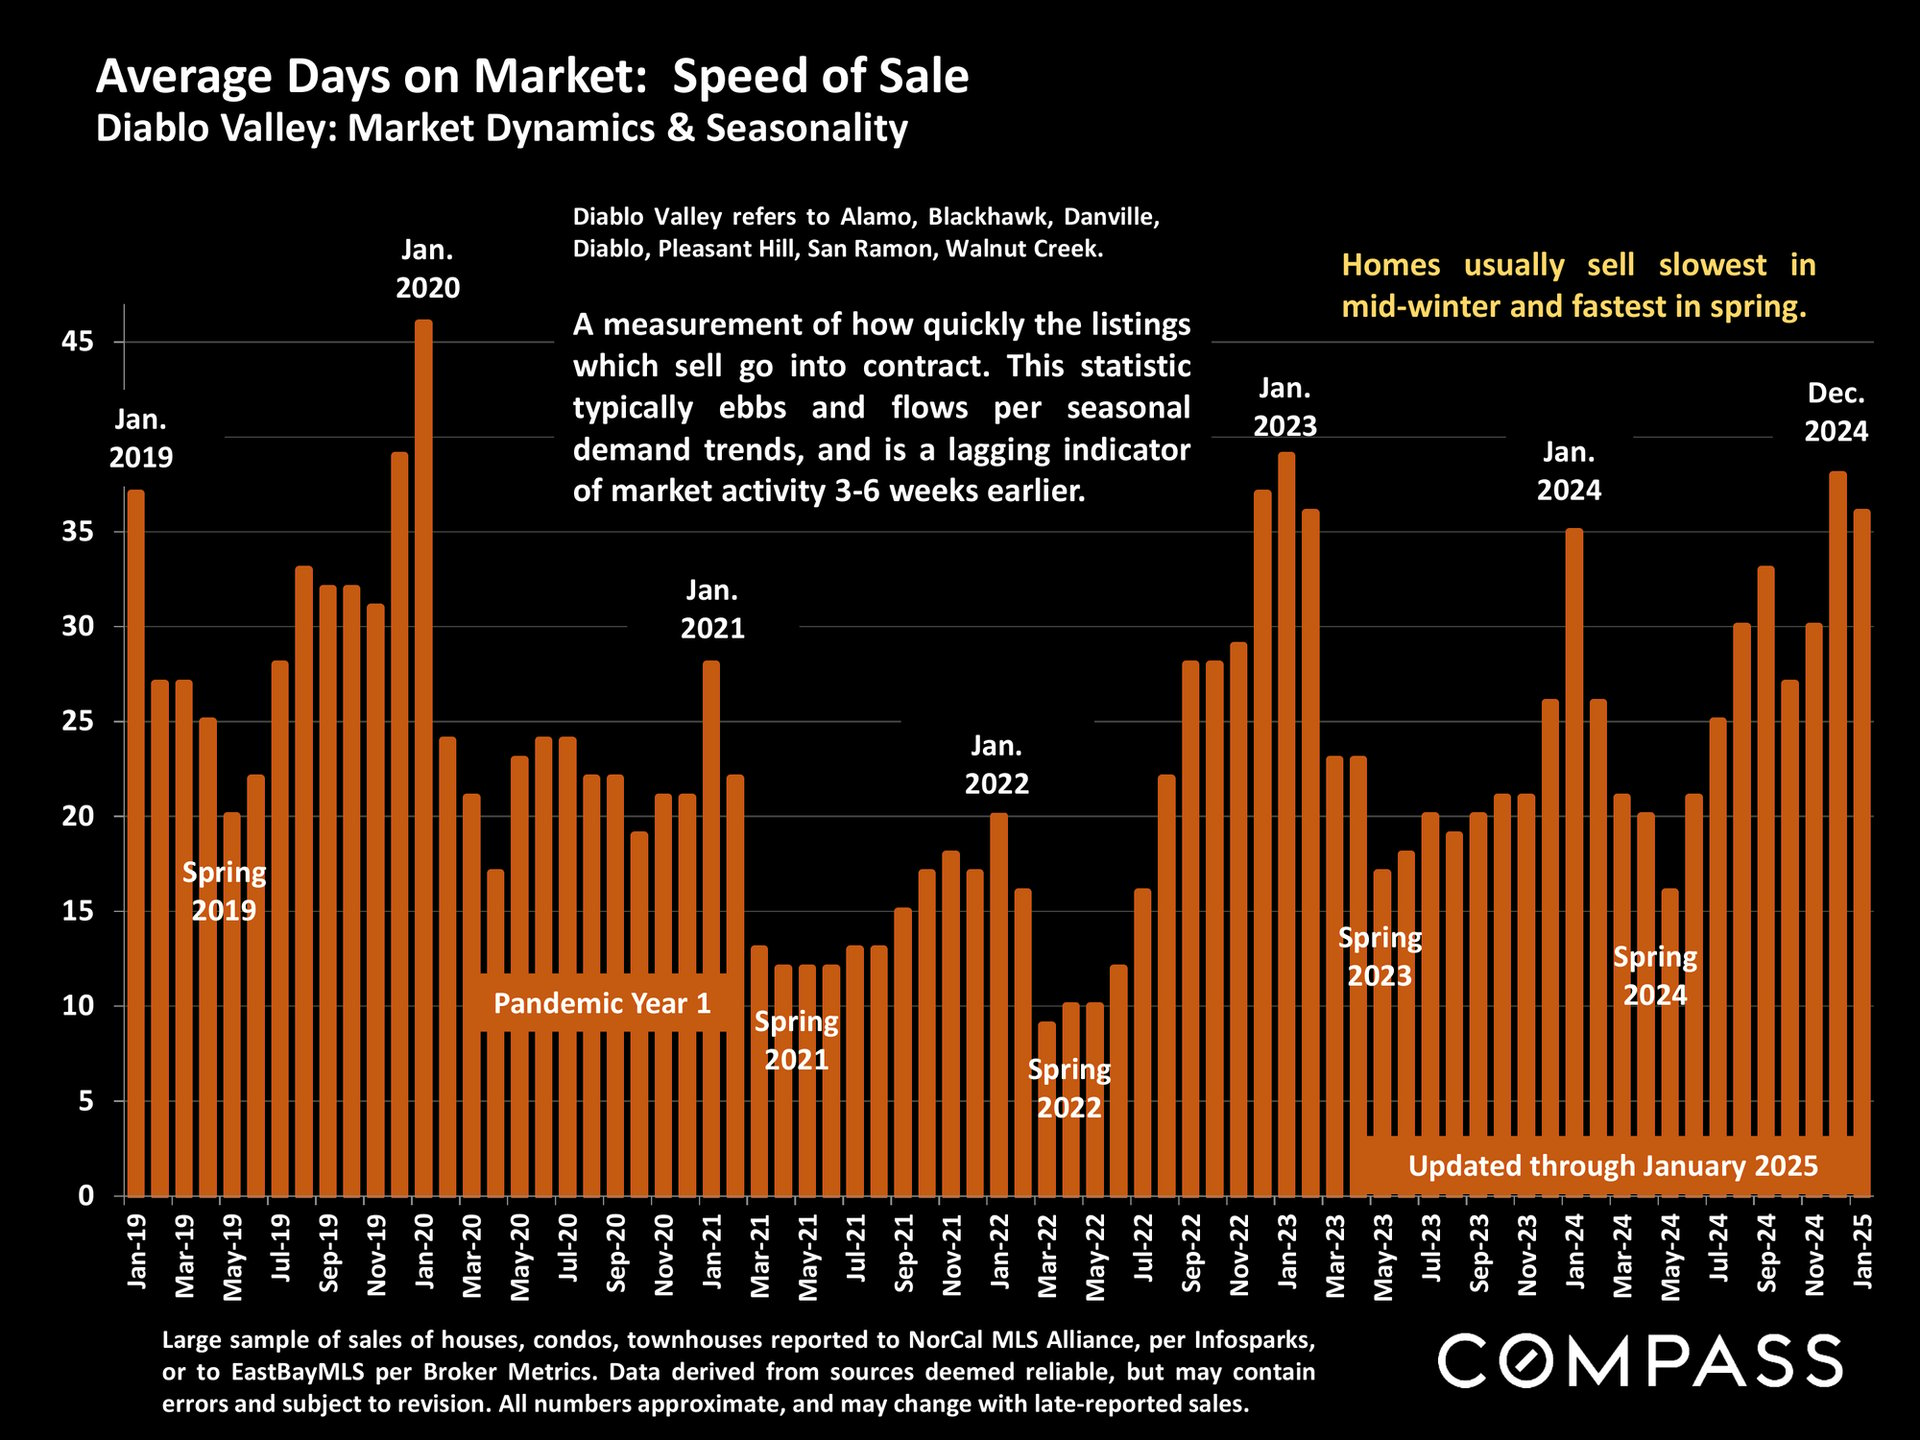
Diablo Valley average days-on-market chart, 2019–2025, with monthly bars and seasonal annotations.
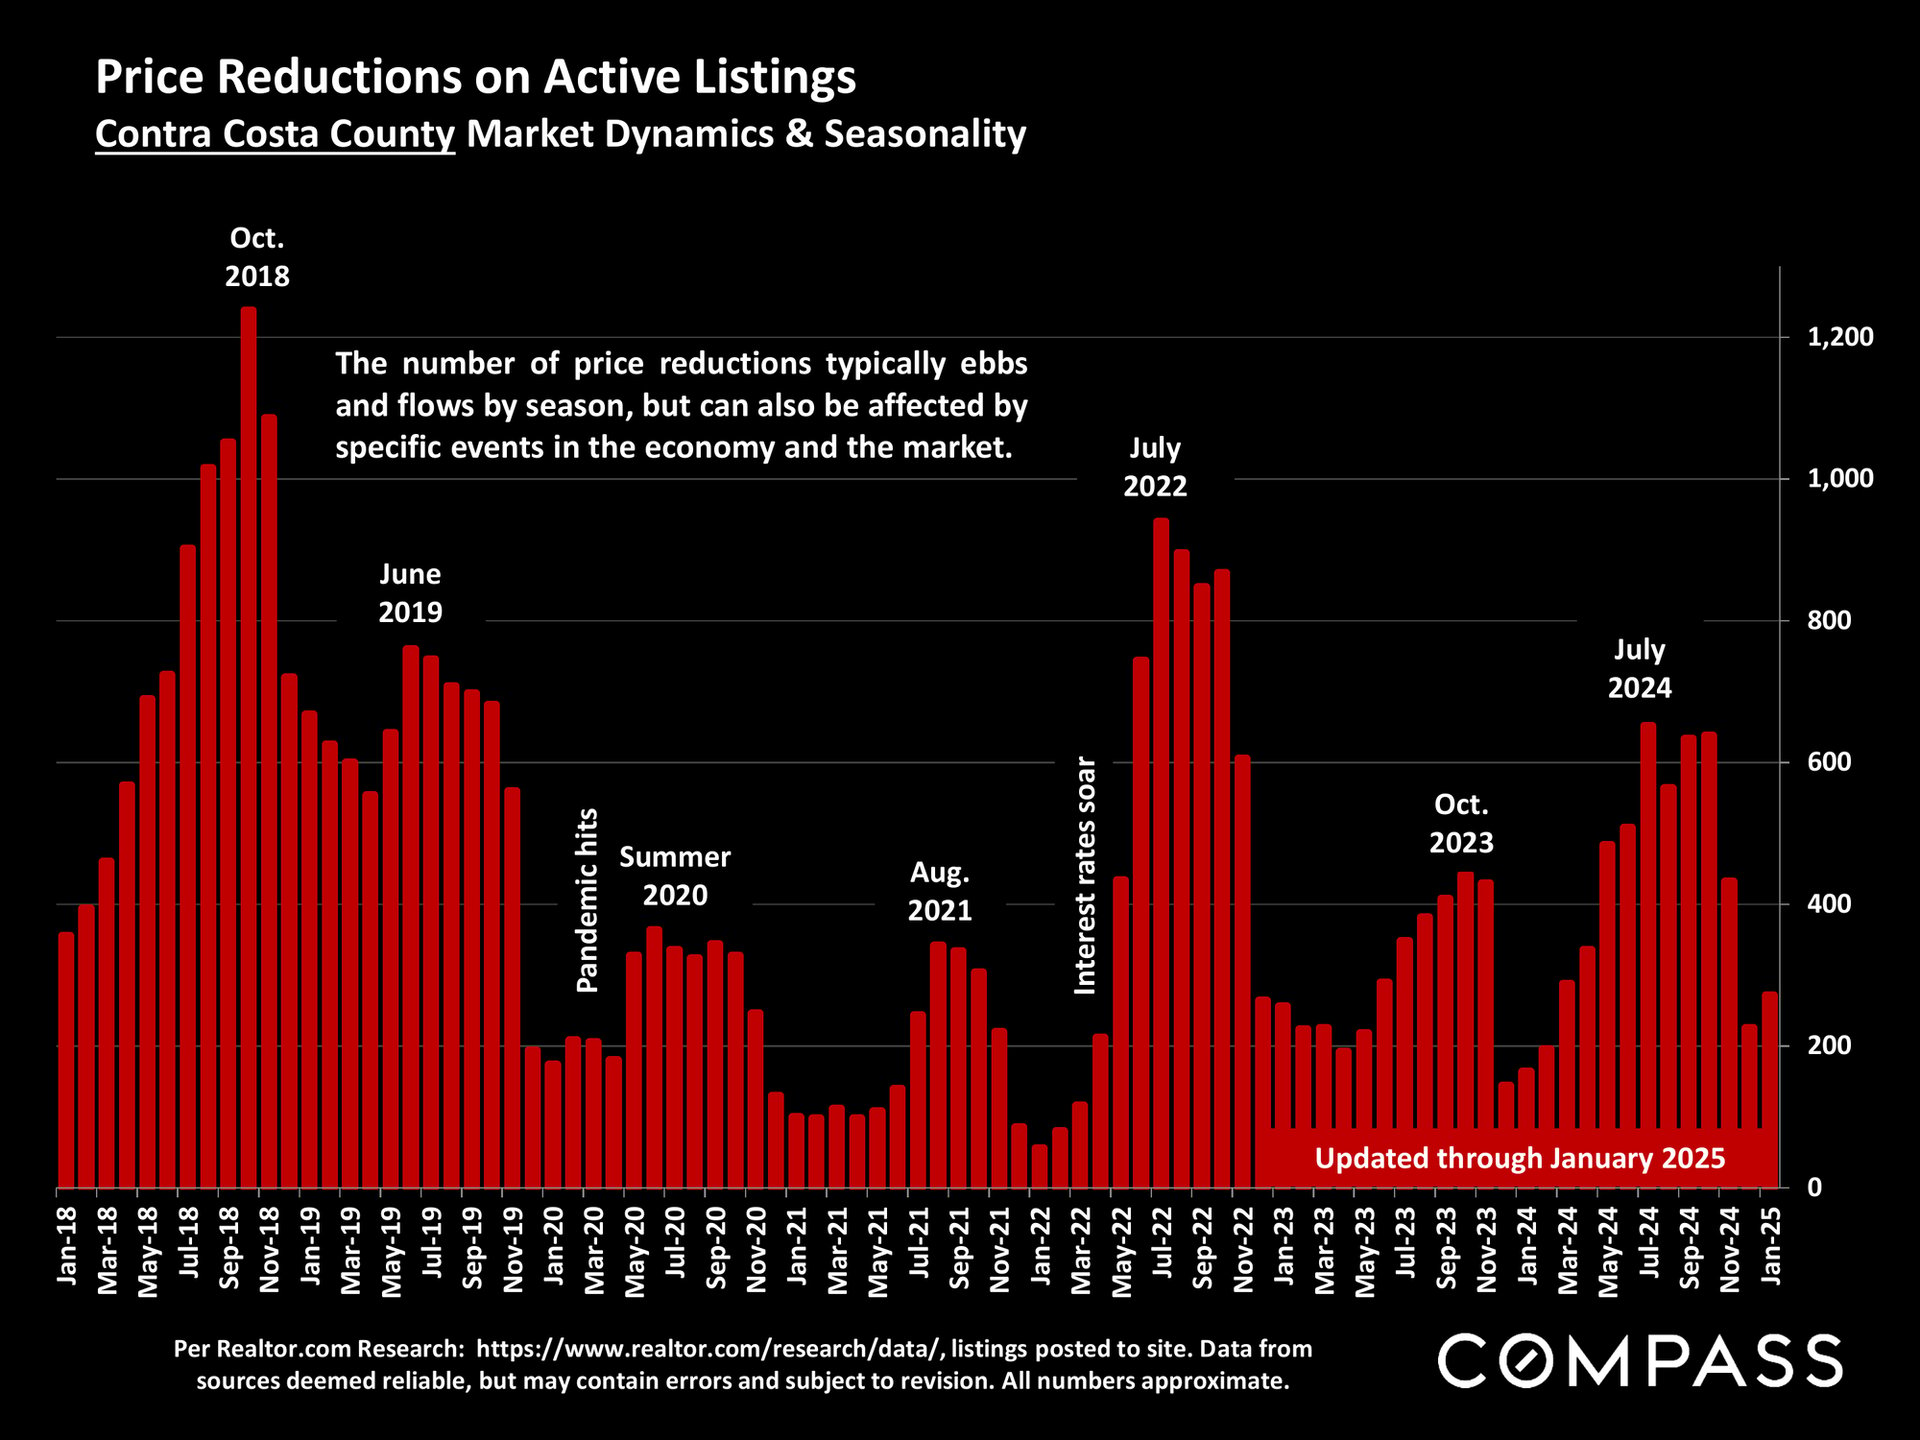
Chart of monthly Contra Costa County active-listing price reductions, January 2018–January 2025, with peaks in 2018 and 2022.
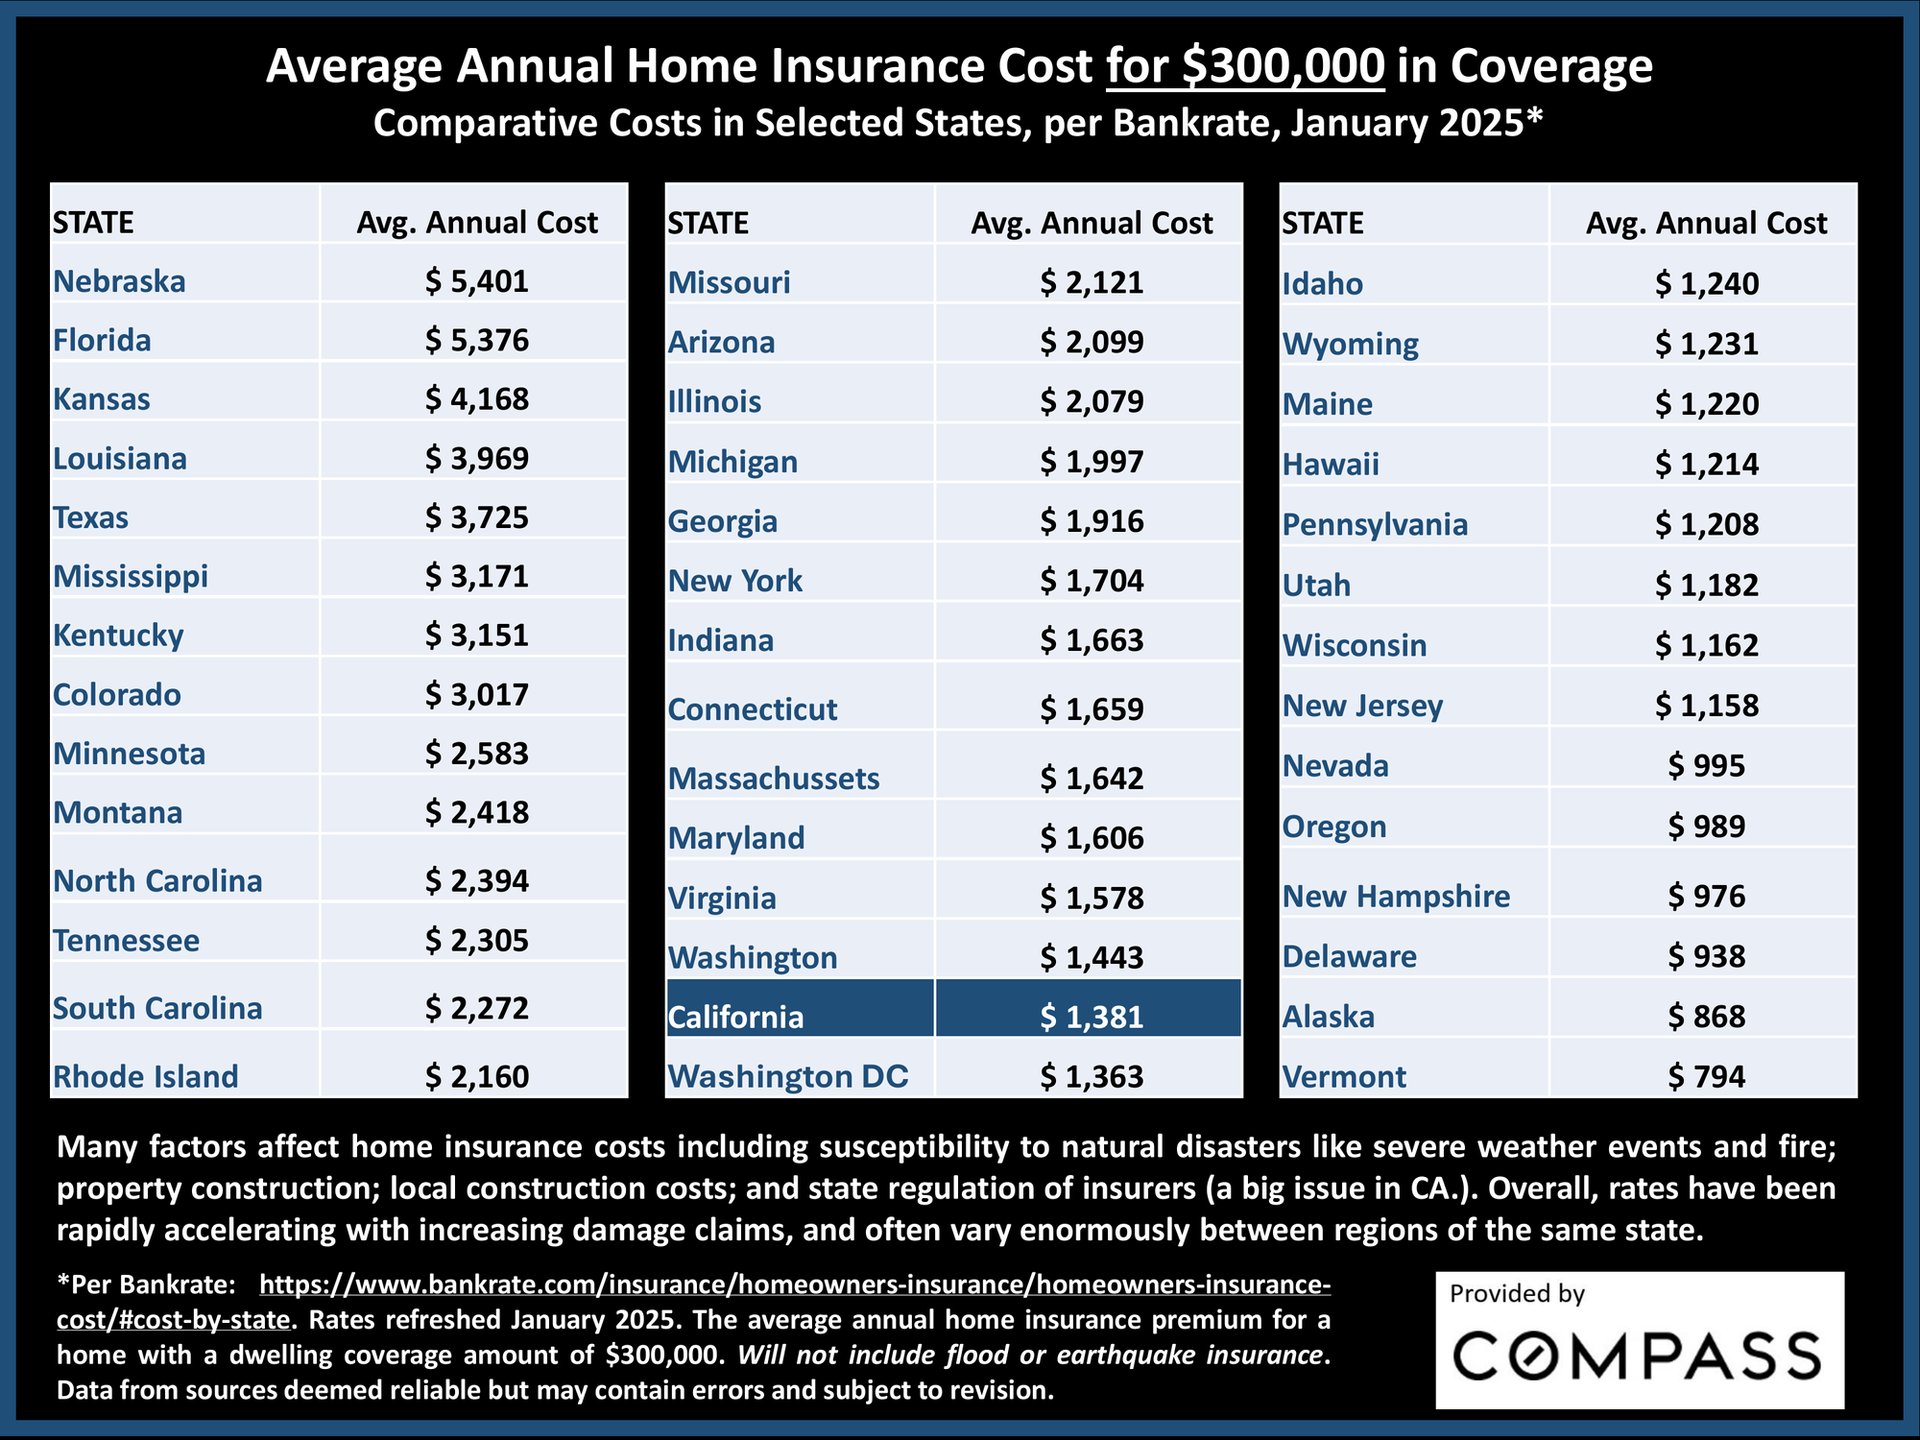
Infographic compares average annual home insurance costs by state; California is highlighted at $1,381.
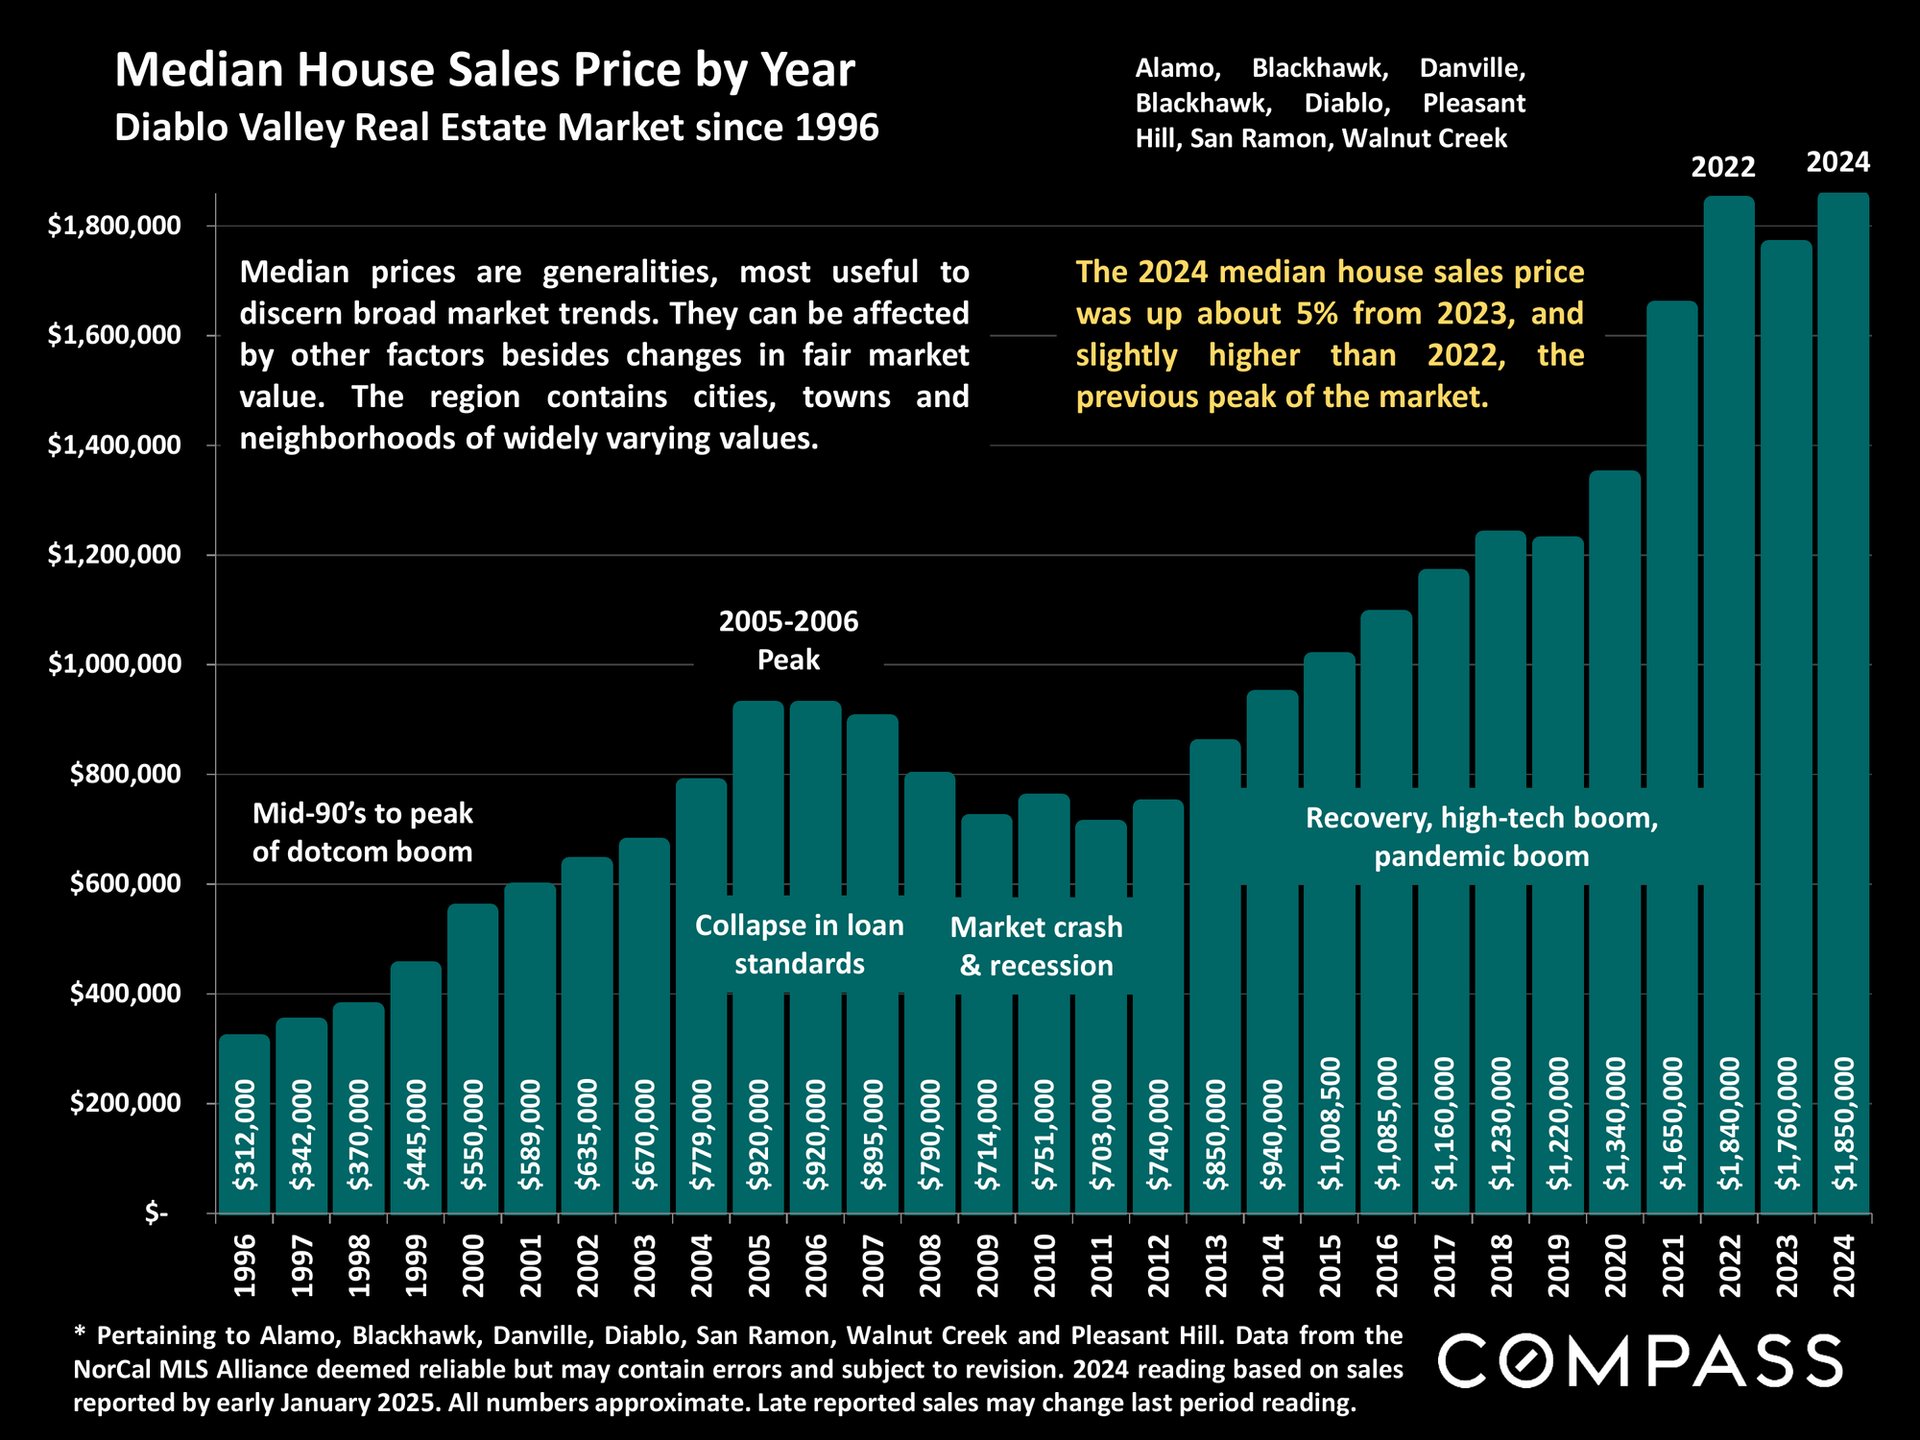
Bar chart of Diablo Valley median home prices from 1996 to 2024, rising to $1.85 million in 2024.
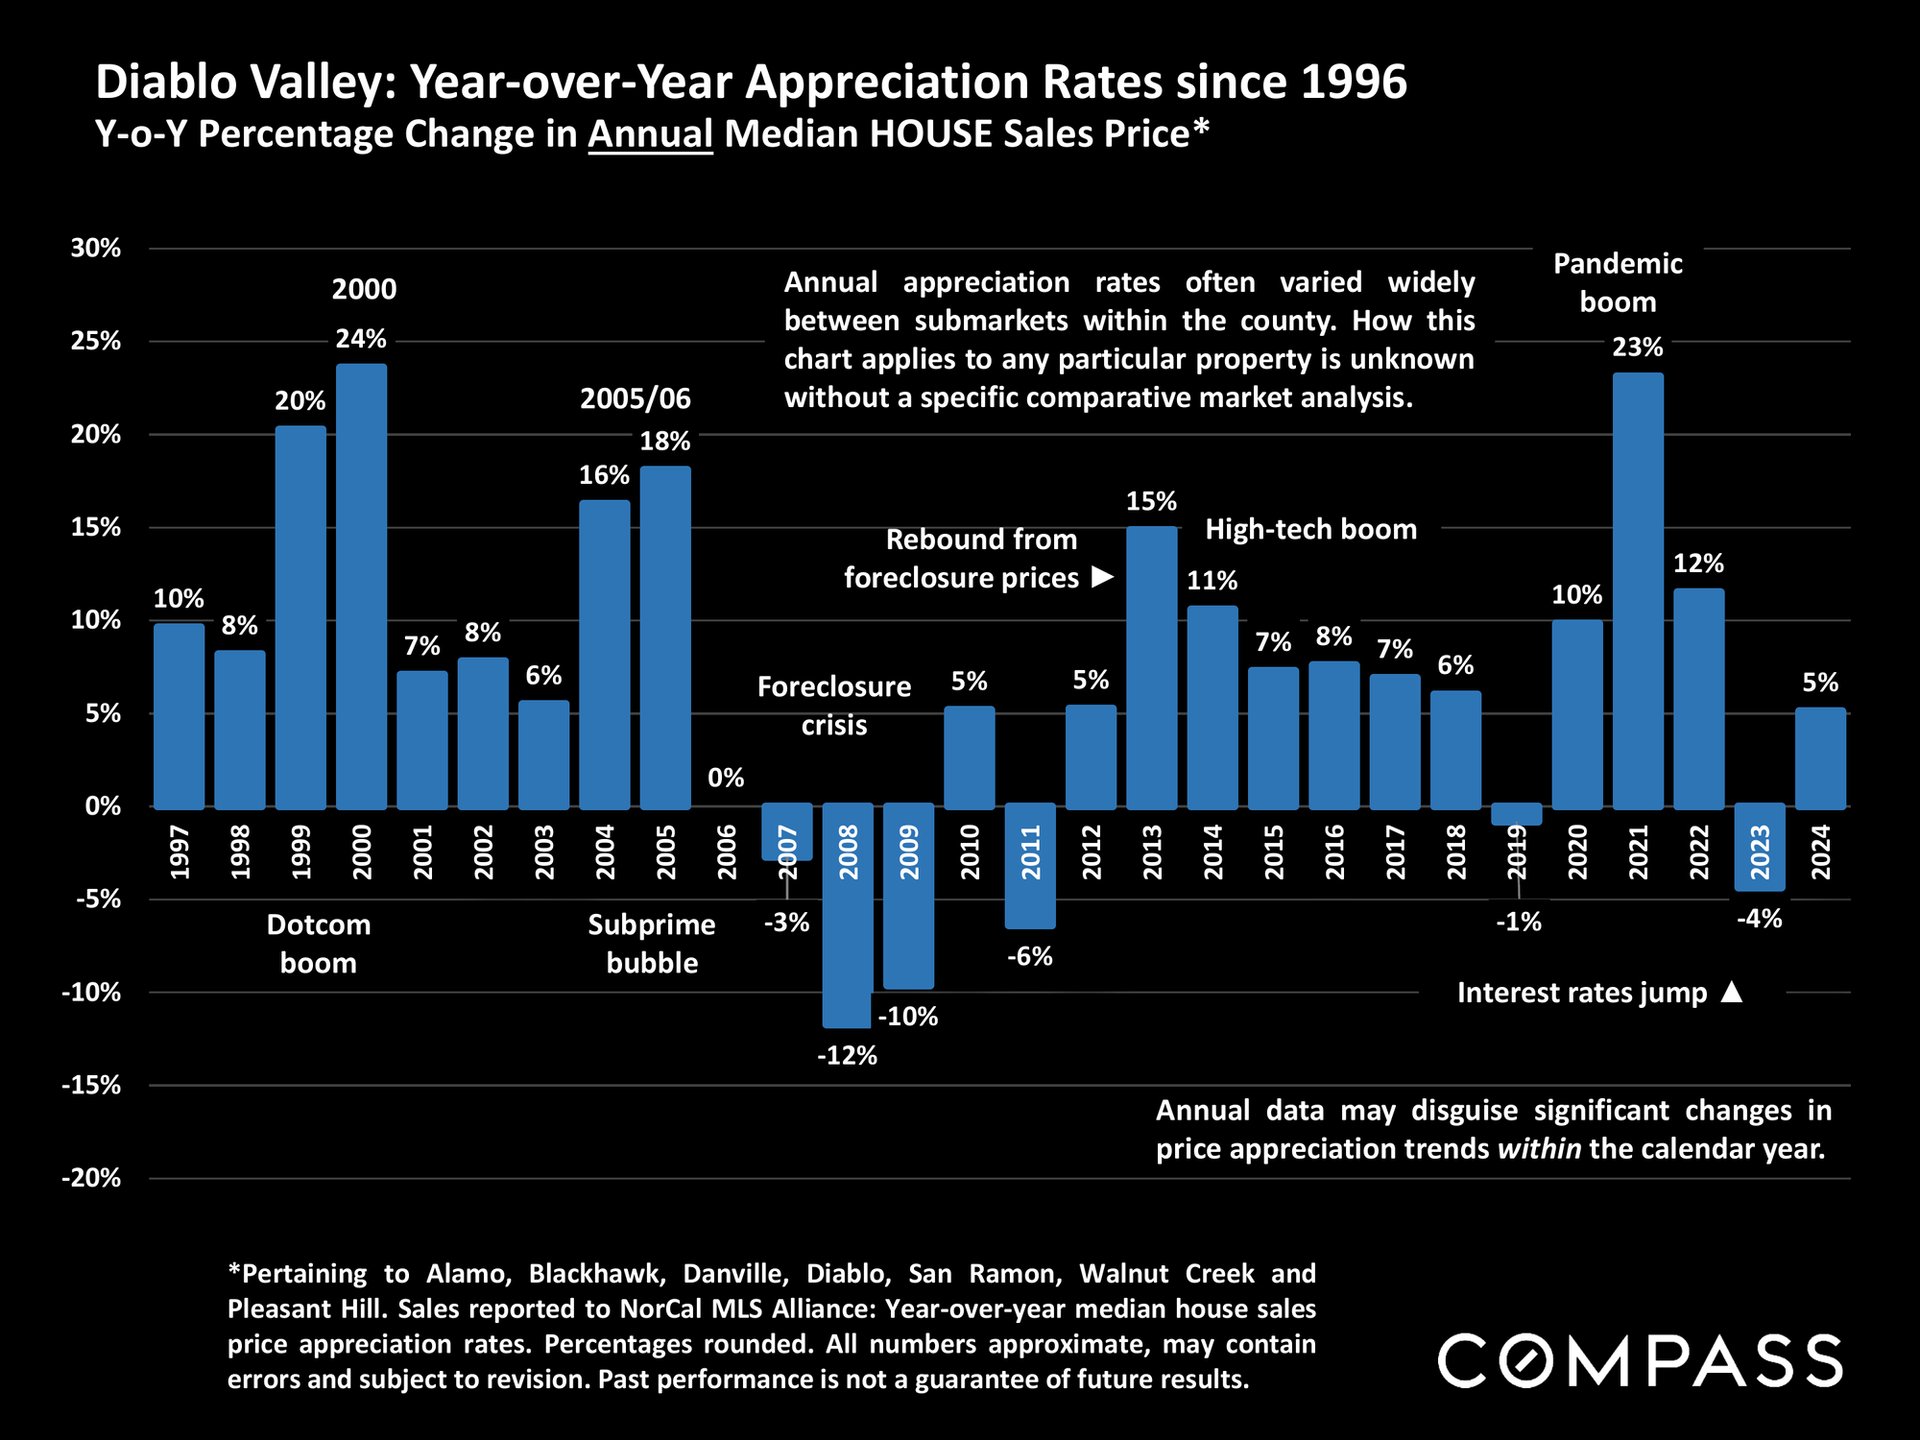
Diablo Valley home-price appreciation chart, with annual percentage changes from 1997 to 2024.
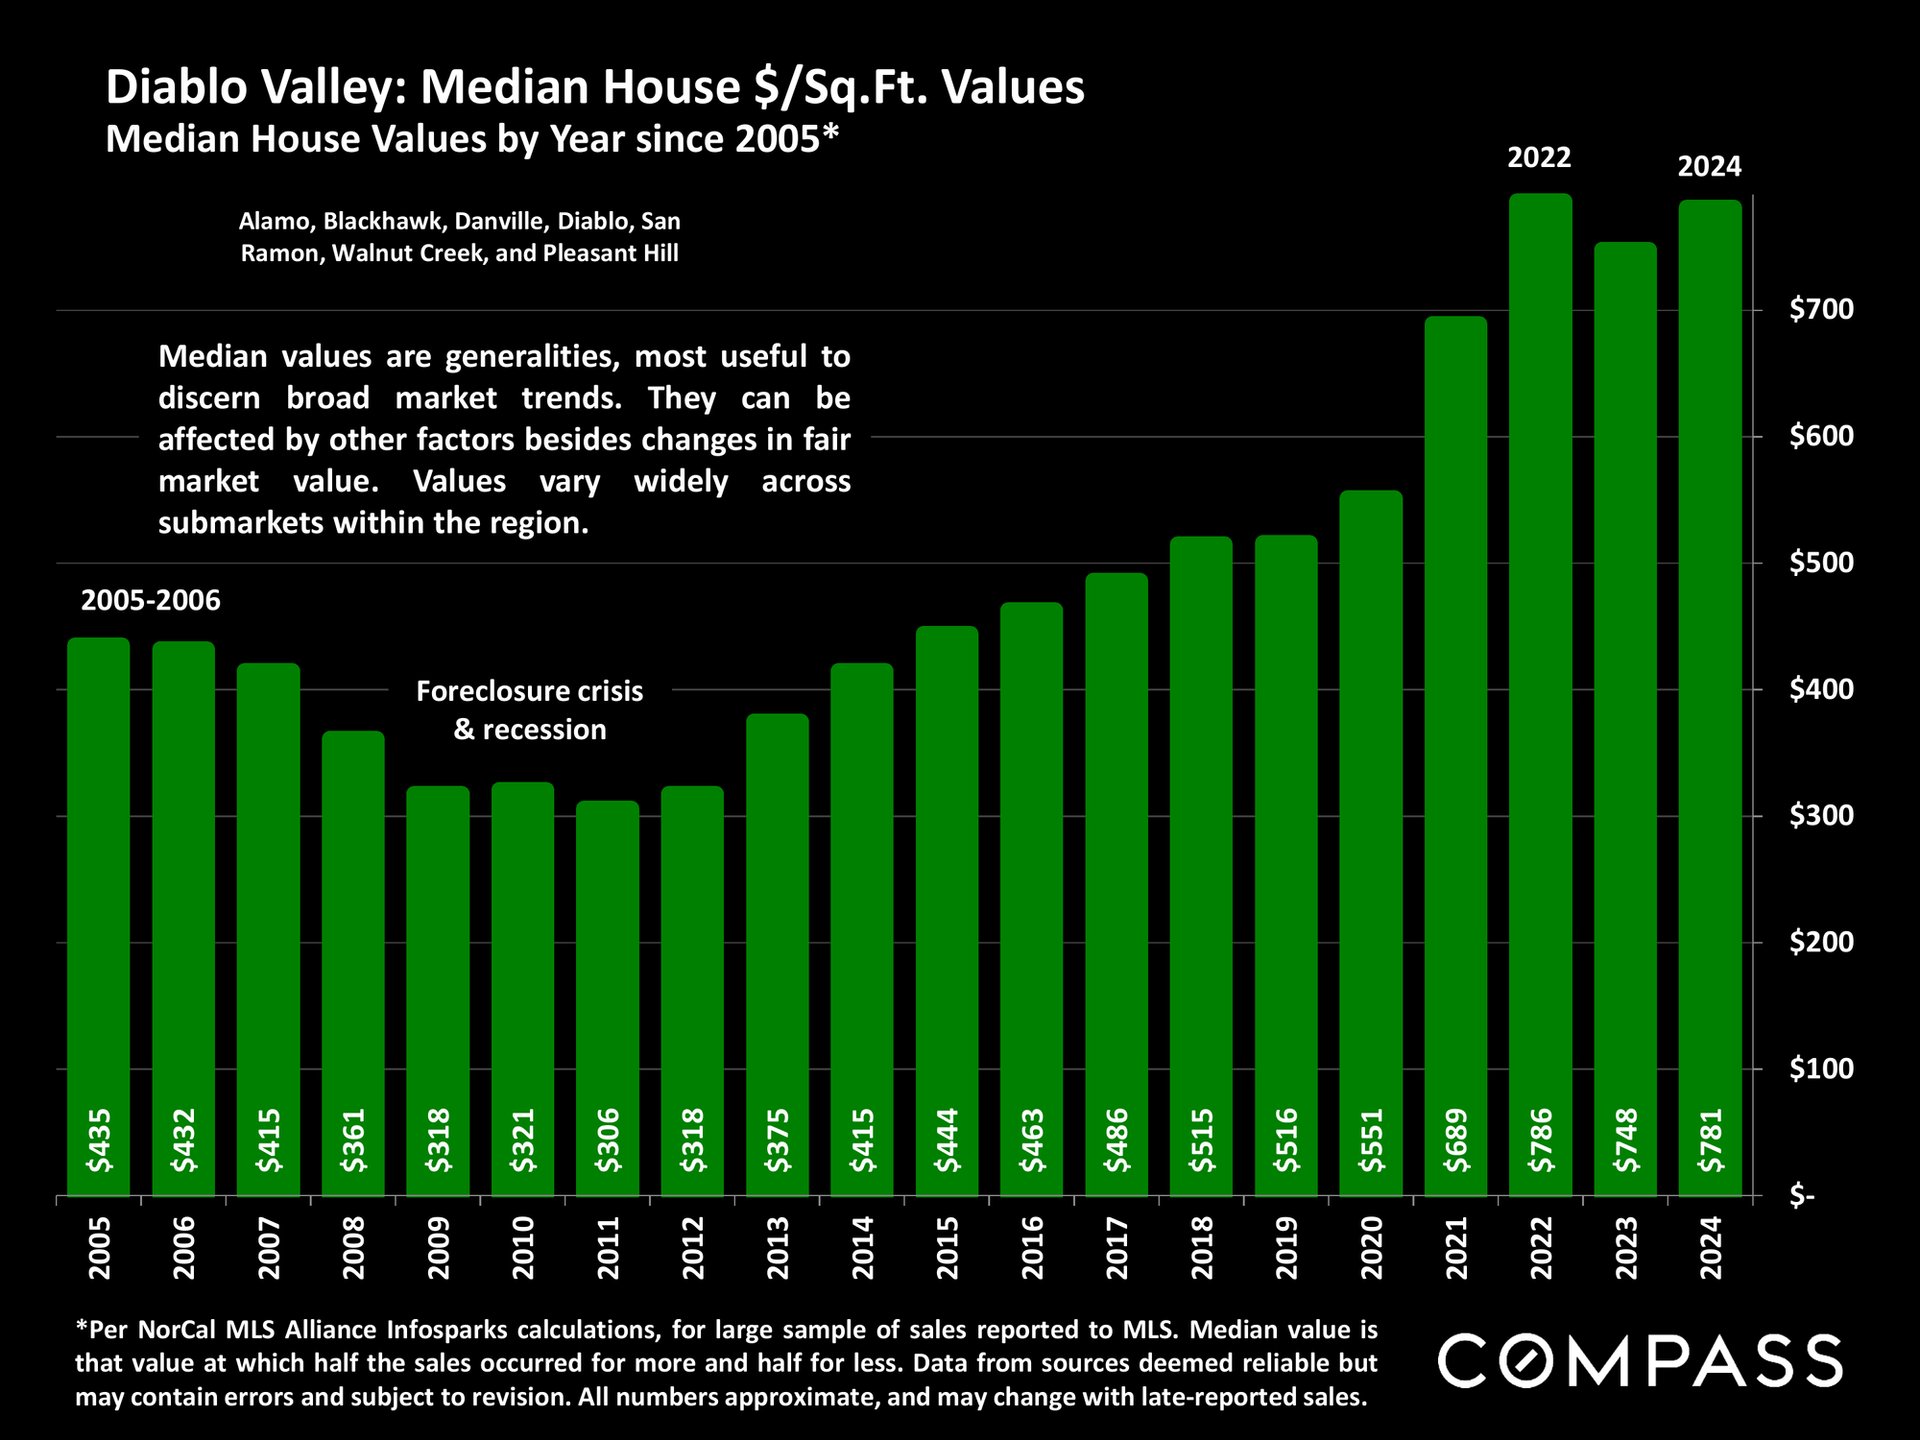
Diablo Valley median house values per square foot, charted annually from 2005 through 2024.
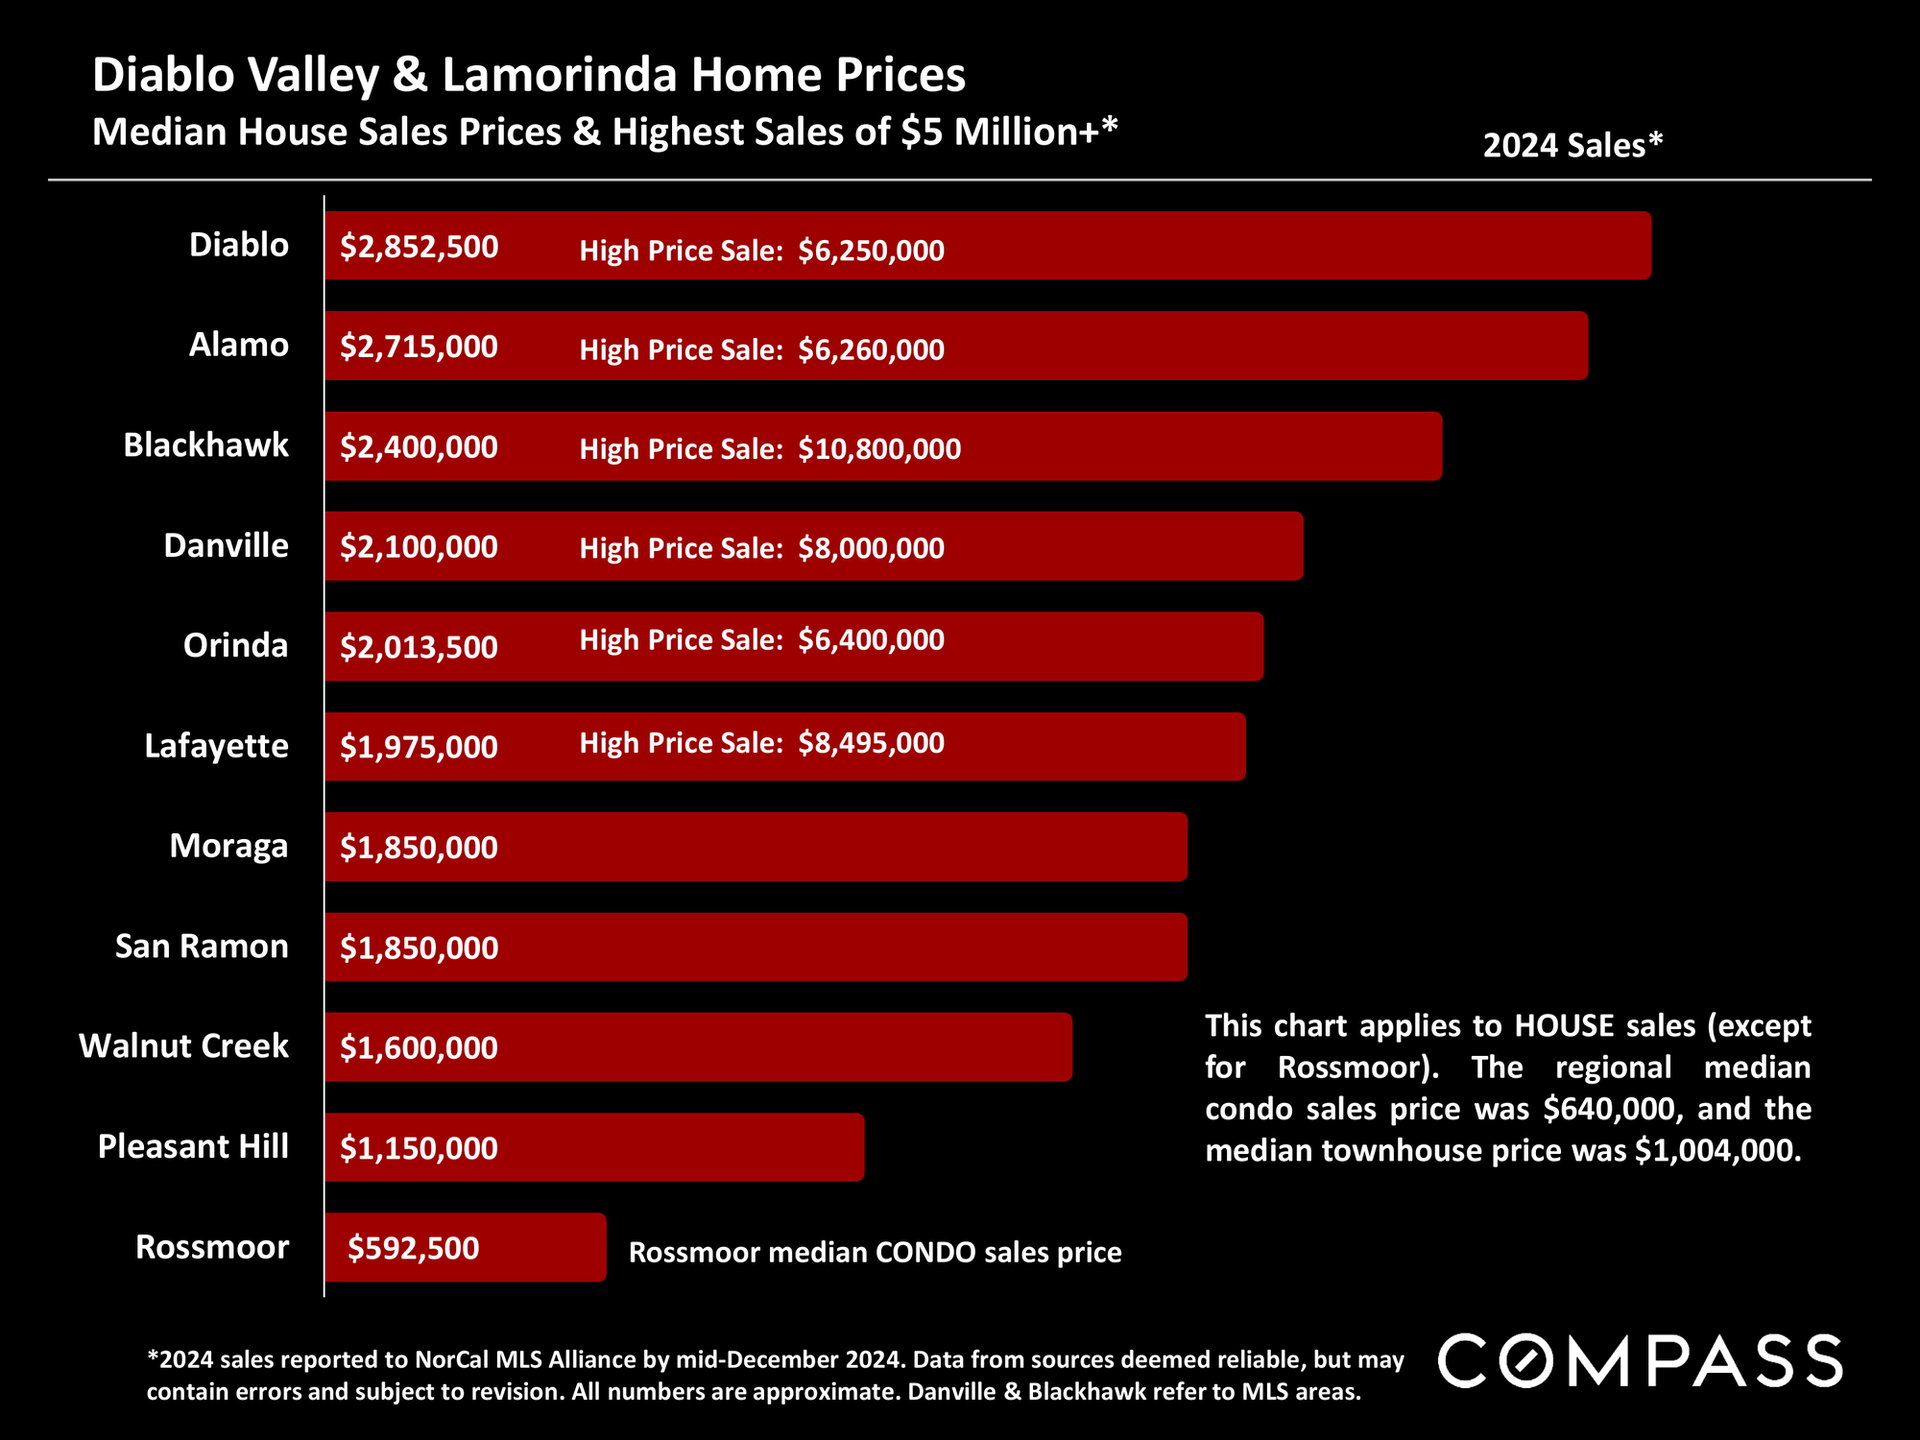
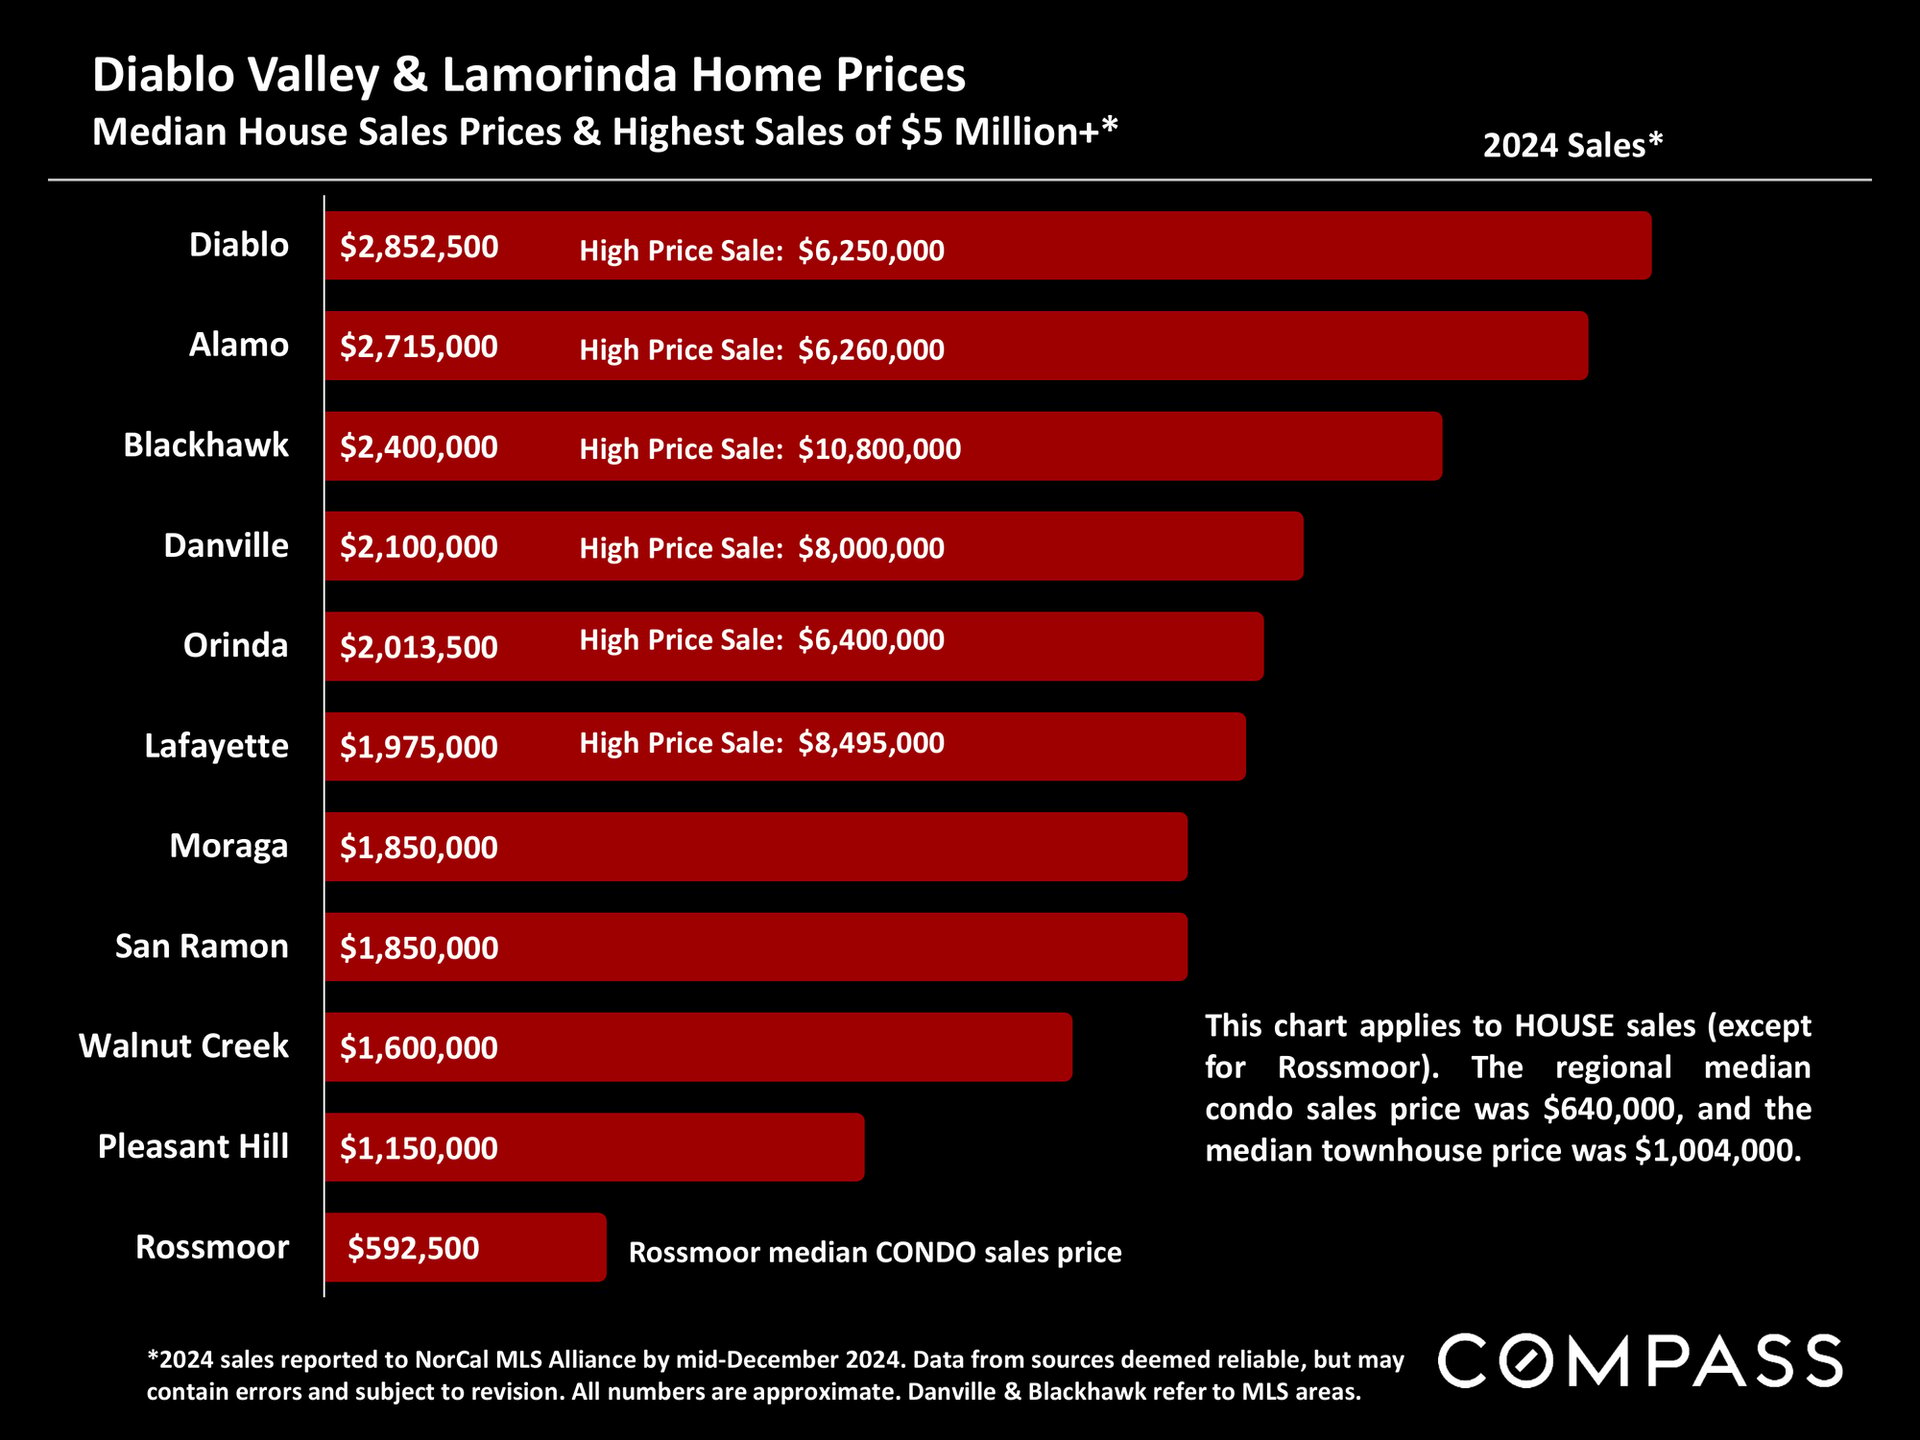
Chart of 2024 Diablo Valley and Lamorinda home prices, led by Diablo at $2,852,500; selected highest sales also shown.
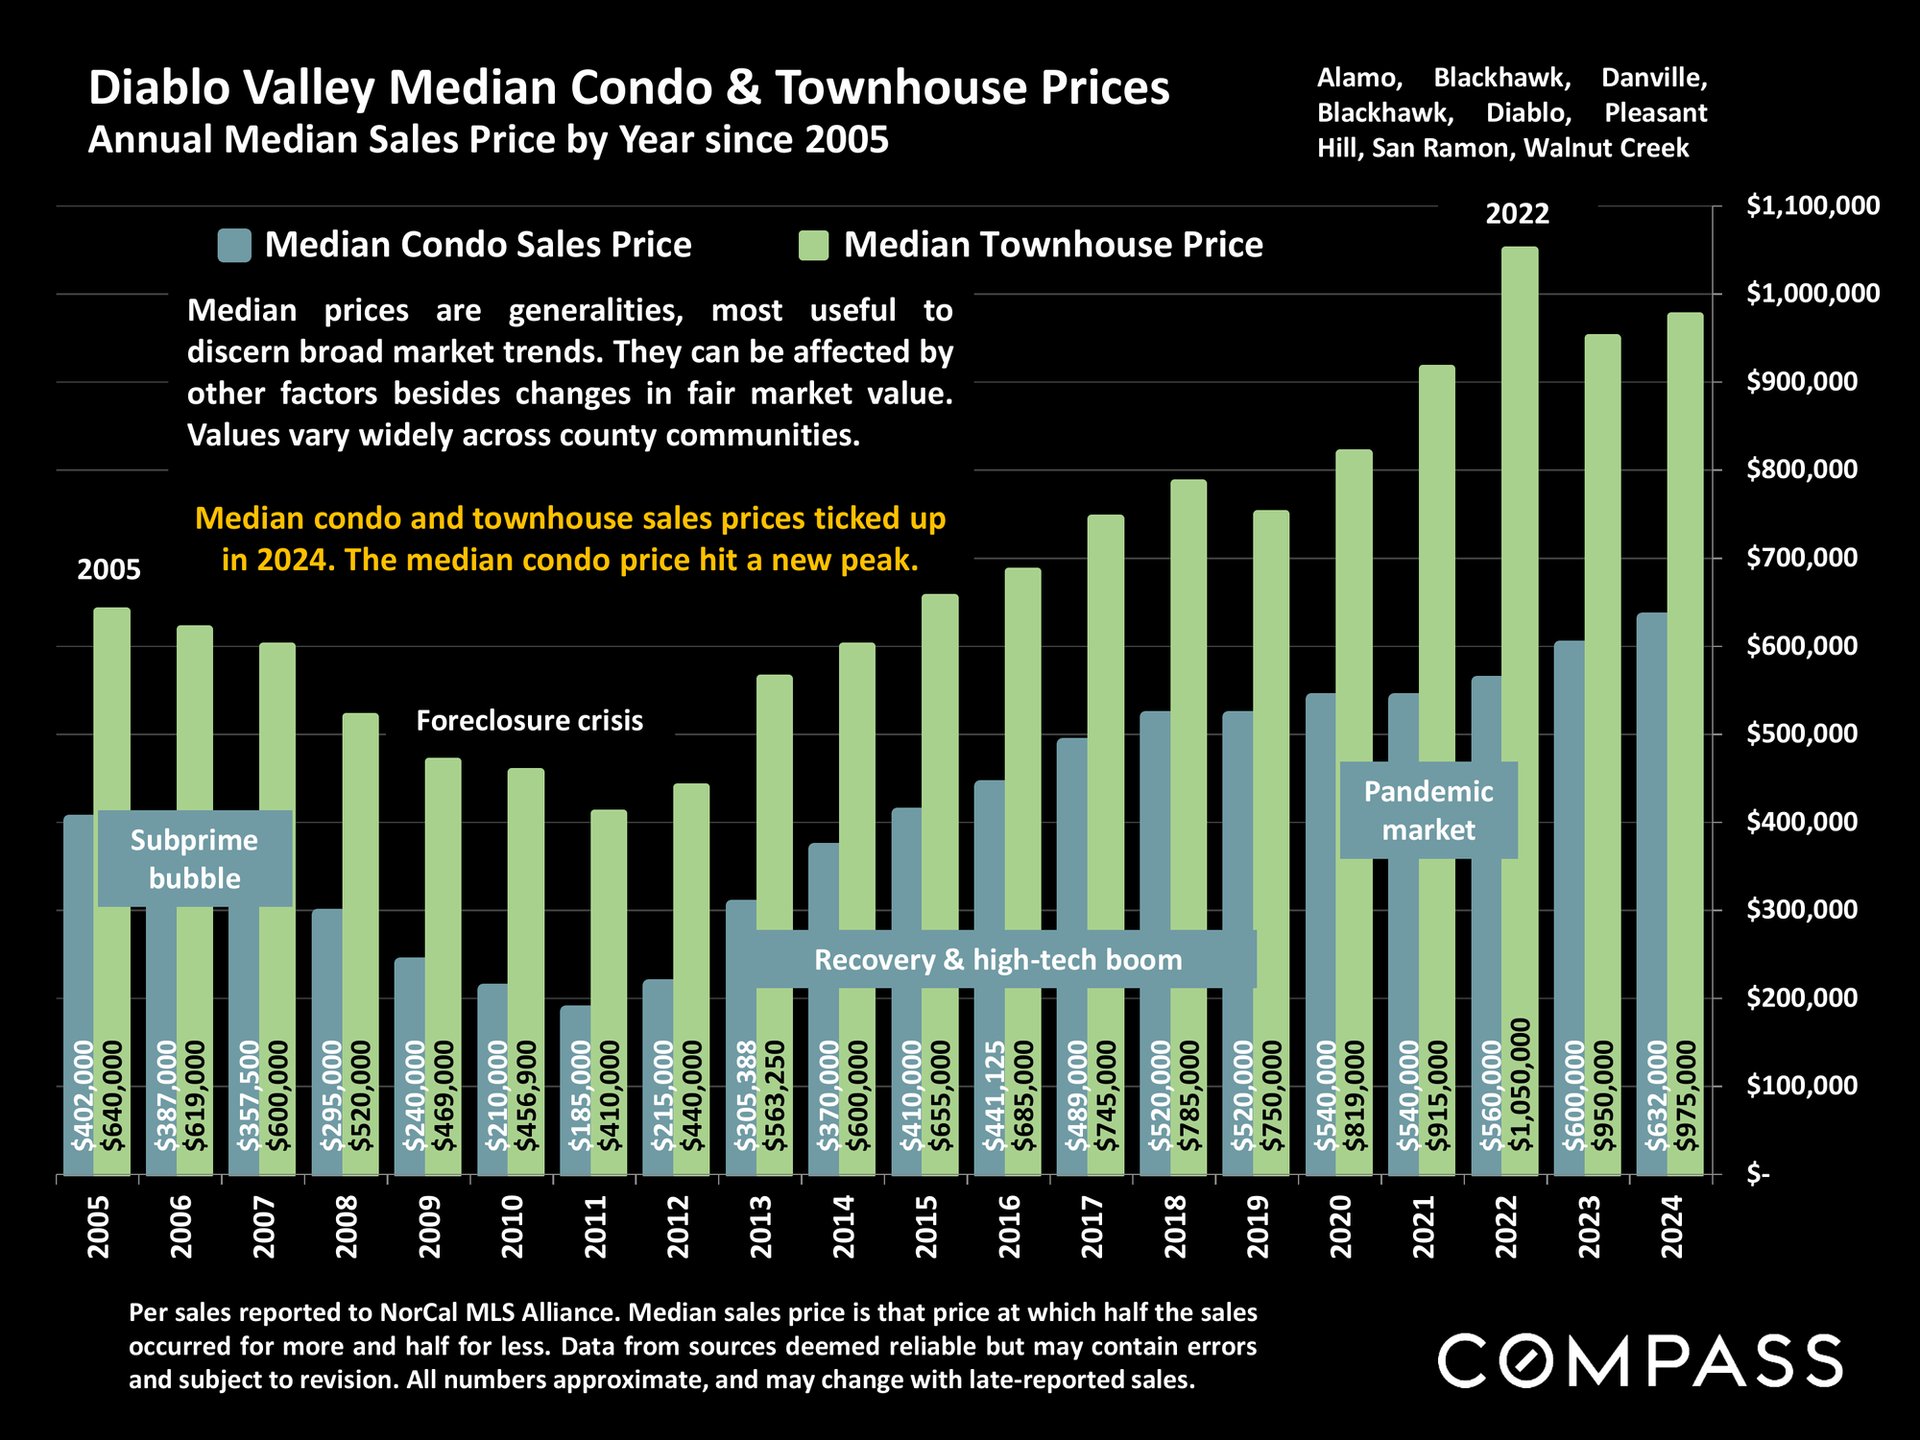
Diablo Valley real estate report graphic with rolling green hills and a link to updated city market information.Diablo Valley condo and townhouse price chart, 2005–2024, with market-era annotations.
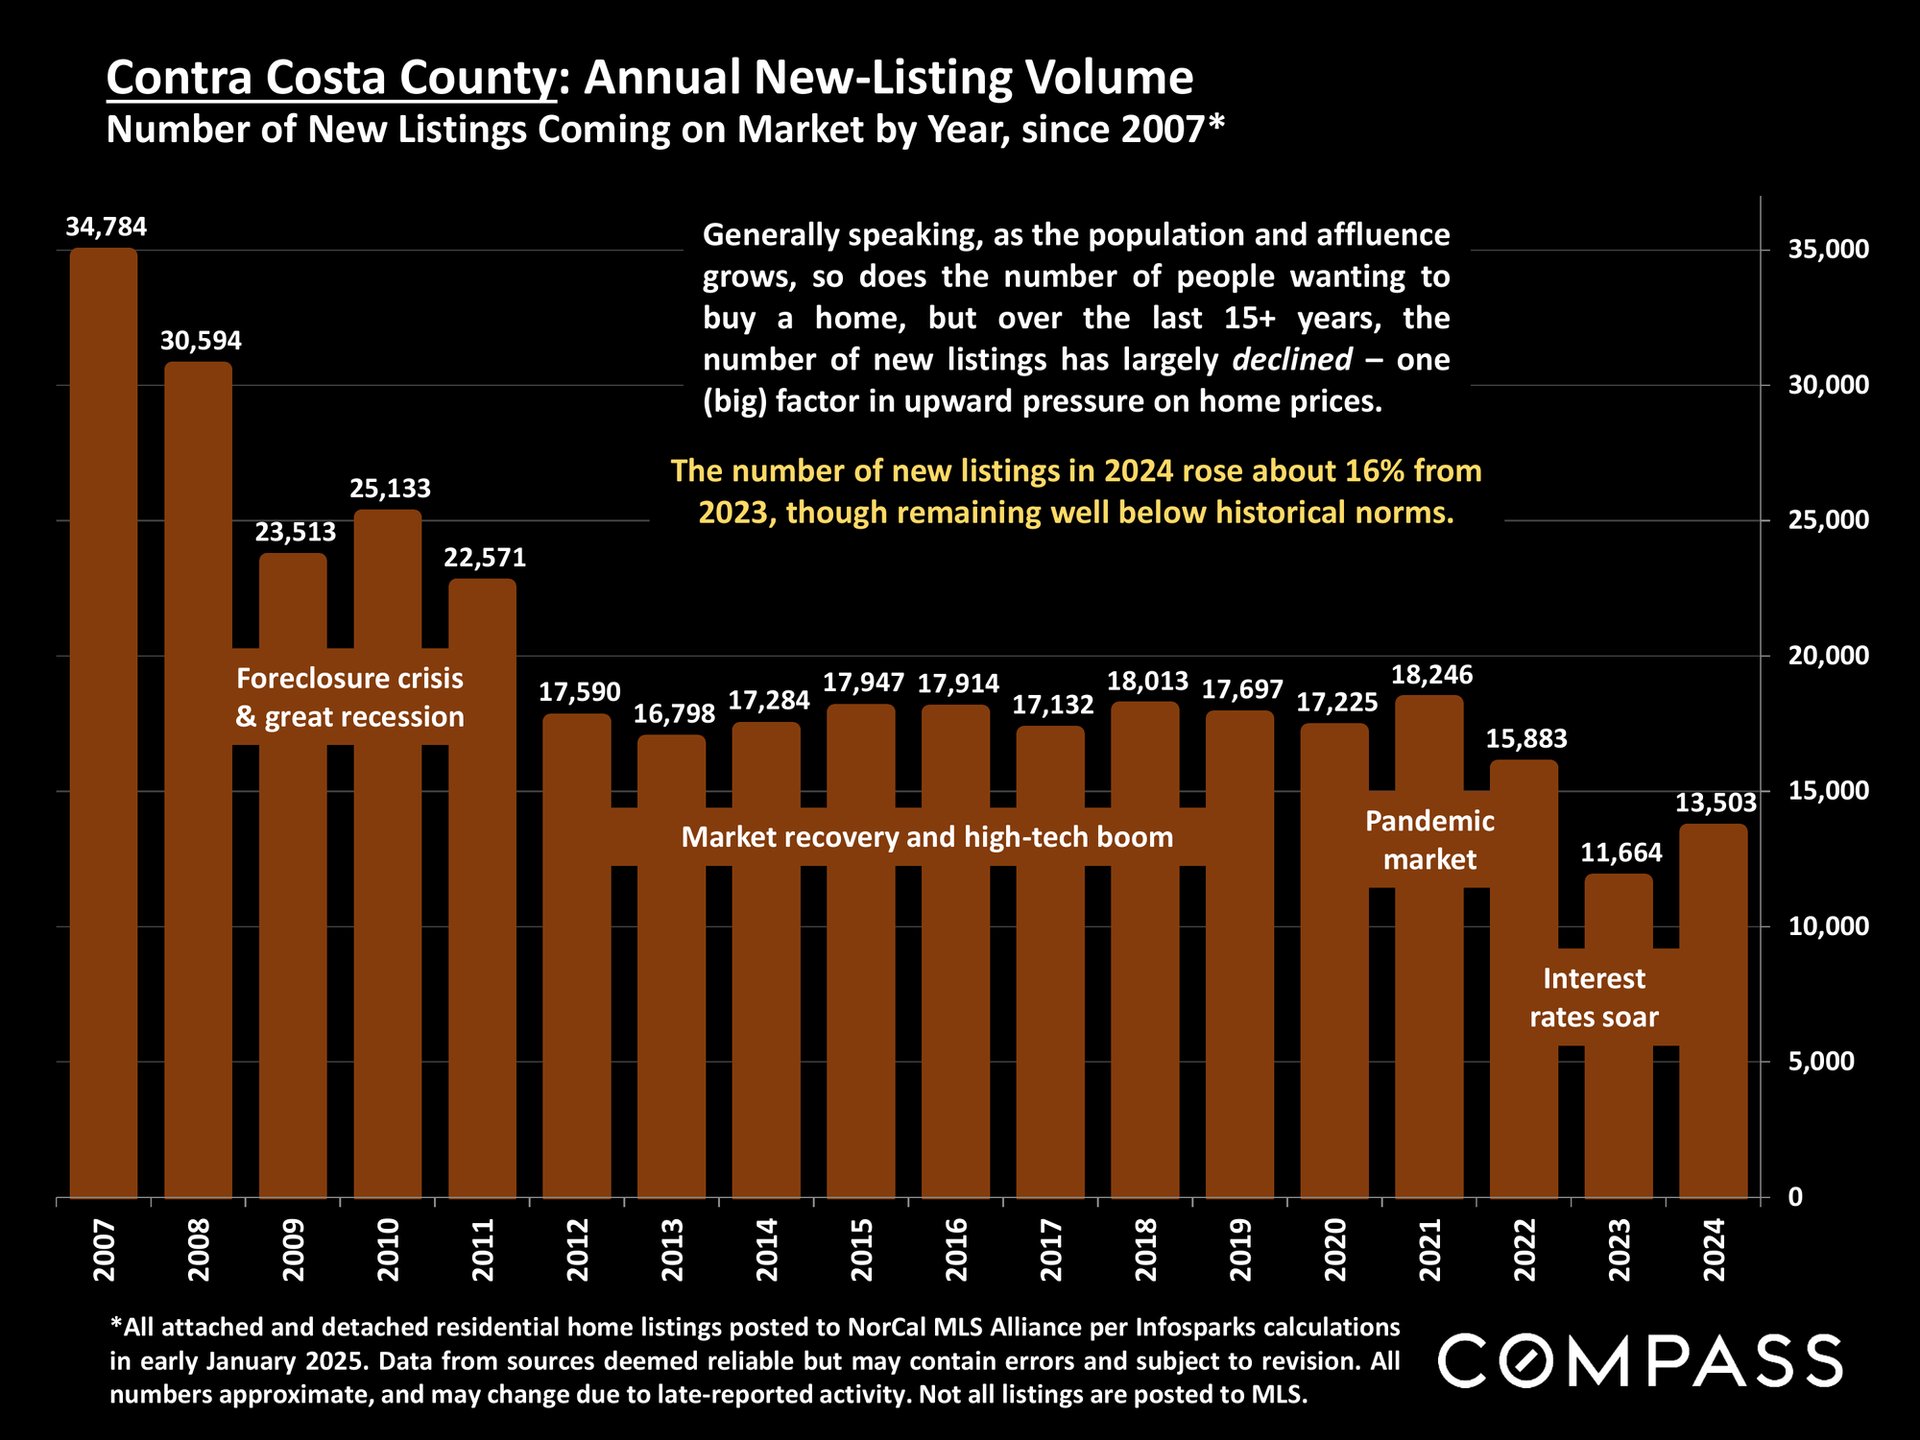
Chart of Contra Costa County new listings from 2007 to 2024, with historical market annotations and a 2024 increase.
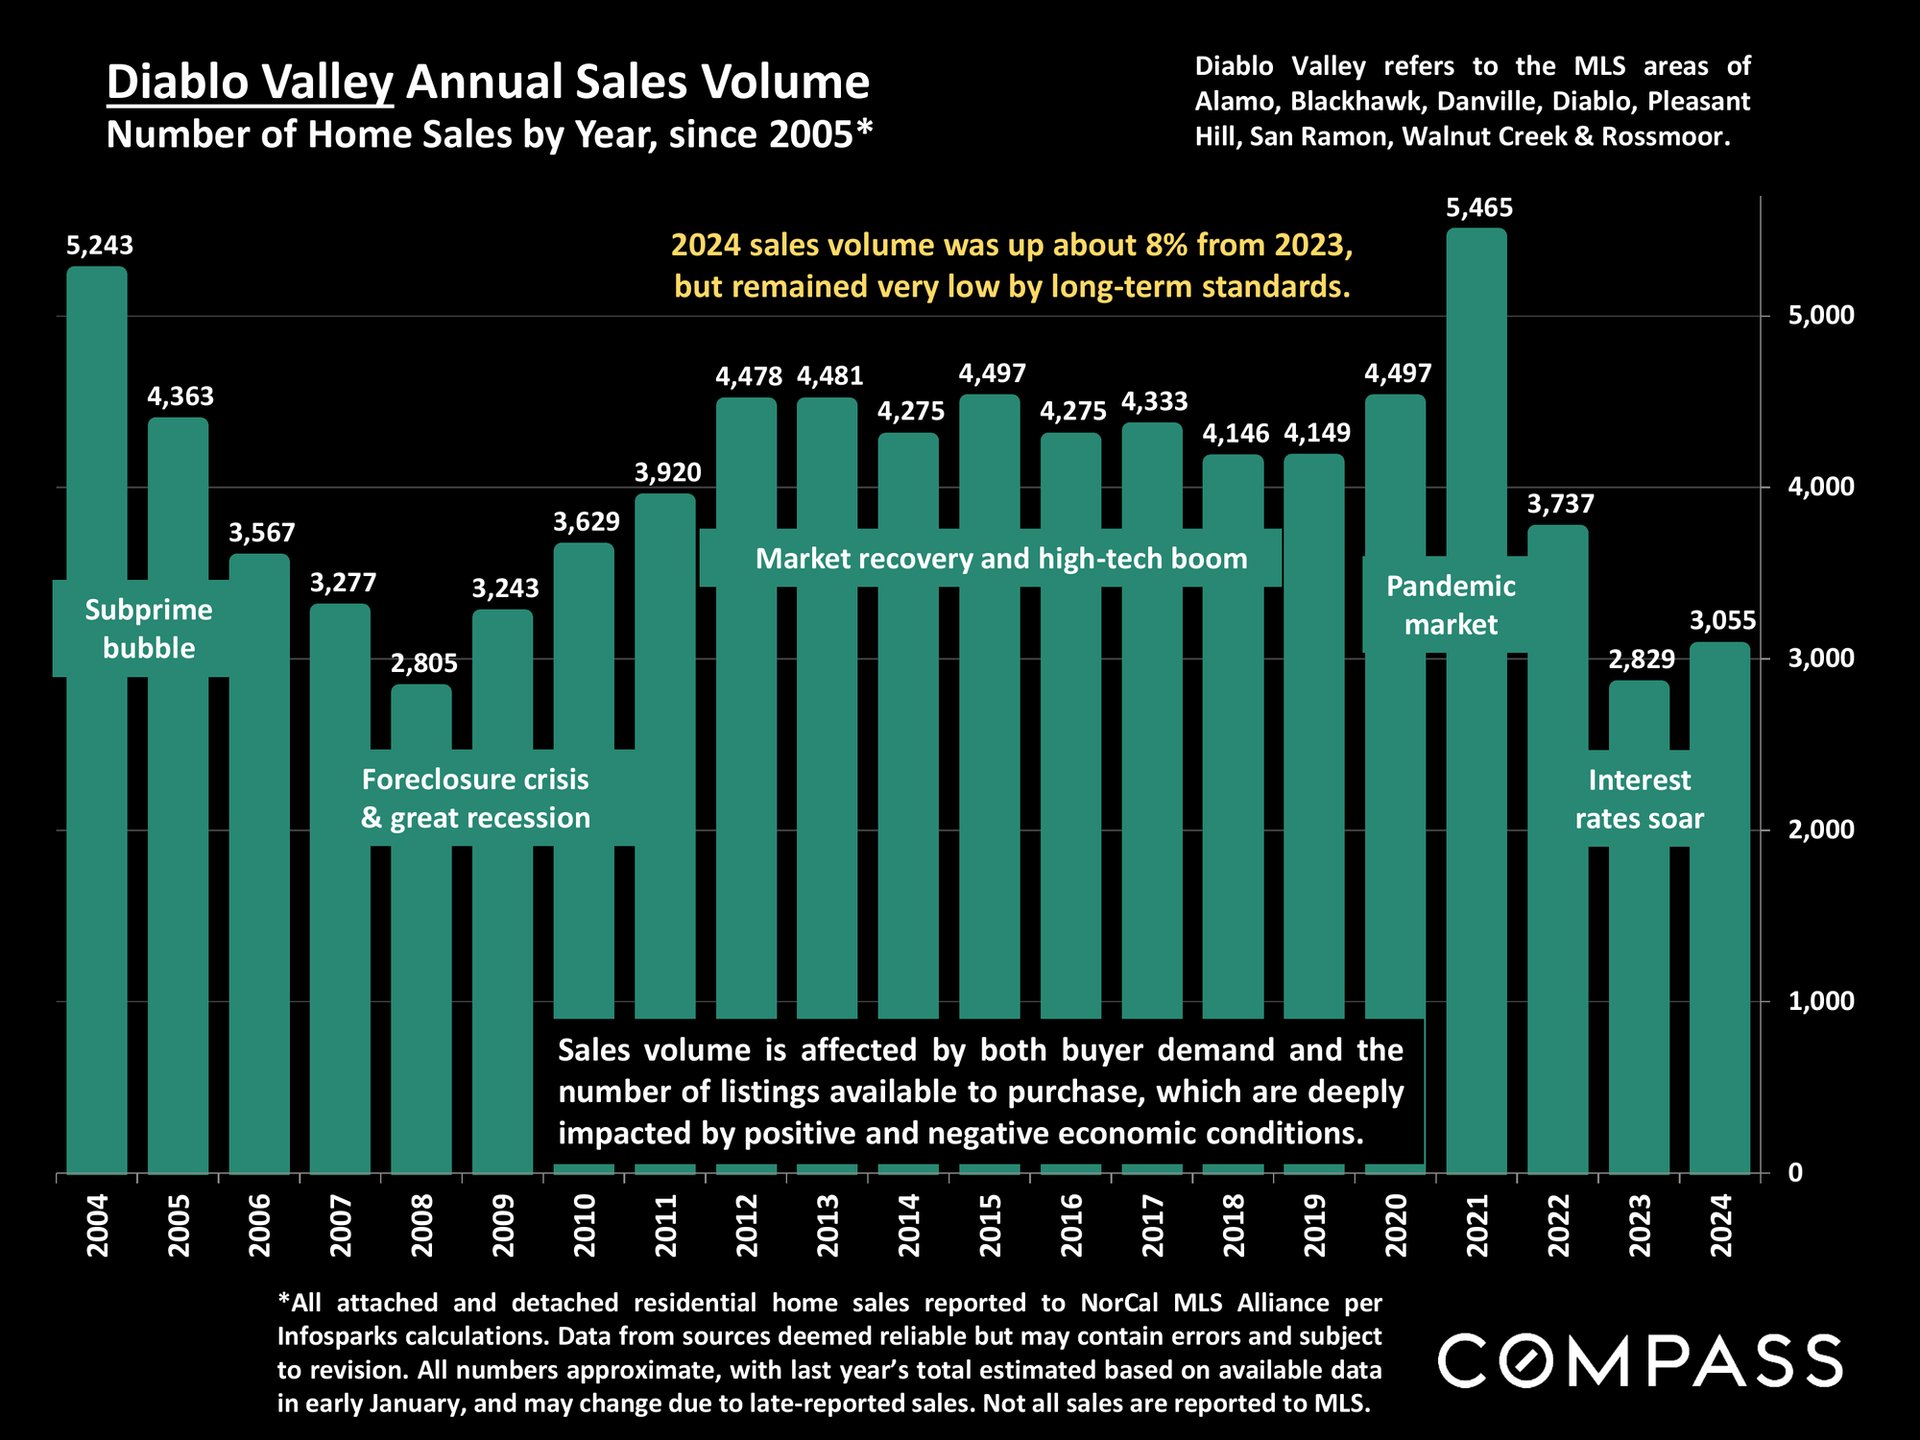
Diablo Valley annual home sales chart, with yearly totals from 2004 to 2024 and market-period annotations.
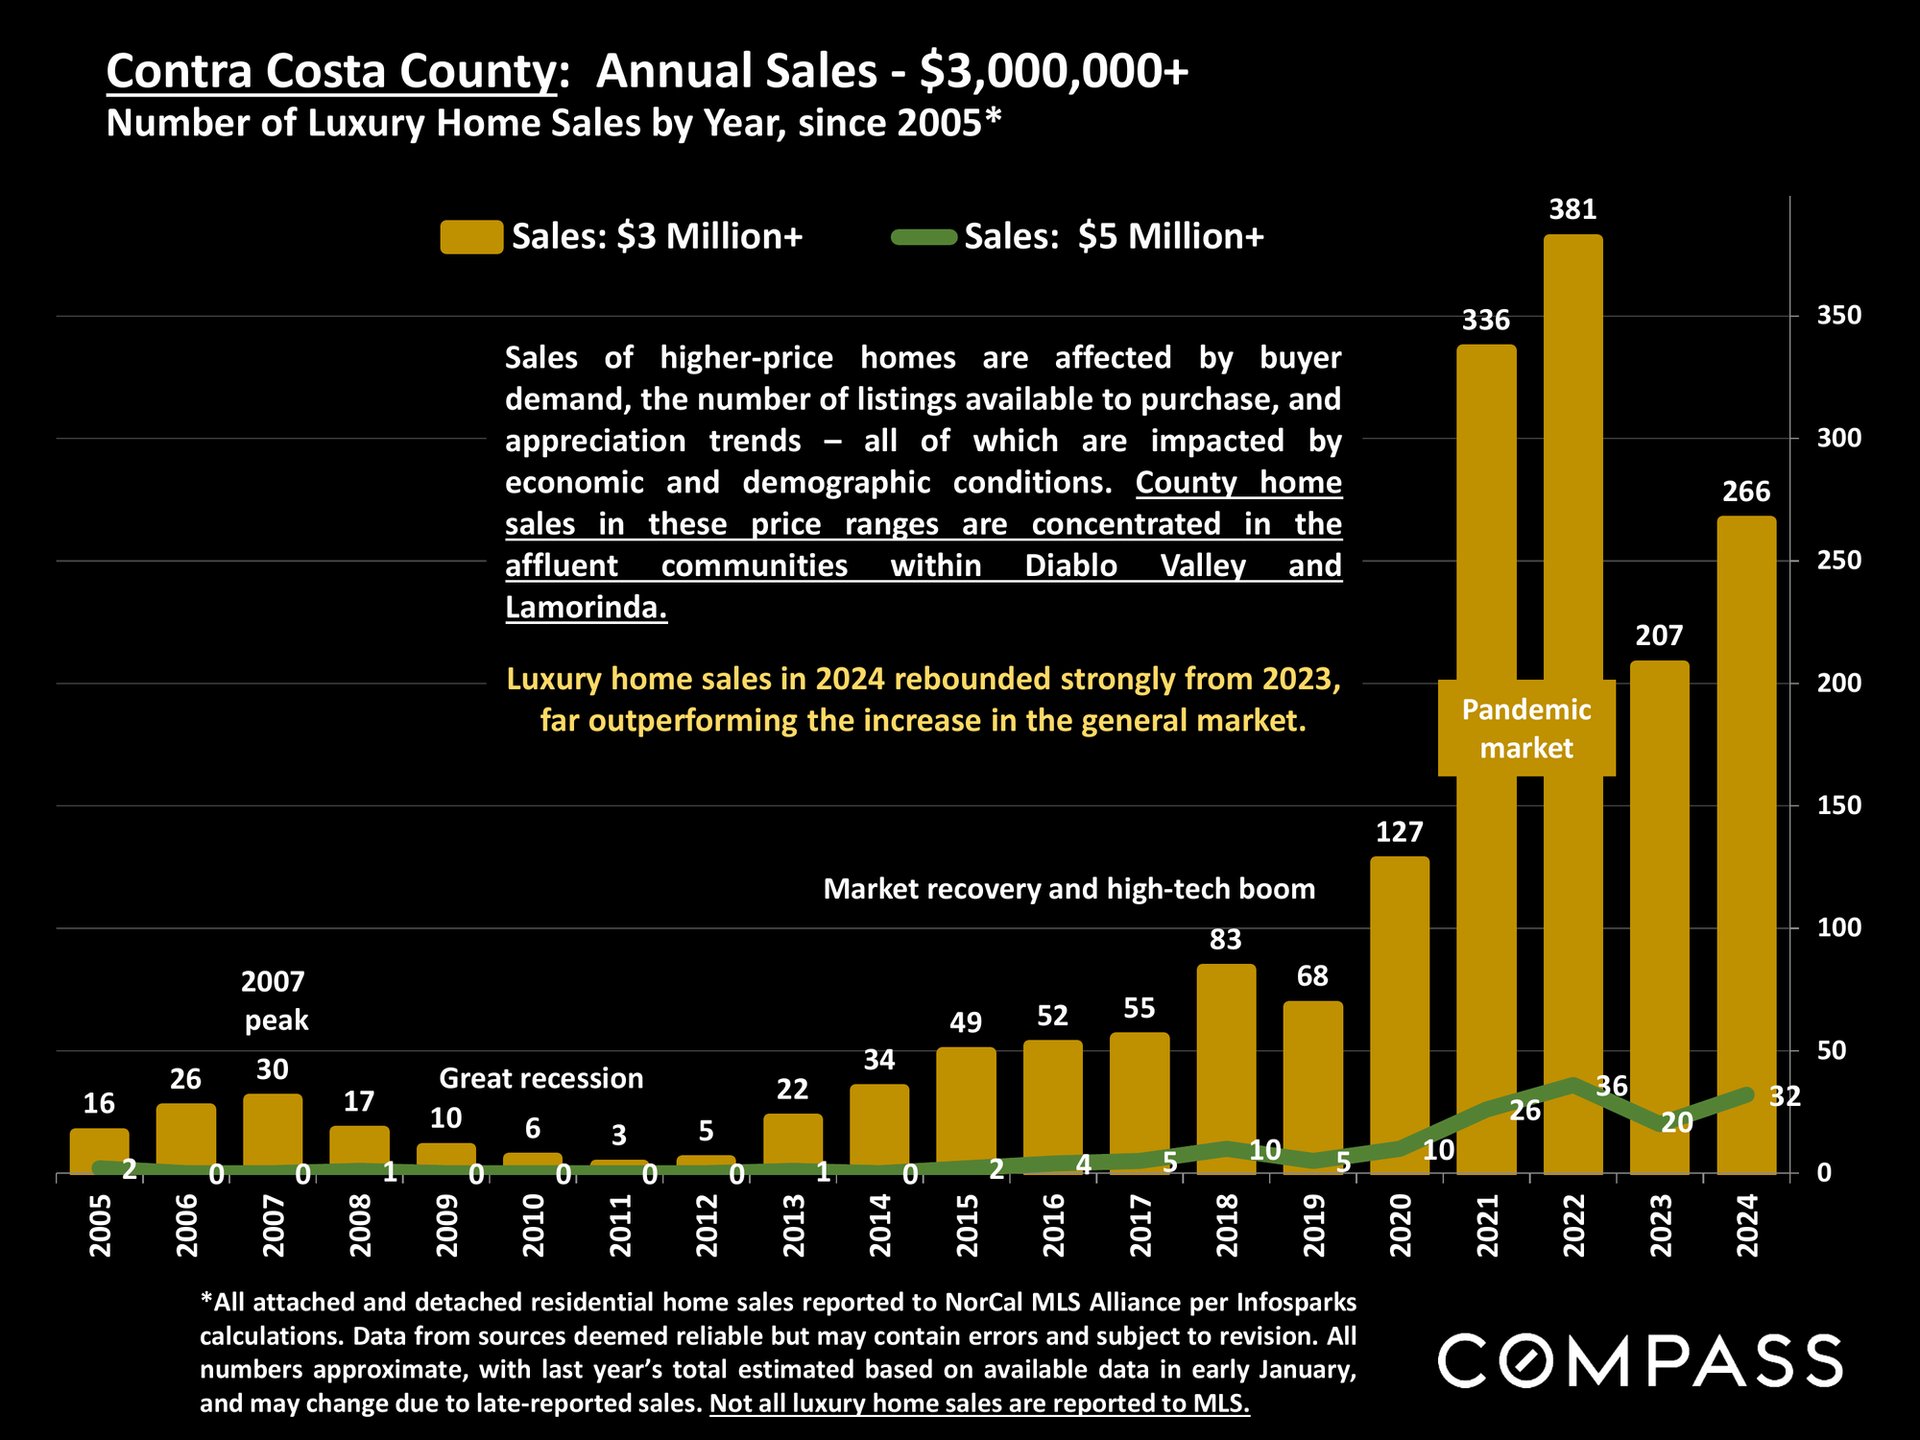
Chart of Contra Costa County luxury home sales from 2005 to 2024, with $3 million and $5 million price thresholds.
Infographic chart of 2024 Diablo Valley home sales by price segment and property type.
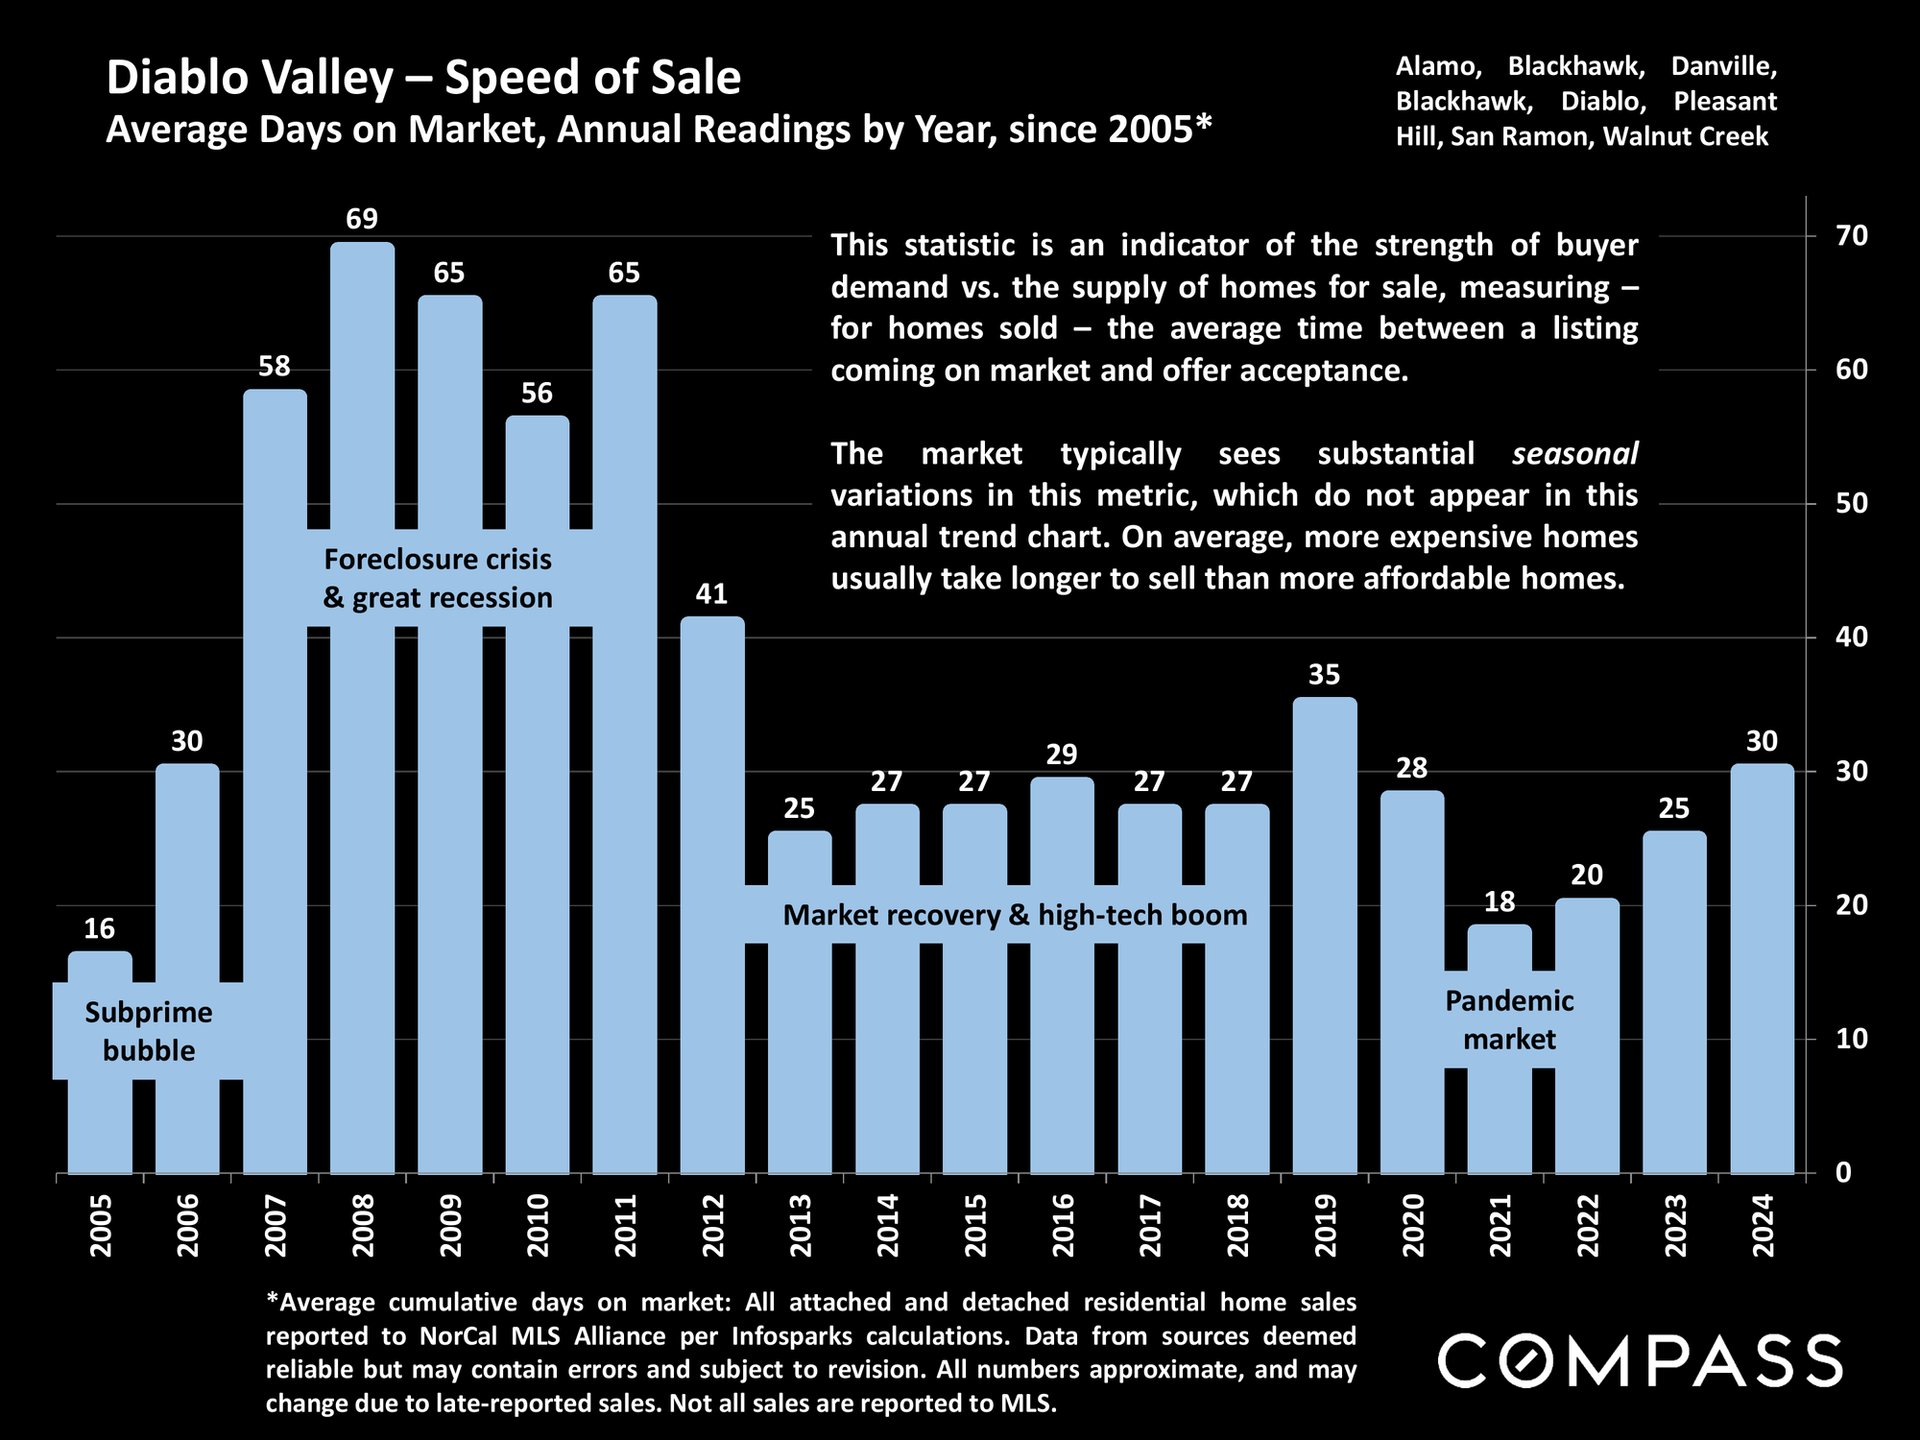
Diablo Valley home-sale days-on-market chart, with annual values from 2005 to 2024 and market-period annotations.
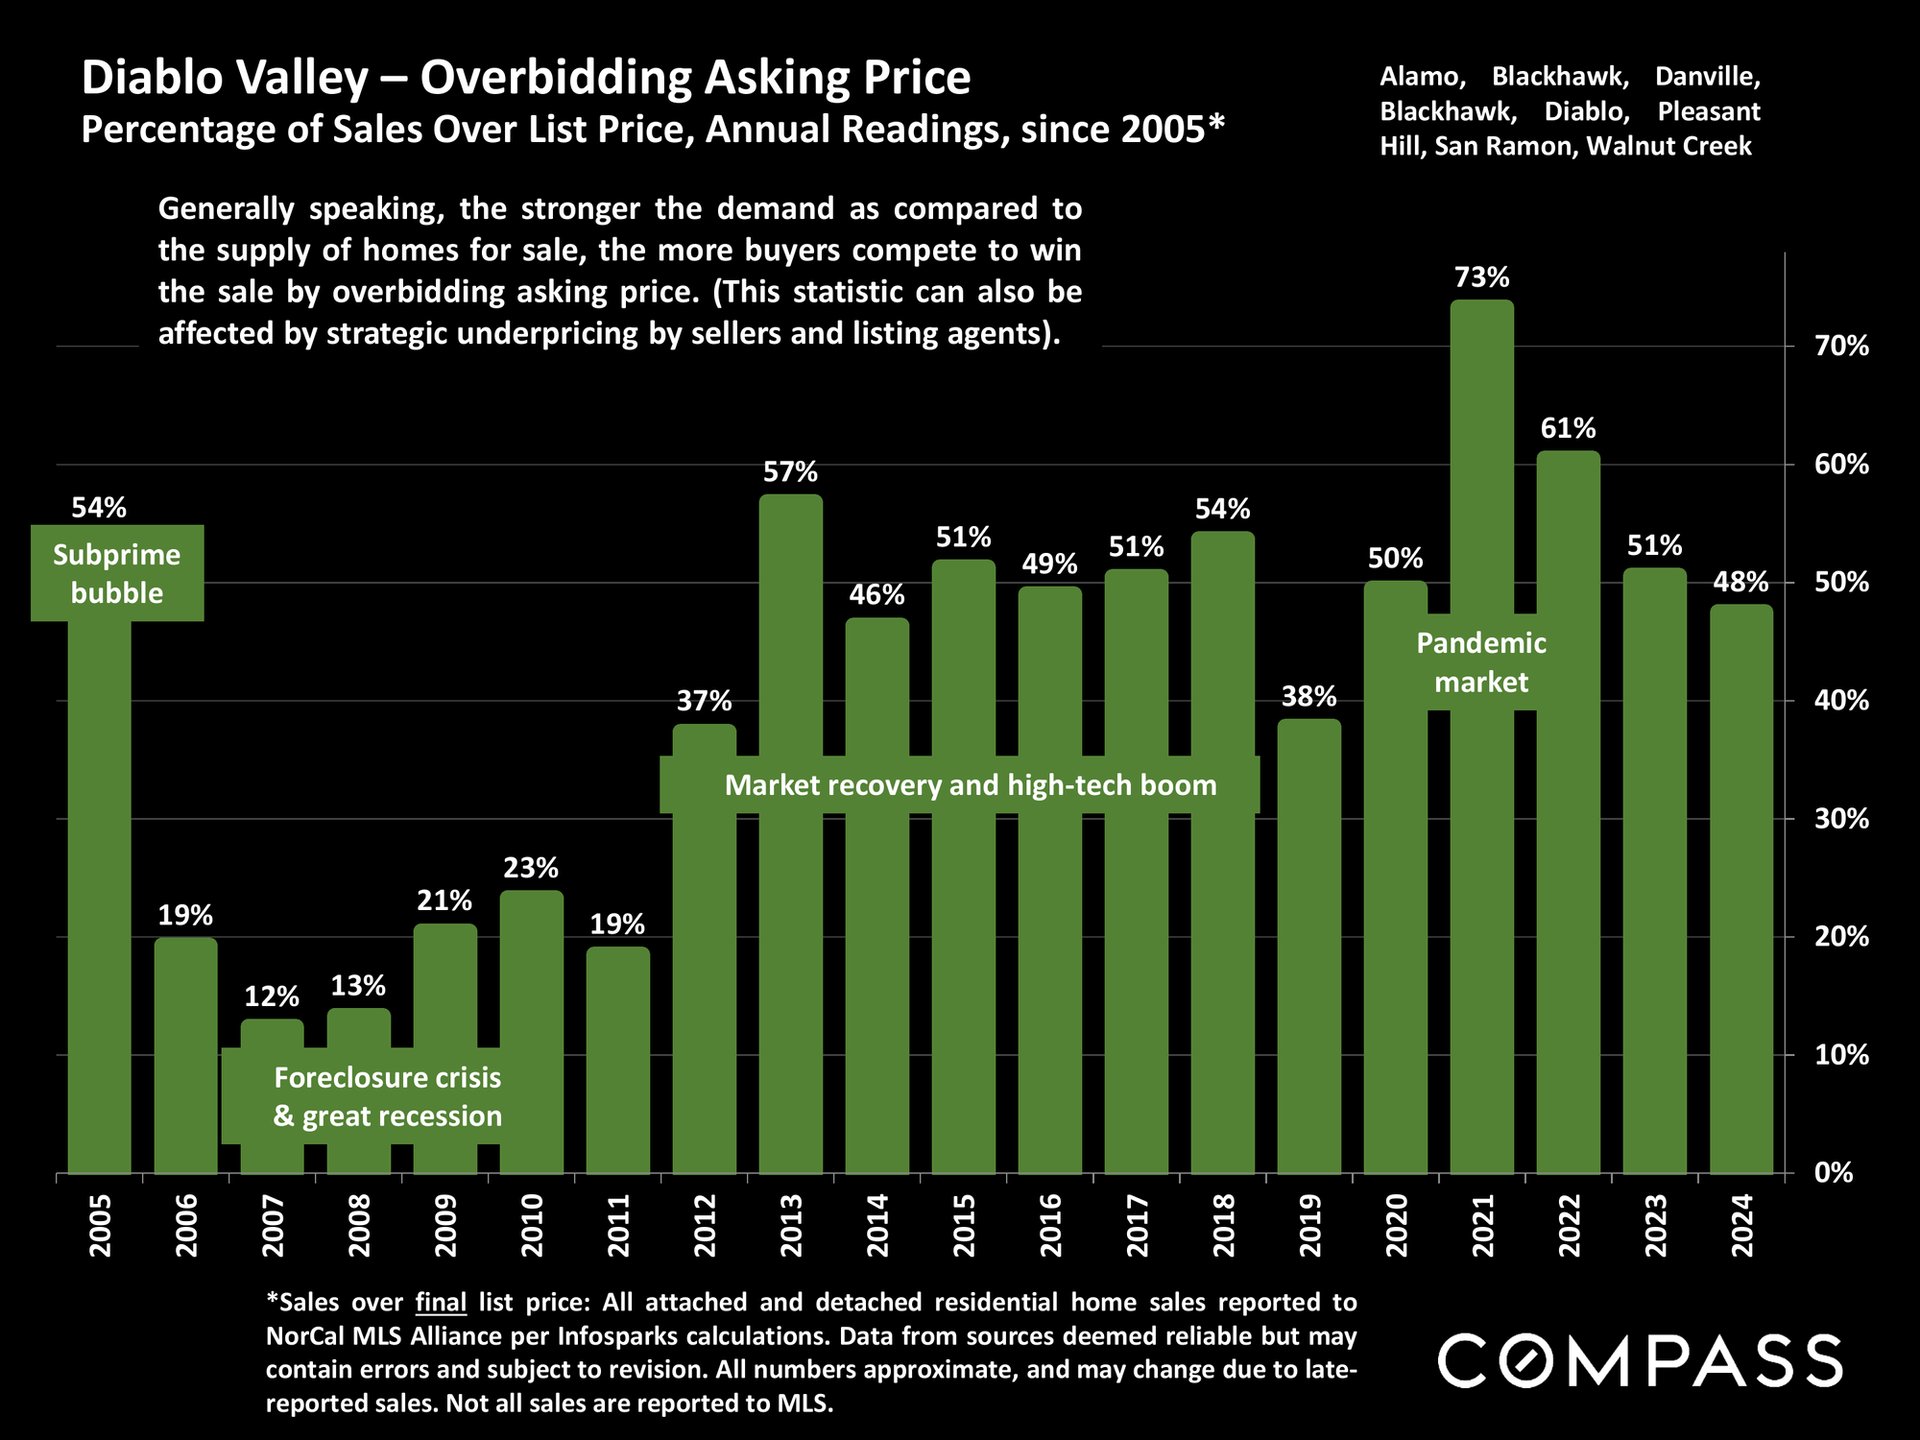
Bar chart of Diablo Valley home sales over list price, peaking at 73% in 2021 and falling to 48% in 2024.
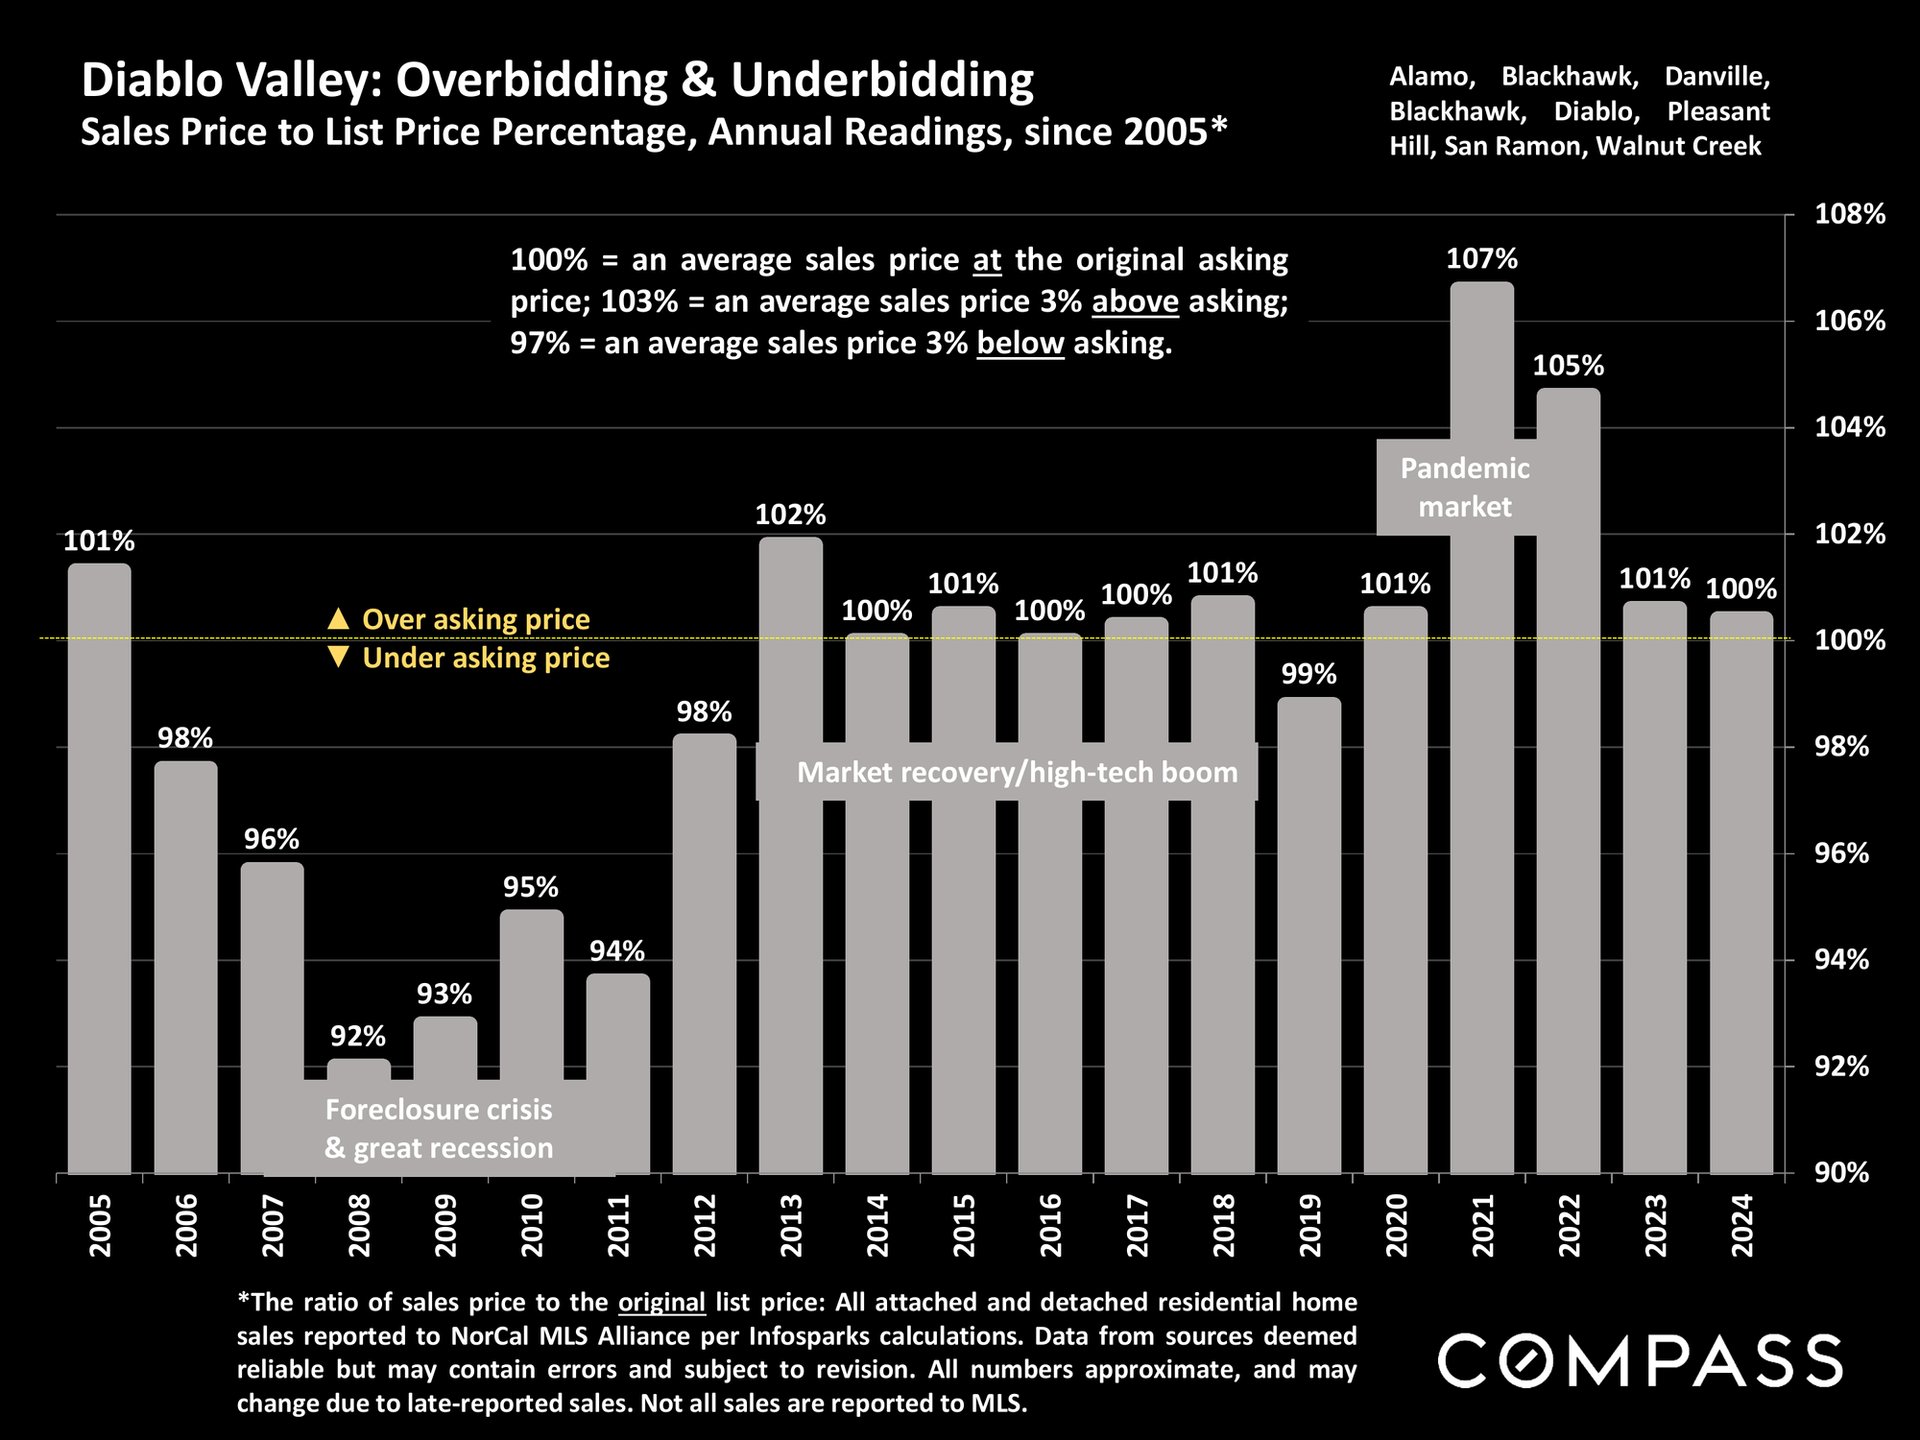
Chart of Diablo Valley home sale prices versus asking prices from 2005 to 2024, with recession and pandemic market annotations.
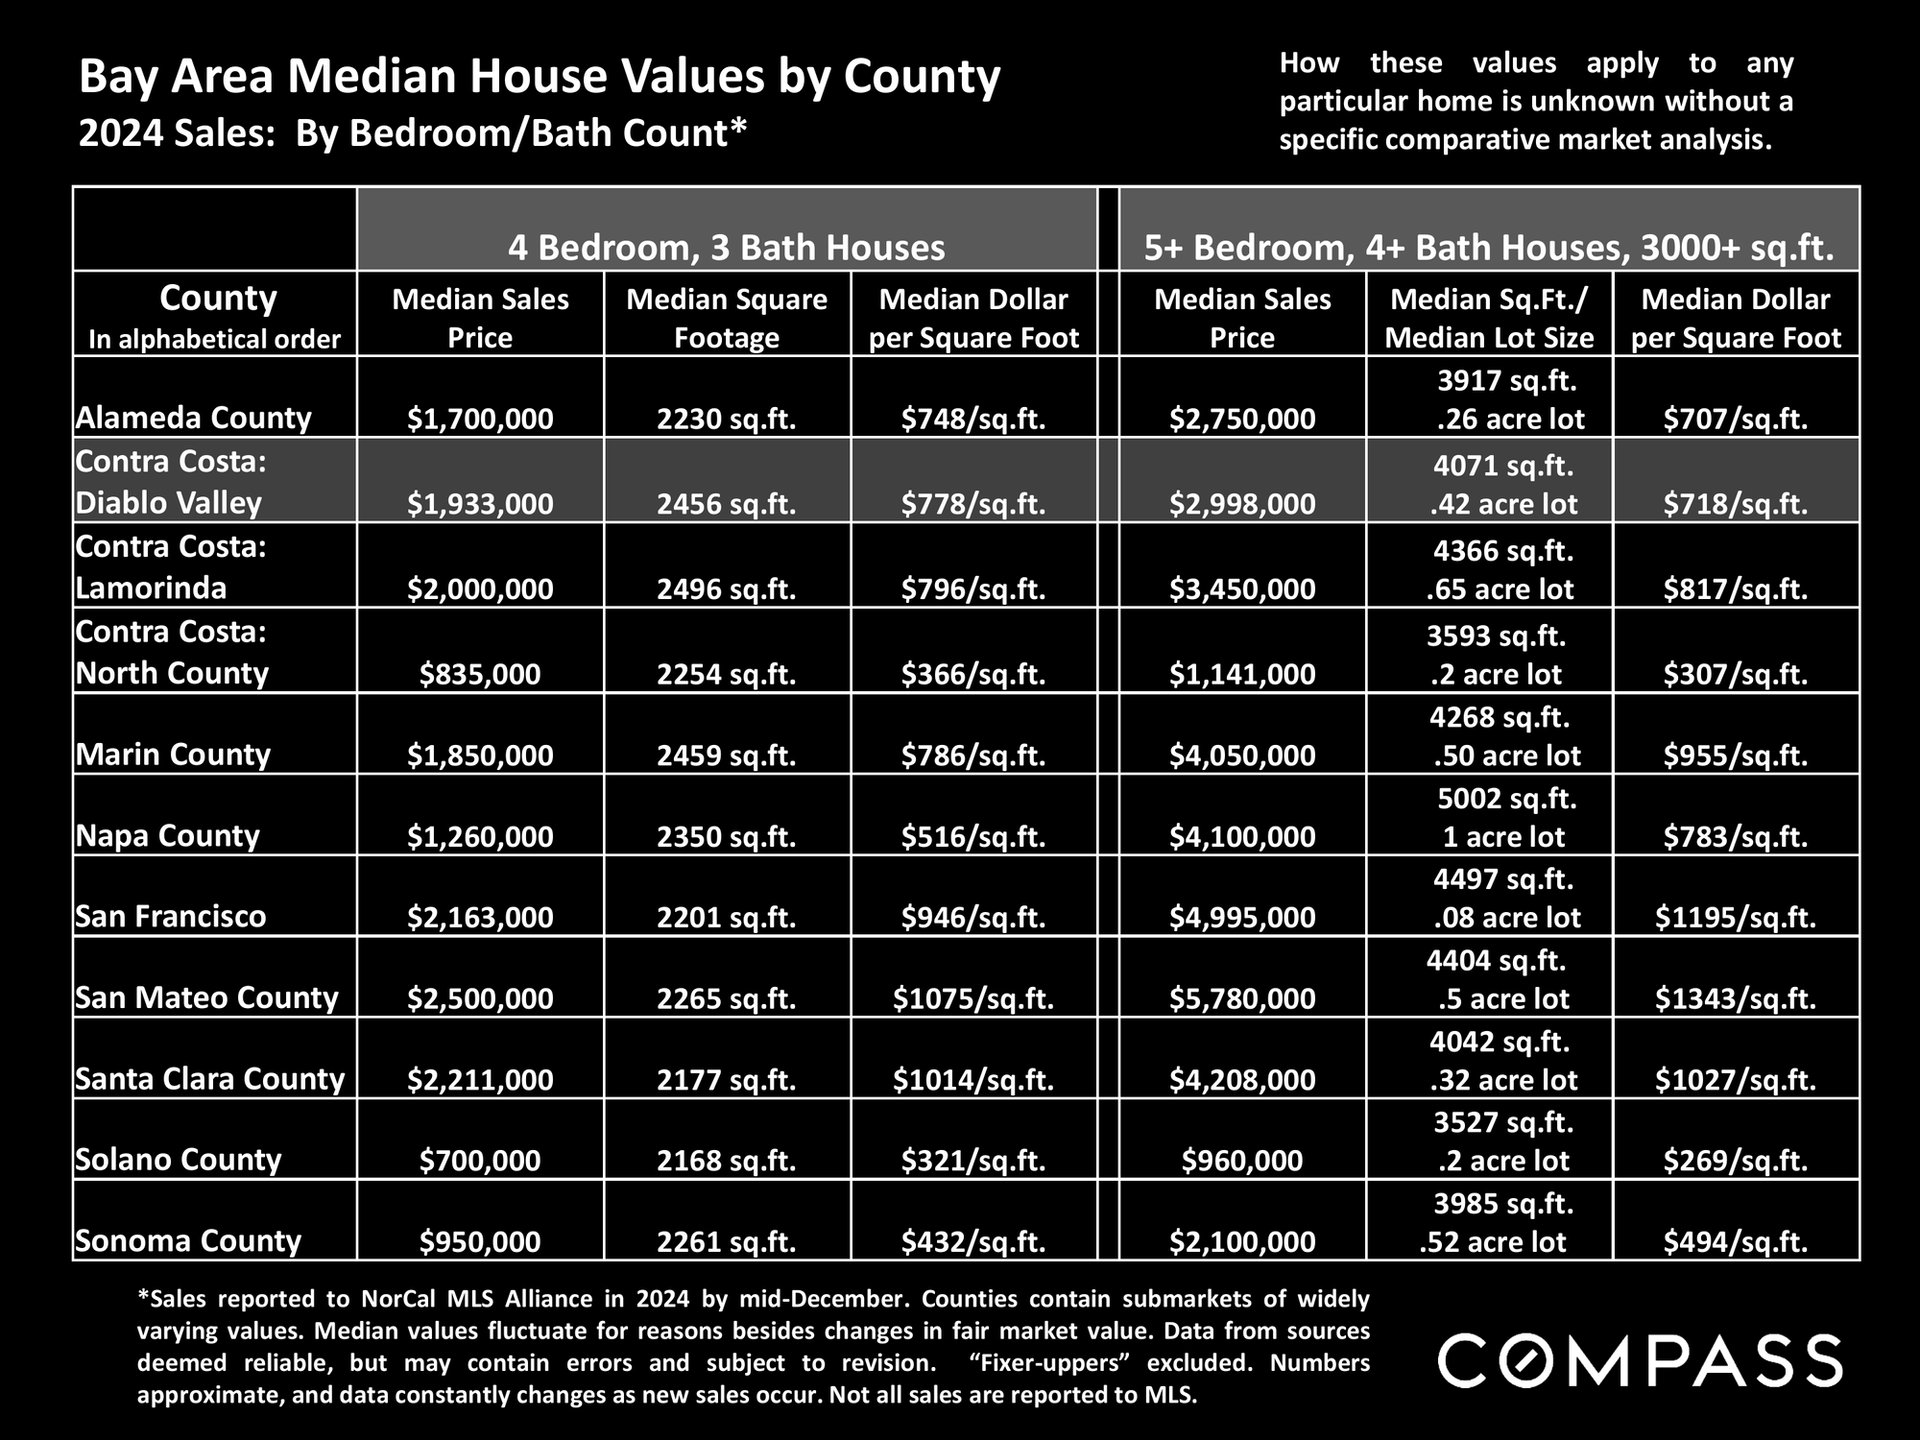
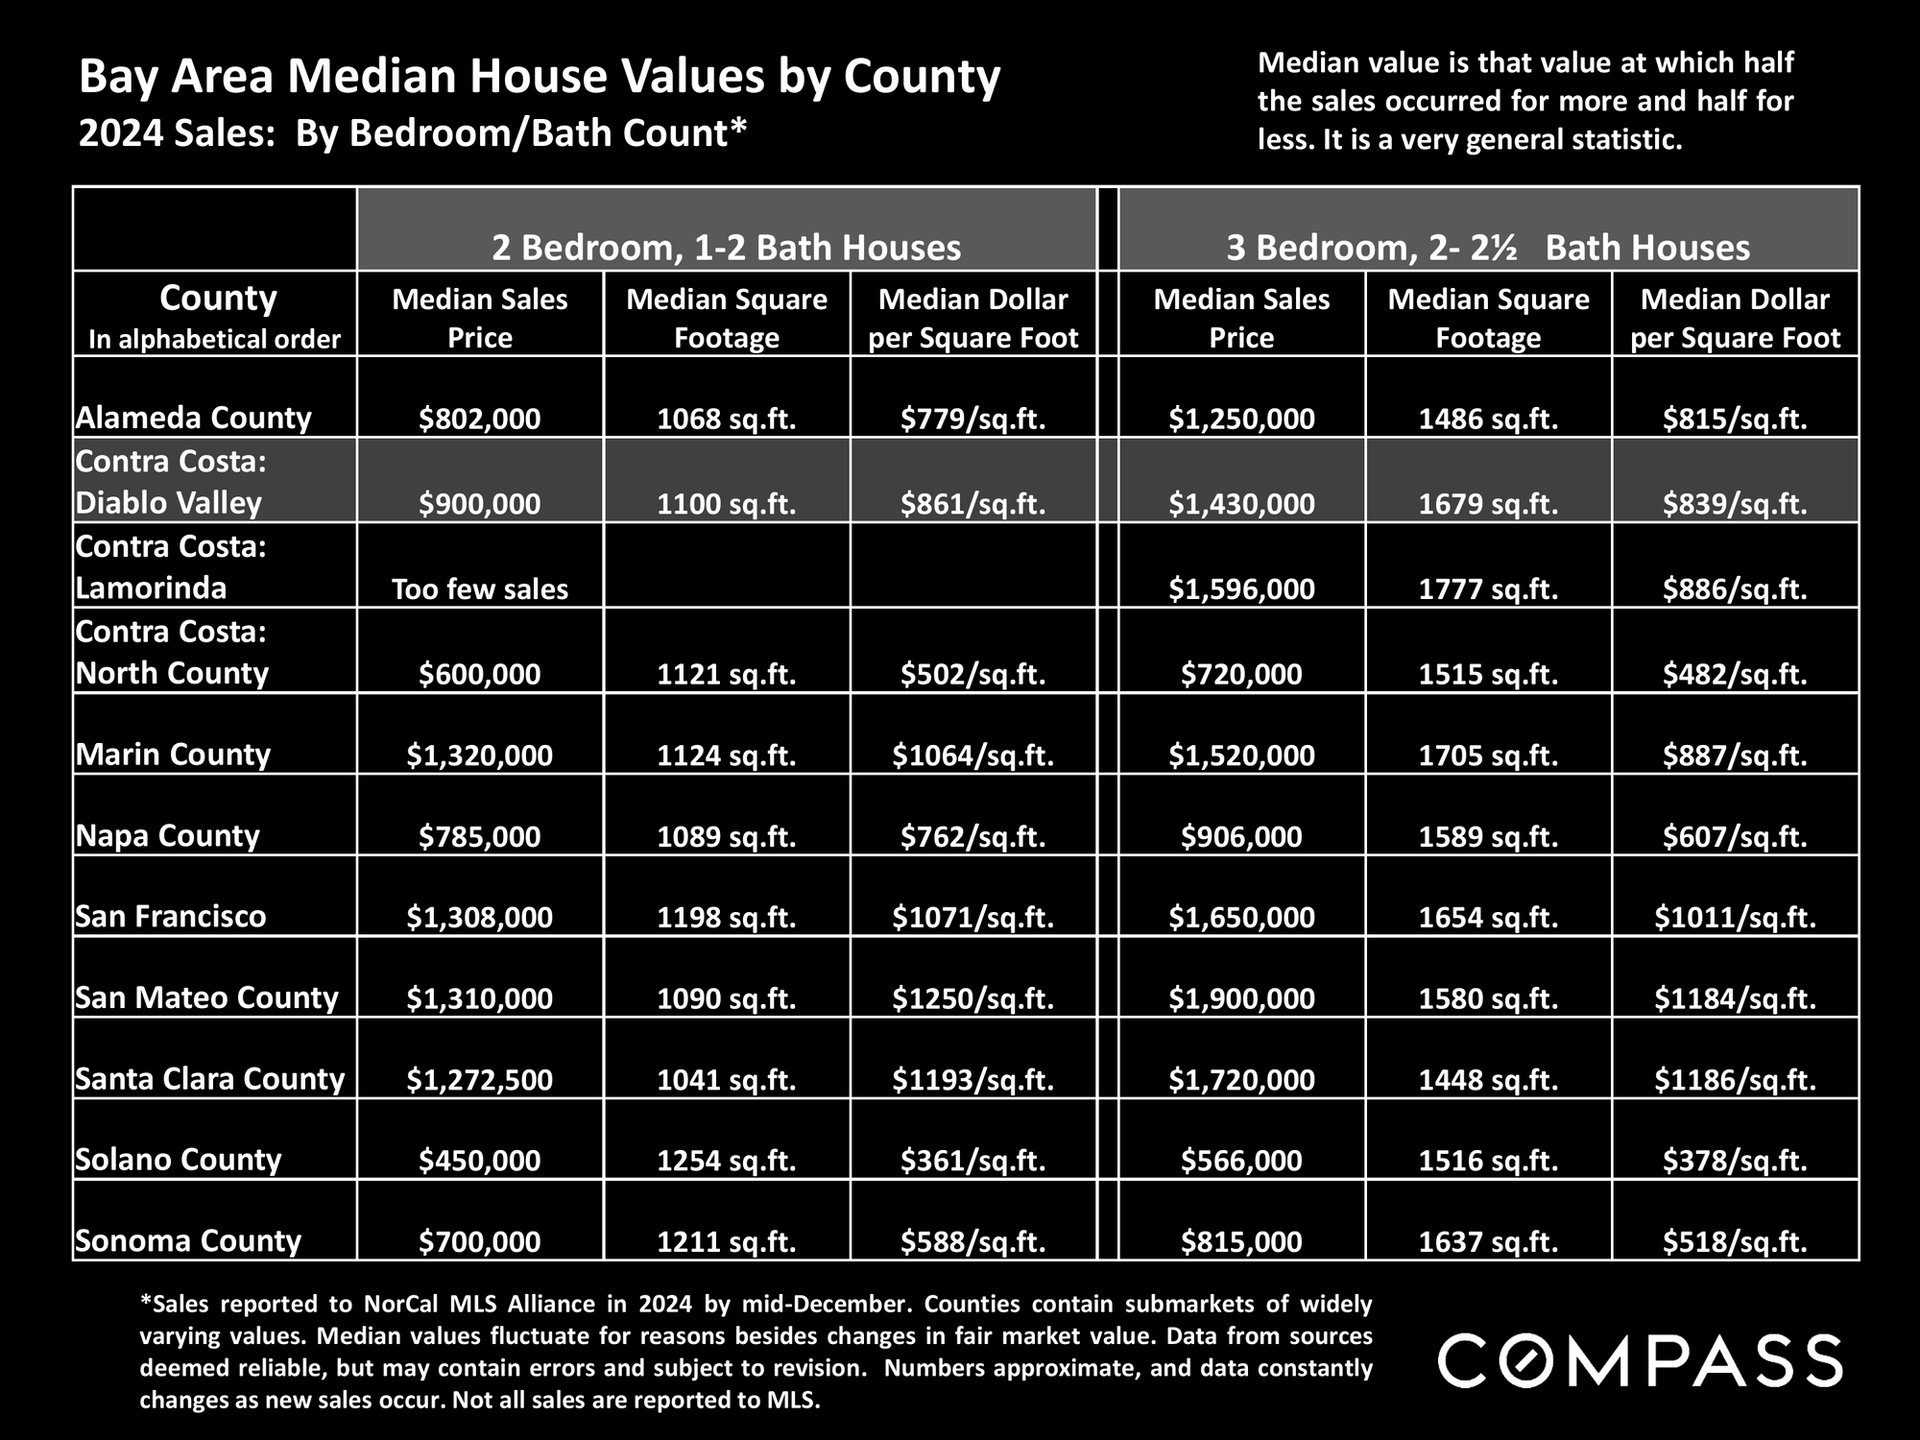
2024 Bay Area median house values by county, comparing home sizes, prices, and price per square foot.
Table comparing 2024 Bay Area home values by county, with Diablo Valley prices highlighted in its row.
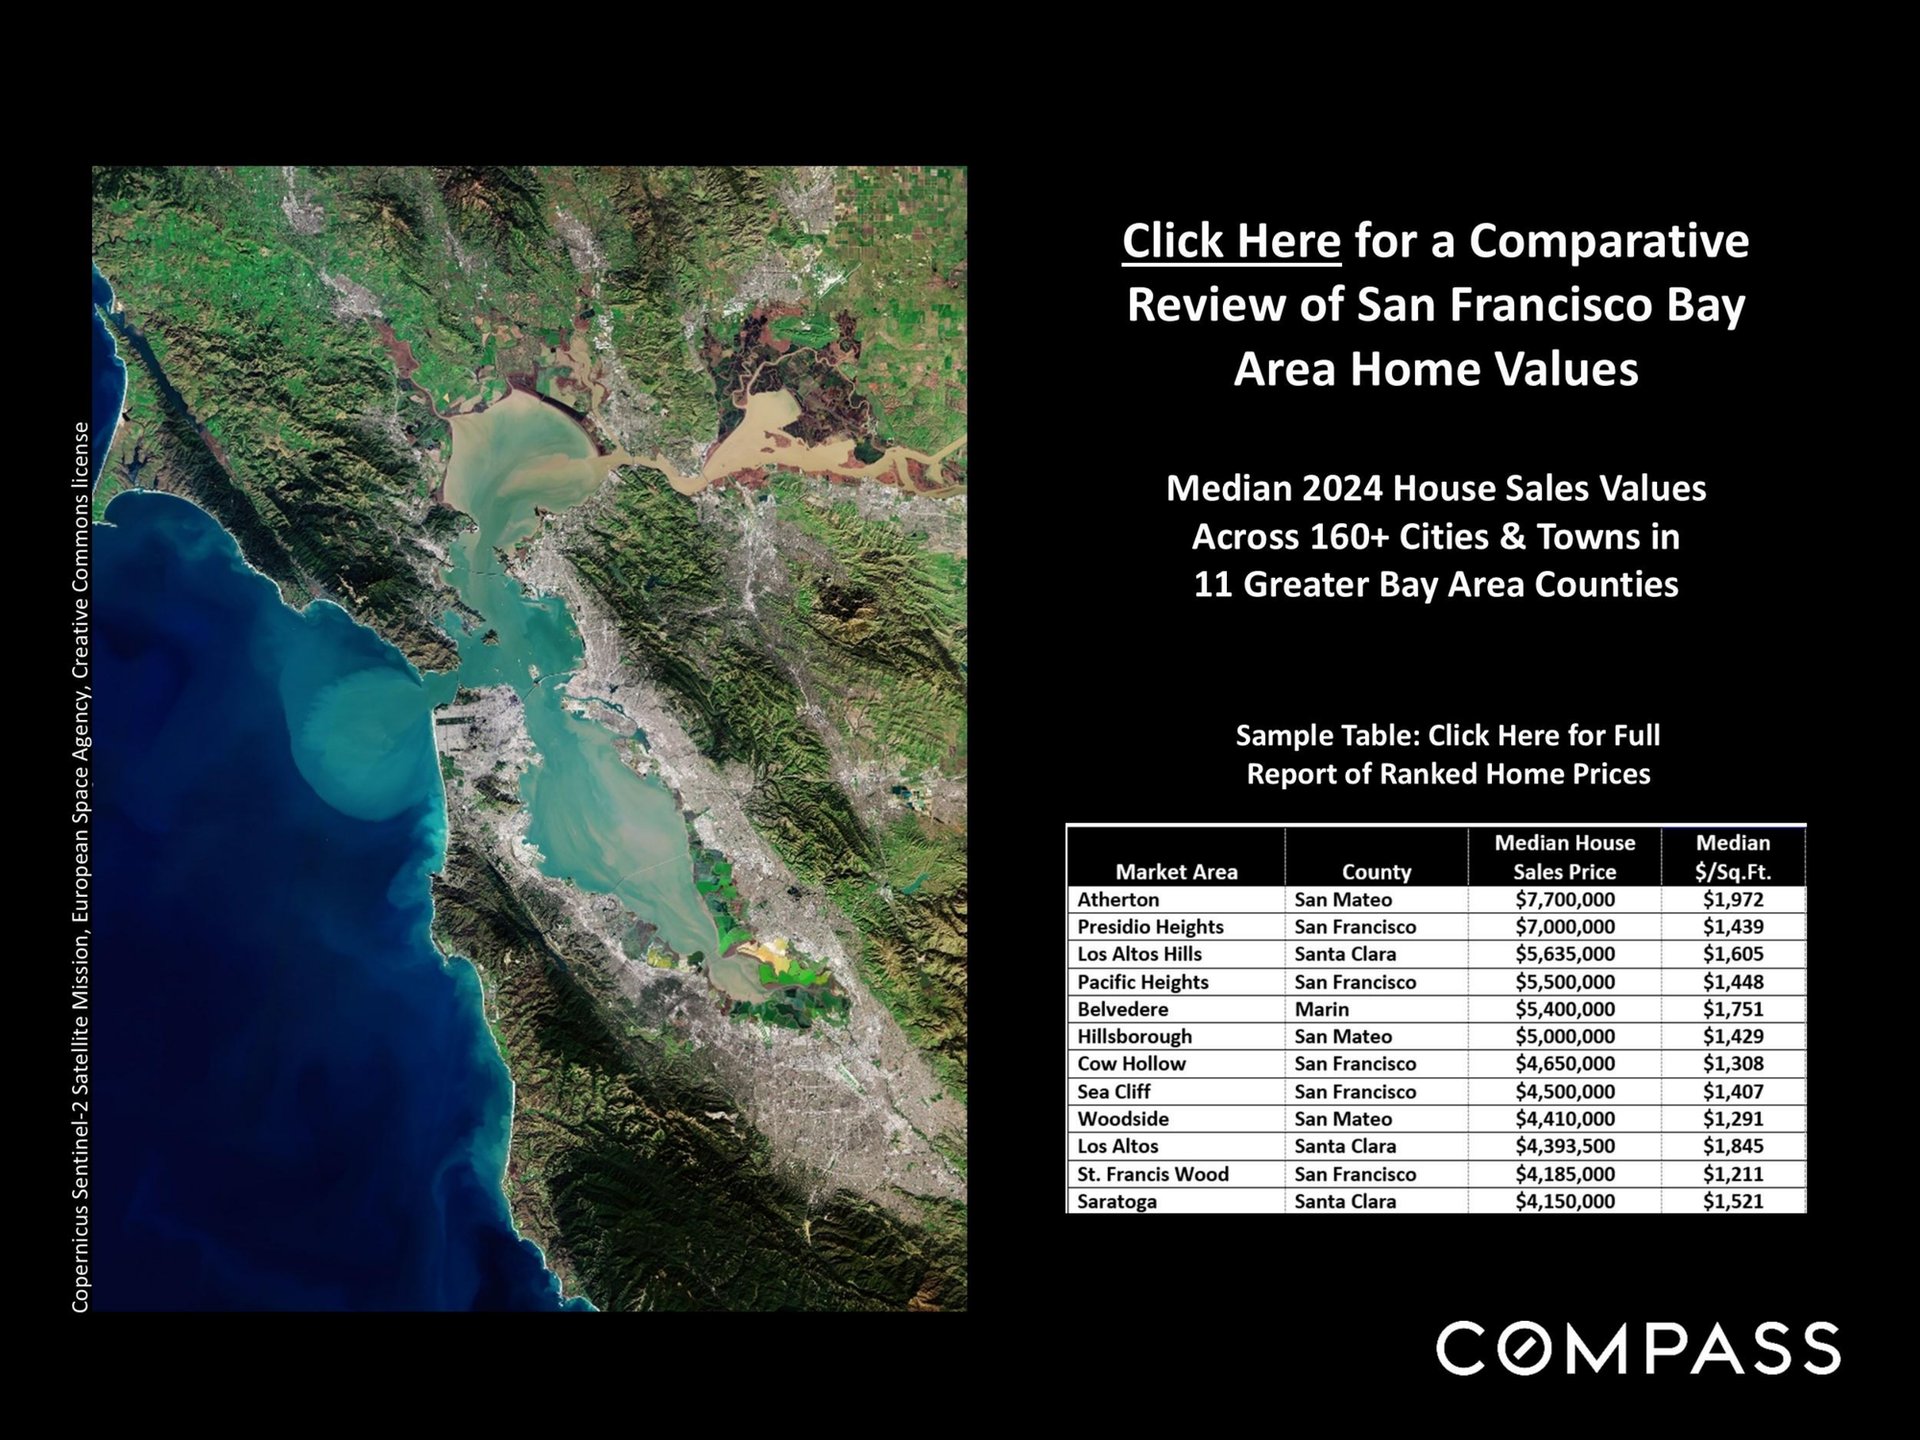
Bay Area home values graphic with satellite map and sample table of 2024 sales prices.
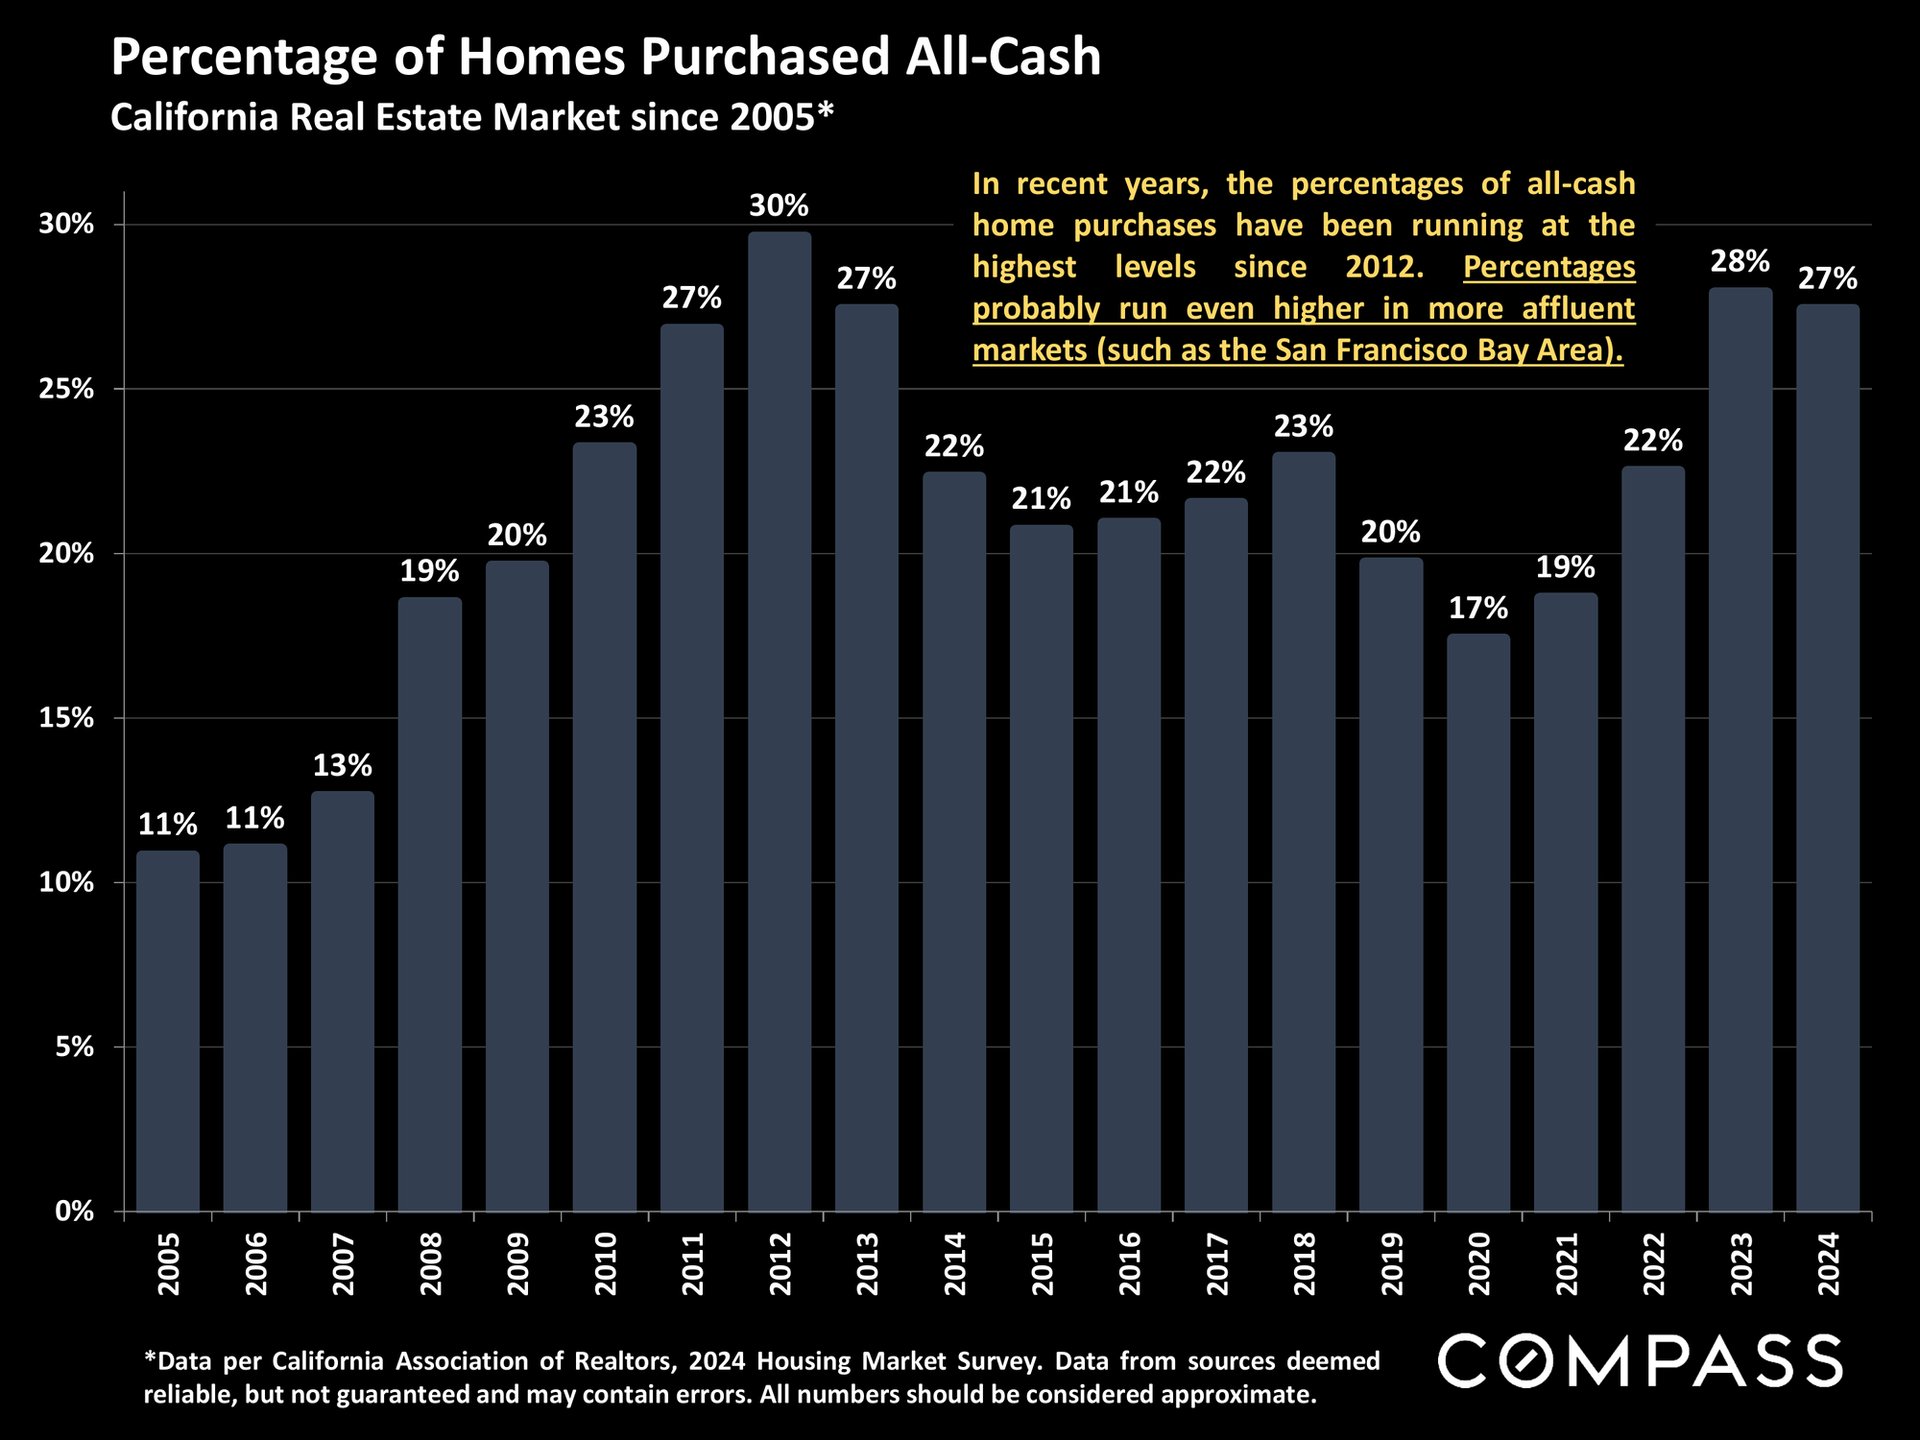
Chart of all-cash home purchases in California, rising to 28% in 2023 and 27% in 2024.
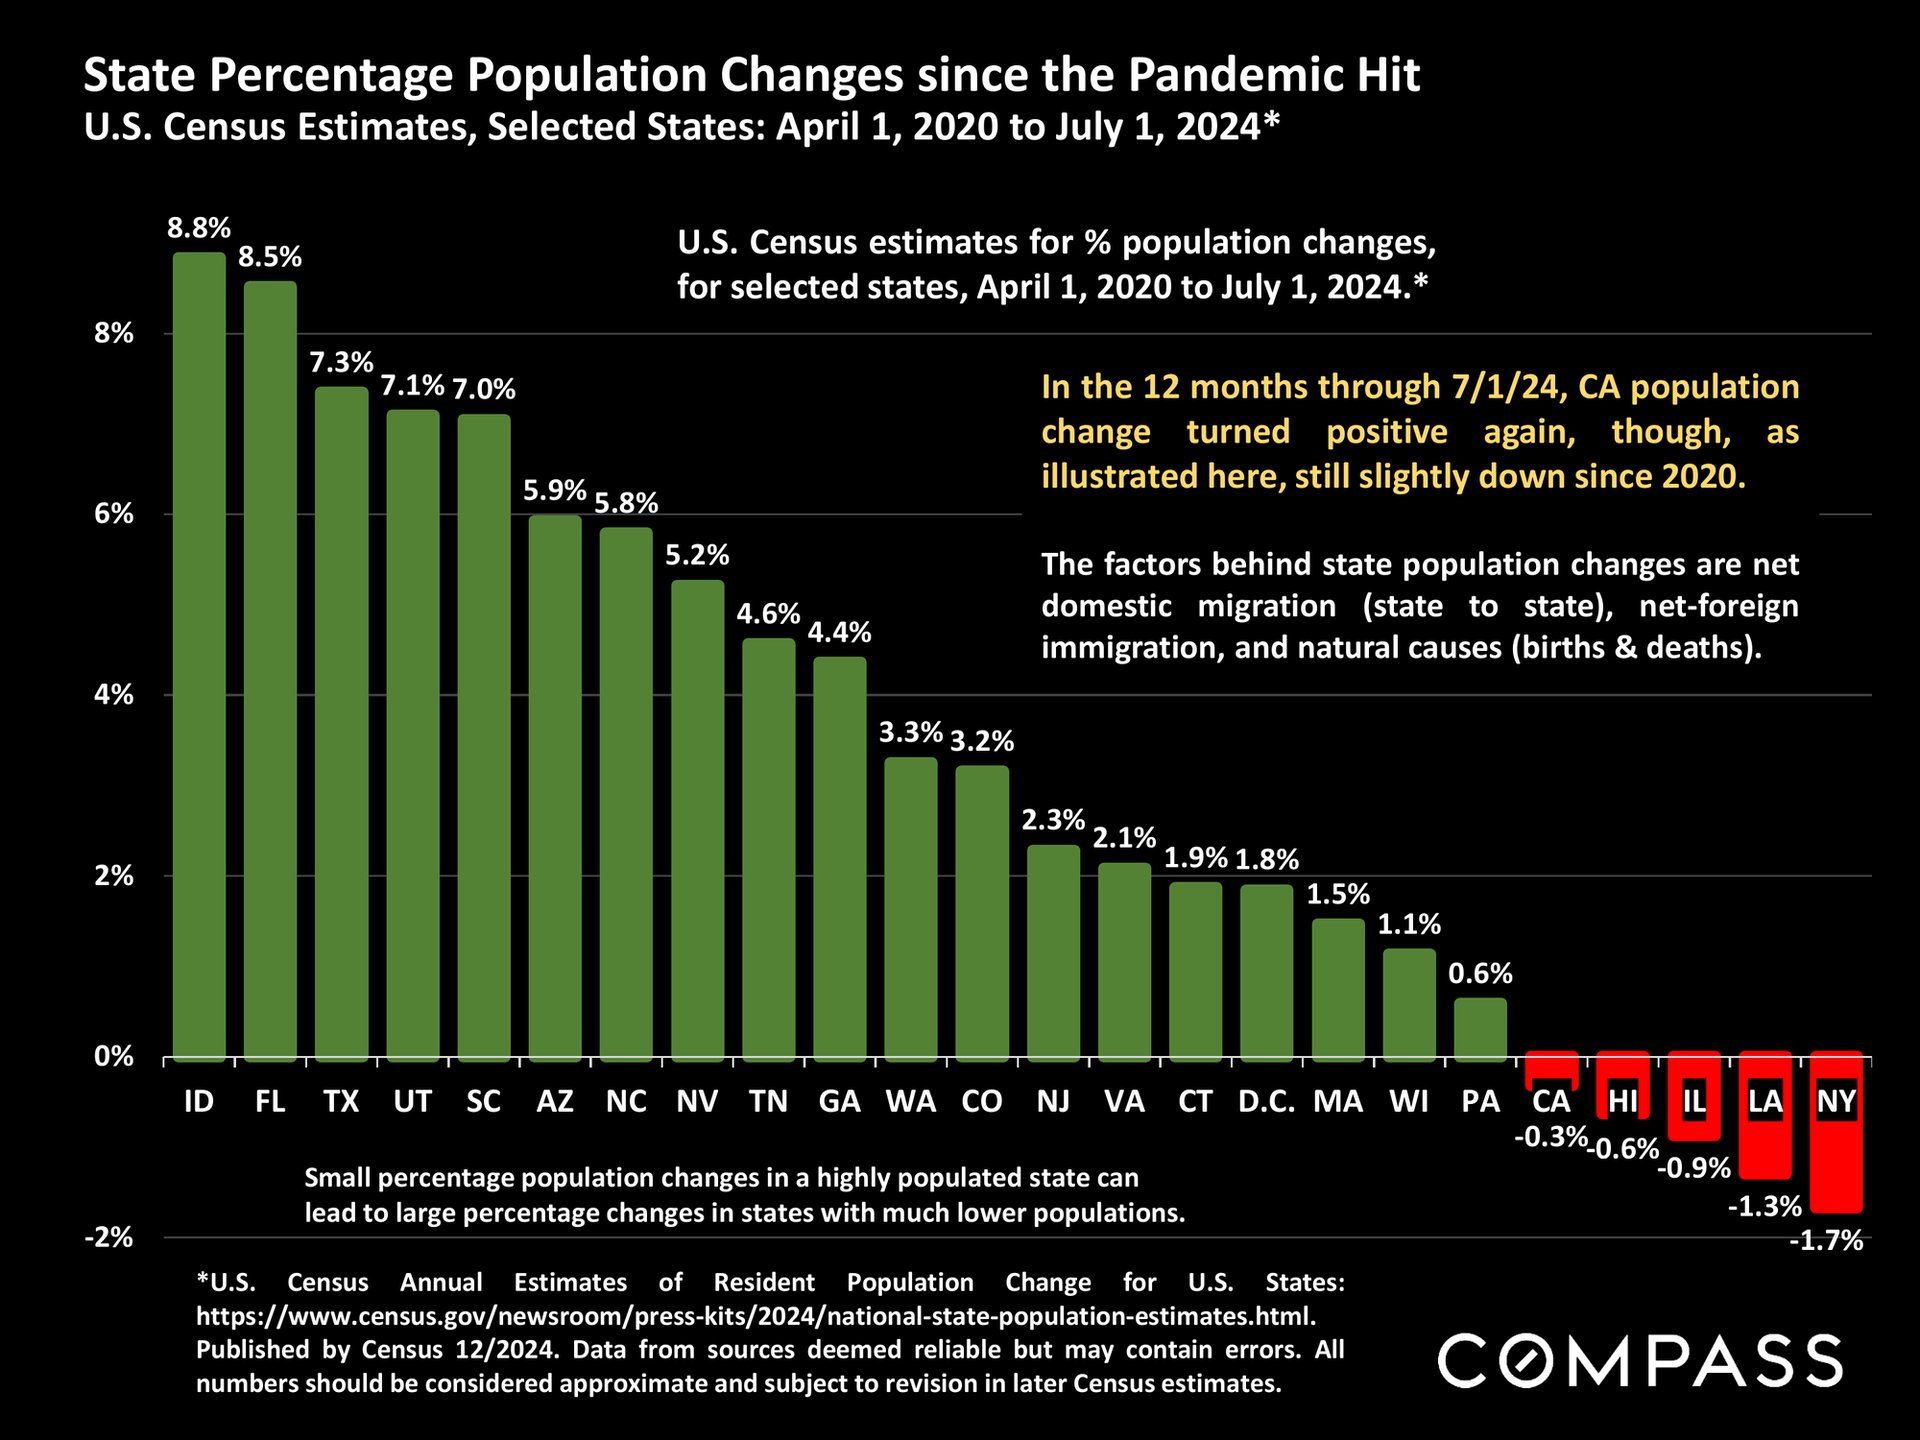
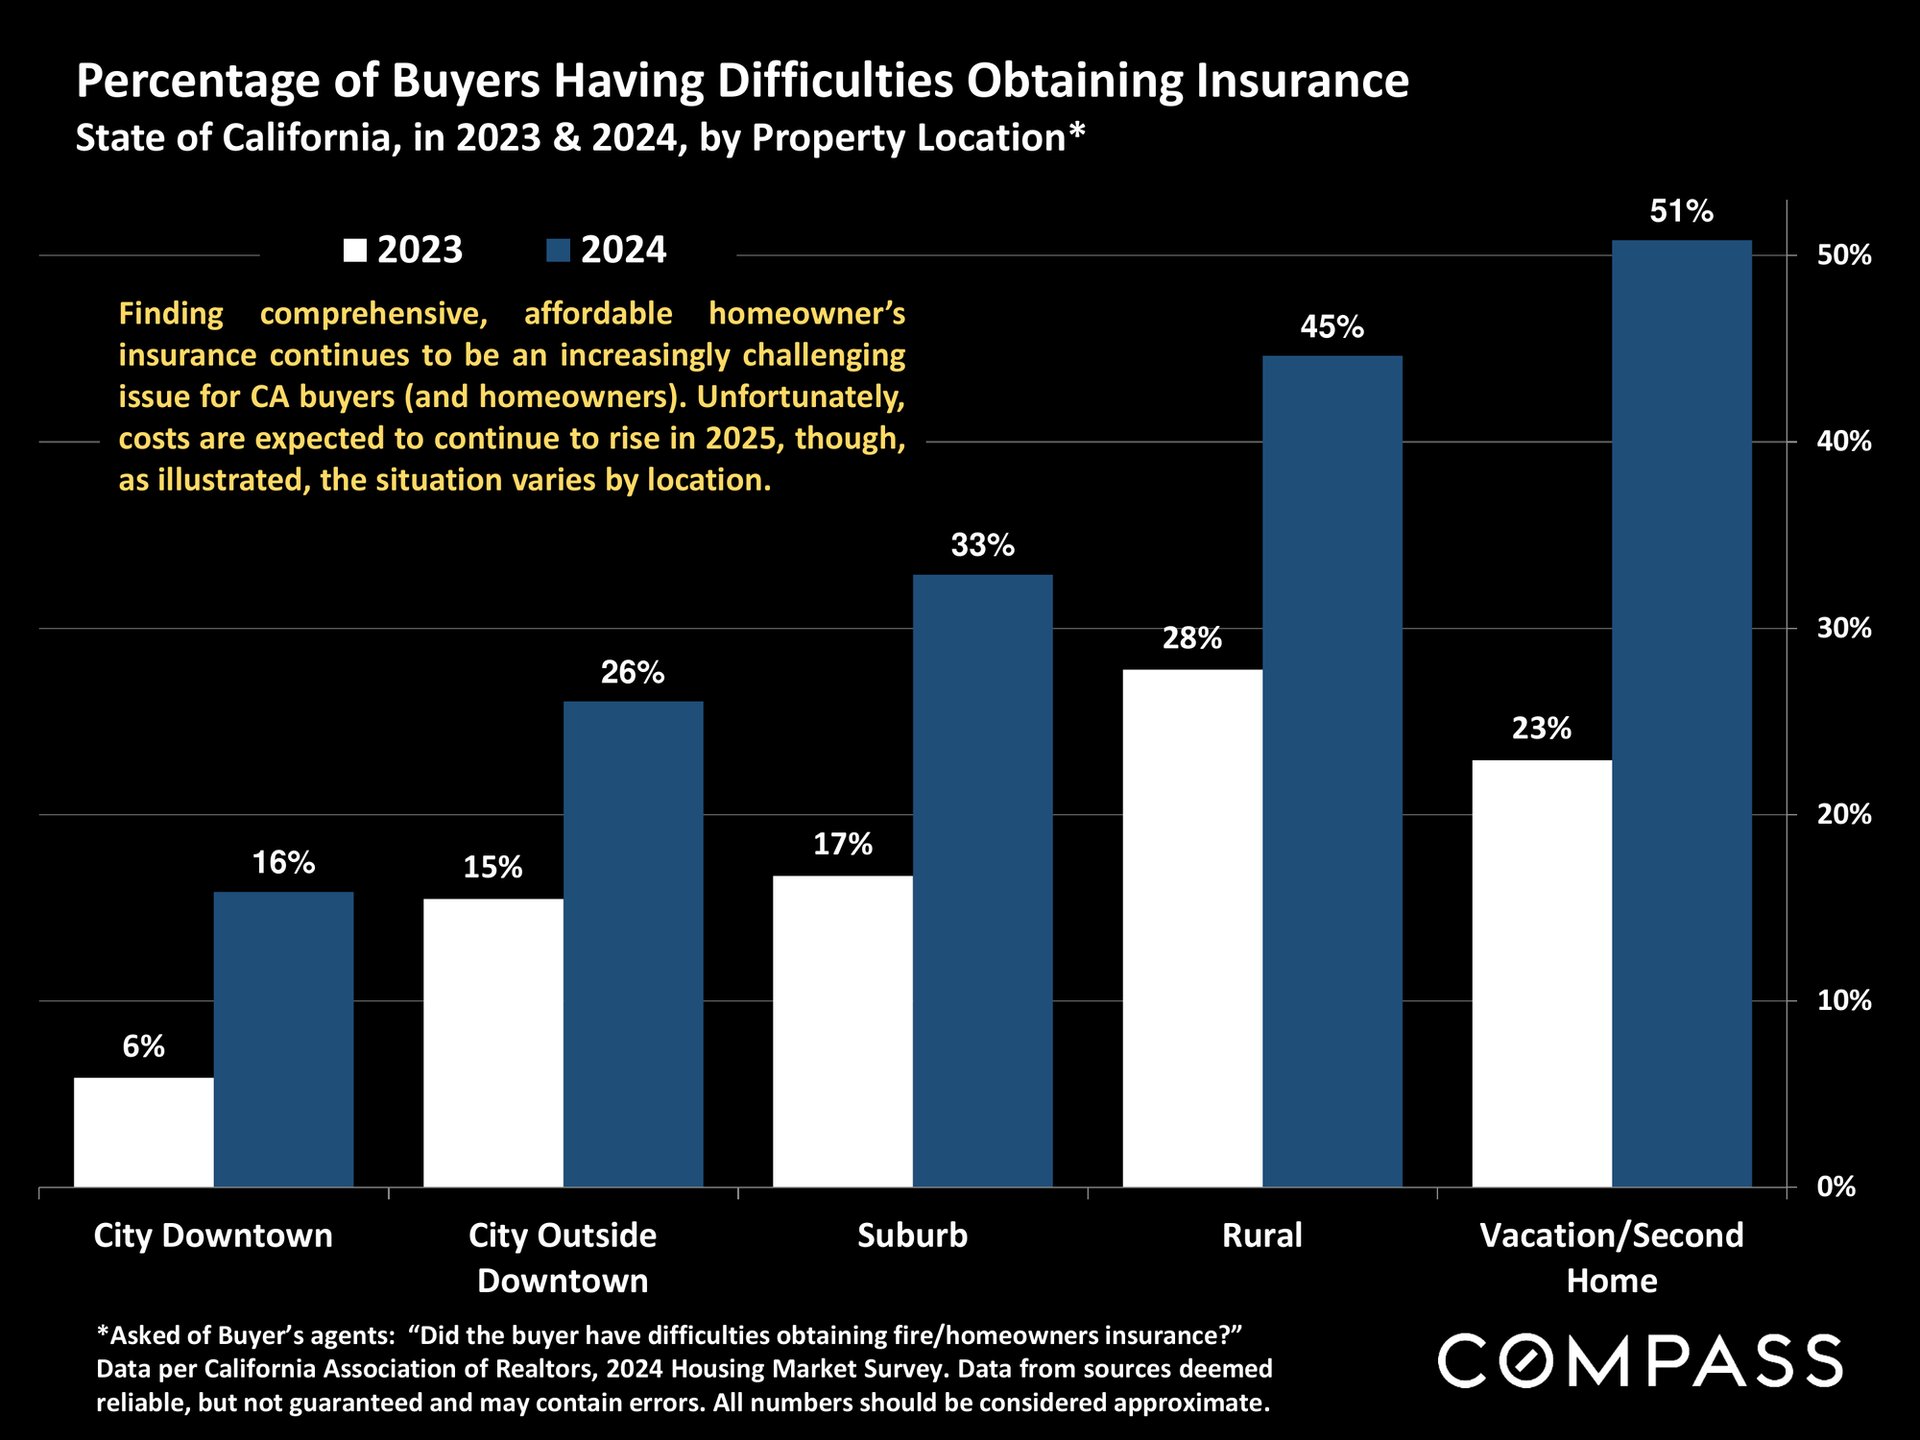
Bar chart of population changes in selected states since 2020, with Idaho highest and New York lowest.Chart shows insurance difficulties rising from 2023 to 2024, highest for vacation or second homes at 51%.
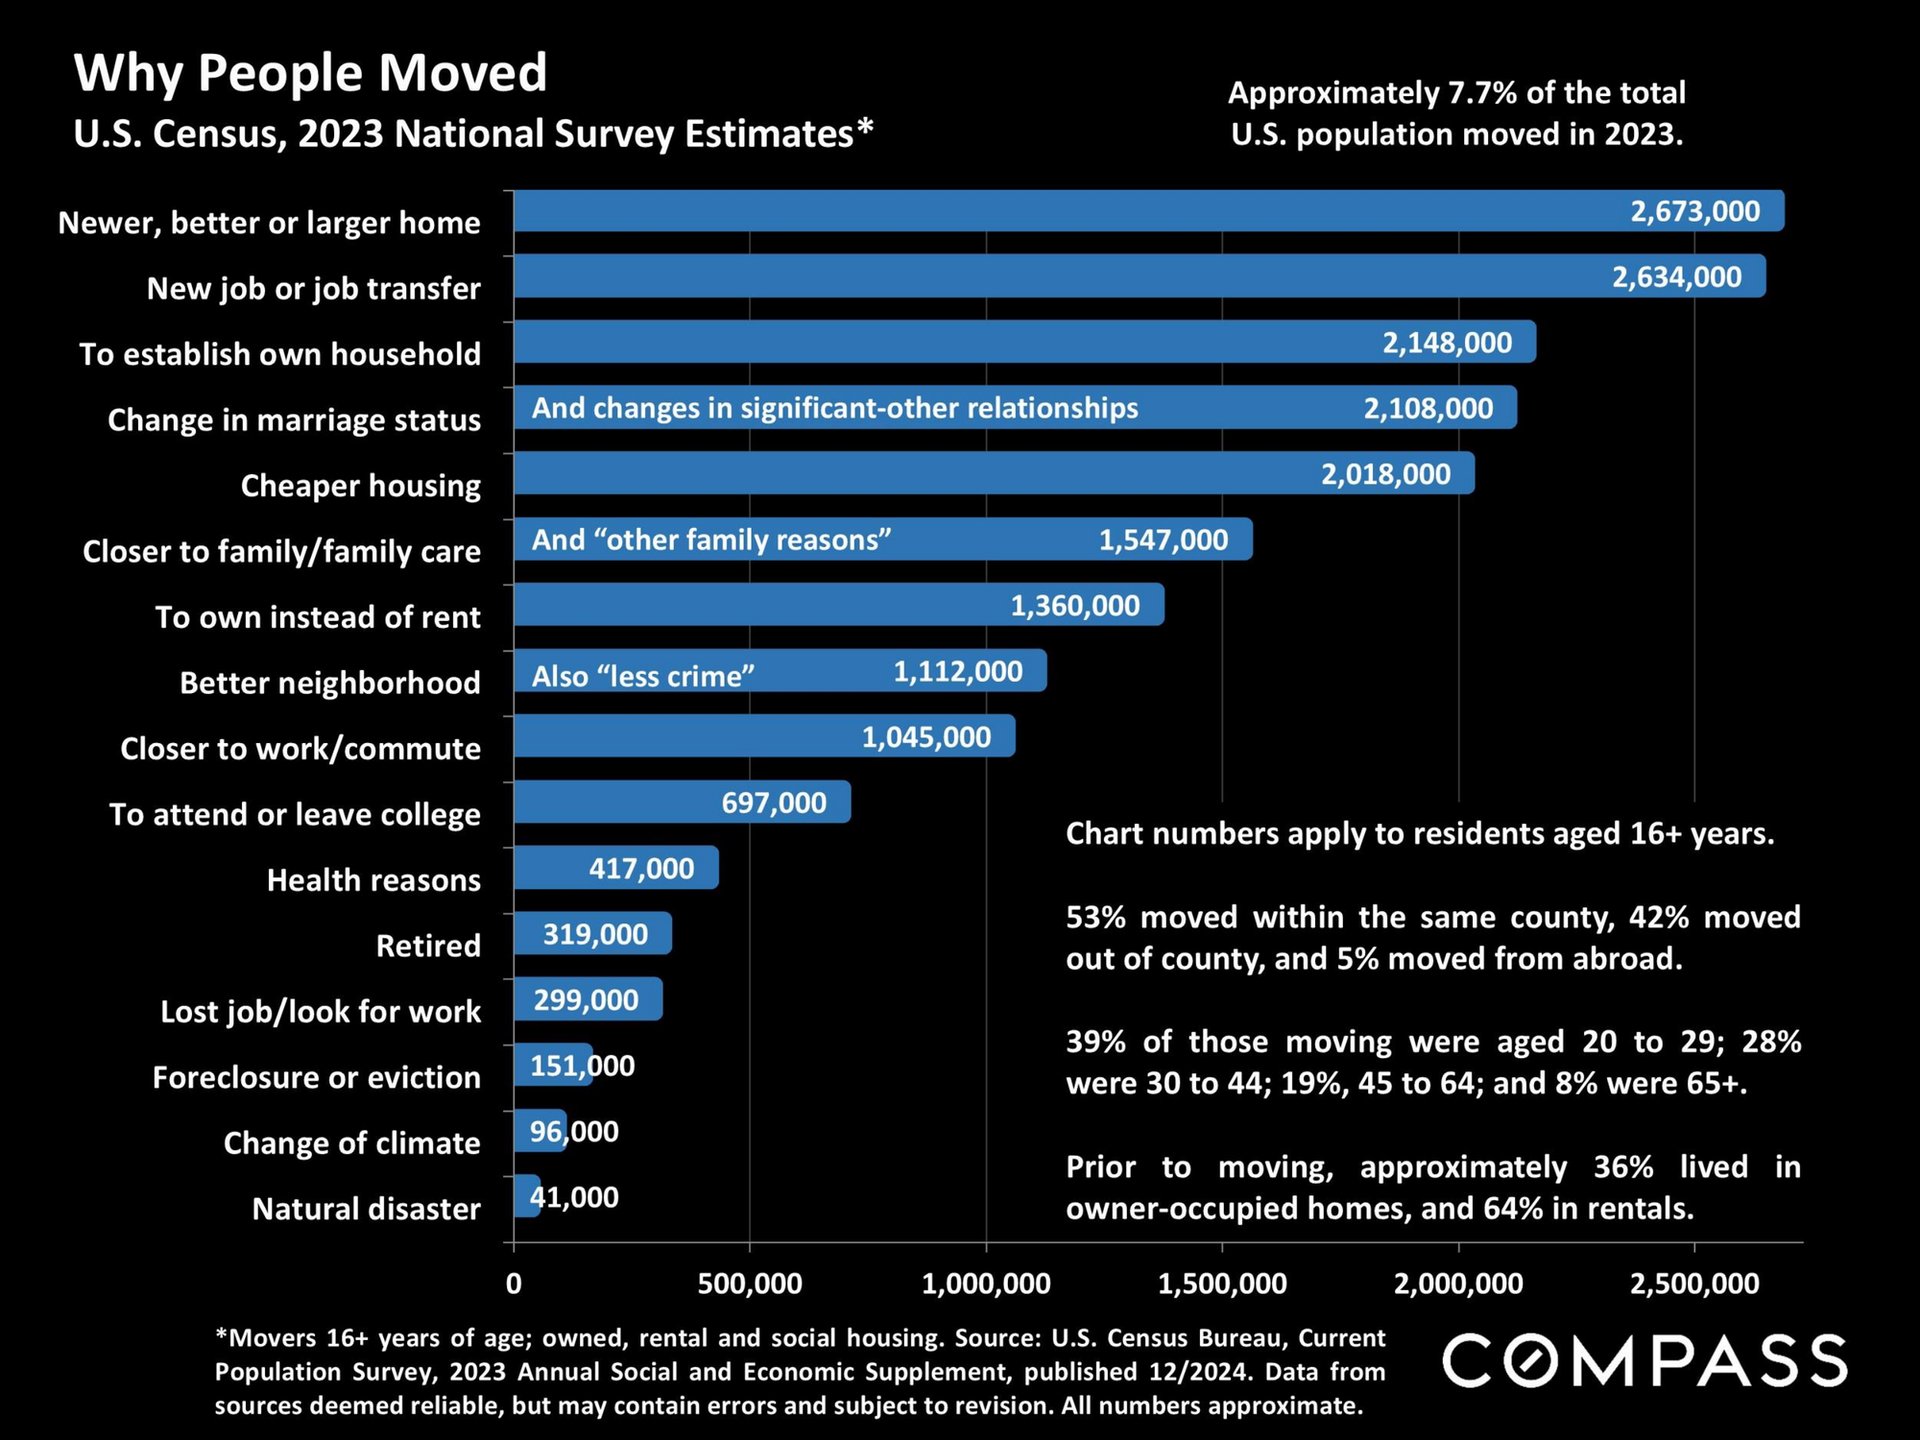
Chart of reasons people moved in 2023, led by seeking a newer, better, or larger home and starting a new job.
Real estate market statistics definitions, data limitations, photo credit, and Compass legal disclaimer.
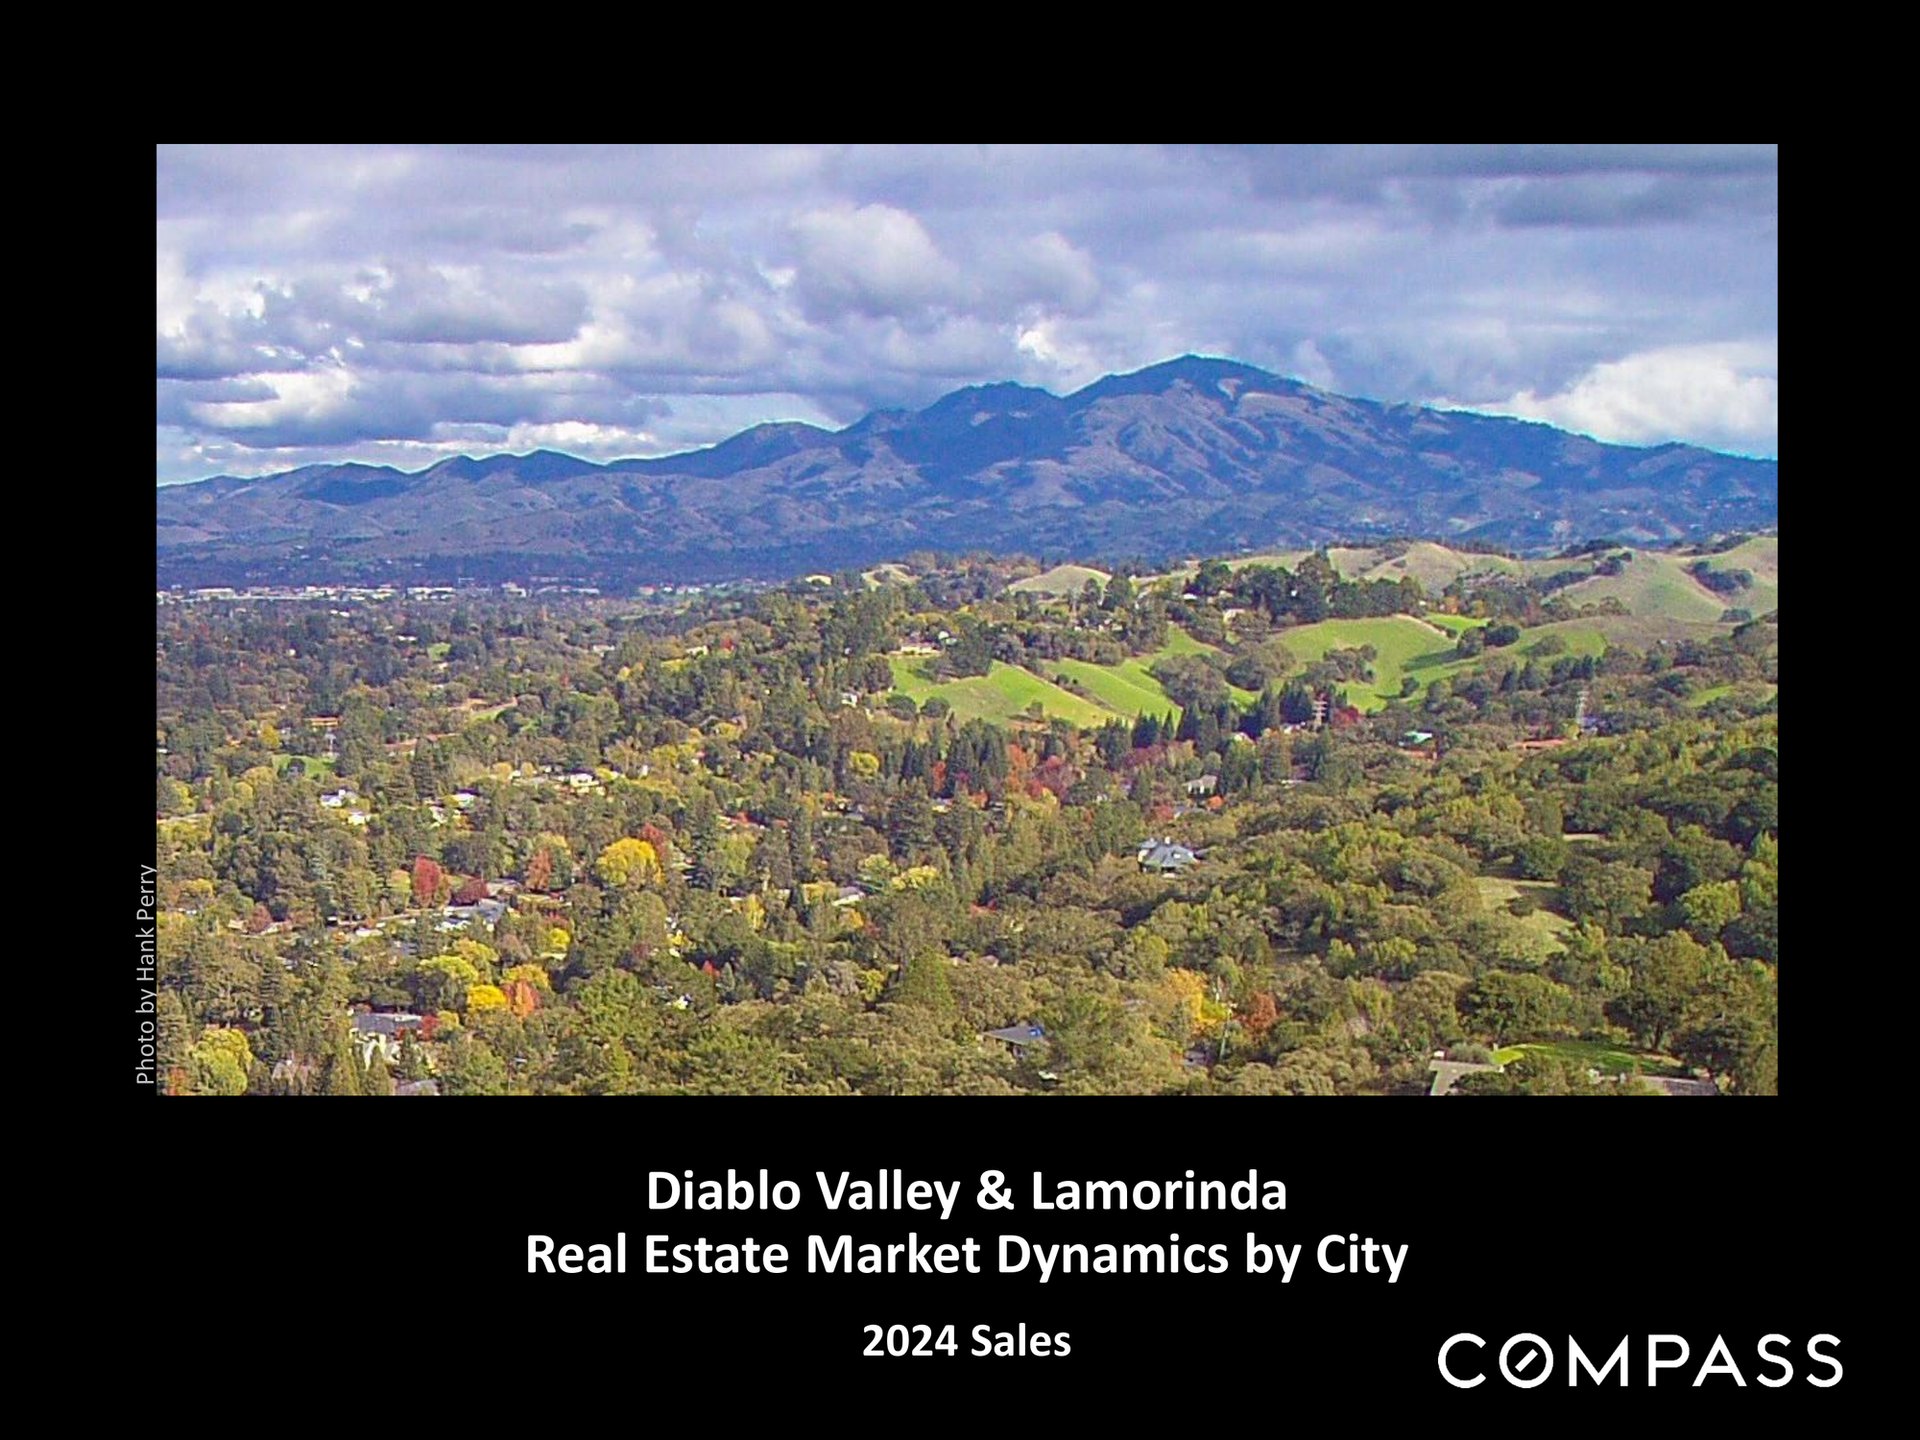
Diablo Valley and Lamorinda real estate market dynamics by city, 2024 sales.
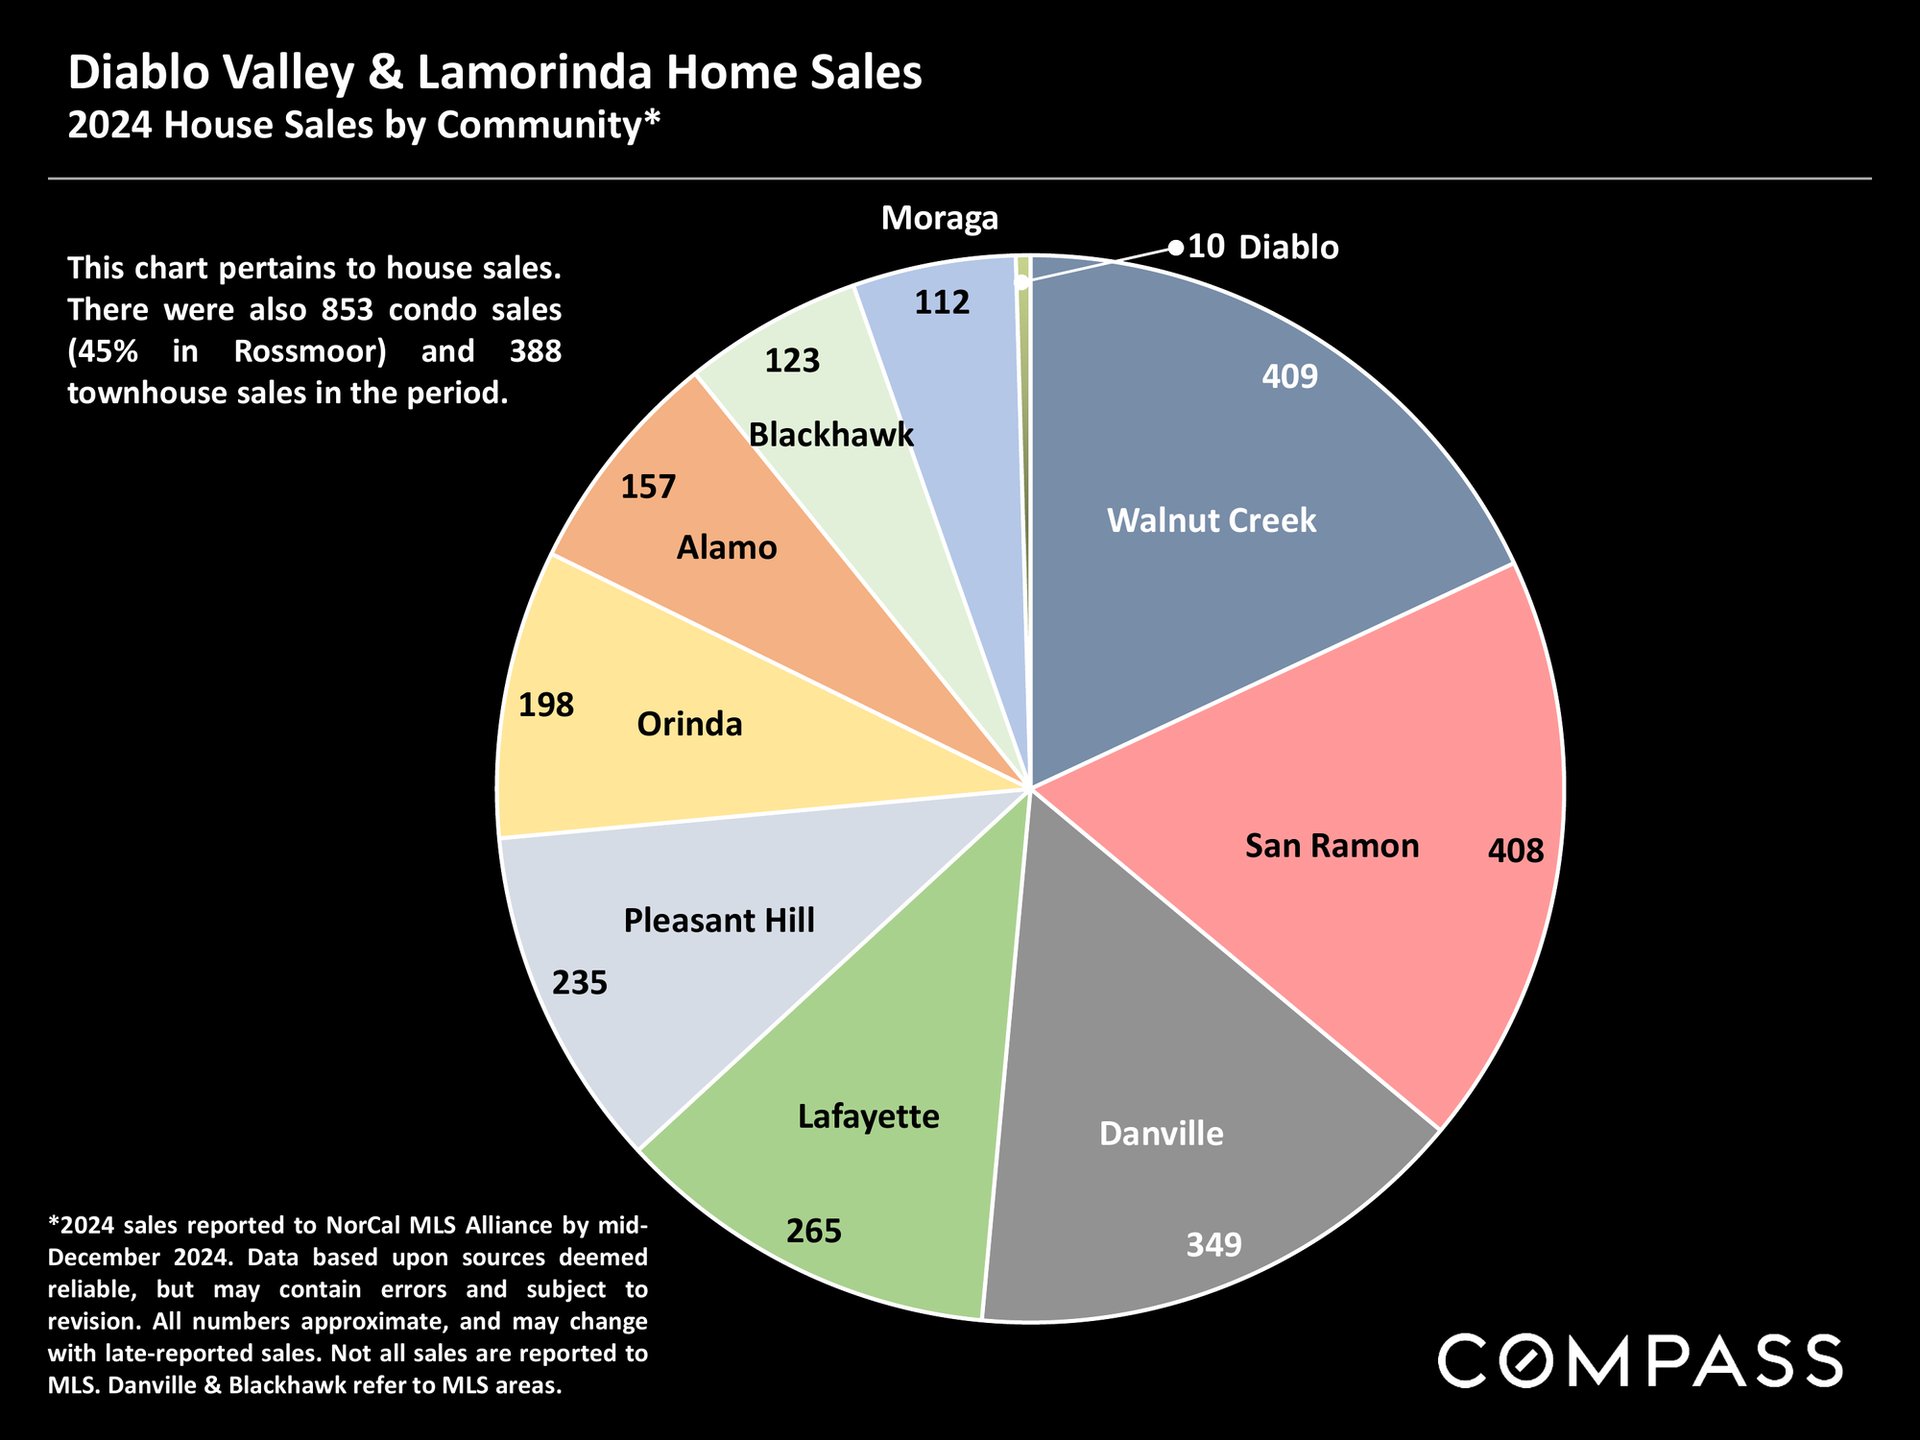
Pie chart of 2024 house sales by community in Diablo Valley and Lamorinda; Walnut Creek and San Ramon lead with about 409 sales each.
Chart of 2024 Diablo Valley and Lamorinda median home prices, with red bars comparing eleven communities.
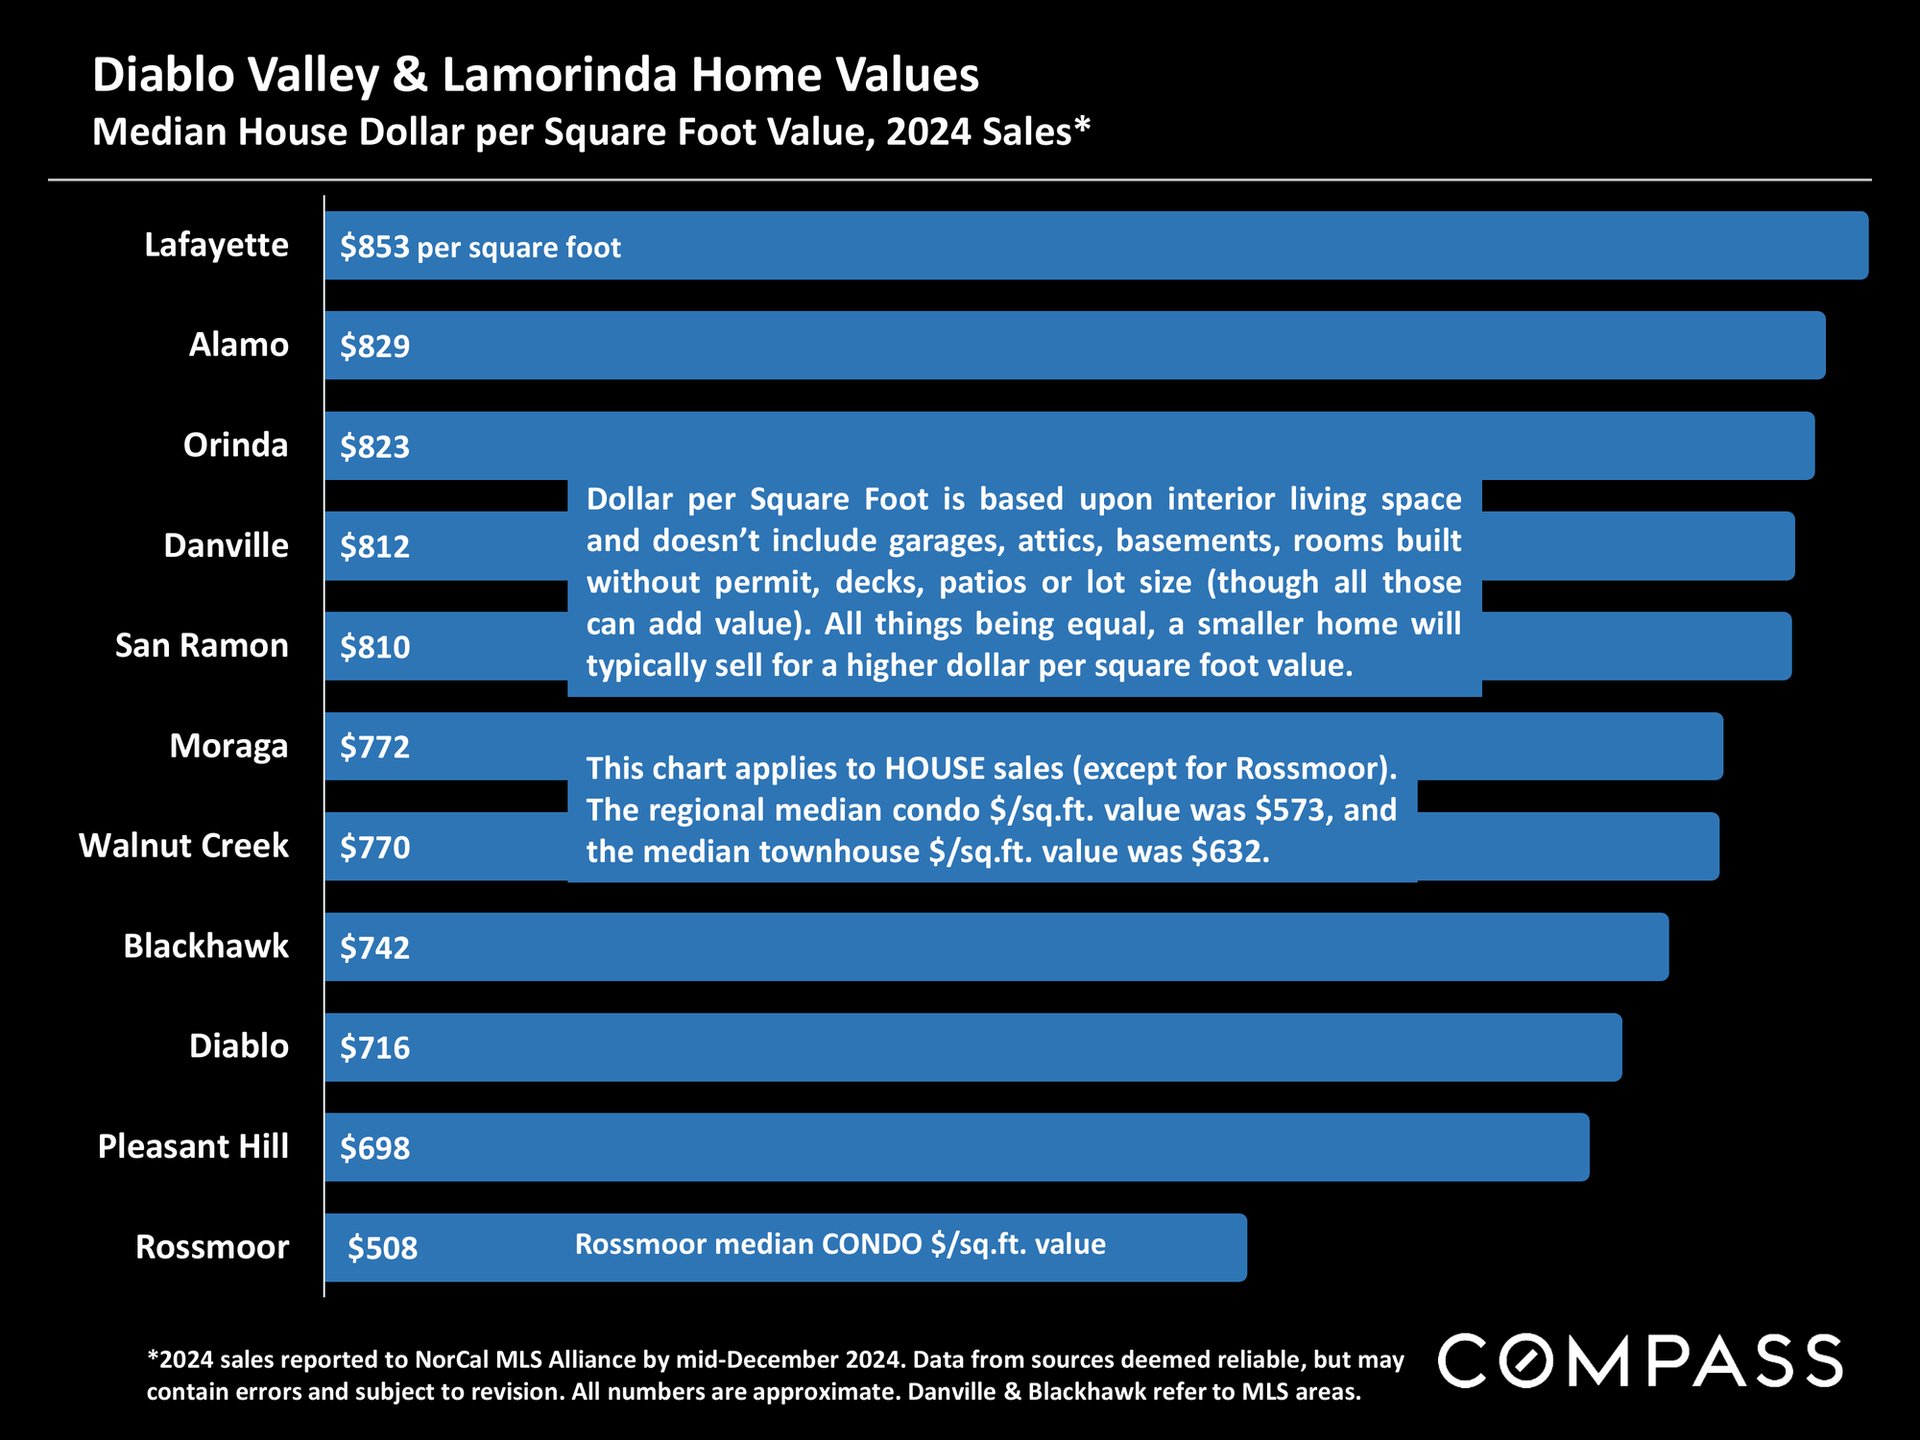
Chart of 2024 median home values per square foot in Diablo Valley and Lamorinda; Lafayette leads at $853.
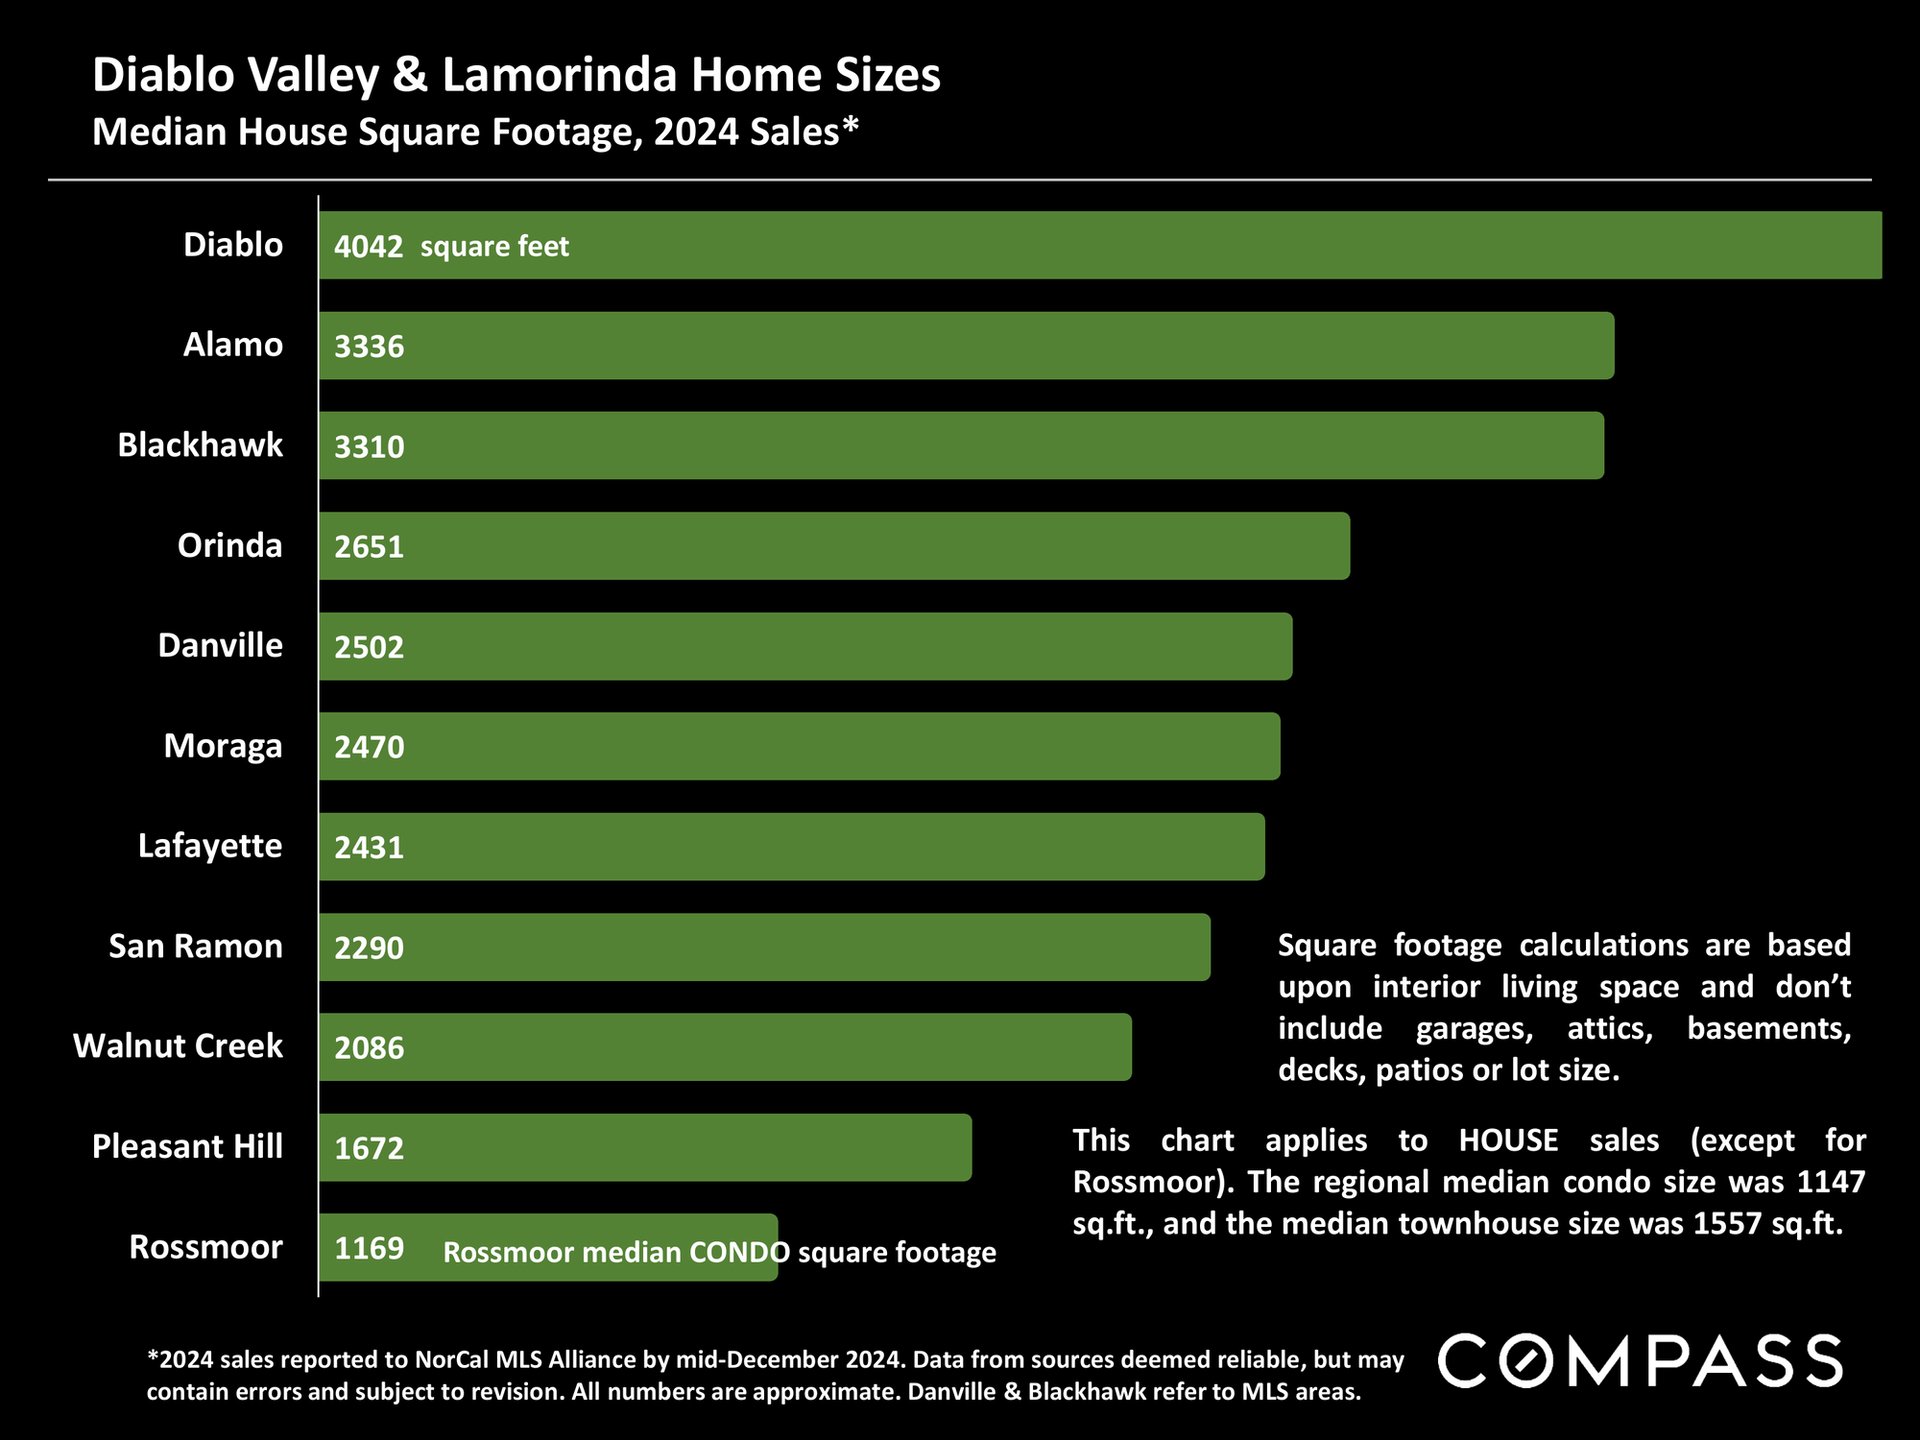
Bar chart compares 2024 median home sizes across Diablo Valley and Lamorinda communities.
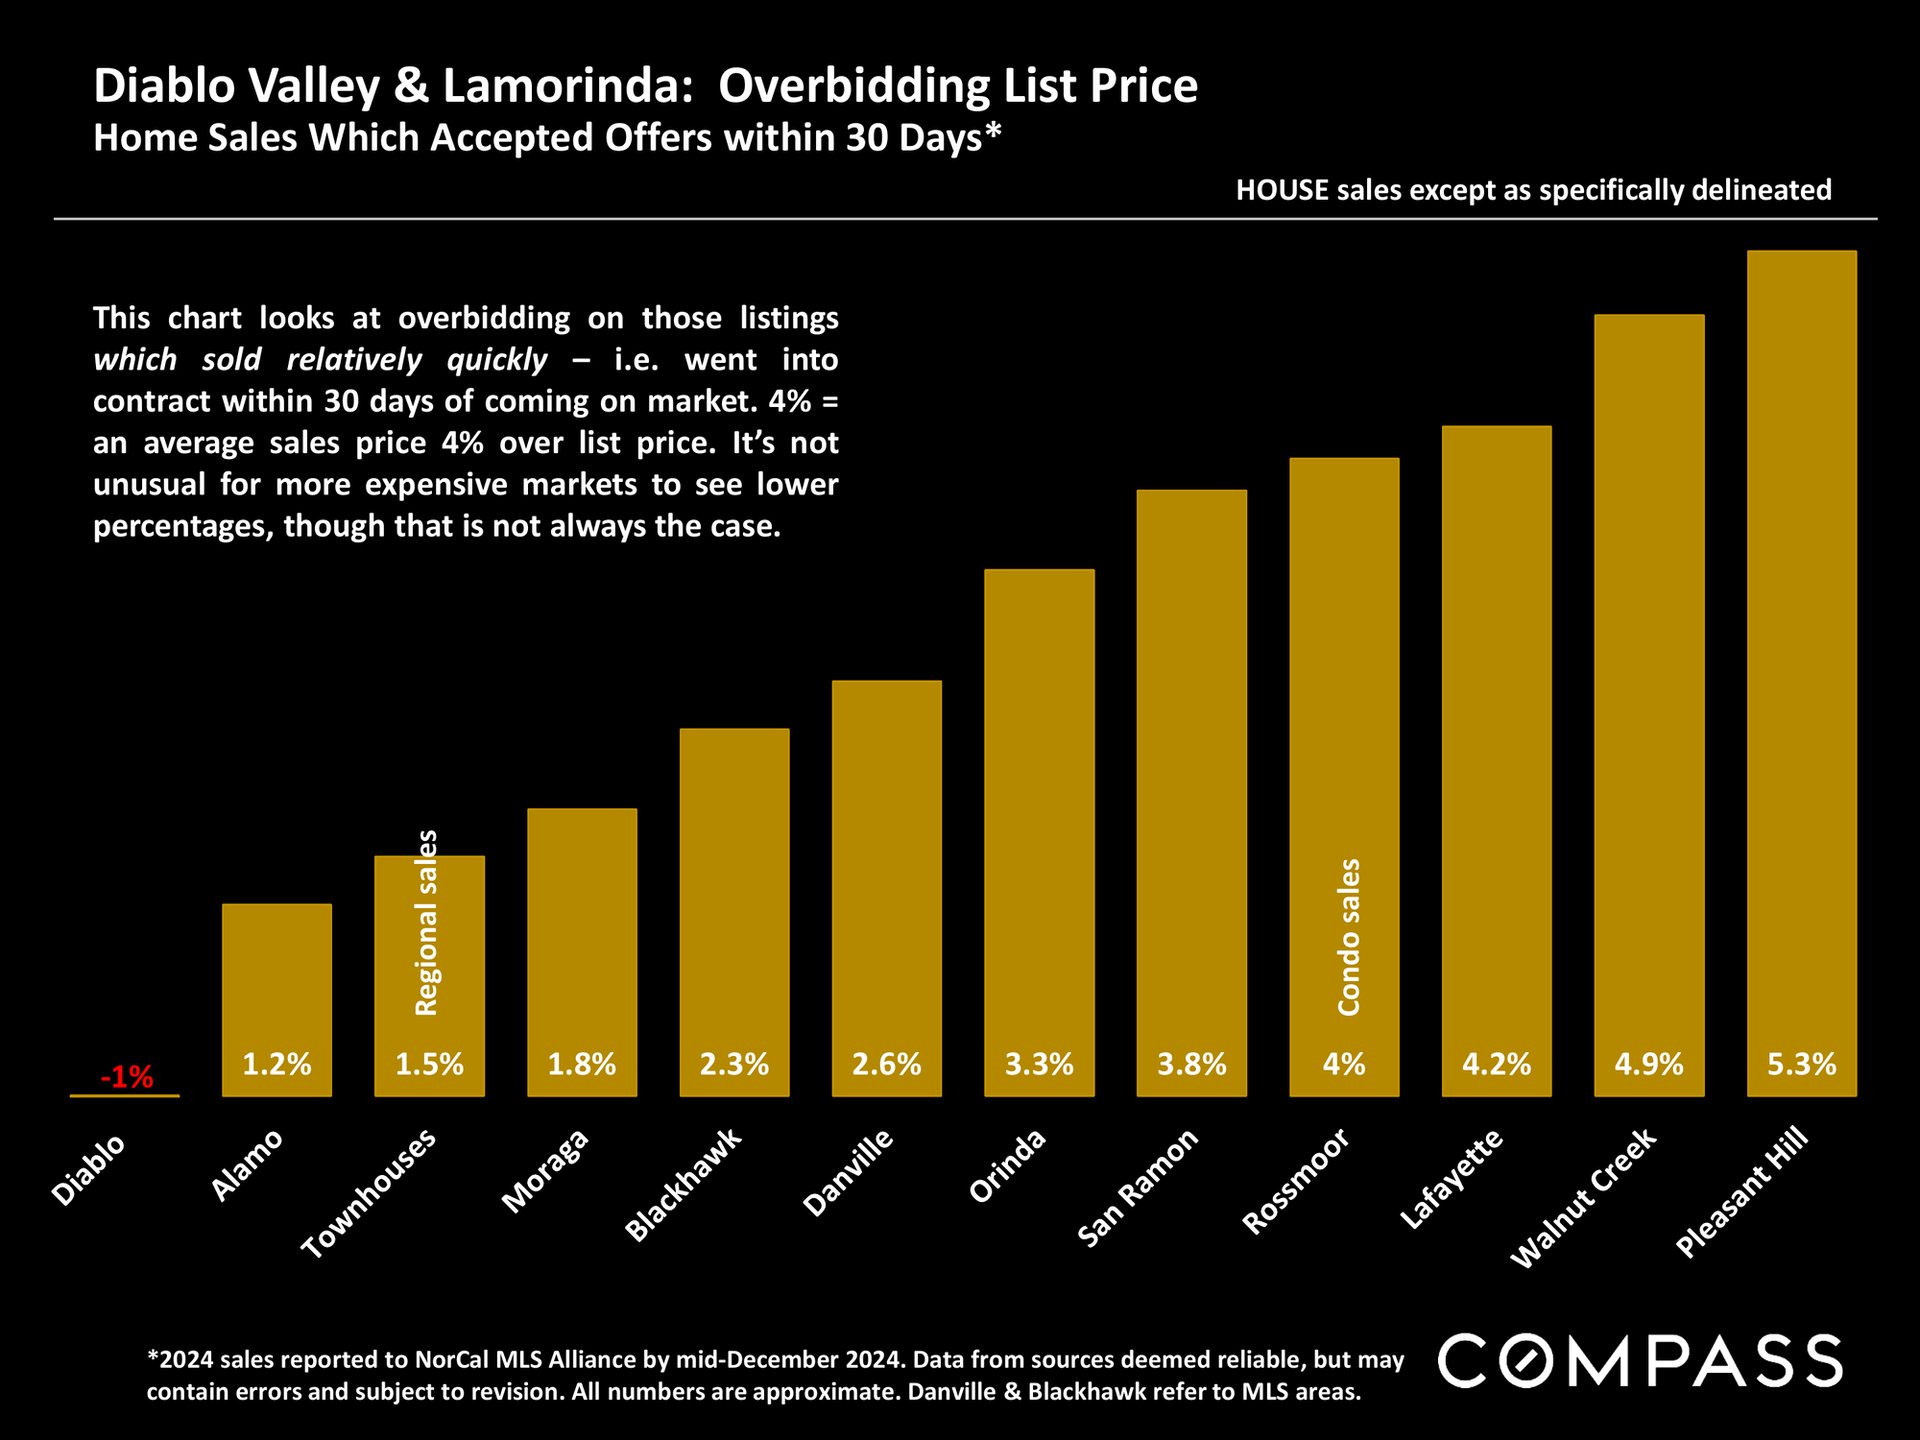
Bar chart of 2024 Diablo Valley and Lamorinda home sale overbidding percentages, from Diablo at -1% to Pleasant Hill at 5.3%.
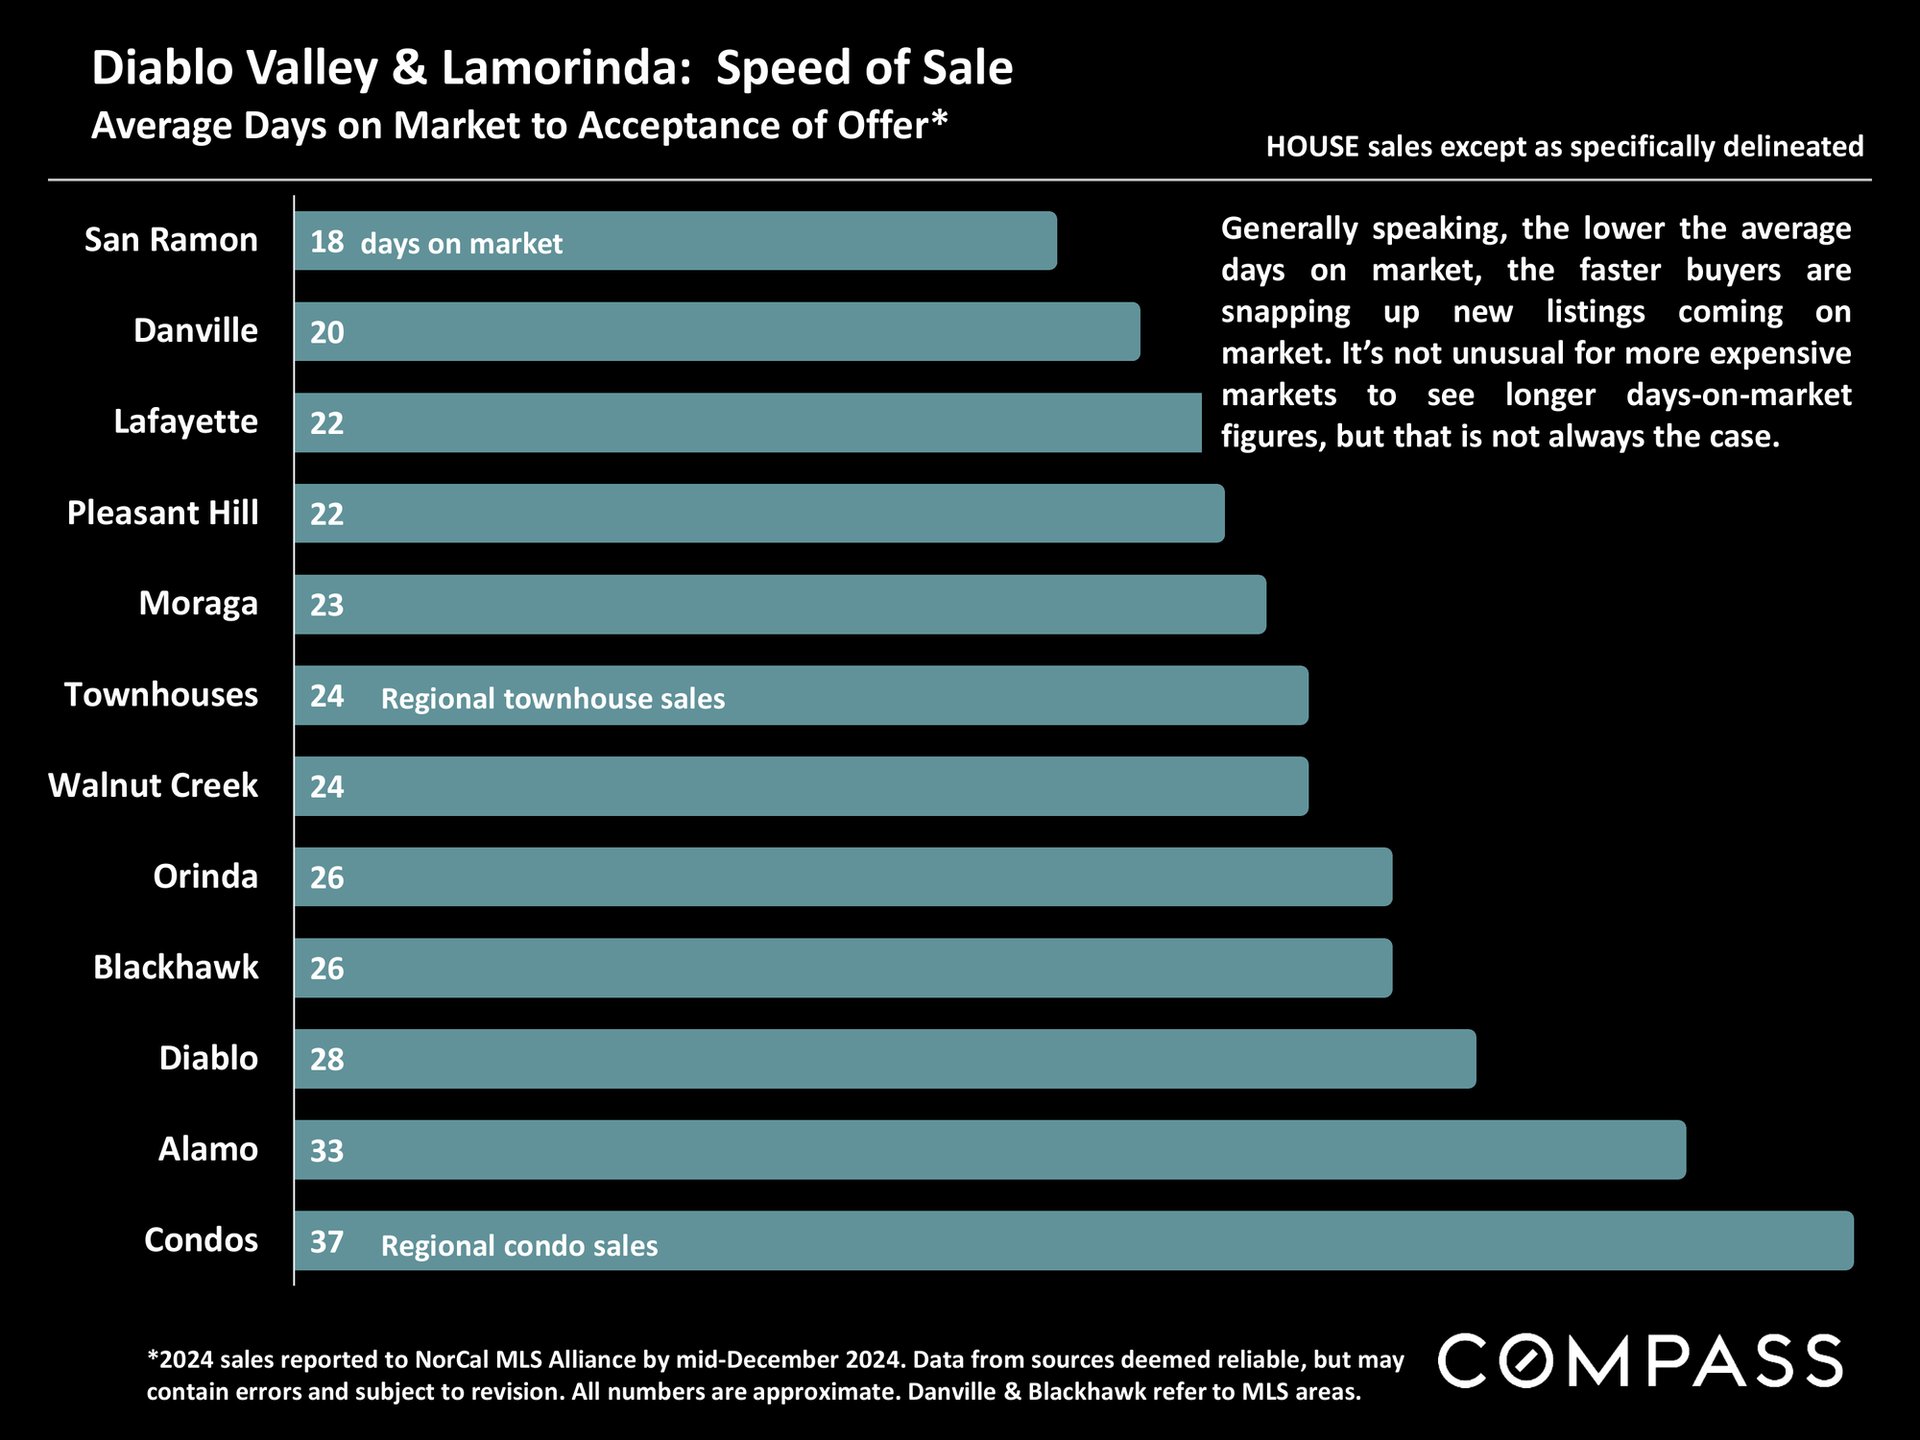
Bar chart of average days to accepted offer across Diablo Valley communities, ranging from 18 days in San Ramon to 37 for condos.


WORK WITH US

We offer the highest level of service and expertise to our clients. Our team has built a reputation for consistently representing the finest real estate in San Francisco and Napa Valley. Results driven and dedicated to your success, whether buying, selling, renting or investing. Contact us today for a private consultation.

Contact Us