Greater Oakland-Berkeley-Inner East Bay: September 2022

September 2022 Greater Oakland-Berkeley Inner East Bay real estate report cover with a person walking a dog beneath autumn leaves.
Market update on Bay Area buyer activity, listings, home prices, and interest rates, with a statistics disclaimer.
Chart of monthly Inner East Bay median house prices from 2018 to 2022, peaking near $1.4 million in spring 2022.
Chart of Inner East Bay home price appreciation, with monthly year-over-year rates from May 2020 to August 2022.
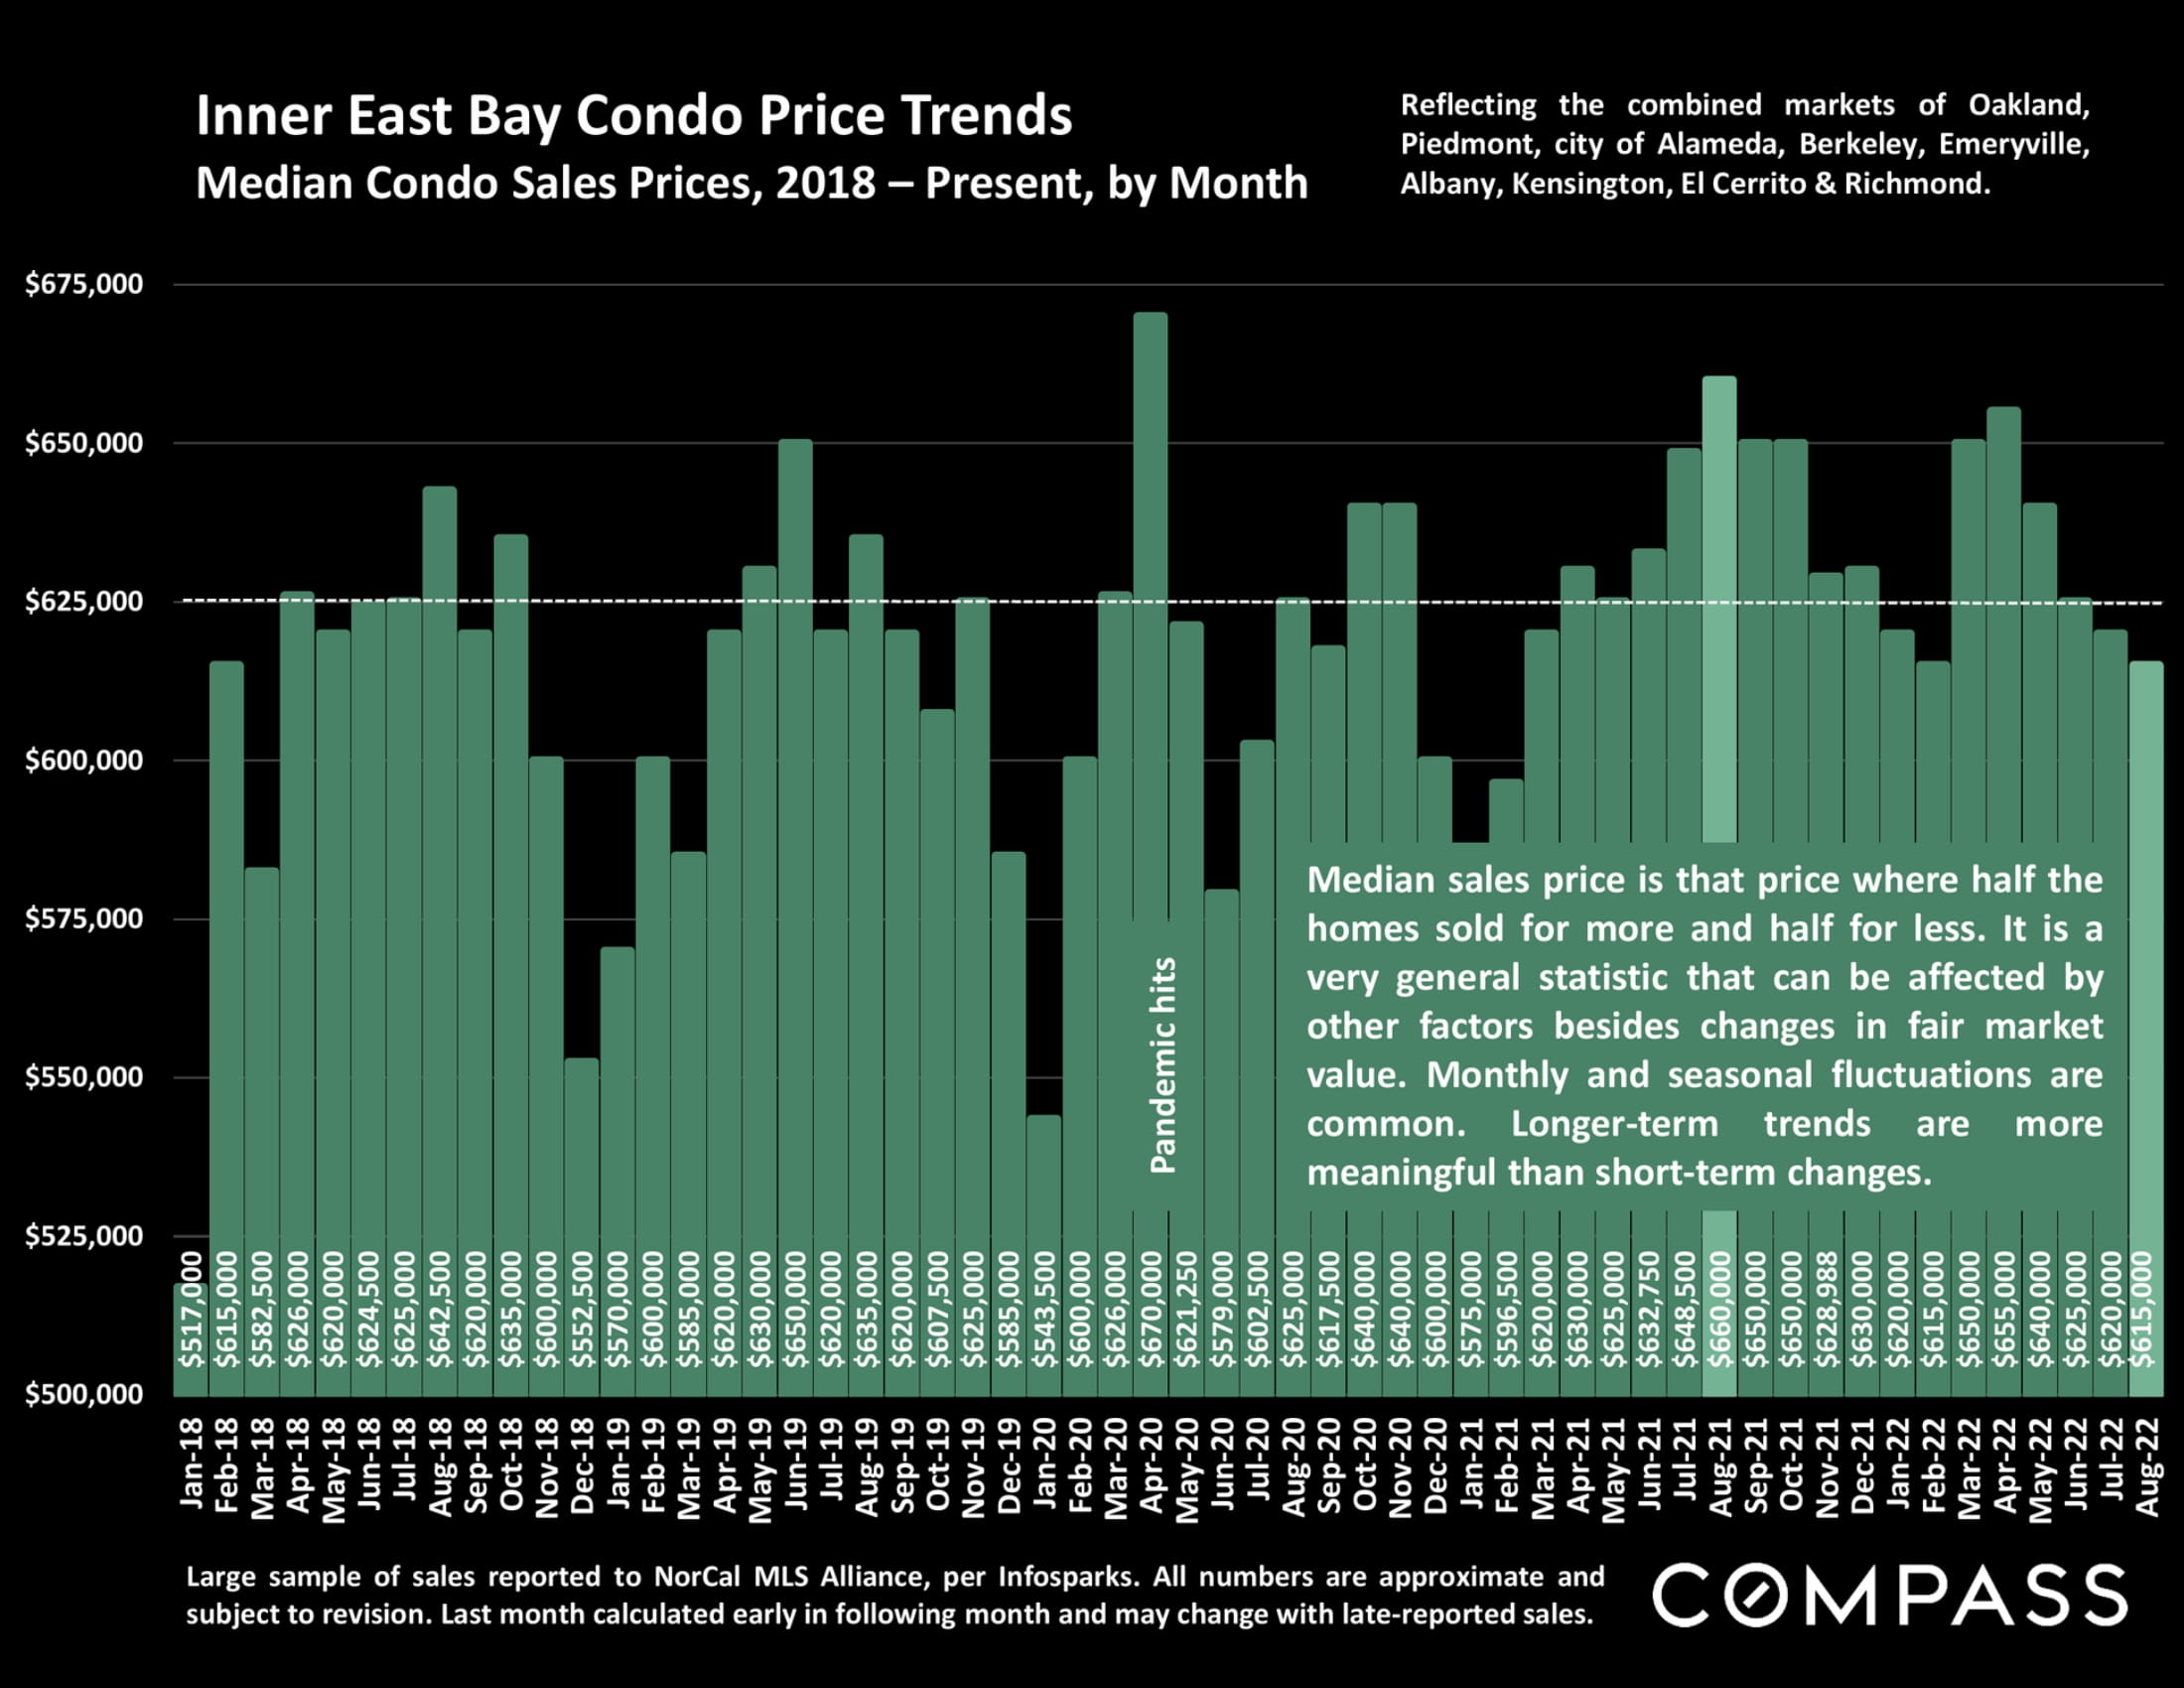
Chart of Inner East Bay monthly median condo sale prices, January 2018–August 2022, with a $625,000 reference line.
Pie chart of Inner East Bay home sales: houses 67%, condos 20%, two-to-four-unit buildings 8%, and townhouses 5%.
Inner East Bay chart of monthly home sales closing above list price, 2018–2022.
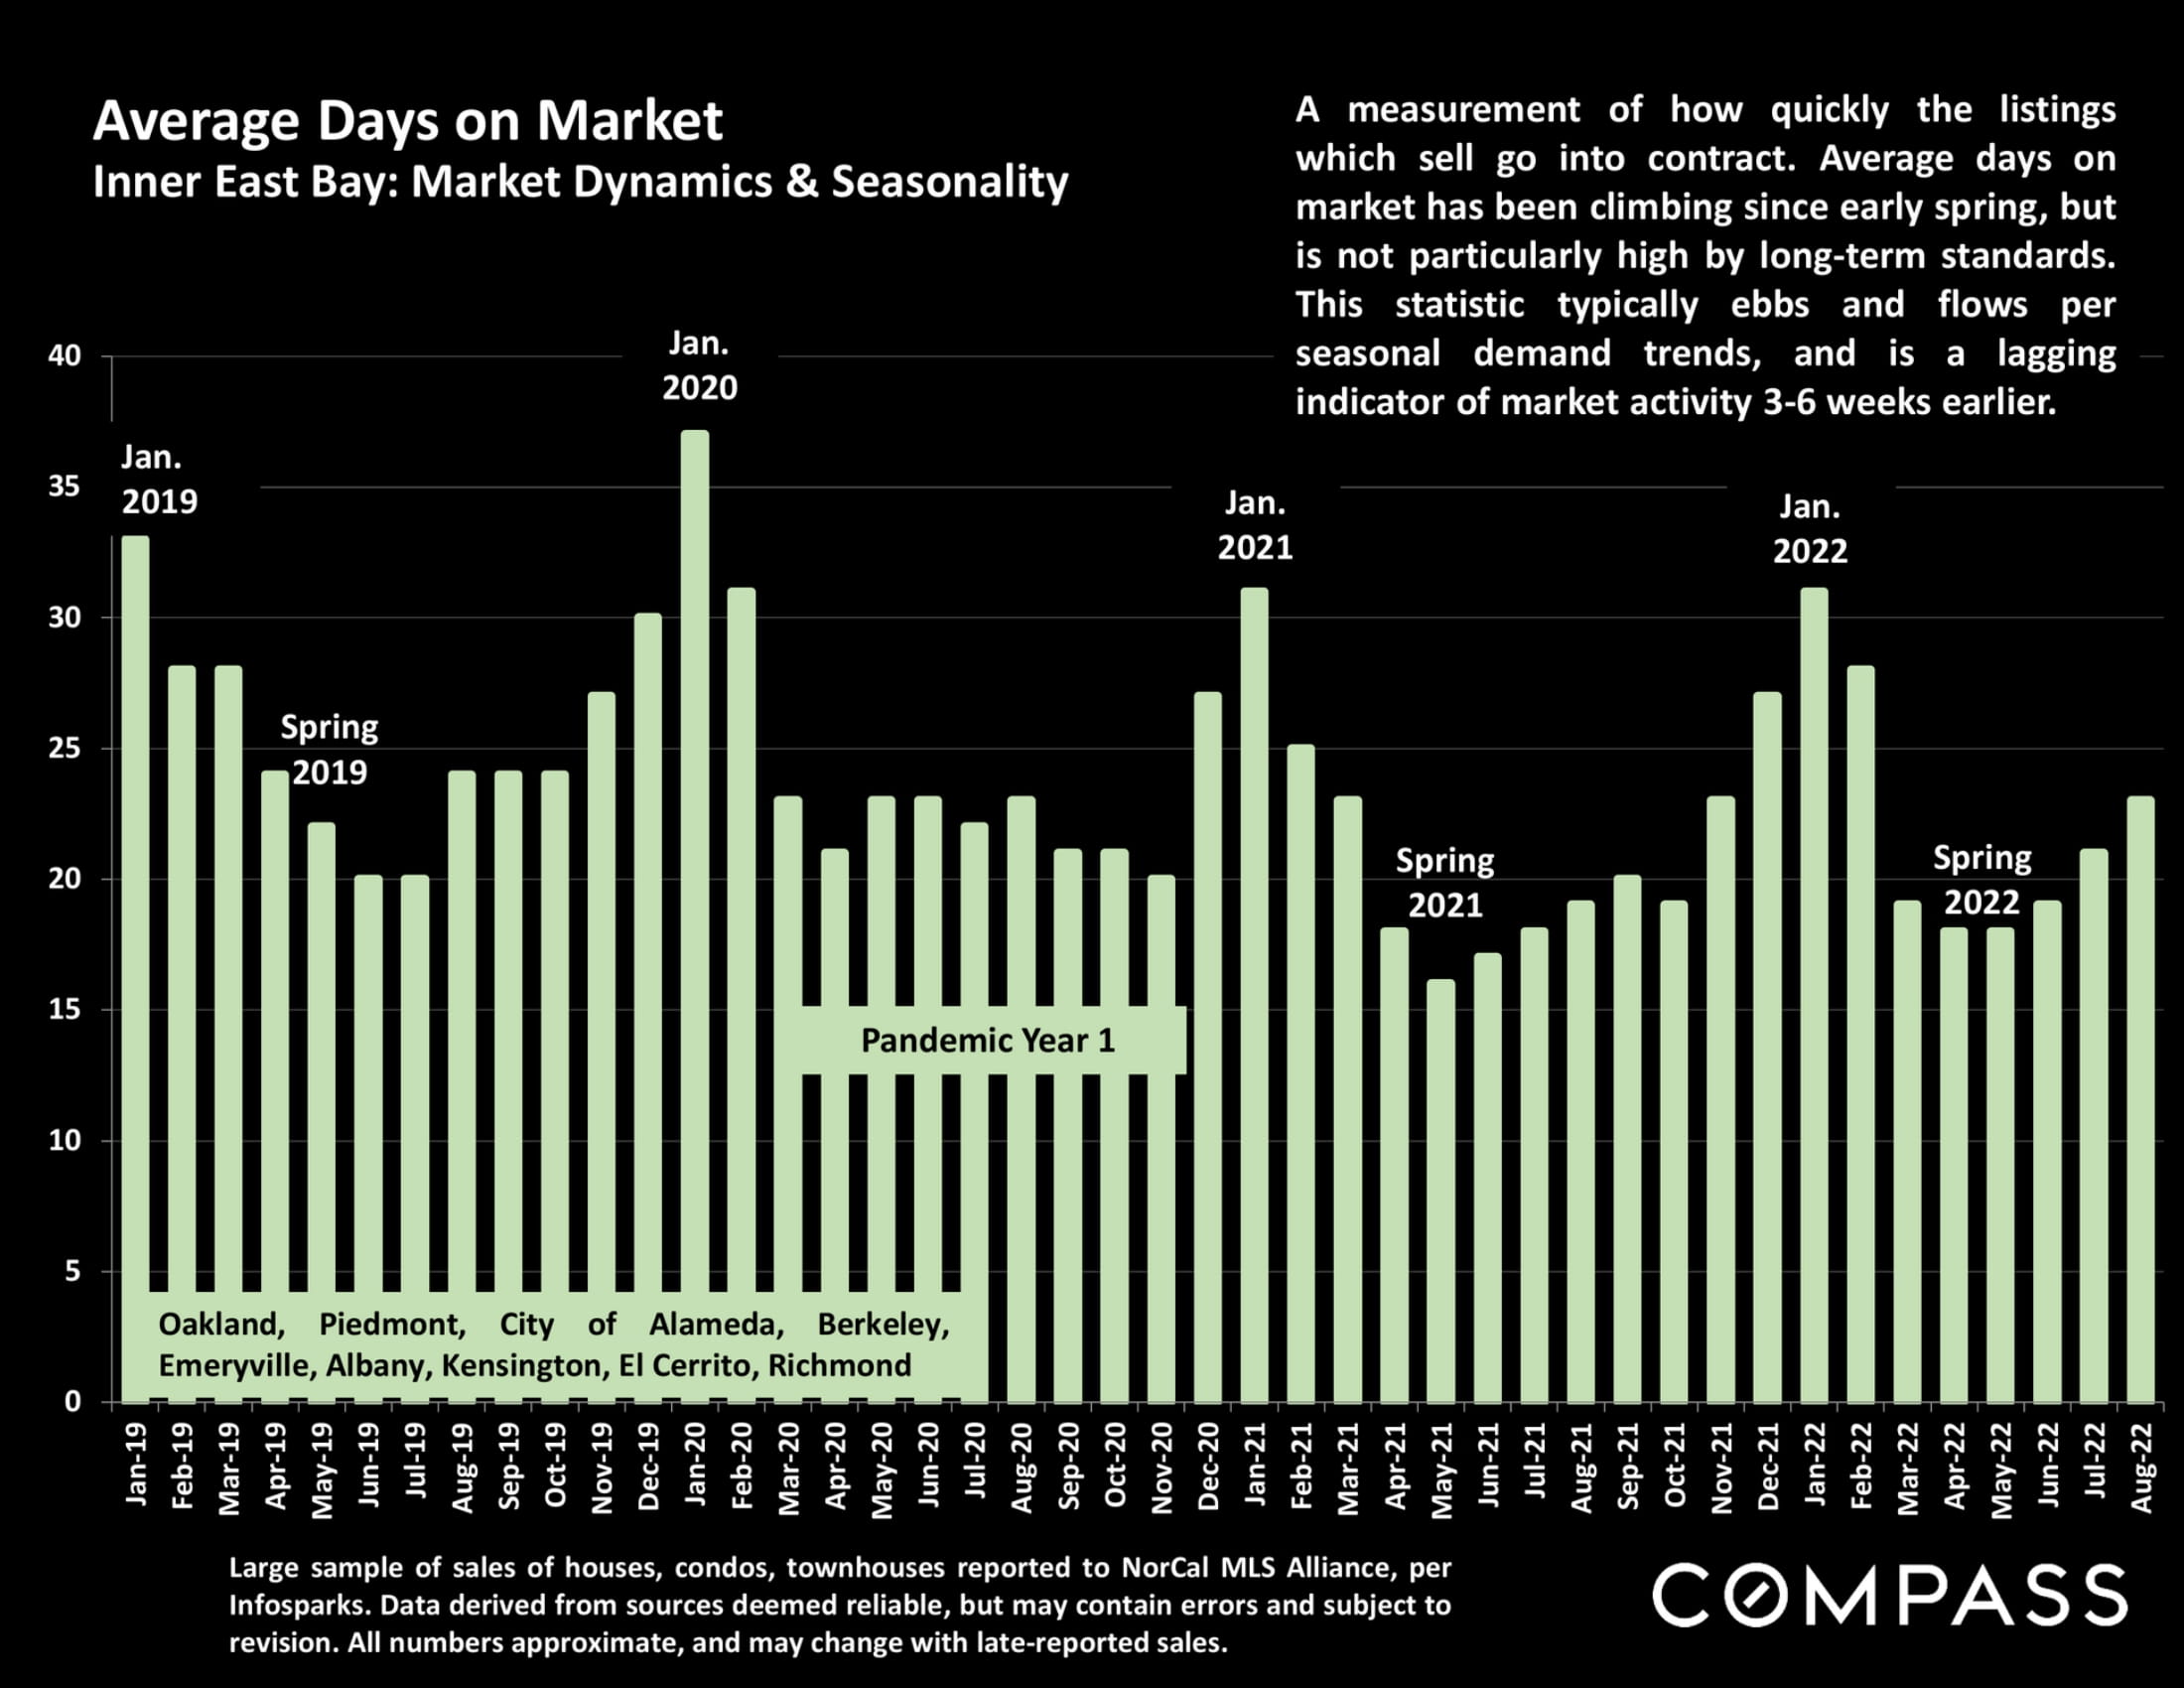
Bar chart of monthly Inner East Bay home-sale days on market, January 2019 to August 2022.
Chart comparing 2021 and 2022 monthly new listings in Oakland, Berkeley, and nearby East Bay communities.
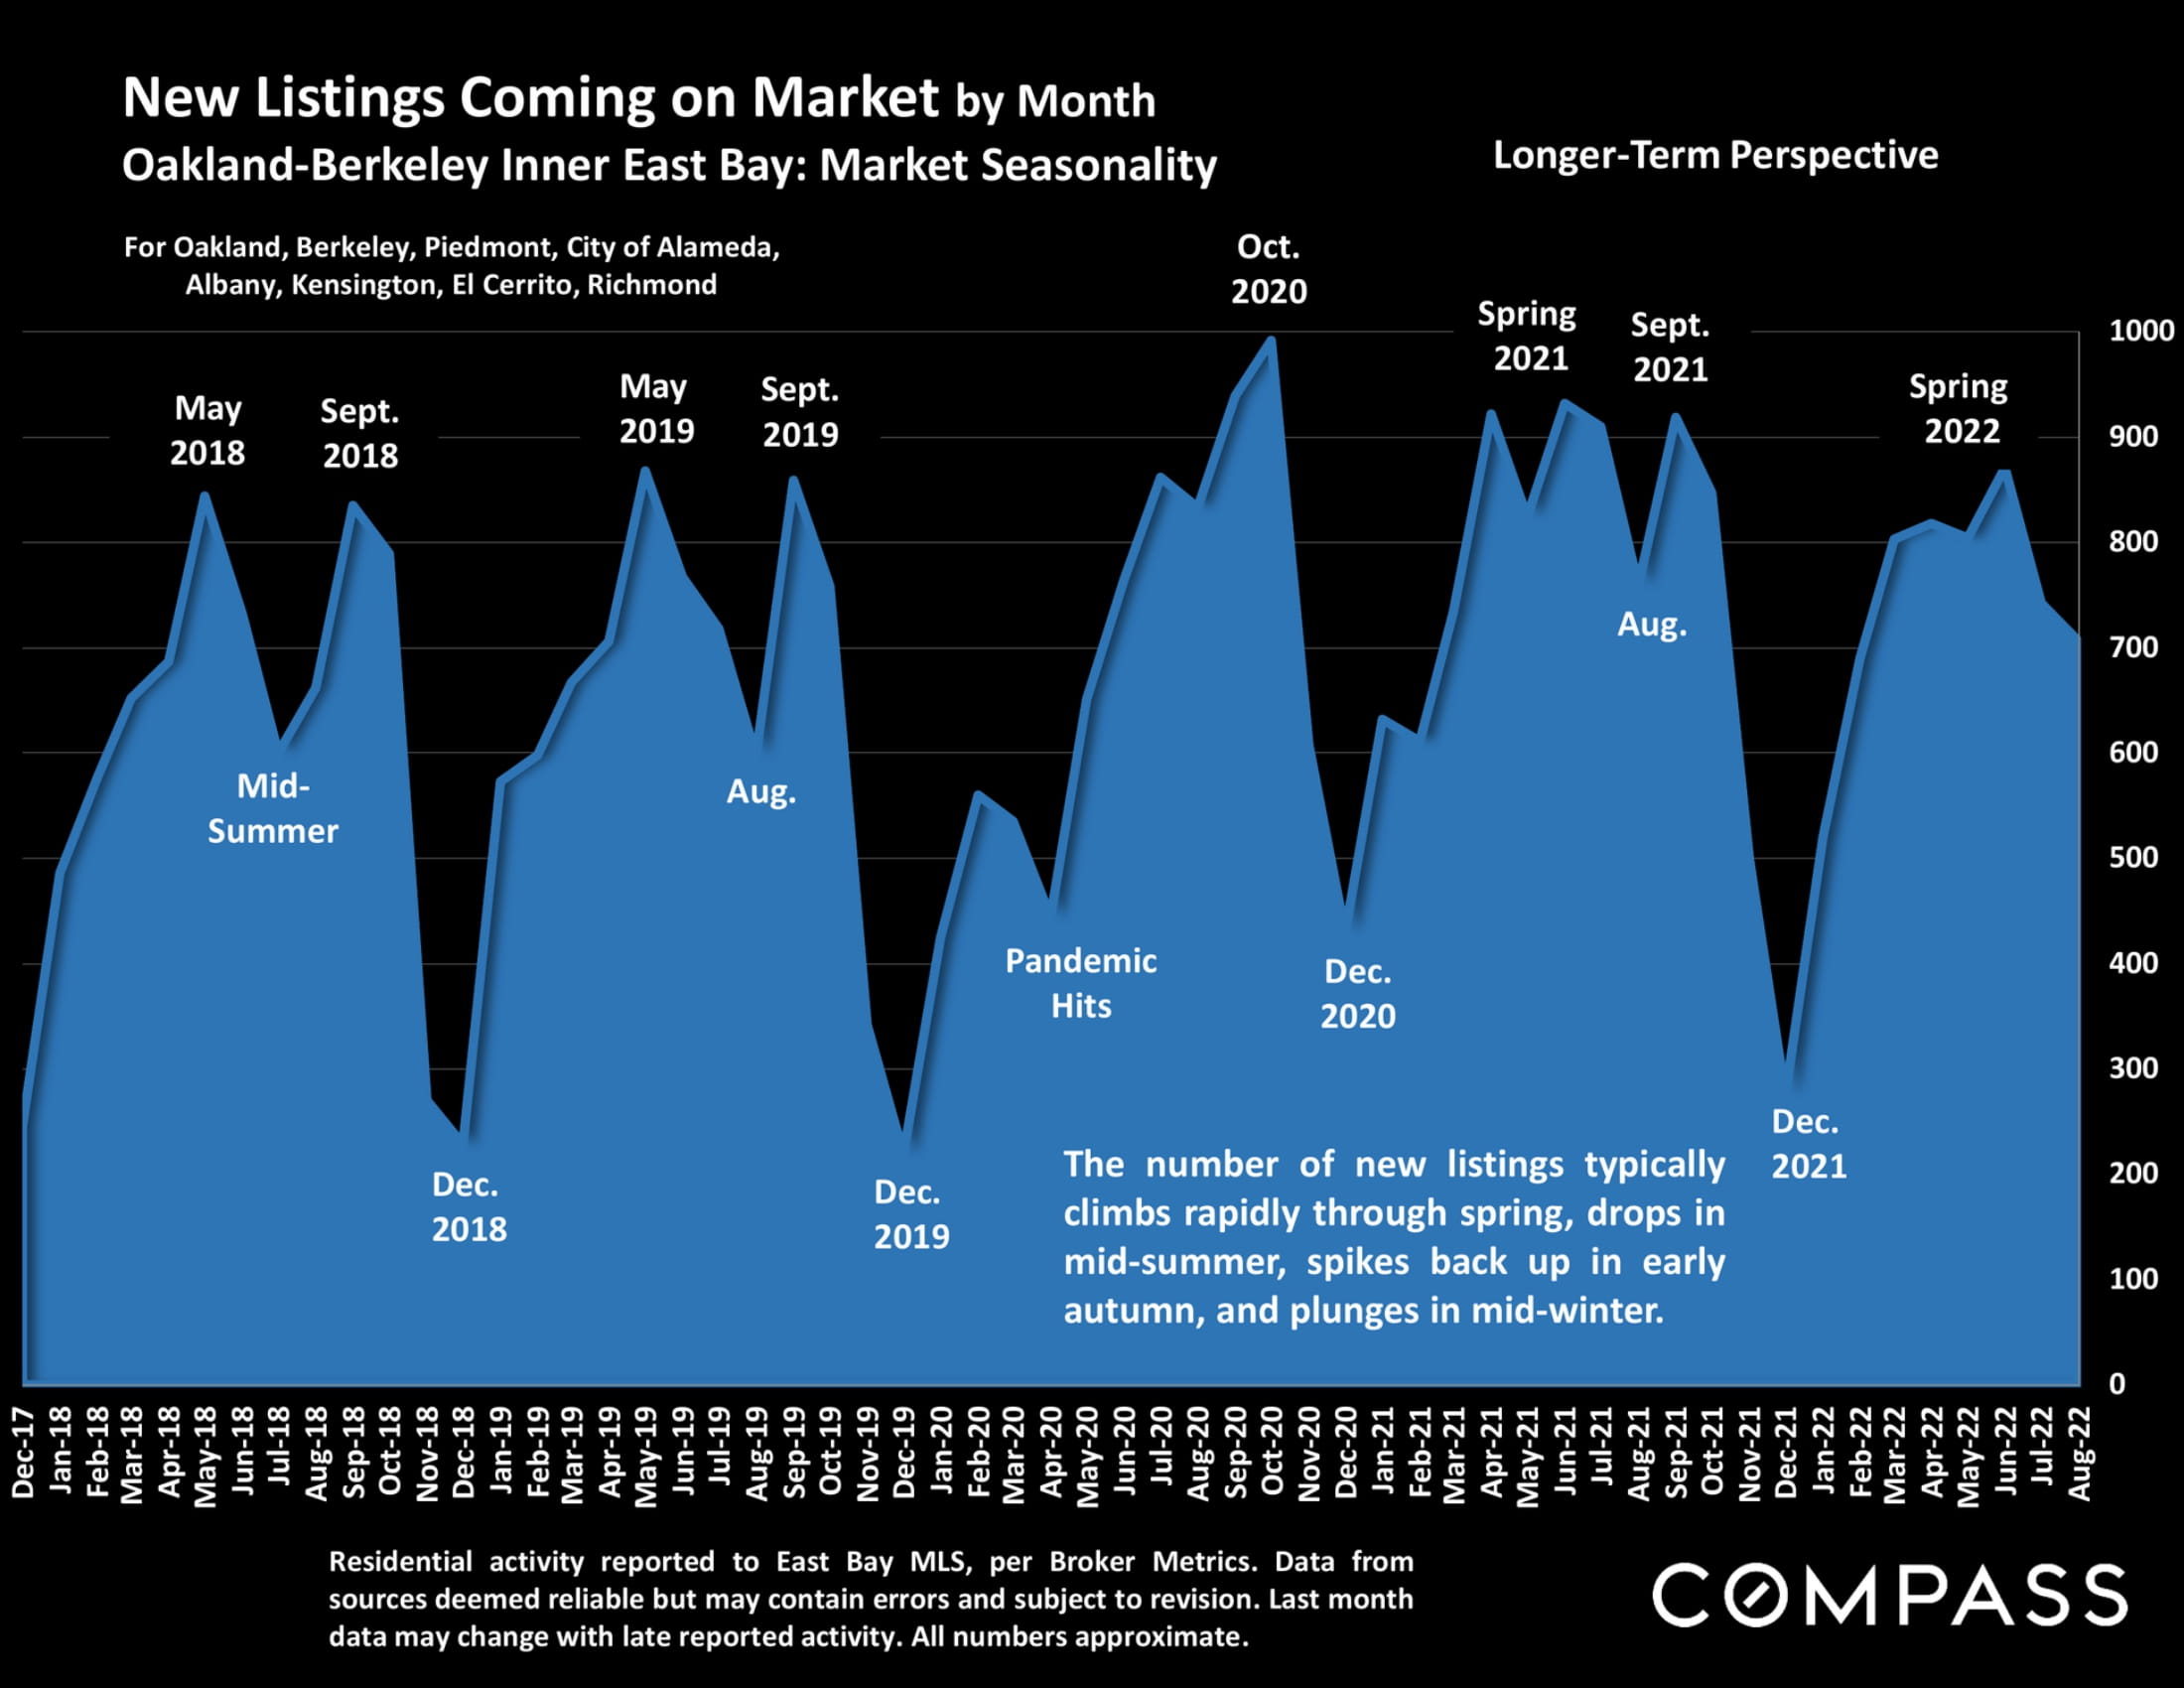
Chart of monthly new listings in Oakland-Berkeley Inner East Bay, showing seasonal trends from 2017 to 2022.
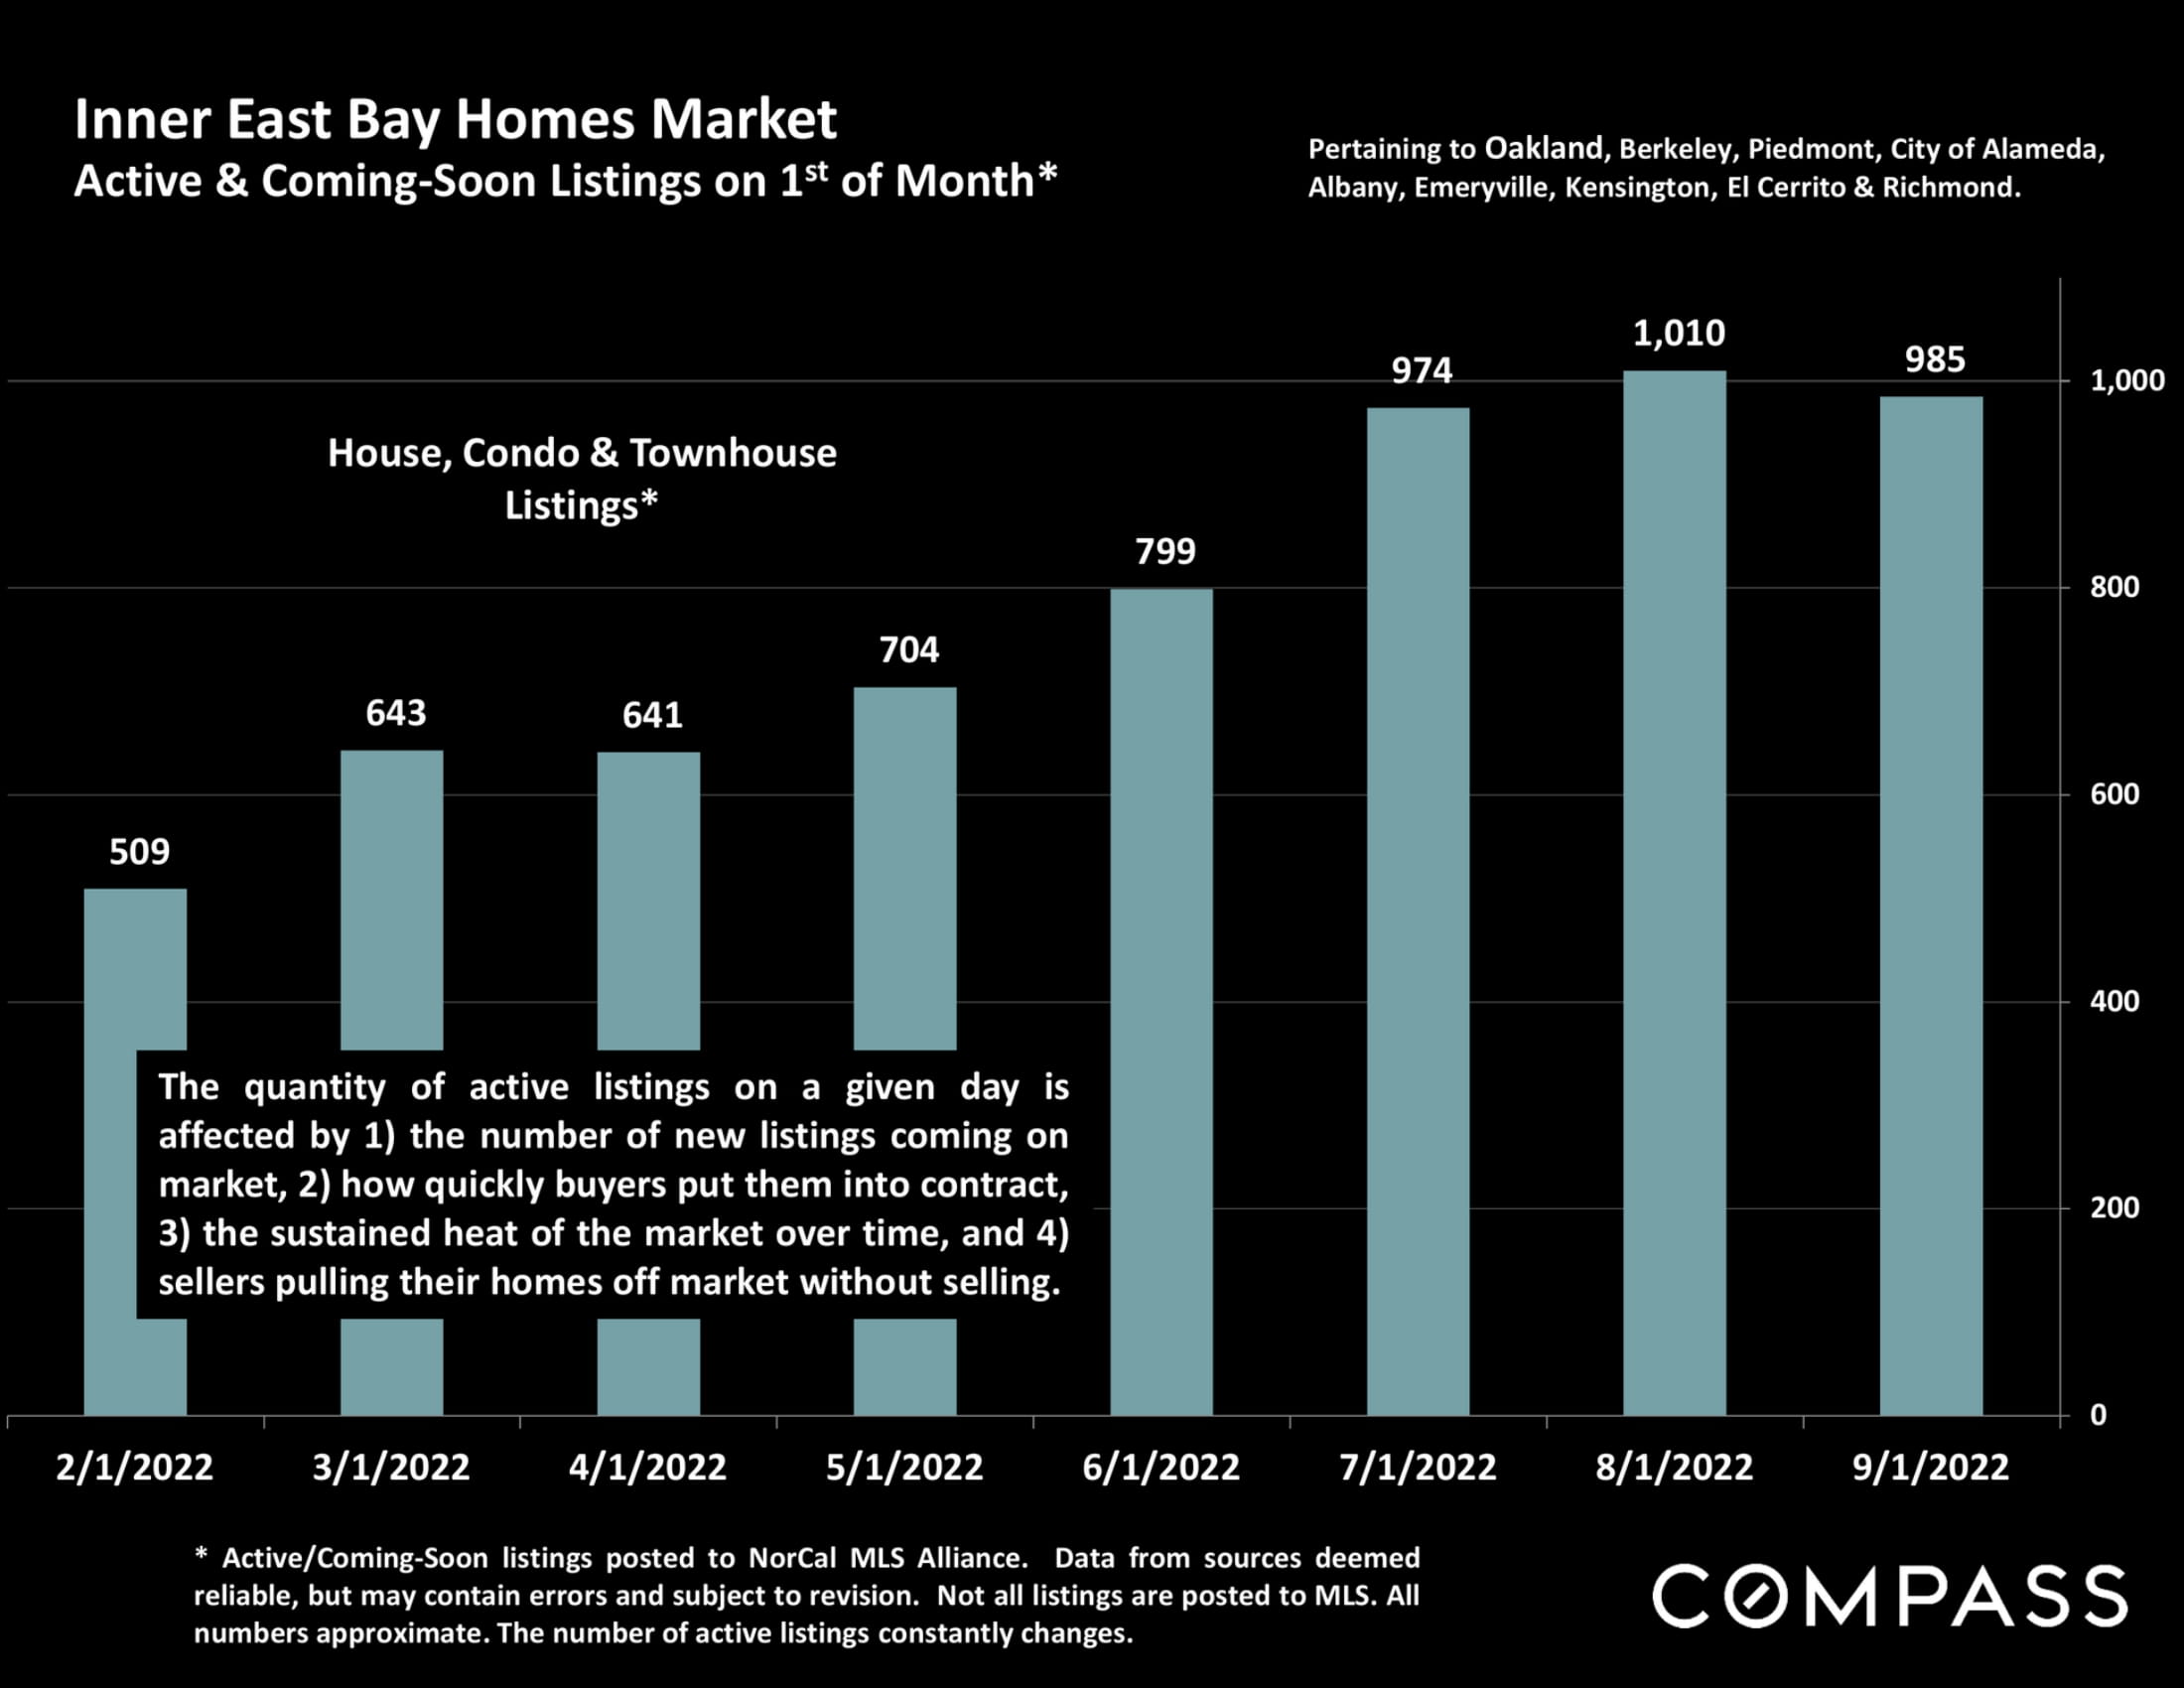
Bar chart of Inner East Bay active and coming-soon home listings, rising from 509 in February to 985 in September 2022.
Chart comparing 2021 and 2022 Inner East Bay listings accepting offers, with monthly figures from January through August.
Line chart of Oakland-Berkeley Inner East Bay market activity from 2018 to 2022, with seasonal trends and pandemic annotations.
Line chart comparing monthly percentages of Inner East Bay listings going into contract in 2021 and 2022.
Chart comparing Alameda County monthly price reductions in 2021 and 2022; 2022 rises to 840 in July.
Chart of Alameda County active-listing price reductions, January 2018–August 2022, with a sharp summer 2022 rise.
Line chart comparing monthly Inner East Bay home sales in 2021 and 2022, with August sales at 709 and 541 respectively.
Oakland-Berkeley Inner East Bay monthly home sales volume chart, with green bars from February 2019 through August 2022.
Chart comparing monthly Inner East Bay home sales over $2 million in 2021 and 2022; 2022 peaked at 98 in April.
Bar chart of East Bay sales above $2 million, with monthly counts from January 2017 to August 2022.
Chart comparing large-home sales, prices, sizes, lot areas, and market times across ten Northern California counties.
Infographic summarizing mortgage rates, consumer confidence, 2022 market declines, inflation, and Bay Area real estate factors.
San Francisco Bay Area real estate survey promotion with the Golden Gate Bridge and a link to the full report.
Real estate market report notes explain statistics, home values, square-foot calculations, and legal disclaimers.


WORK WITH US

We offer the highest level of service and expertise to our clients. Our team has built a reputation for consistently representing the finest real estate in San Francisco and Napa Valley. Results driven and dedicated to your success, whether buying, selling, renting or investing. Contact us today for a private consultation.

Contact Us