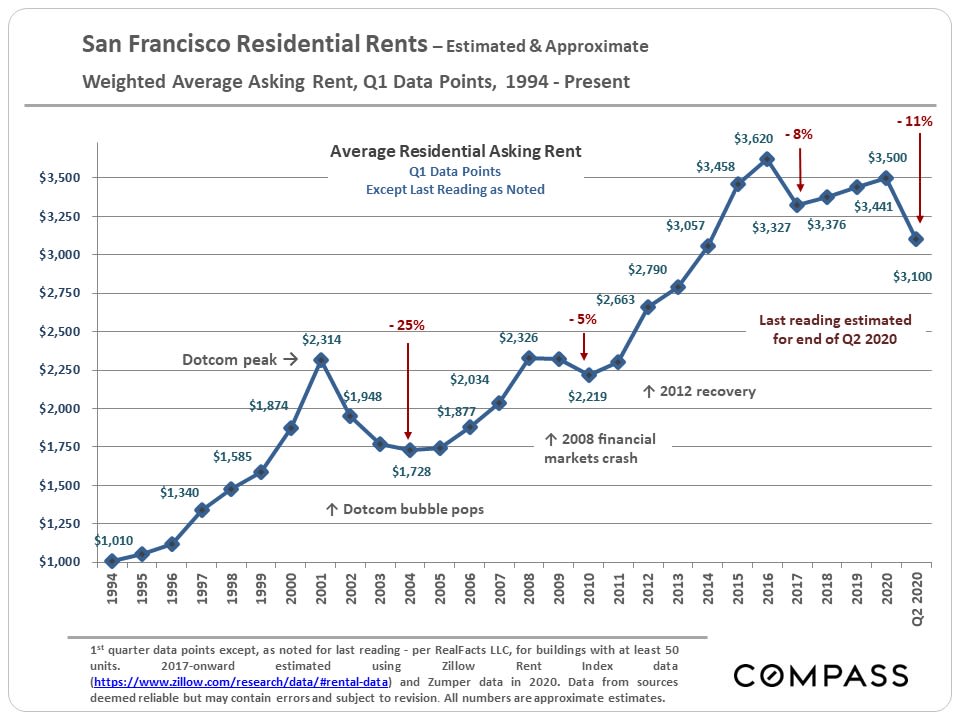
It had already been a challenging couple of years for San Francisco landlords, with political developments regarding sales, evictions and rent control coming into effect, seemingly one after another - but COVID-19 is a health and economic crisis of another magnitude. Mass unemployment hits the city’s rental market extremely hard: Tenants paying the highest rents in the country often move quickly if their jobs are lost. The crisis has left many existing tenants unable to pay their rent, and new rules have severely limited landlords’ legal options, though some of those are now being challenged in court. Market rent rates have been dropping and vacancy rates increasing, in a manner reminiscent of the period after the dotcom collapse, another time of sudden, high unemployment.
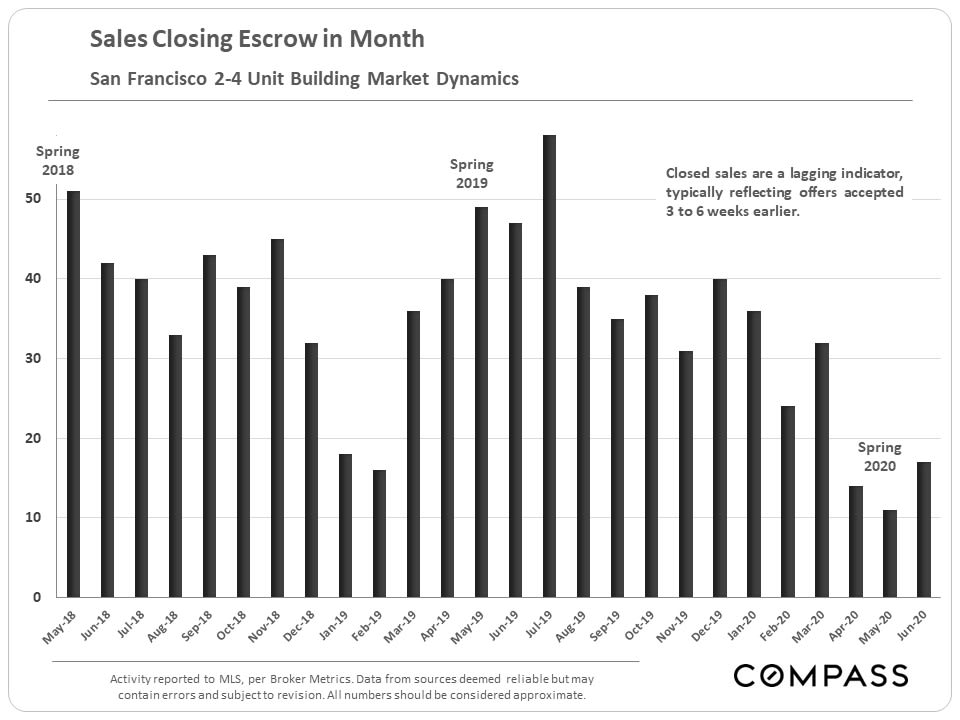
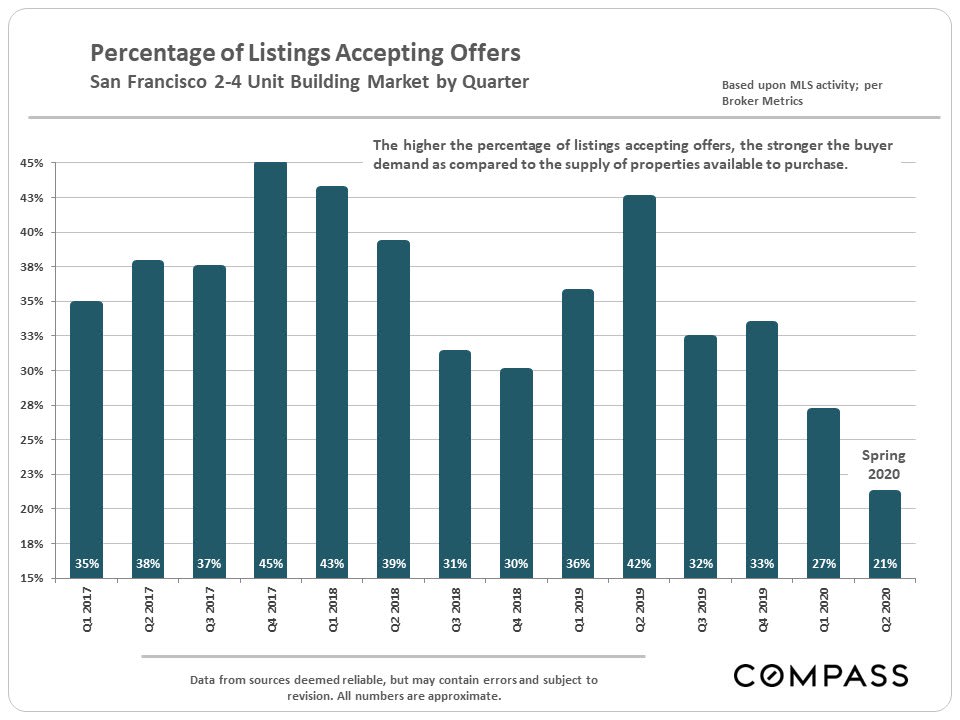
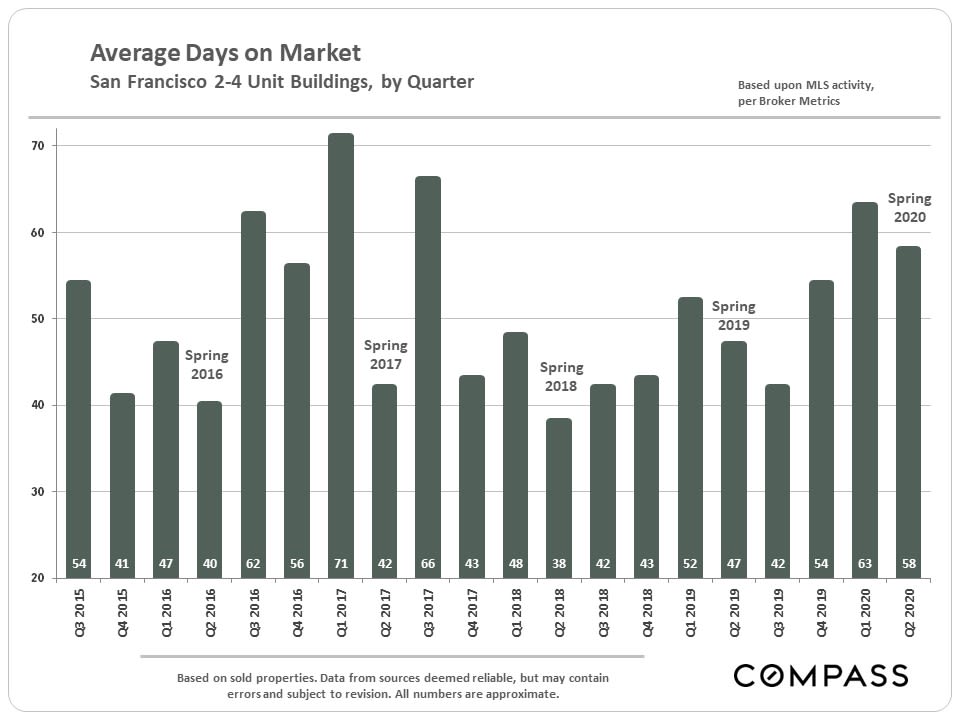
With all this occurring, it is not surprising that sales activity for multi-family income properties has plunged in the last quarter, and to a large degree, we have little choice but to wait for the situation to settle and clarify. Shelter in place rules make it virtually impossible to show occupied units. With reduced sales volume, it becomes more difficult to reliably assess market values, but so far, there has been no precipitous drop. Even with rent declines, occupied apartments generate high income streams, and interest rates have hit all-time lows. And, of course, vacant units in smaller buildings often appeal to owner-occupier buyers. Though COVID-19 has temporarily affected many of the things that residents love so much about the city, San Francisco remains a financial, technology and cultural capital.
Long-term investors who have avoided over-leveraging their properties have ridden out several economic crises over the last 30 years and will do so again. There will almost certainly be opportunities for savvy buyers.
Supply & Demand Indicators by Month or Quarter



Sales Breakdowns - 12 Months of Sales
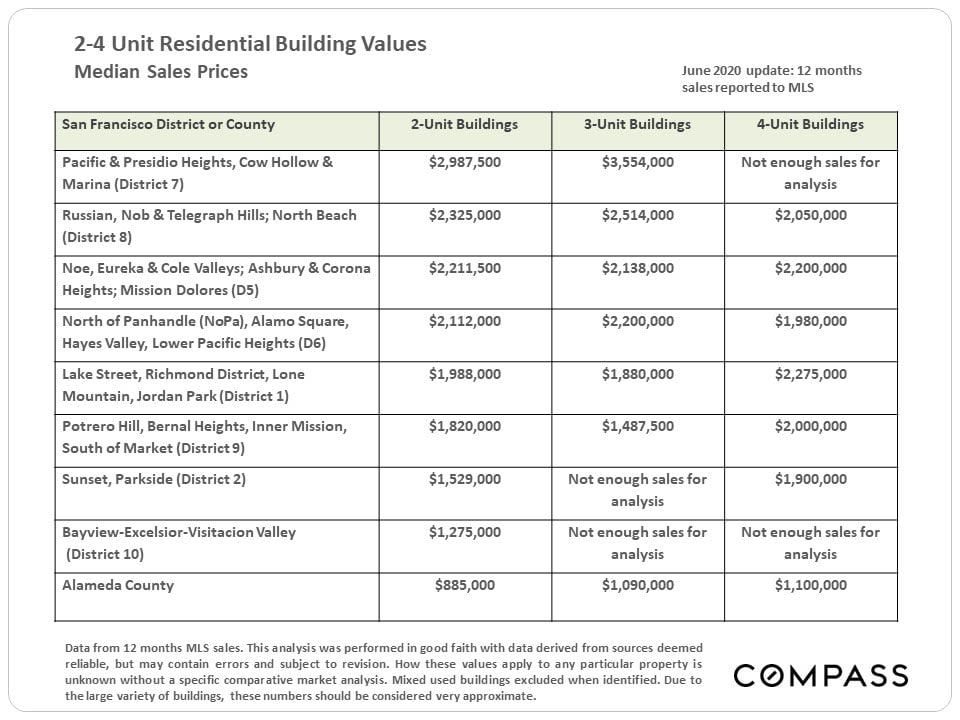


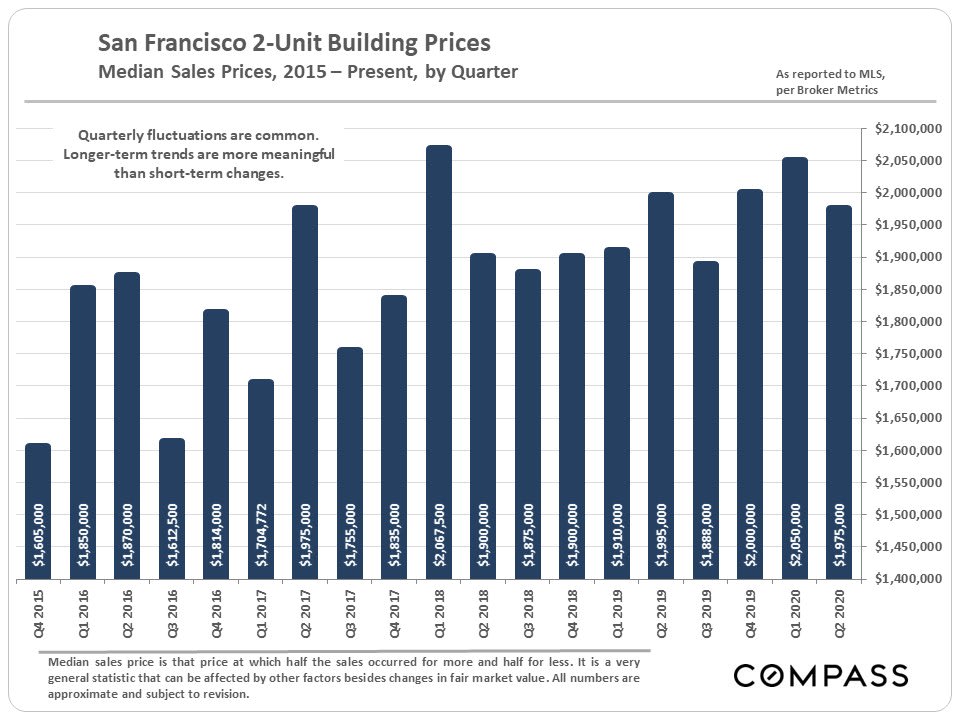
2-Unit Building Values
(Not enough 3-4 unit building sales in Q2 for reliable analysis)

Market Rate Rent Trends
Market Share by Broker
