June 2020 Report

Bay Area Market Reports

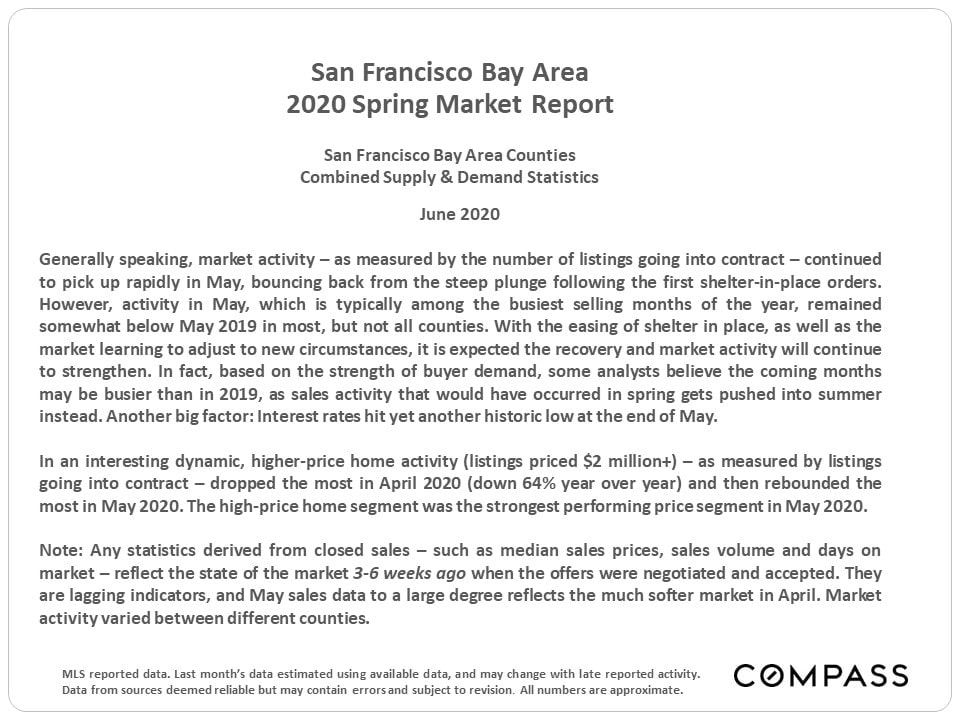
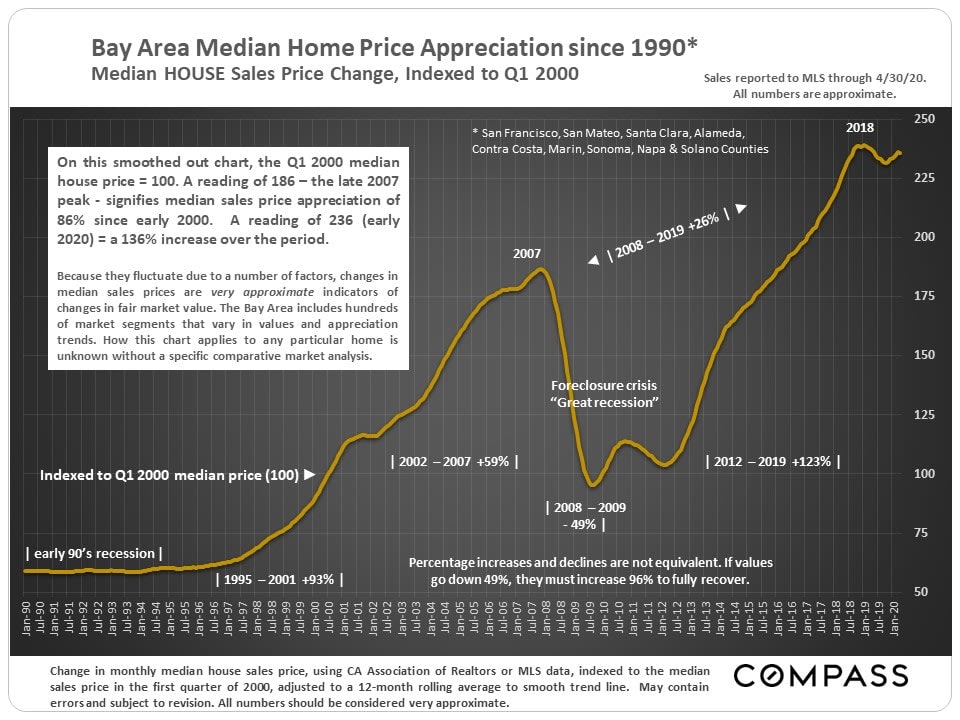
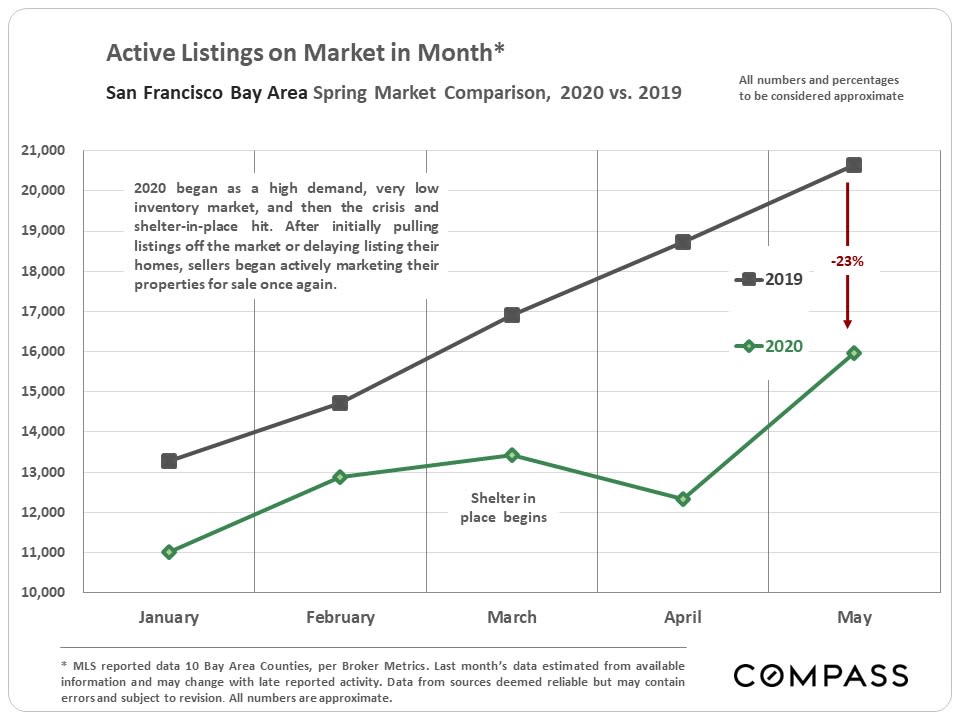
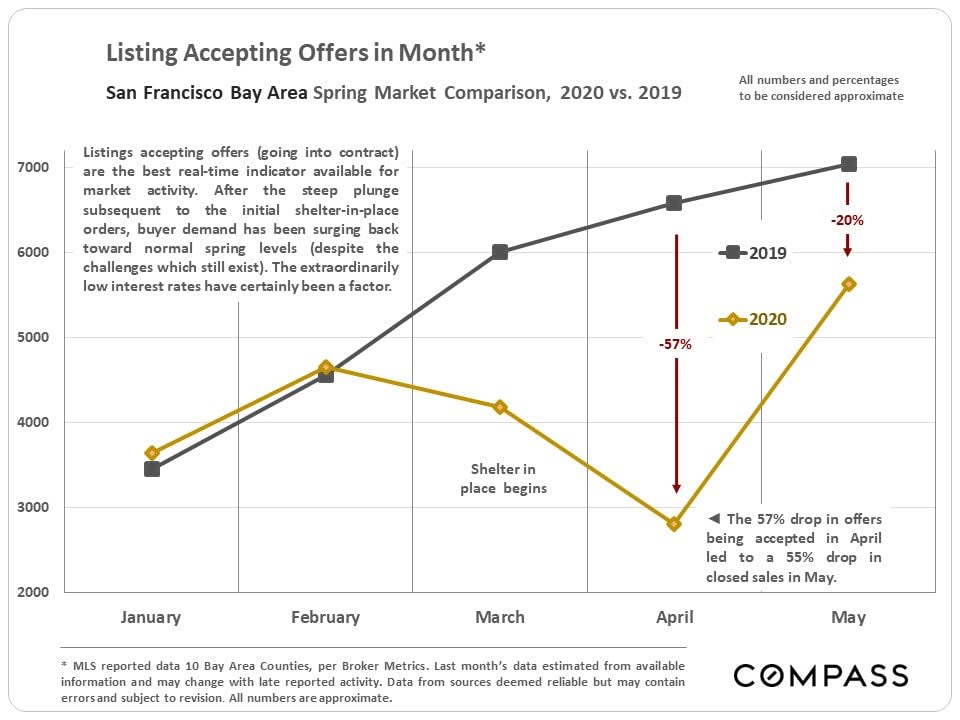
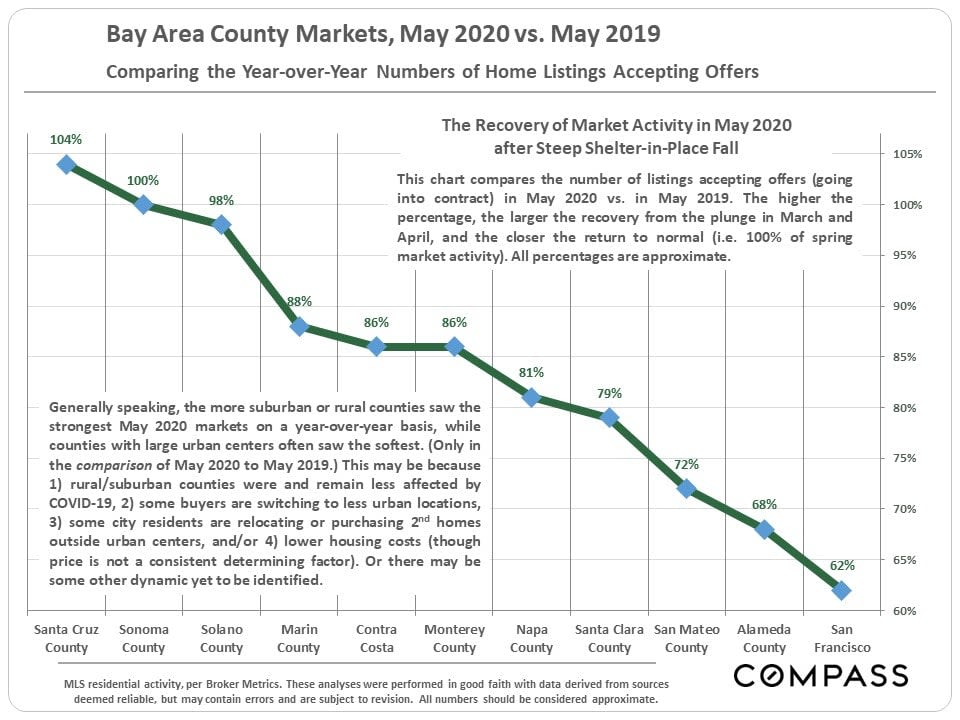
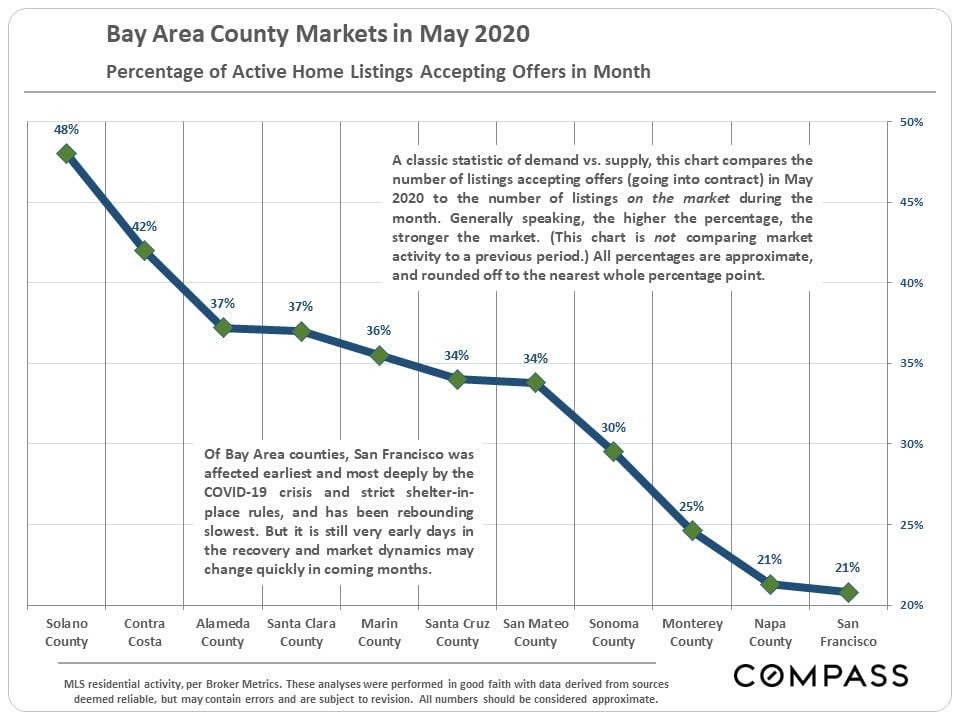
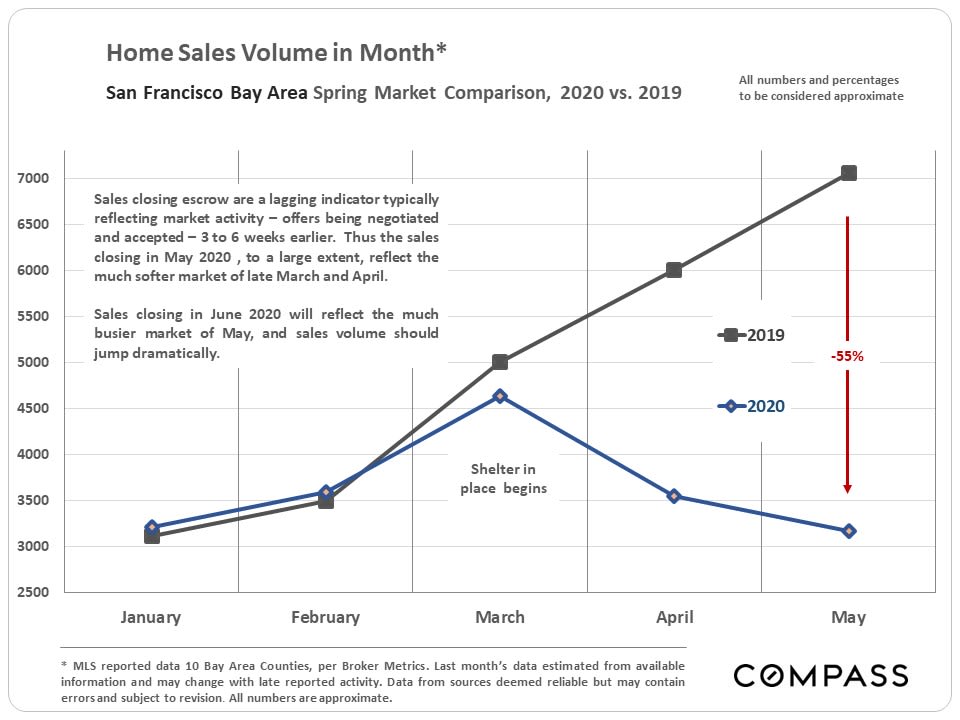
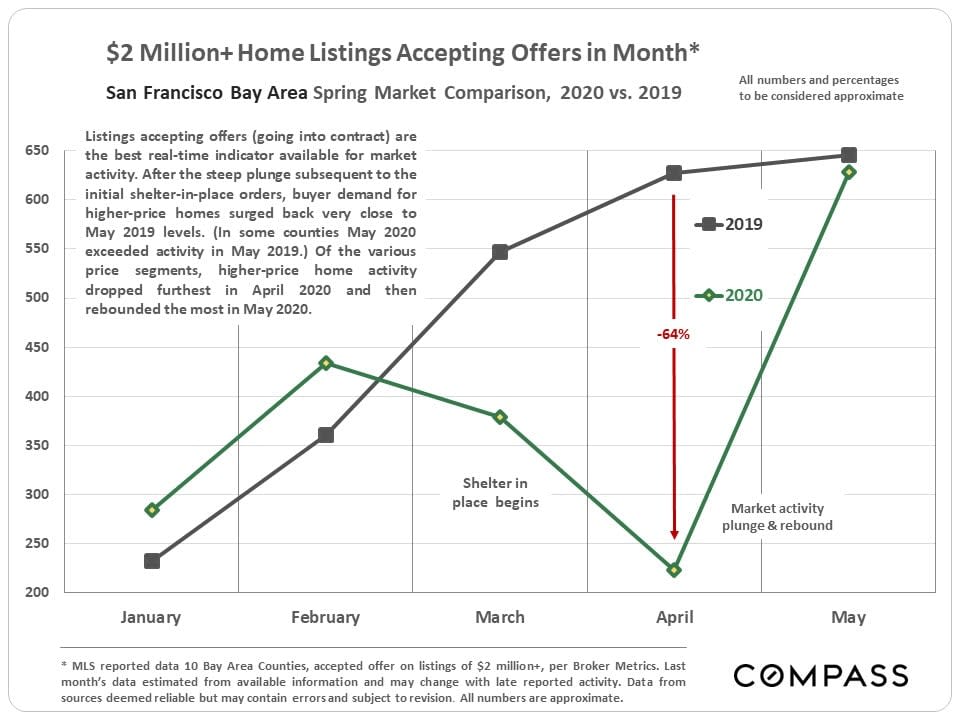
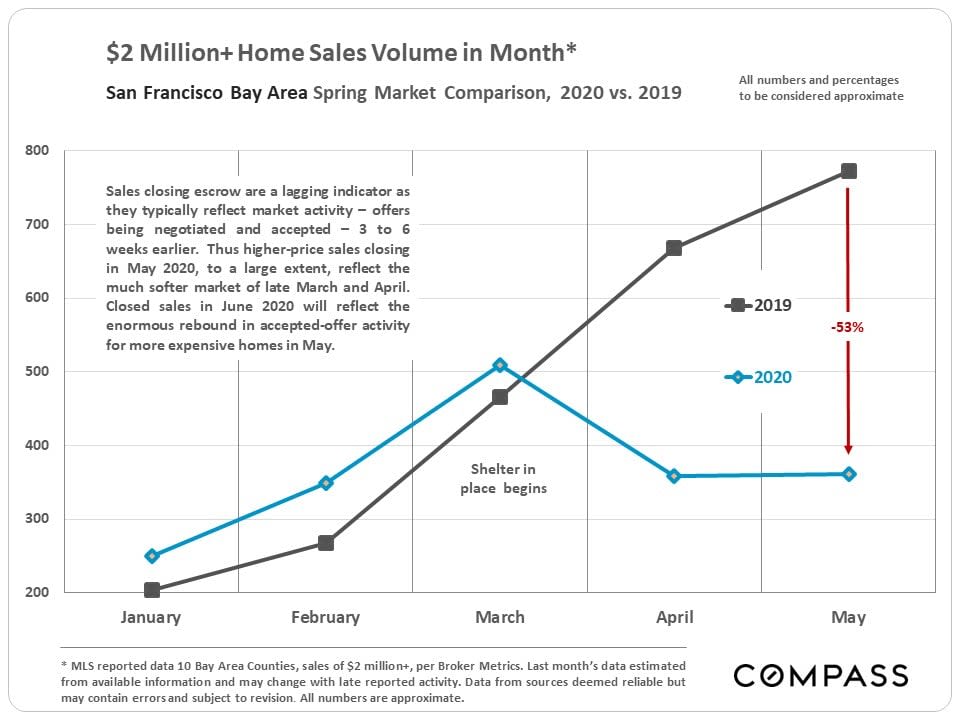
June 2020 San Francisco Bay Area spring market report on county supply and demand statistics.Bay Area median home price appreciation chart, showing a gold price index line from 1990 through early 2020.Chart comparing San Francisco Bay Area active listings in 2019 and 2020, with 2020 listings 23% lower in May.Chart comparing San Francisco Bay Area listings accepting offers in 2019 and 2020, with an April drop and May rebound.Chart comparing year-over-year May home listings accepting offers across 11 Bay Area counties.Chart of Bay Area counties’ May 2020 offer-acceptance rates, ranging from 48% in Solano to 21% in San Francisco.Bay Area home sales volume chart comparing 2019 and 2020, showing a 55% May decline.Chart comparing Bay Area $2 million-plus home offers in 2019 and 2020, with a sharp April 2020 drop and May rebound.Chart comparing monthly San Francisco Bay Area sales of $2 million-plus homes in 2019 and 2020.Market report disclaimer explaining data limitations and legal terms, with a link to Compass Bay Area Market Reports.

WORK WITH US

We offer the highest level of service and expertise to our clients. Our team has built a reputation for consistently representing the finest real estate in San Francisco and Napa Valley. Results driven and dedicated to your success, whether buying, selling, renting or investing. Contact us today for a private consultation.

Contact Us