
Macroeconomic Factors & Indicators: September 2022

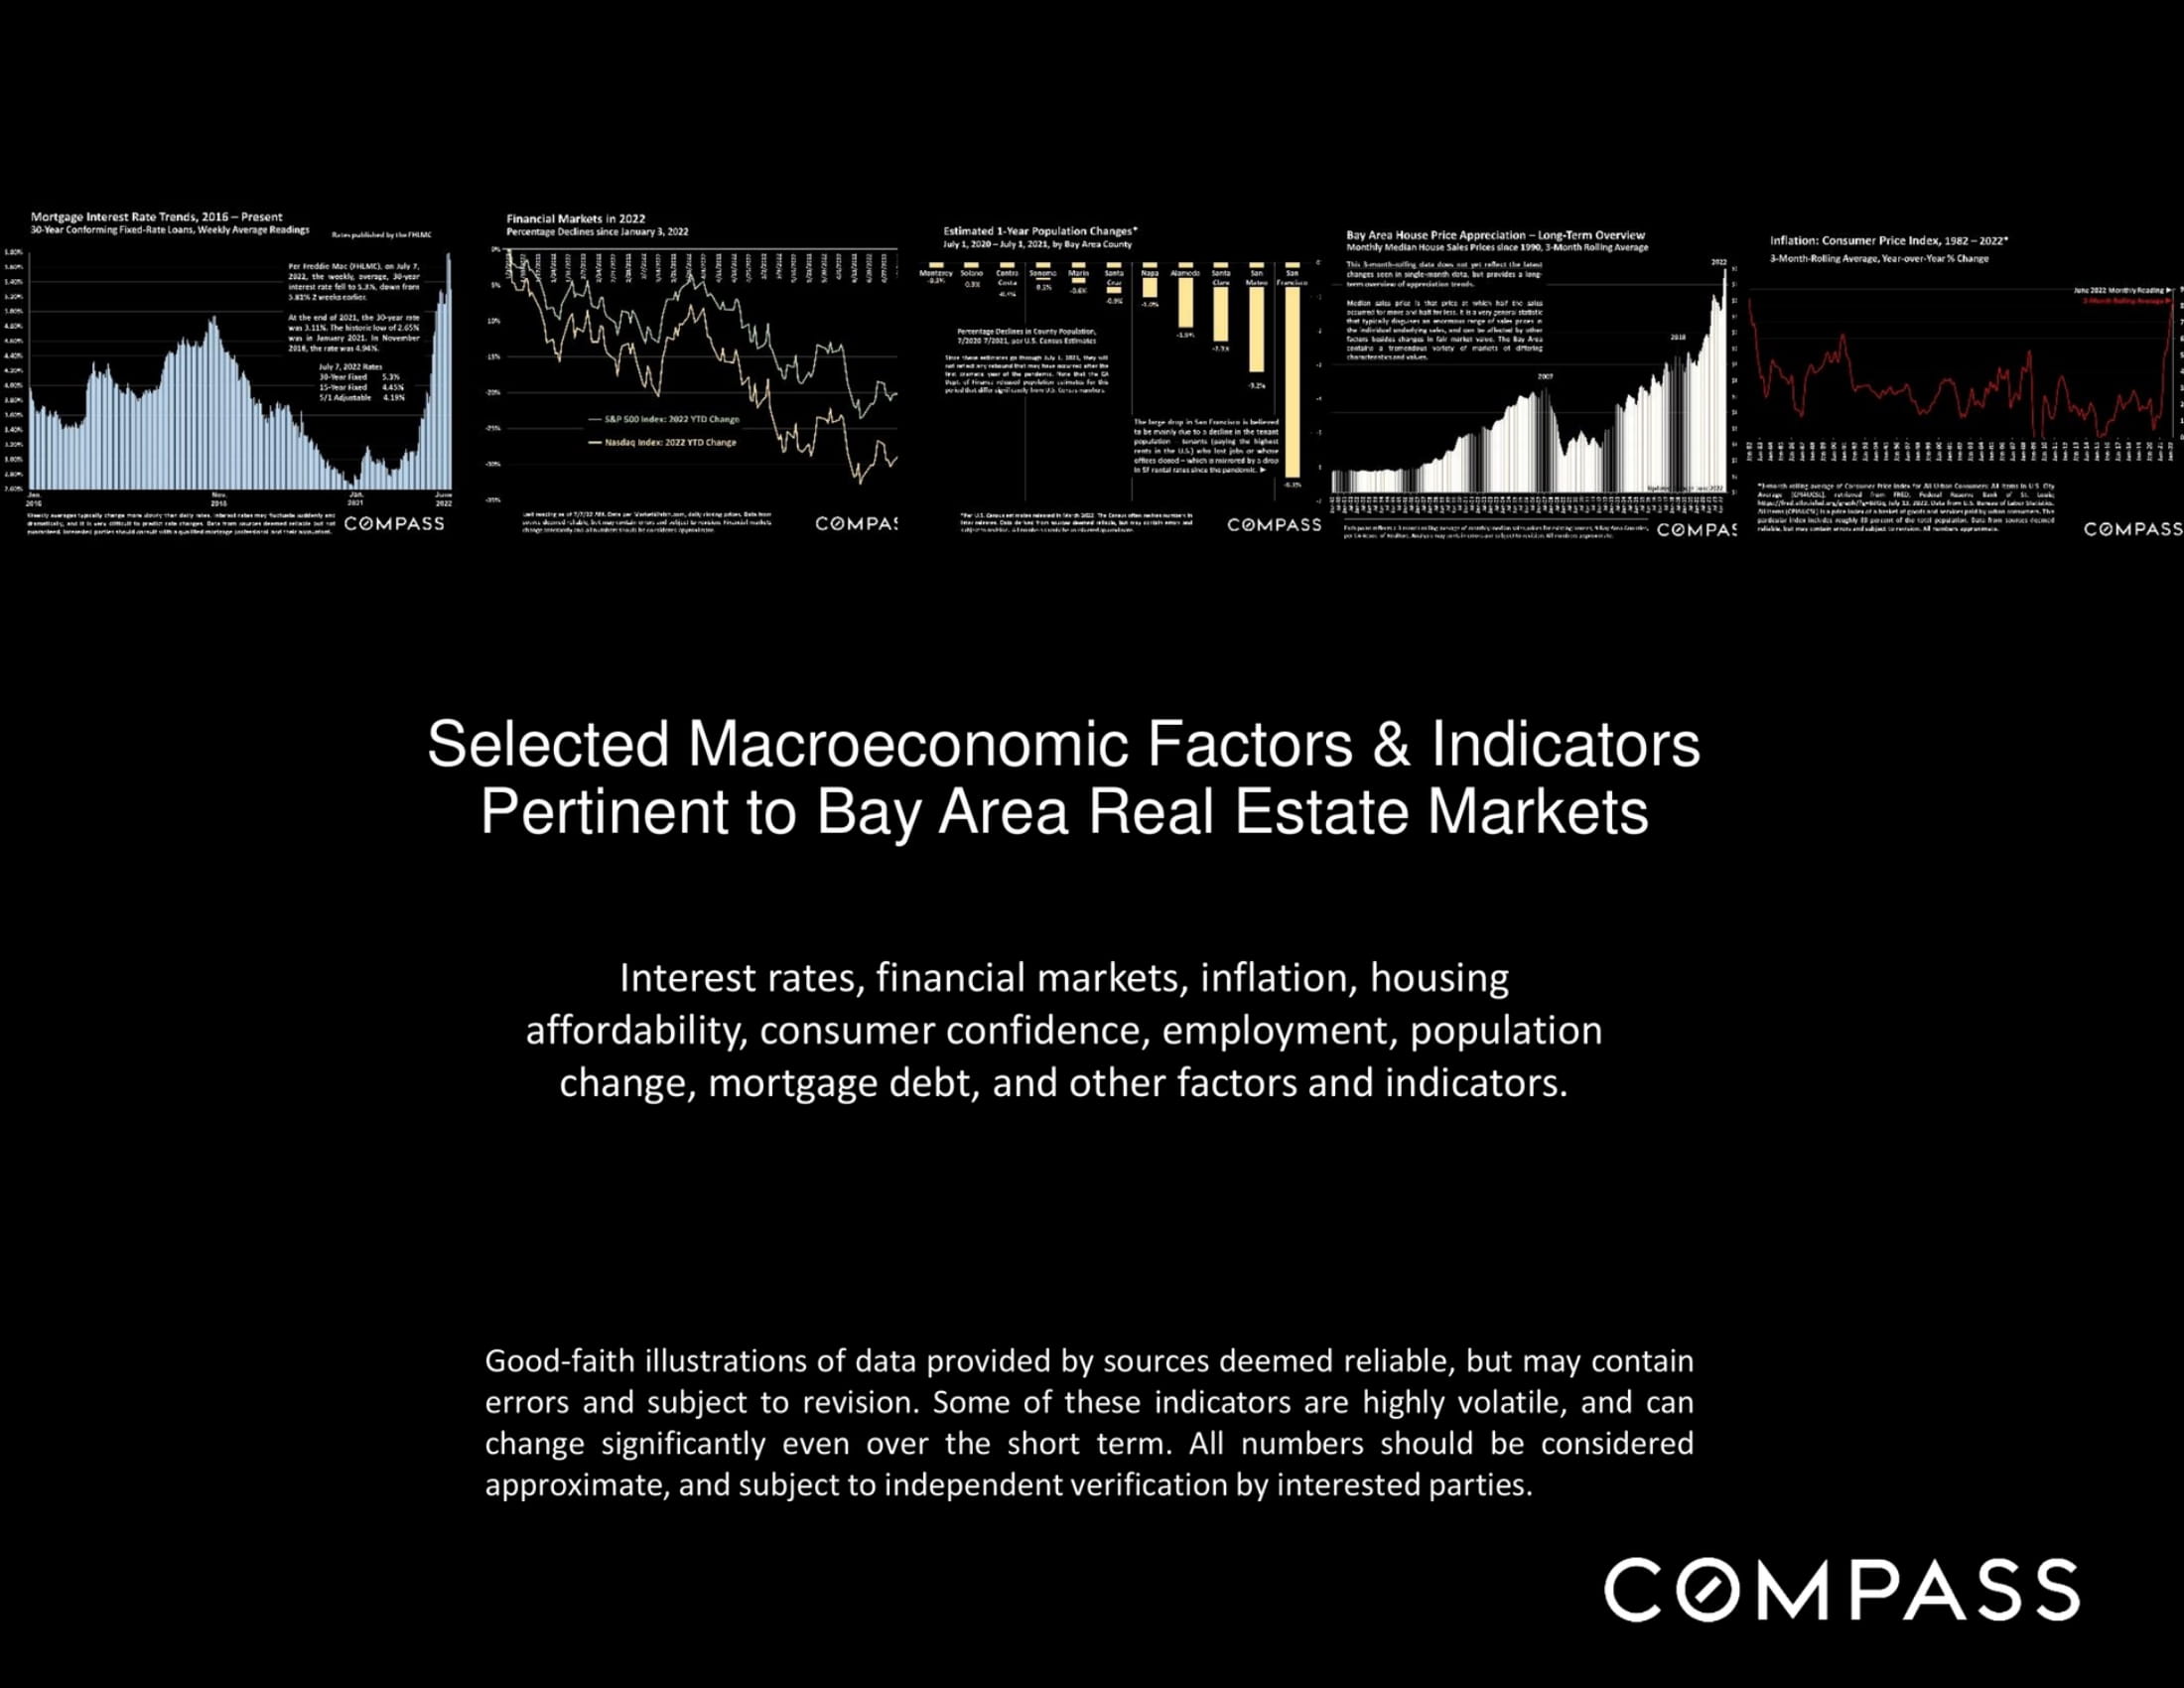
Infographic of Bay Area real estate economic indicators, including mortgage rates, financial markets, population, home prices, and inflation.
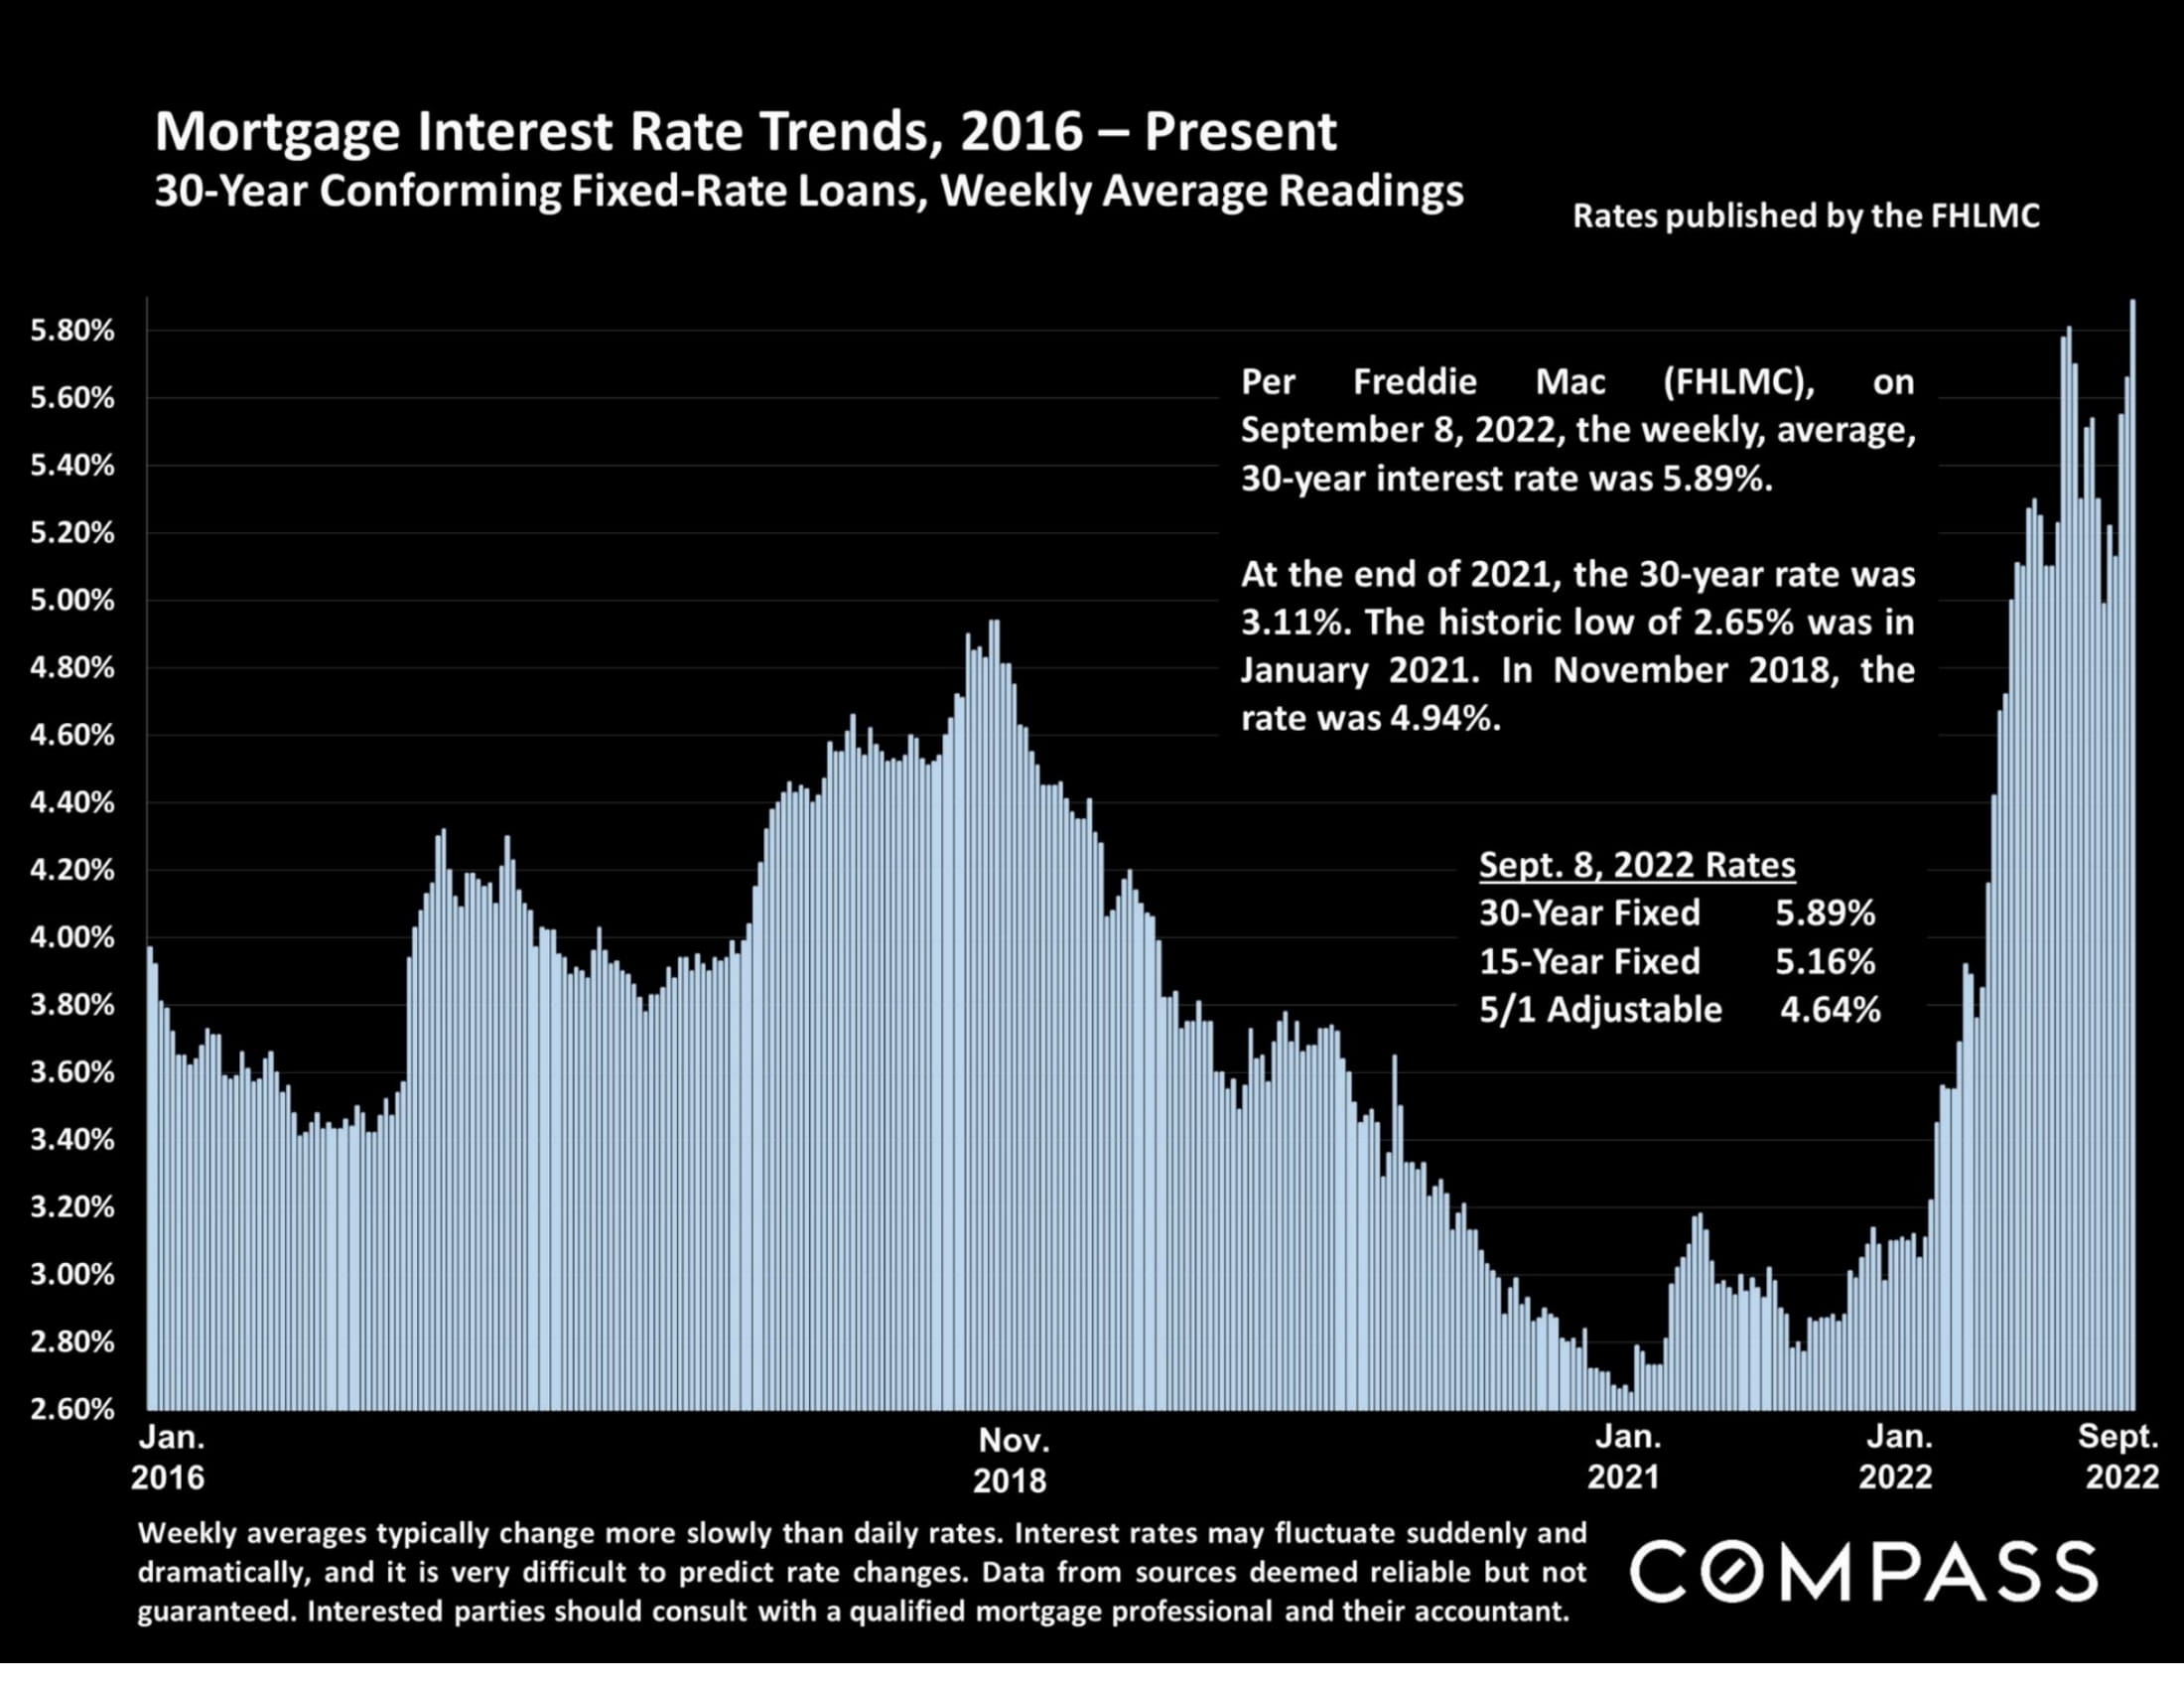
Chart of mortgage rates from 2016 to 2022, showing a sharp rise to 5.89% in September 2022.
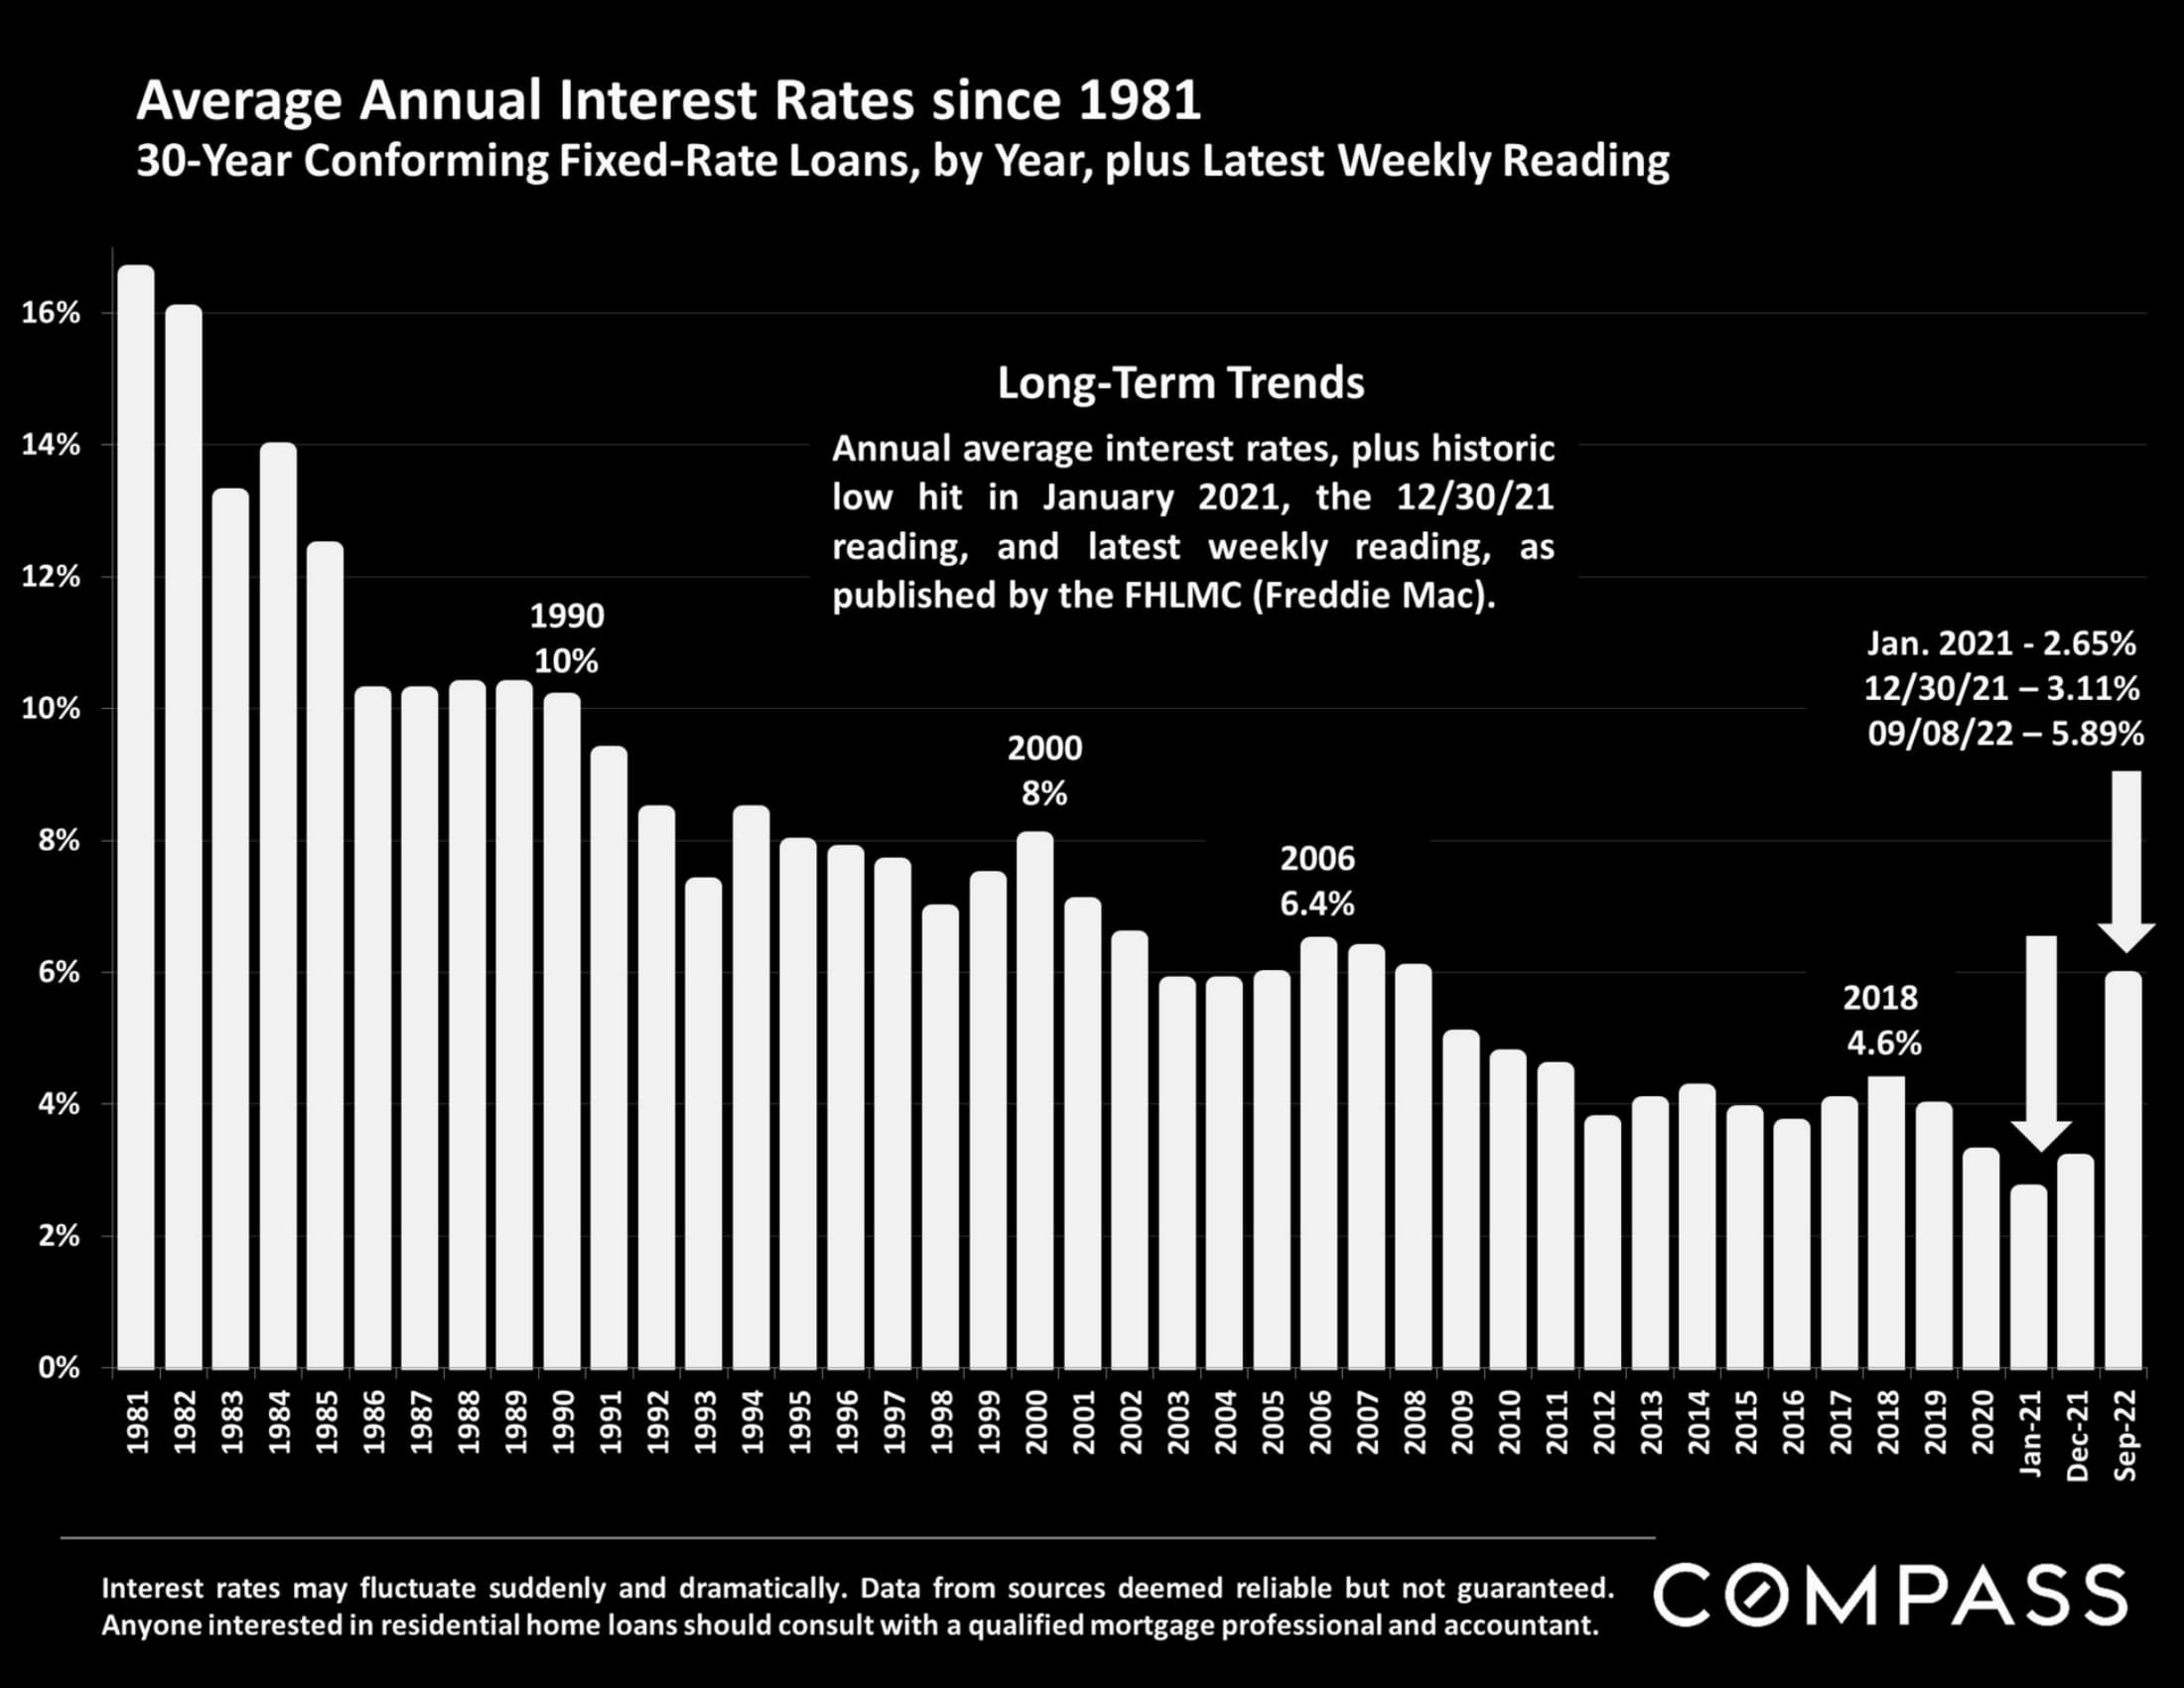
Bar chart of average 30-year fixed mortgage rates, 1981–2022, showing a rise to 5.89% in September 2022.
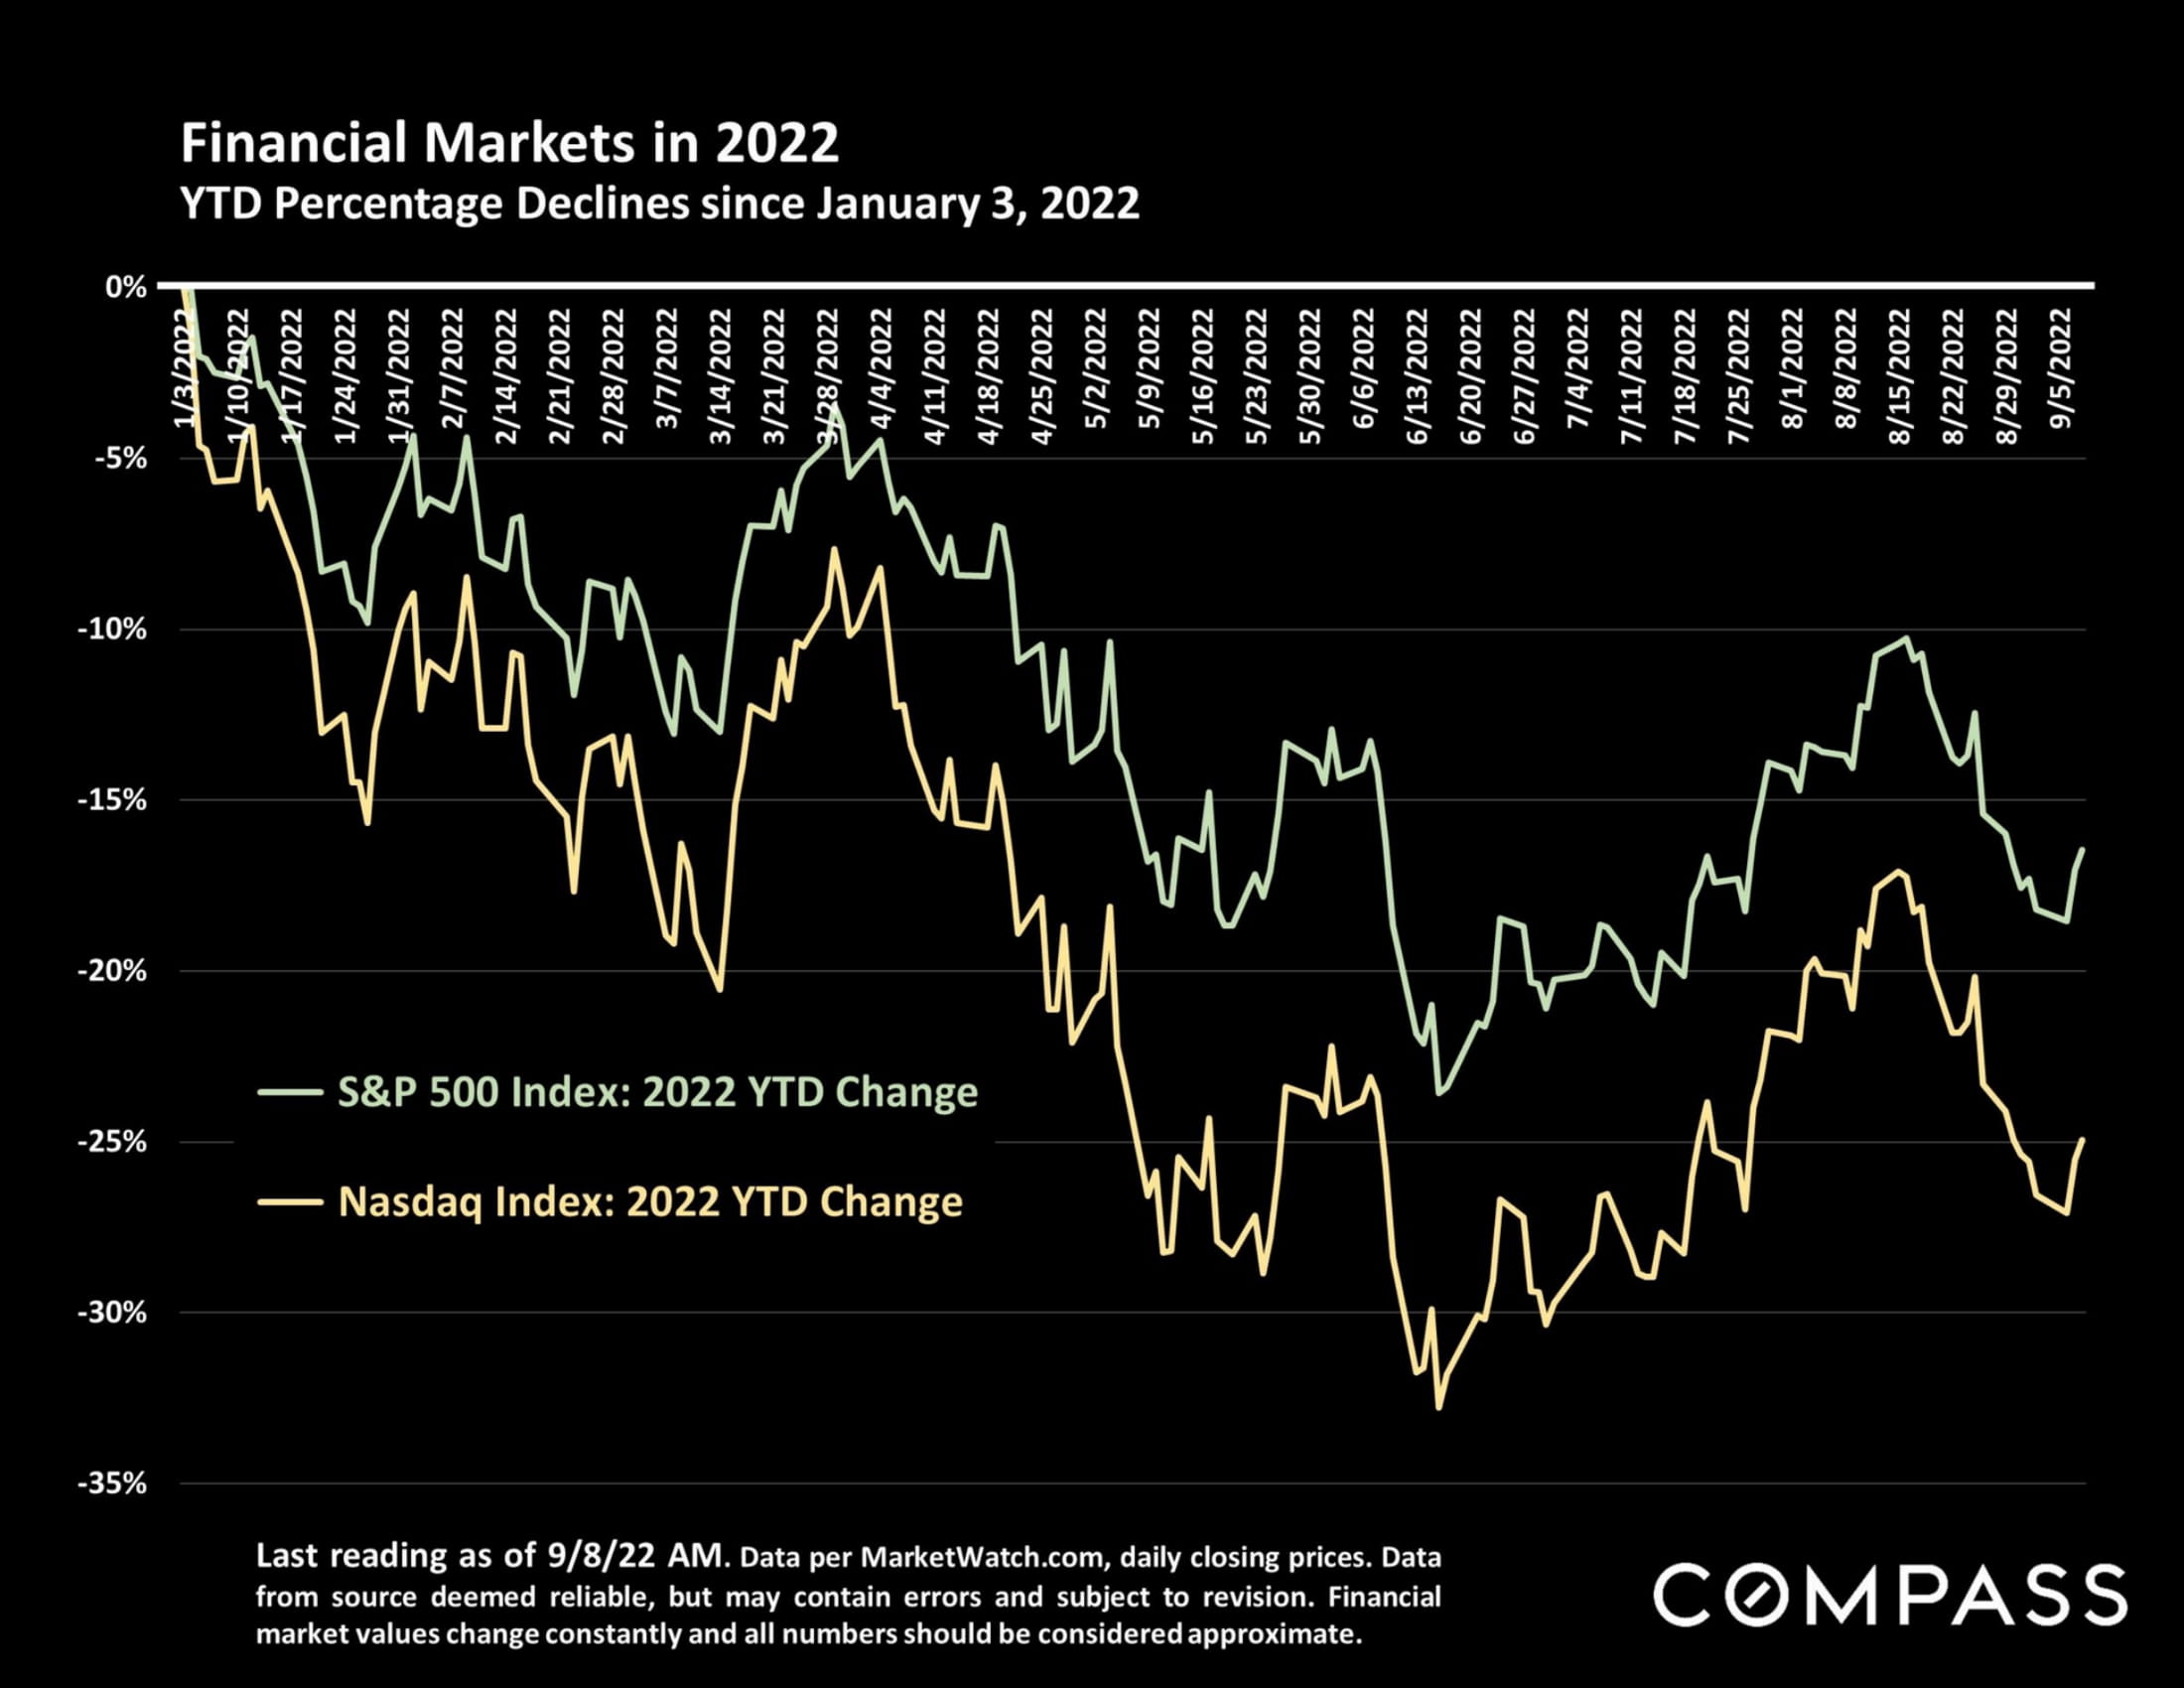
Chart comparing 2022 year-to-date declines in the S&P 500 and Nasdaq through September 8.
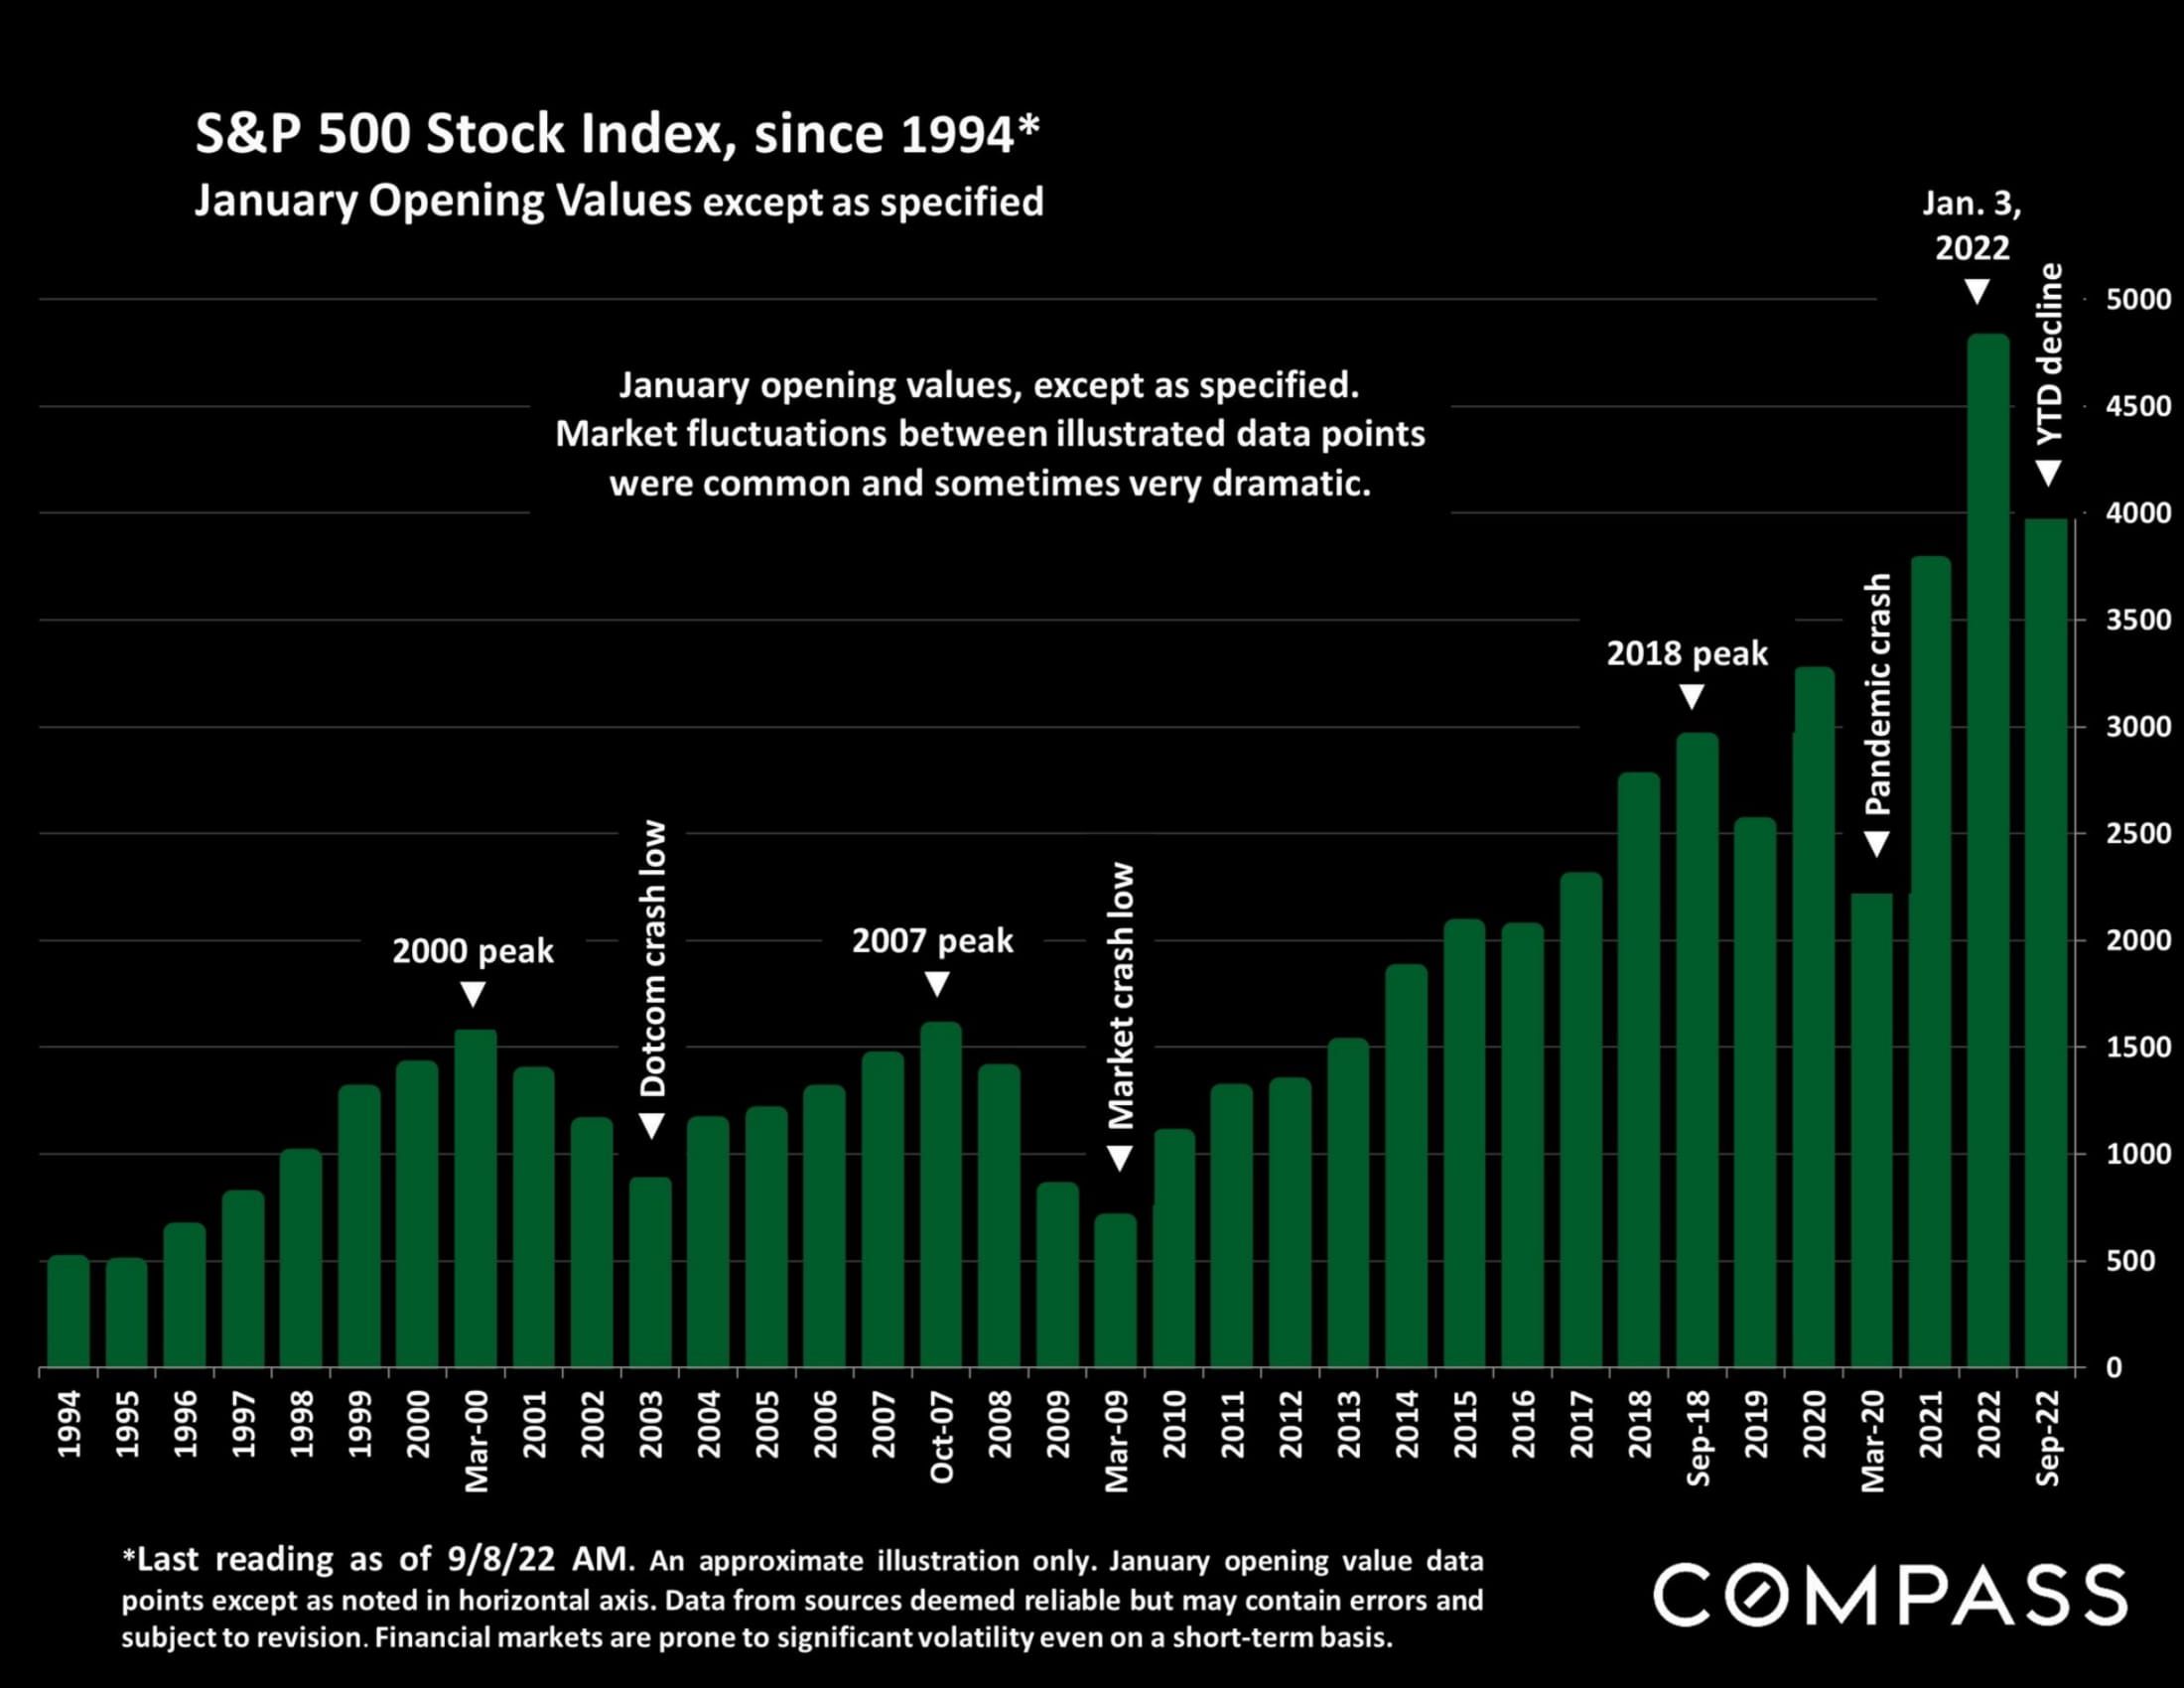
Bar chart of the S&P 500 from 1994 to September 2022, marking market peaks, crashes, and the 2022 decline.
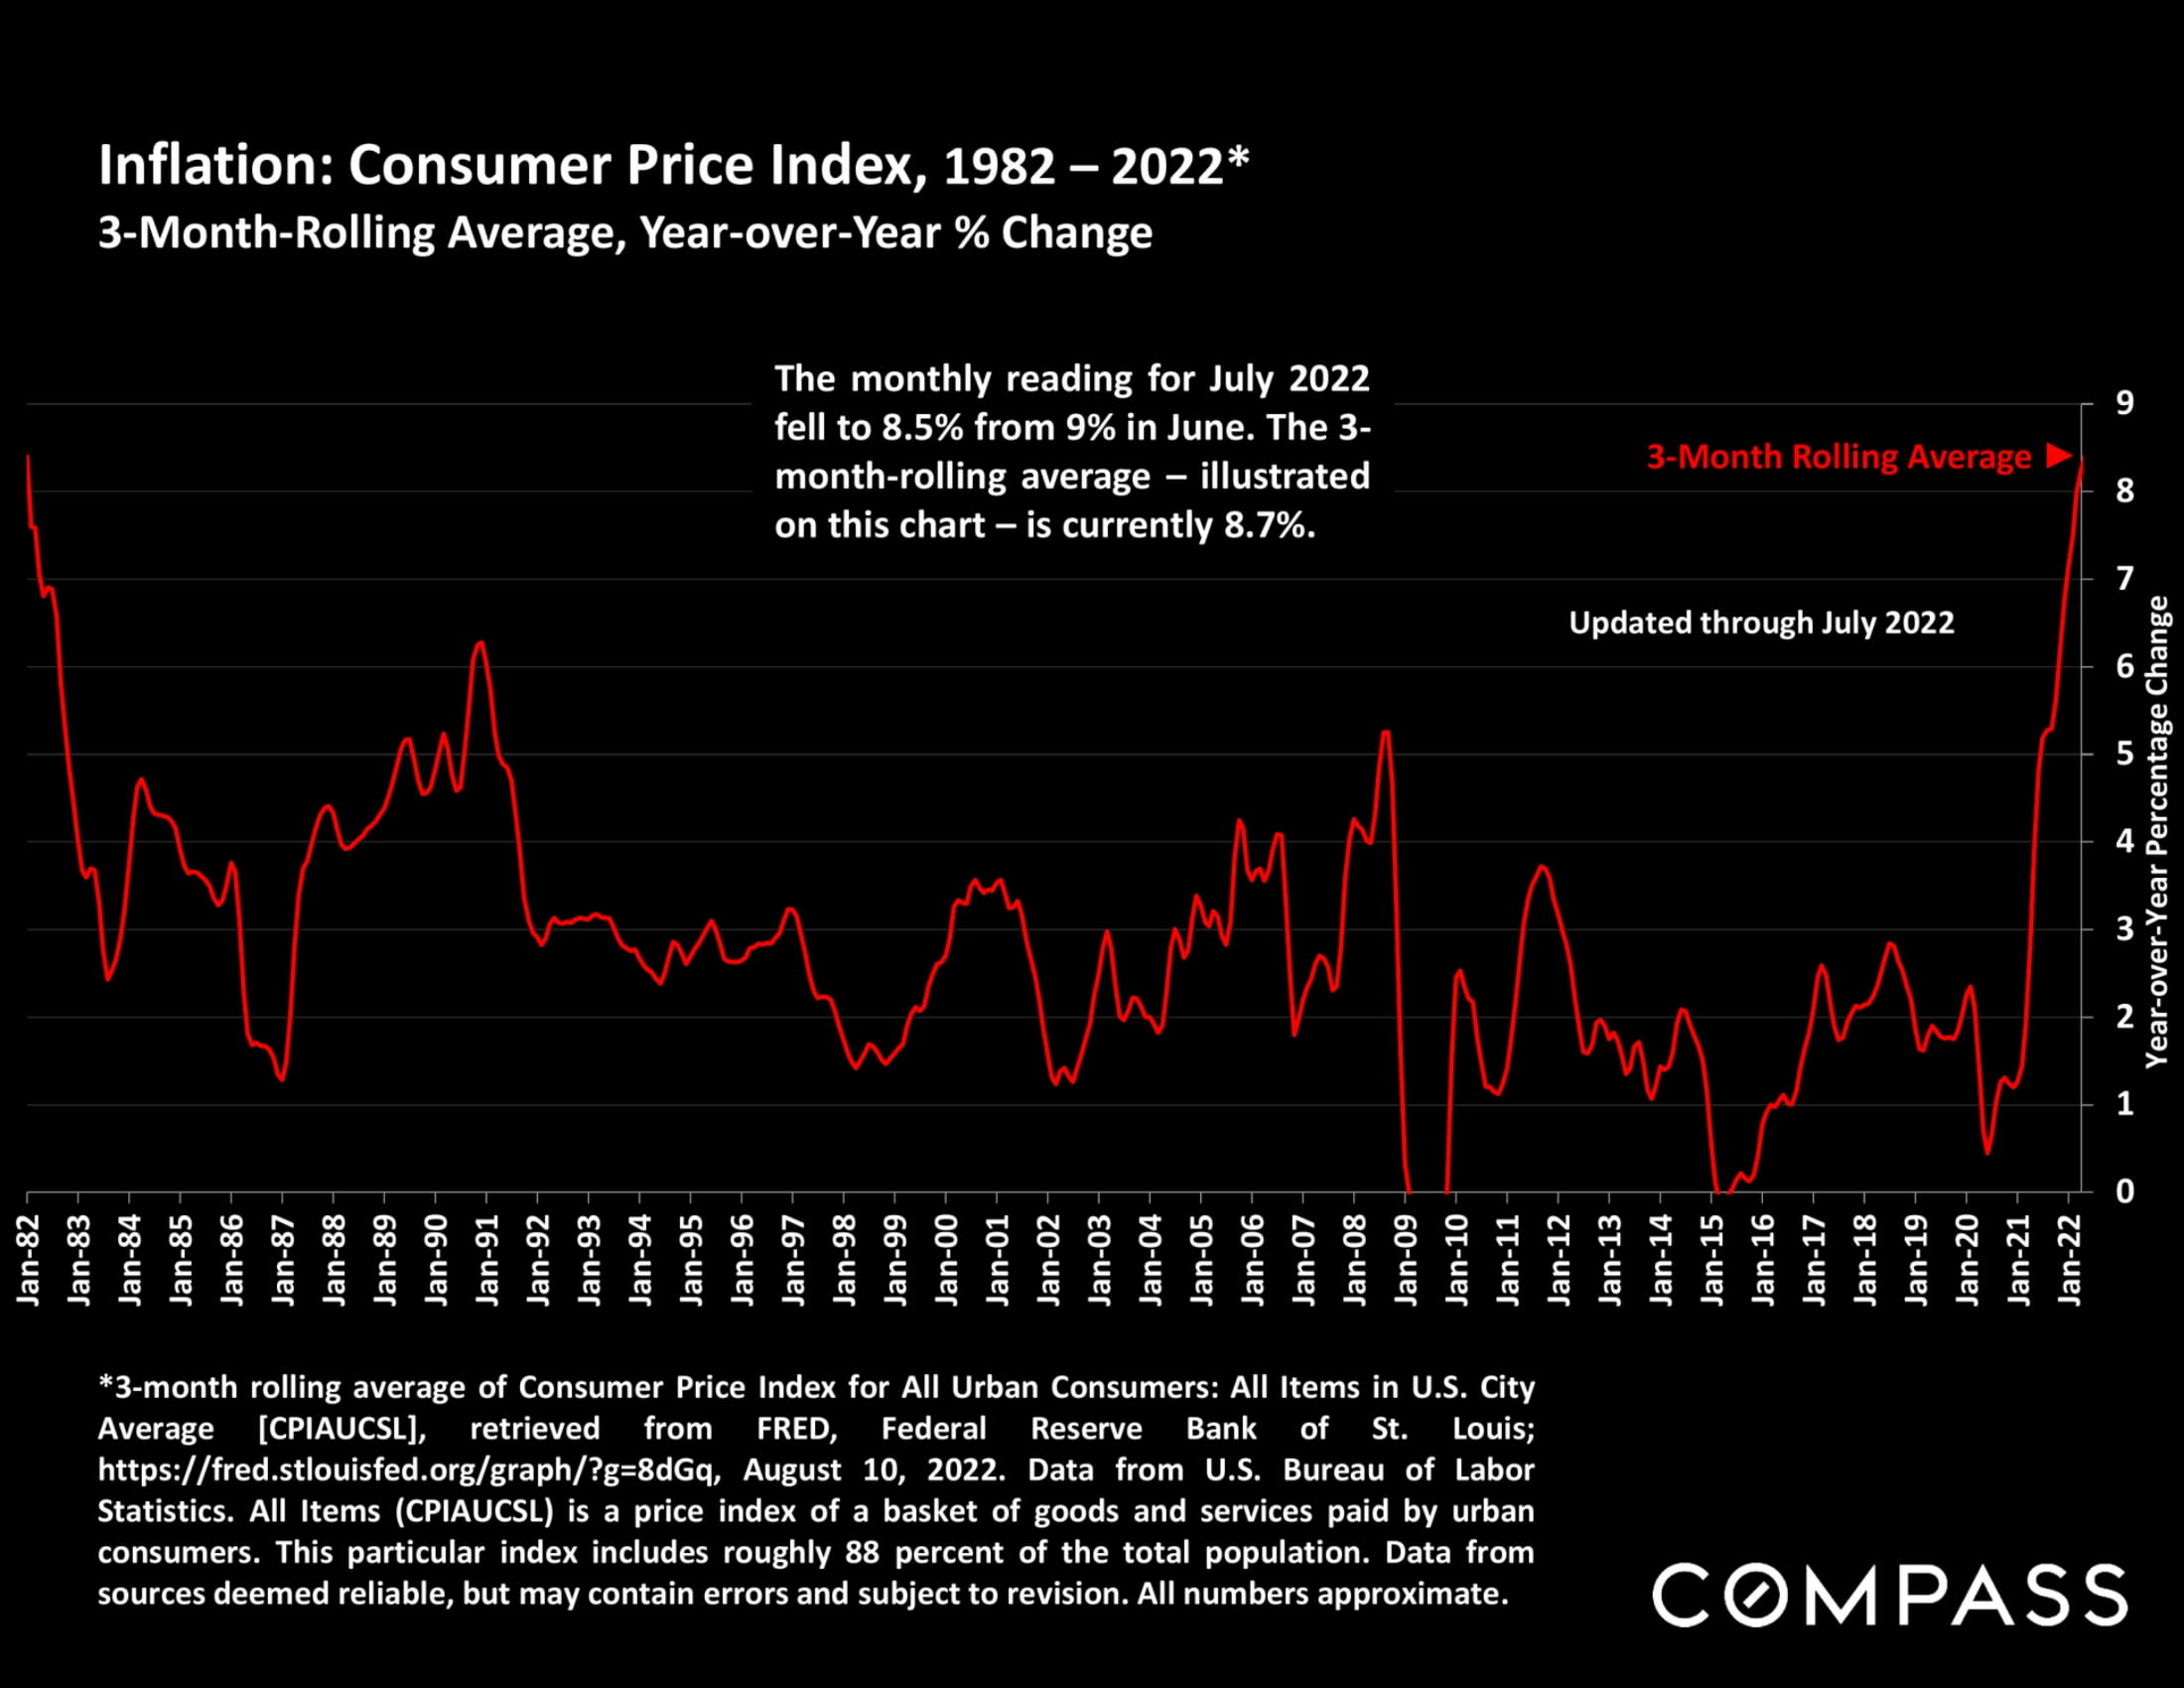
Chart of U.S. CPI inflation from 1982 to 2022, with a red line rising to 8.7% in July 2022.
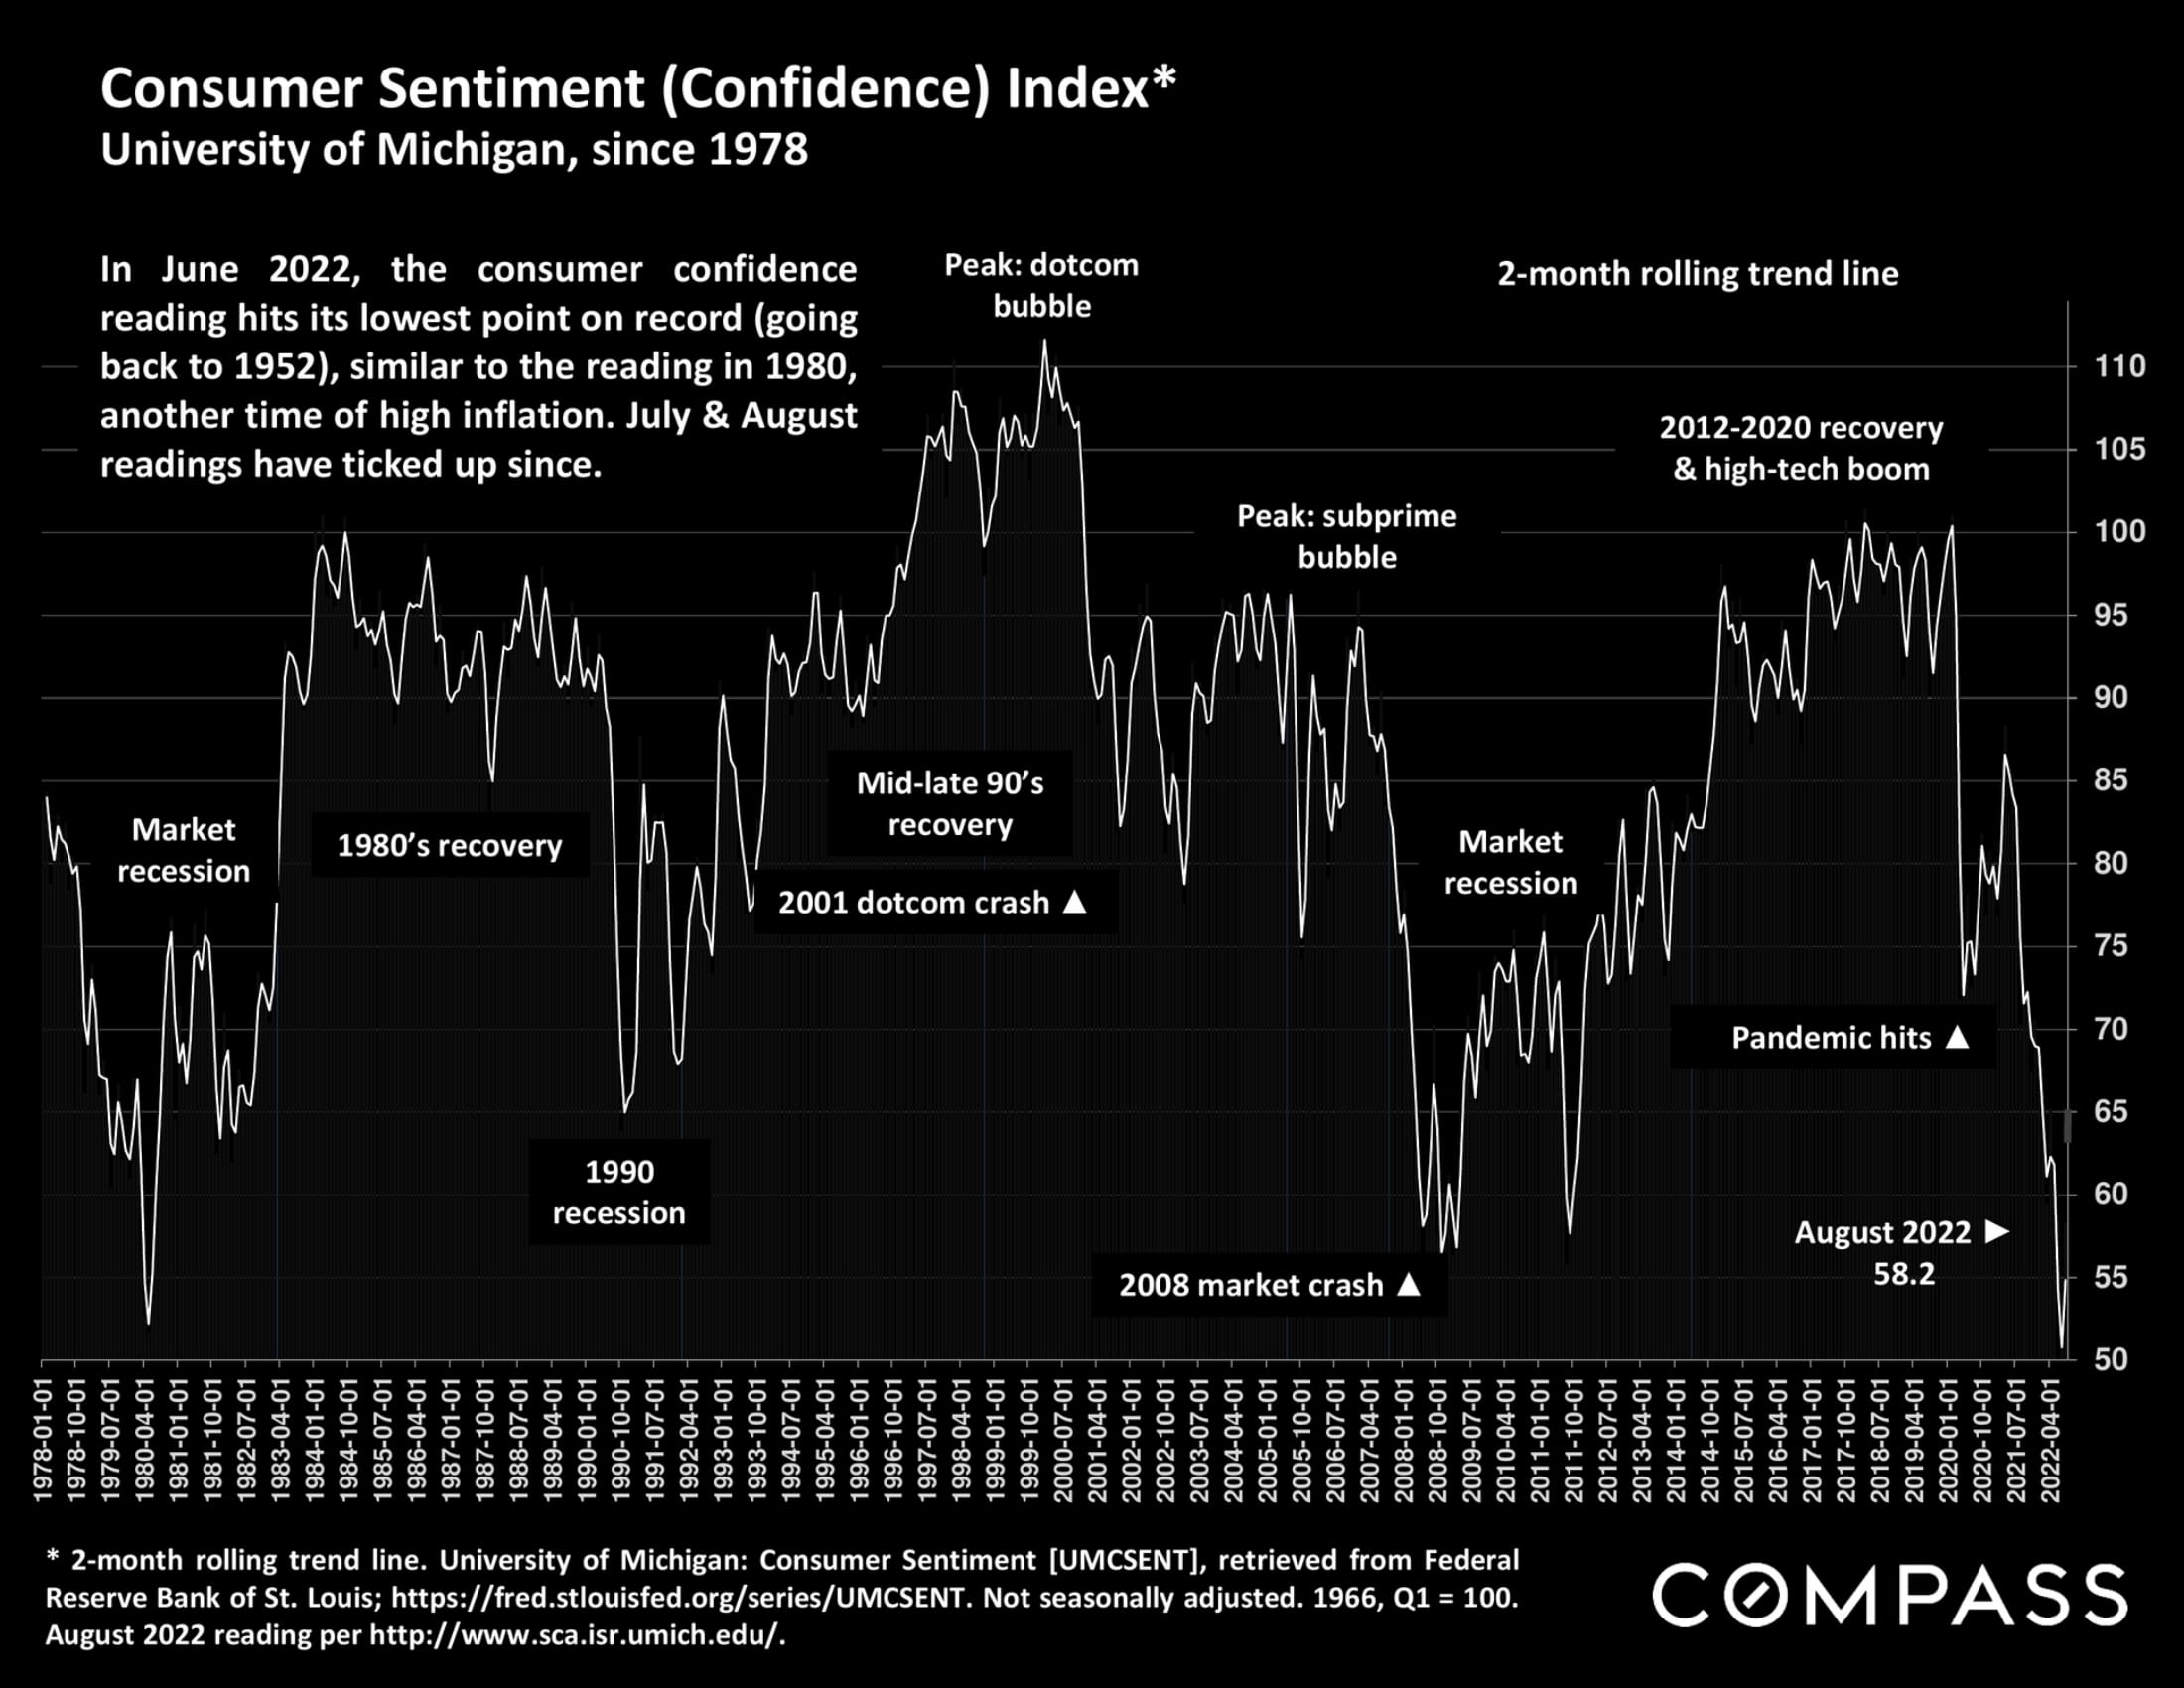
Consumer sentiment index chart from 1978 to August 2022, with recession and market-event annotations.
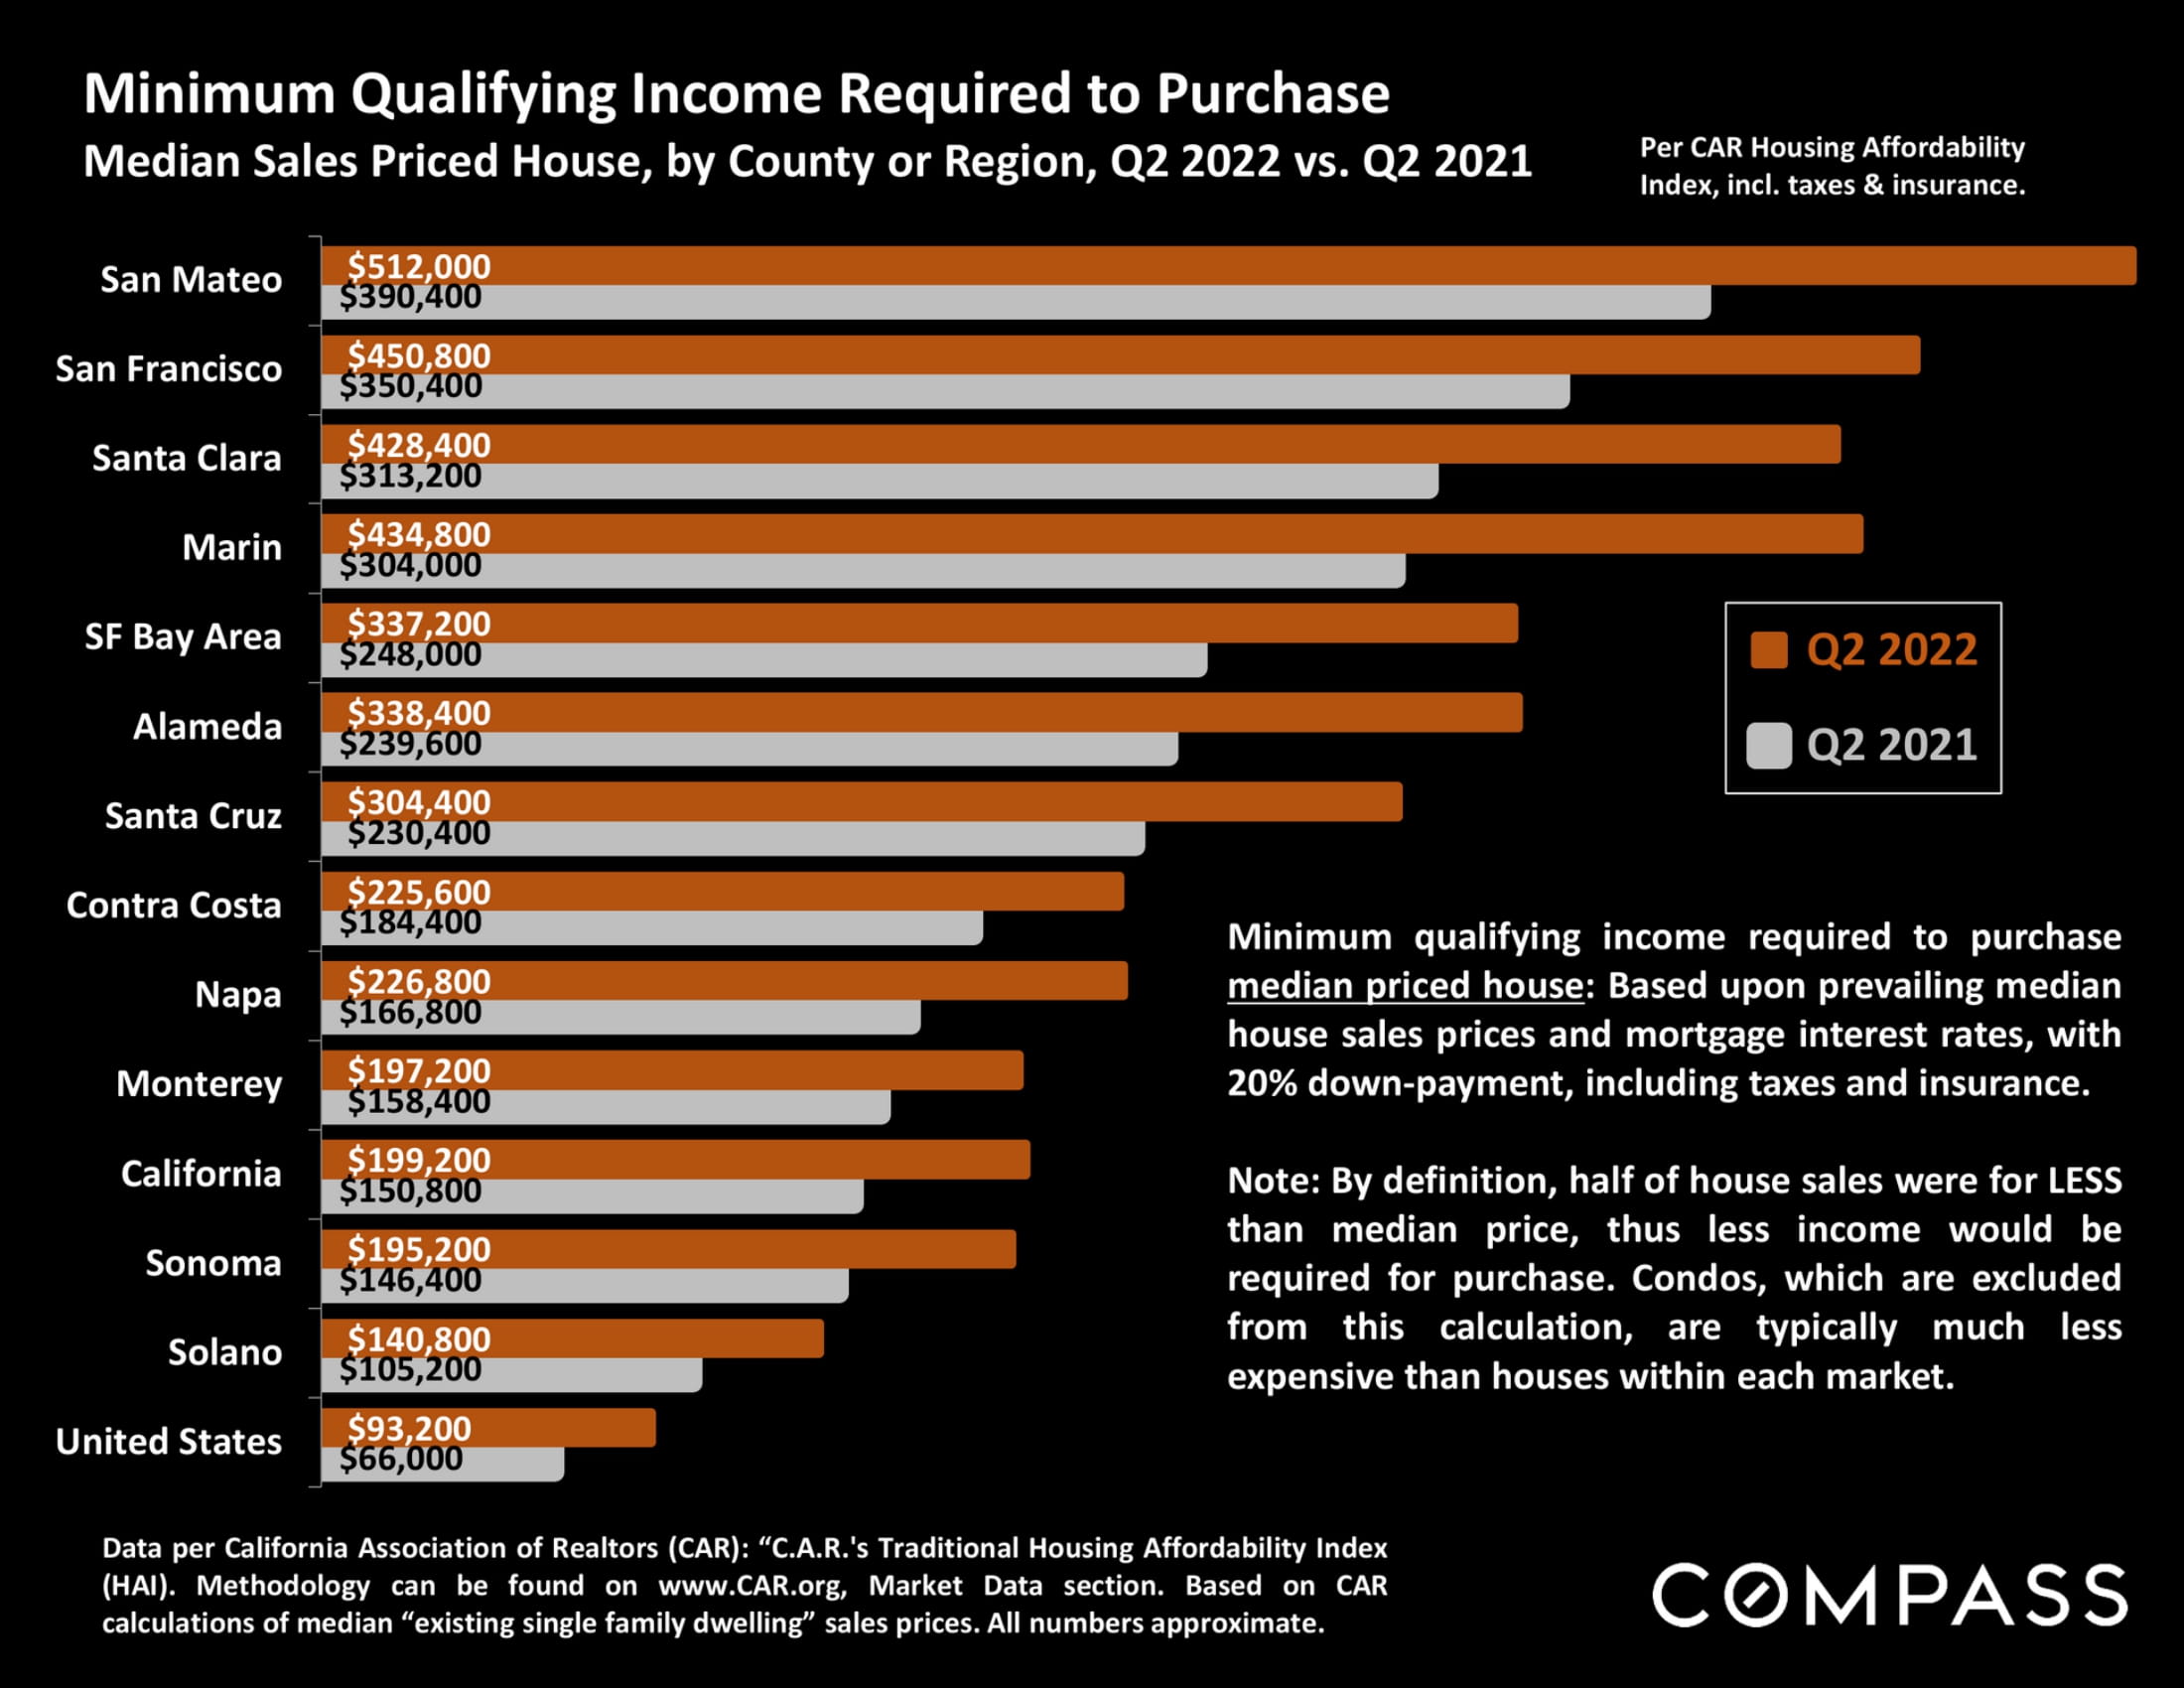
Bar chart comparing minimum income needed to buy a median-priced house in Q2 2022 and Q2 2021 across Bay Area markets.
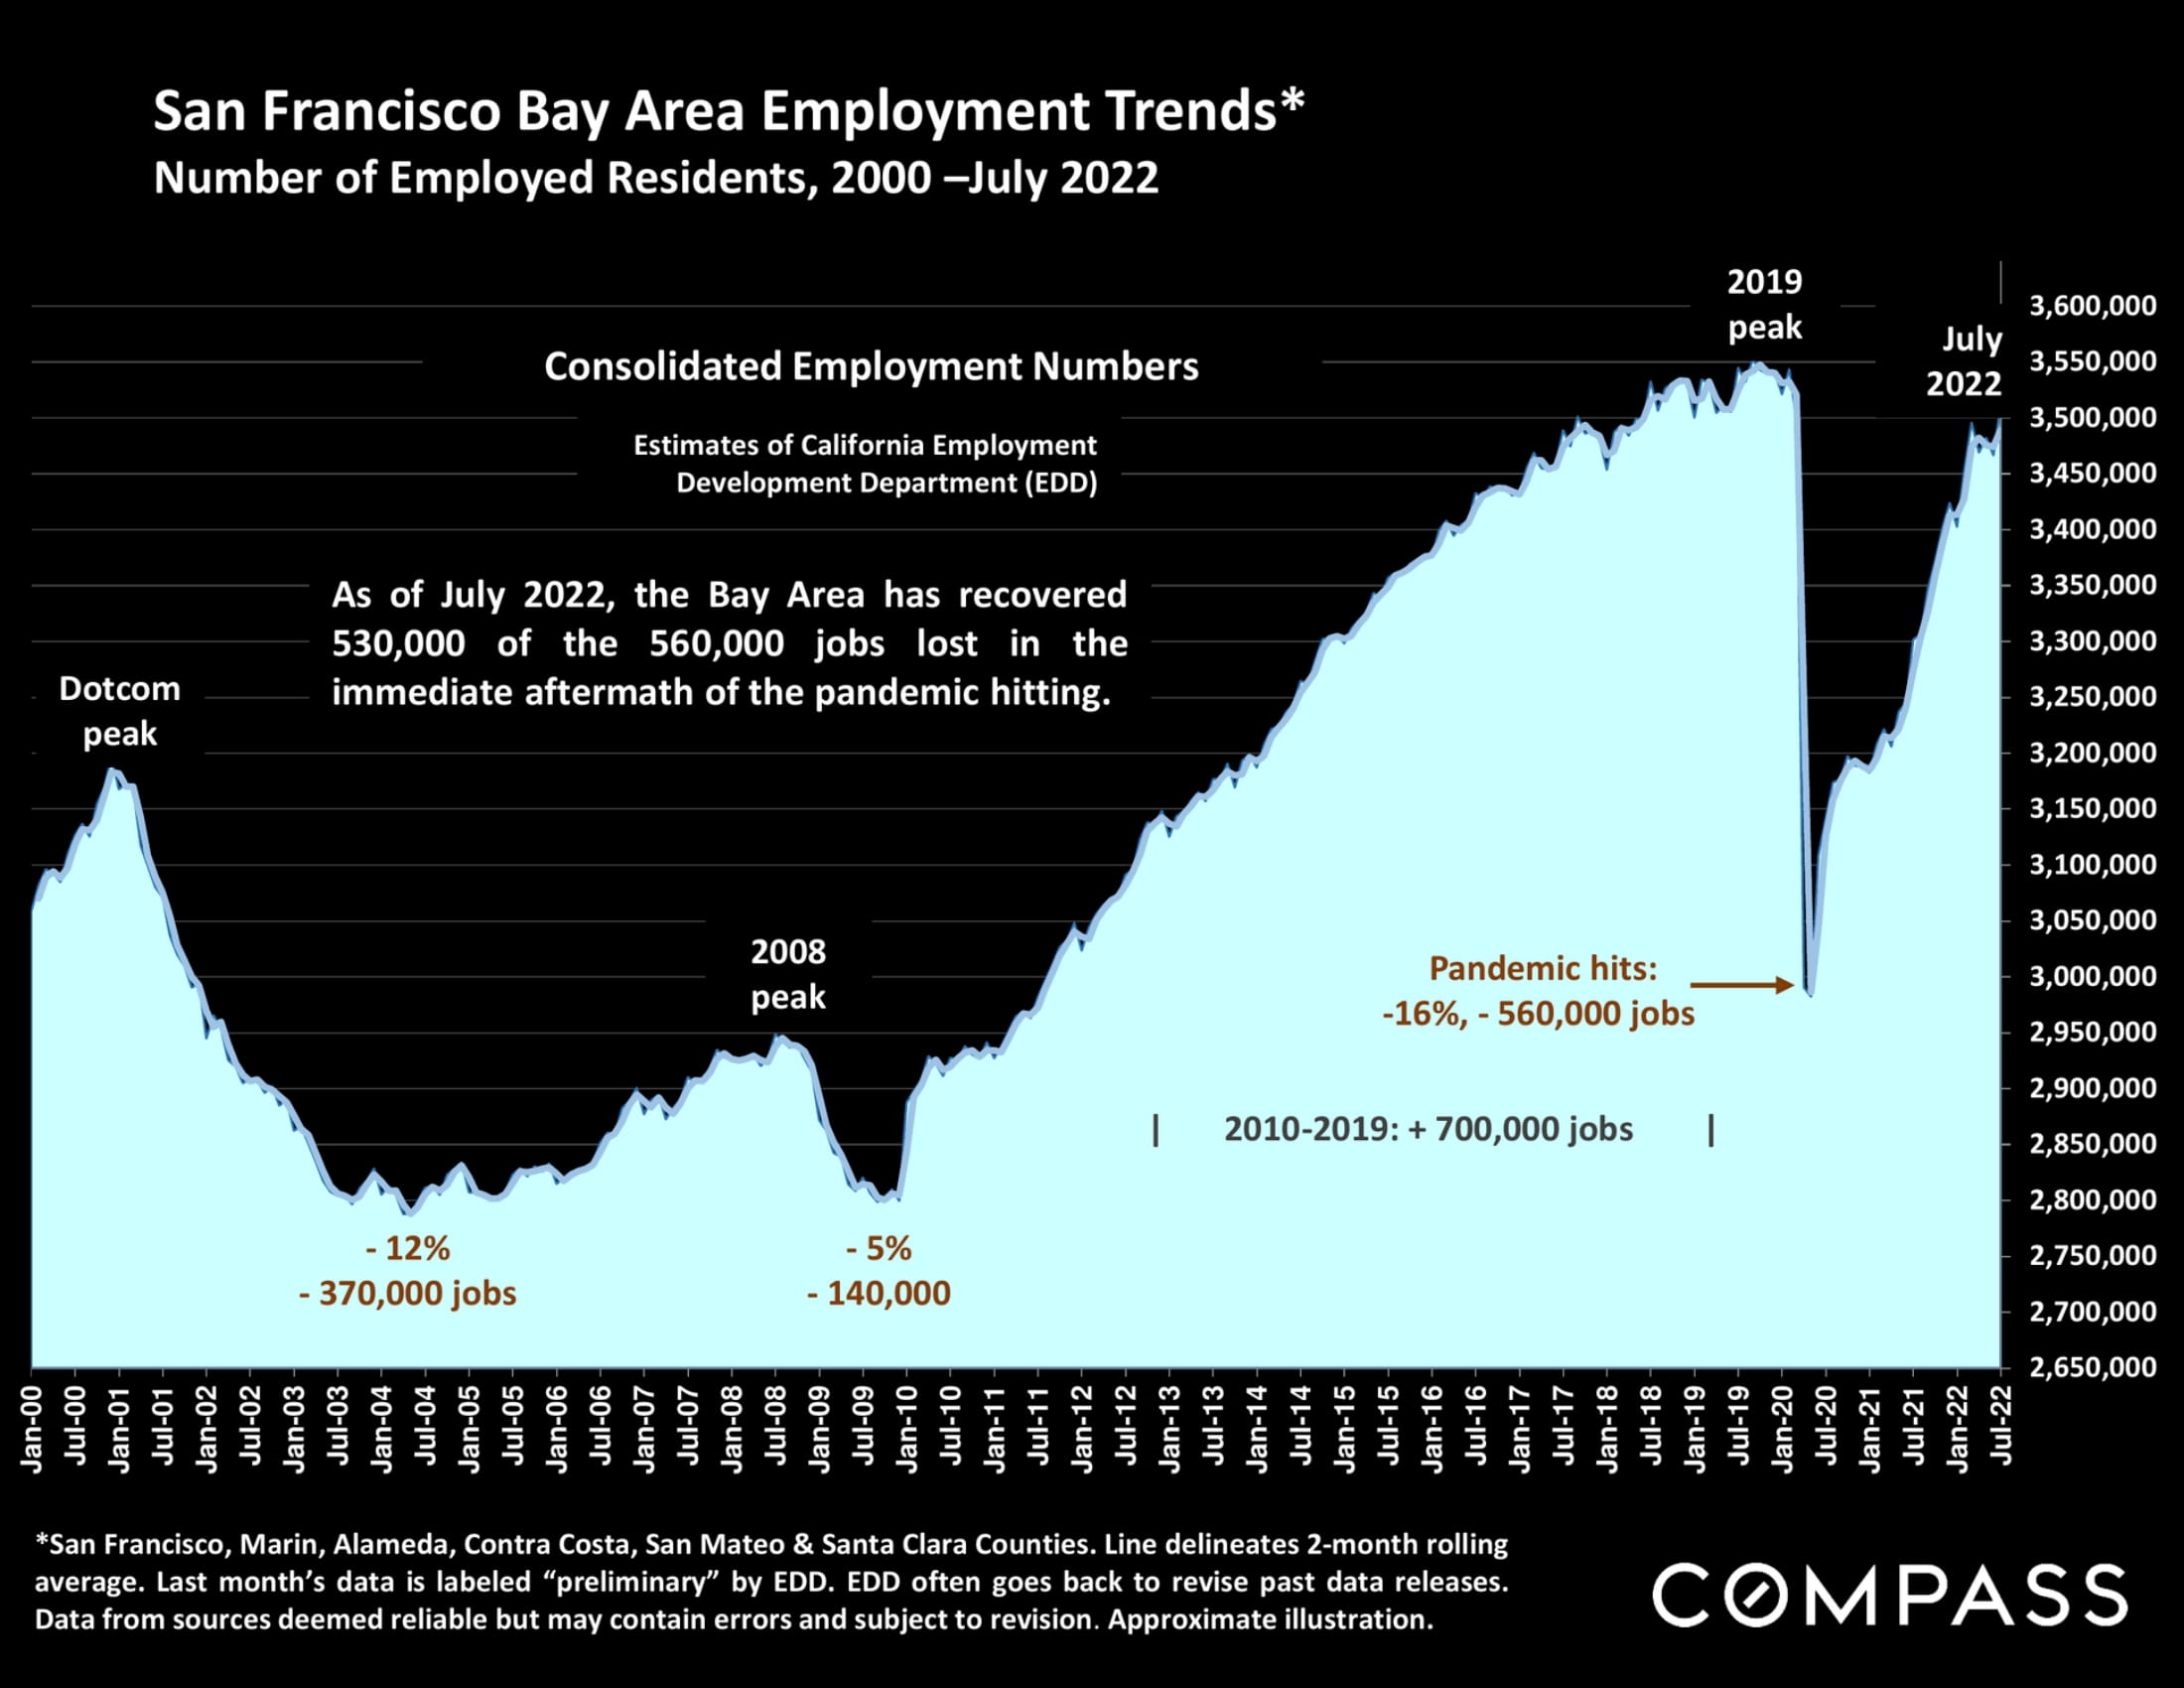
Chart of Bay Area employment from 2000 to July 2022, highlighting the pandemic job loss and subsequent recovery.
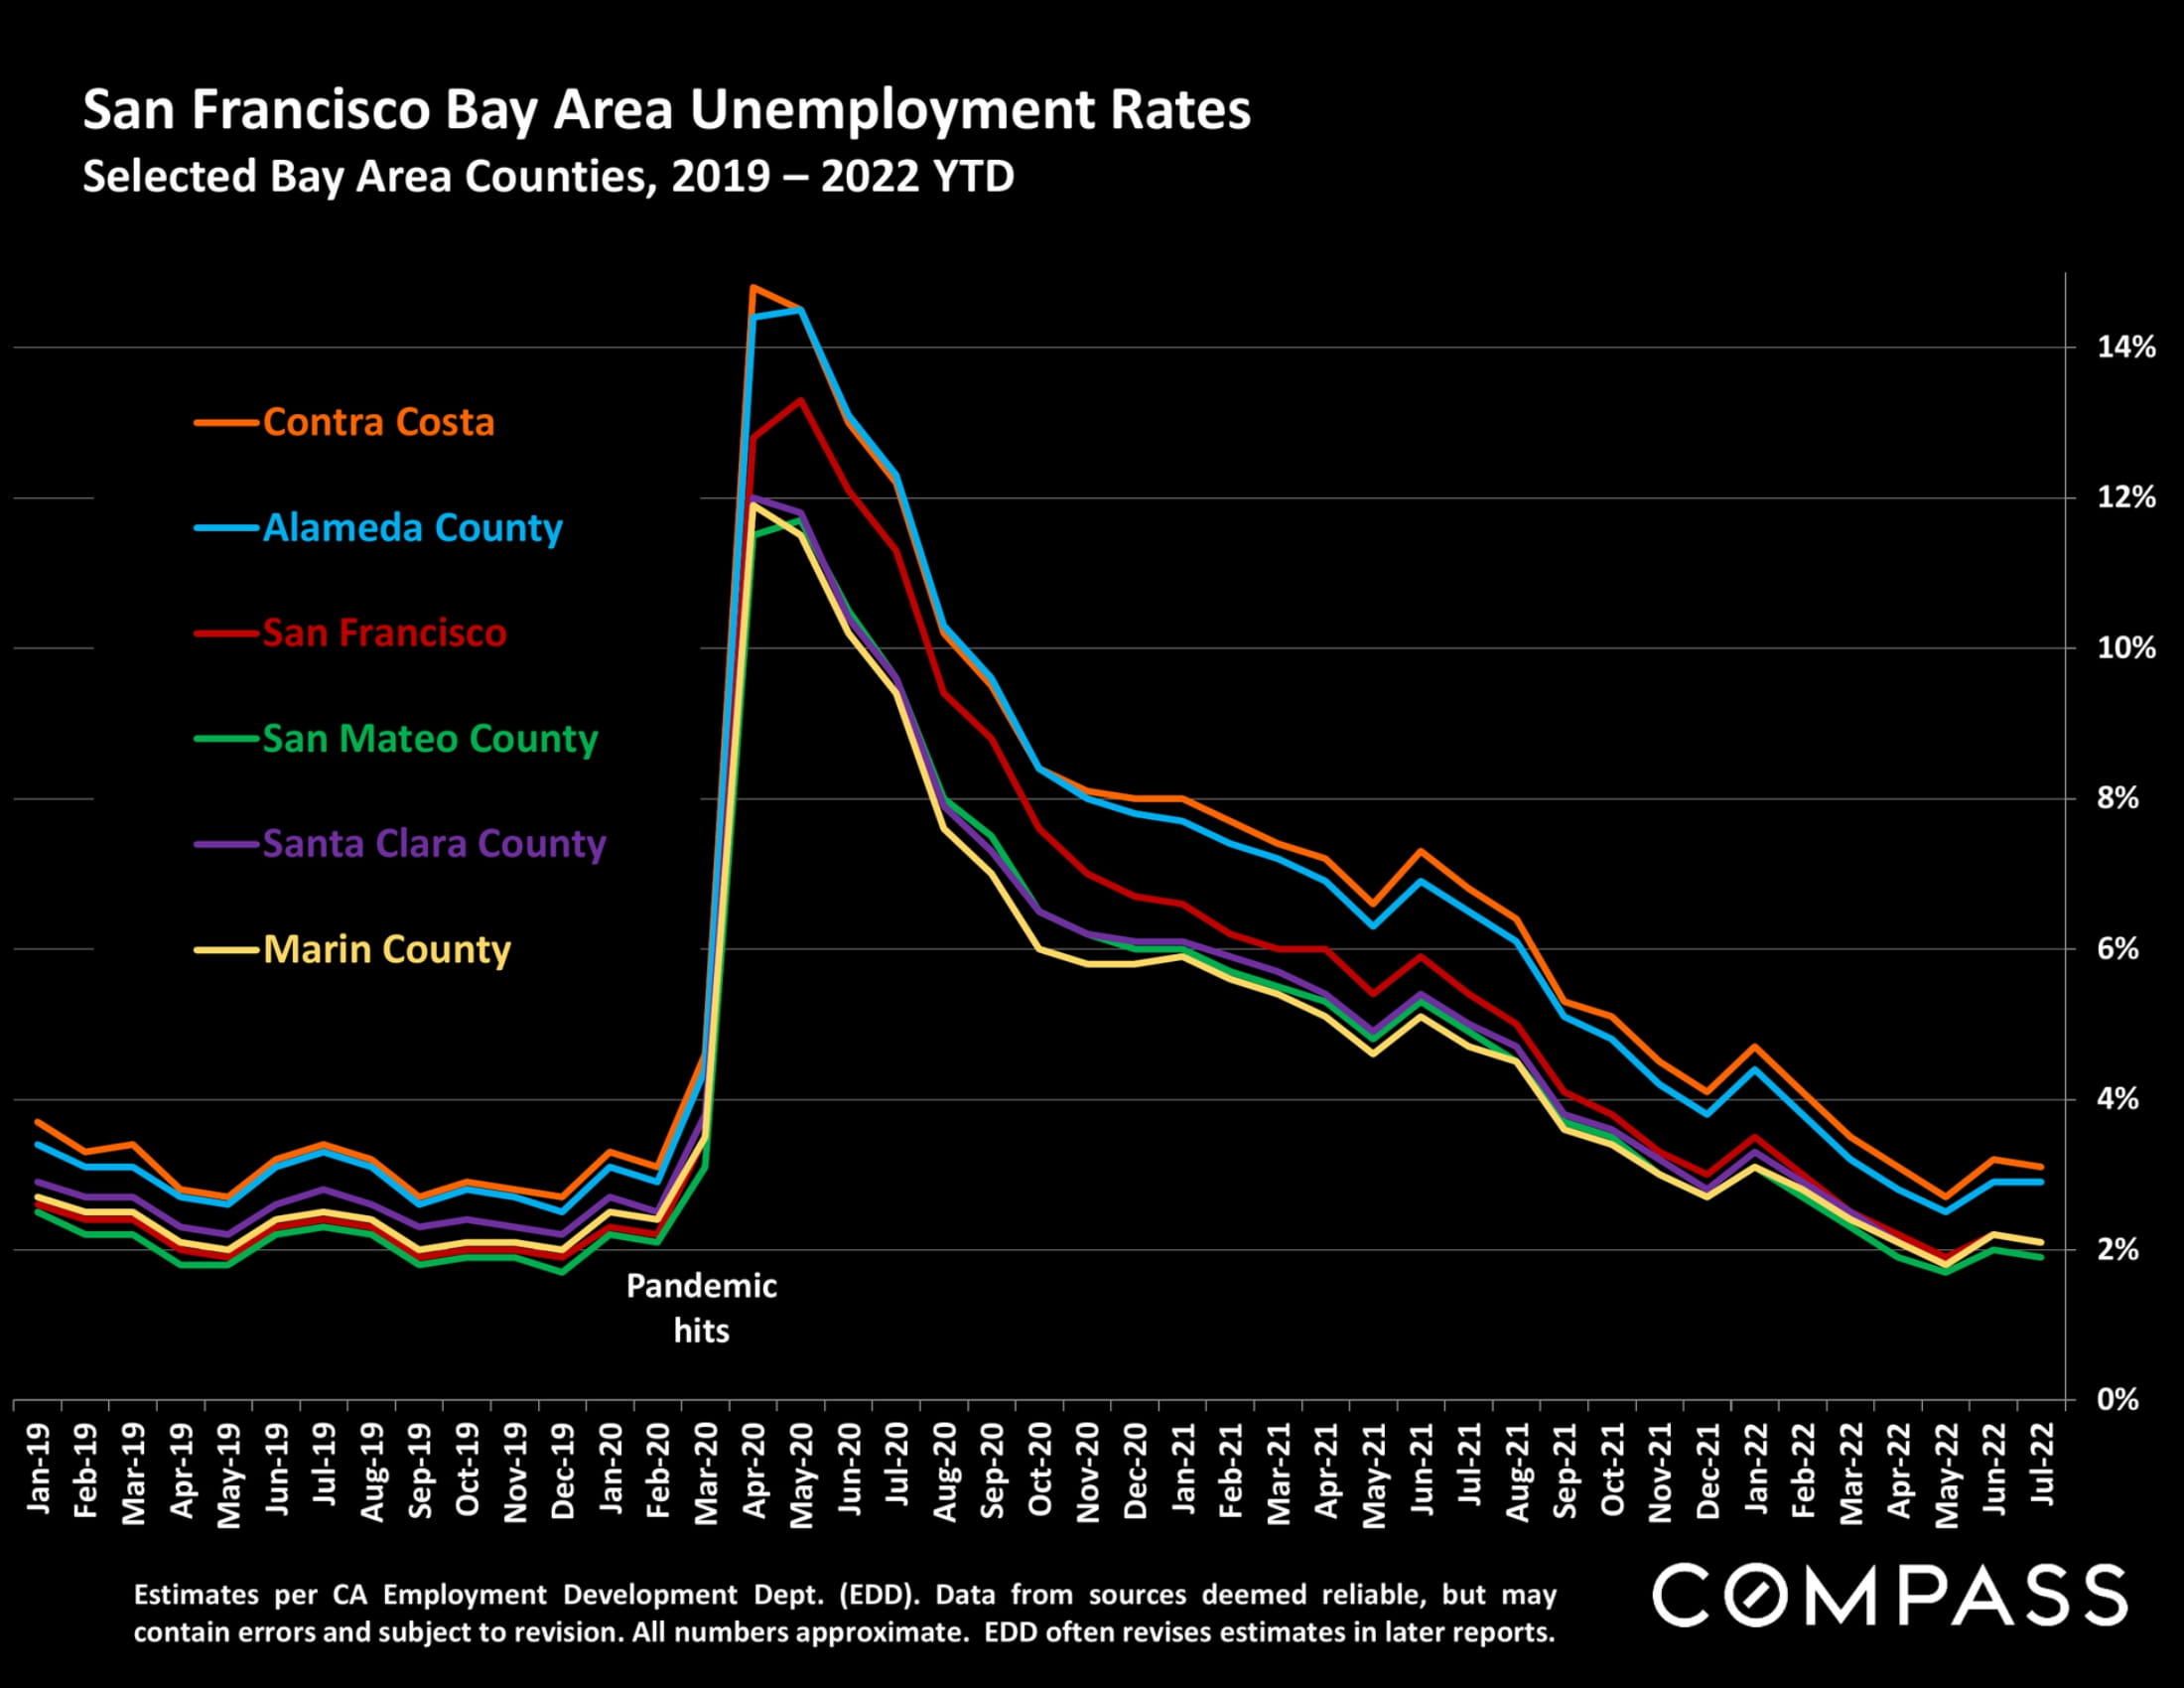
Line chart comparing unemployment rates across six Bay Area counties from 2019 to July 2022, with a pandemic-era spike.
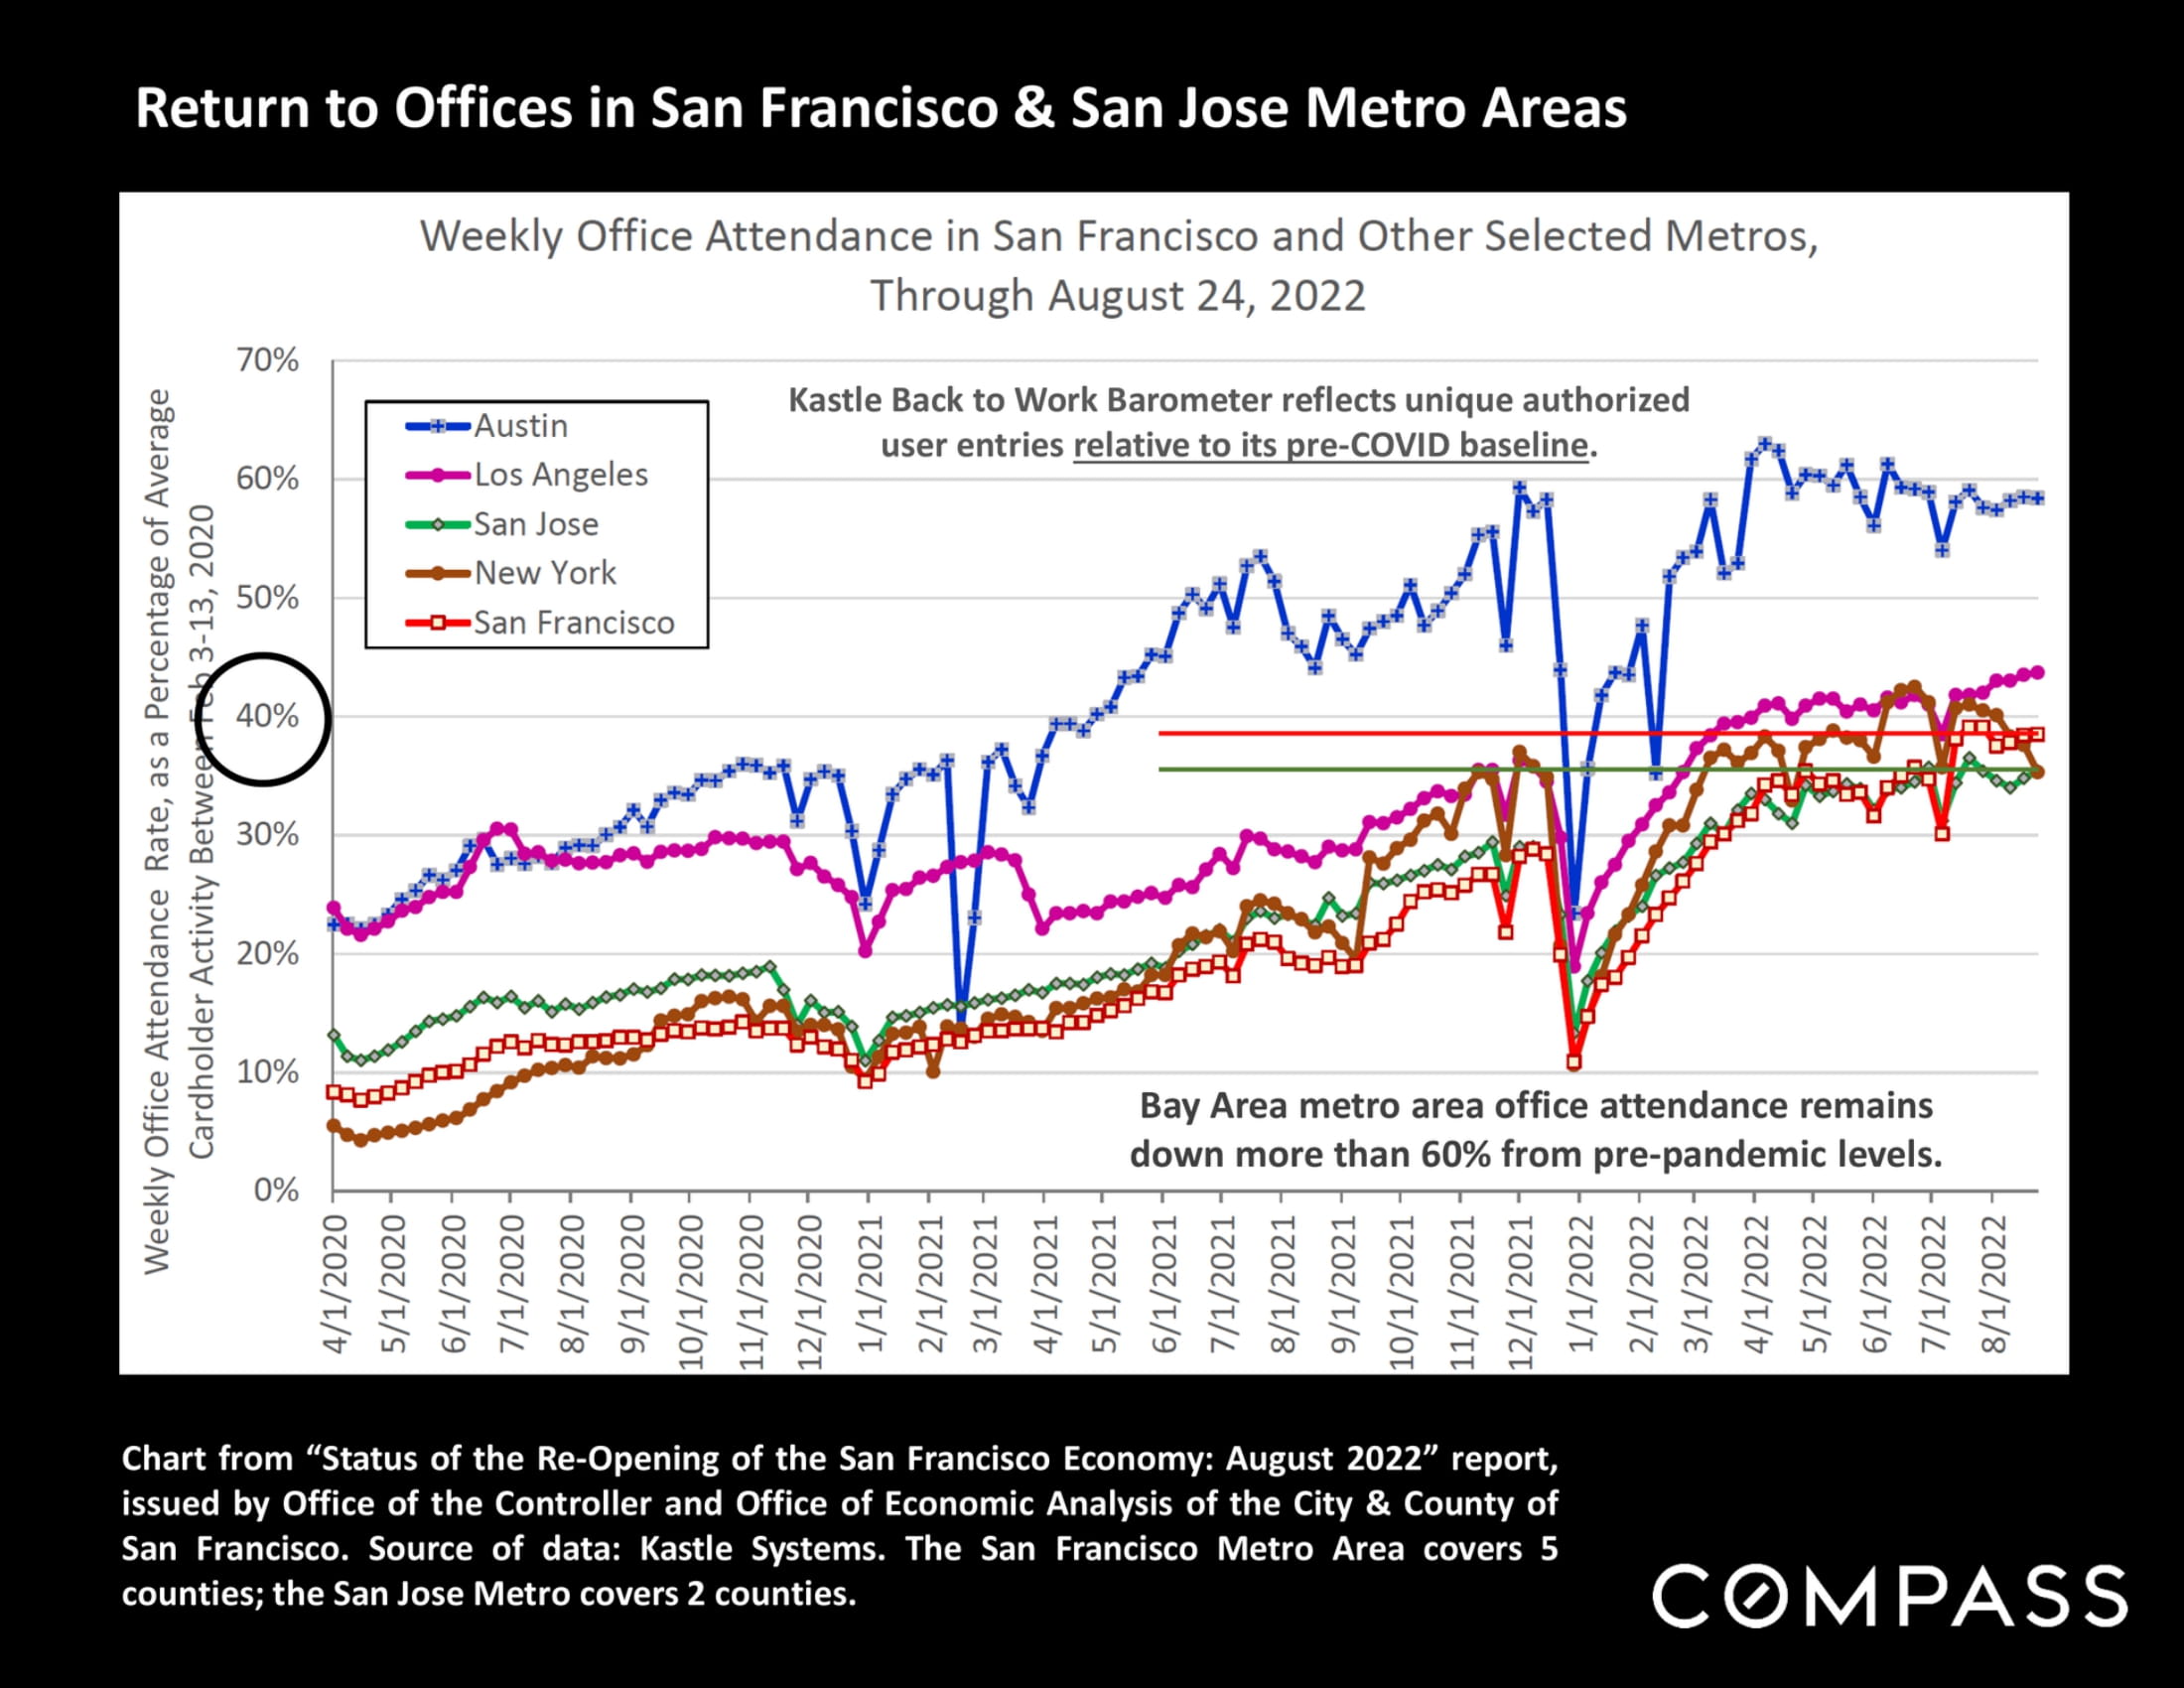
Line chart of weekly office attendance through August 2022; Bay Area attendance remains over 60% below pre-pandemic levels.
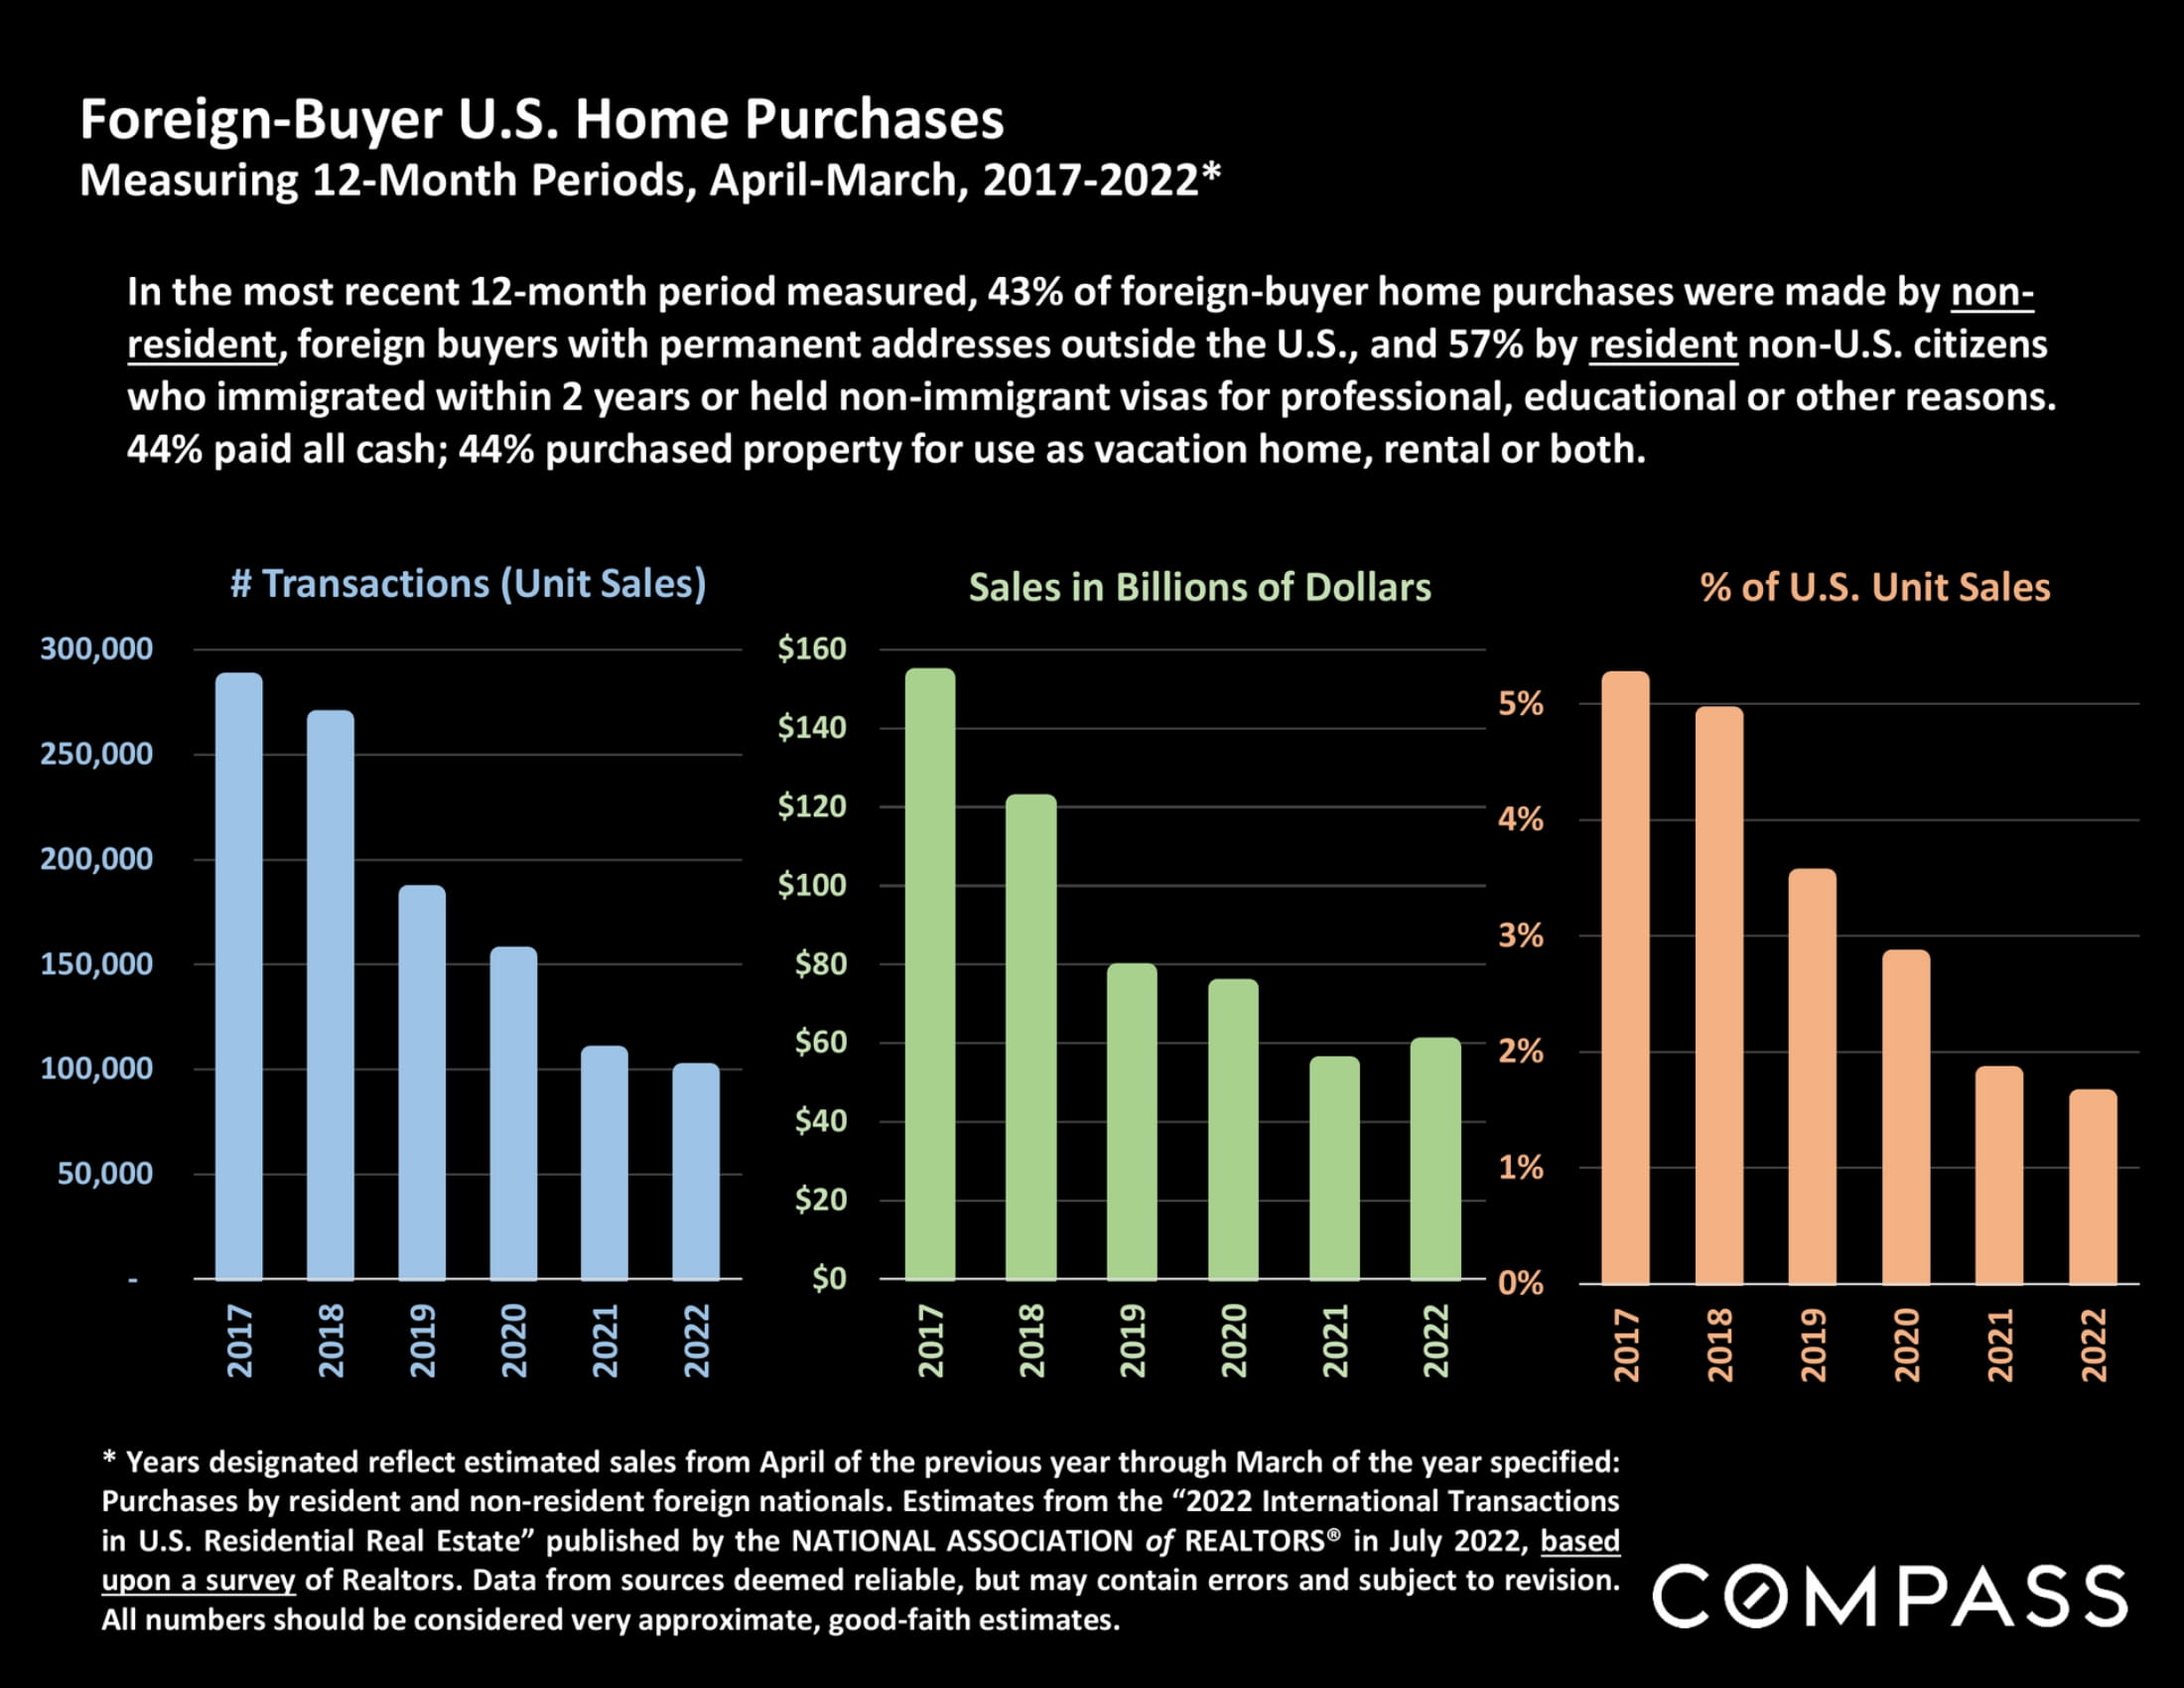
Infographic comparing foreign-buyer U.S. home purchases, sales value, and share of U.S. unit sales from 2017 to 2022.
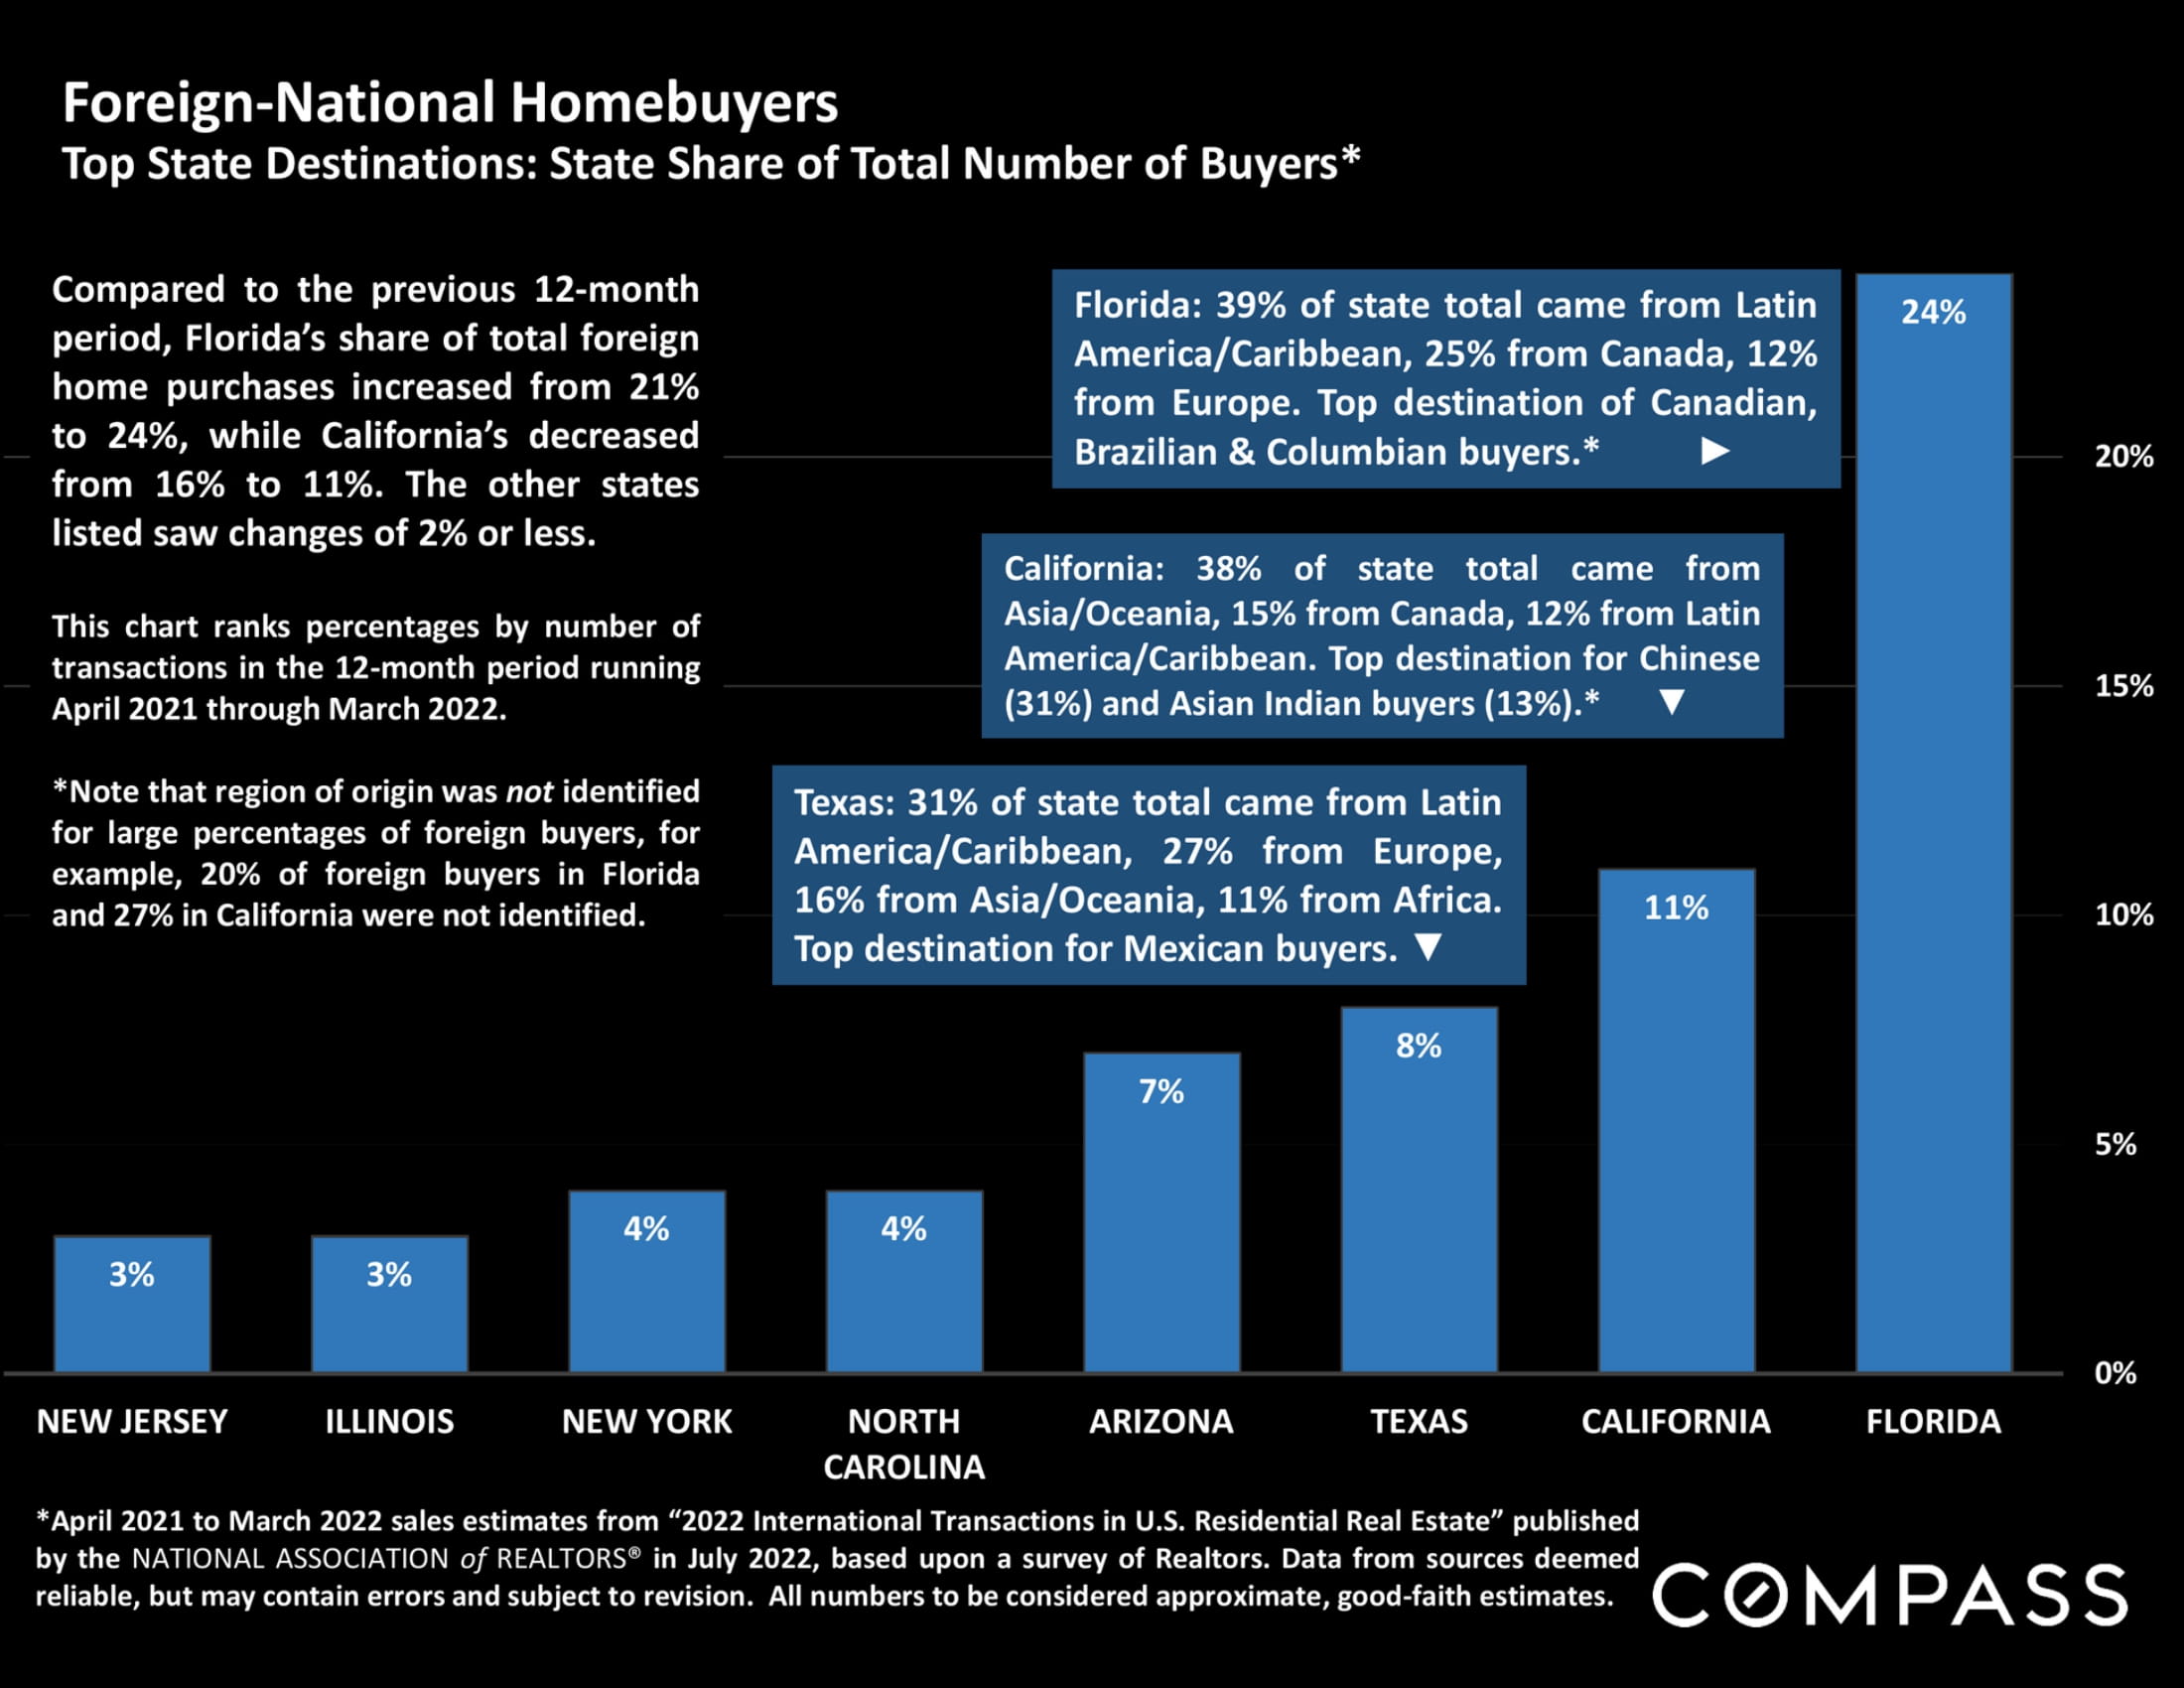
Chart of foreign-national homebuyer destinations, with Florida leading at 24% and California at 11%.
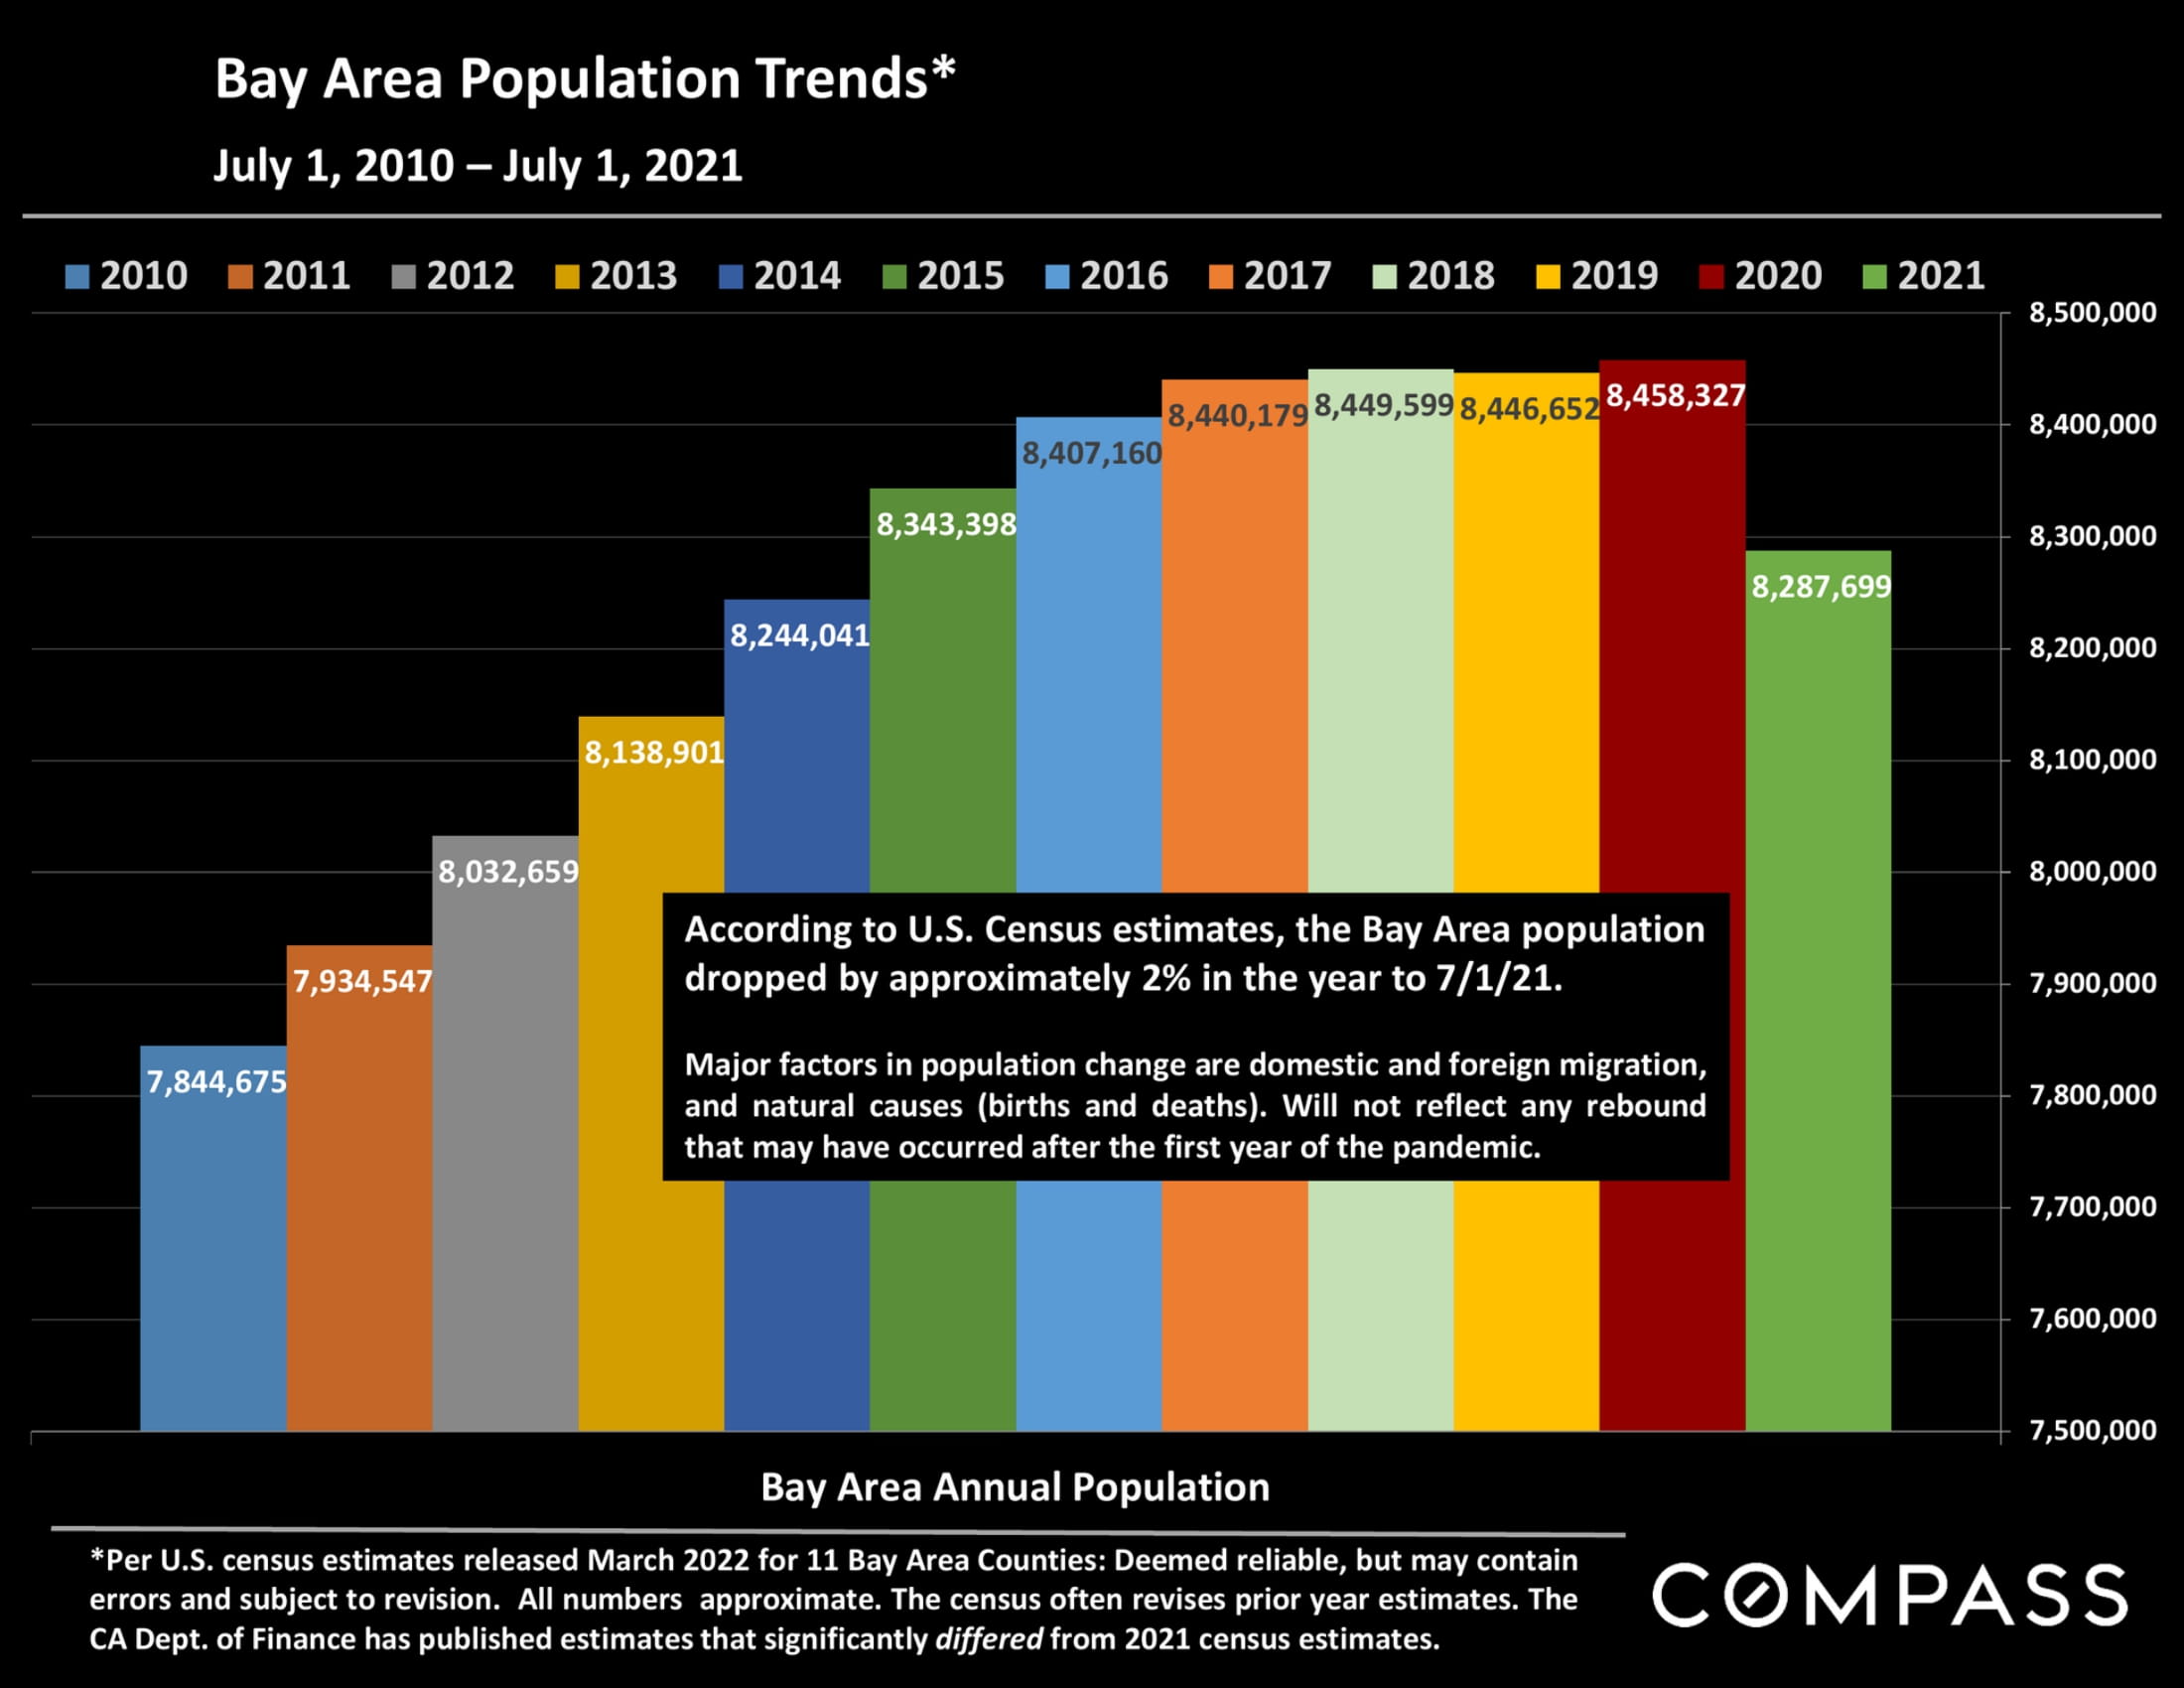
Bay Area population trends chart, 2010–2021, with a decline of approximately 2% in 2021.
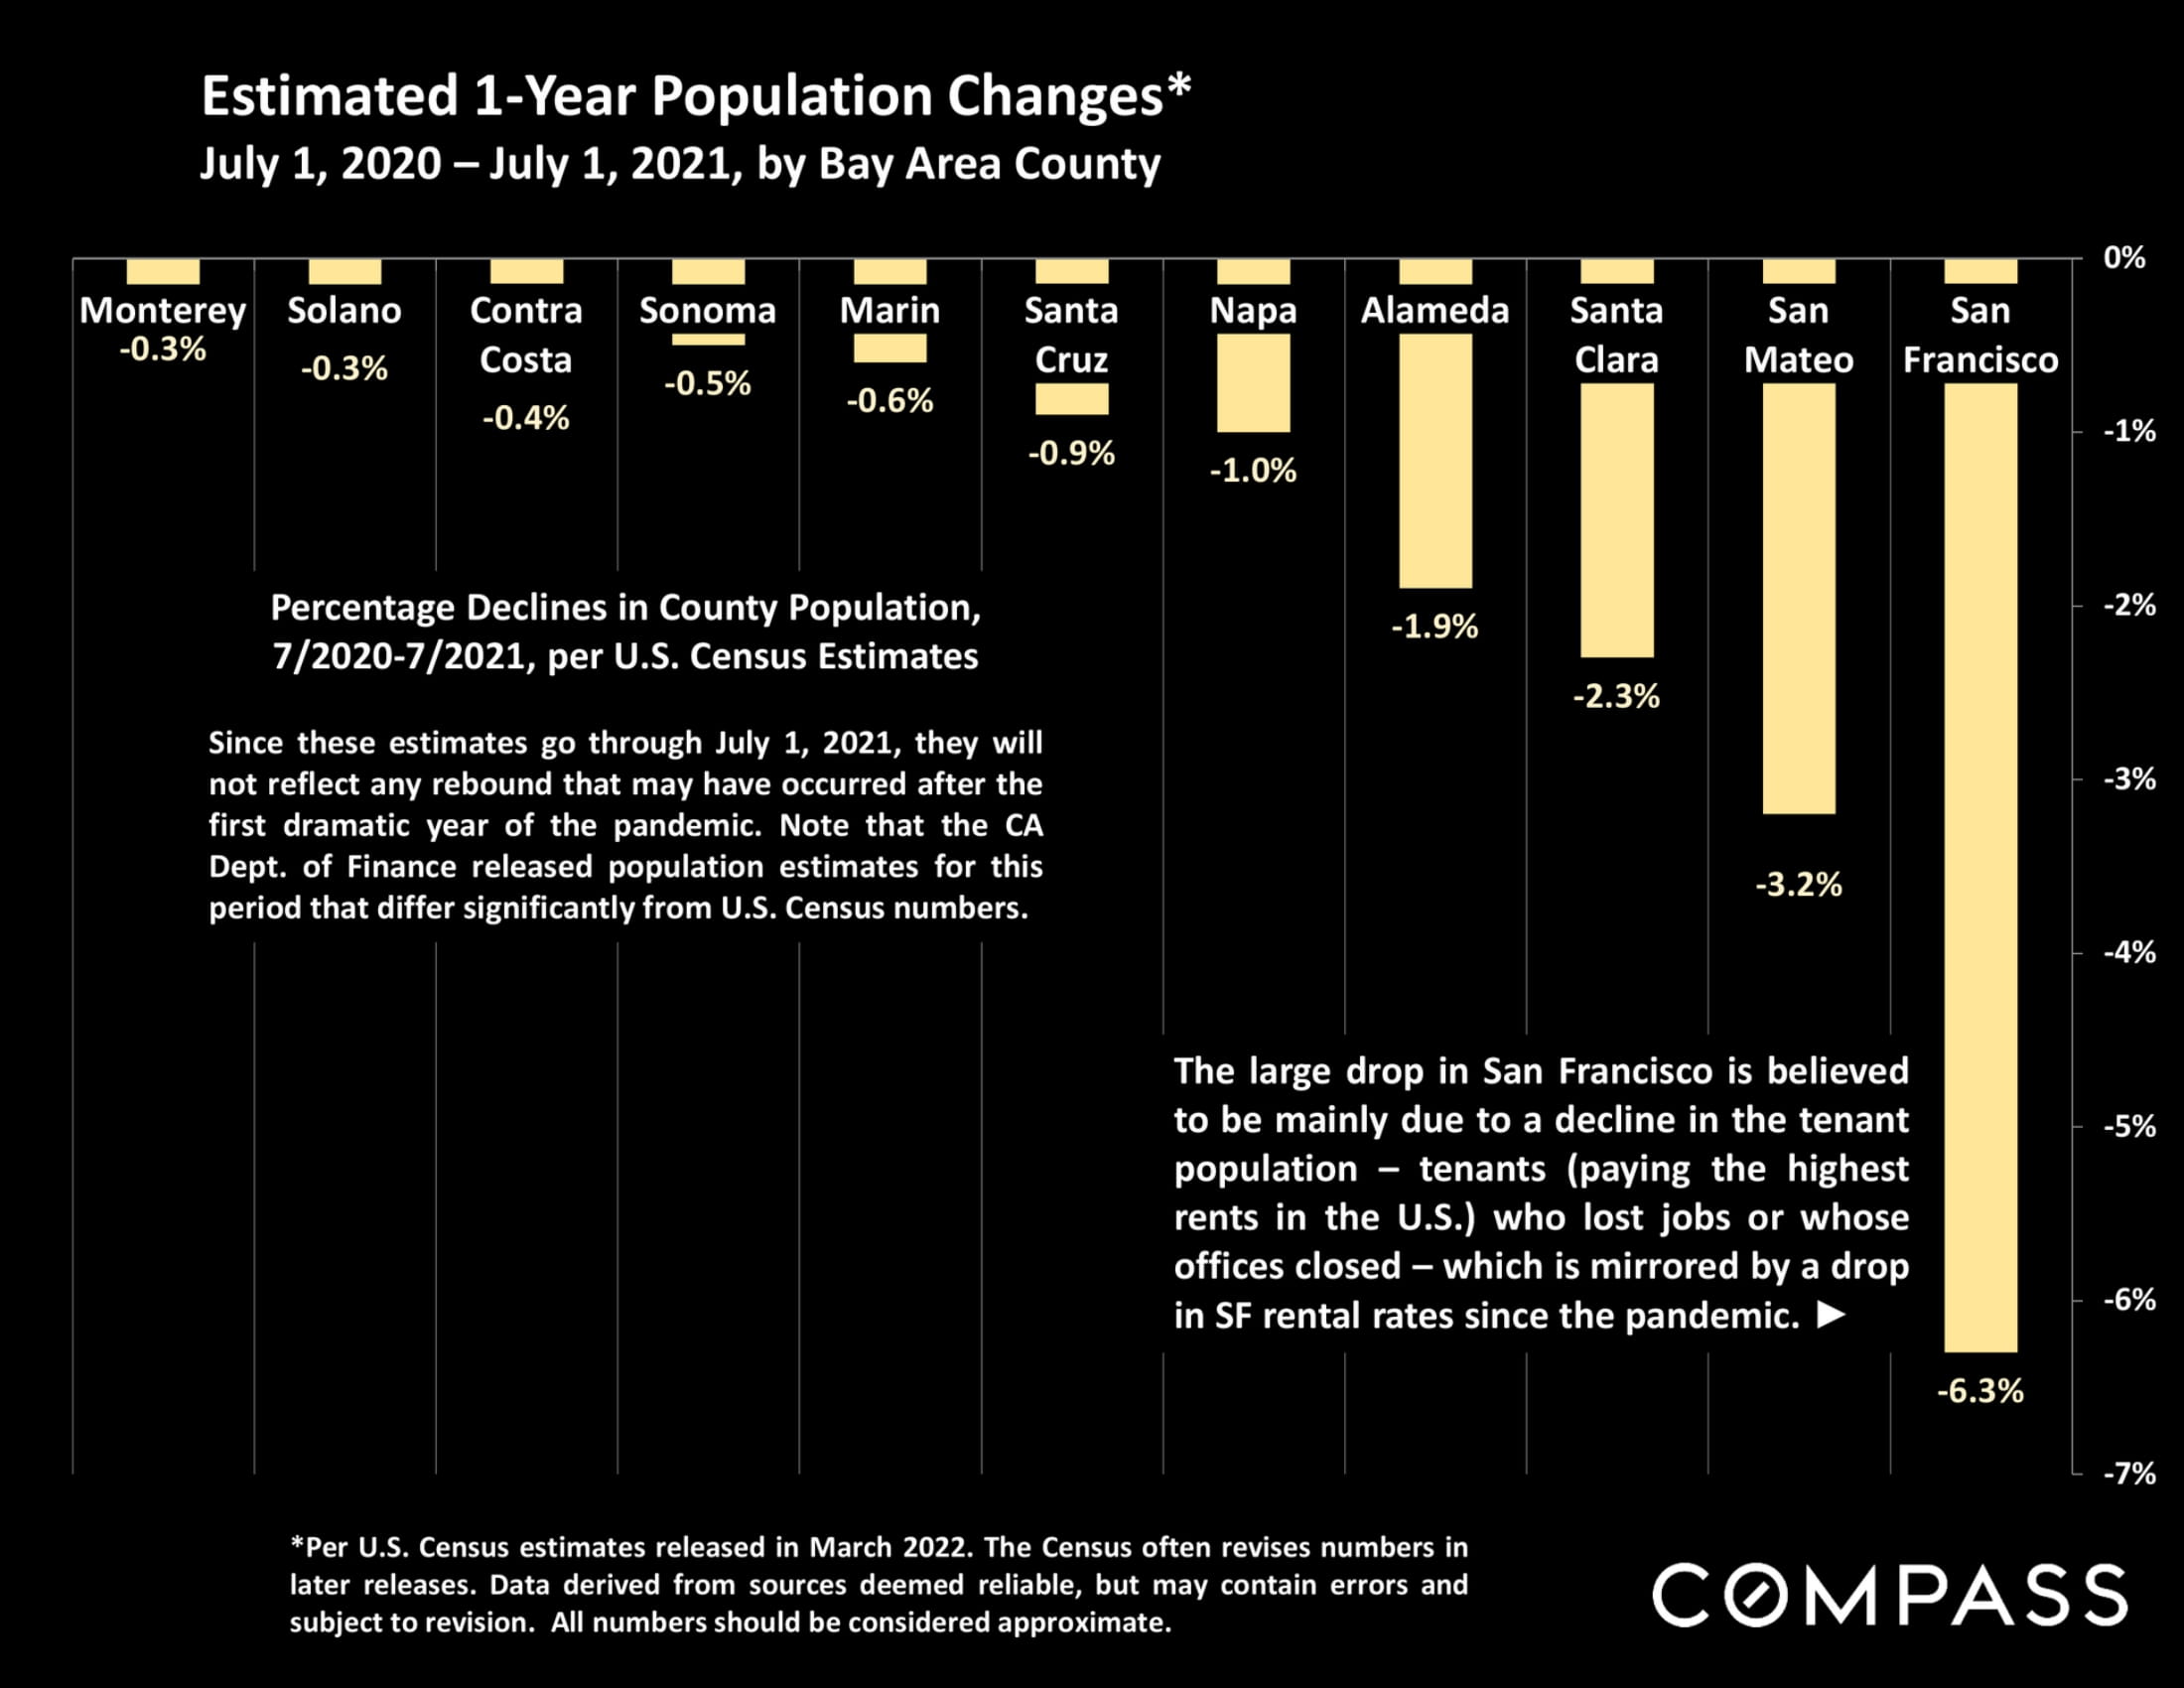
Chart of estimated 2020–2021 population declines across Bay Area counties, largest in San Francisco at 6.3%.
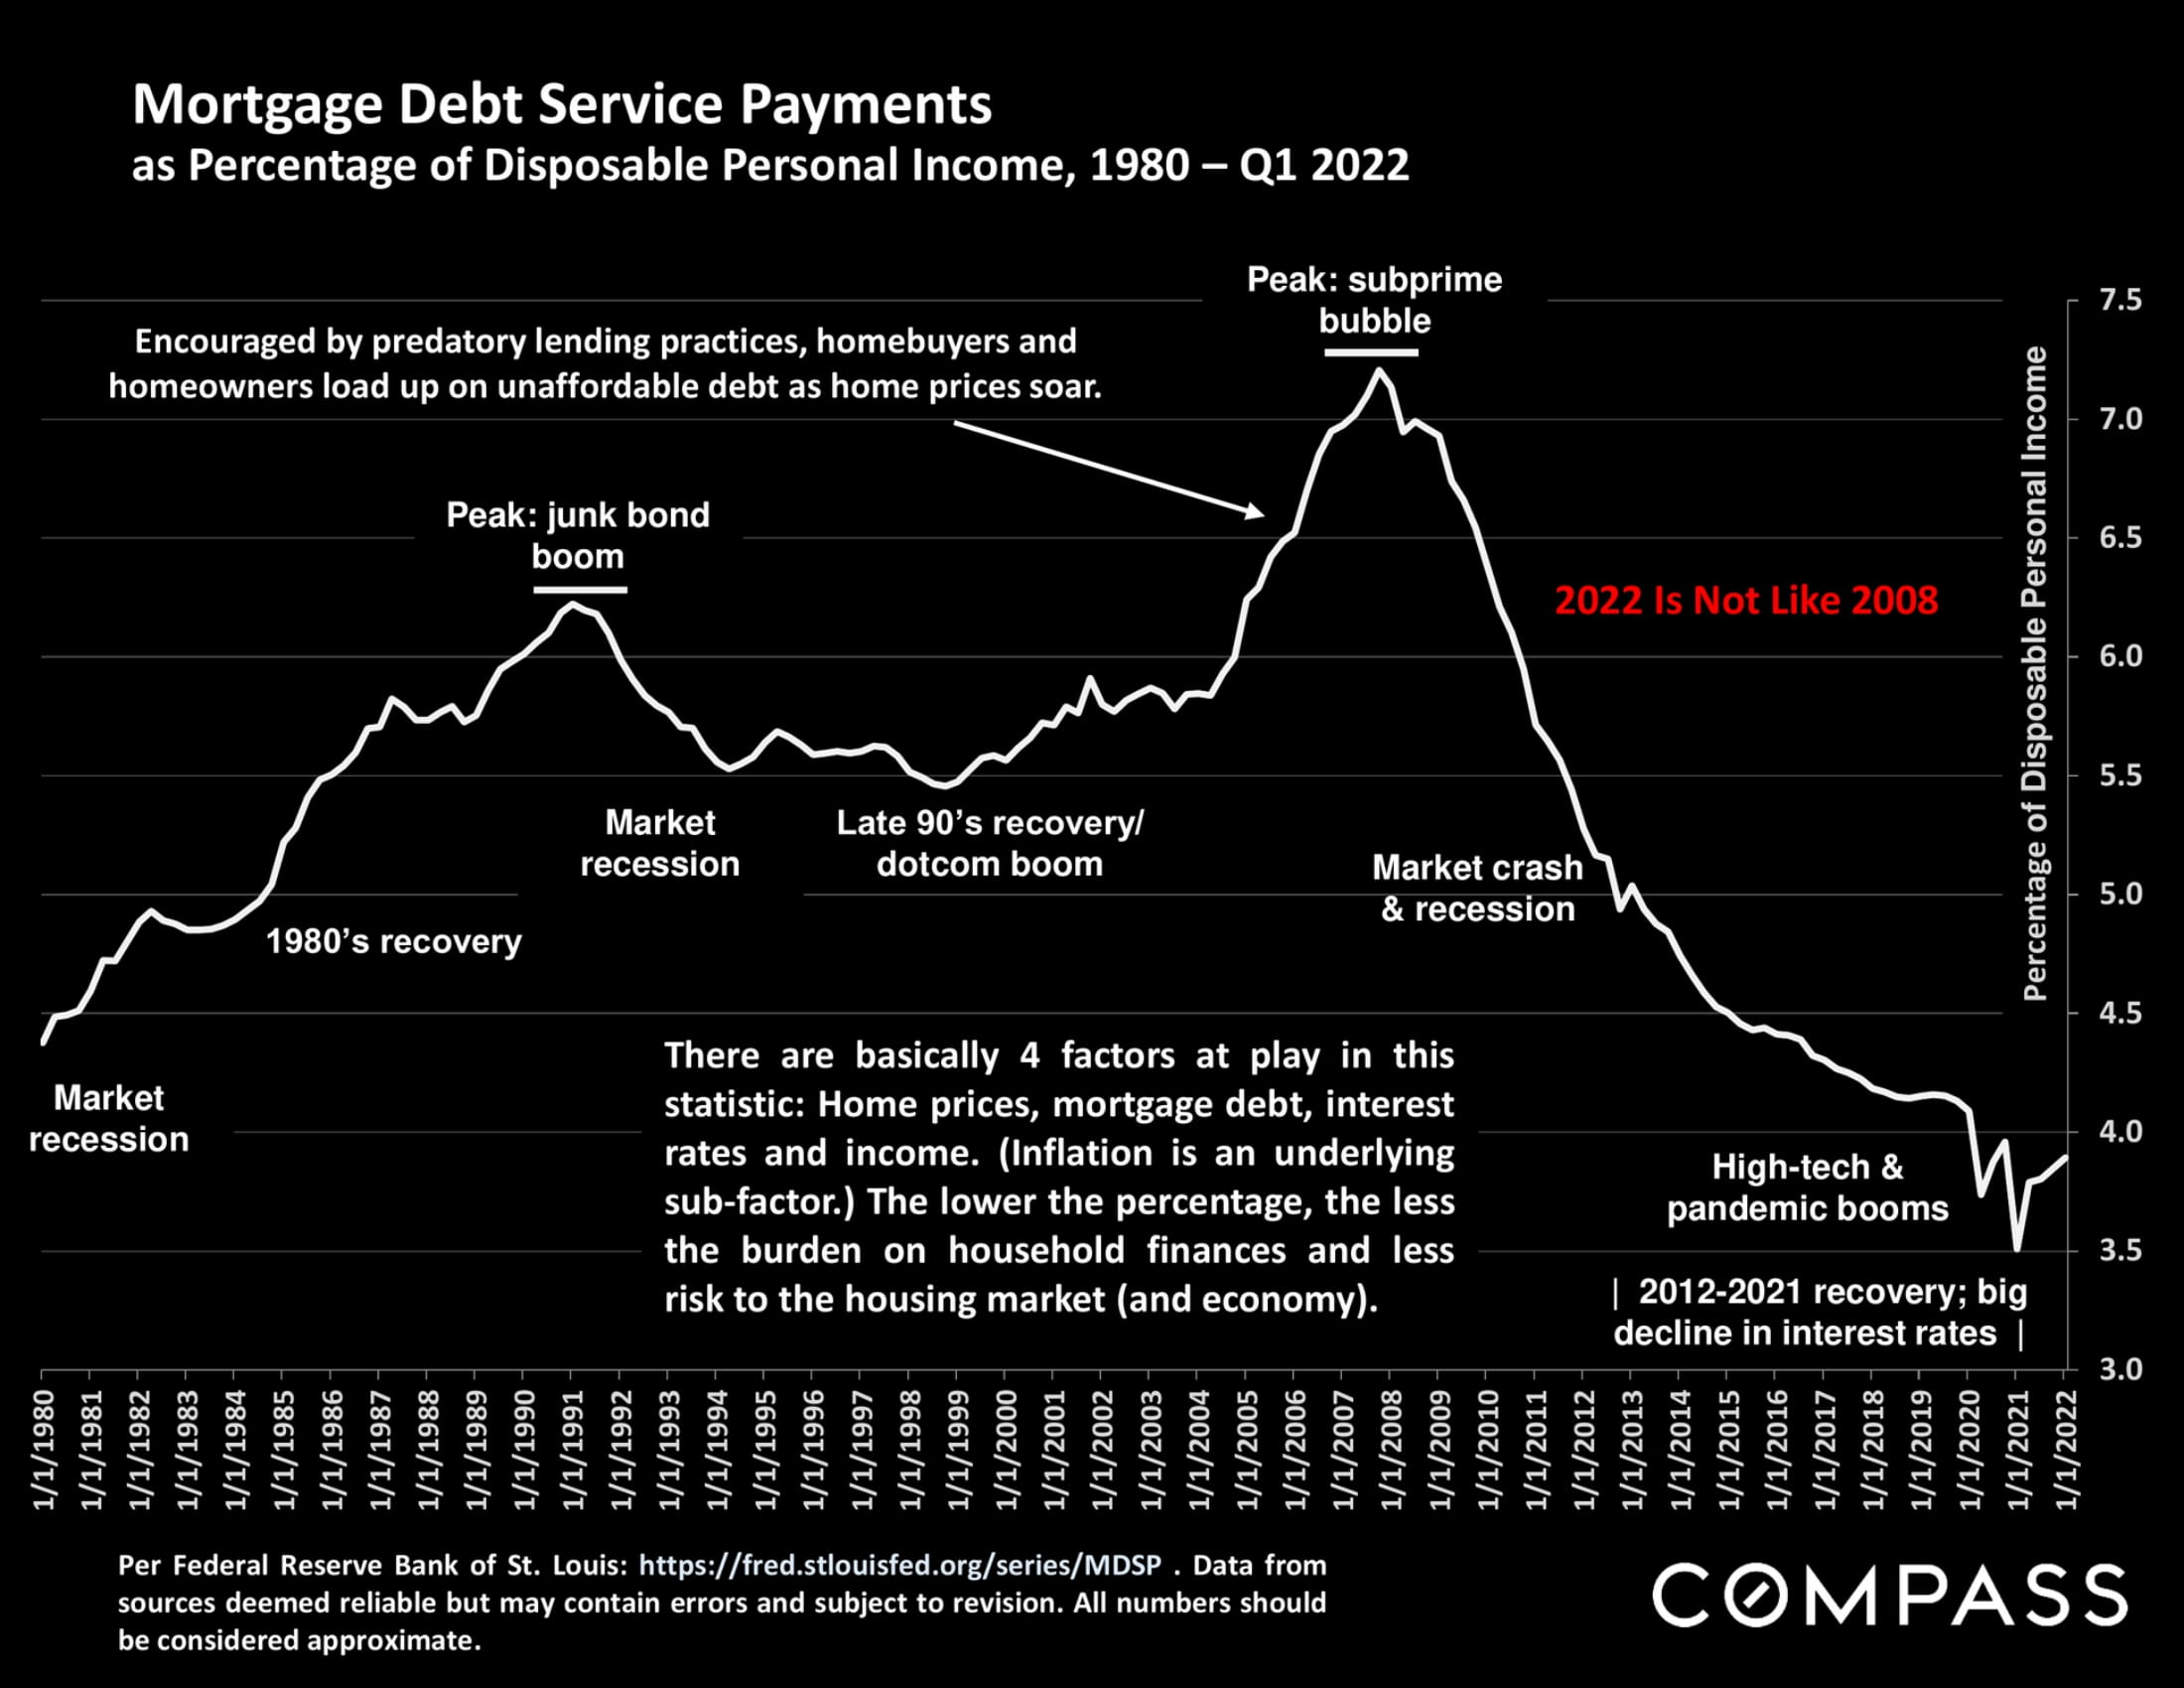
Chart of mortgage debt payments as a share of personal income, 1980–2022, with economic periods and a 2022 comparison.
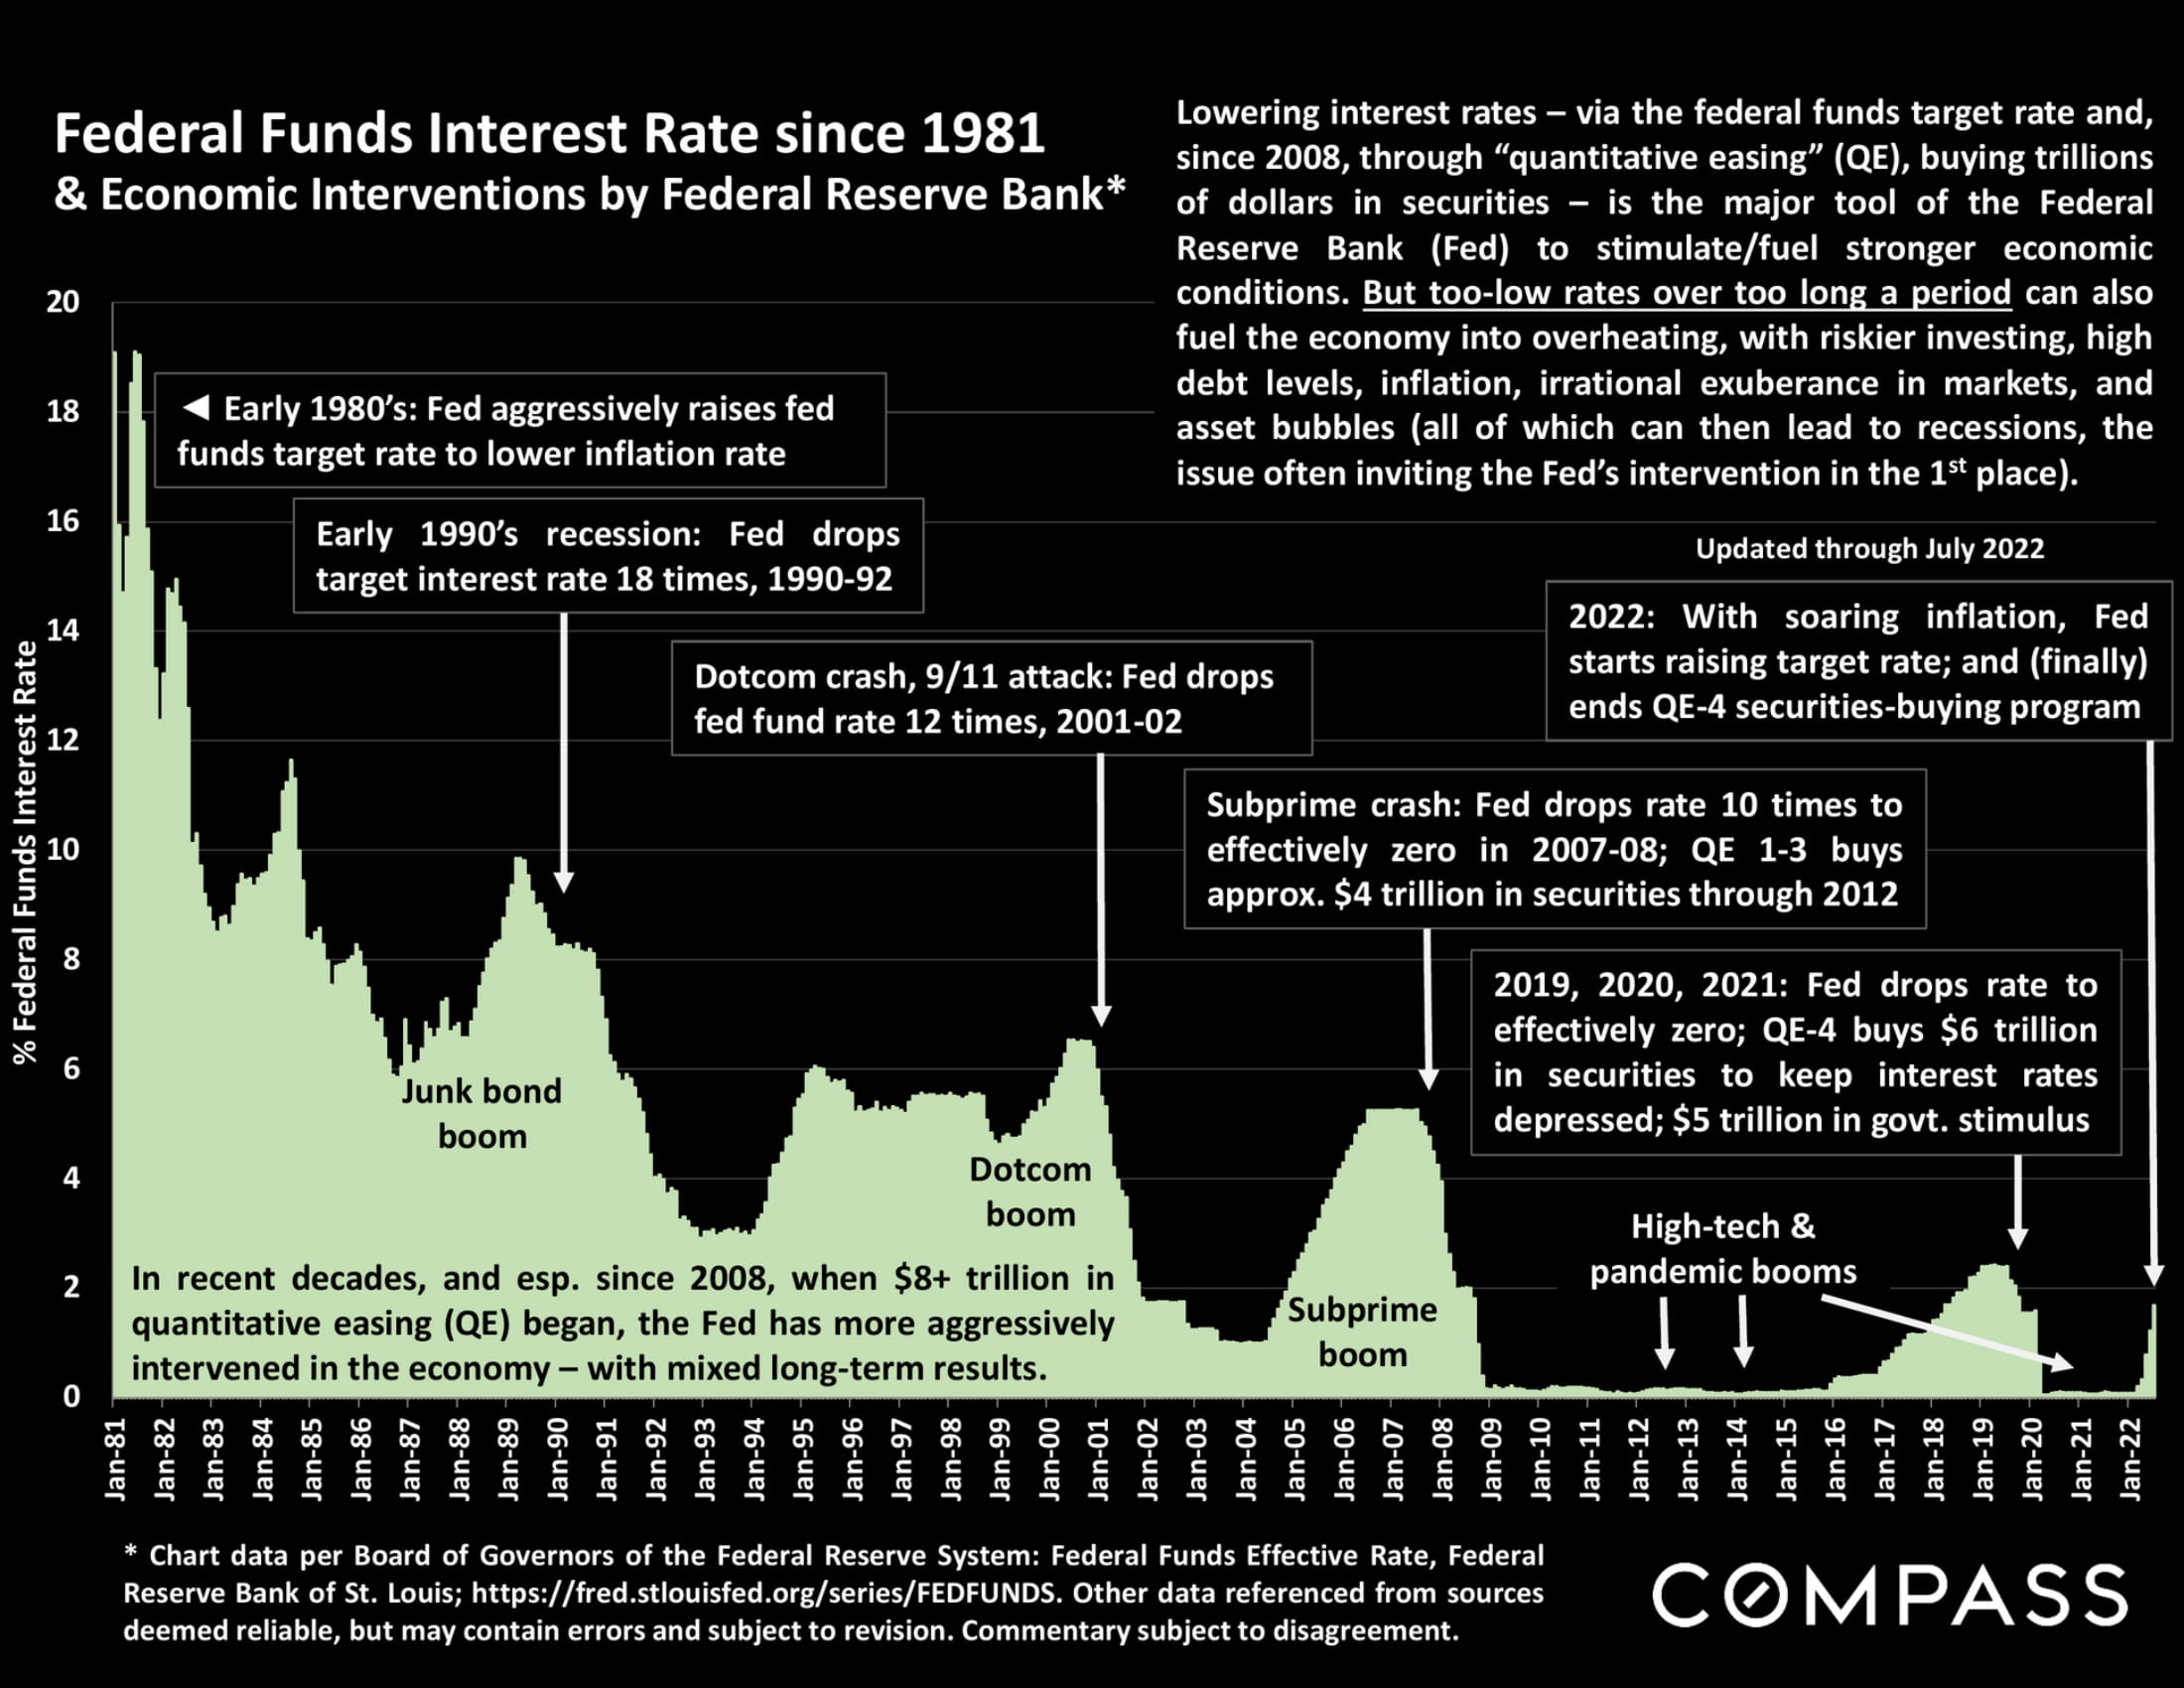
Chart of federal funds interest rates from 1981 to 2022, annotated with major Federal Reserve interventions and economic events.
Chart of U.S. federal debt rising to over $30 trillion by Q2 2022.
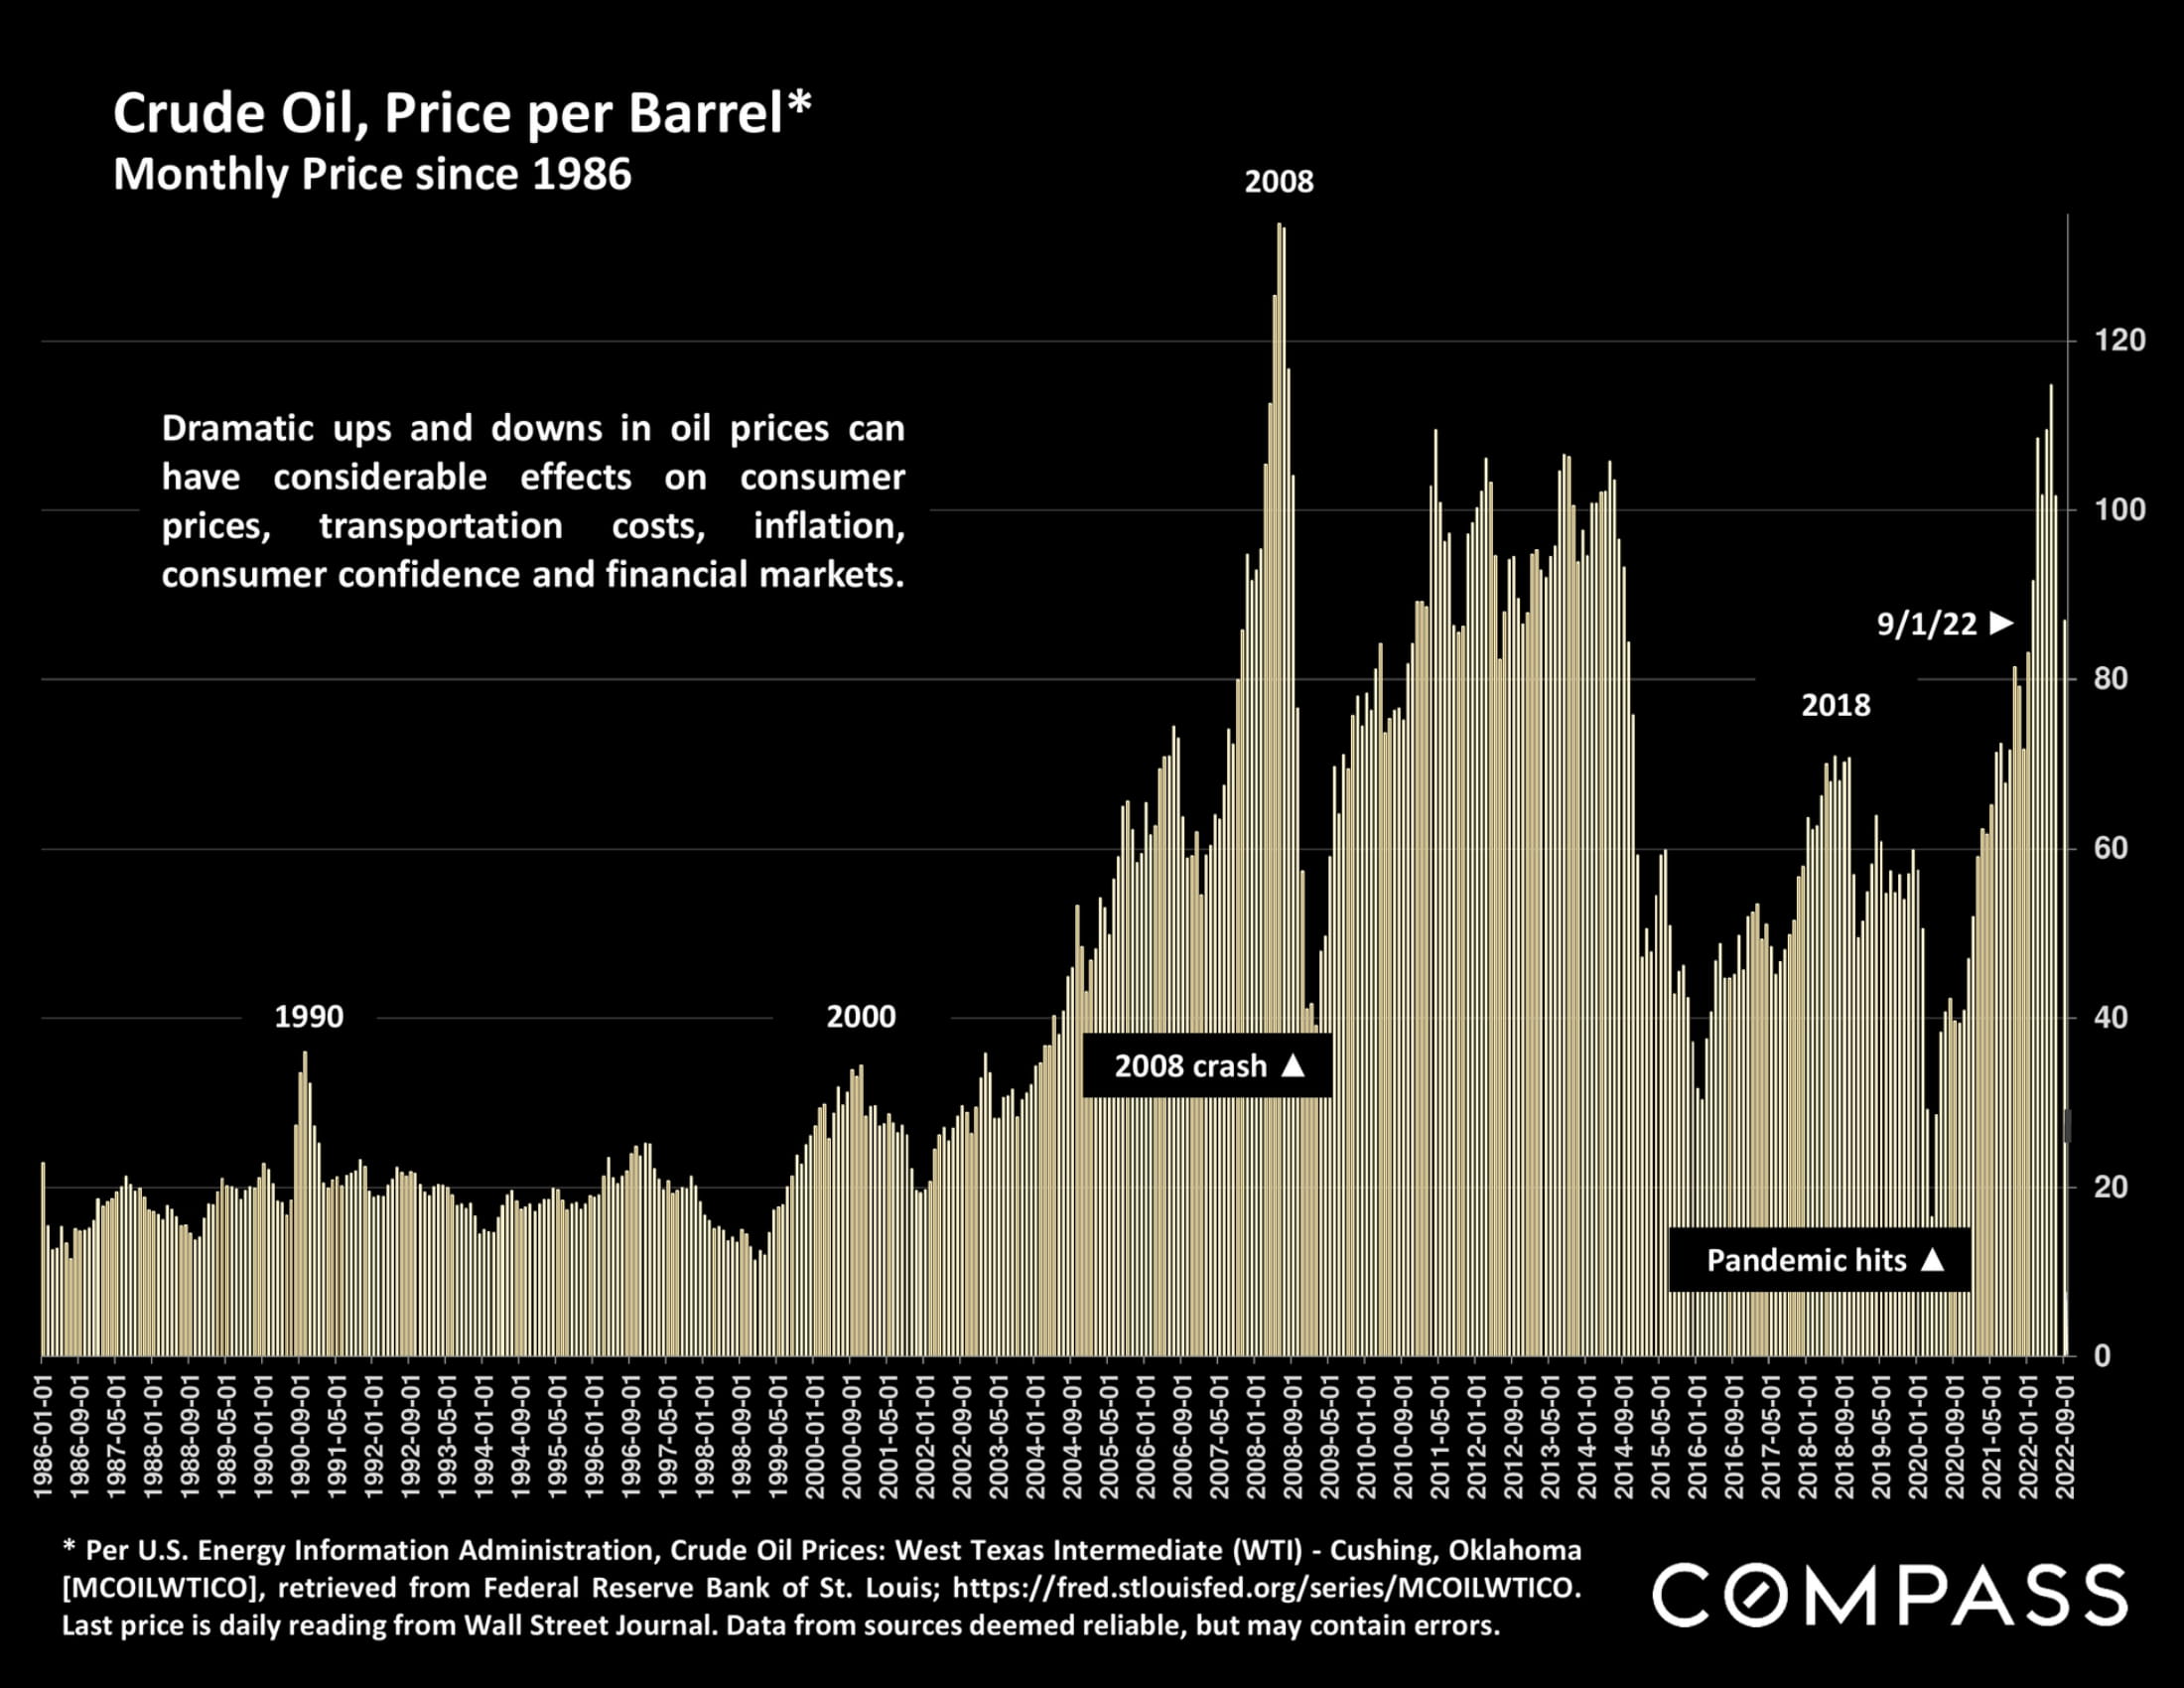
Bar chart of monthly crude oil prices from 1986 to September 2022, highlighting the 2008 crash and pandemic-era changes.
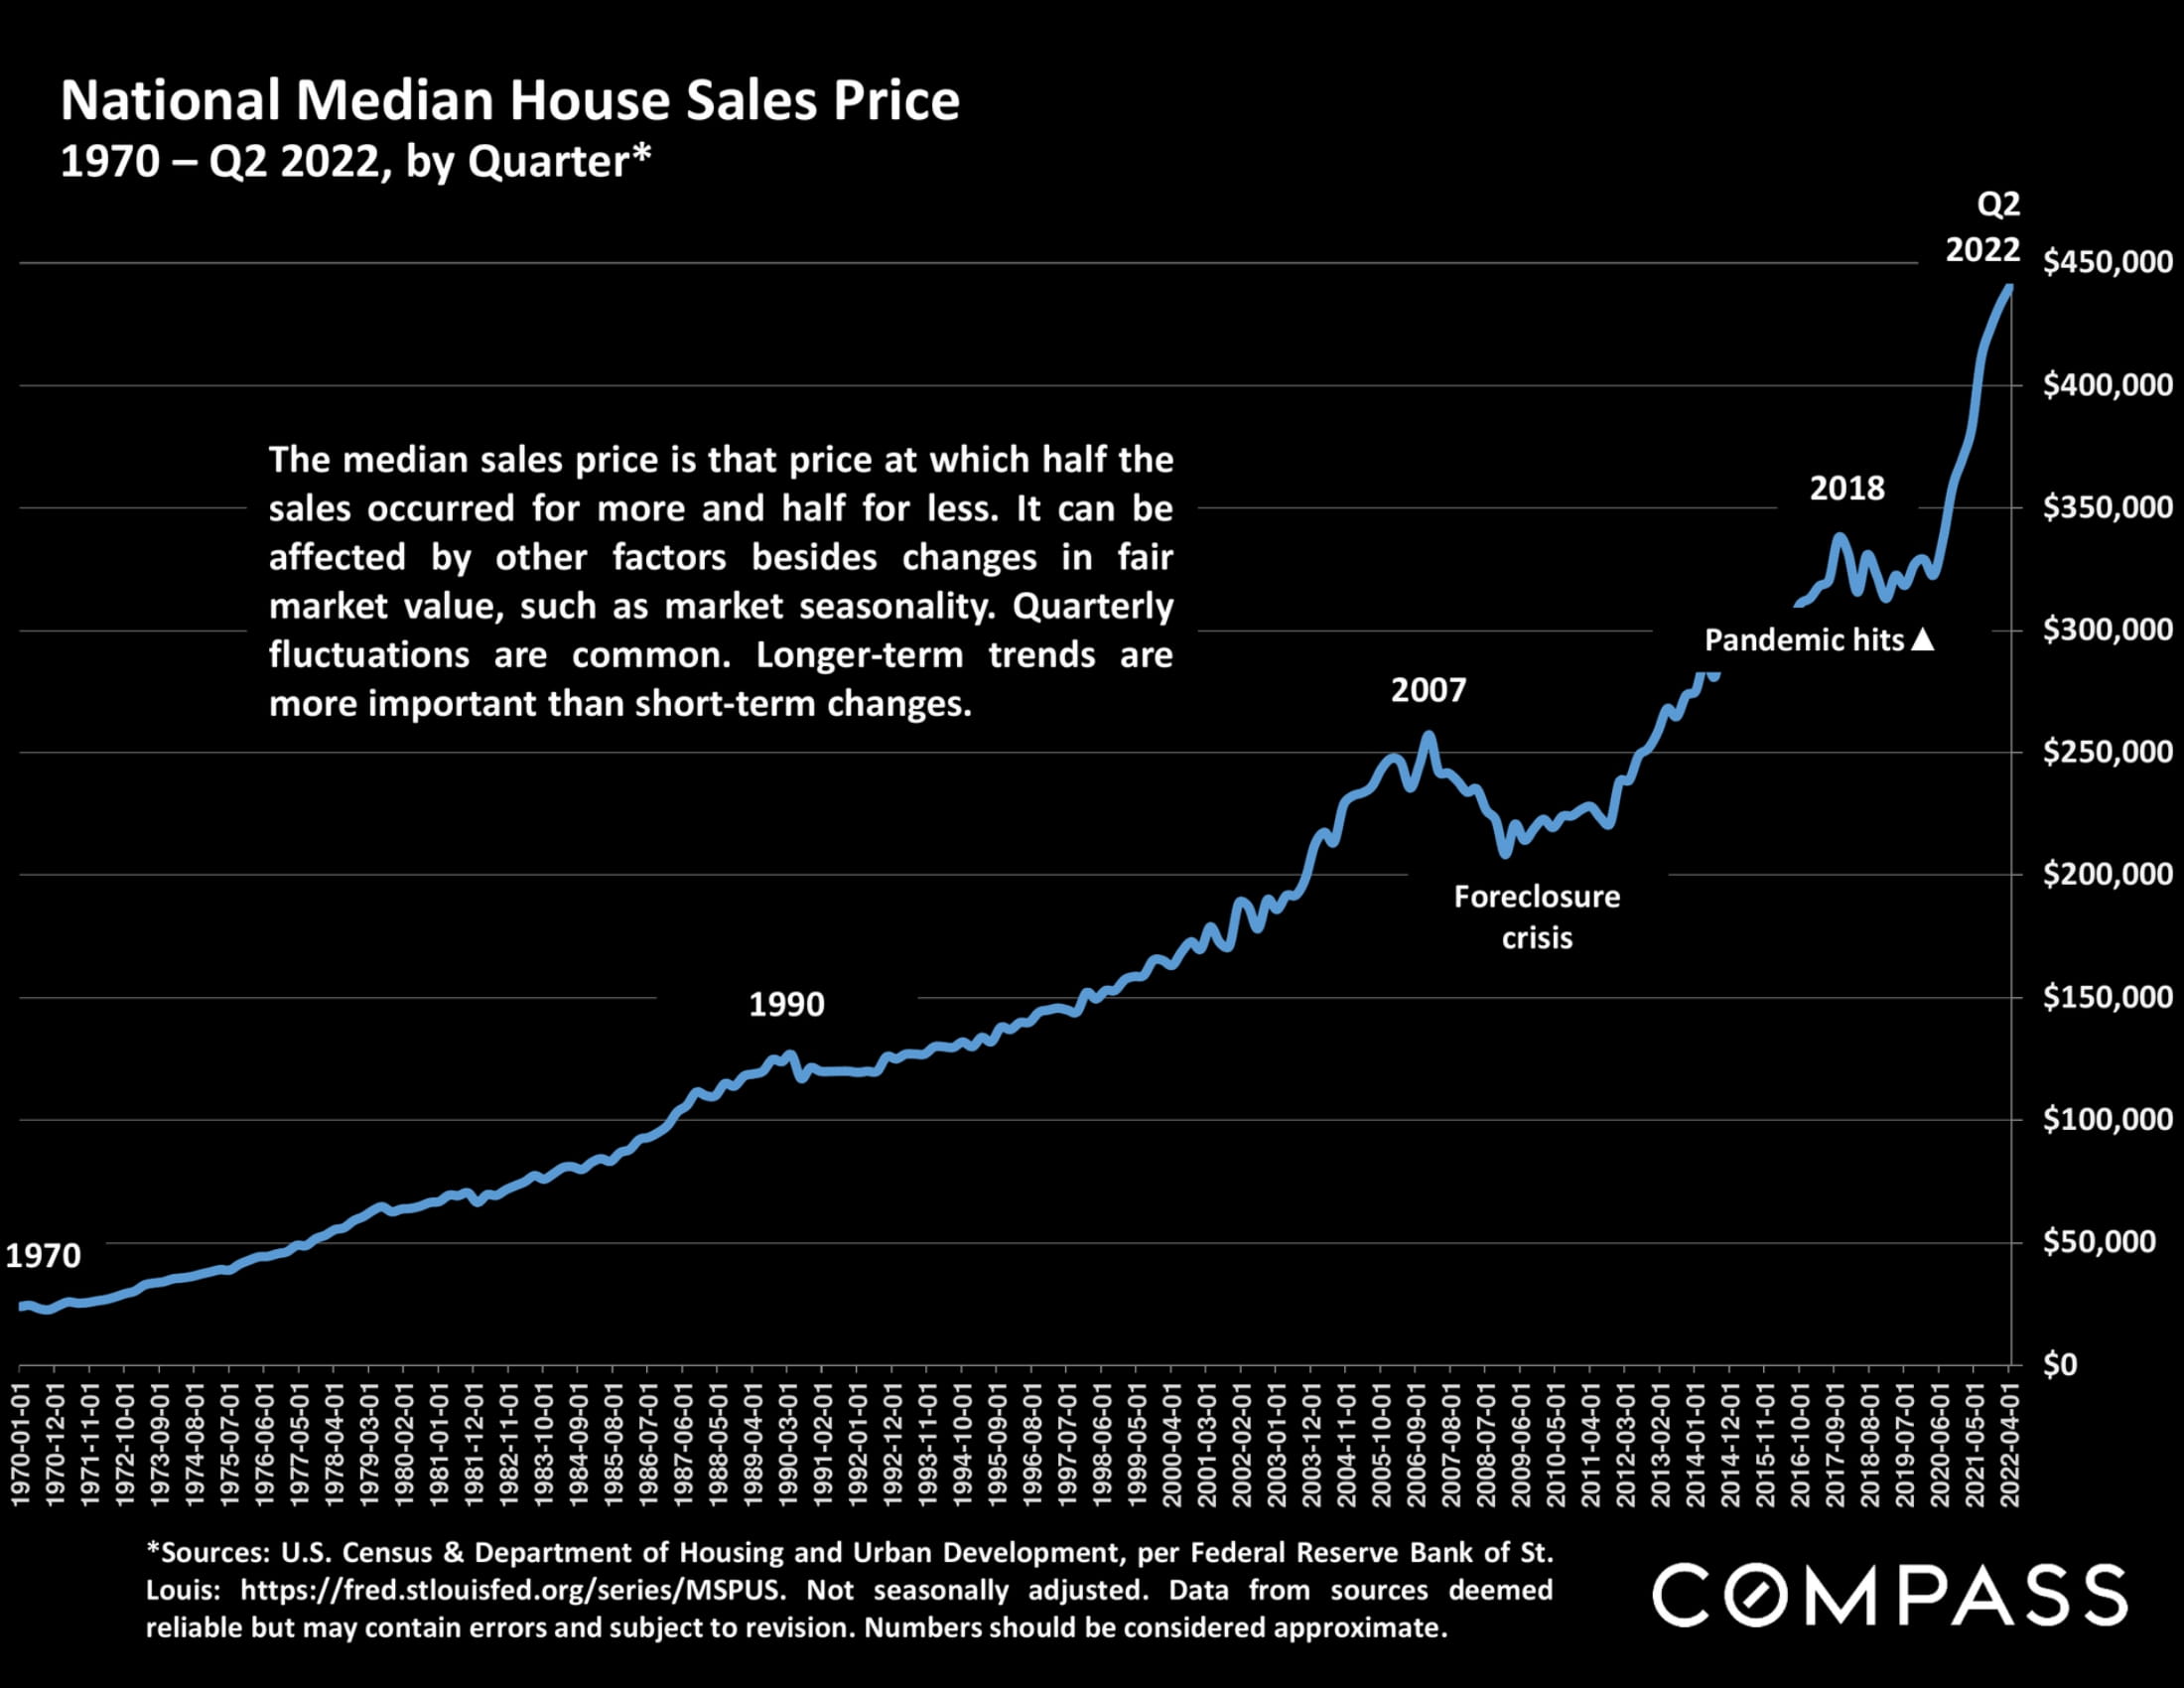
Chart of national median house prices, rising from under $50,000 in 1970 to about $440,000 in Q2 2022.
Chart of Bay Area median home prices, 1990–2022 YTD, with brown bars and annotations for major market periods.
Bay Area home-price appreciation rates by year, 1990–2022 YTD.
Chart of Bay Area median home sale prices, showing an overall rise from 1984 to 2022 with several market downturns.
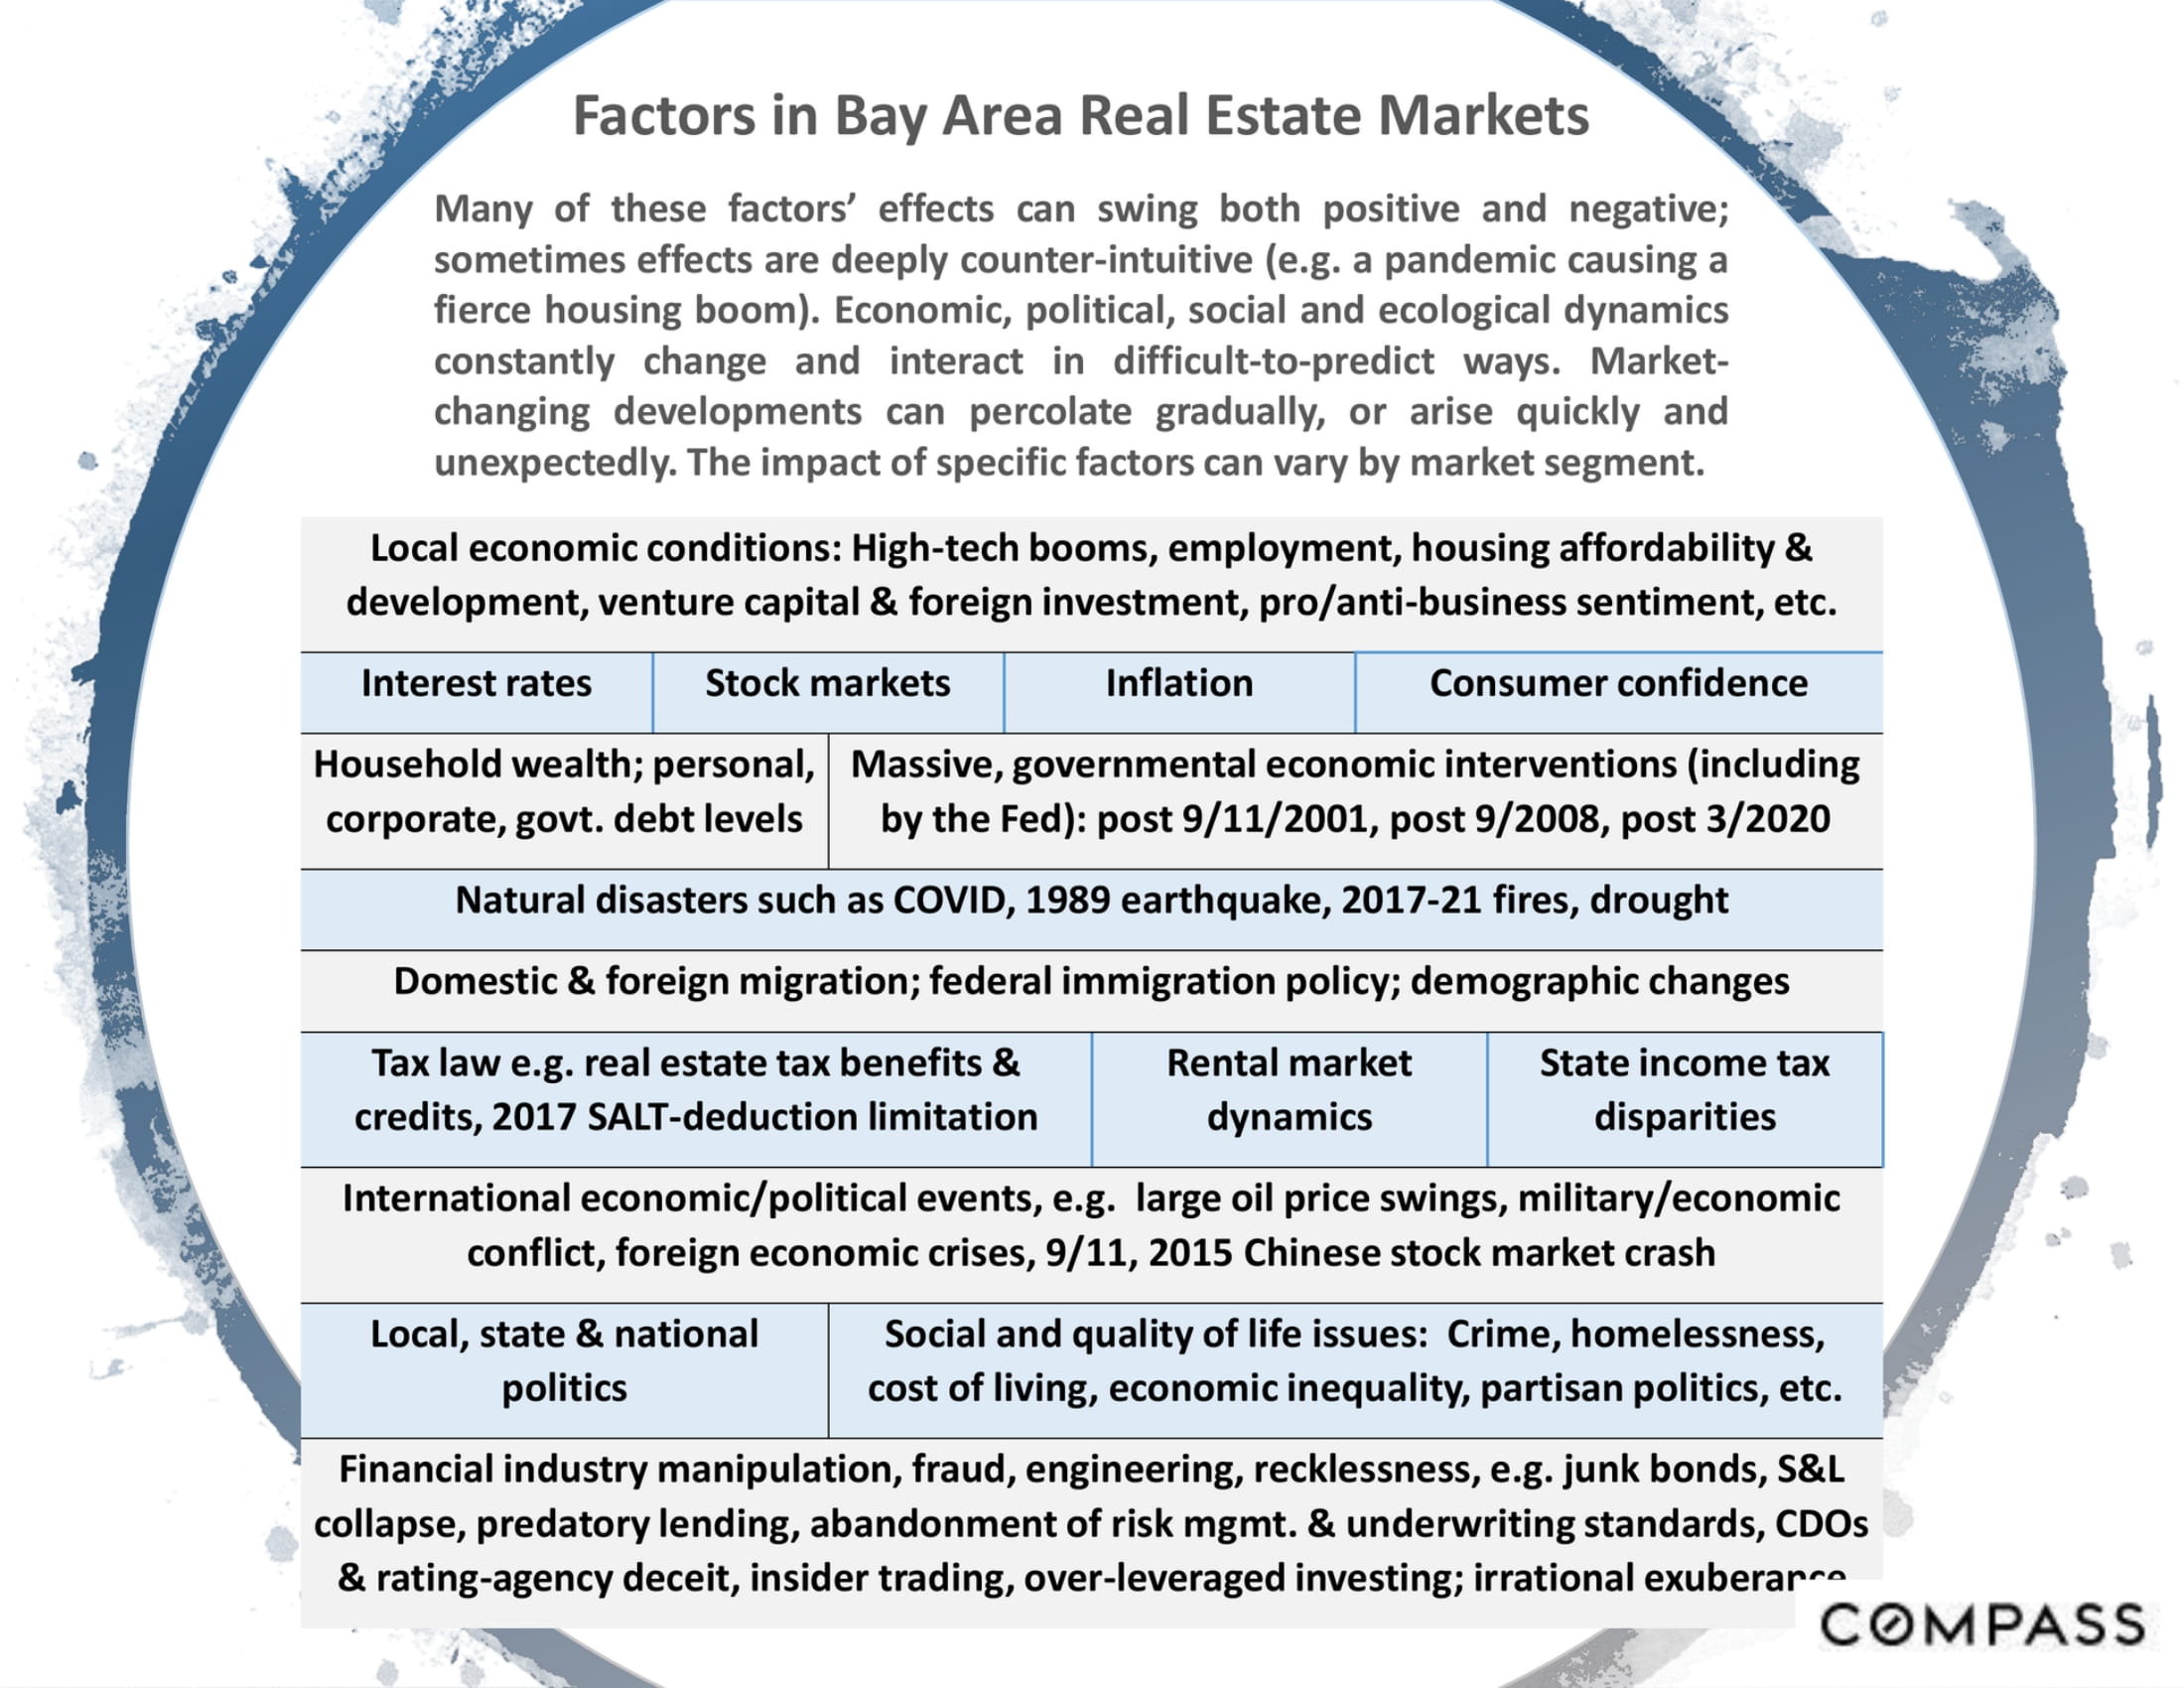
Infographic listing economic, political, social, and environmental factors that influence Bay Area real estate markets.
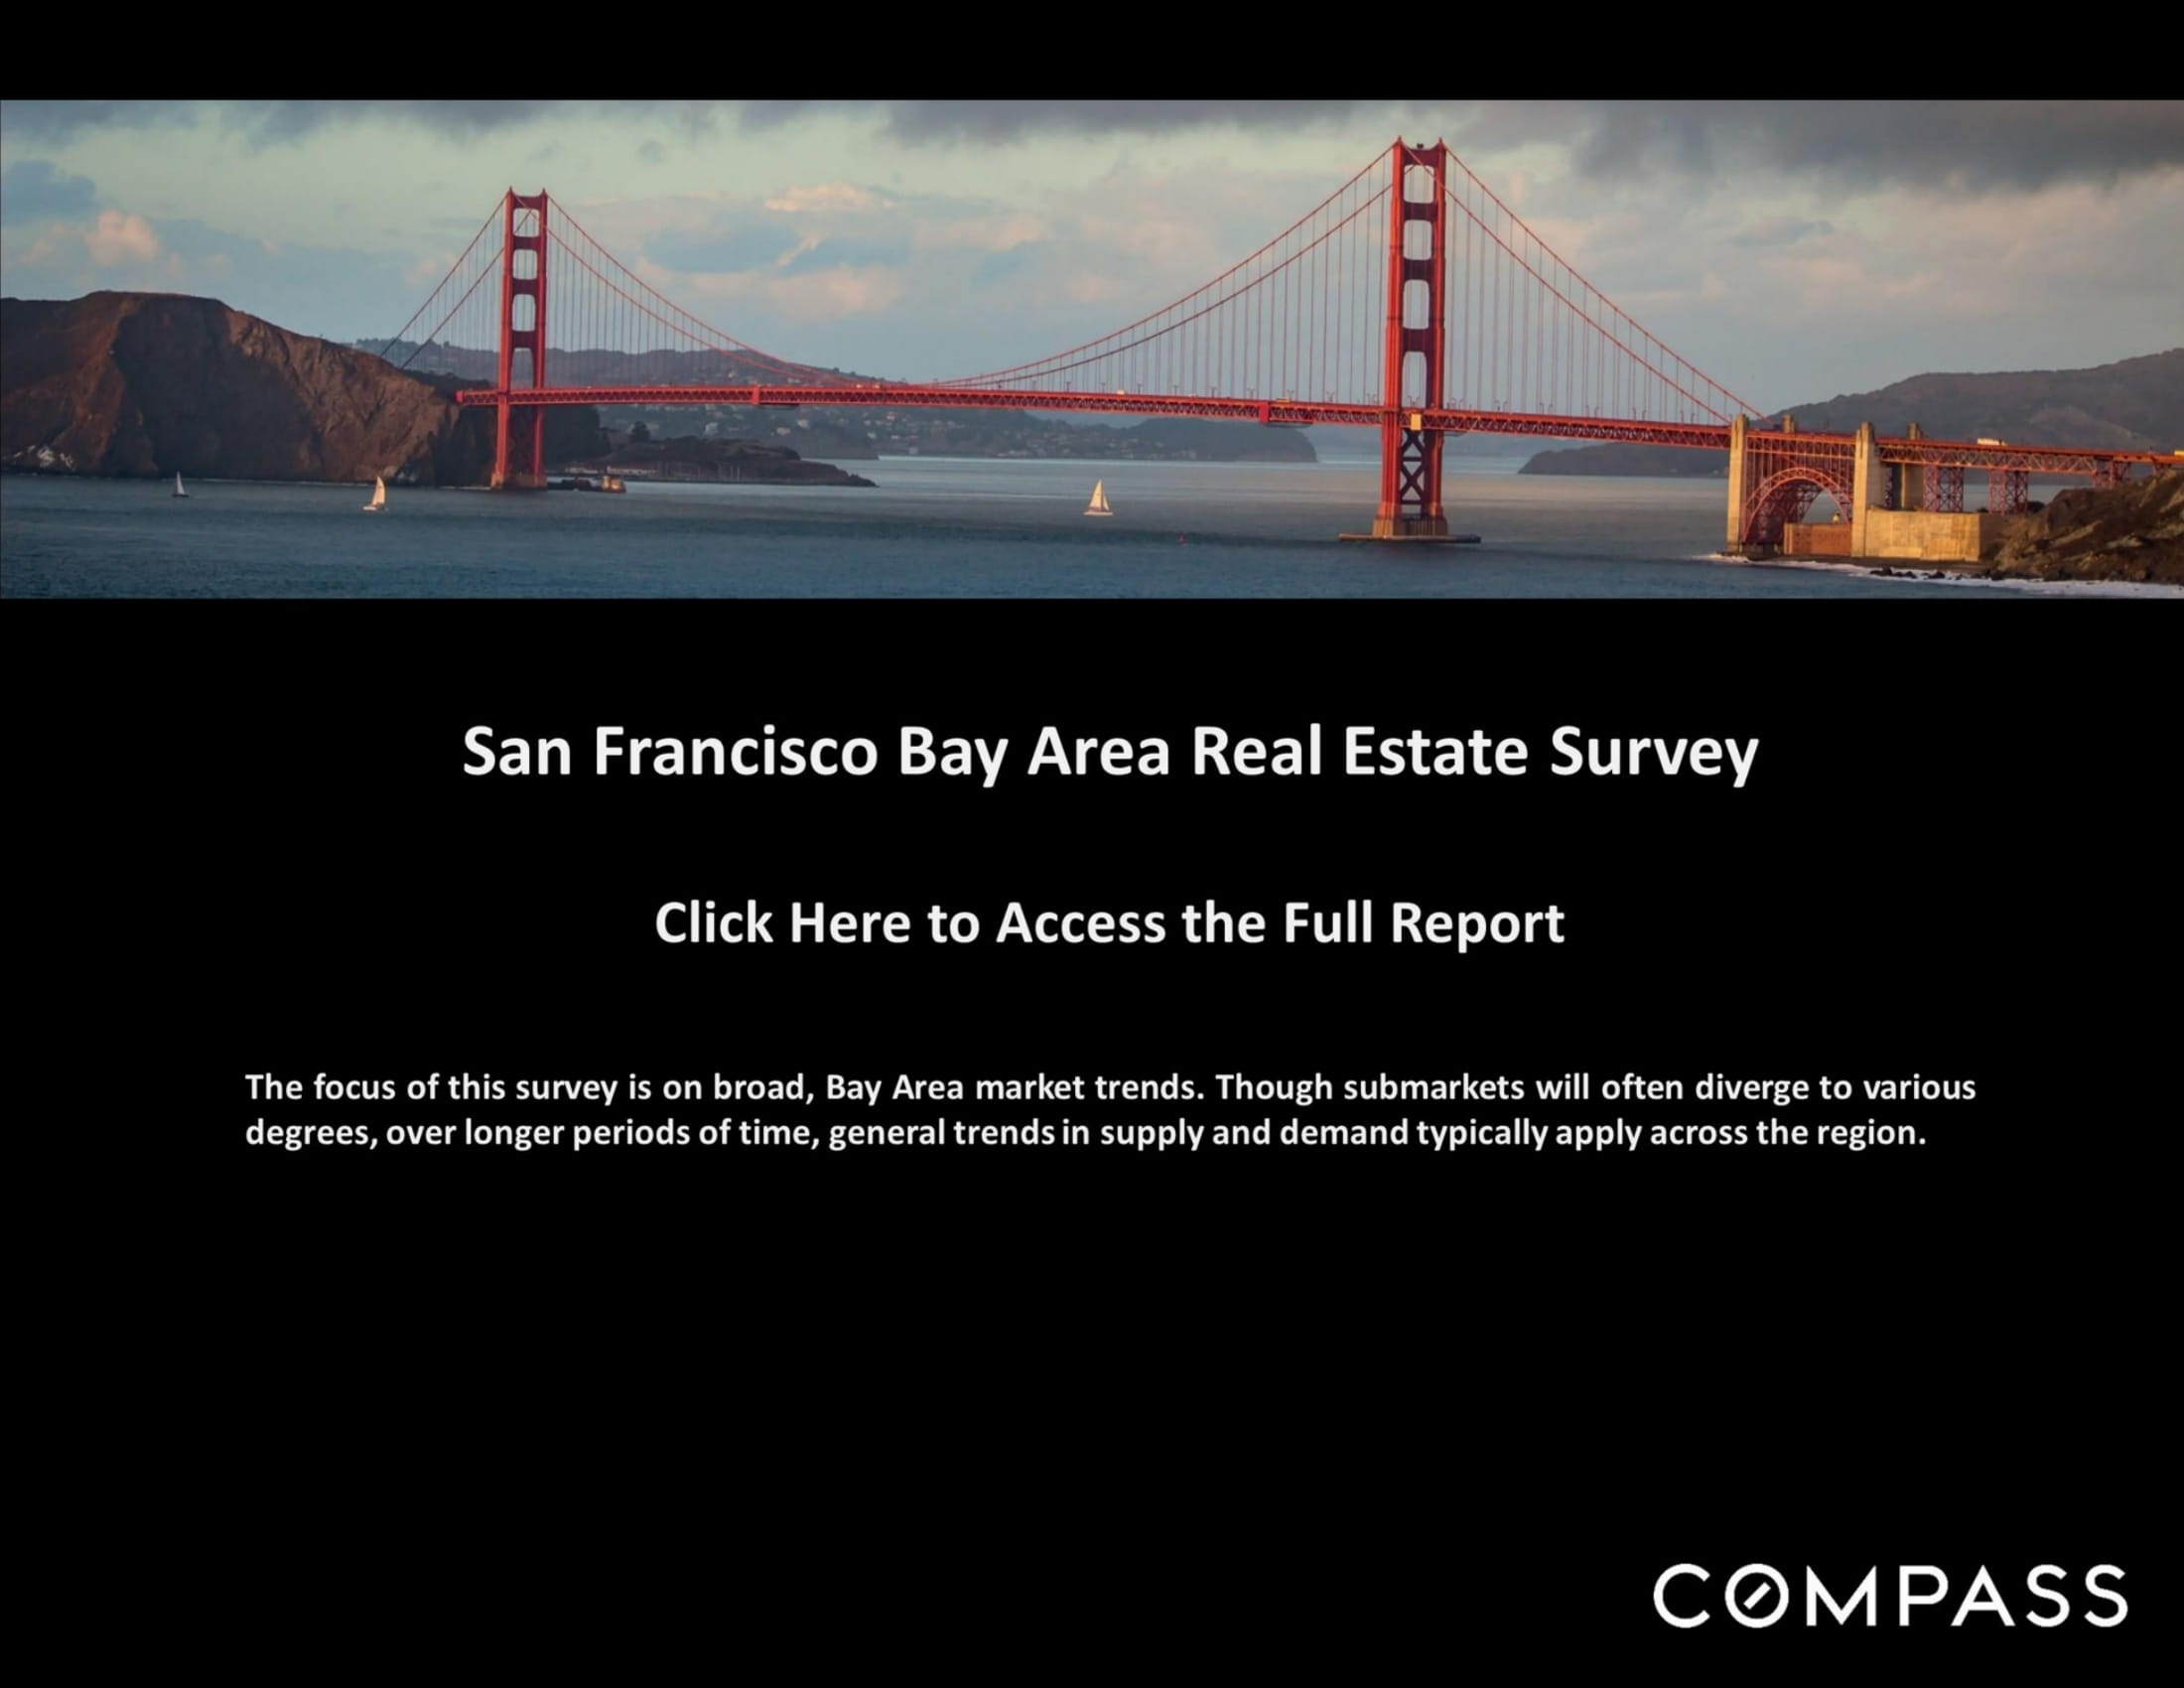
San Francisco Bay Area Real Estate Survey promo with a Golden Gate Bridge panorama and link to the full report.
Compass report cover on San Francisco Bay Area home price appreciation trends since 1990.
Compass market report page with notes on interpreting housing statistics, factors affecting home values, and legal disclosures.


WORK WITH US

We offer the highest level of service and expertise to our clients. Our team has built a reputation for consistently representing the finest real estate in San Francisco and Napa Valley. Results driven and dedicated to your success, whether buying, selling, renting or investing. Contact us today for a private consultation.

Contact Us