
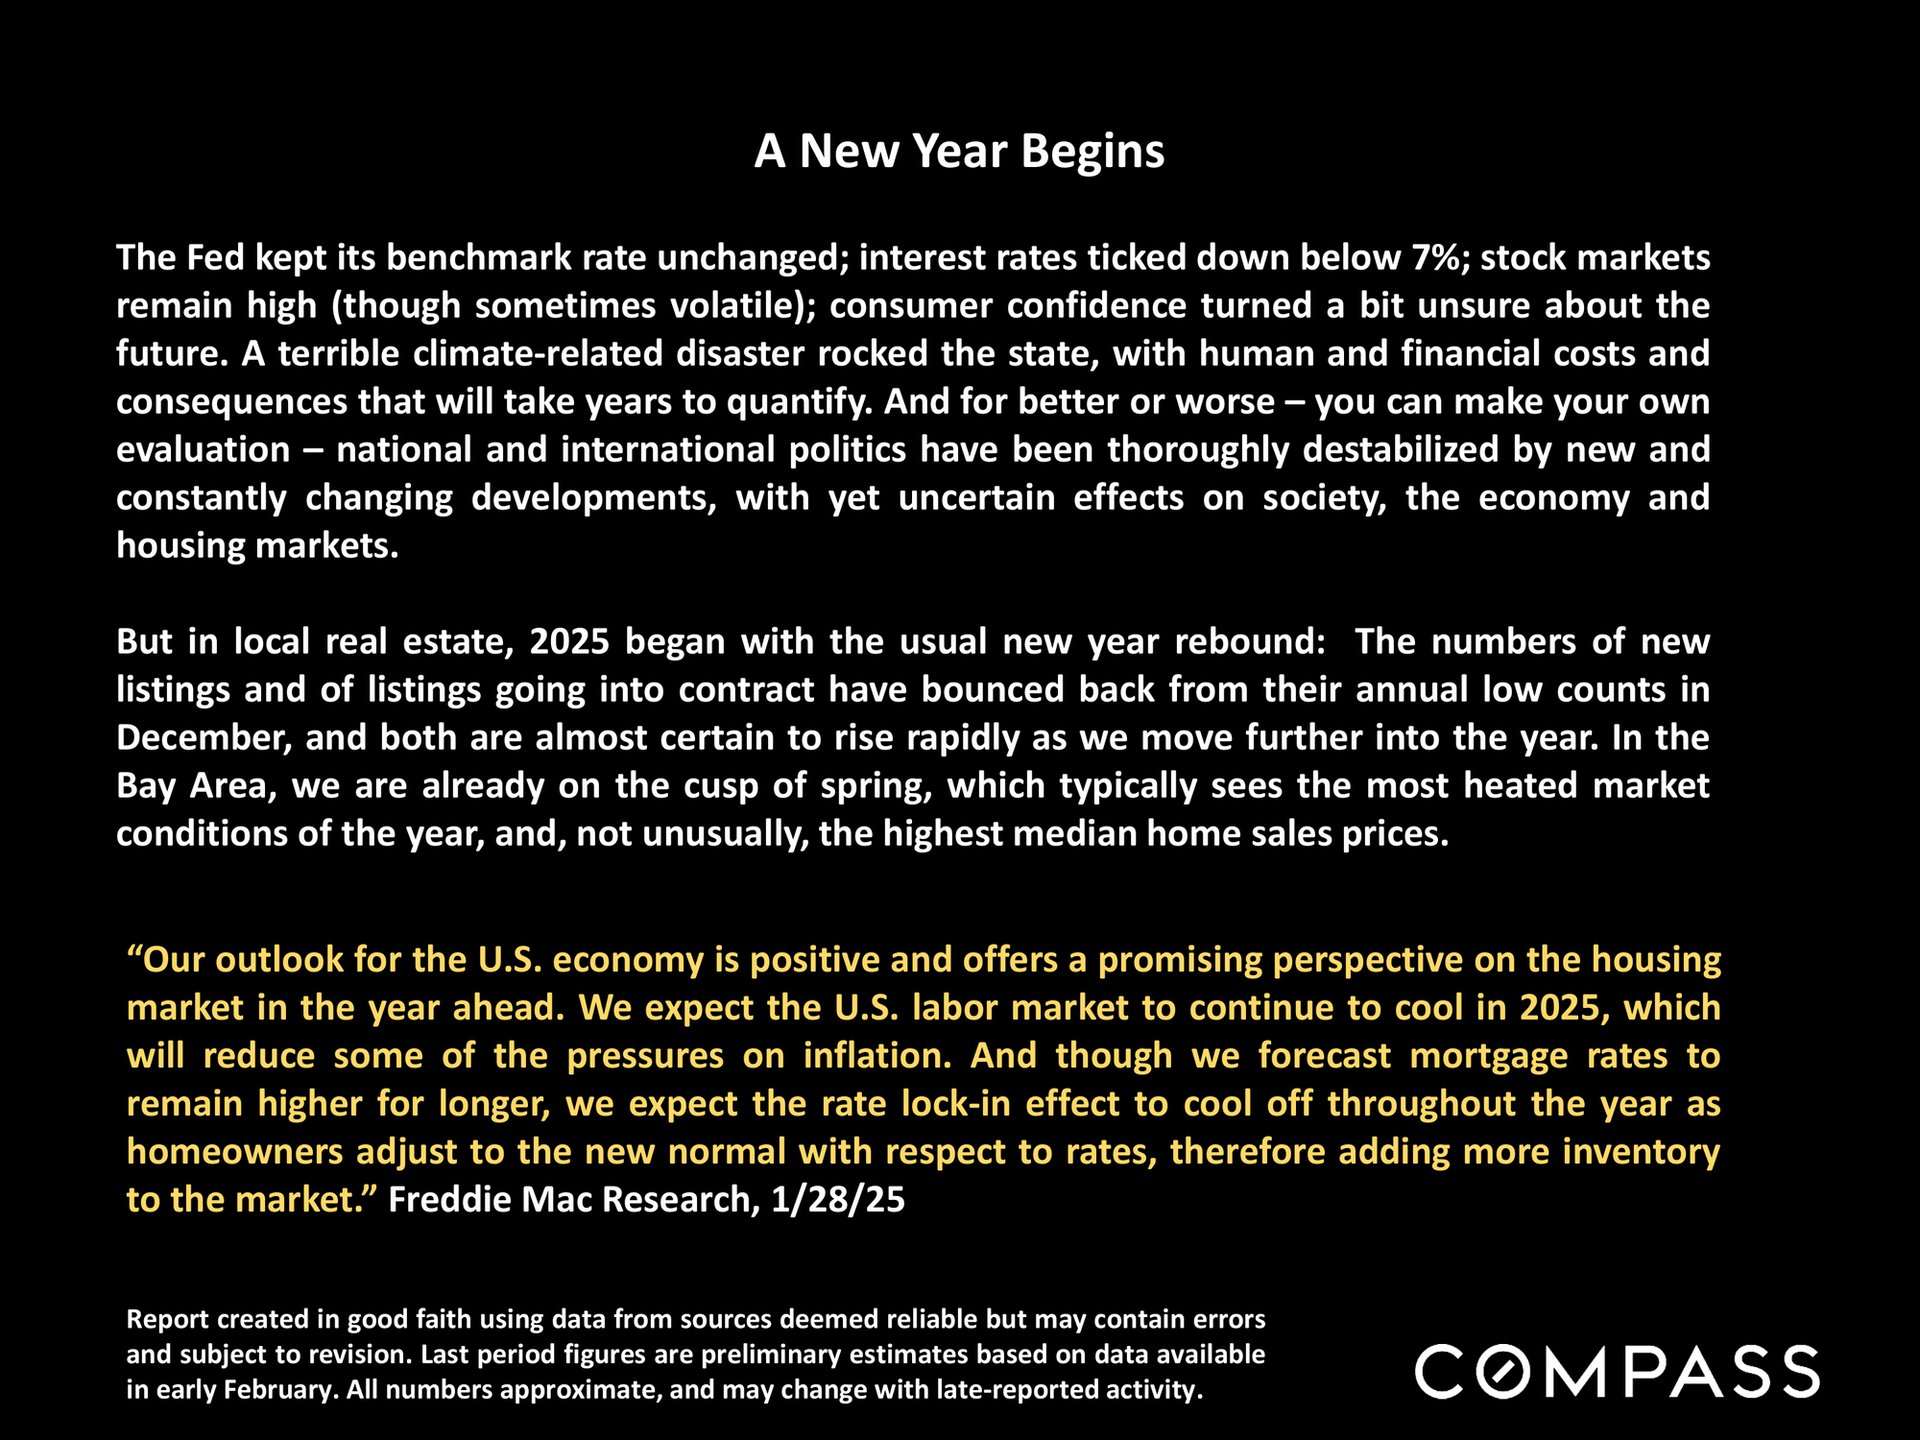

Marin County Real Estate February 2025 Report

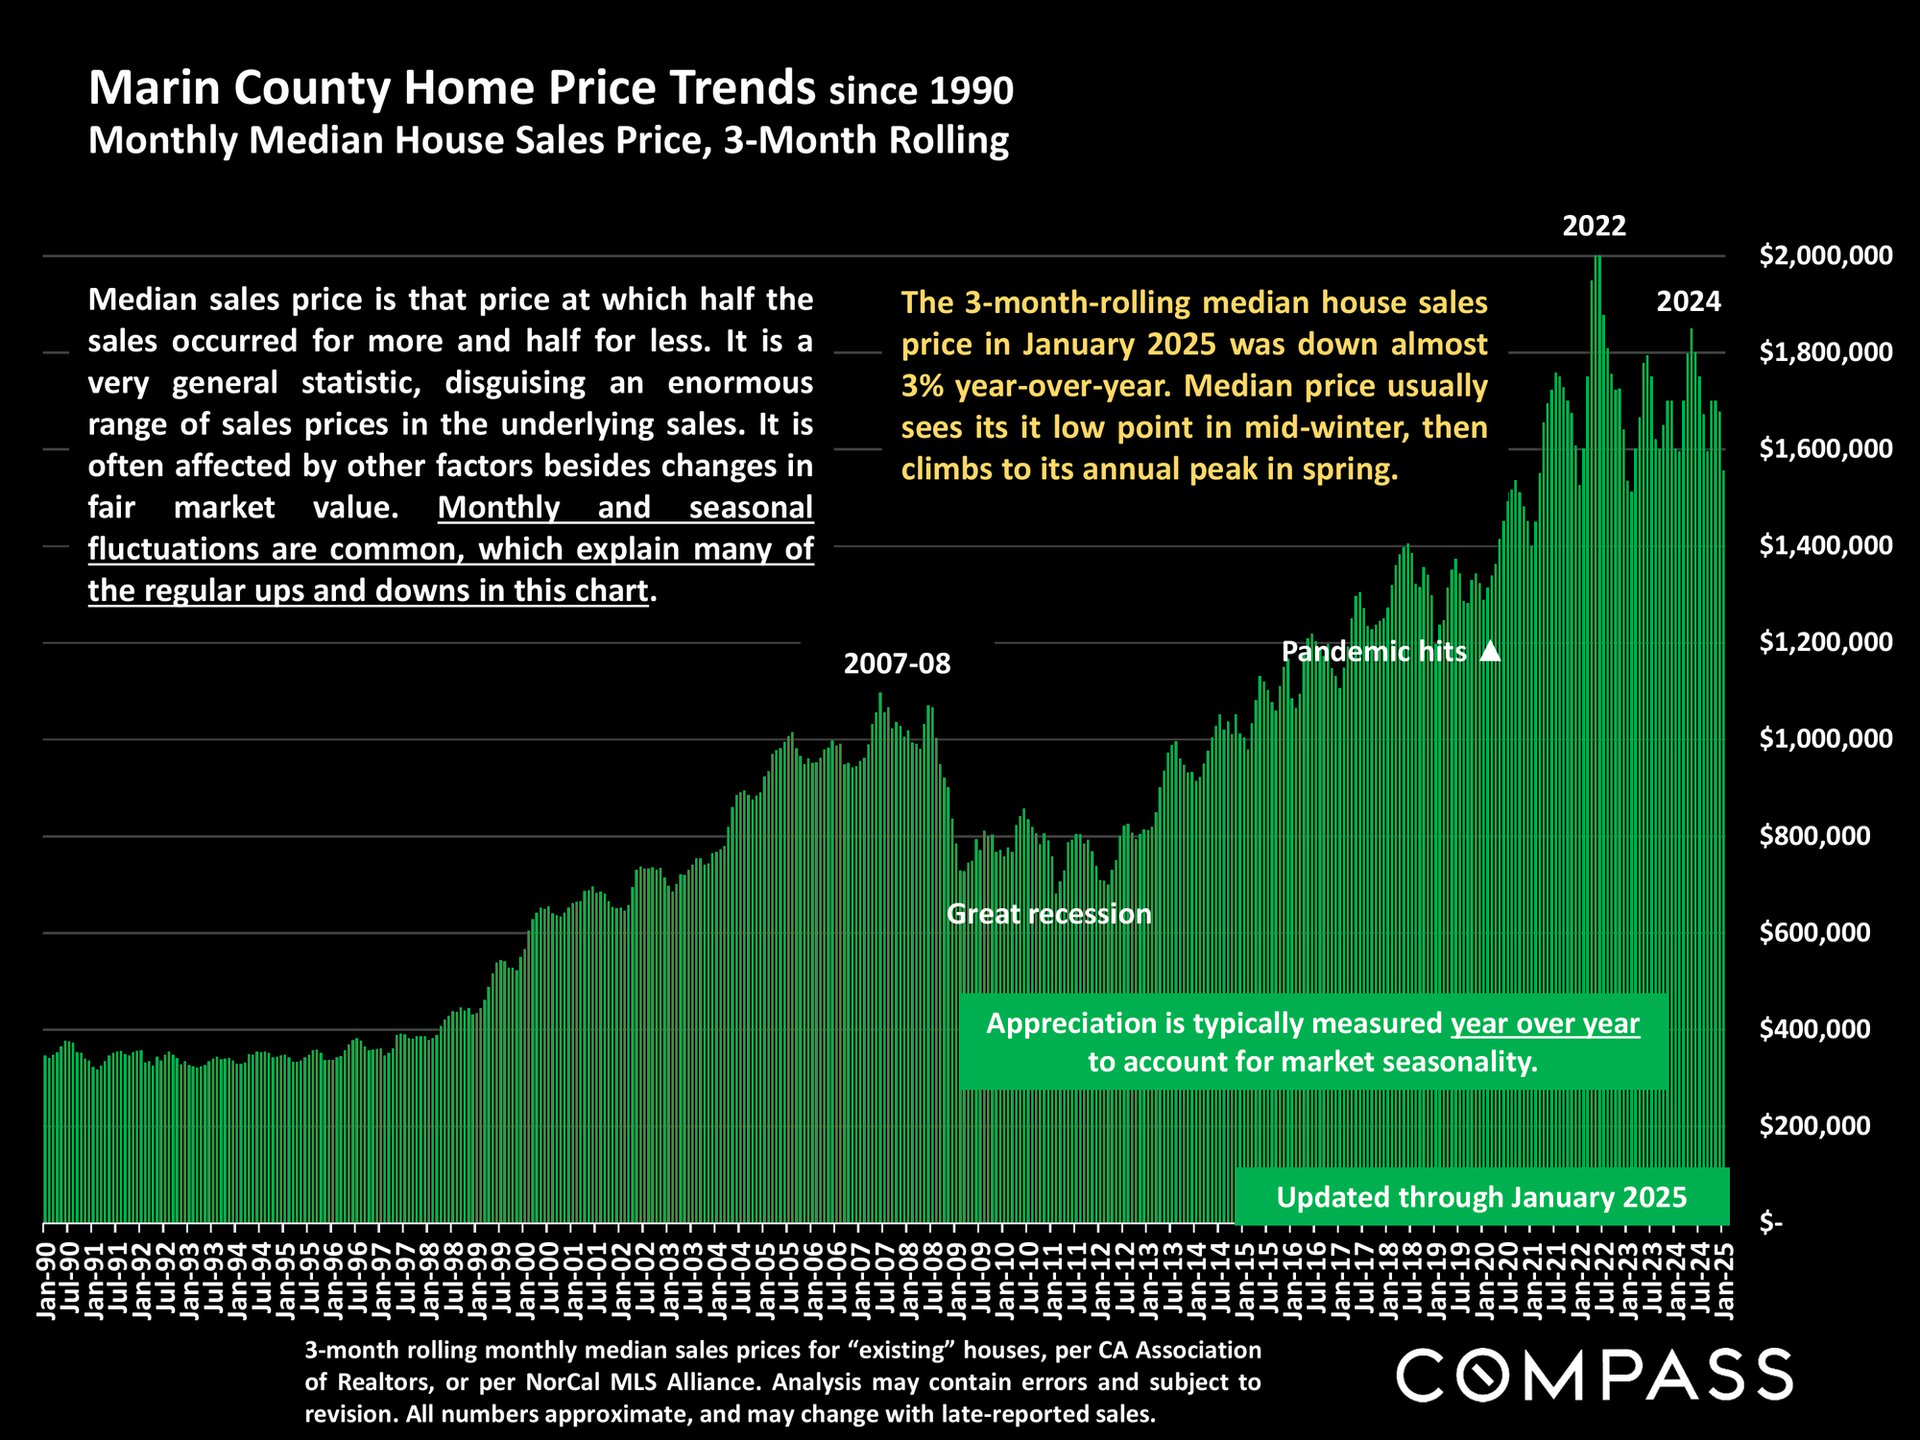
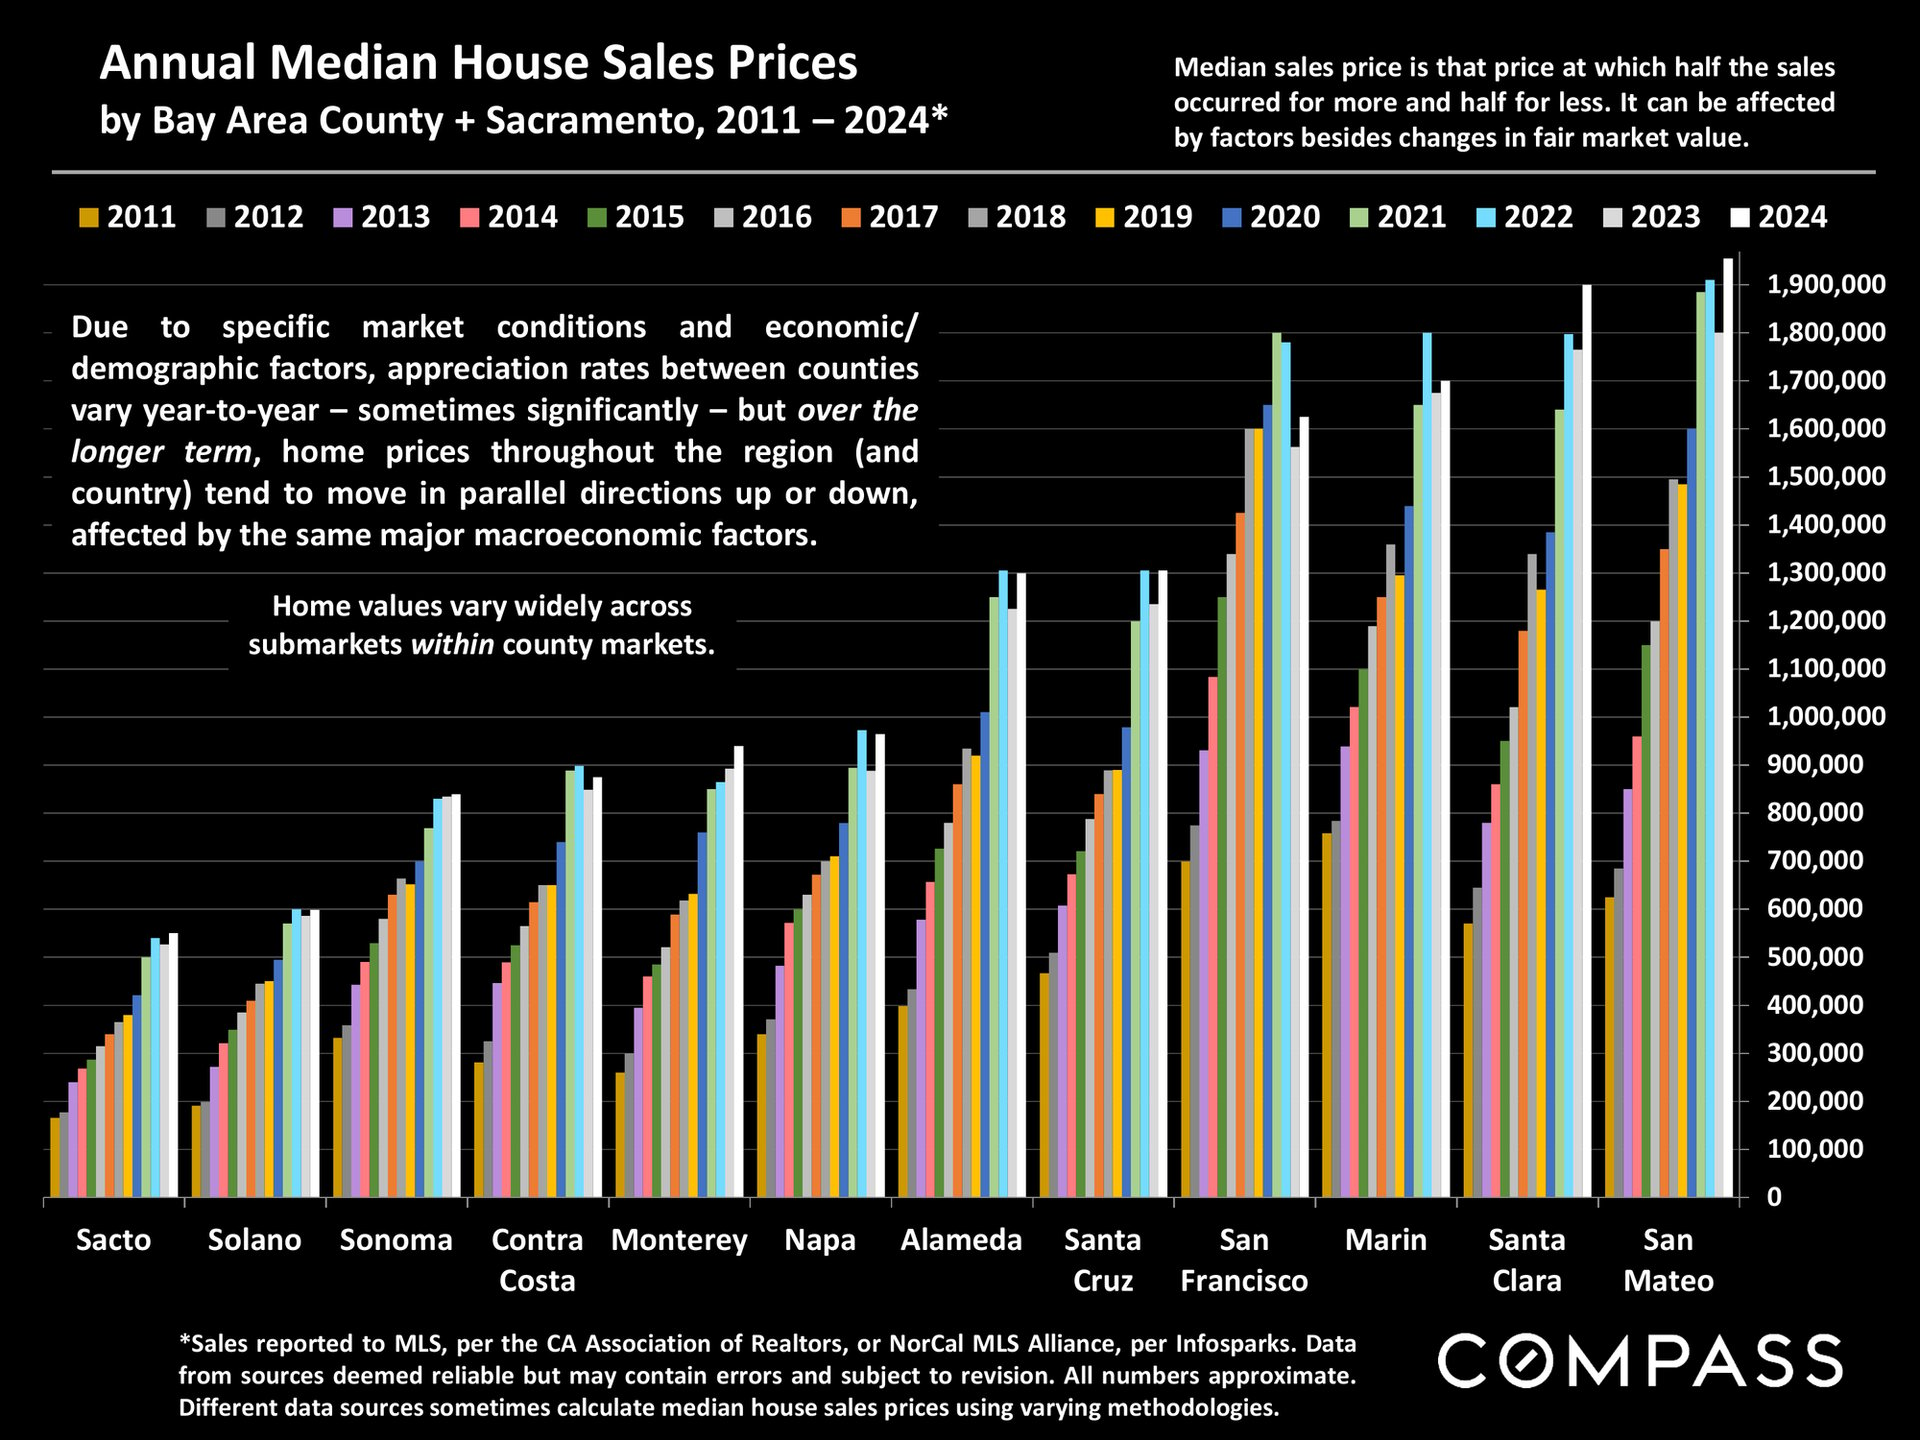
Marin County Real Estate February 2025 ReportOpening slide for a 2025 real estate report, summarizing economic conditions and the Bay Area housing market outlook.Chart of jumbo mortgage rates from 2018 to February 2025, showing a sharp rise beginning in 2022.Chart tracks Marin County median home prices from 1990 to January 2025, highlighting the Great Recession and pandemic-era rise.Bar chart of median house sale prices by county, 2011–2024, with Marin prices reaching about $1.9 million in 2024.
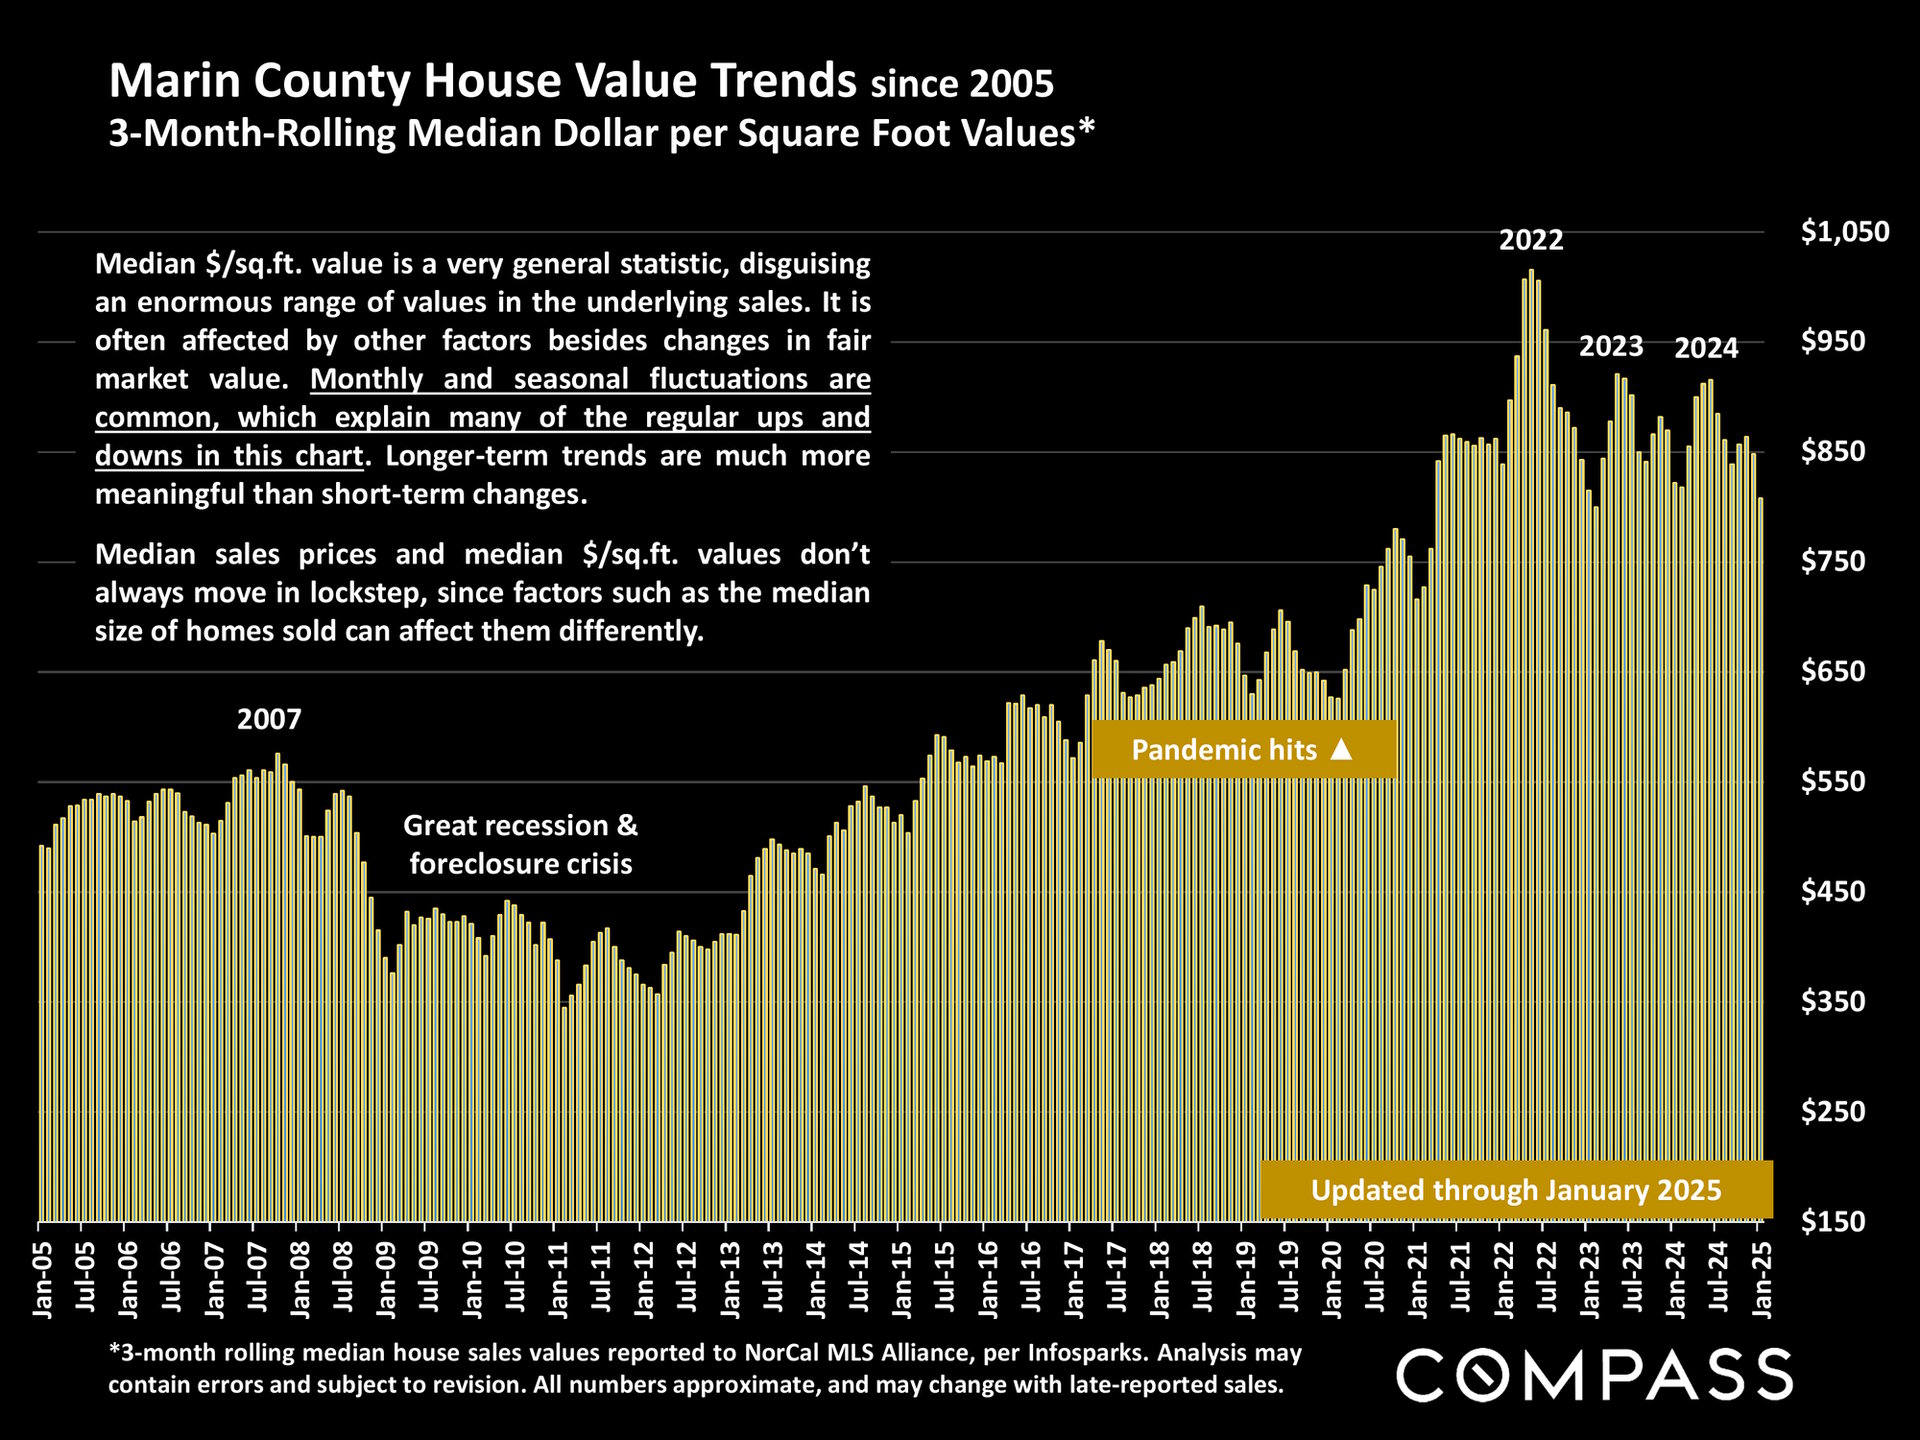
Chart of Marin County home values per square foot, with yellow bars from 2005 through January 2025.
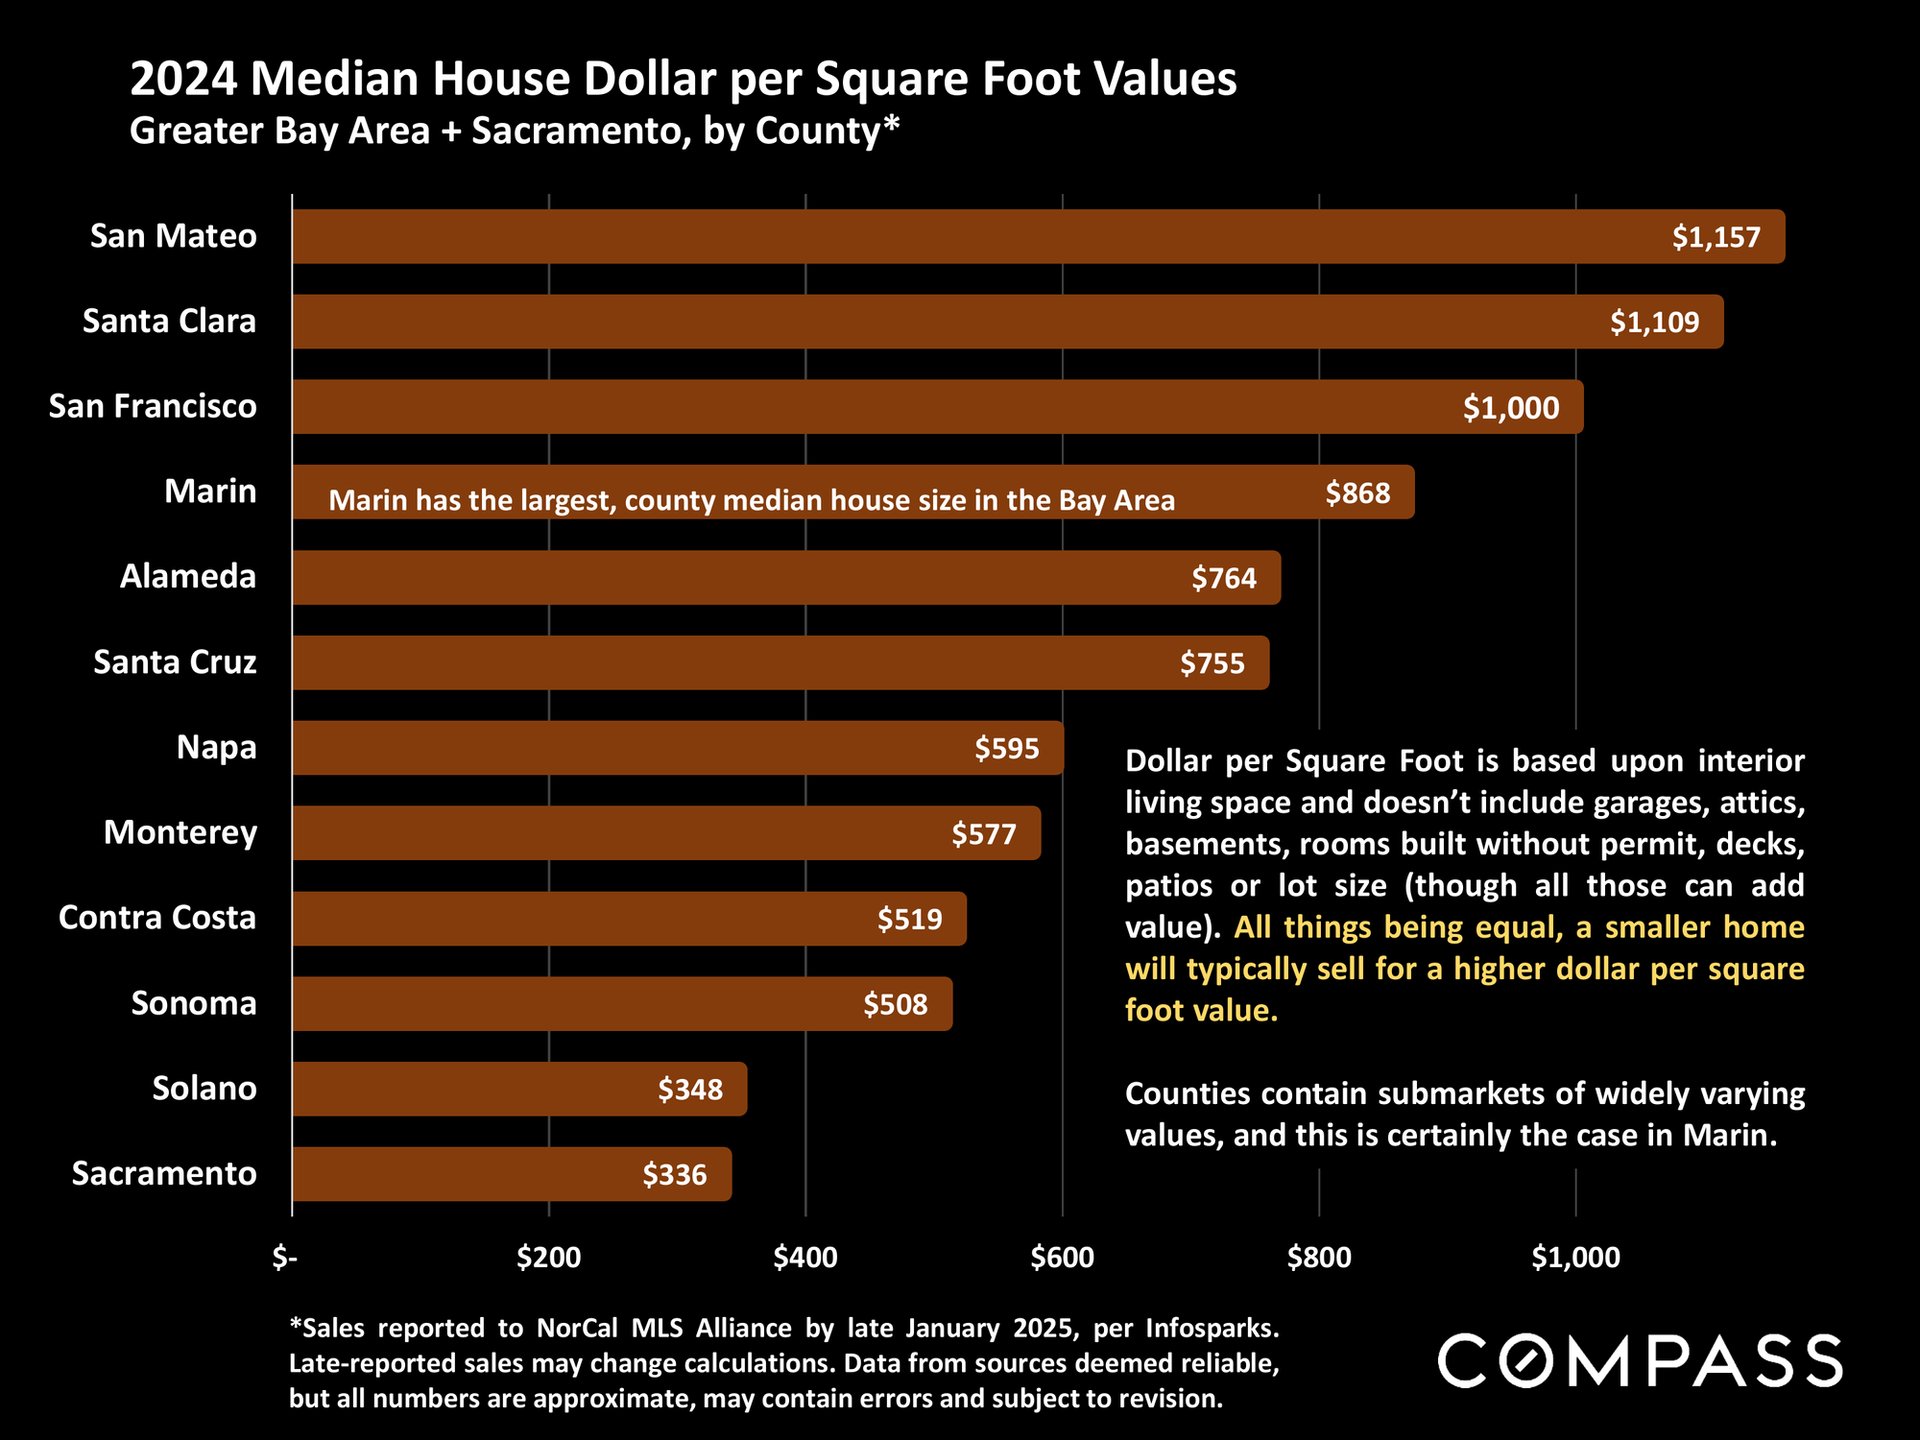
Chart of 2024 median house prices per square foot by county, with Marin at $868 and San Mateo leading at $1,157.
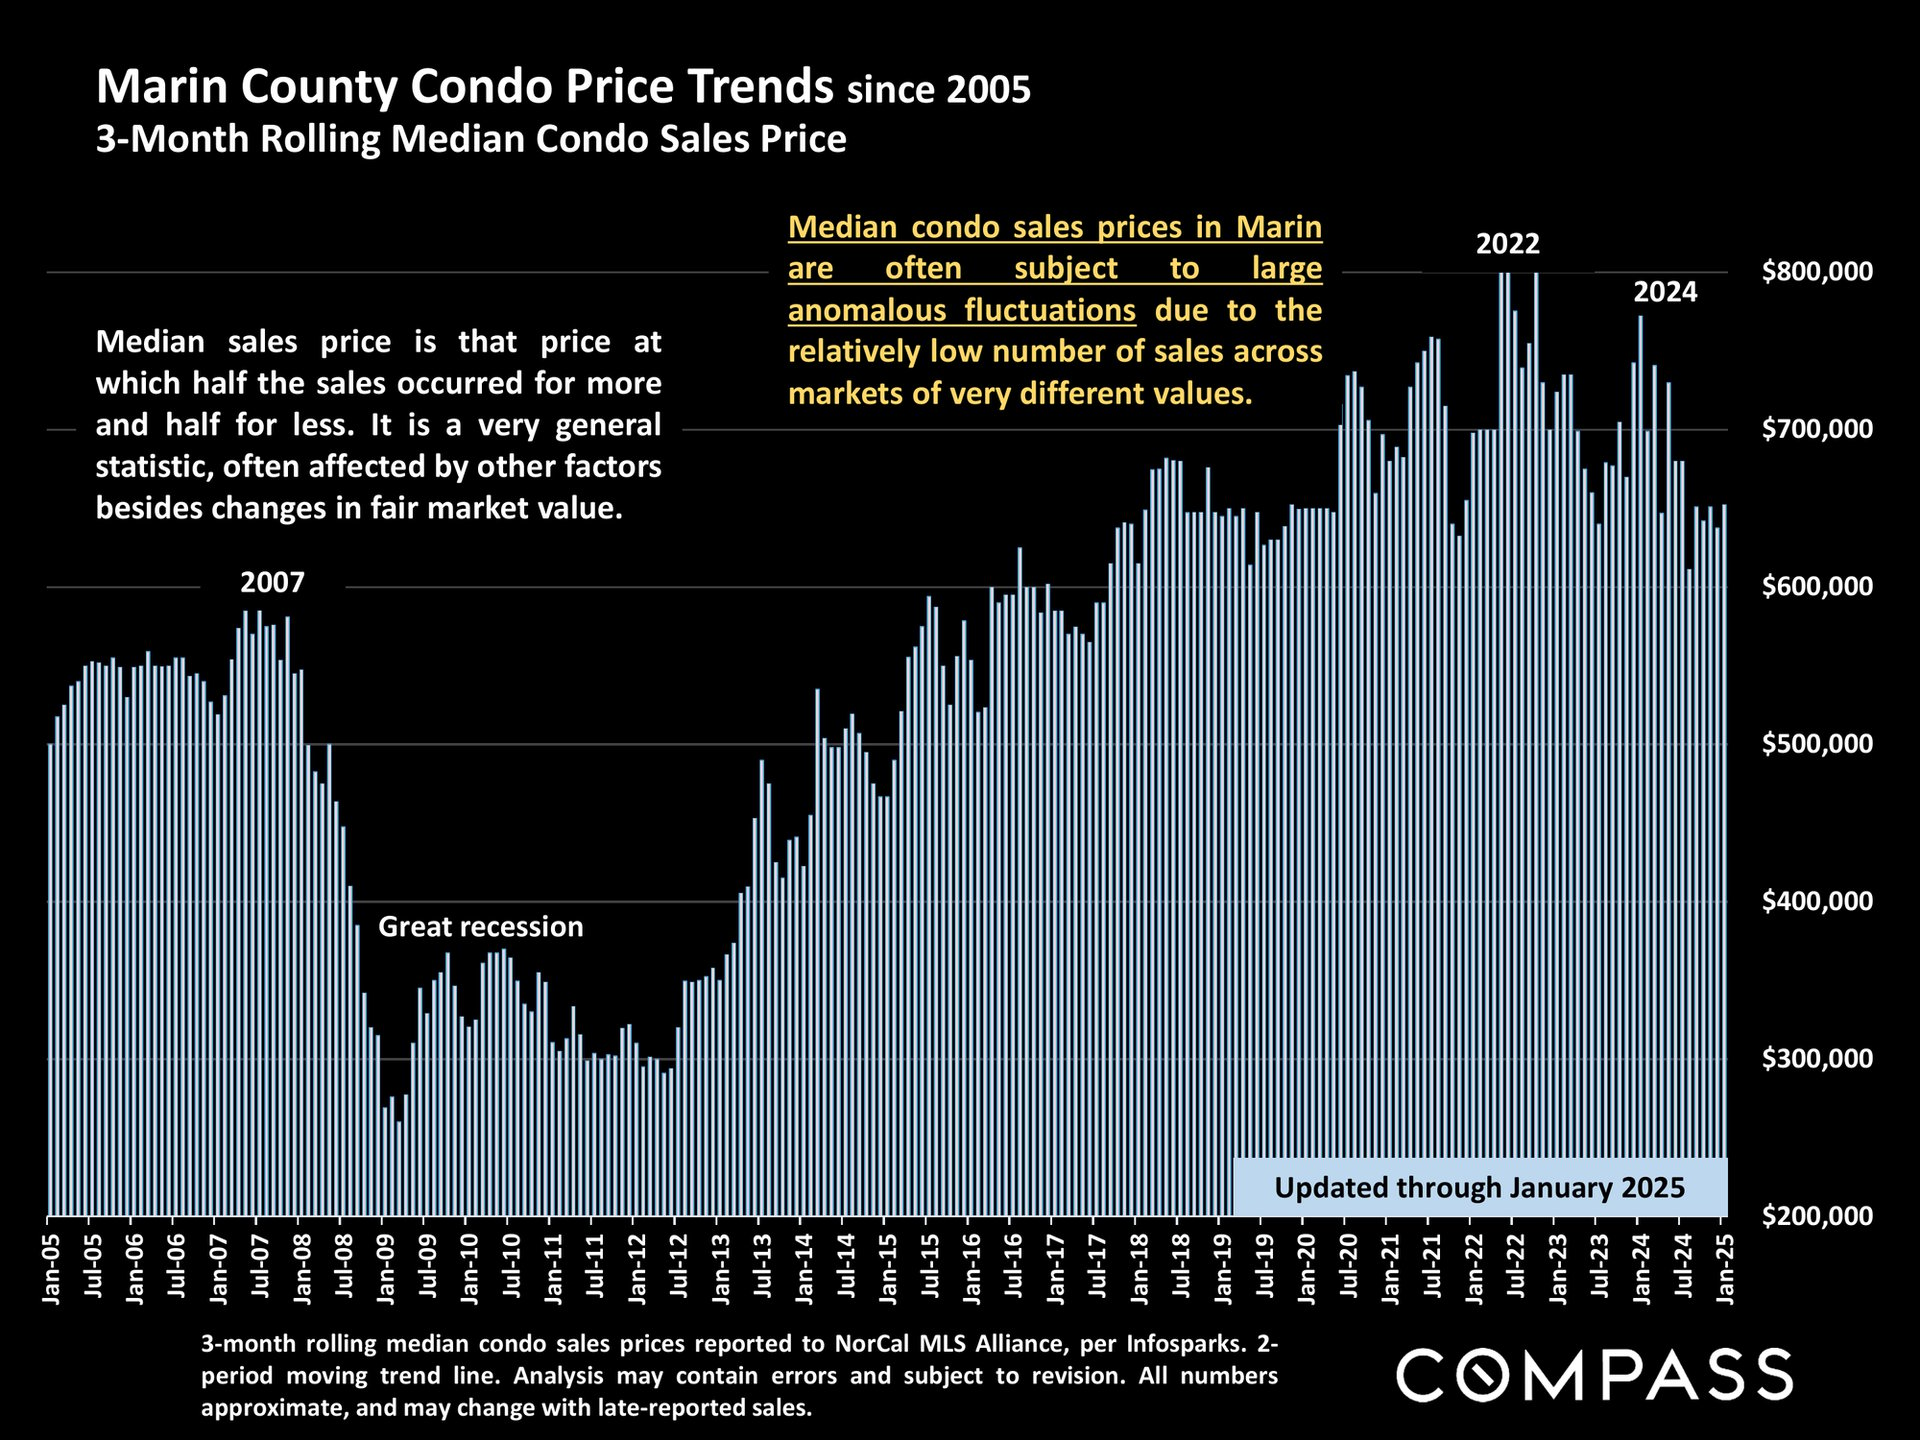
Chart of Marin County condo prices, 2005–2025, showing recession-era decline and later rise with sharp fluctuations.
Chart of monthly new listings in Marin County from December 2019 through December 2024.
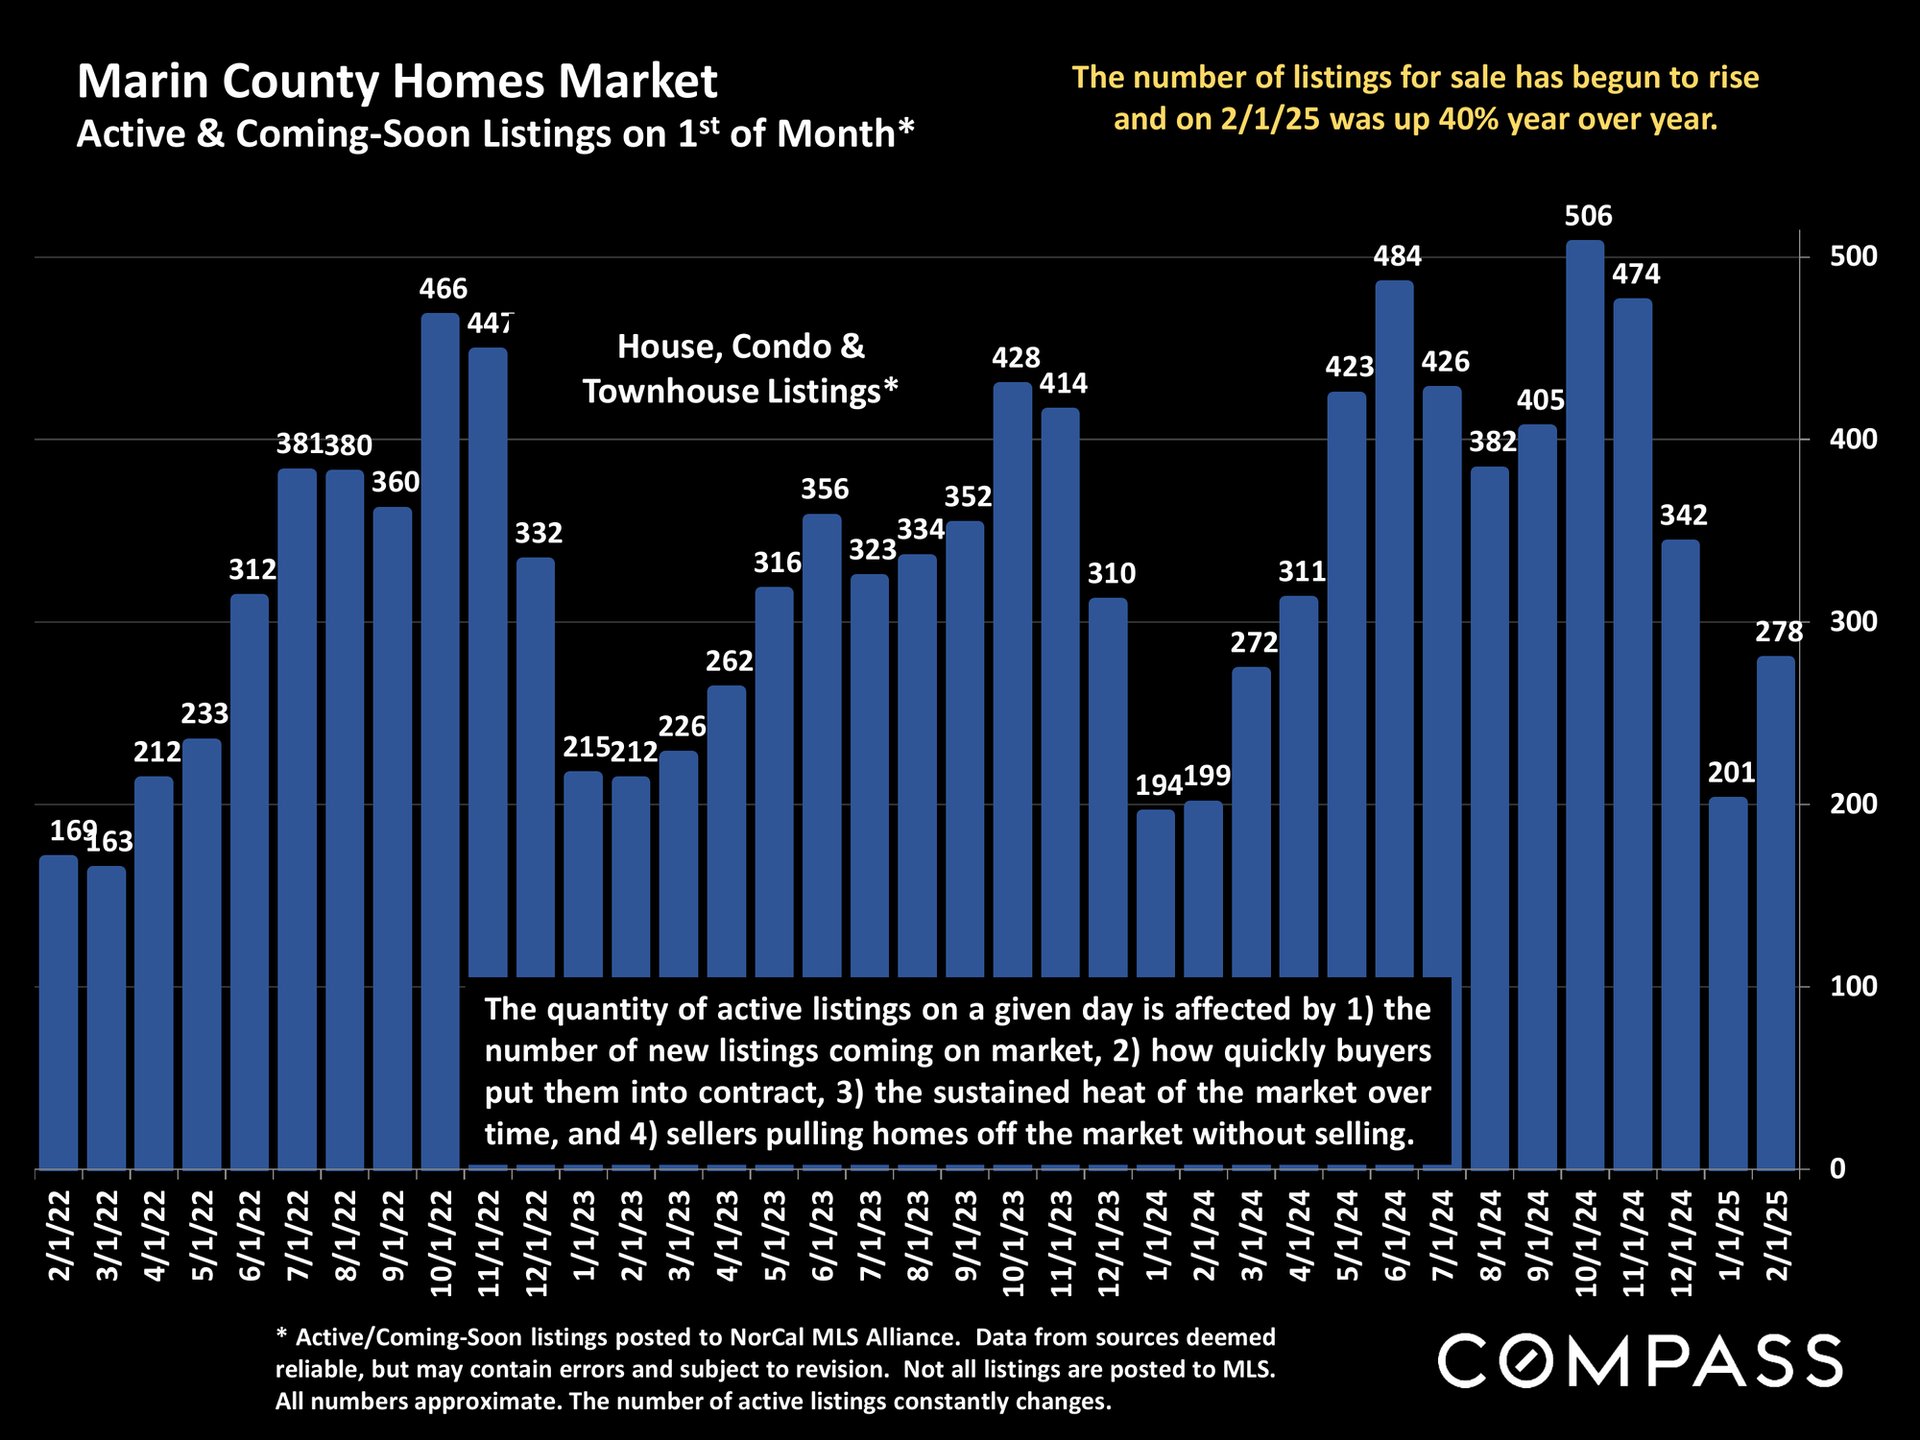
Bar chart of Marin County home listings from 2022 to 2025; listings rose 40% year over year by February 2025.
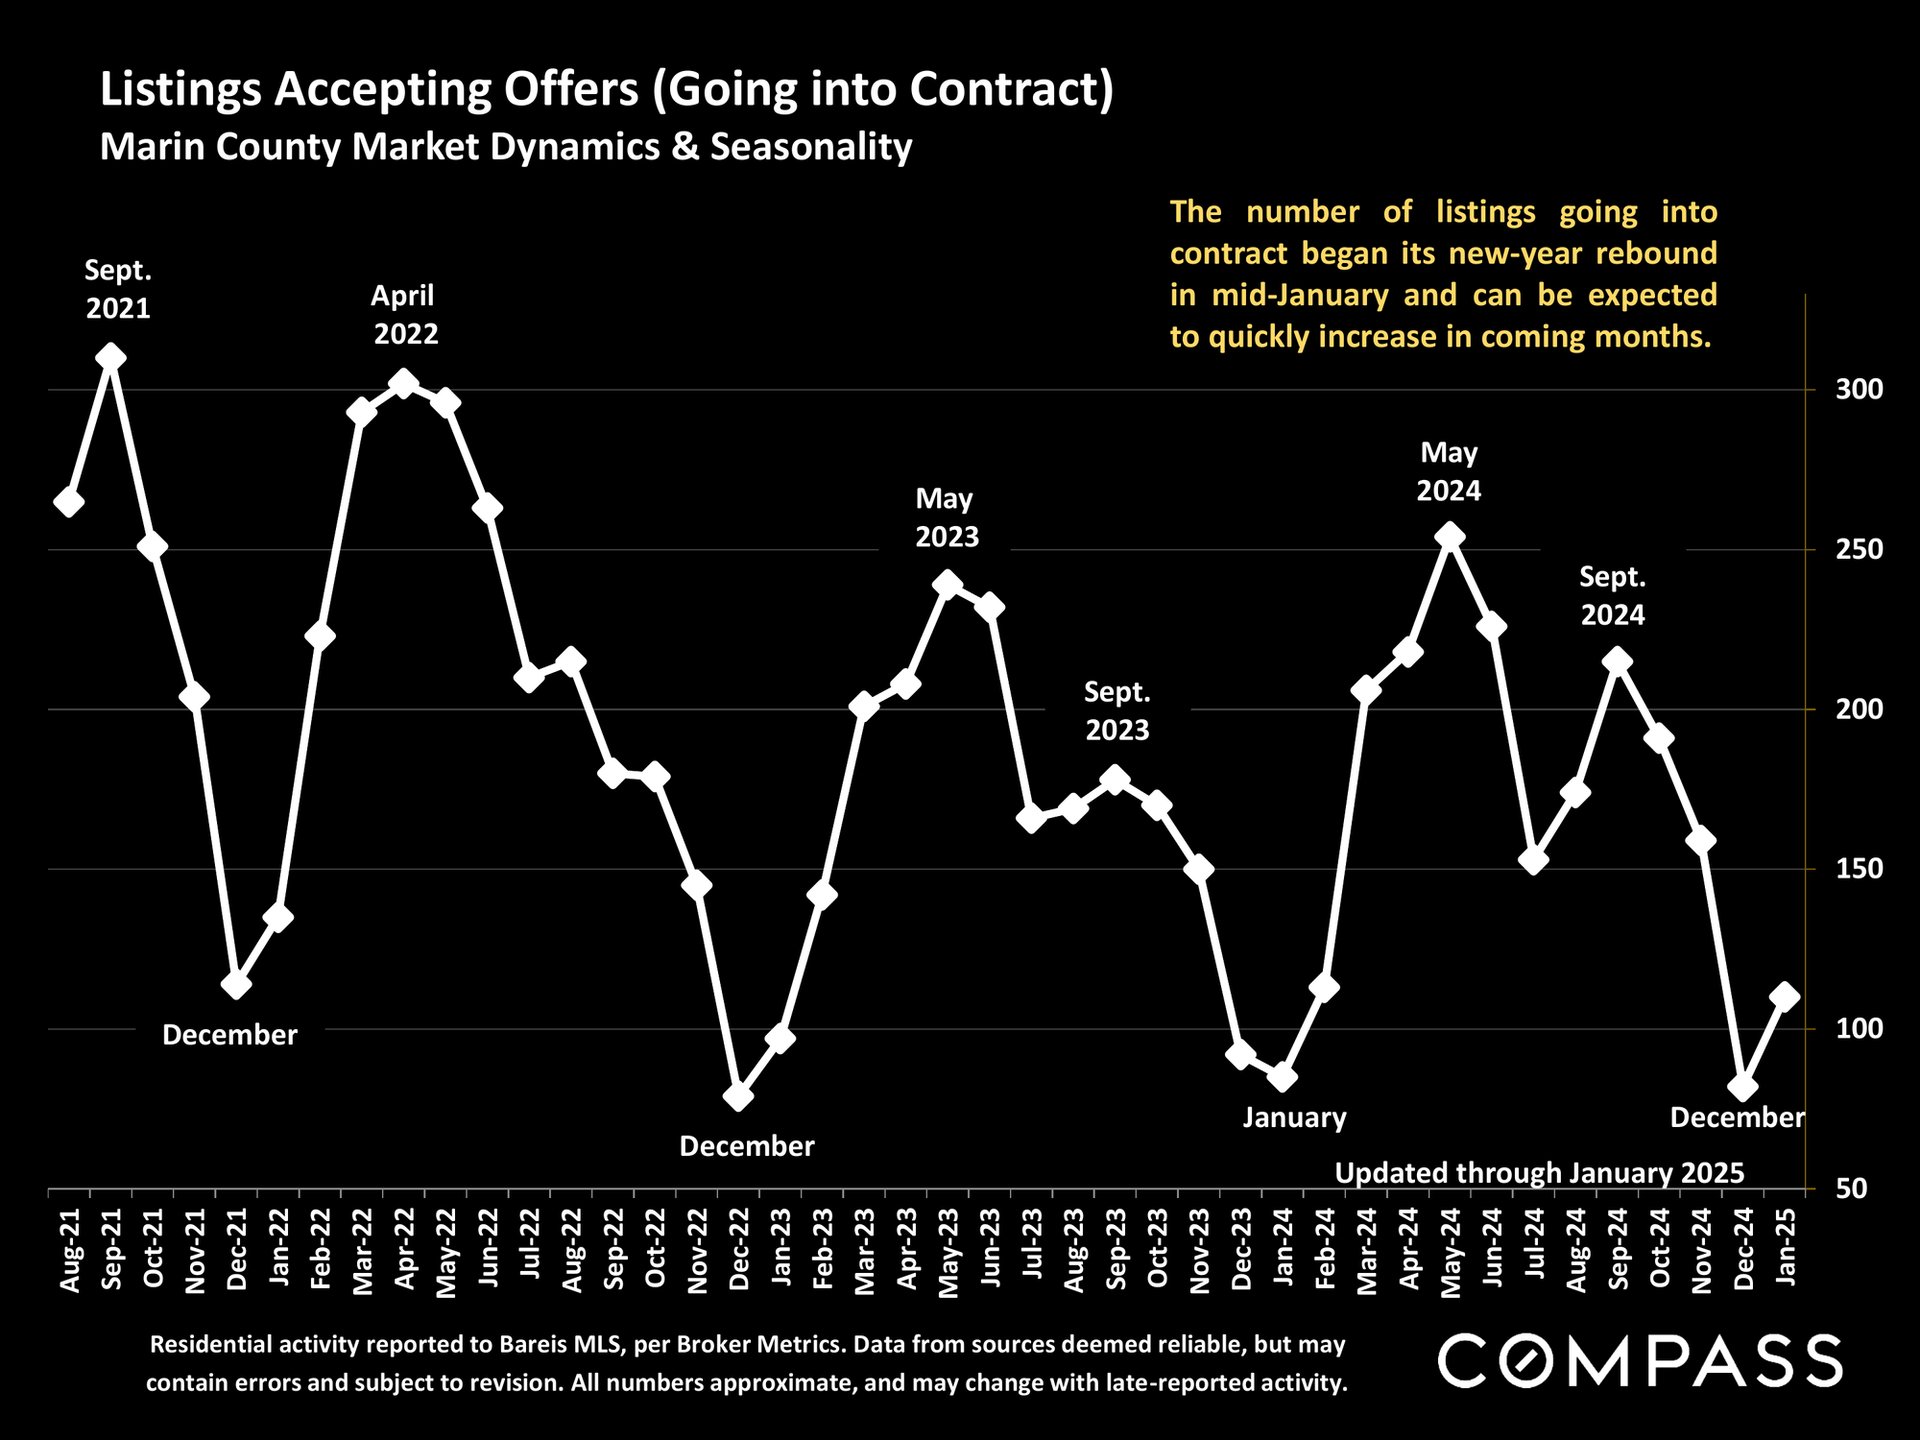
Chart of Marin County listings going into contract, showing monthly seasonal patterns from August 2021 through January 2025.
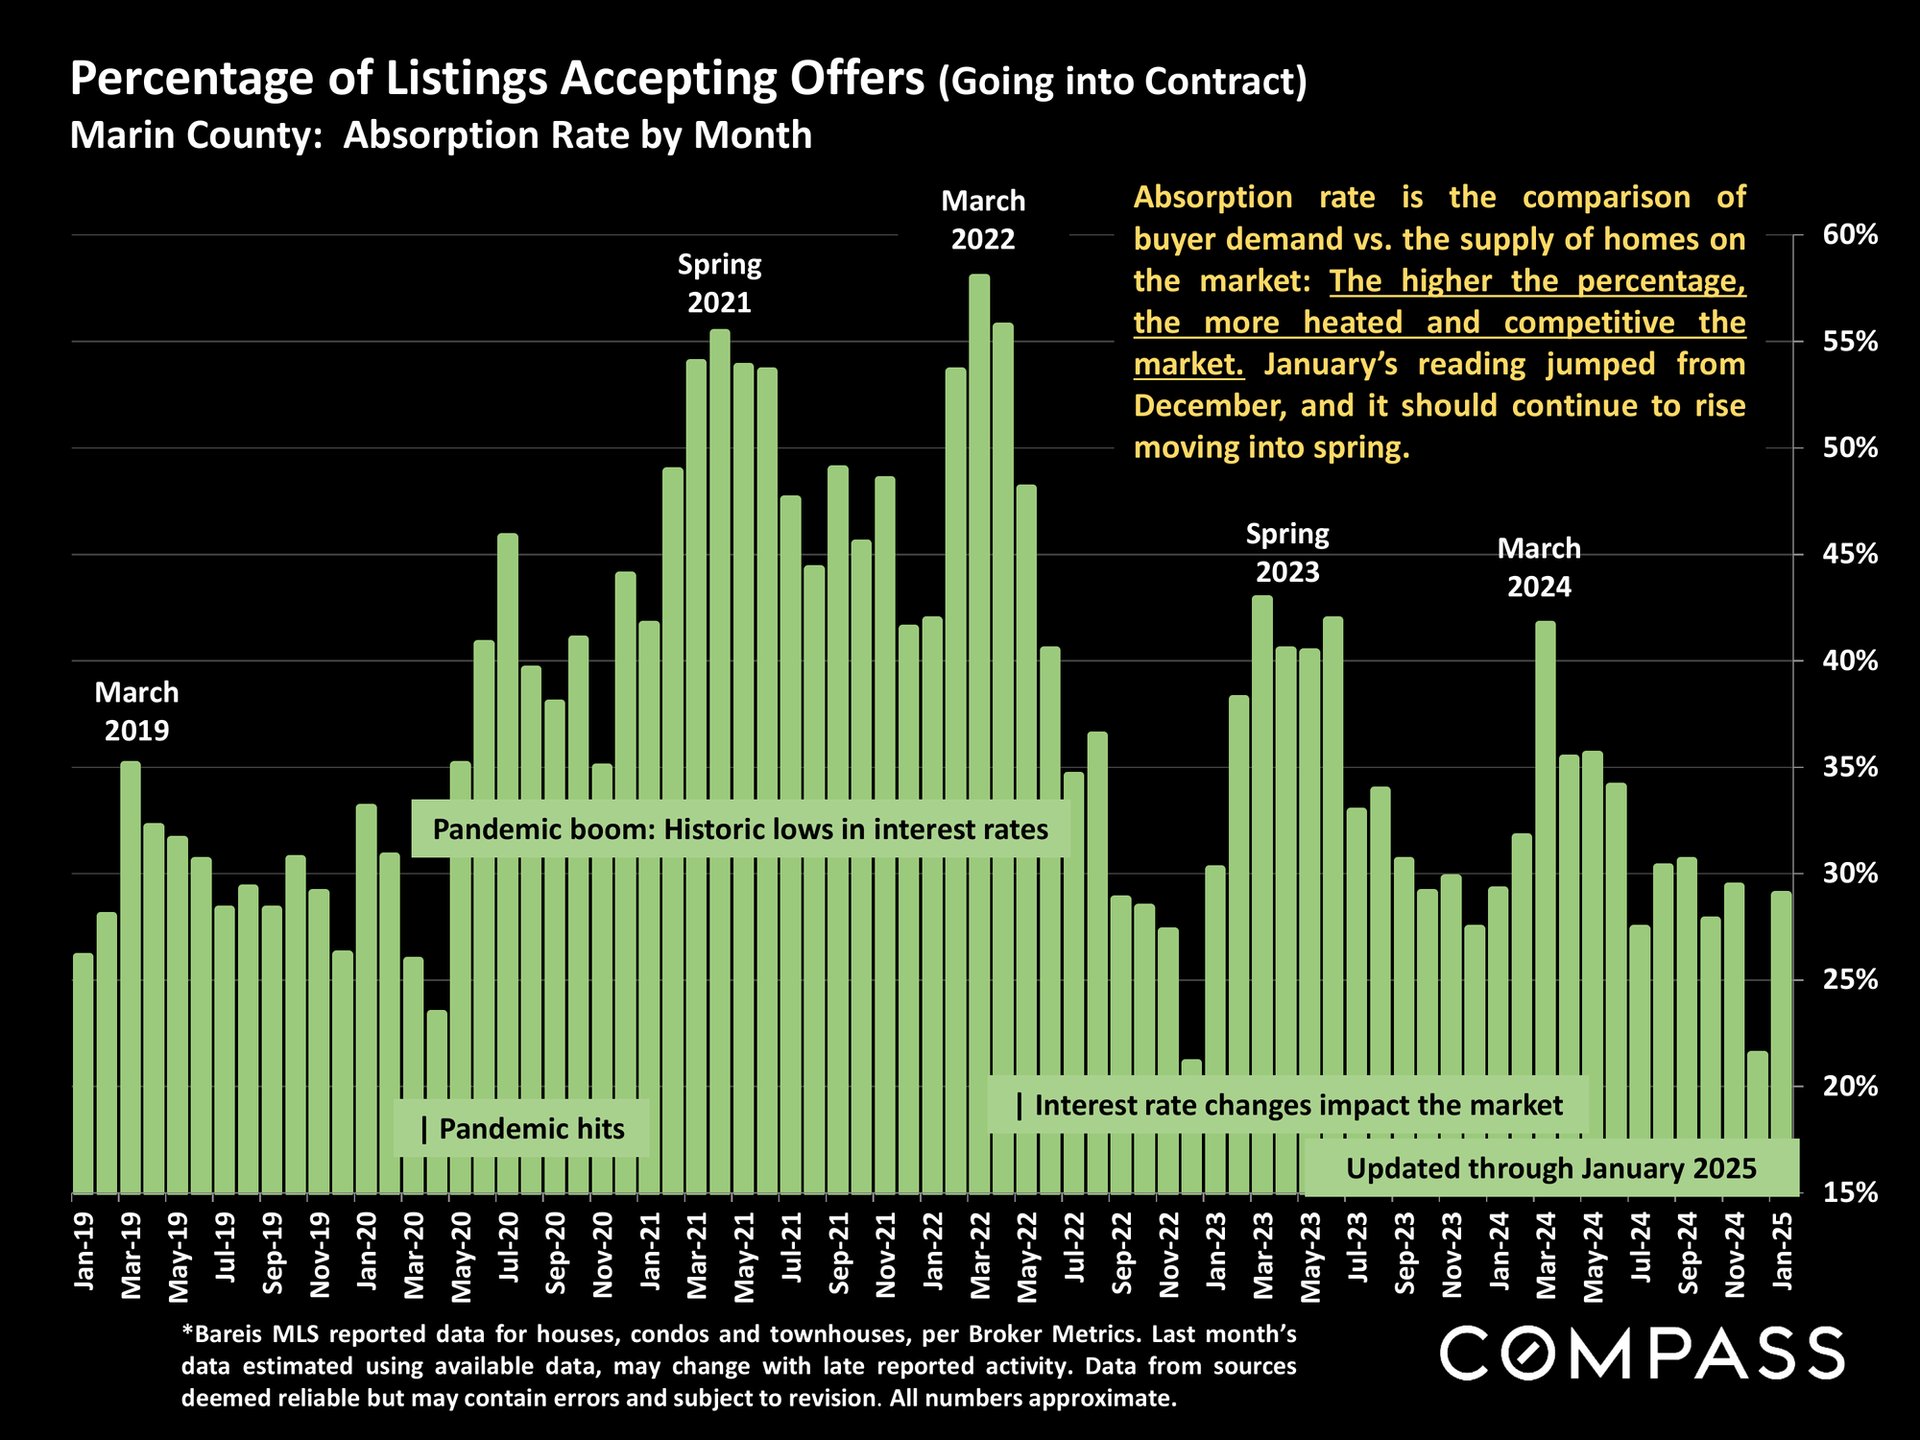
Bar chart of Marin County listing absorption rates from 2019 to January 2025, with pandemic and interest-rate annotations.
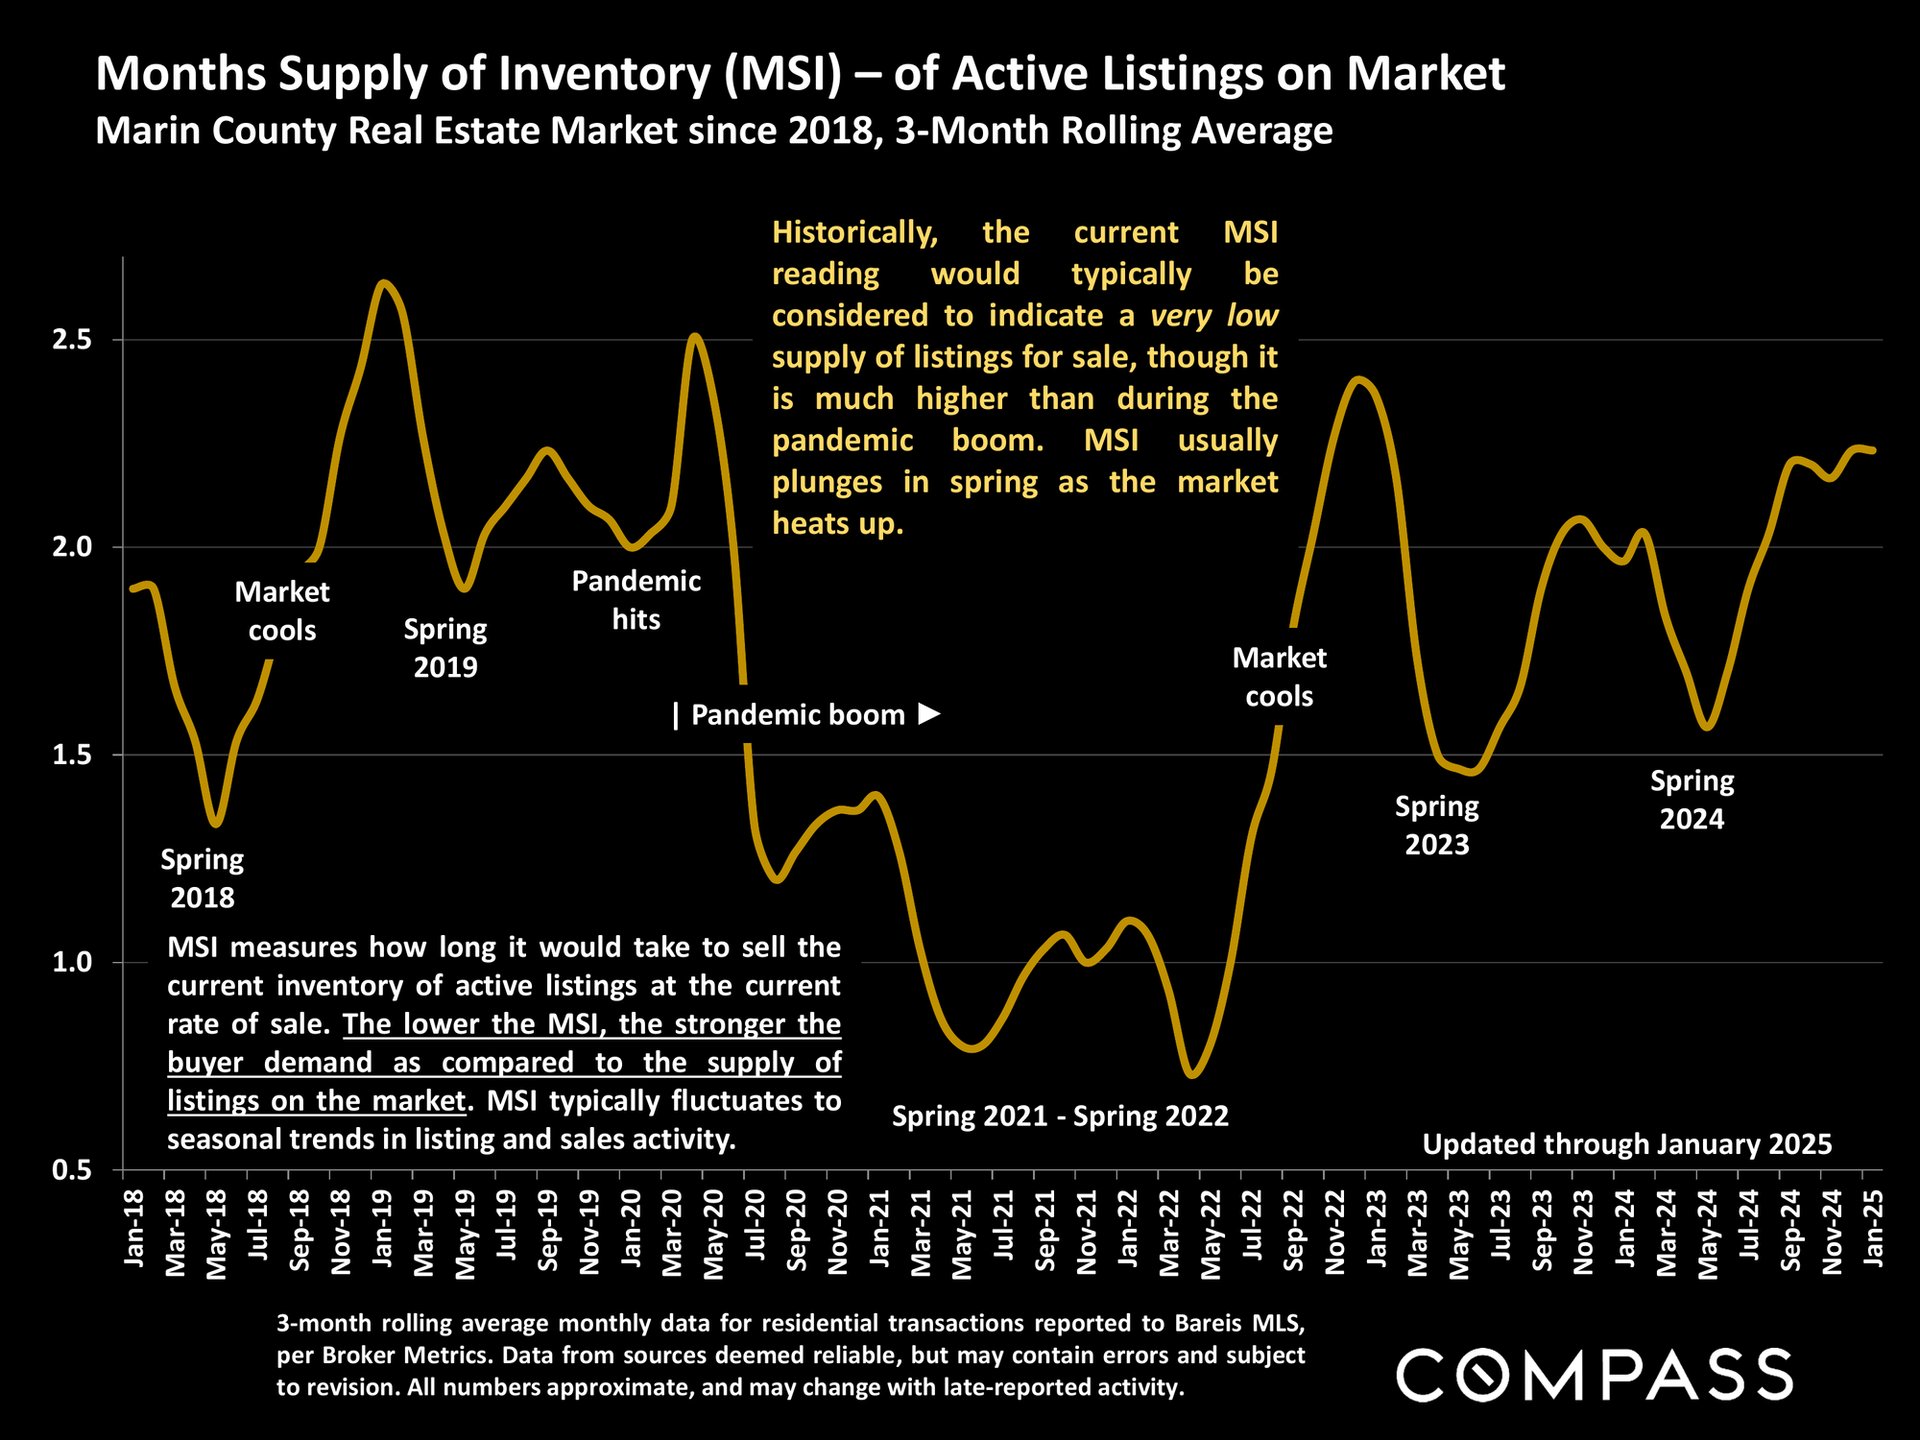
Chart of Marin County months of inventory from 2018 to January 2025, with a gold line and market annotations.
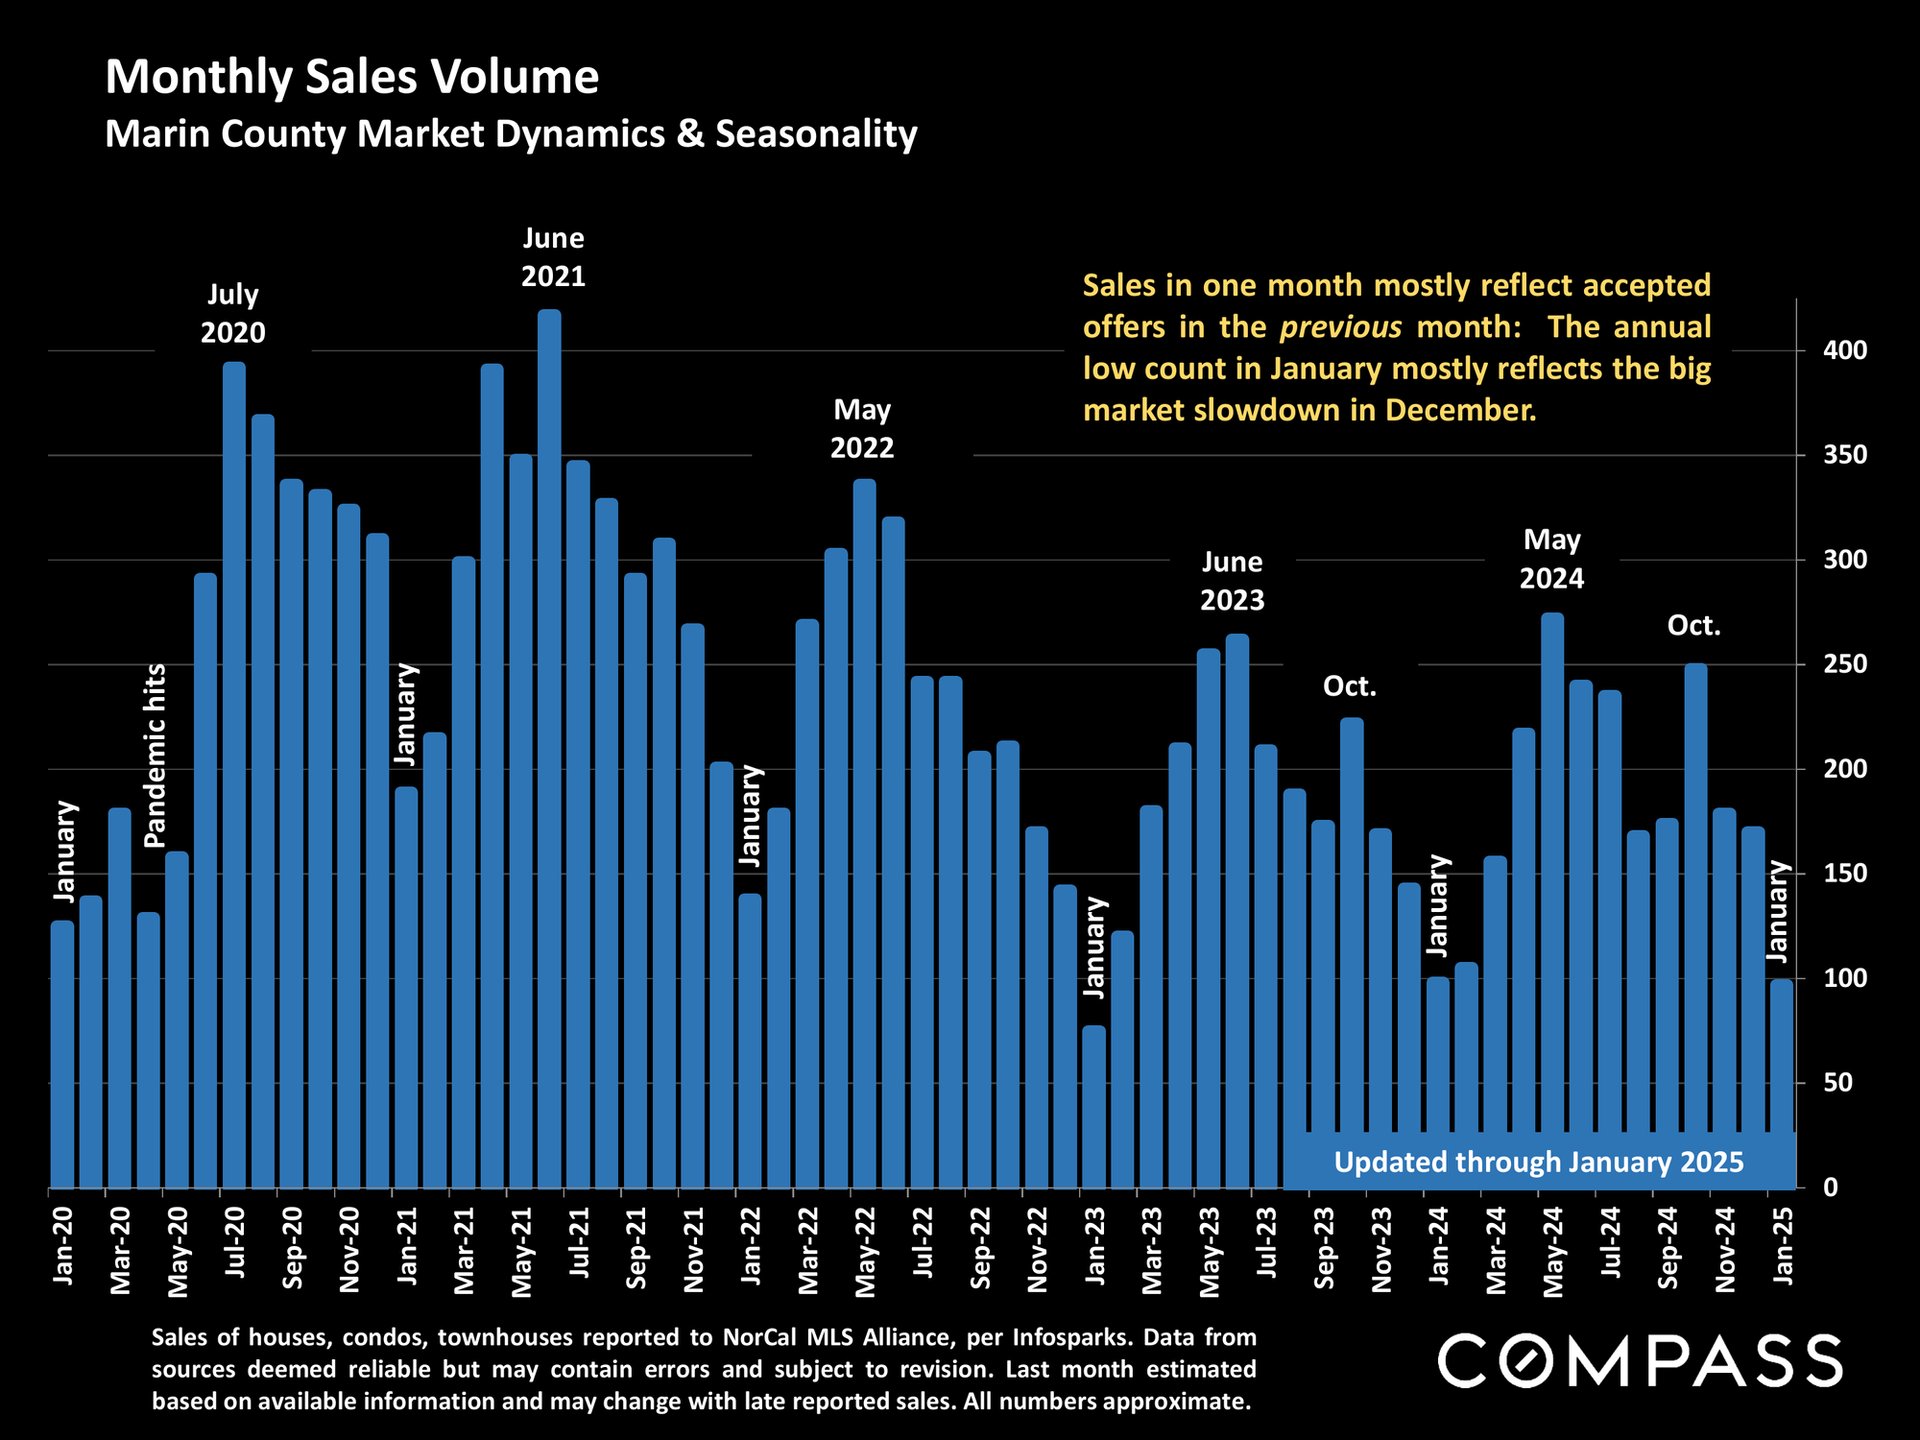
Bar chart of Marin County monthly home sales from January 2020 through January 2025, with seasonal peaks and market notes.
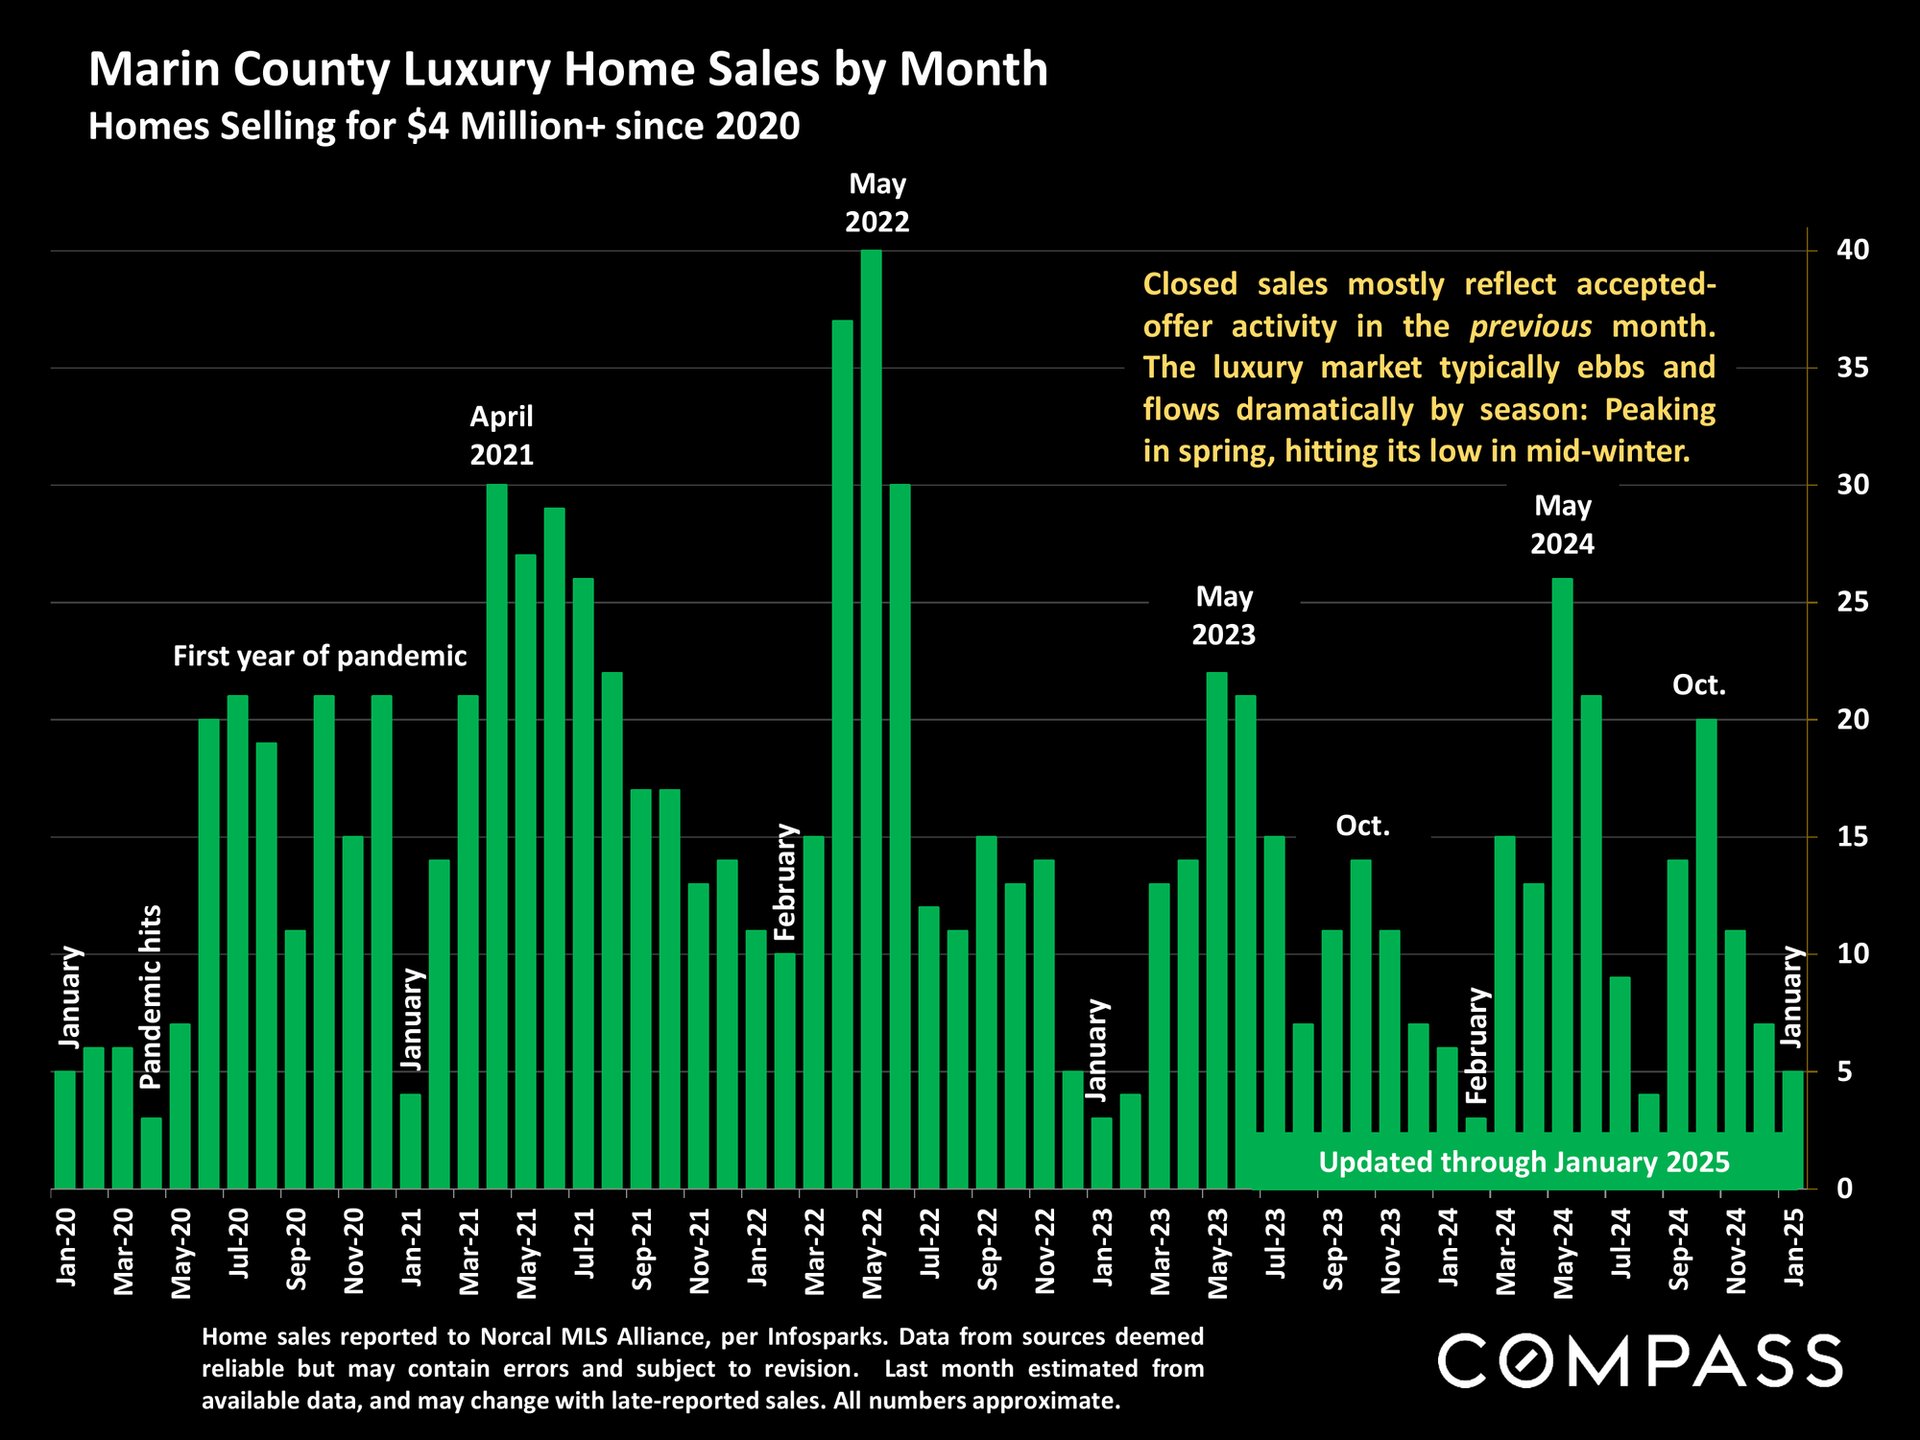
Chart of monthly Marin County home sales over $4 million, January 2020–January 2025, with spring peaks.
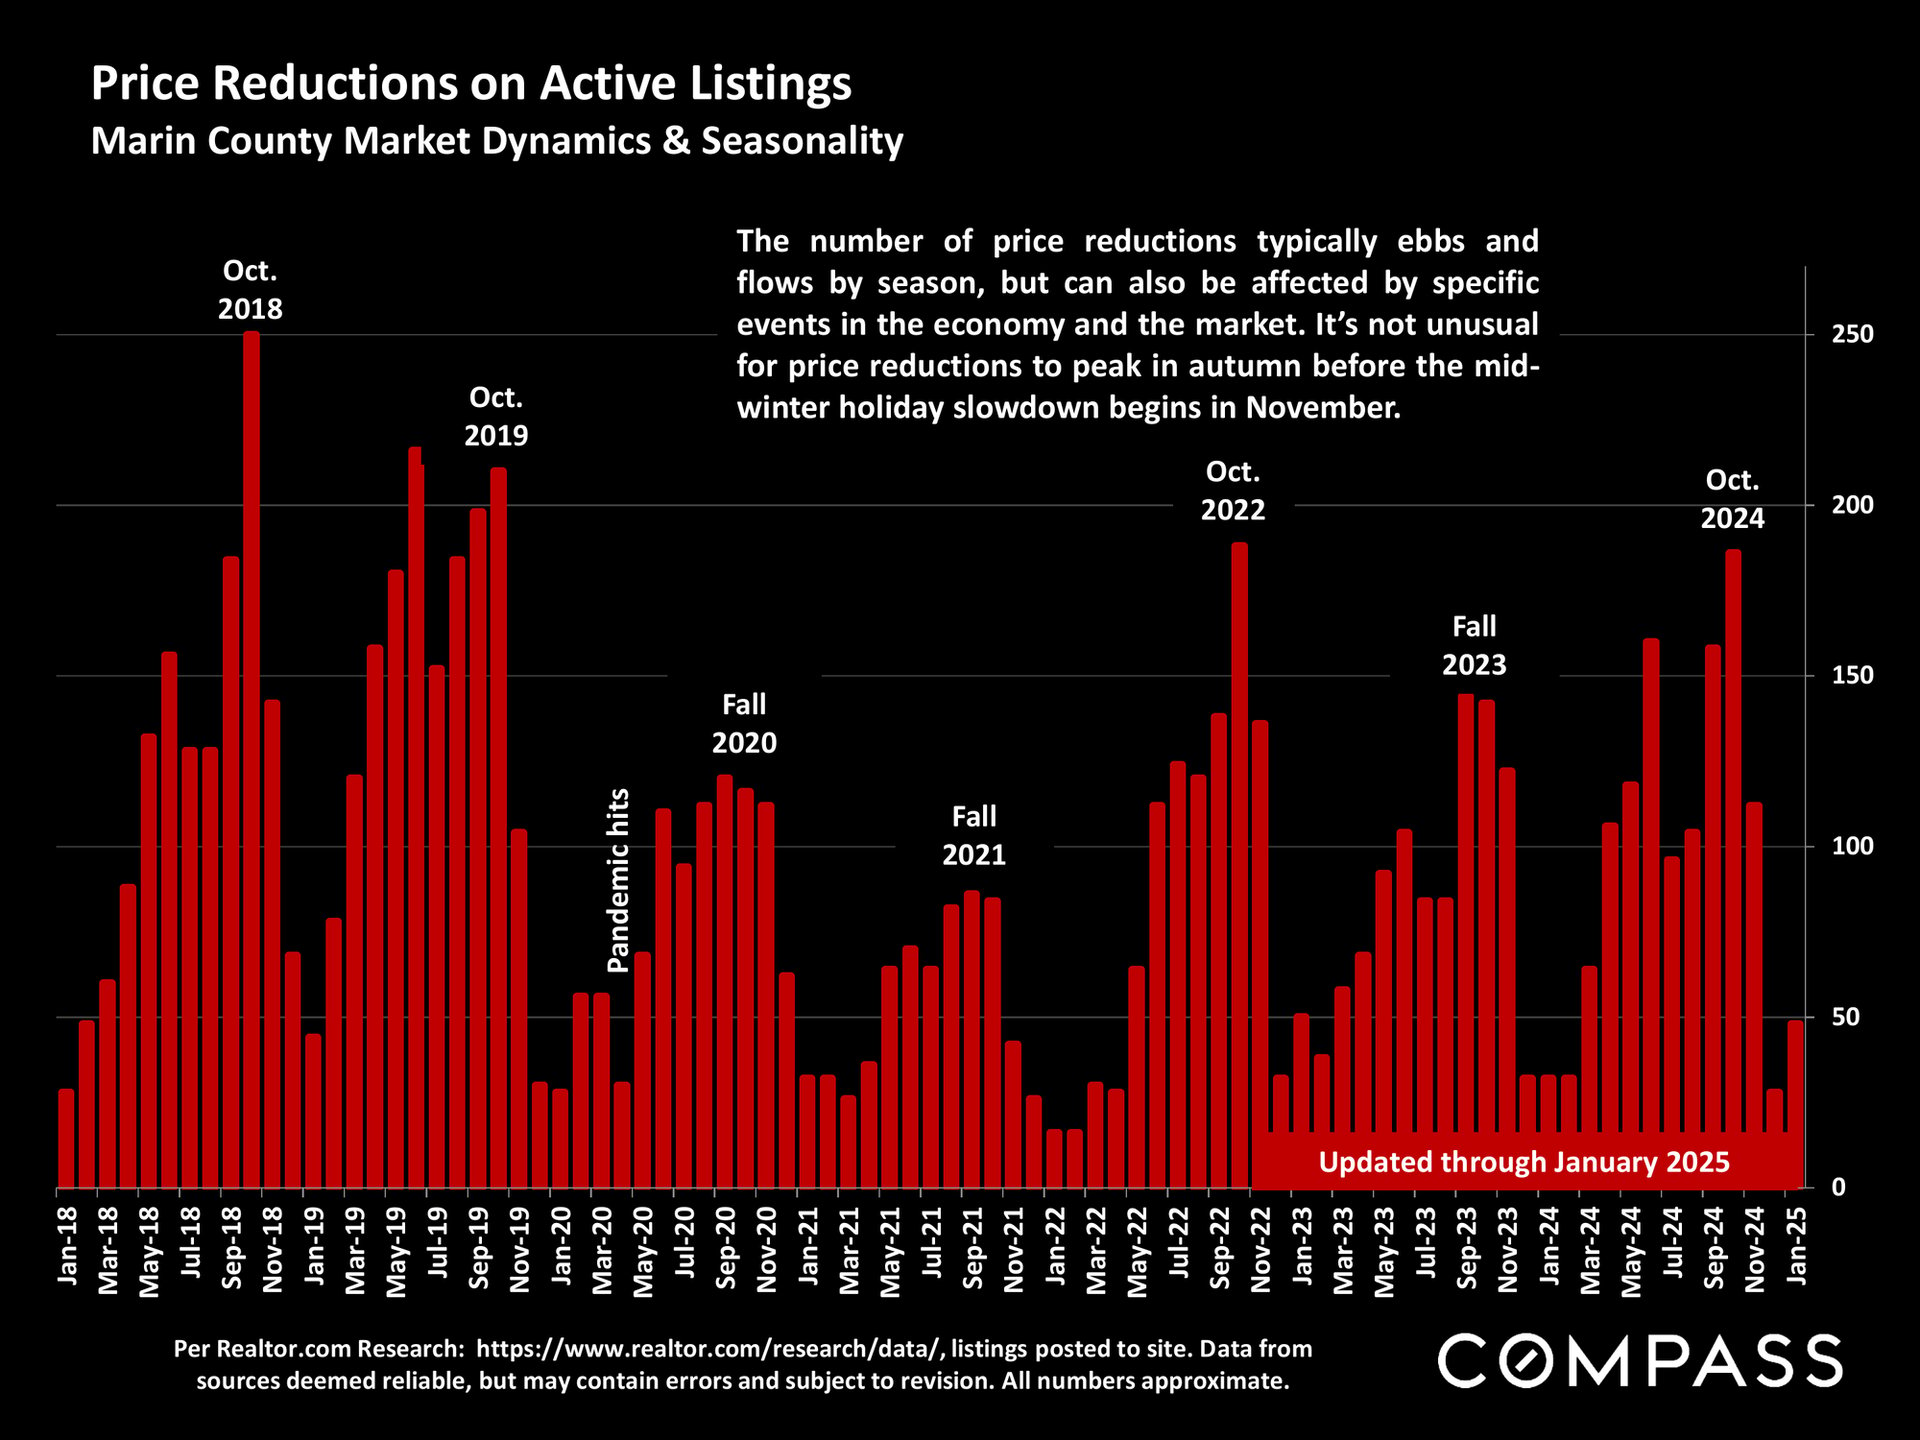
Chart of Marin County active-listing price reductions from January 2018 through January 2025
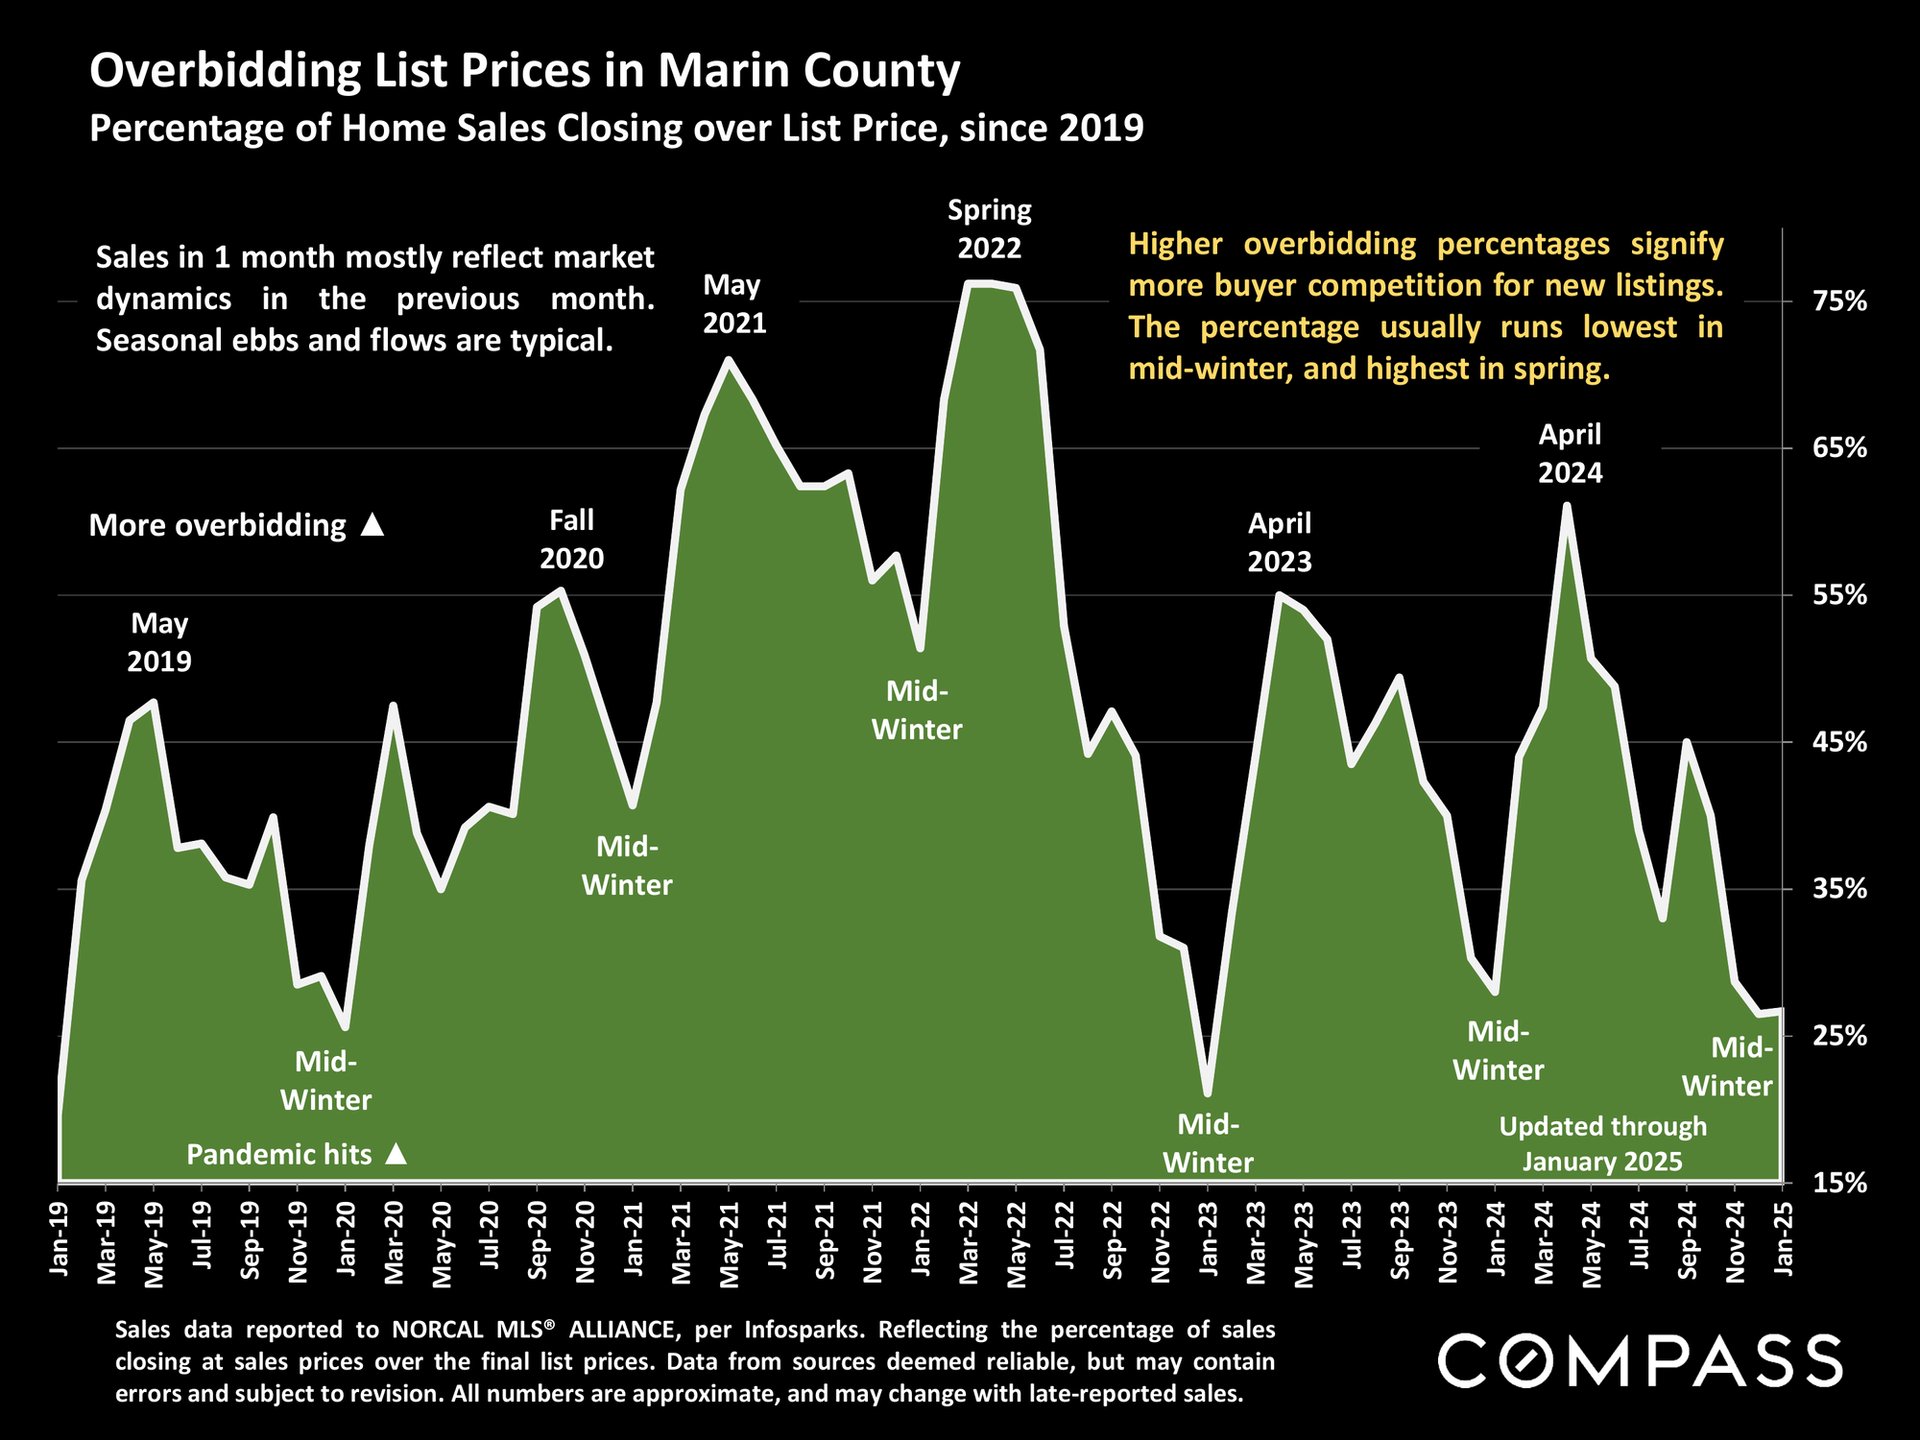
Chart showing Marin County home sales closing over list price from January 2019 through January 2025.
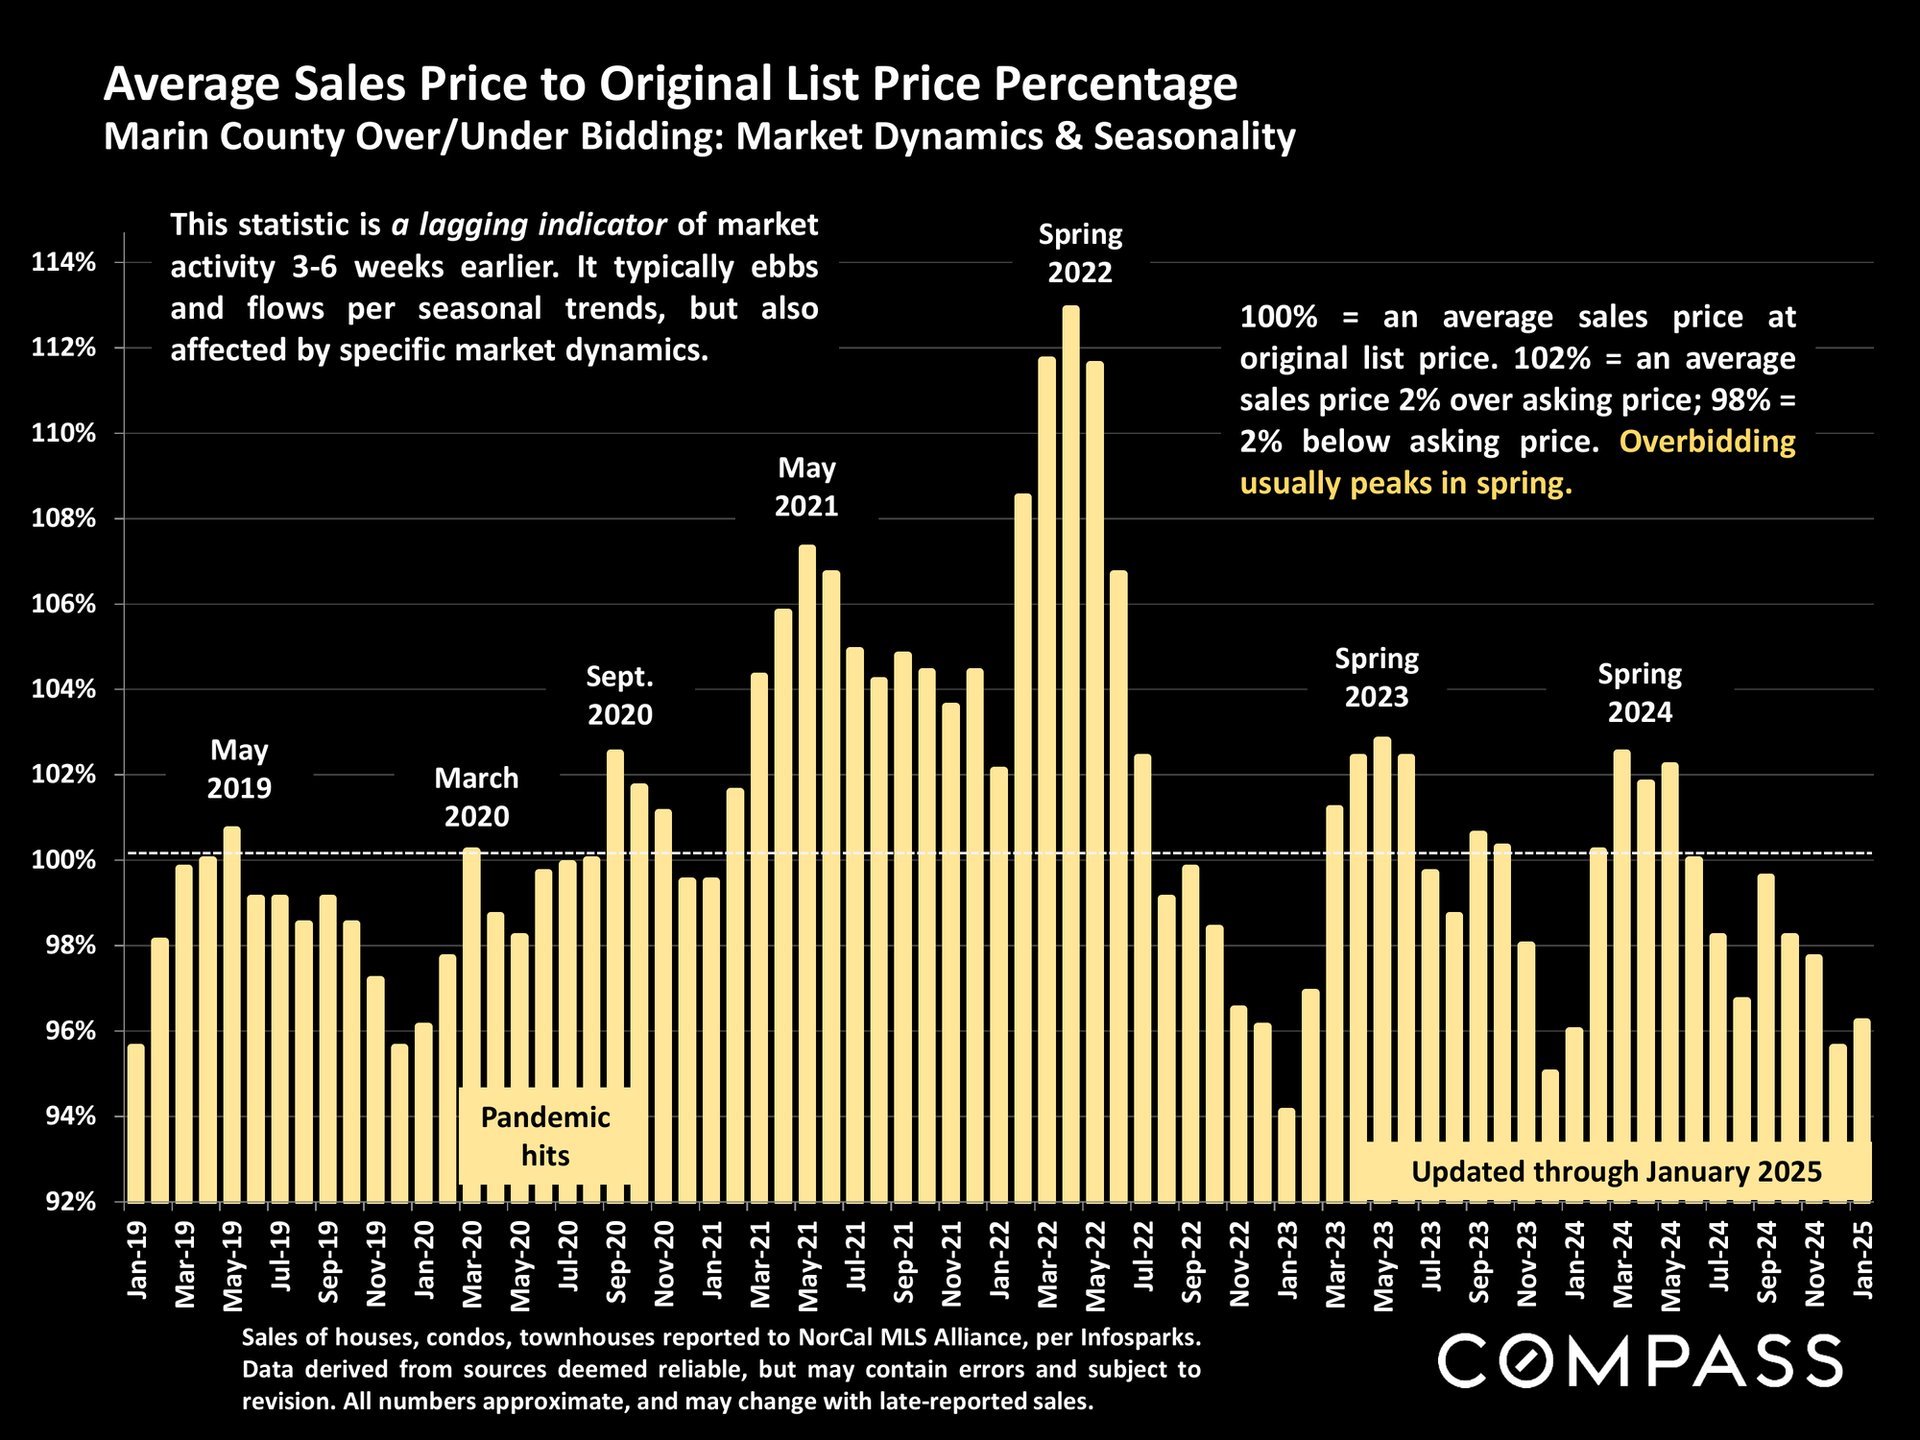
Chart of Marin County home sale prices versus original list prices, with a peak near 113% in spring 2022.
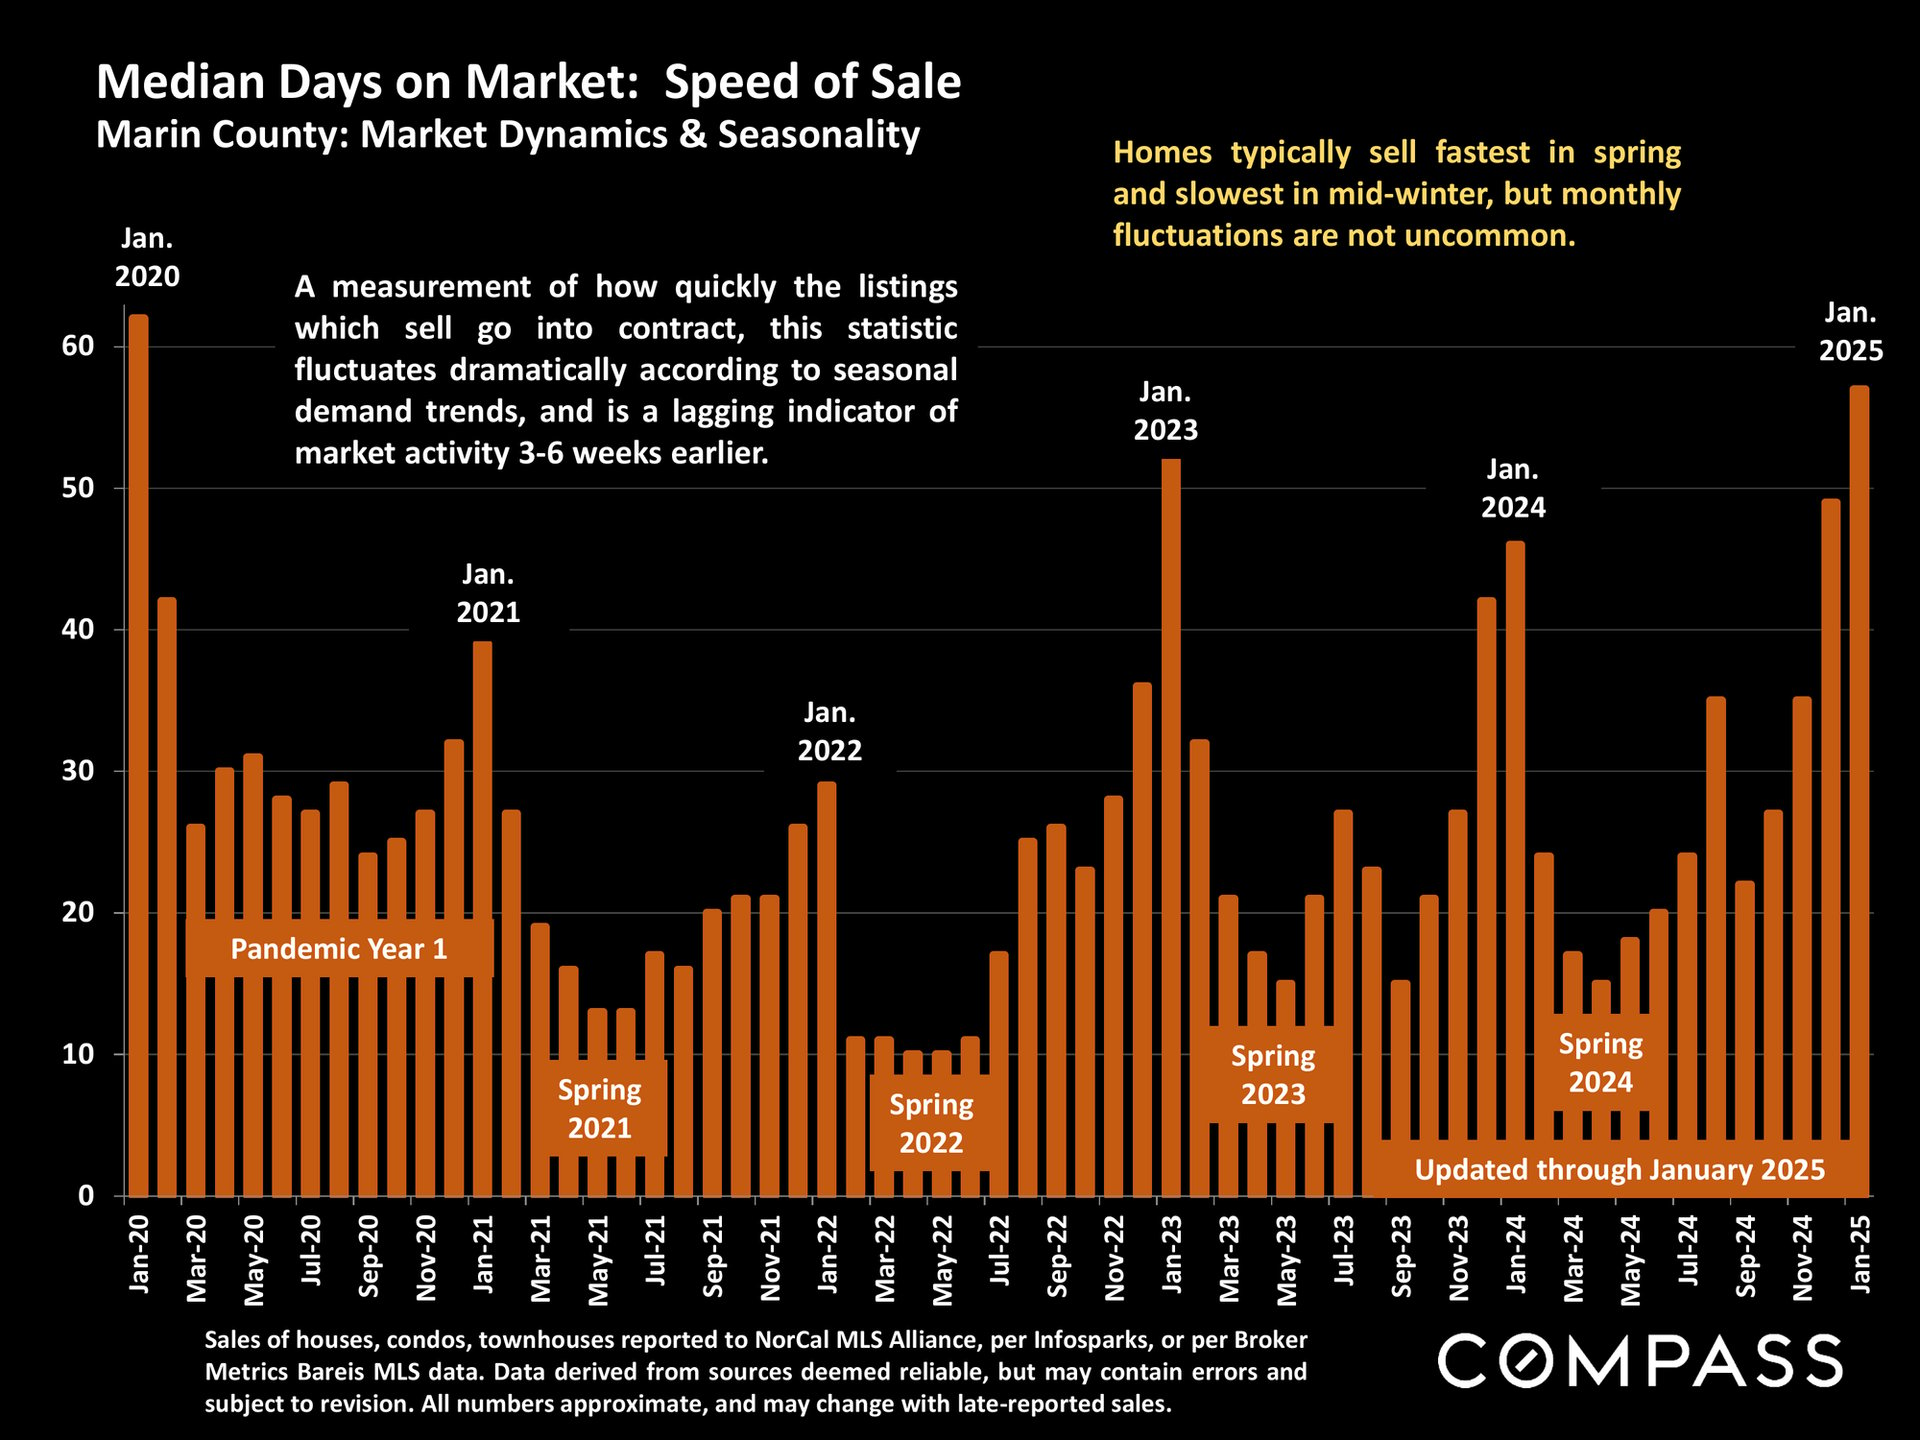
Marin County median days-on-market chart, with monthly orange bars from 2020 to January 2025 and seasonal annotations.
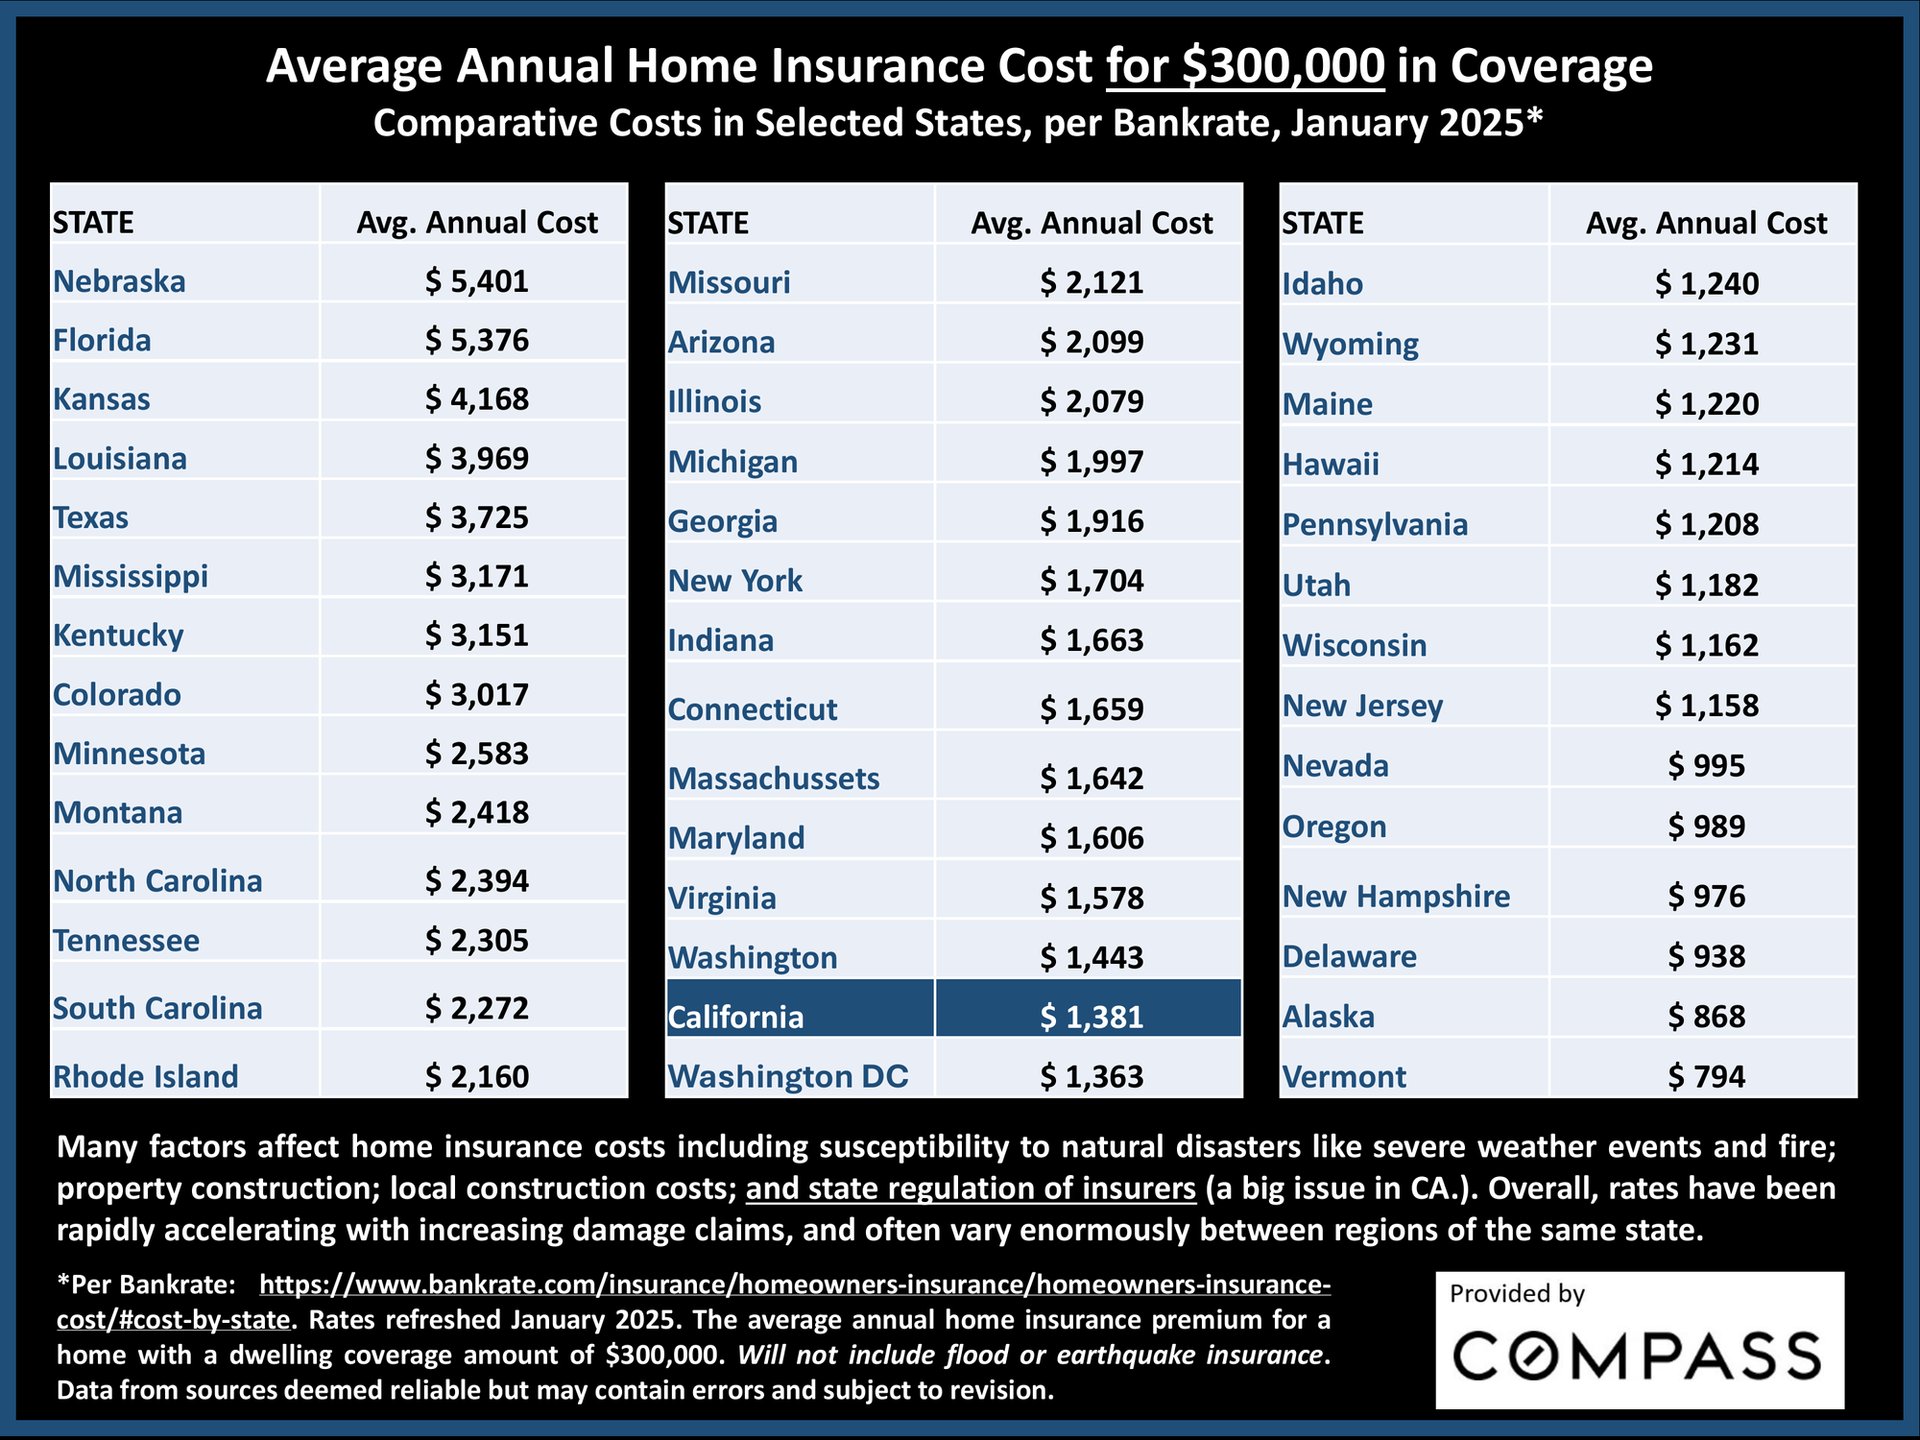
Chart comparing average annual home insurance costs by state for $300,000 in coverage, with California highlighted.
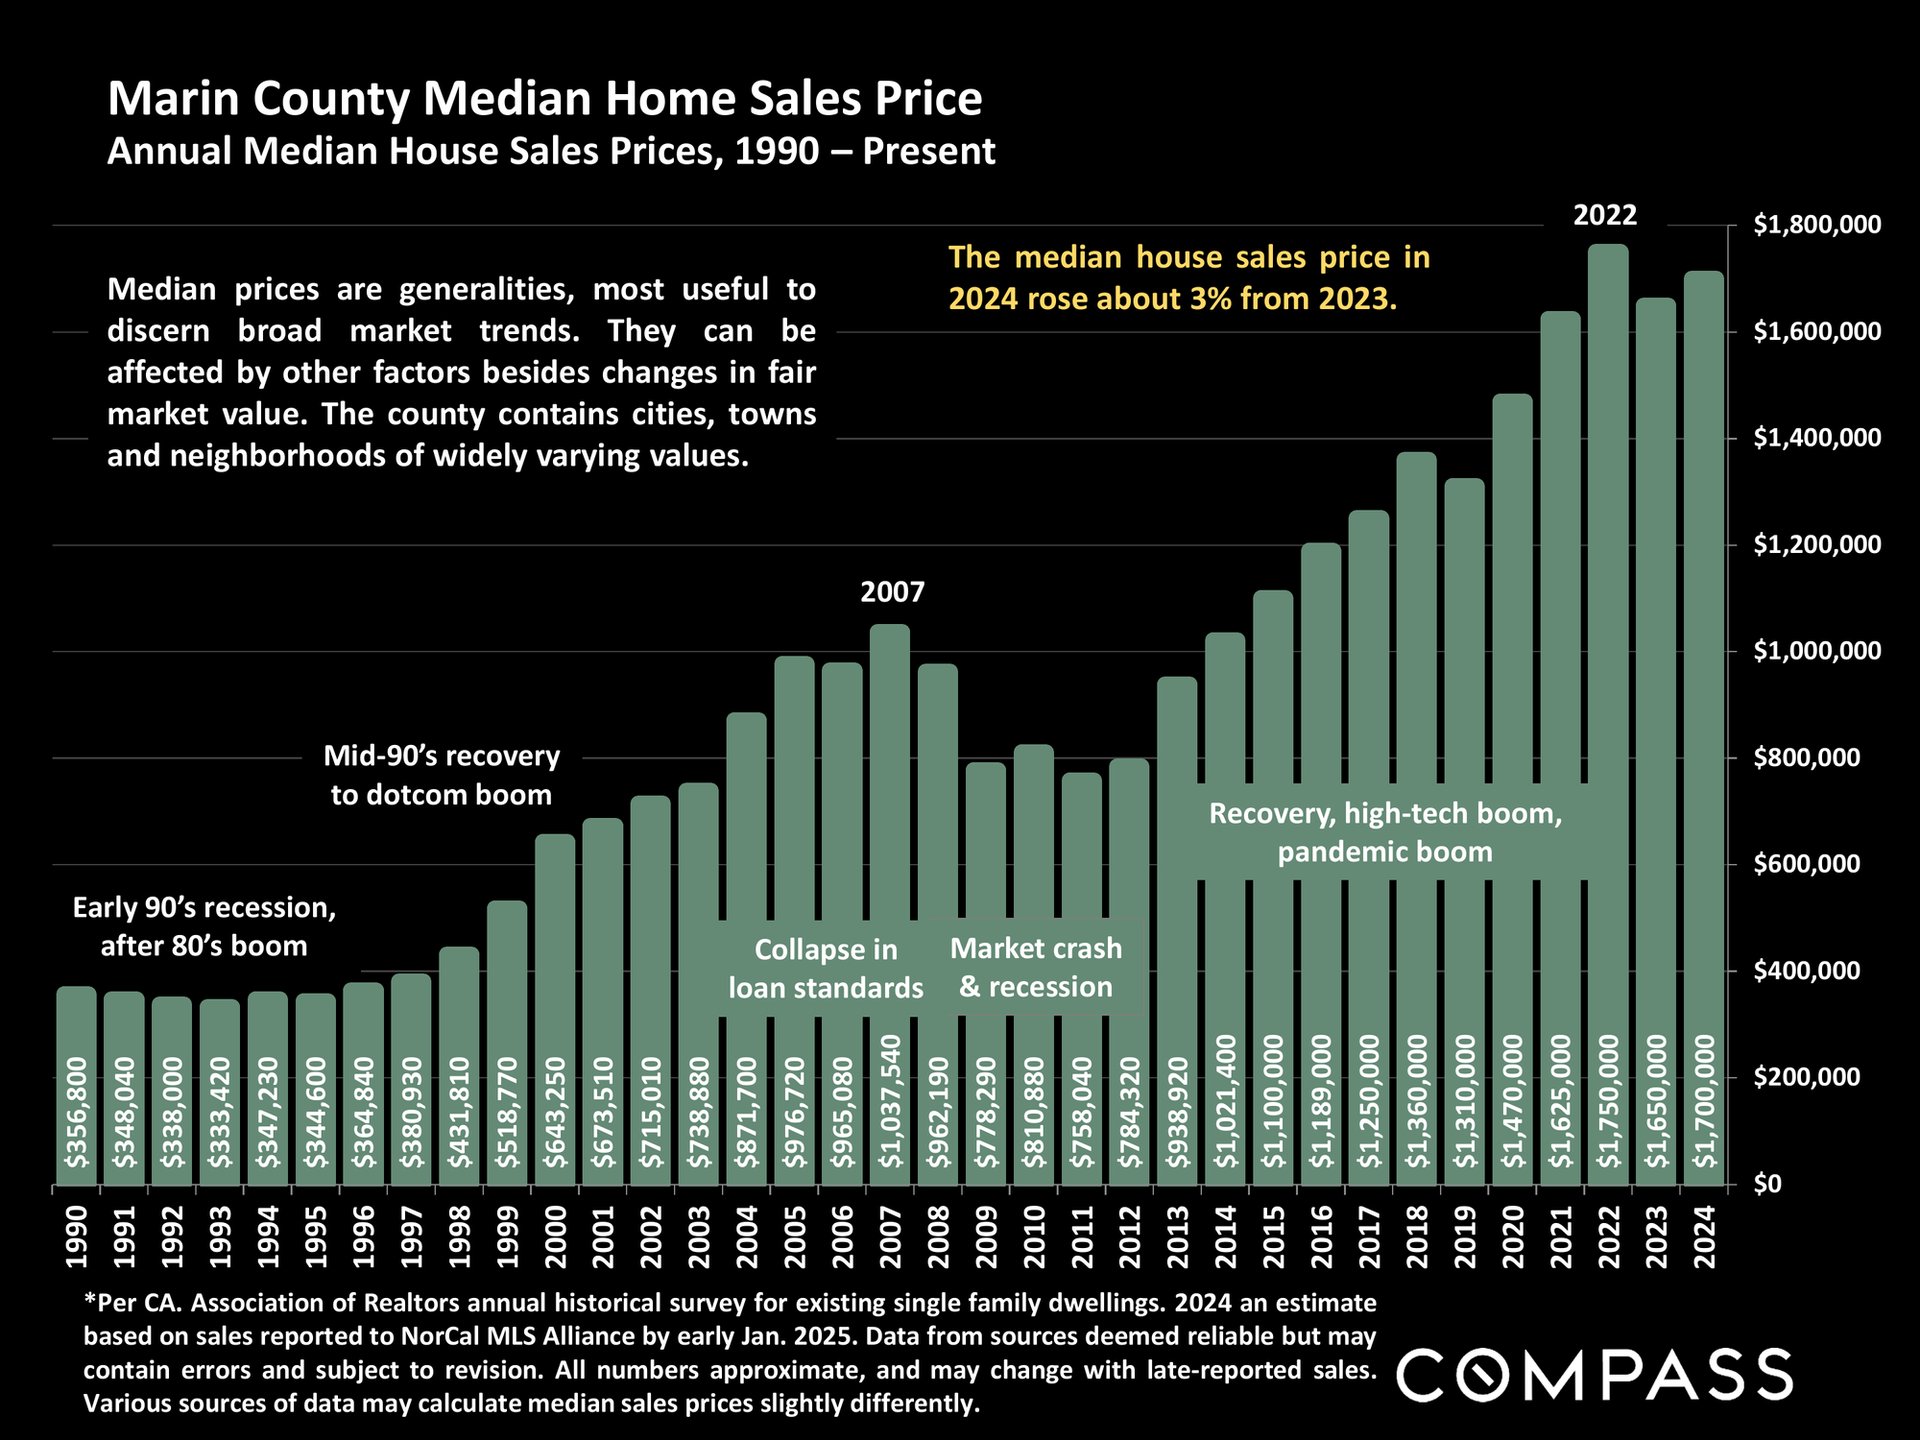
Chart of Marin County median home sale prices, 1990–2024, rising to an estimated $1.7 million in 2024.
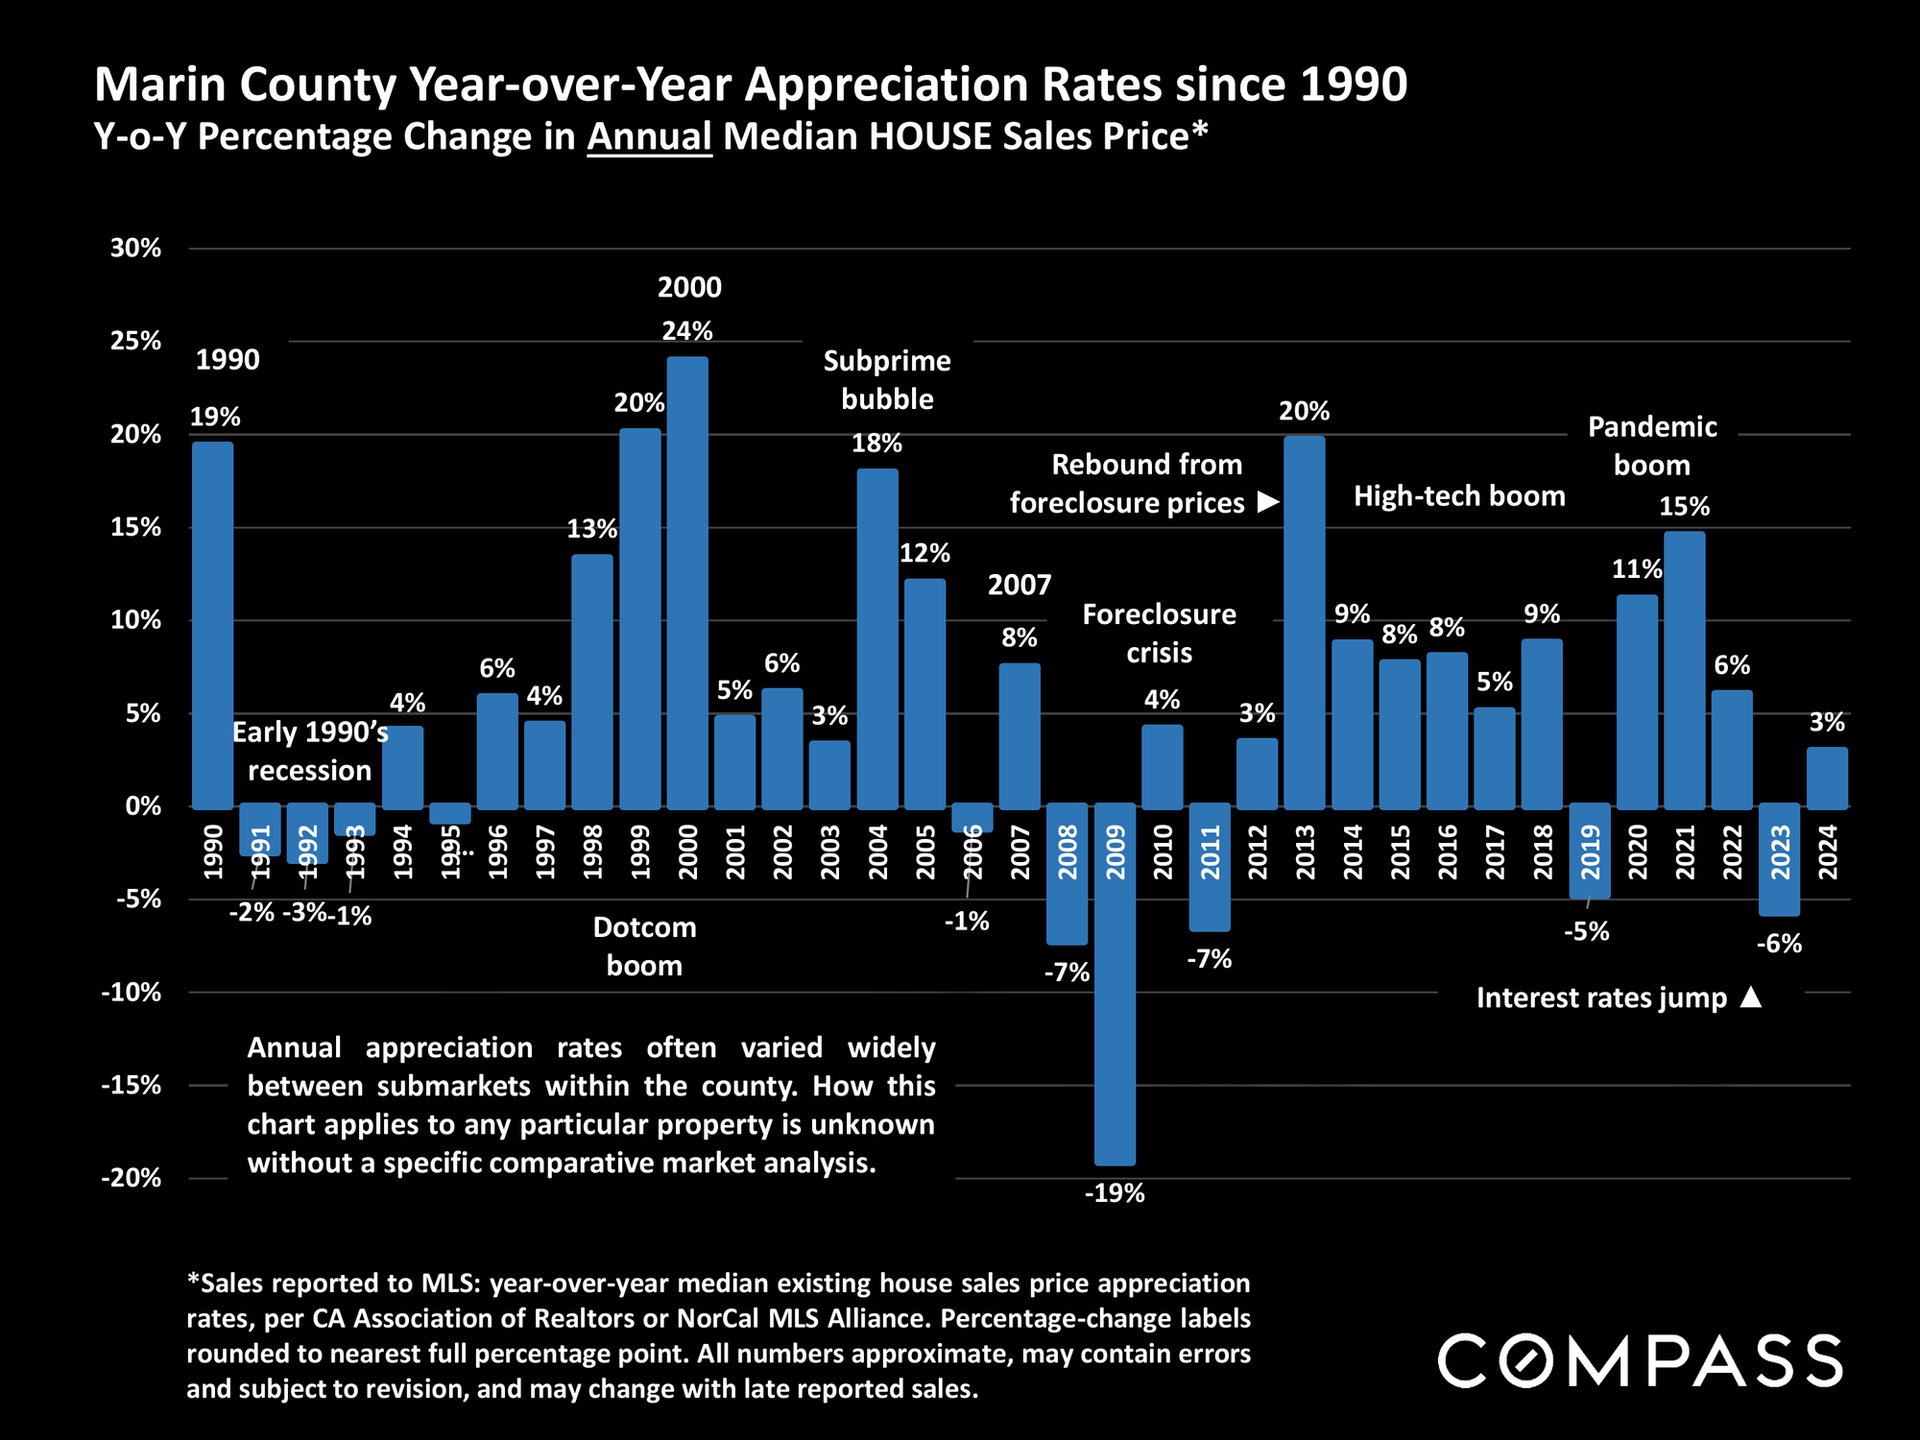
Chart of Marin County annual median house price appreciation rates from 1990 to 2024, with historical market annotations.
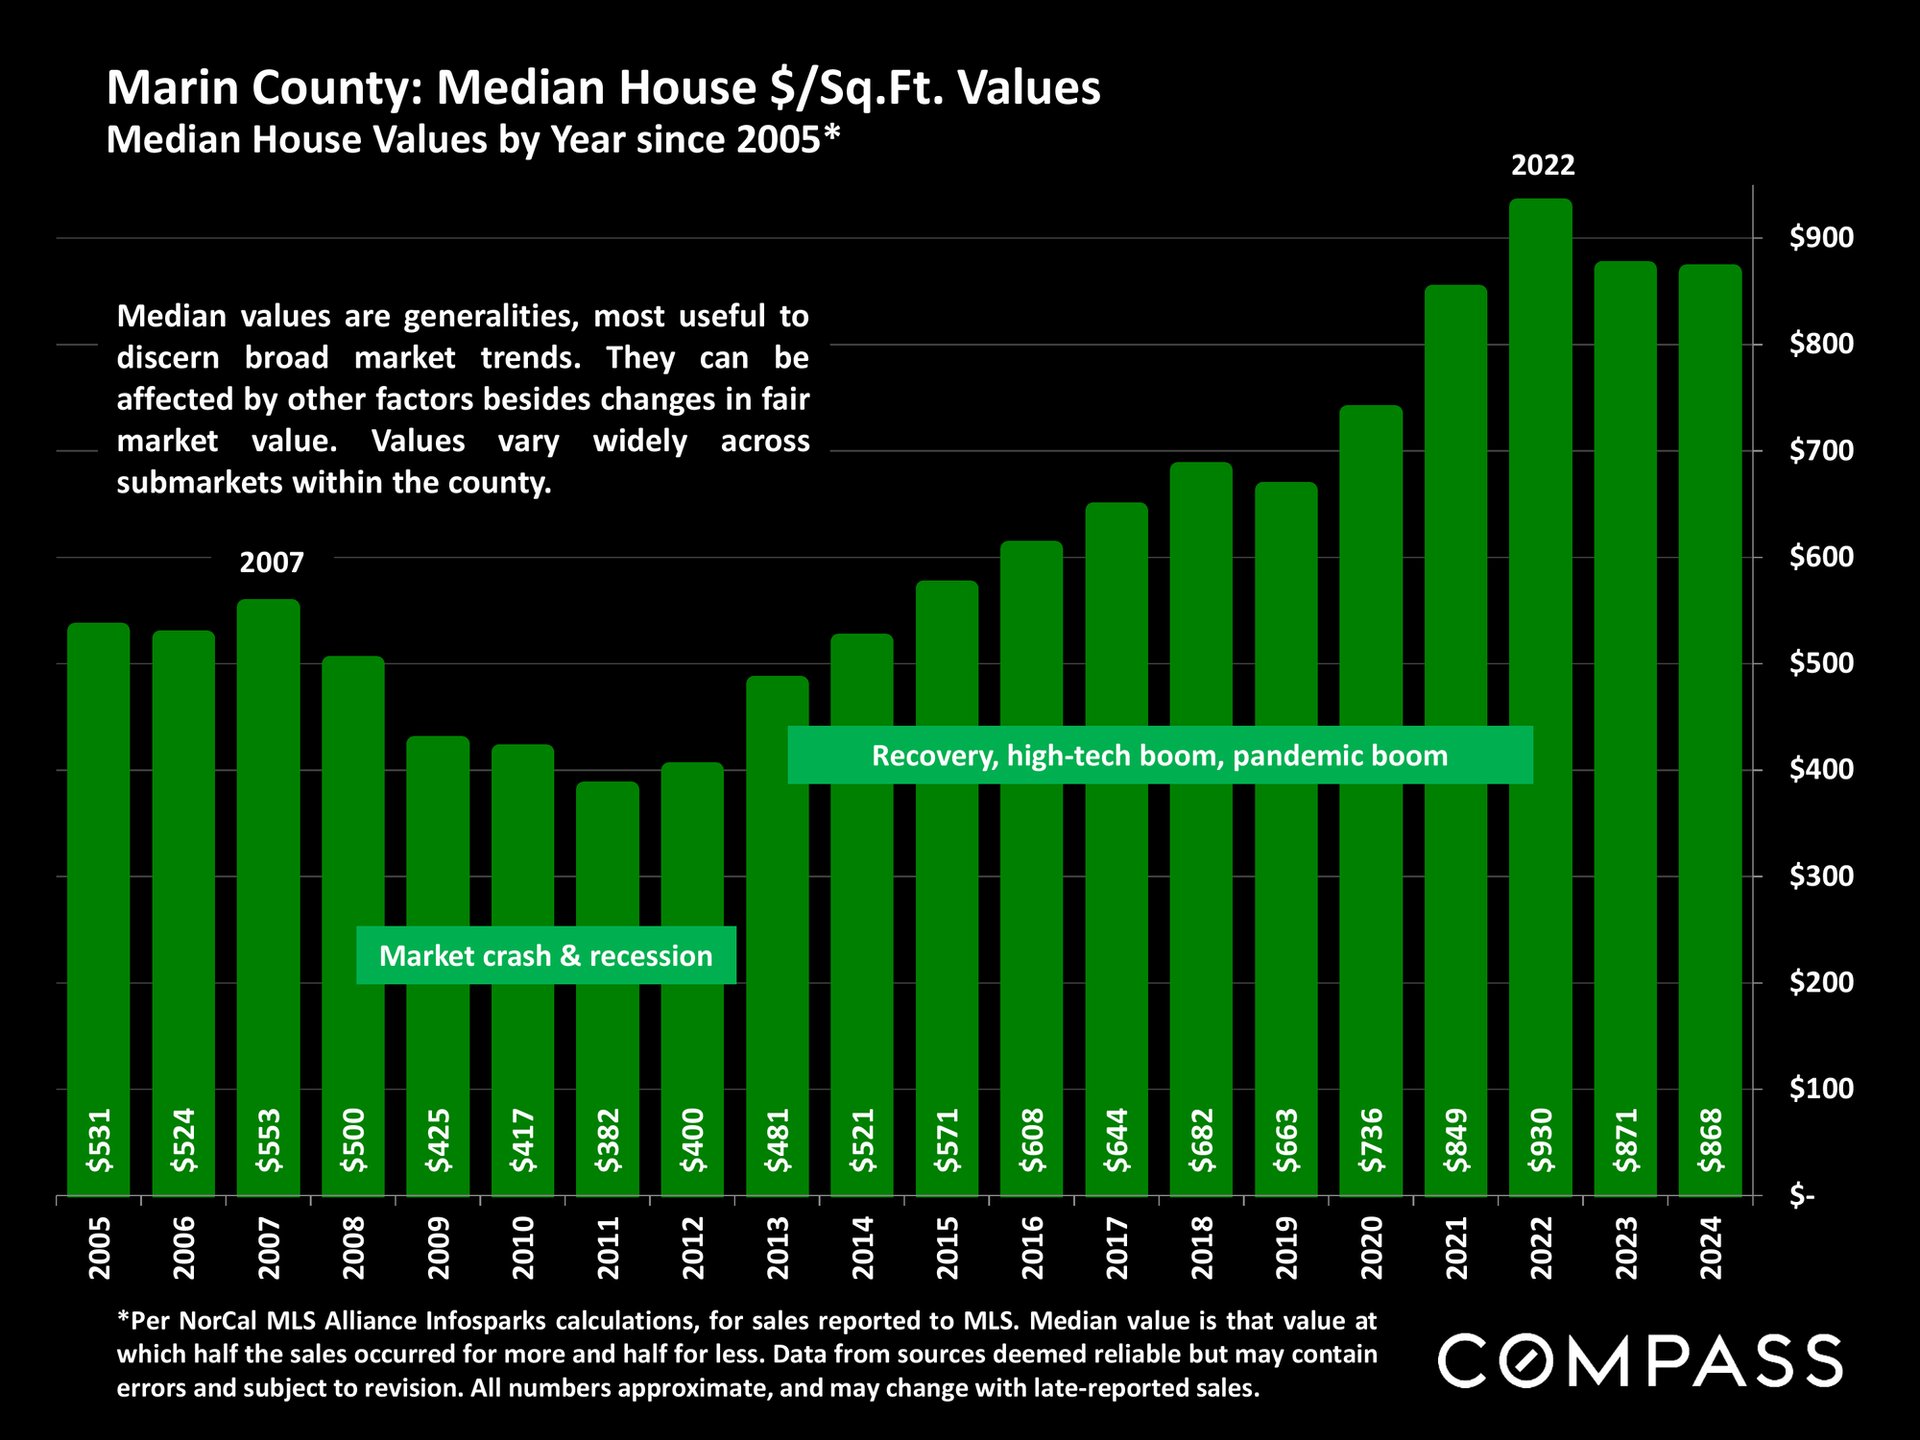
Bar chart of Marin County median house values per square foot, peaking at $930 in 2022 and easing to $868 in 2024.
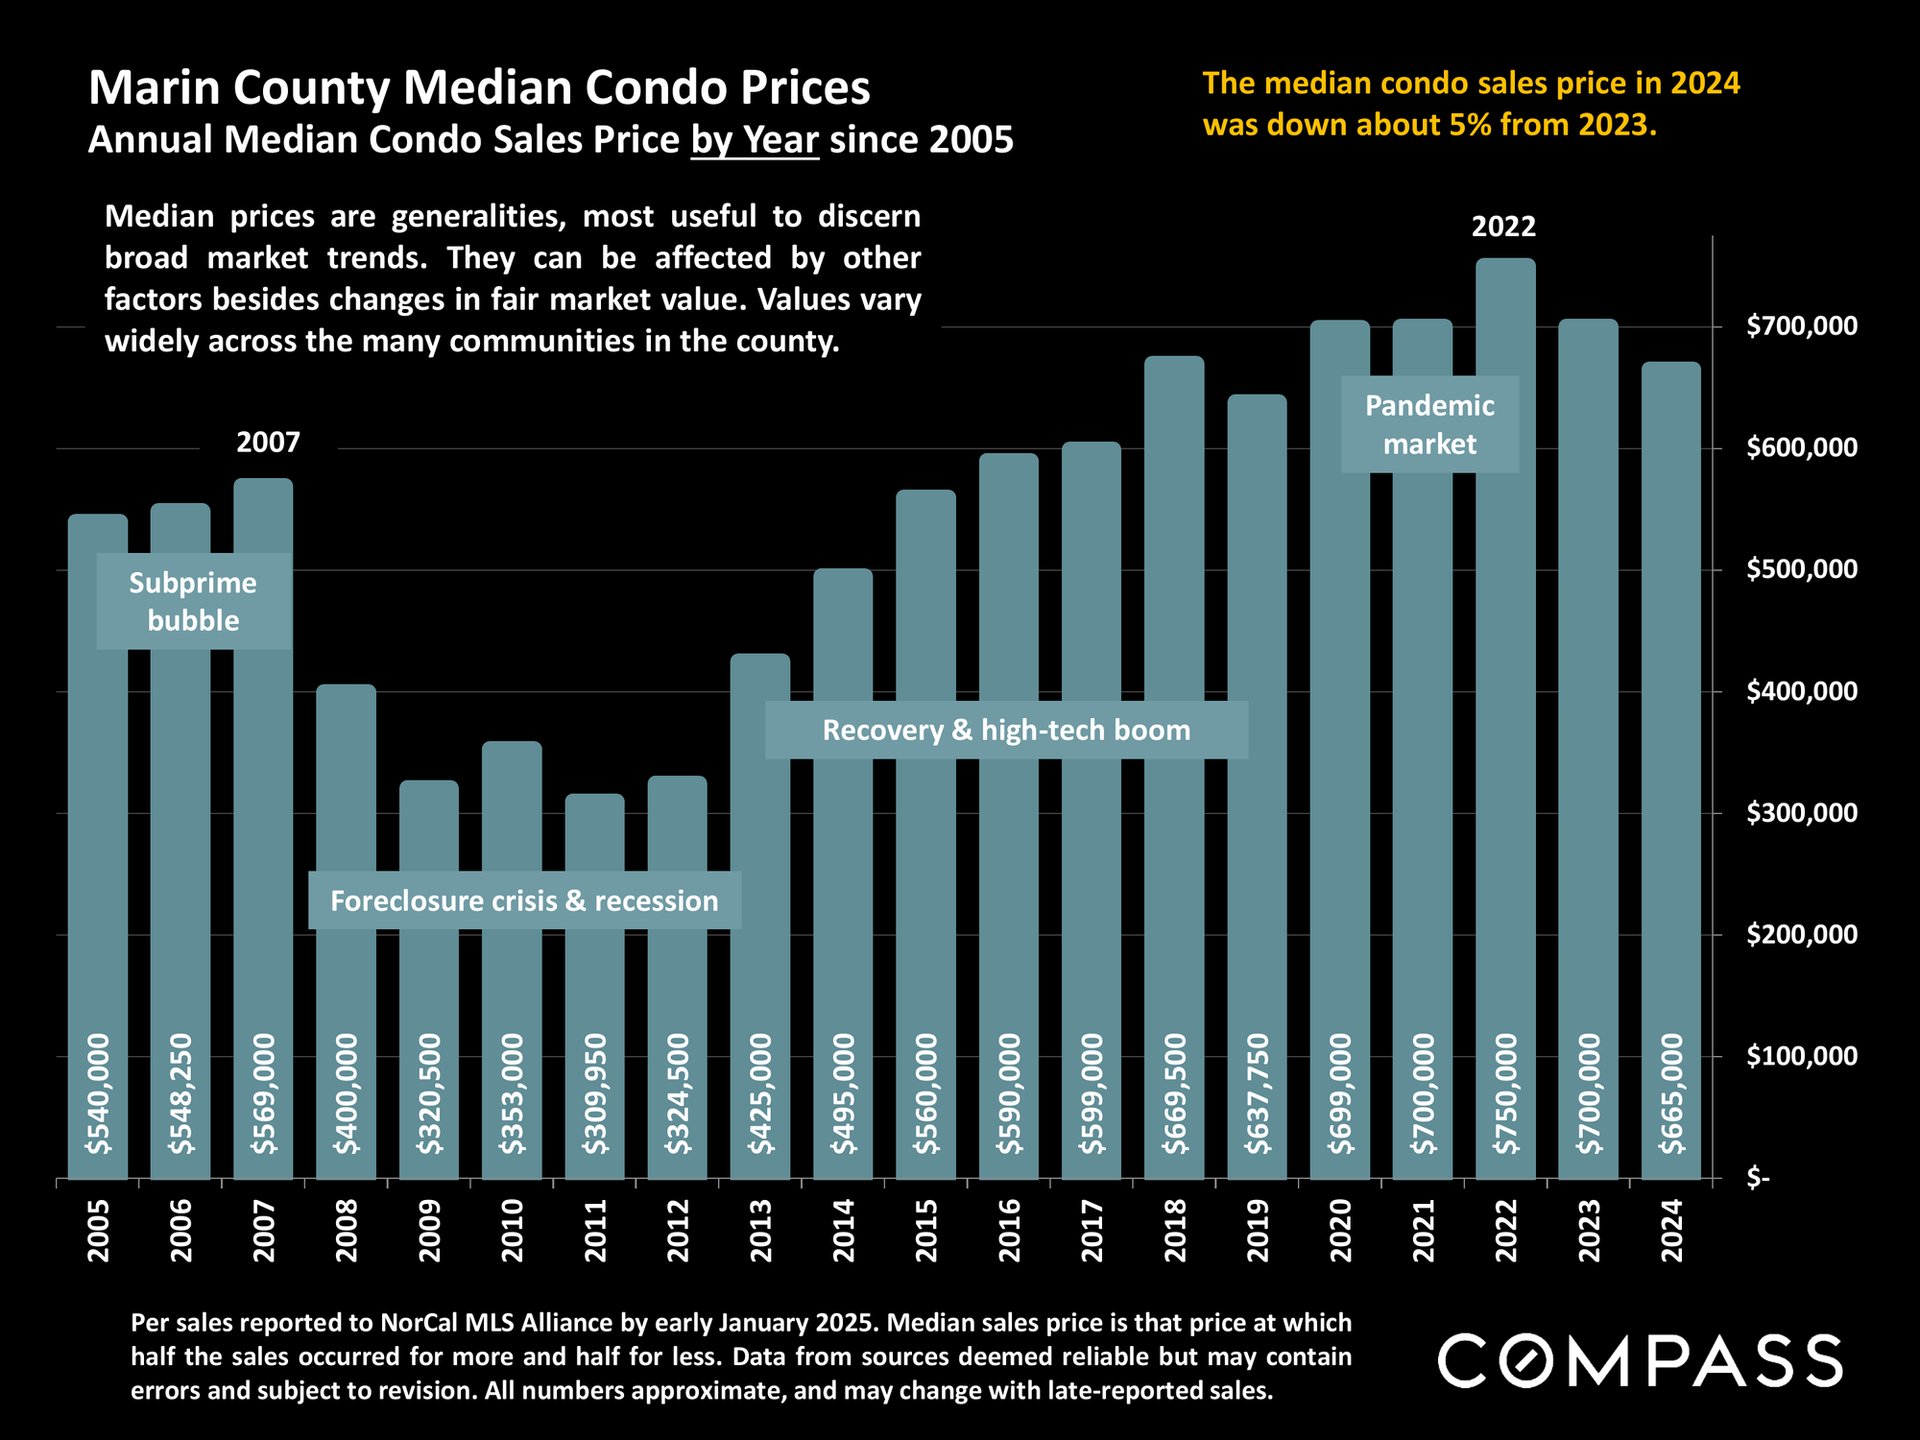
Chart of Marin County median condo prices from 2005–2024, peaking at $750,000 in 2022 and falling to $665,000 in 2024.
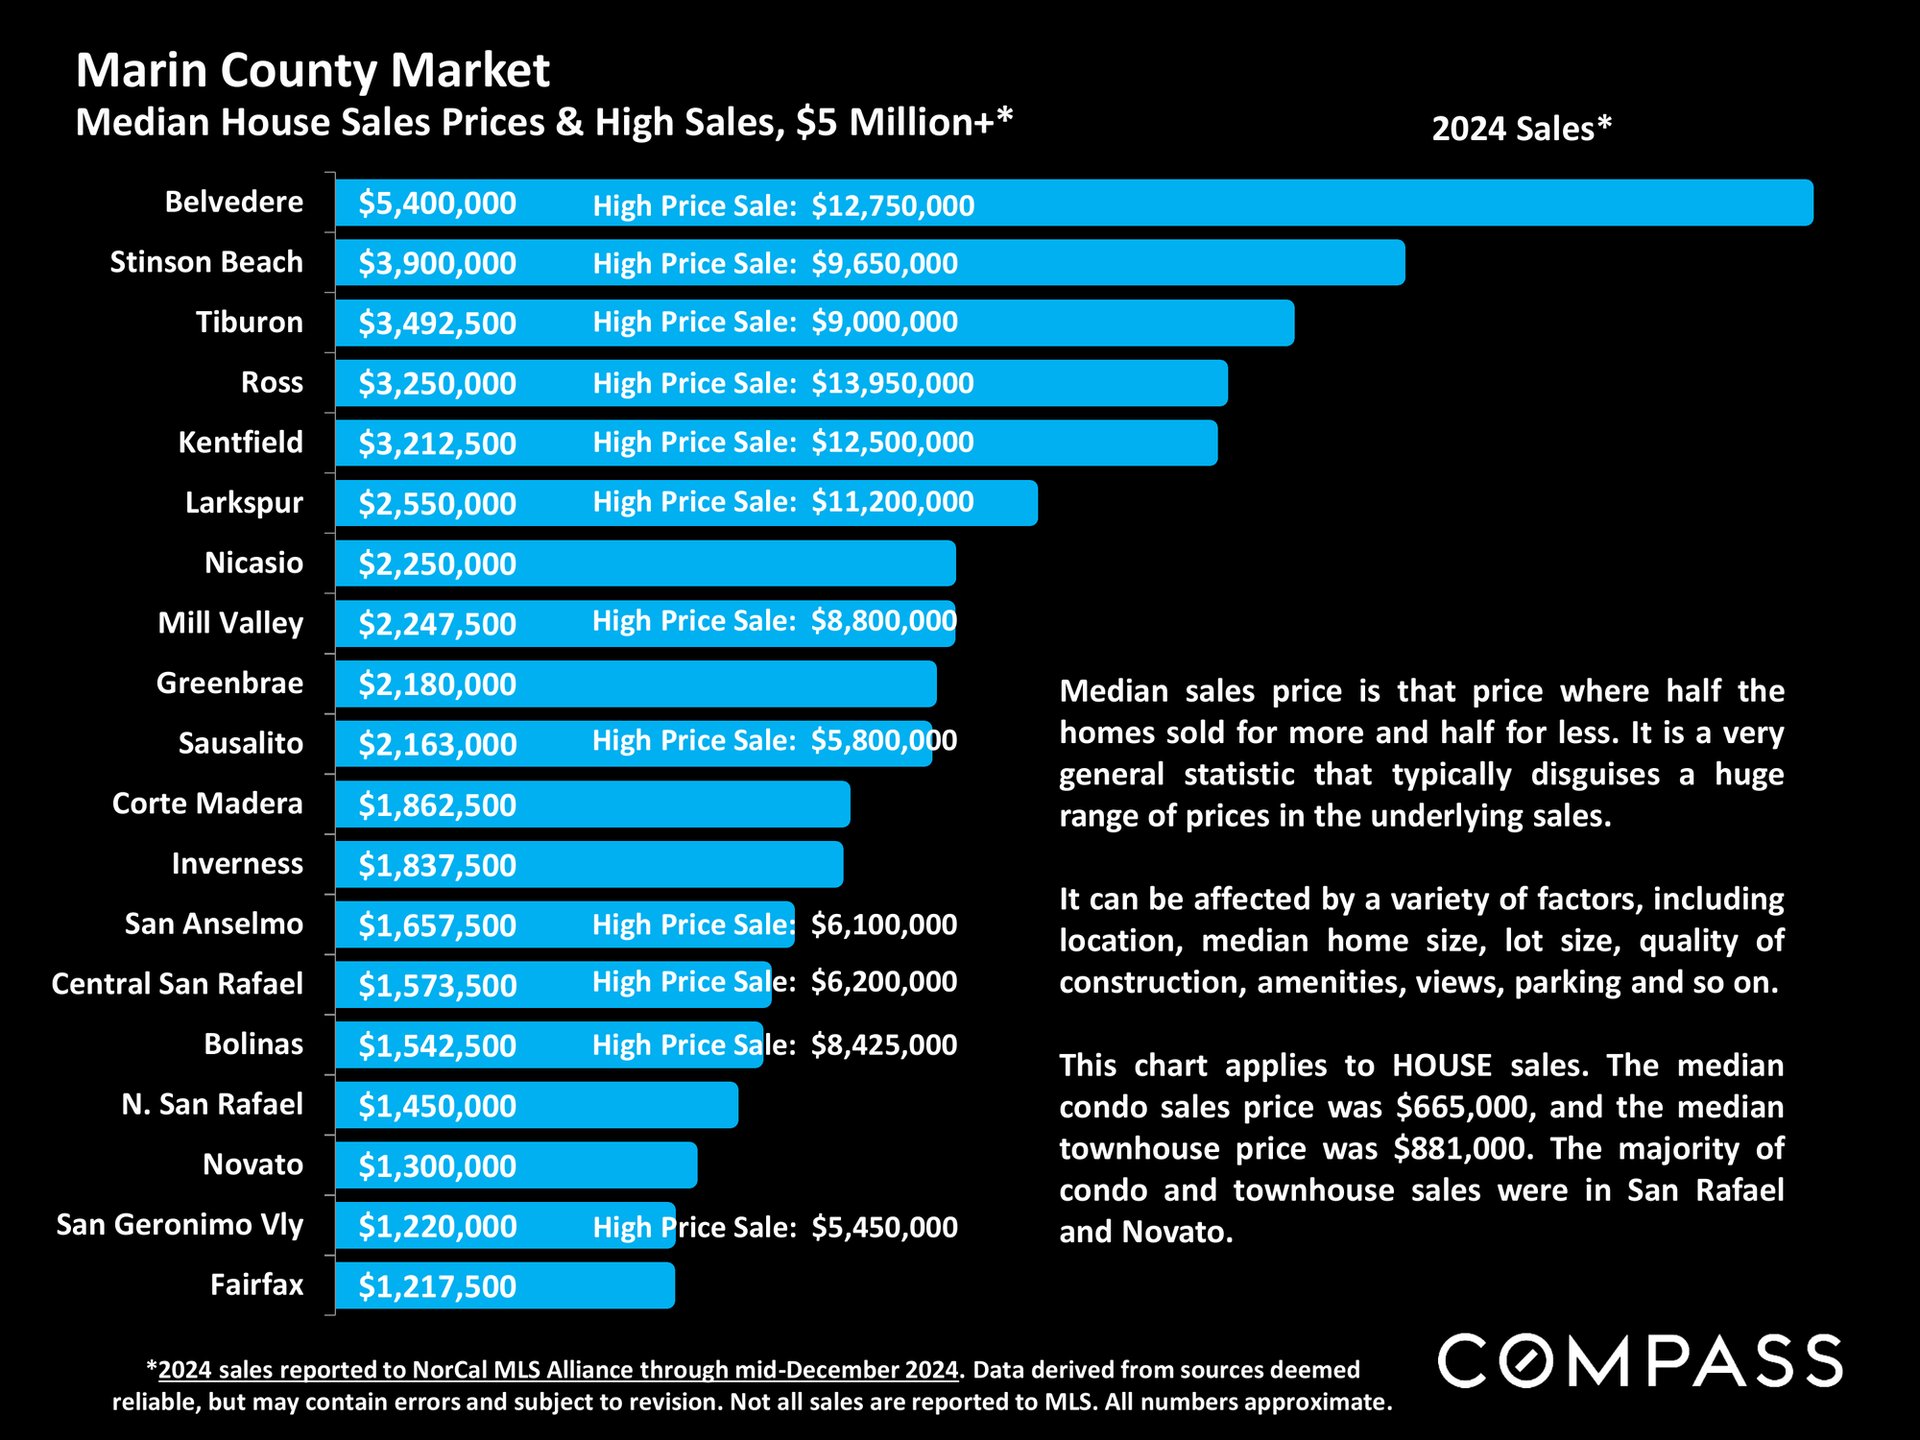
Chart of 2024 Marin County median house sale prices by community, with high sales and explanatory notes.
Graphic linking to an updated report on city and town real estate markets in Marin County.
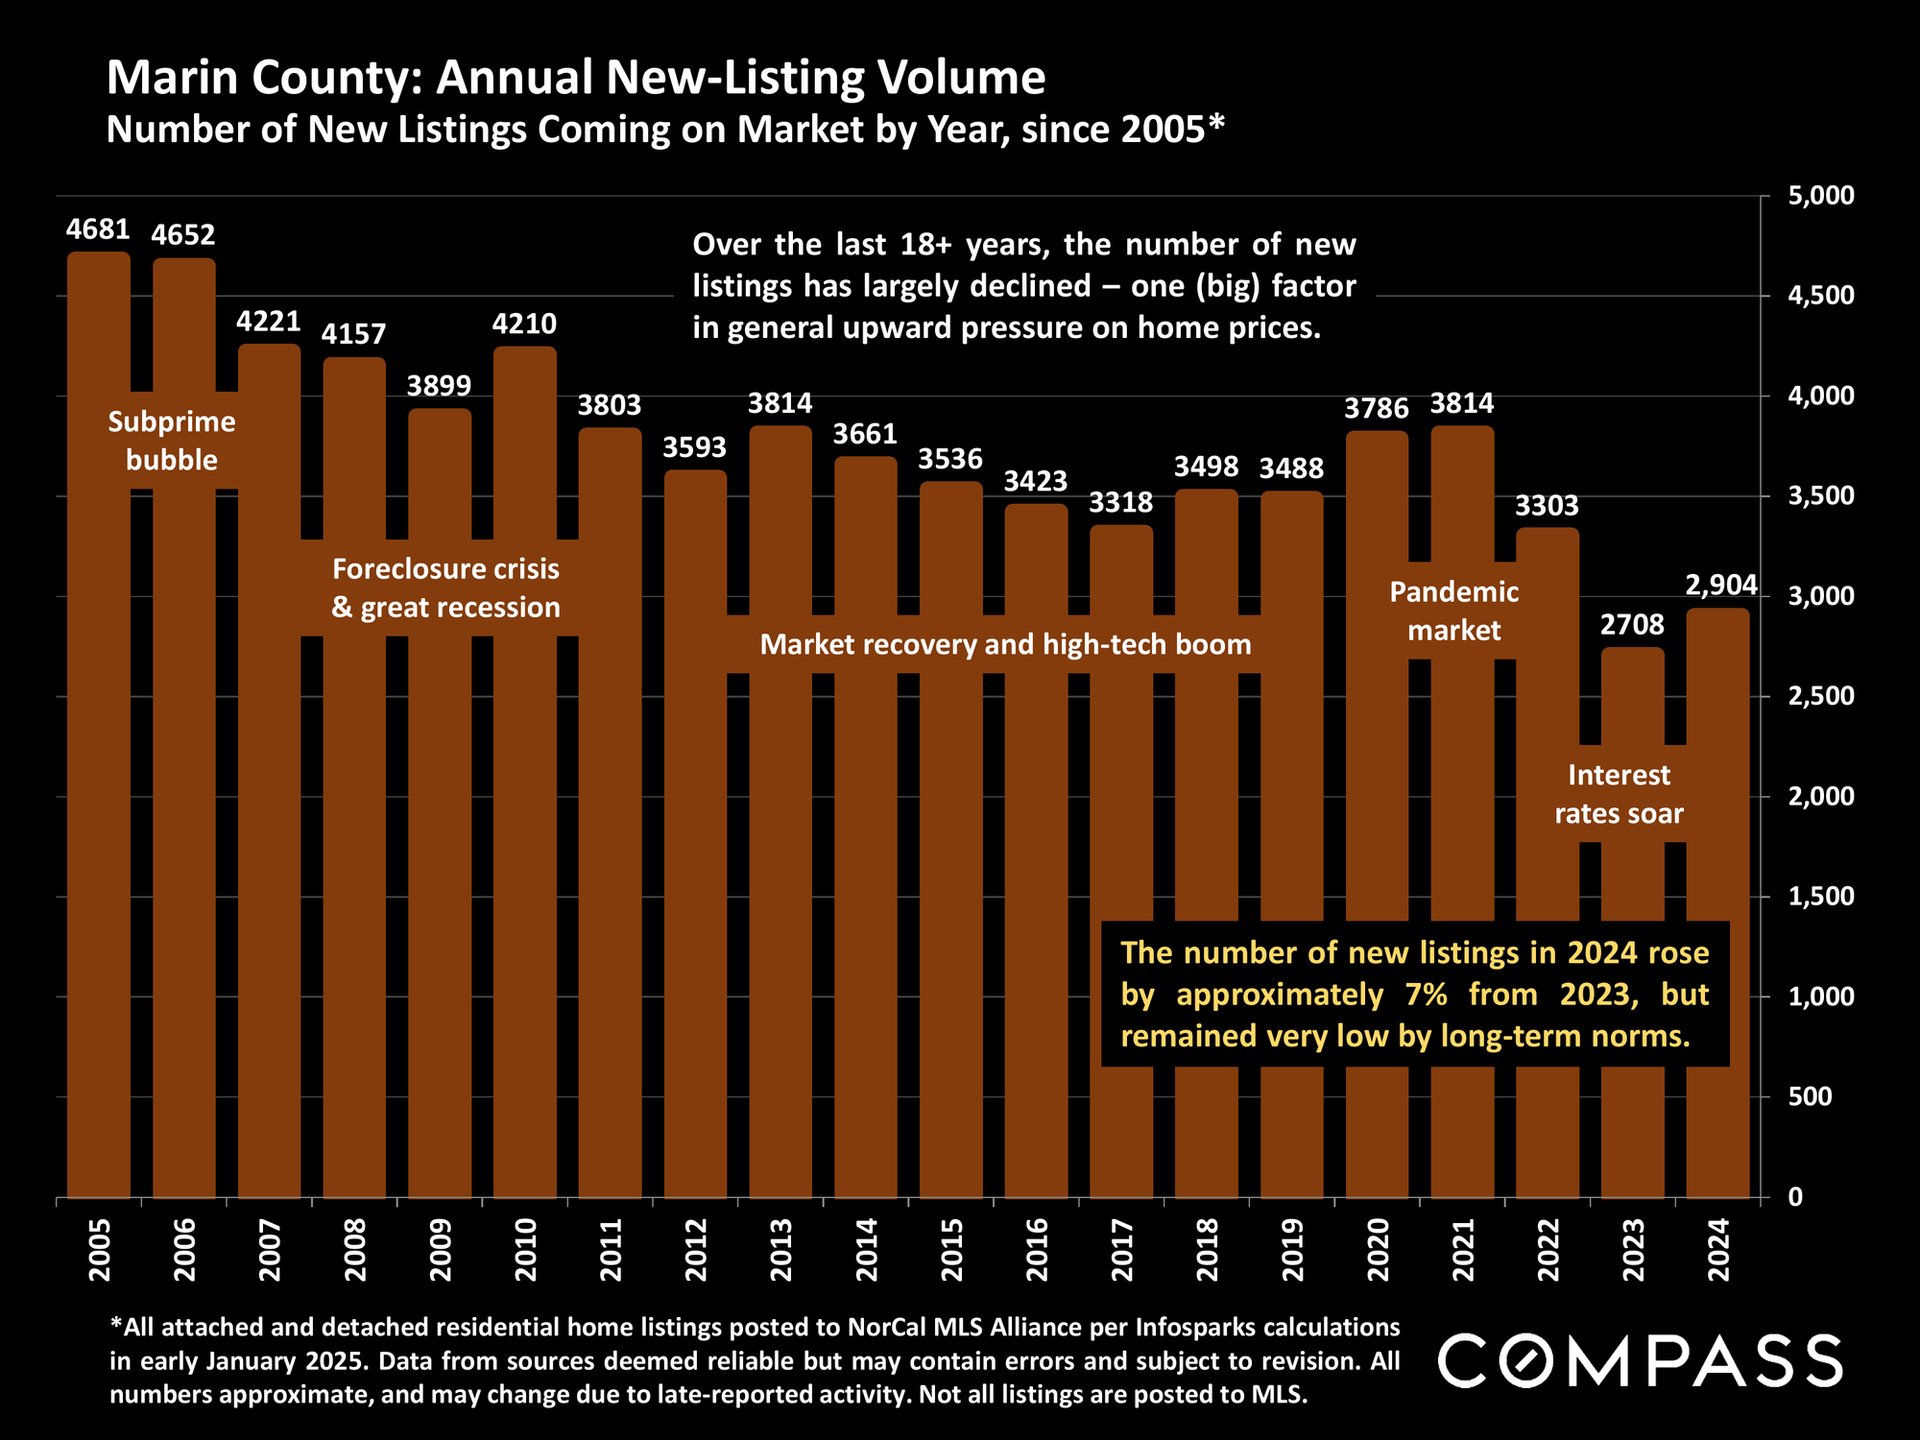
Chart of Marin County annual new listings, 2005–2024, with market-period annotations and a long-term decline.
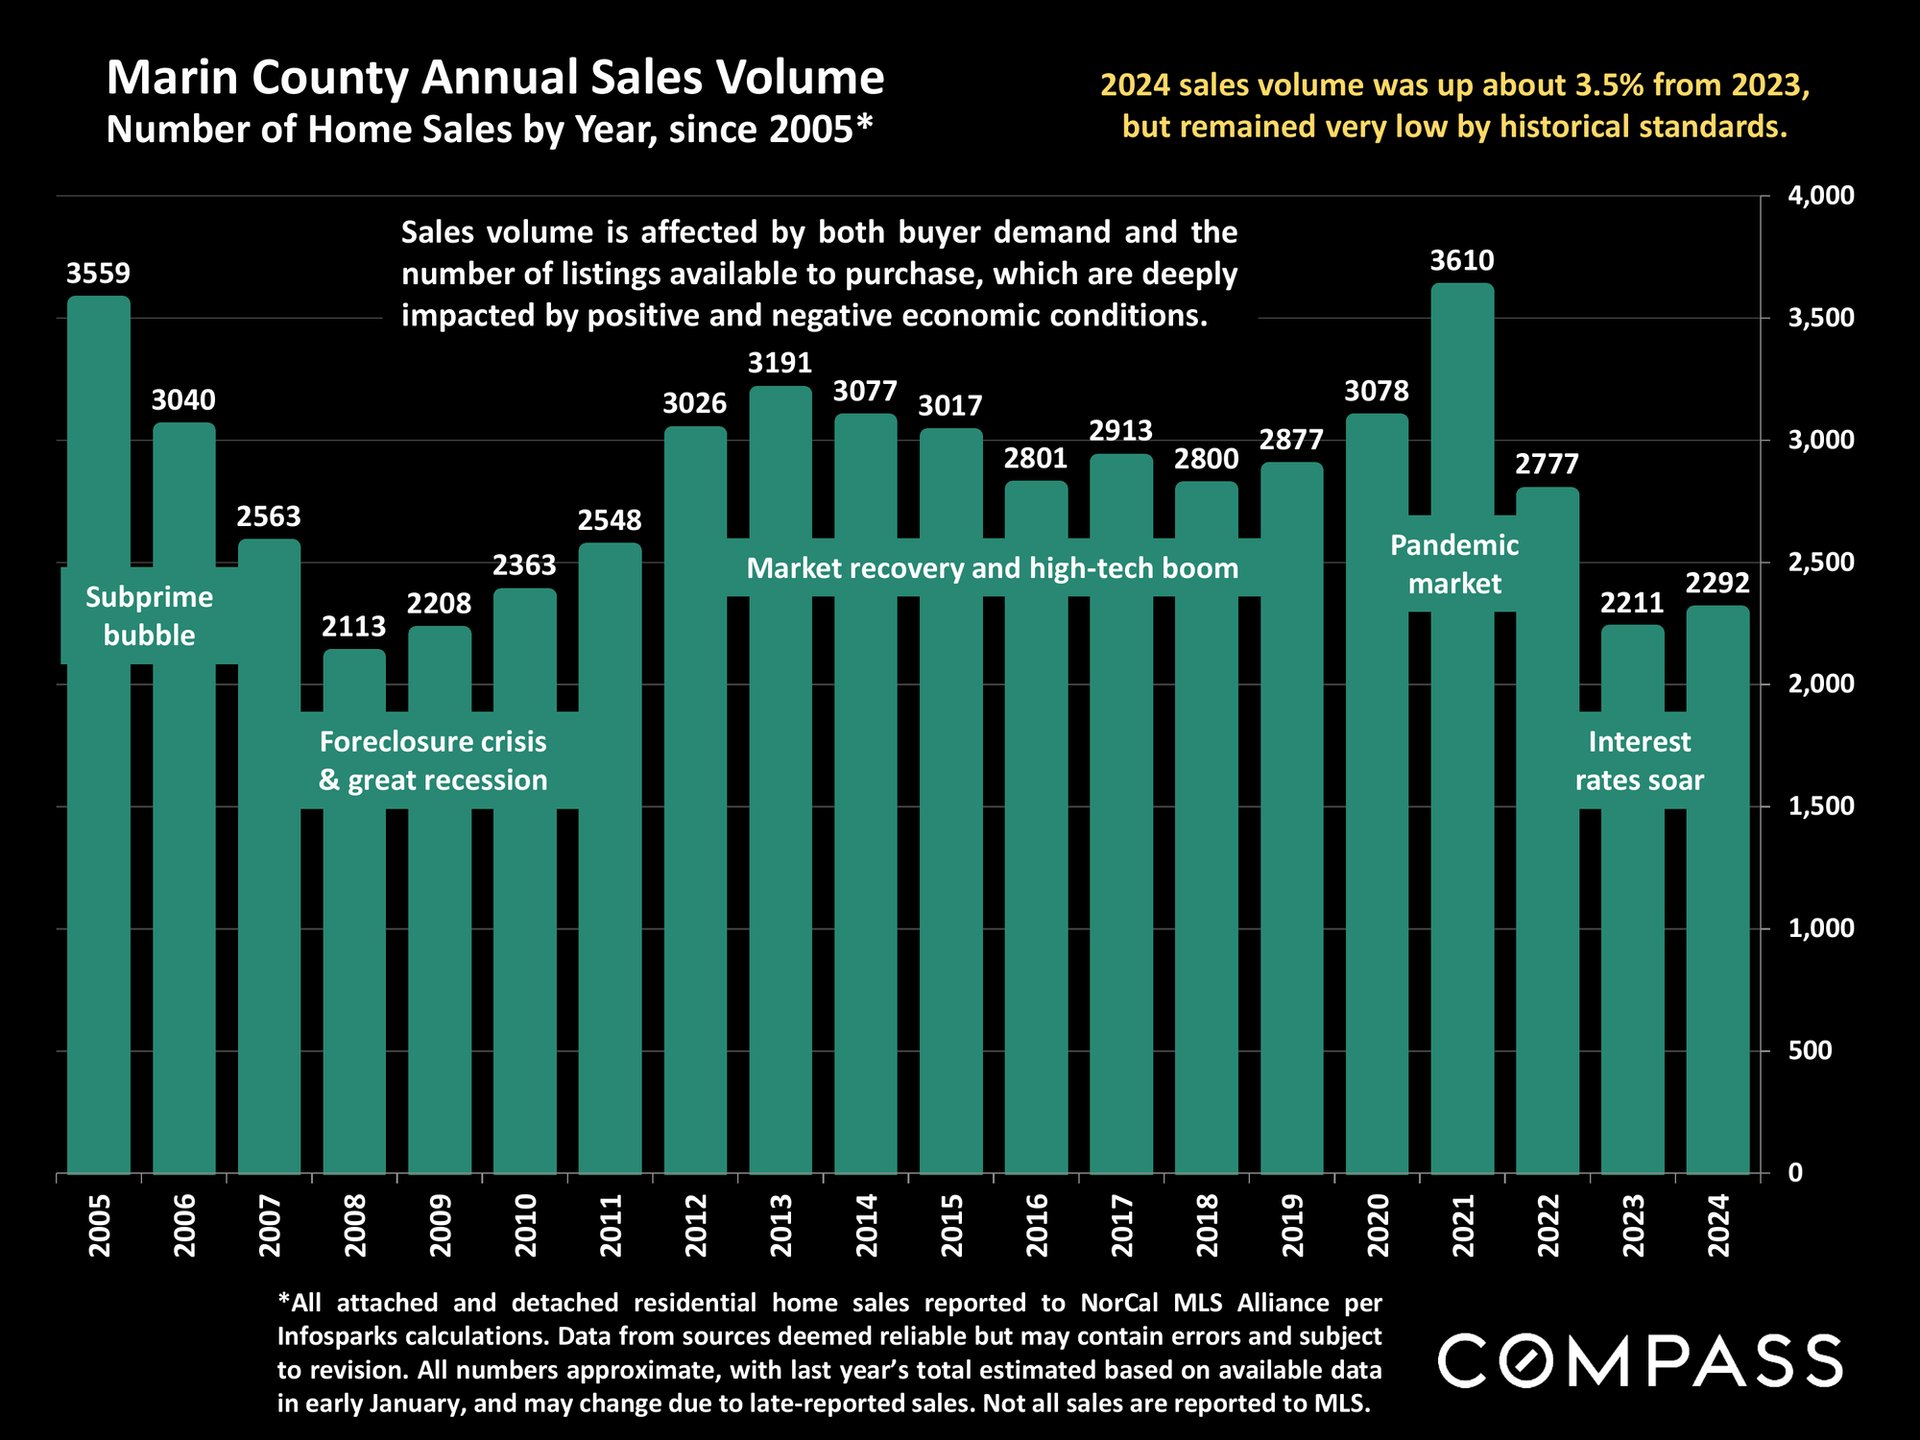
Bar chart of Marin County home sales from 2005–2024, showing 2,292 sales in 2024, up 3.5% from 2023.
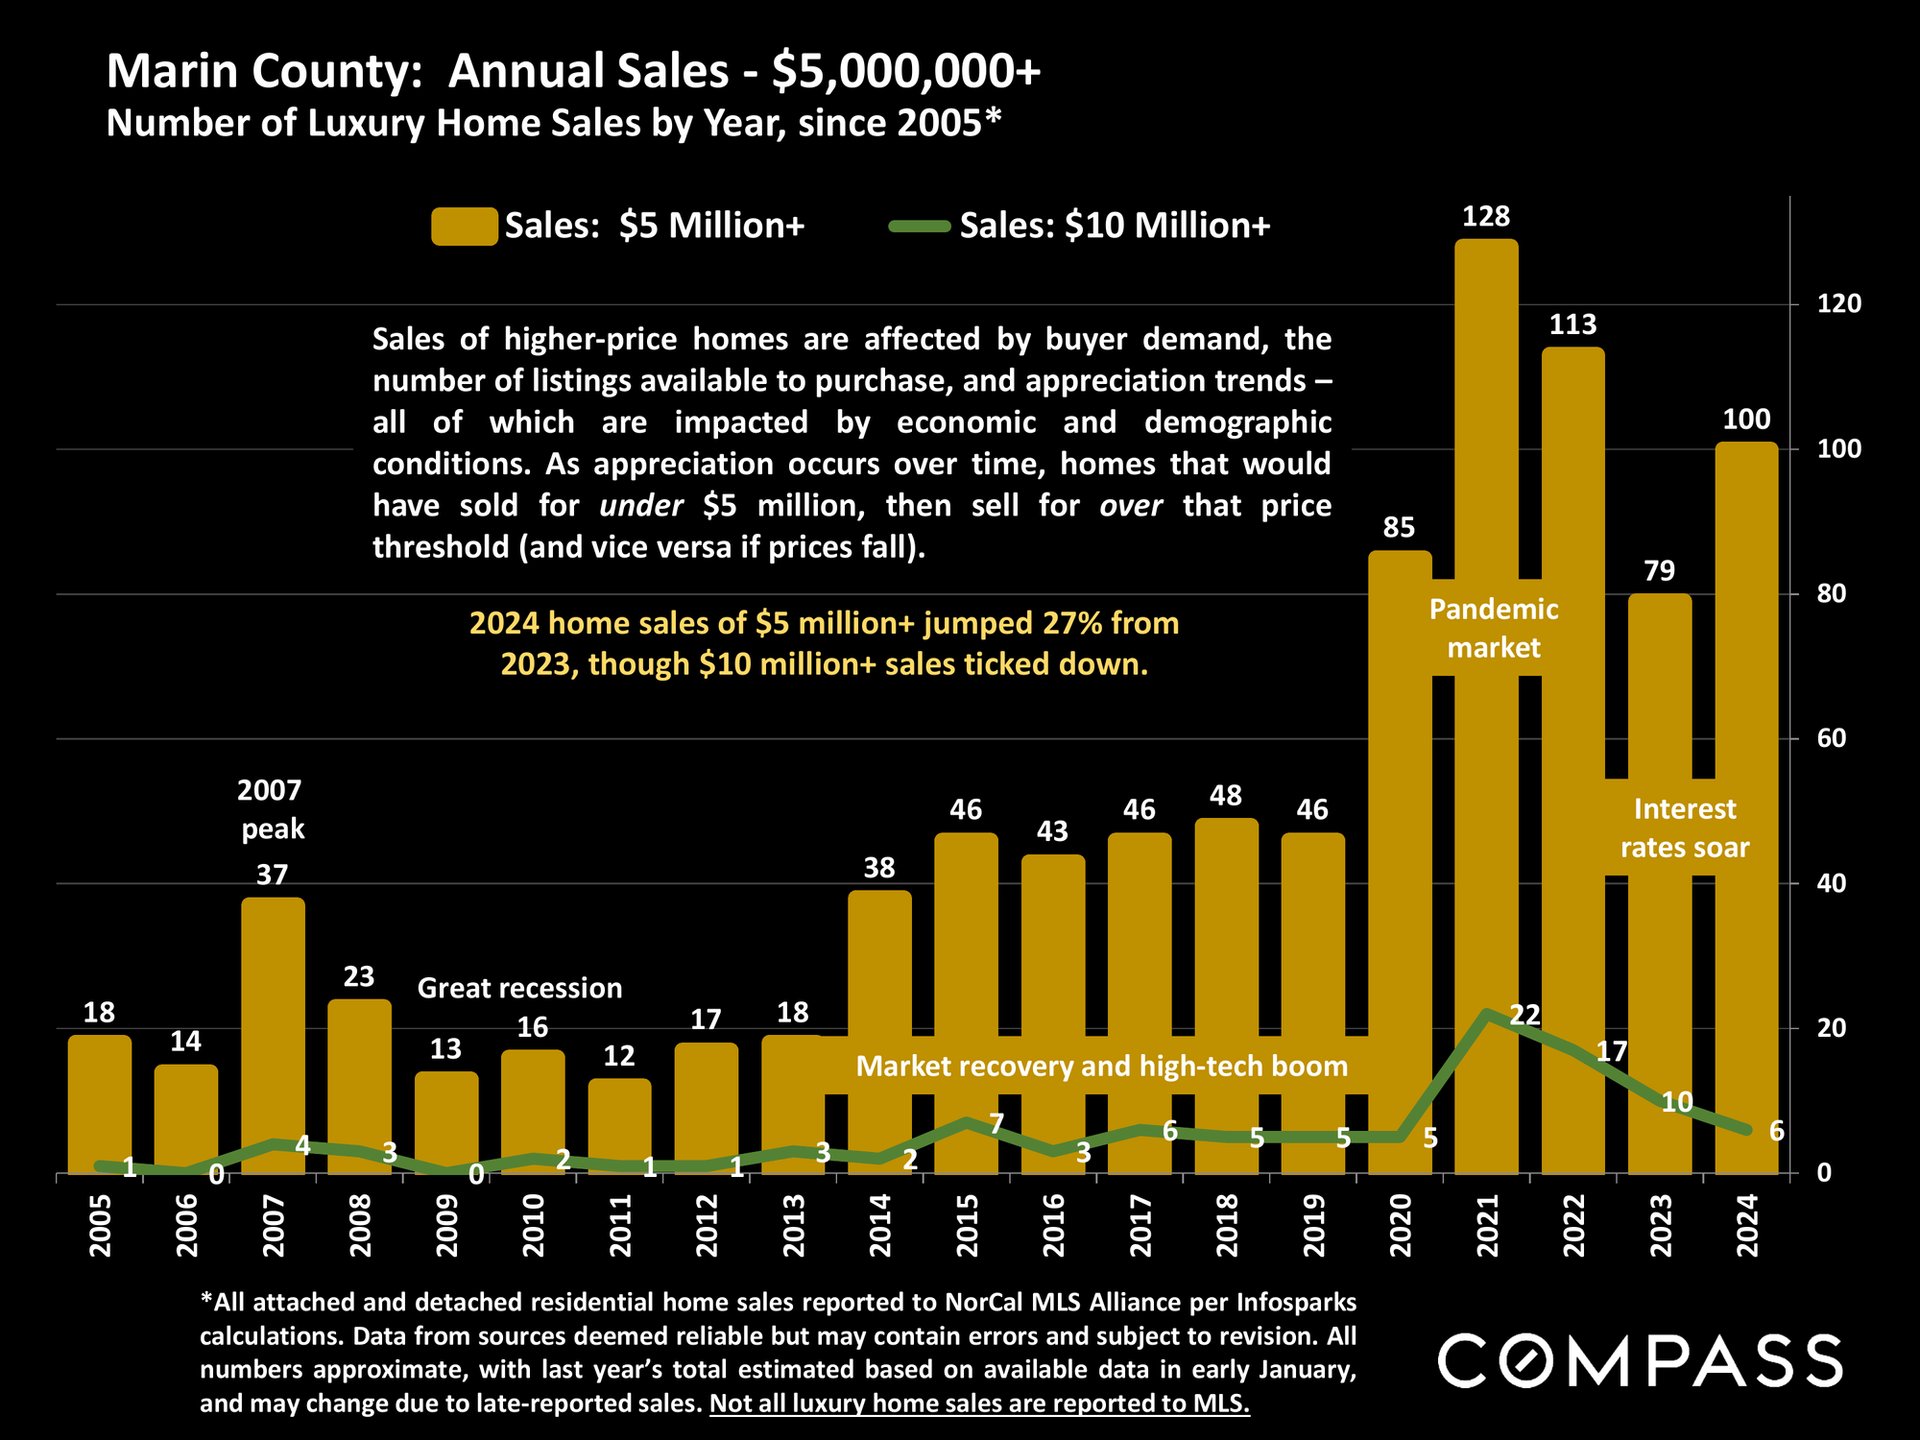
Chart of Marin County luxury home sales from 2005 to 2024, with gold bars for $5 million-plus sales and a green line for $10 million-plus sales.
Pie chart of Marin County 2024 home sales by price segment, with property-type shares and market notes.
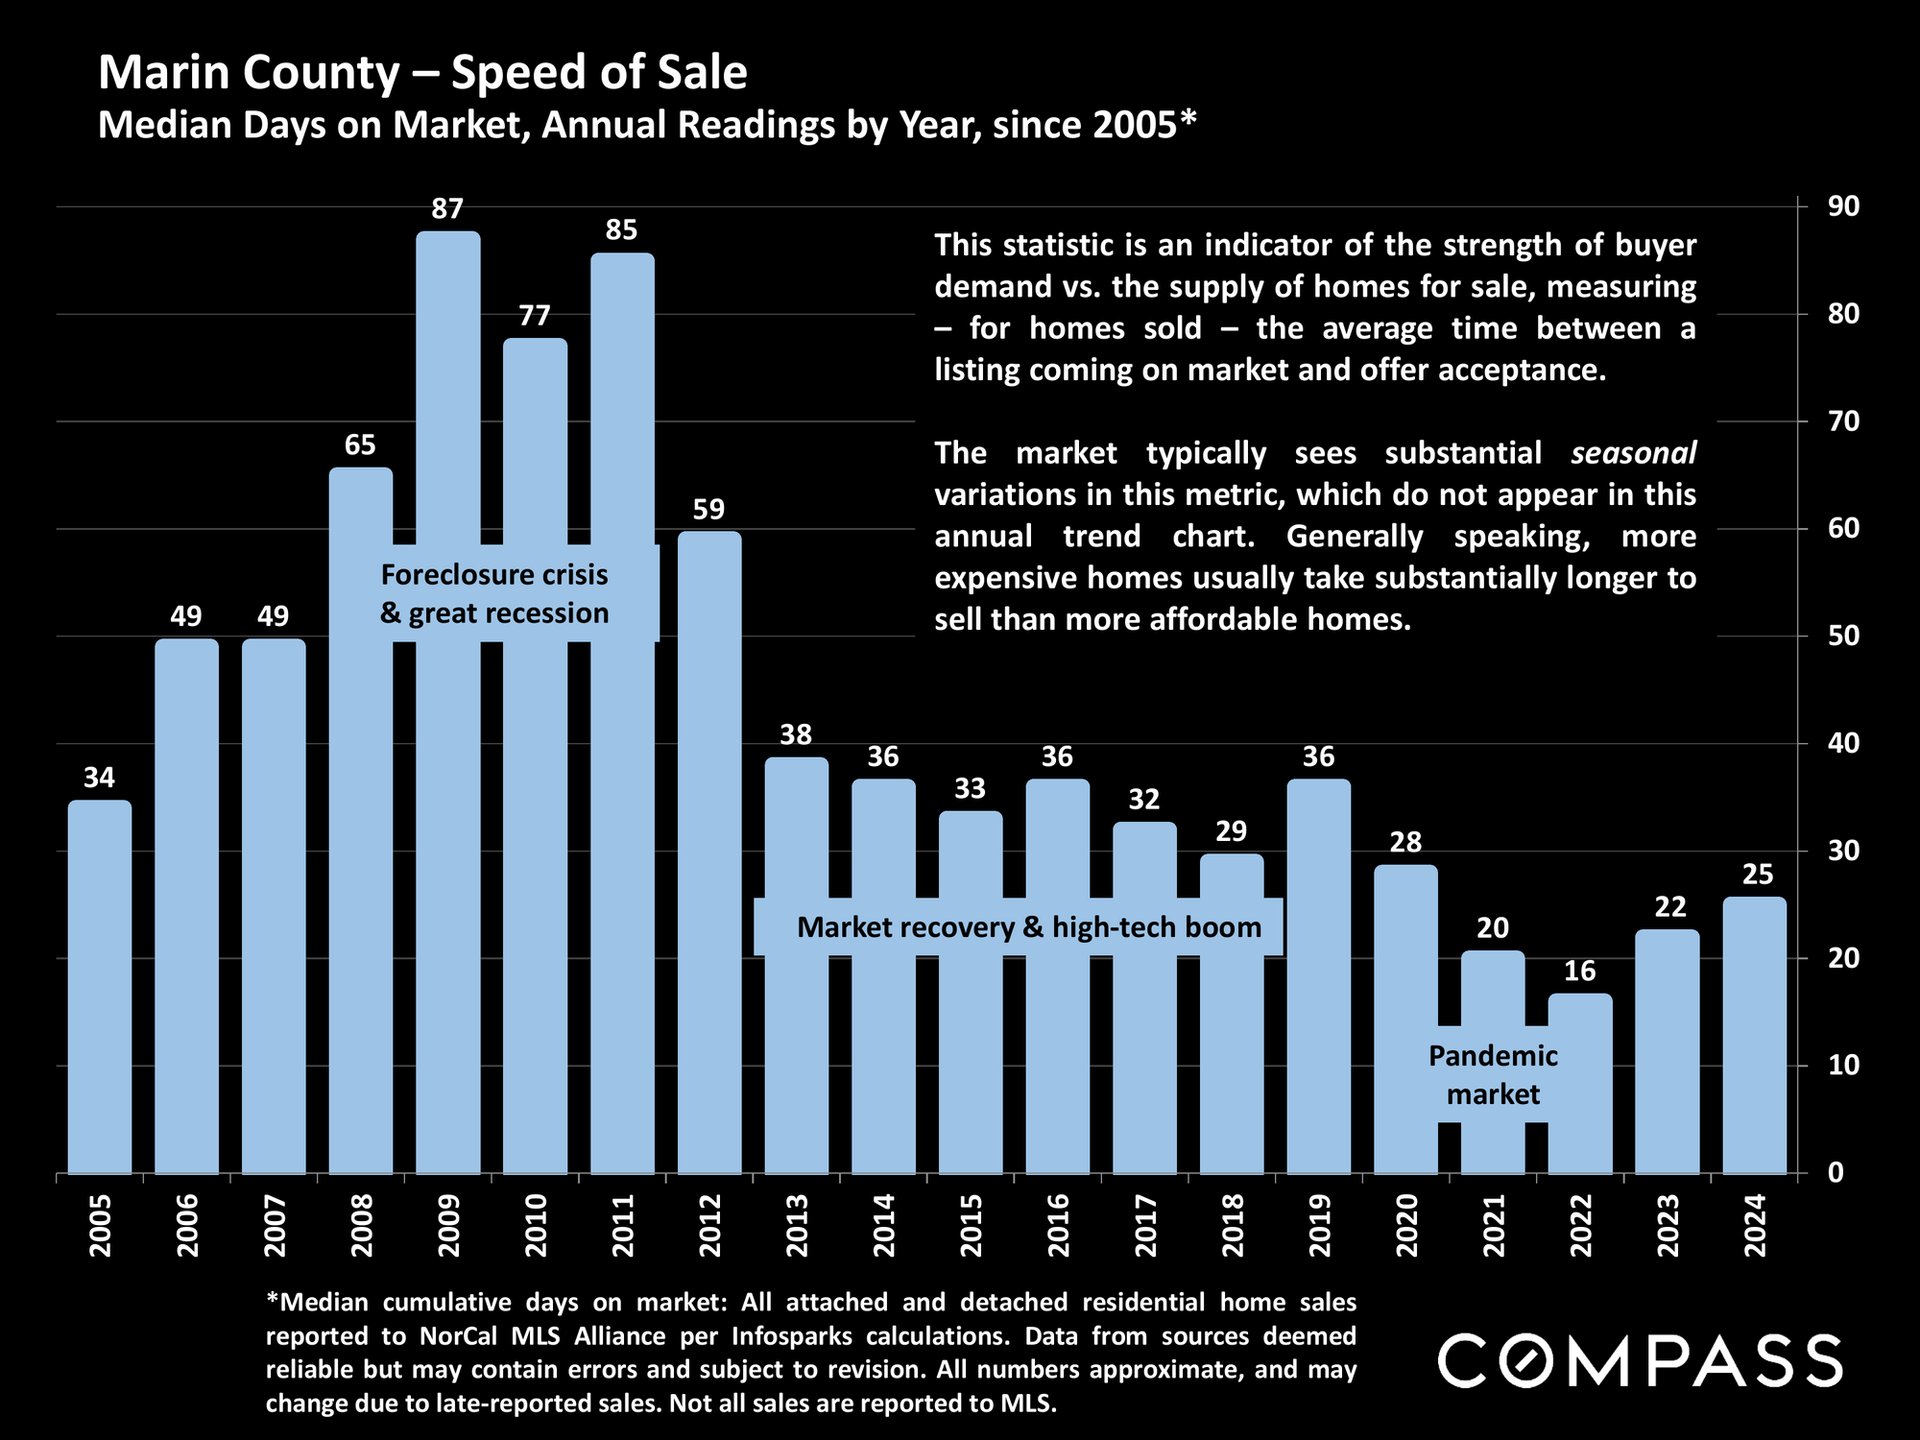
Chart of Marin County median days on market, peaking at 87 in 2009, falling to 16 in 2022, and reaching 25 in 2024.
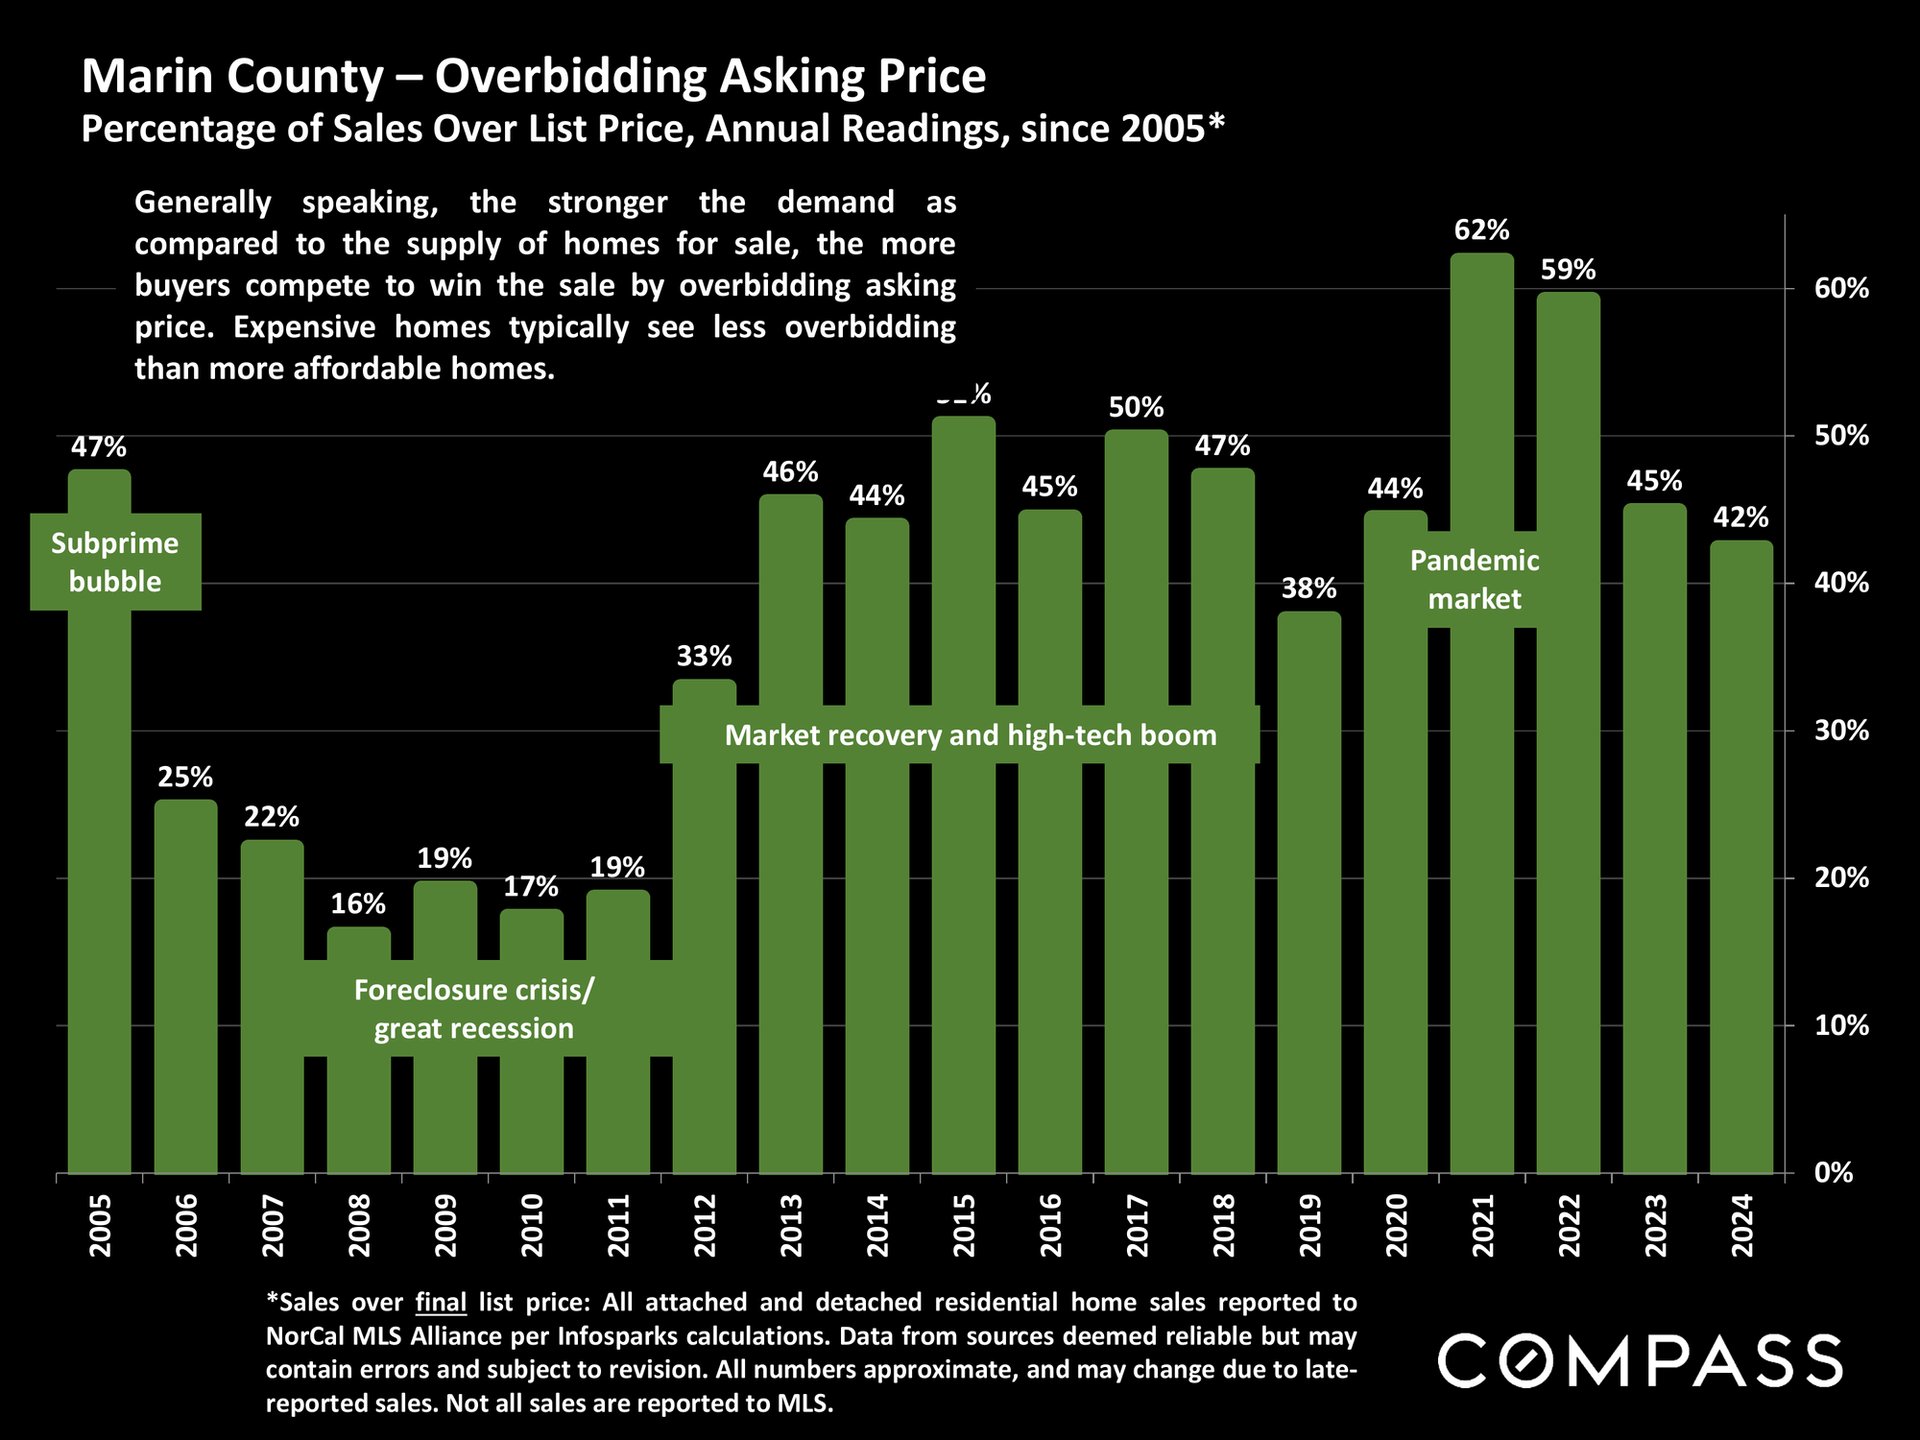
Bar chart of Marin County home sales over list price, peaking at 62% in 2021 and declining to 42% in 2024.
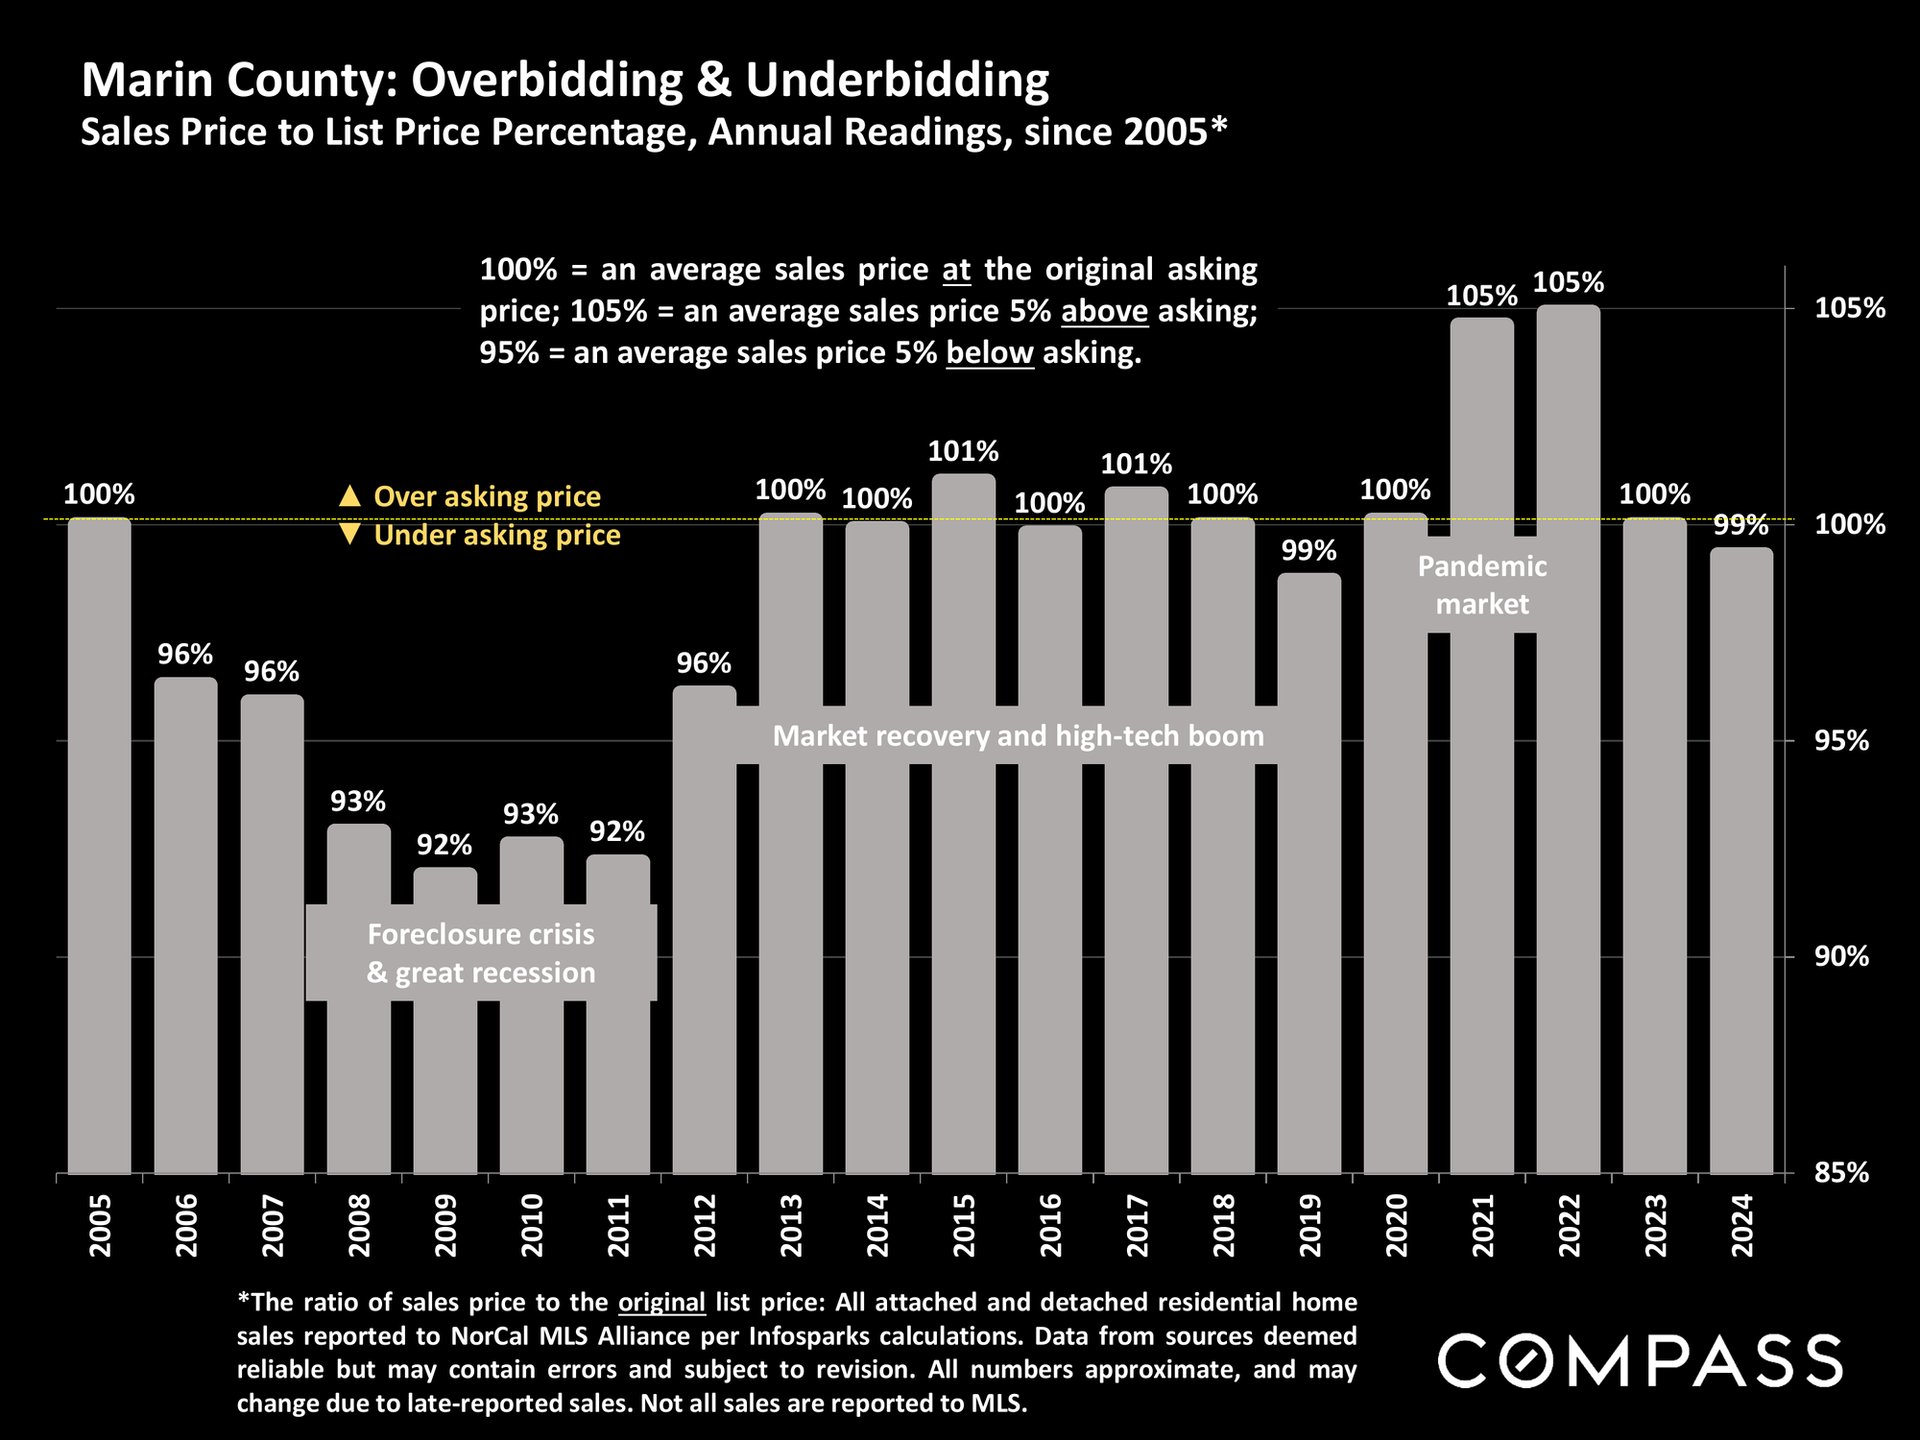
Marin County sale-to-list price chart, 2005–2024, with recession, recovery, and pandemic annotations.
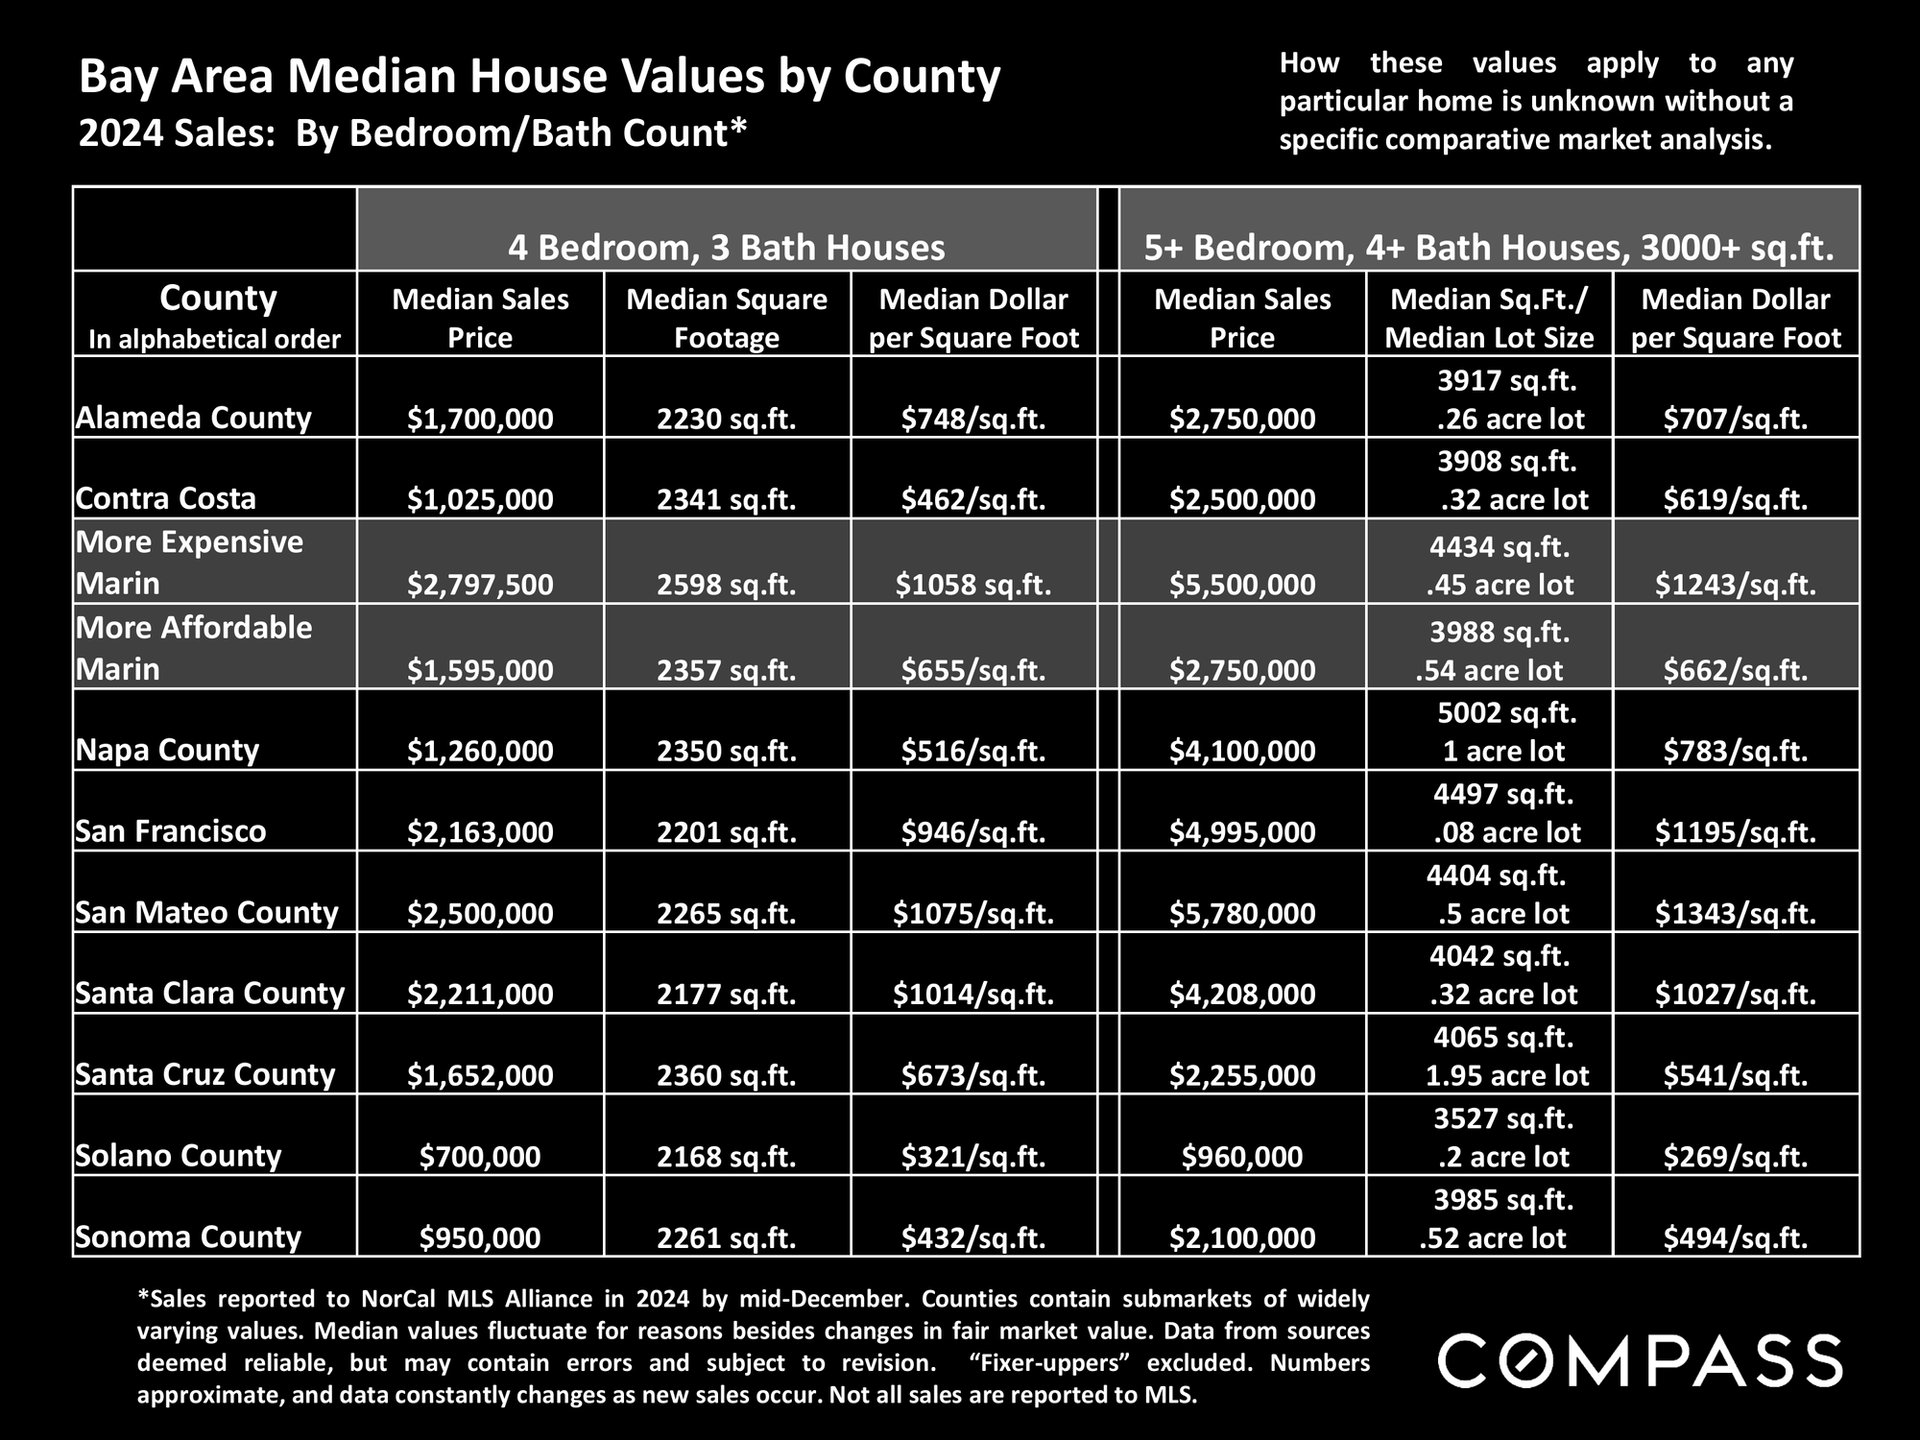
Chart comparing 2024 median home prices and sizes across Bay Area counties by bedroom and bathroom count.
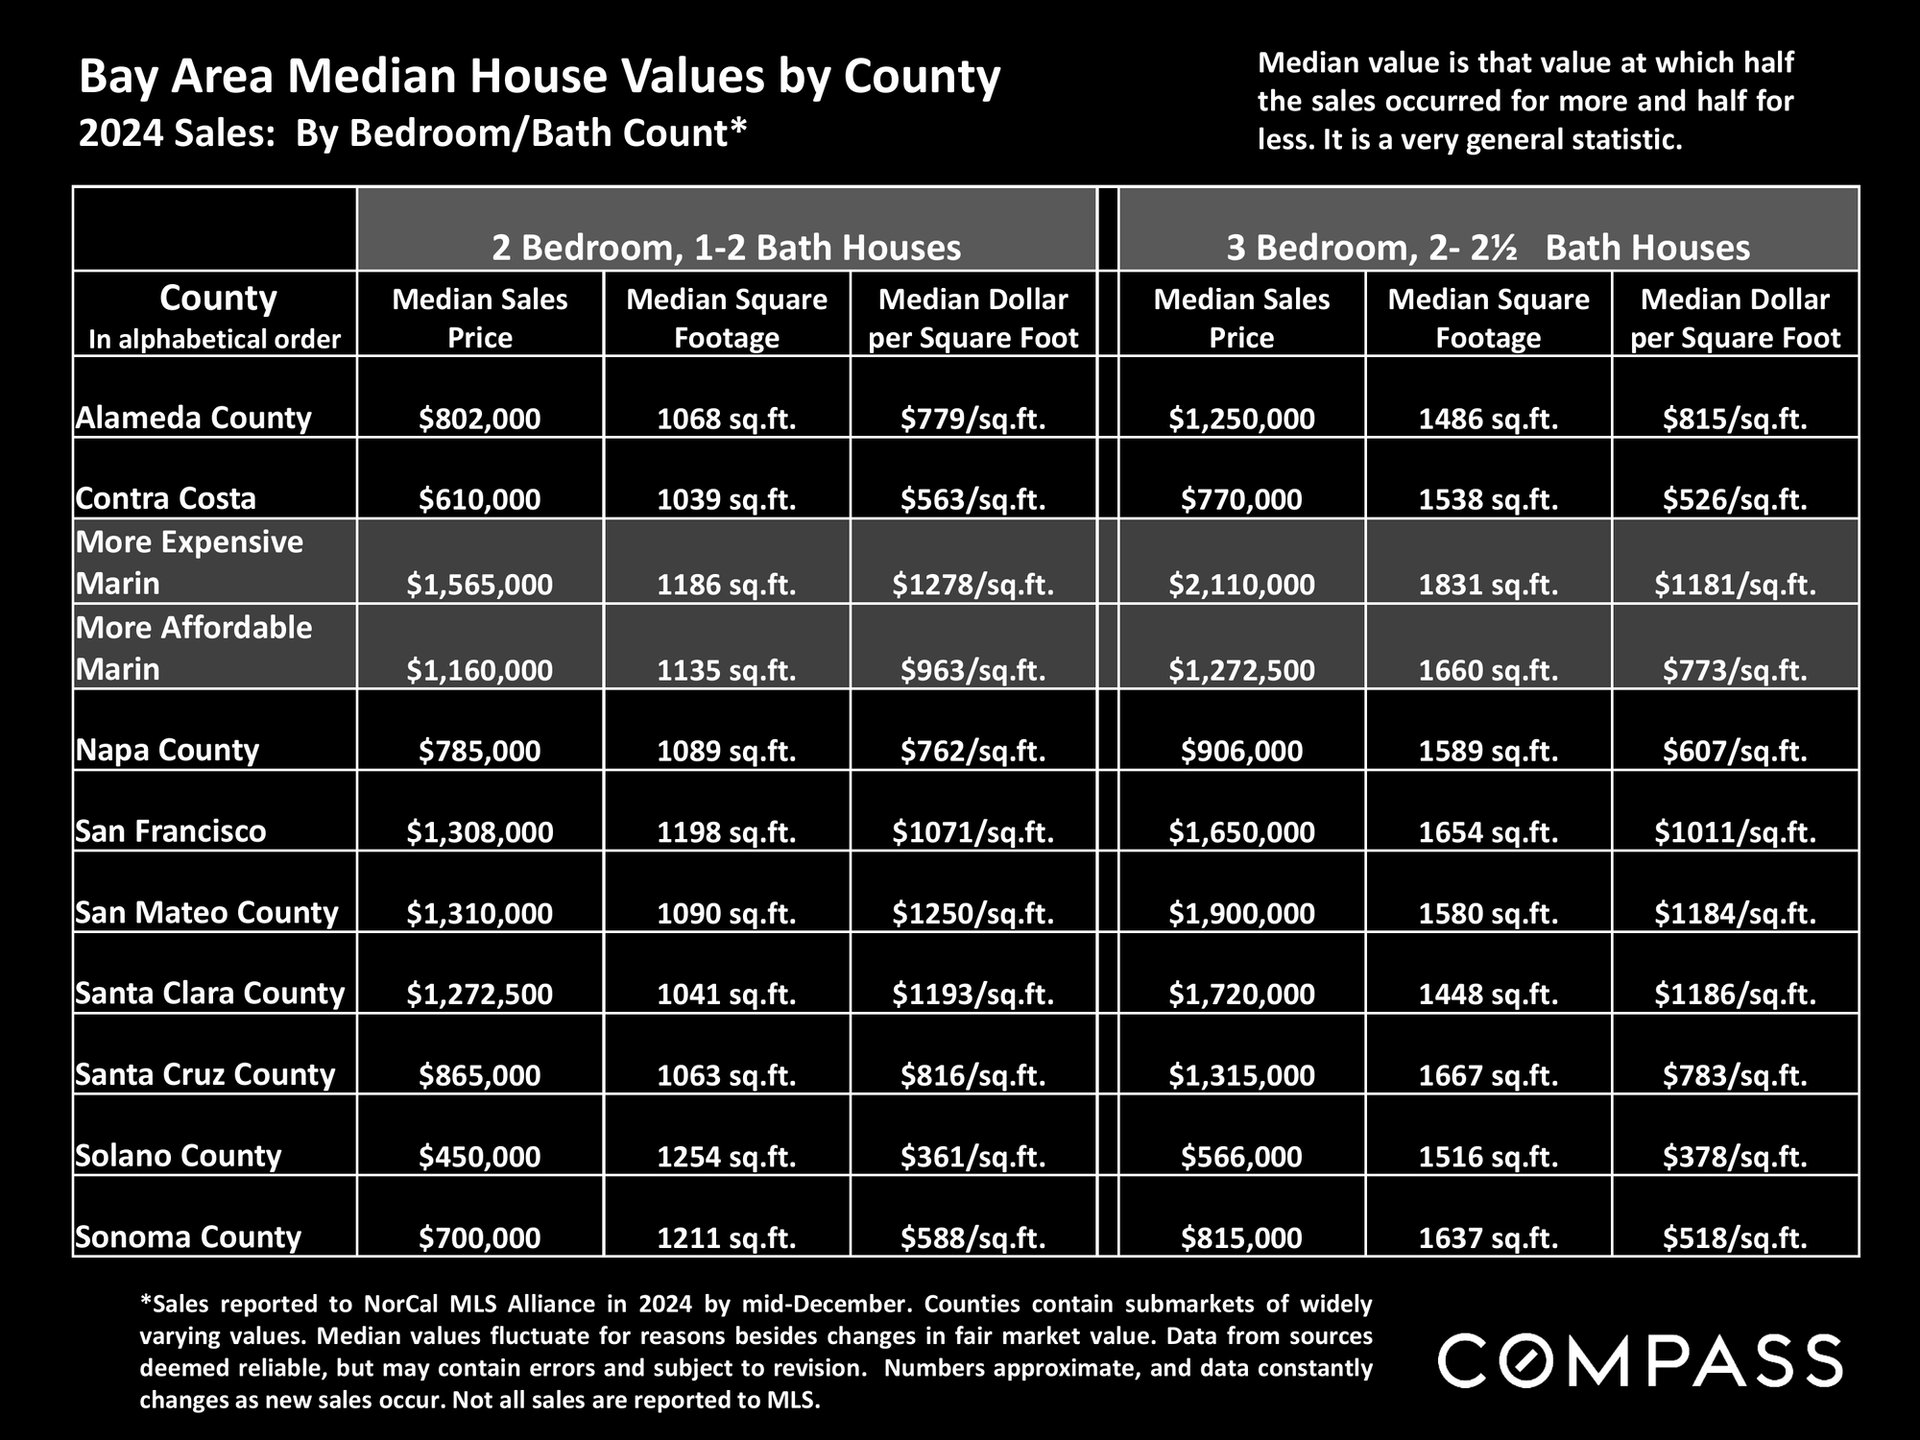
Table comparing 2024 Bay Area home values by county and bedroom count; Marin is split into more expensive and affordable submarkets.
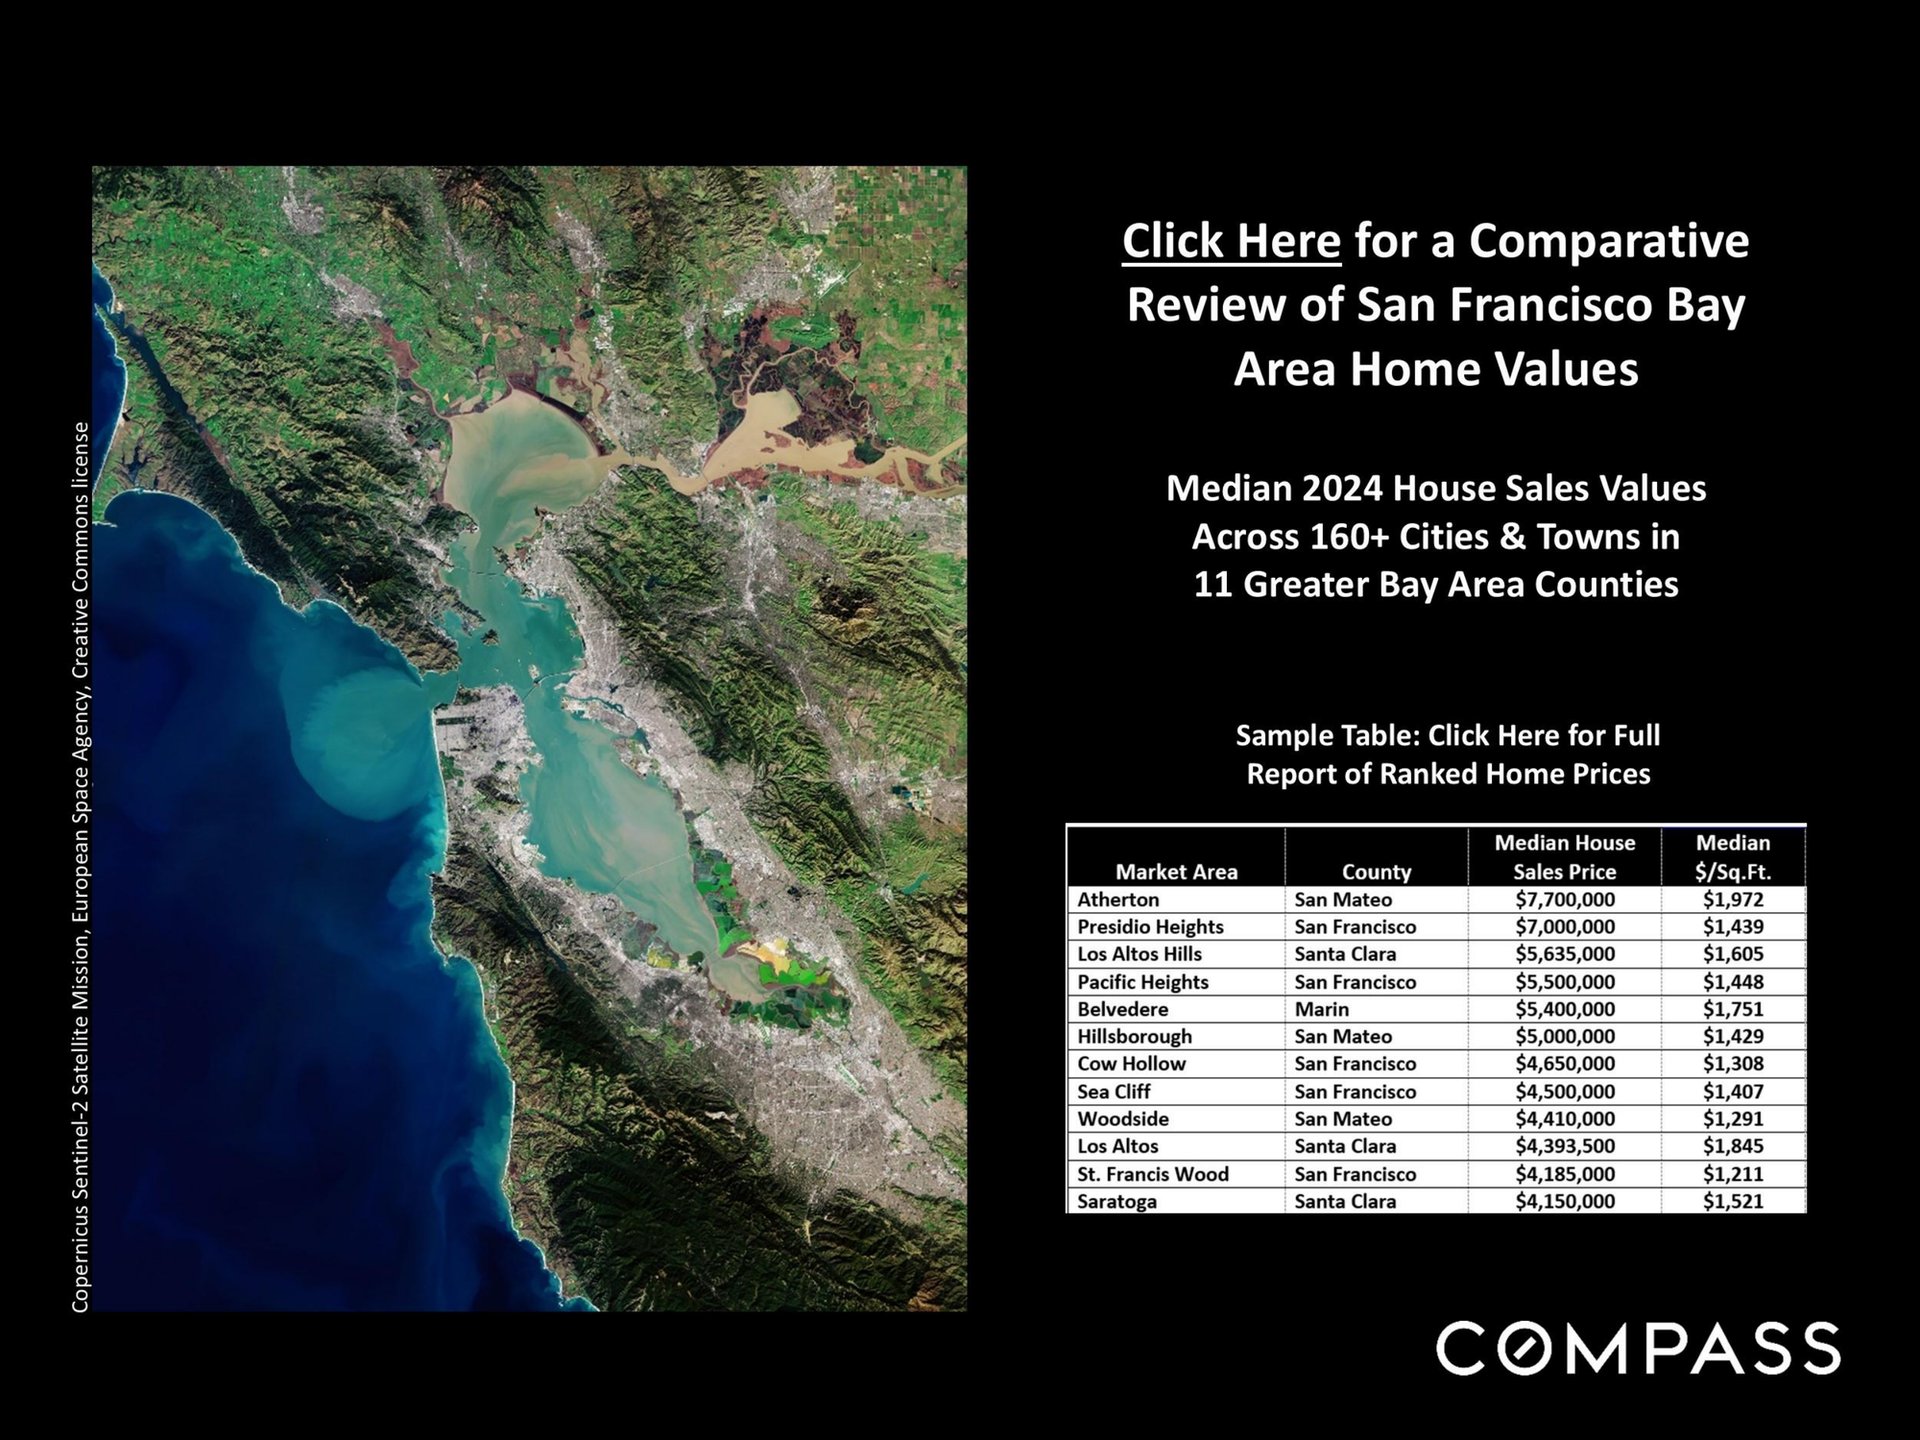
Bay Area home-value infographic with a satellite map and a sample table of 2024 median sale prices.
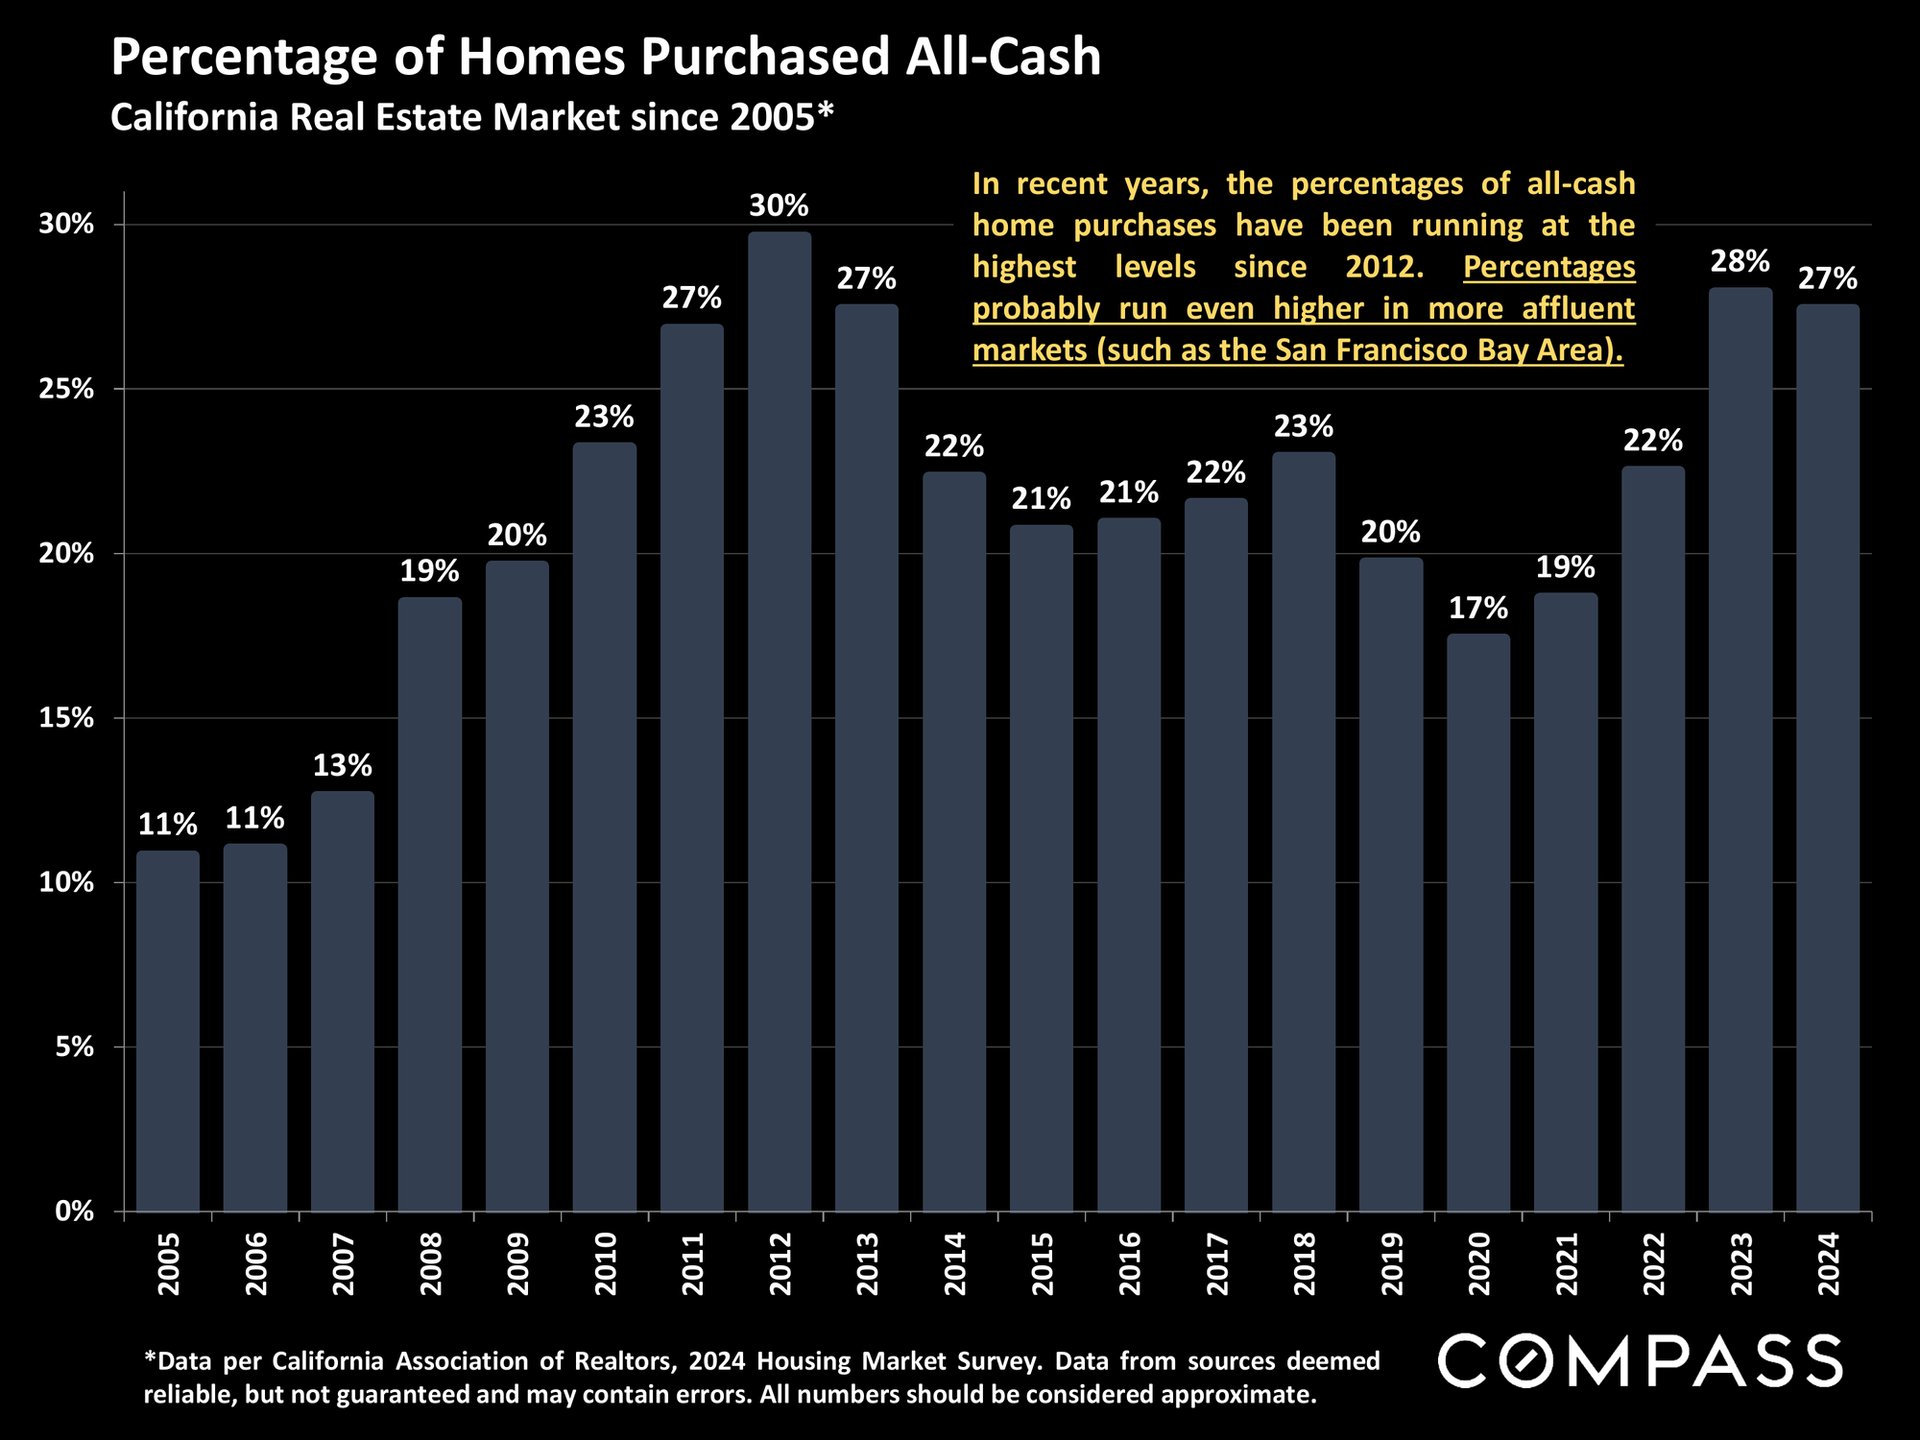
Chart of California all-cash home purchases, 2005–2024, peaking at 30% in 2012 and reaching 27% in 2024.
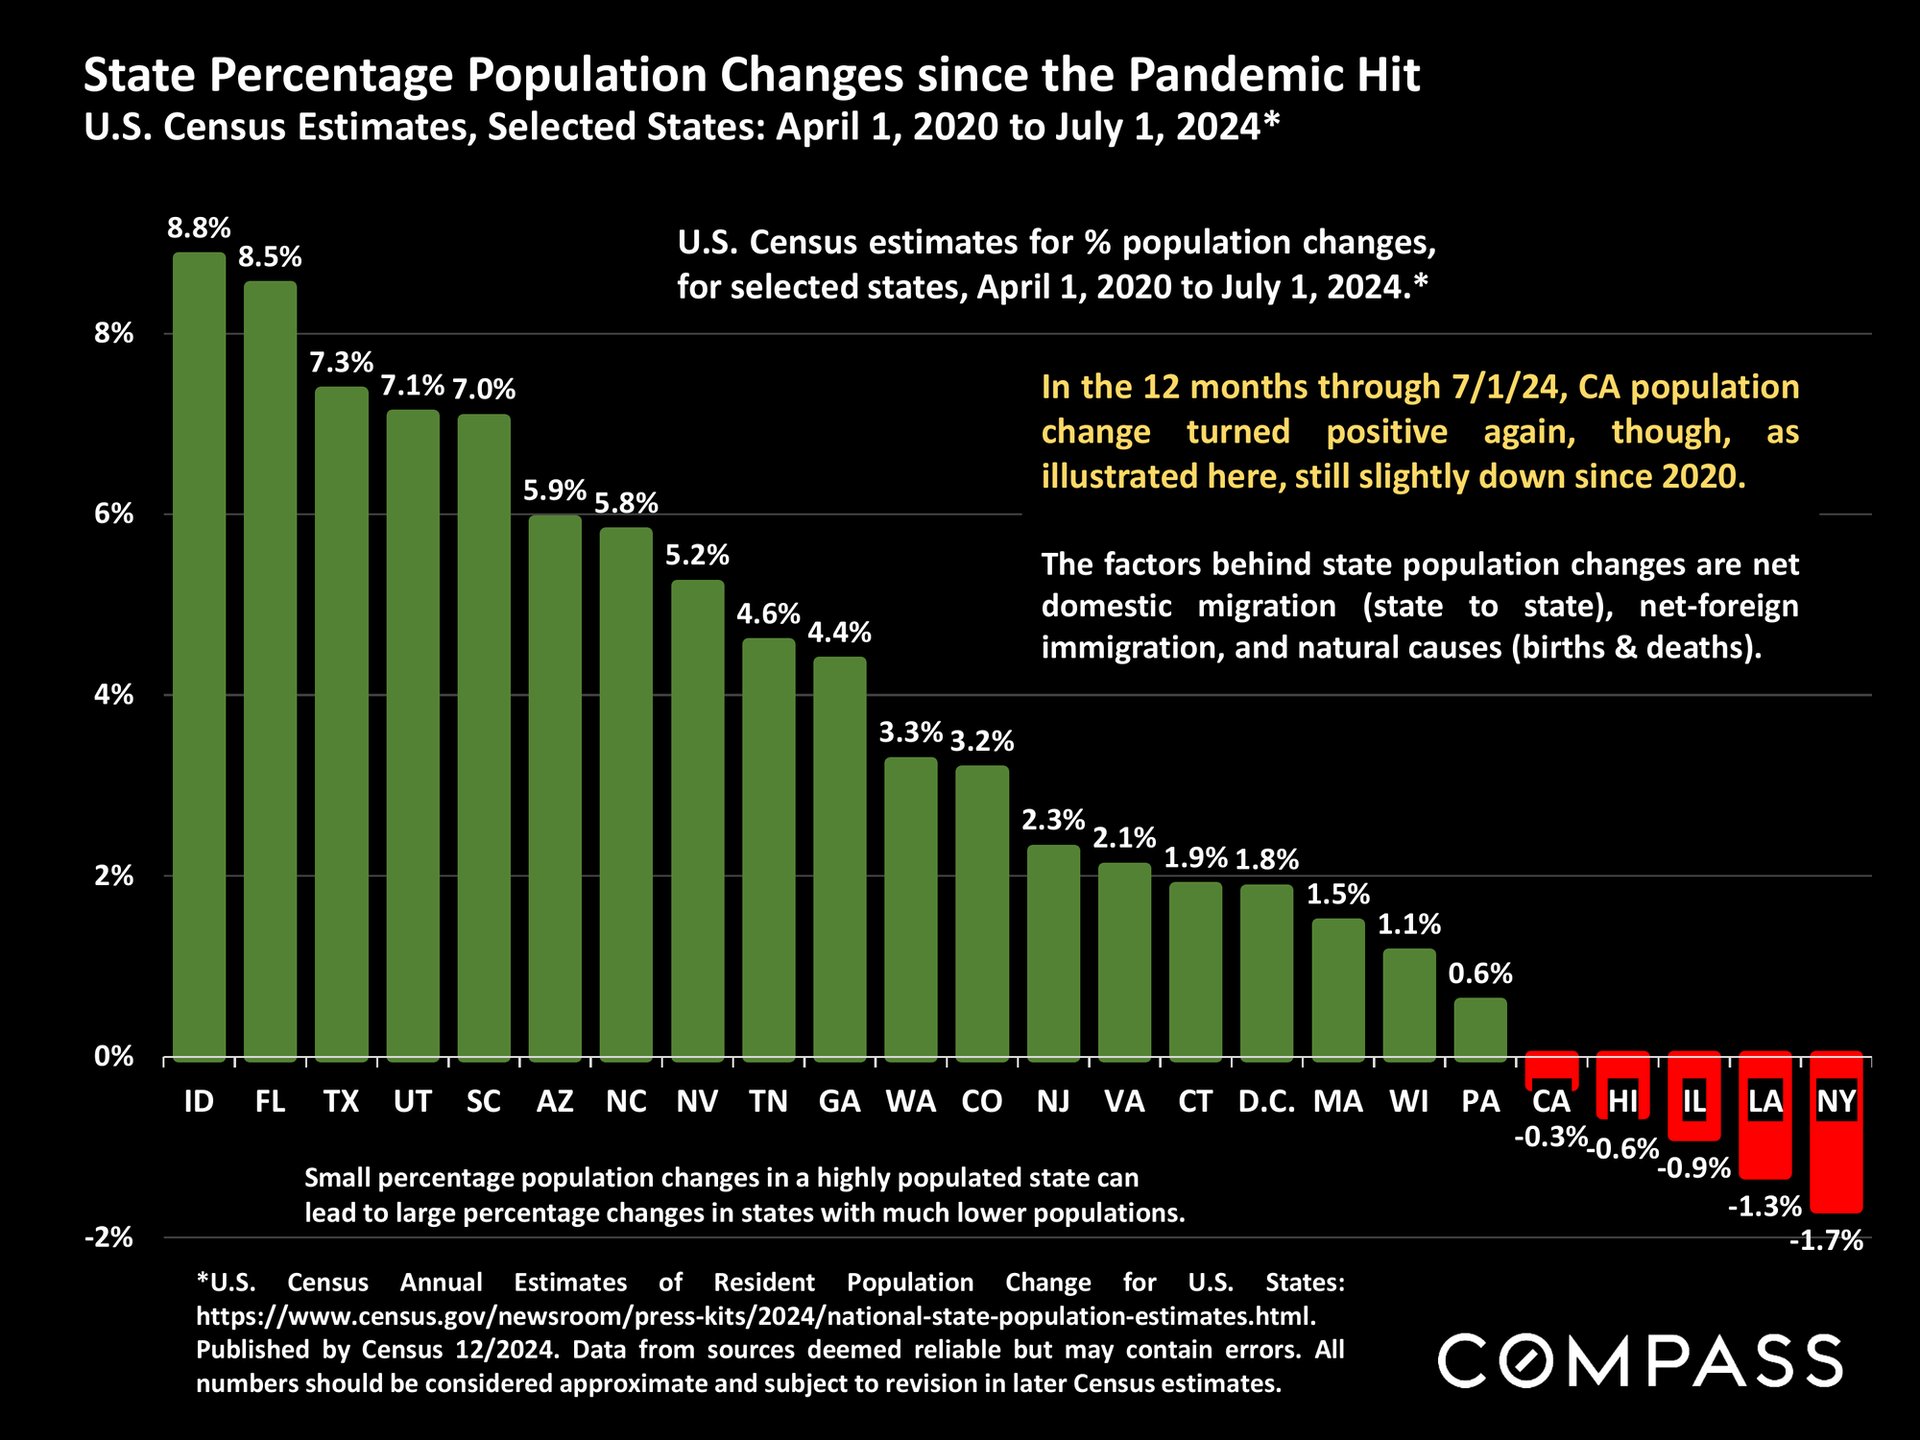
Chart of state population changes from 2020 to 2024, with Idaho highest and New York lowest.
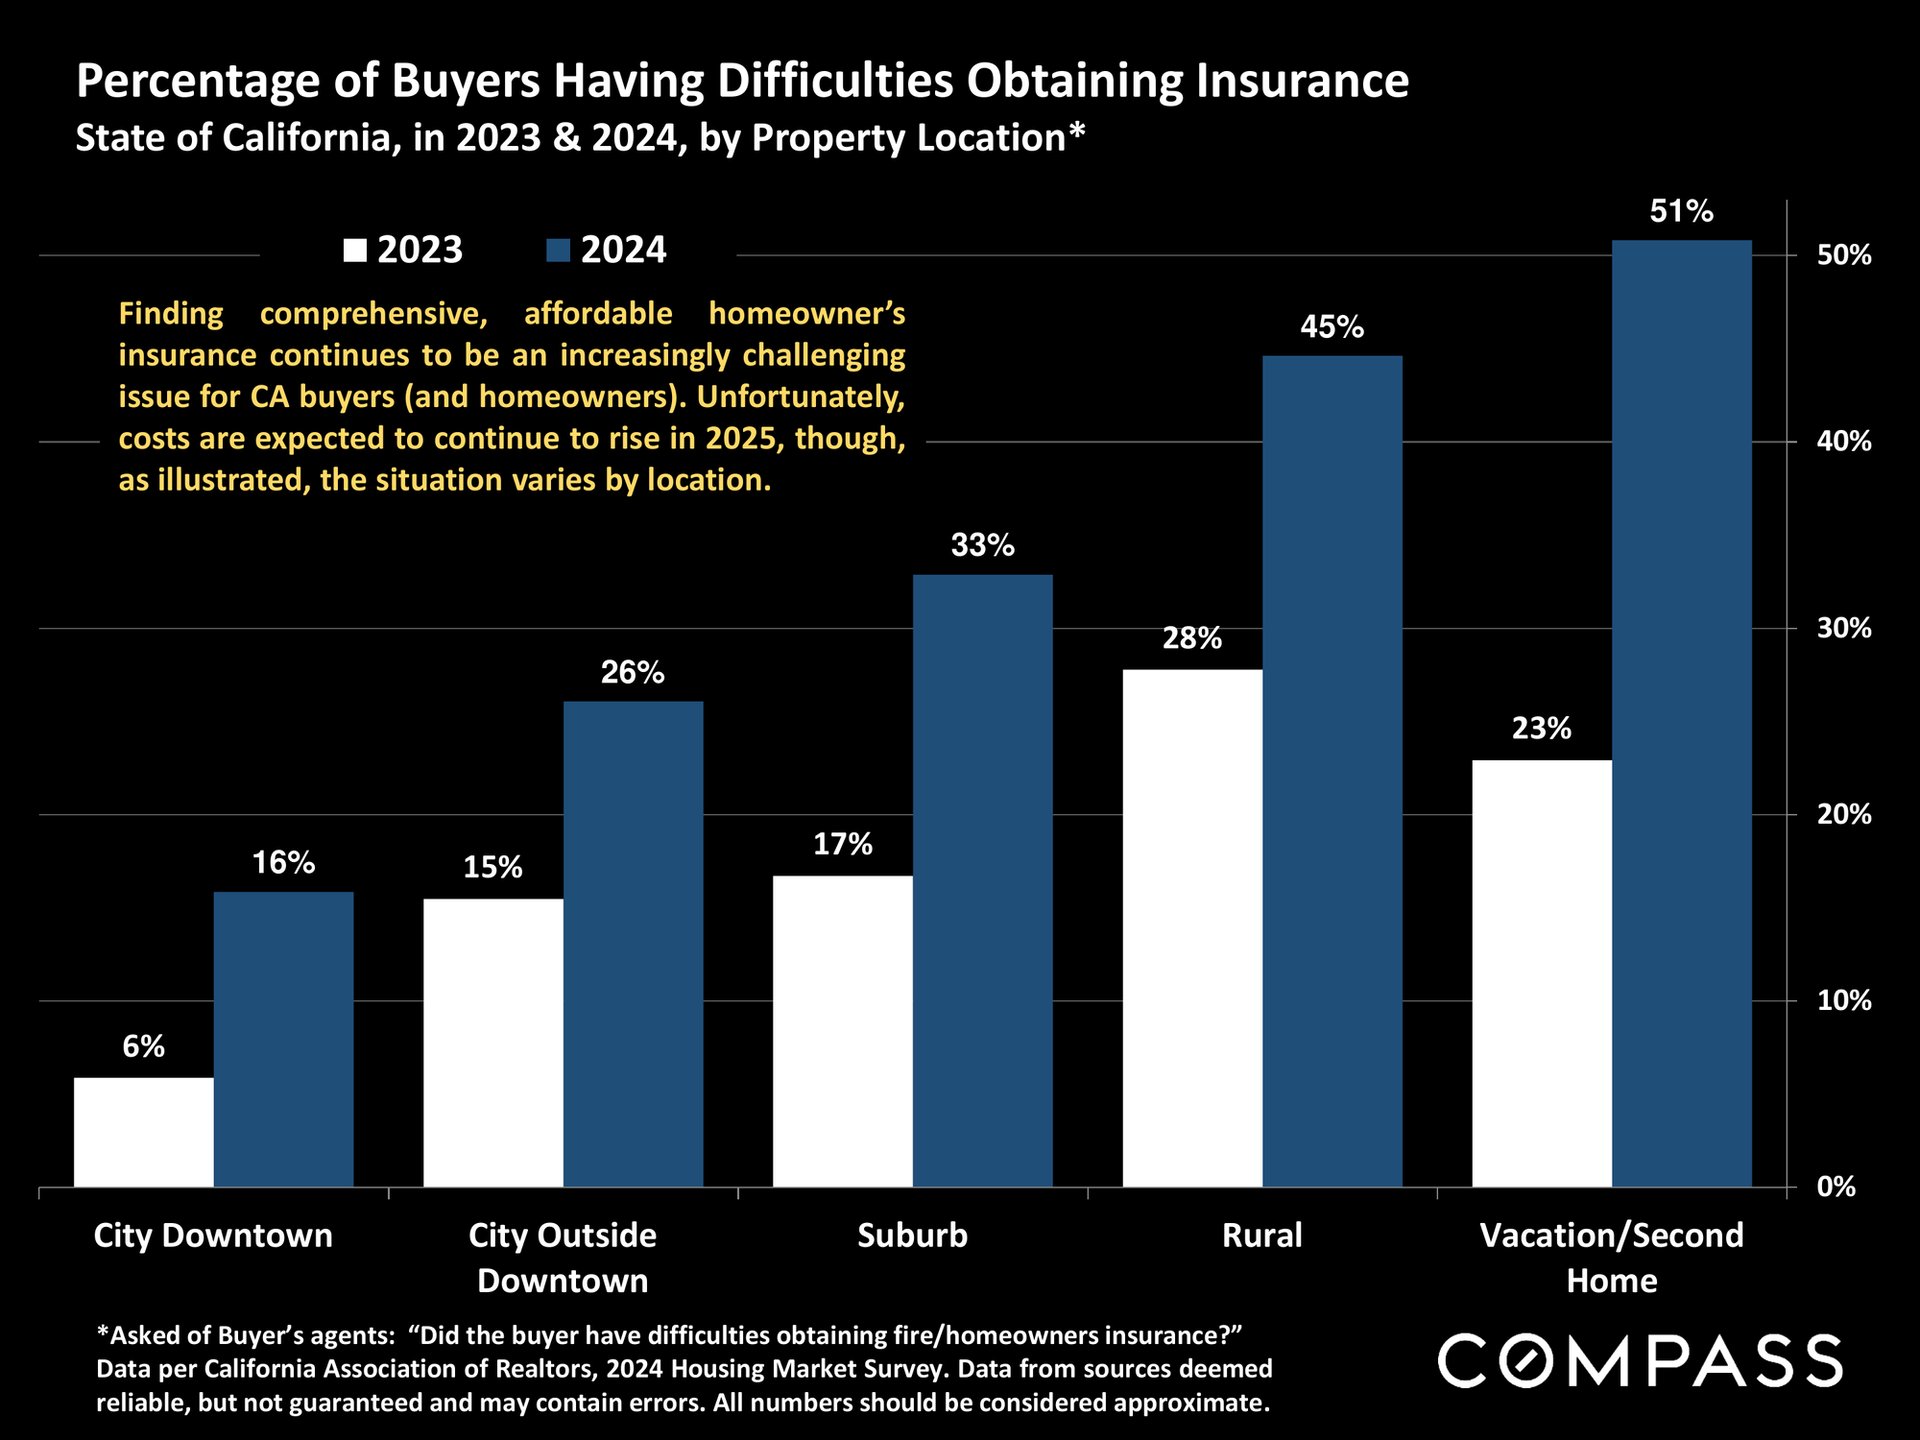
Chart compares California buyers’ insurance difficulties in 2023 and 2024 by property location; rates rise in every category.
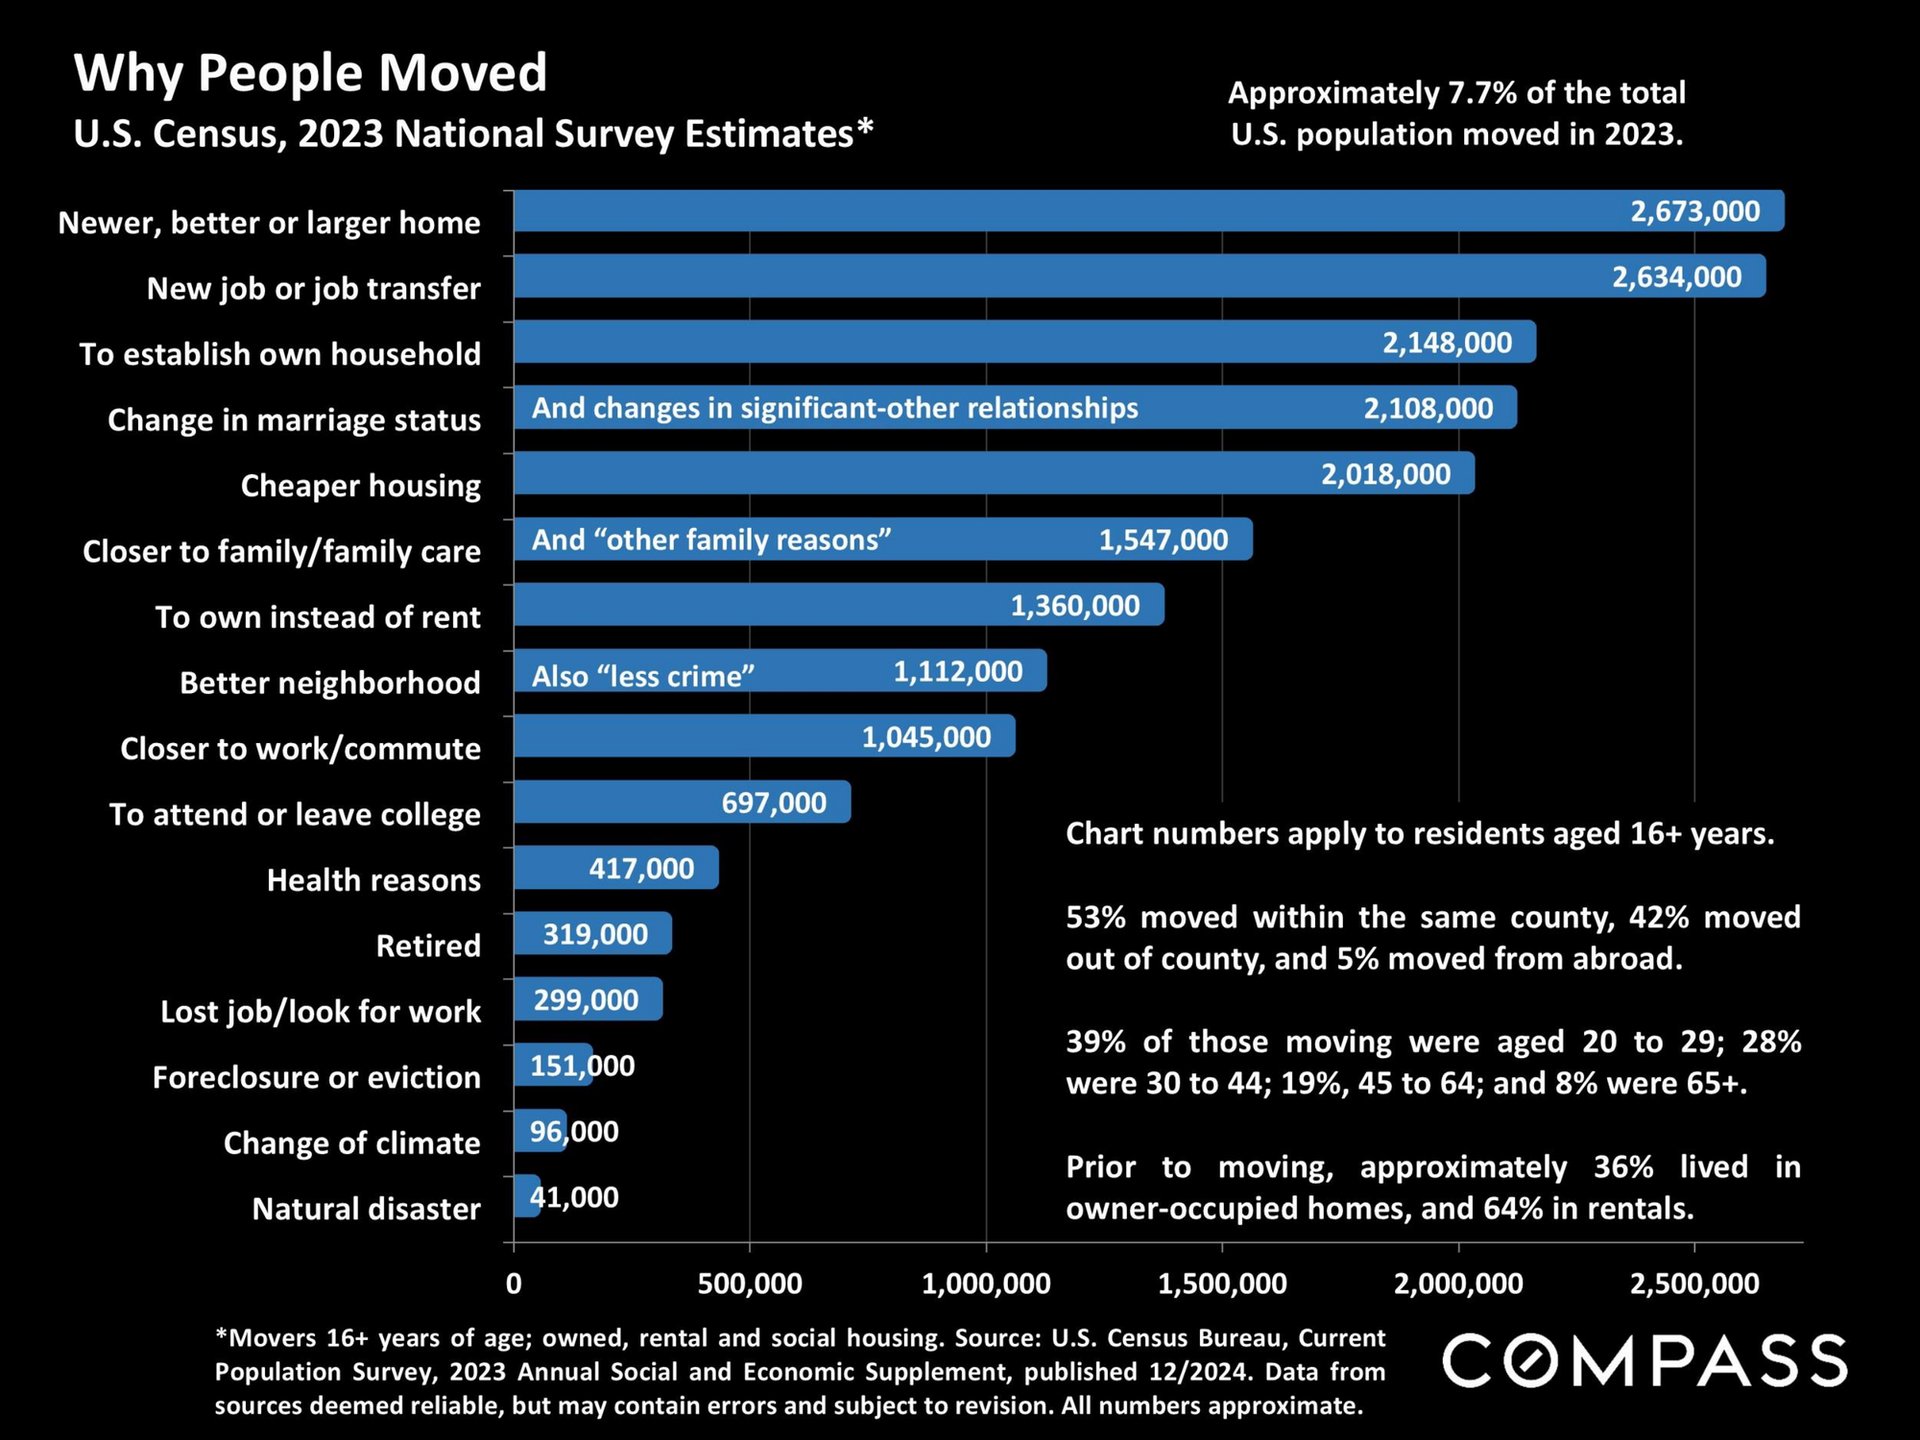
Bar chart of reasons people moved in 2023; better or larger homes and job changes top the list.
Market report notes explain real estate statistics and valuation measures, followed by licensing and legal disclaimers.
Compass 2024 Marin County real estate sales report cover with a panoramic view of wooded hills and the distant San Francisco skyline.
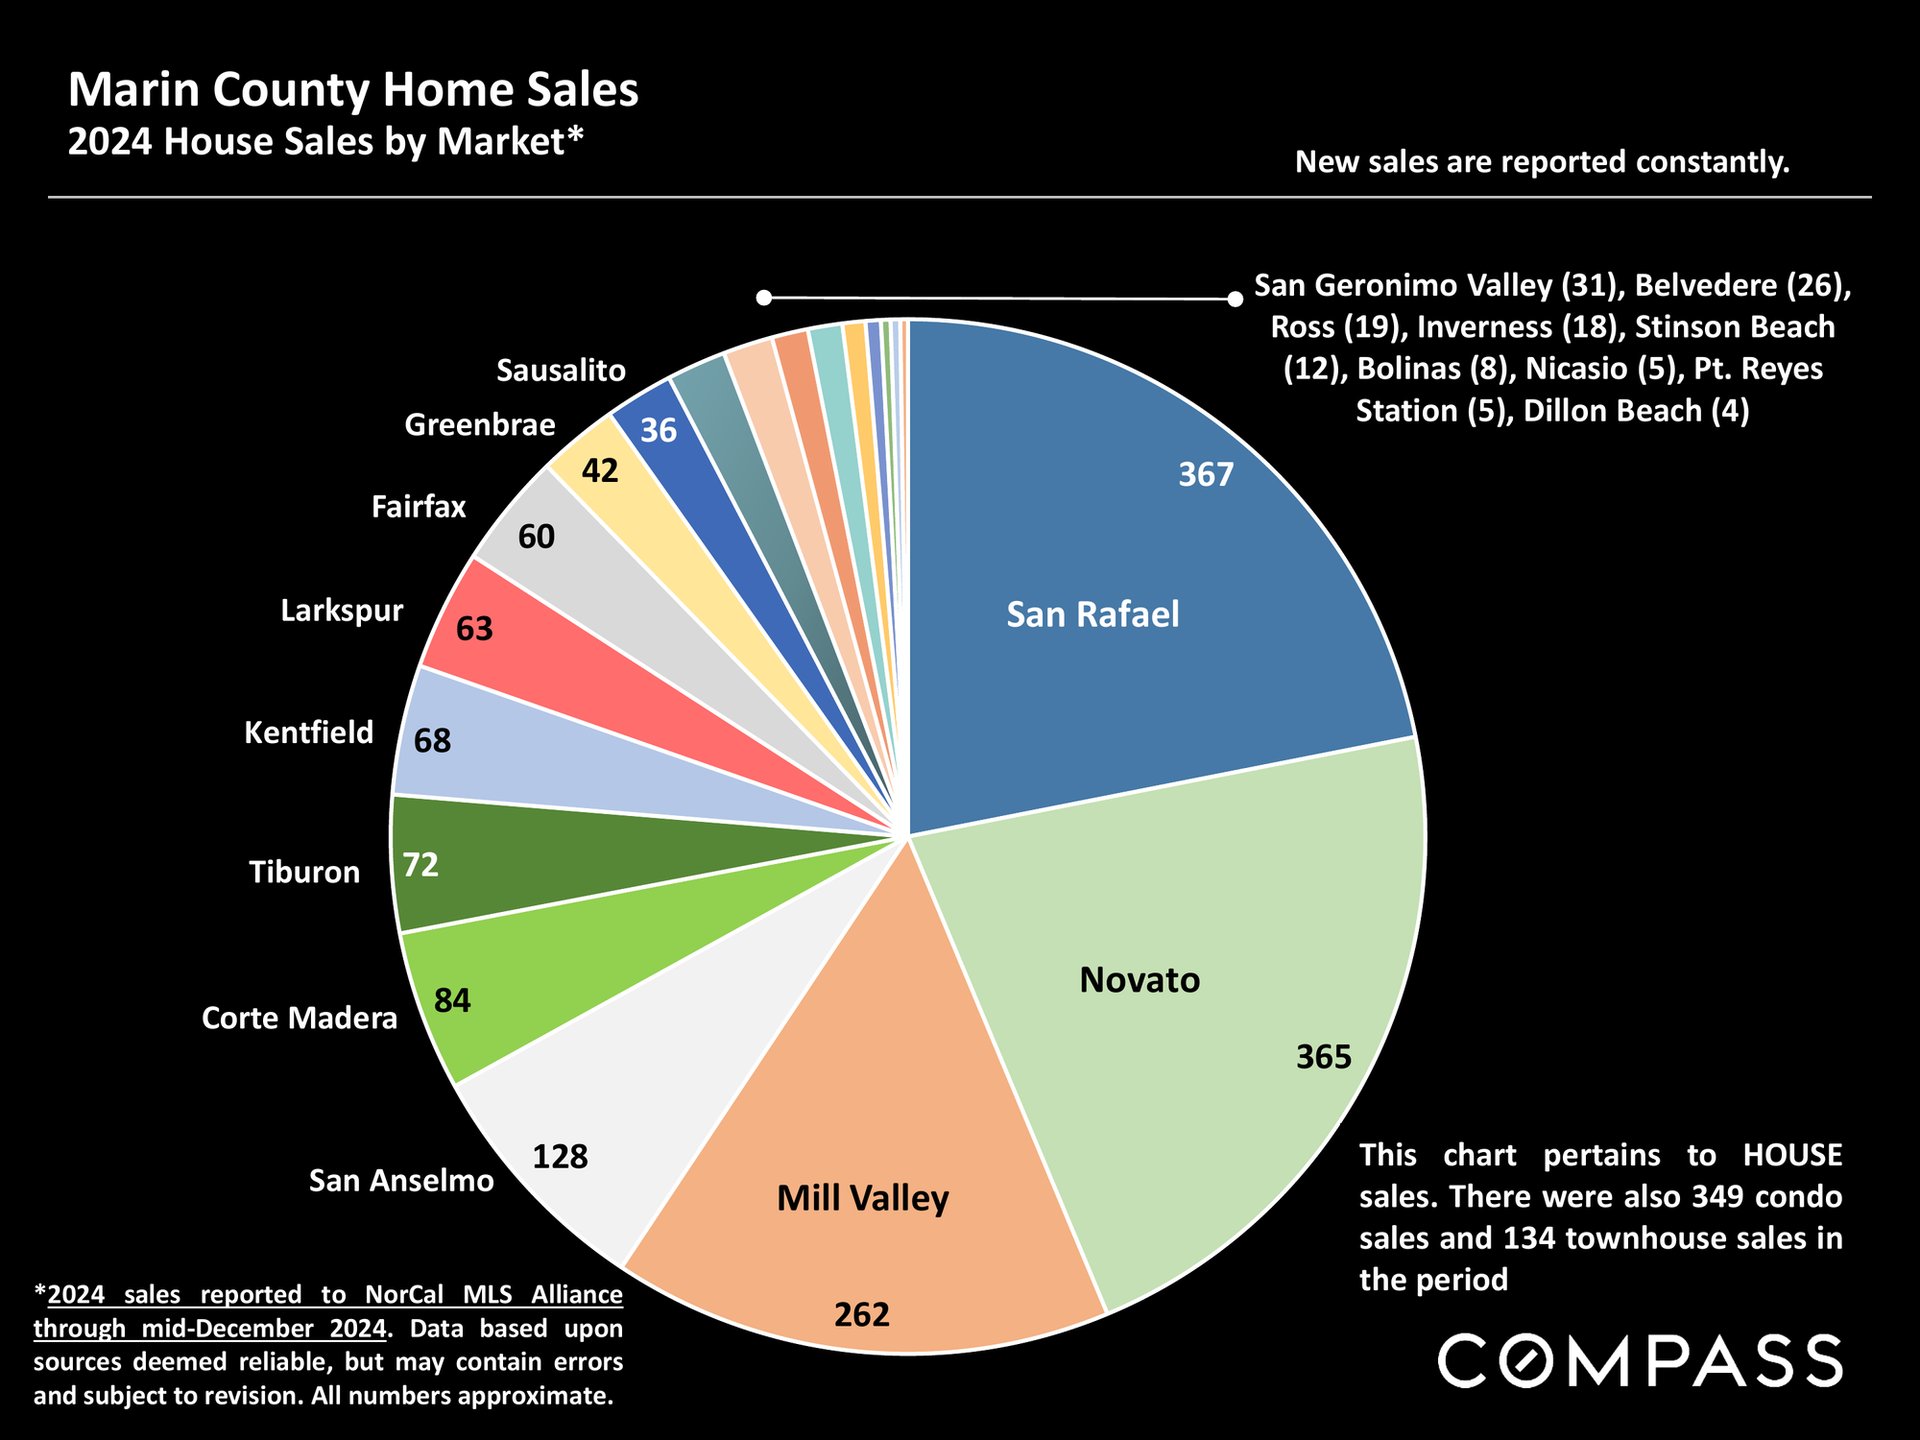
Pie chart of 2024 Marin County home sales by market, led by San Rafael, Novato, and Mill Valley.
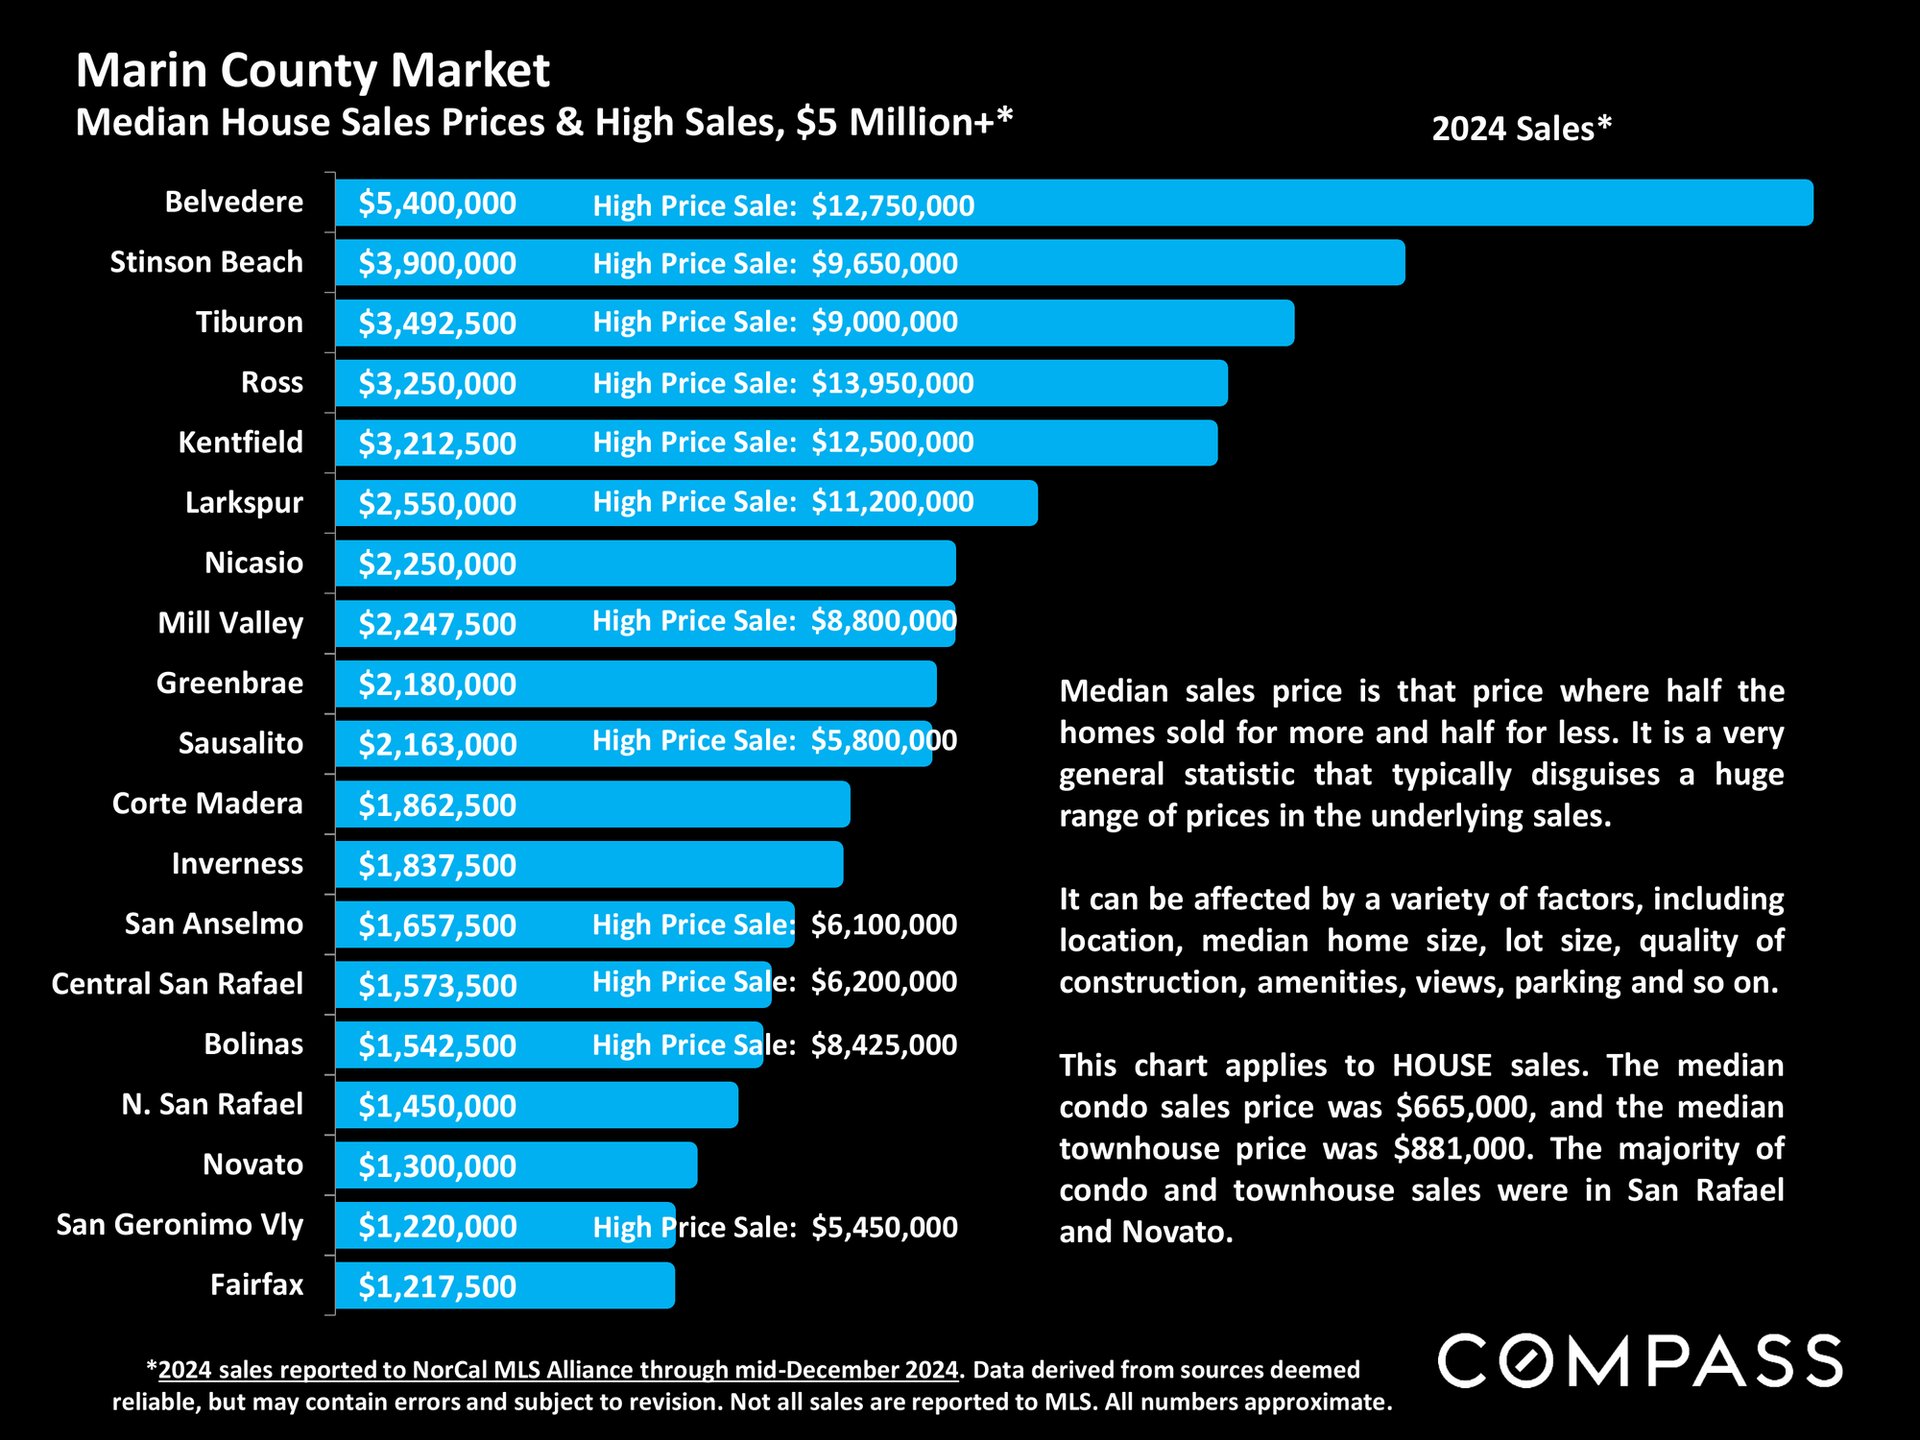
Marin County 2024 median house sale prices and high sales by community, shown in a blue horizontal bar chart.
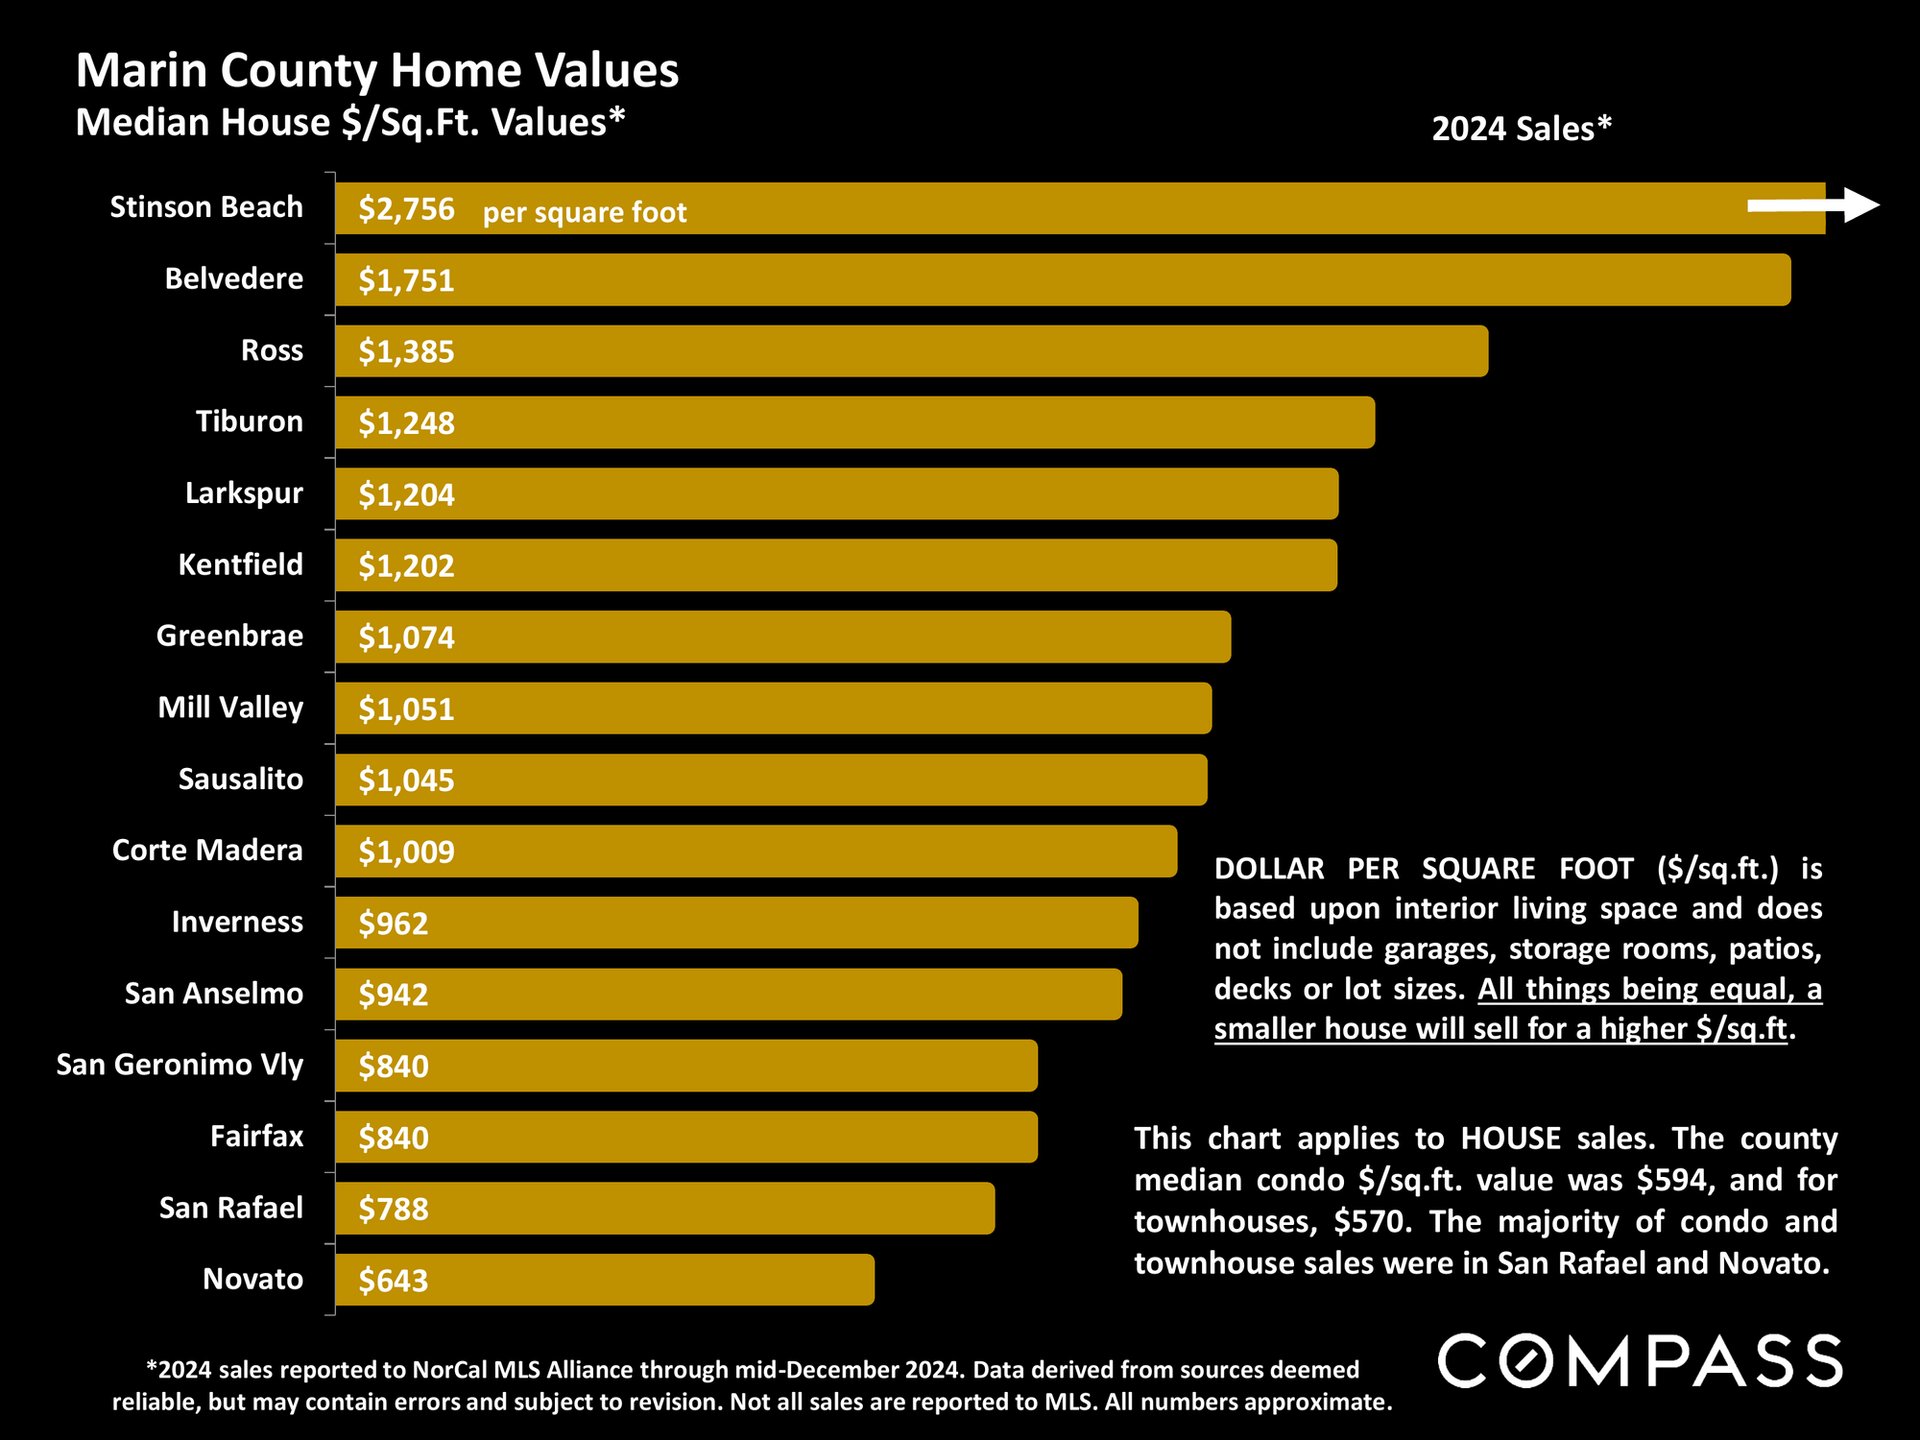
Chart compares 2024 median house prices per square foot across Marin County communities; Stinson Beach leads at $2,756.
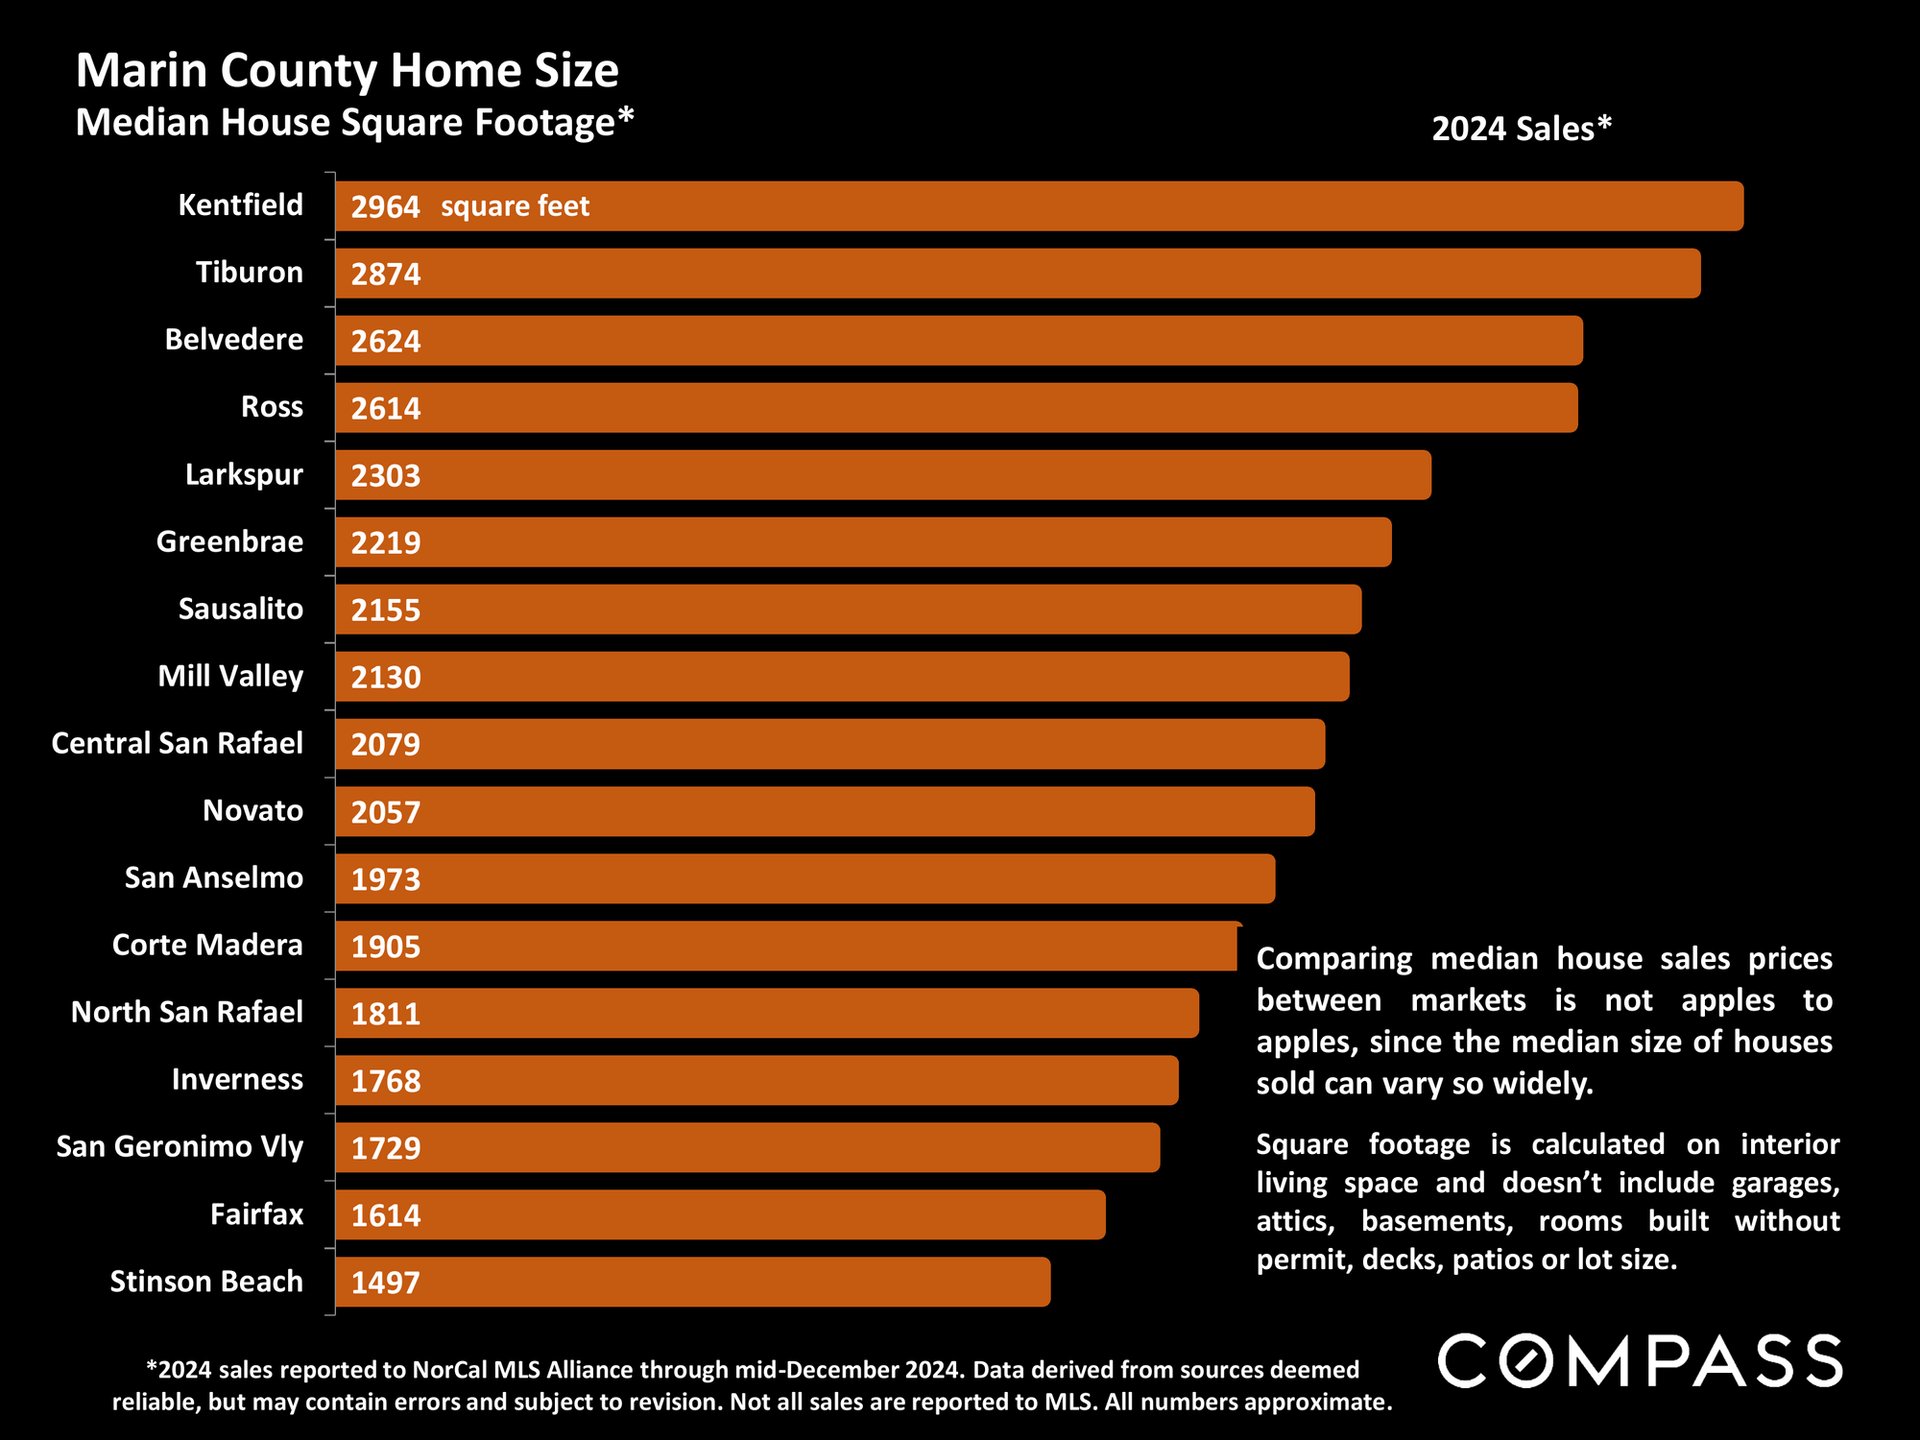
Chart of median house square footage by Marin County community, ranging from 1,497 square feet in Stinson Beach to 2,964 in Kentfield.
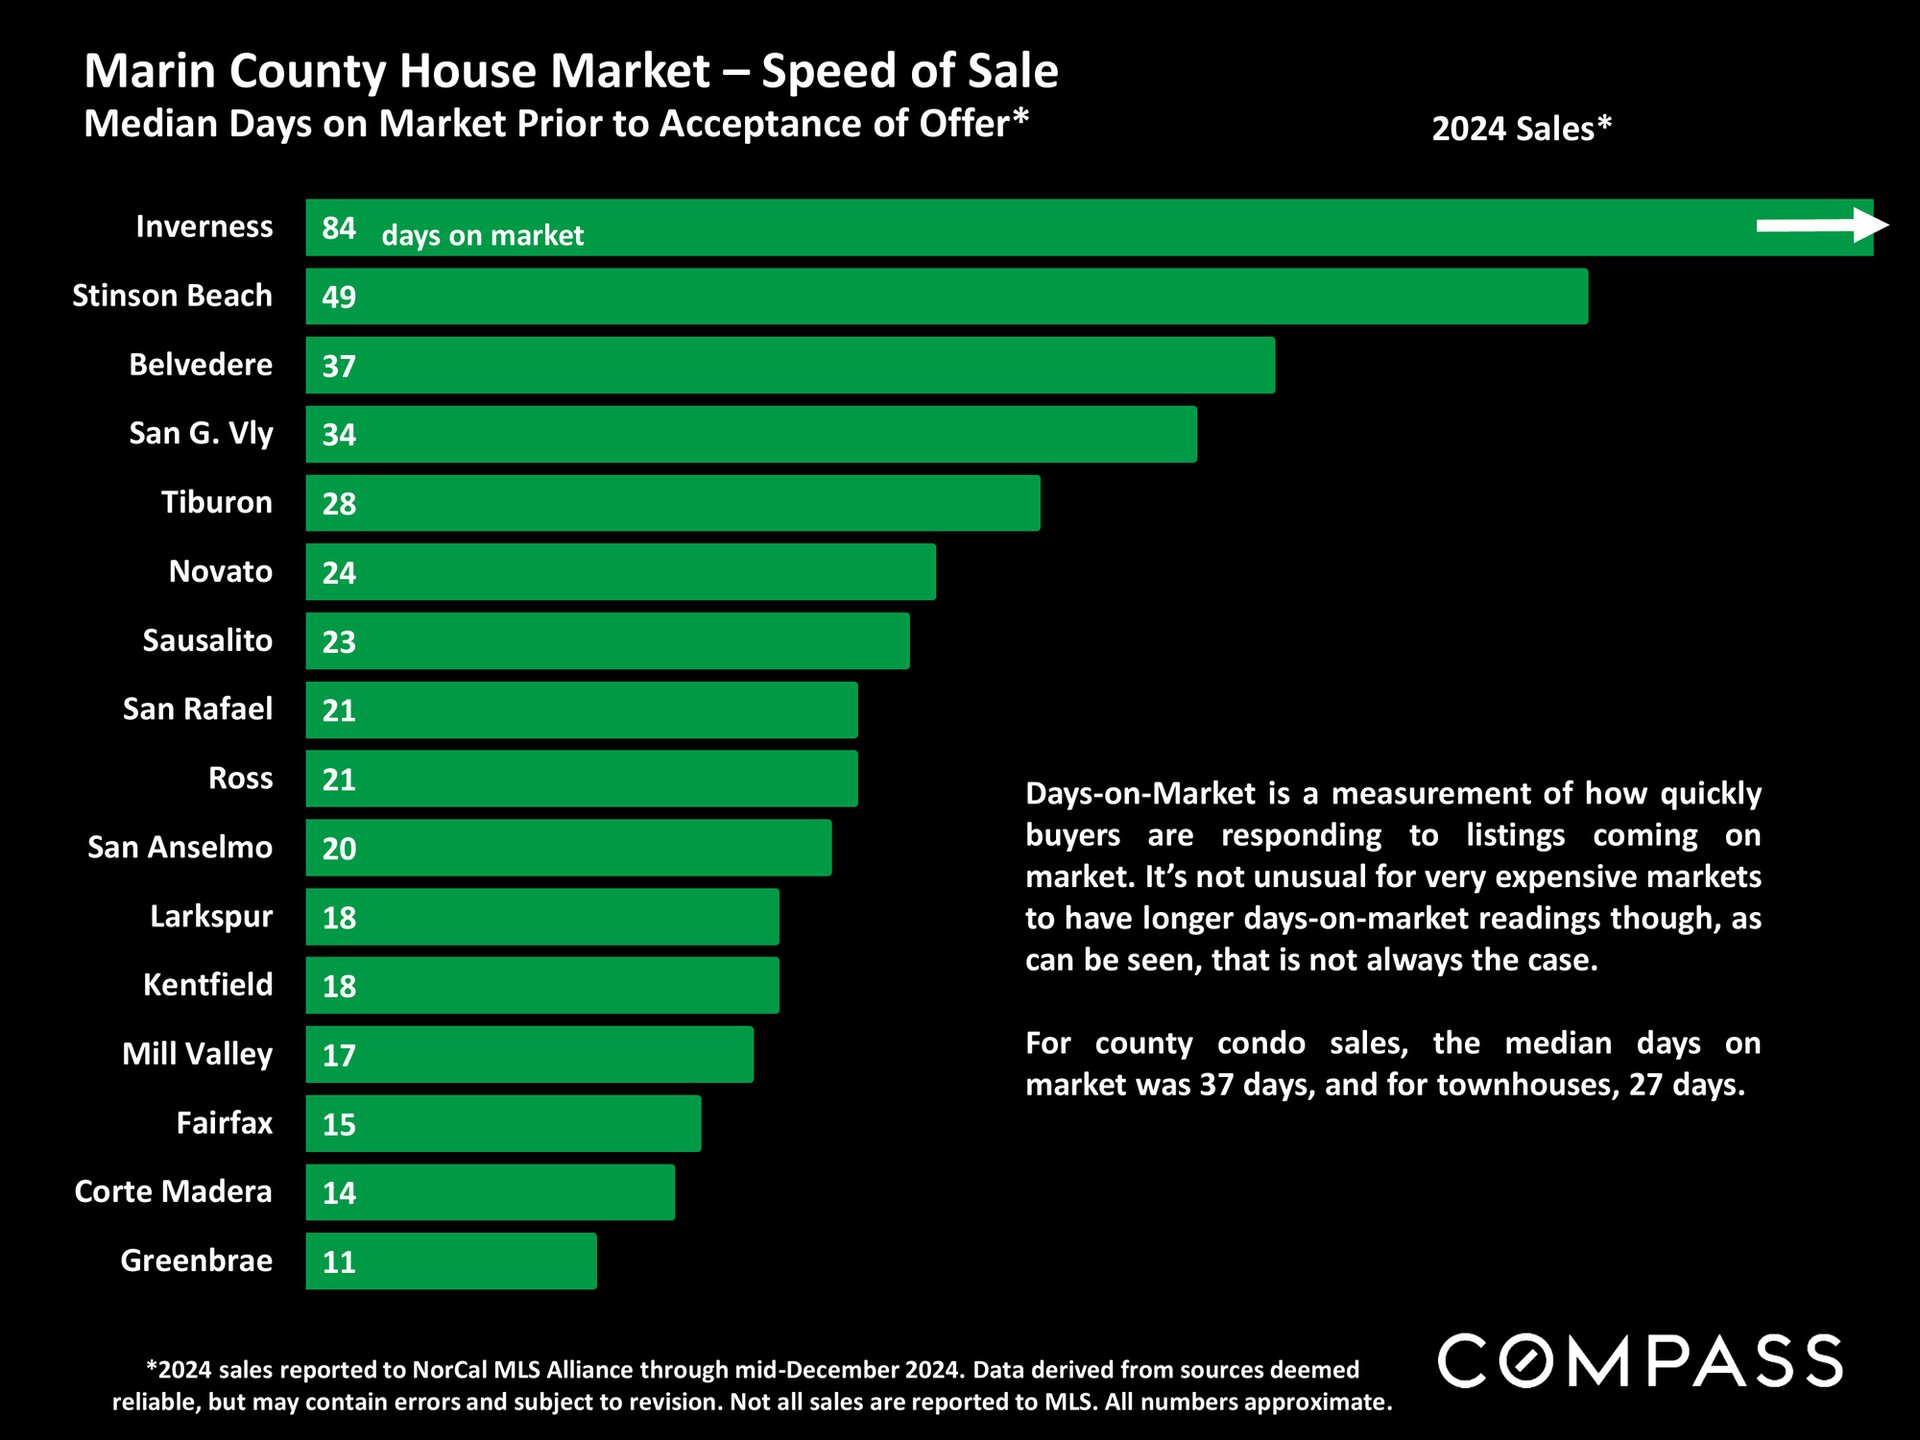
Chart of median days on market for homes in Marin County communities, led by Inverness at 84 days.
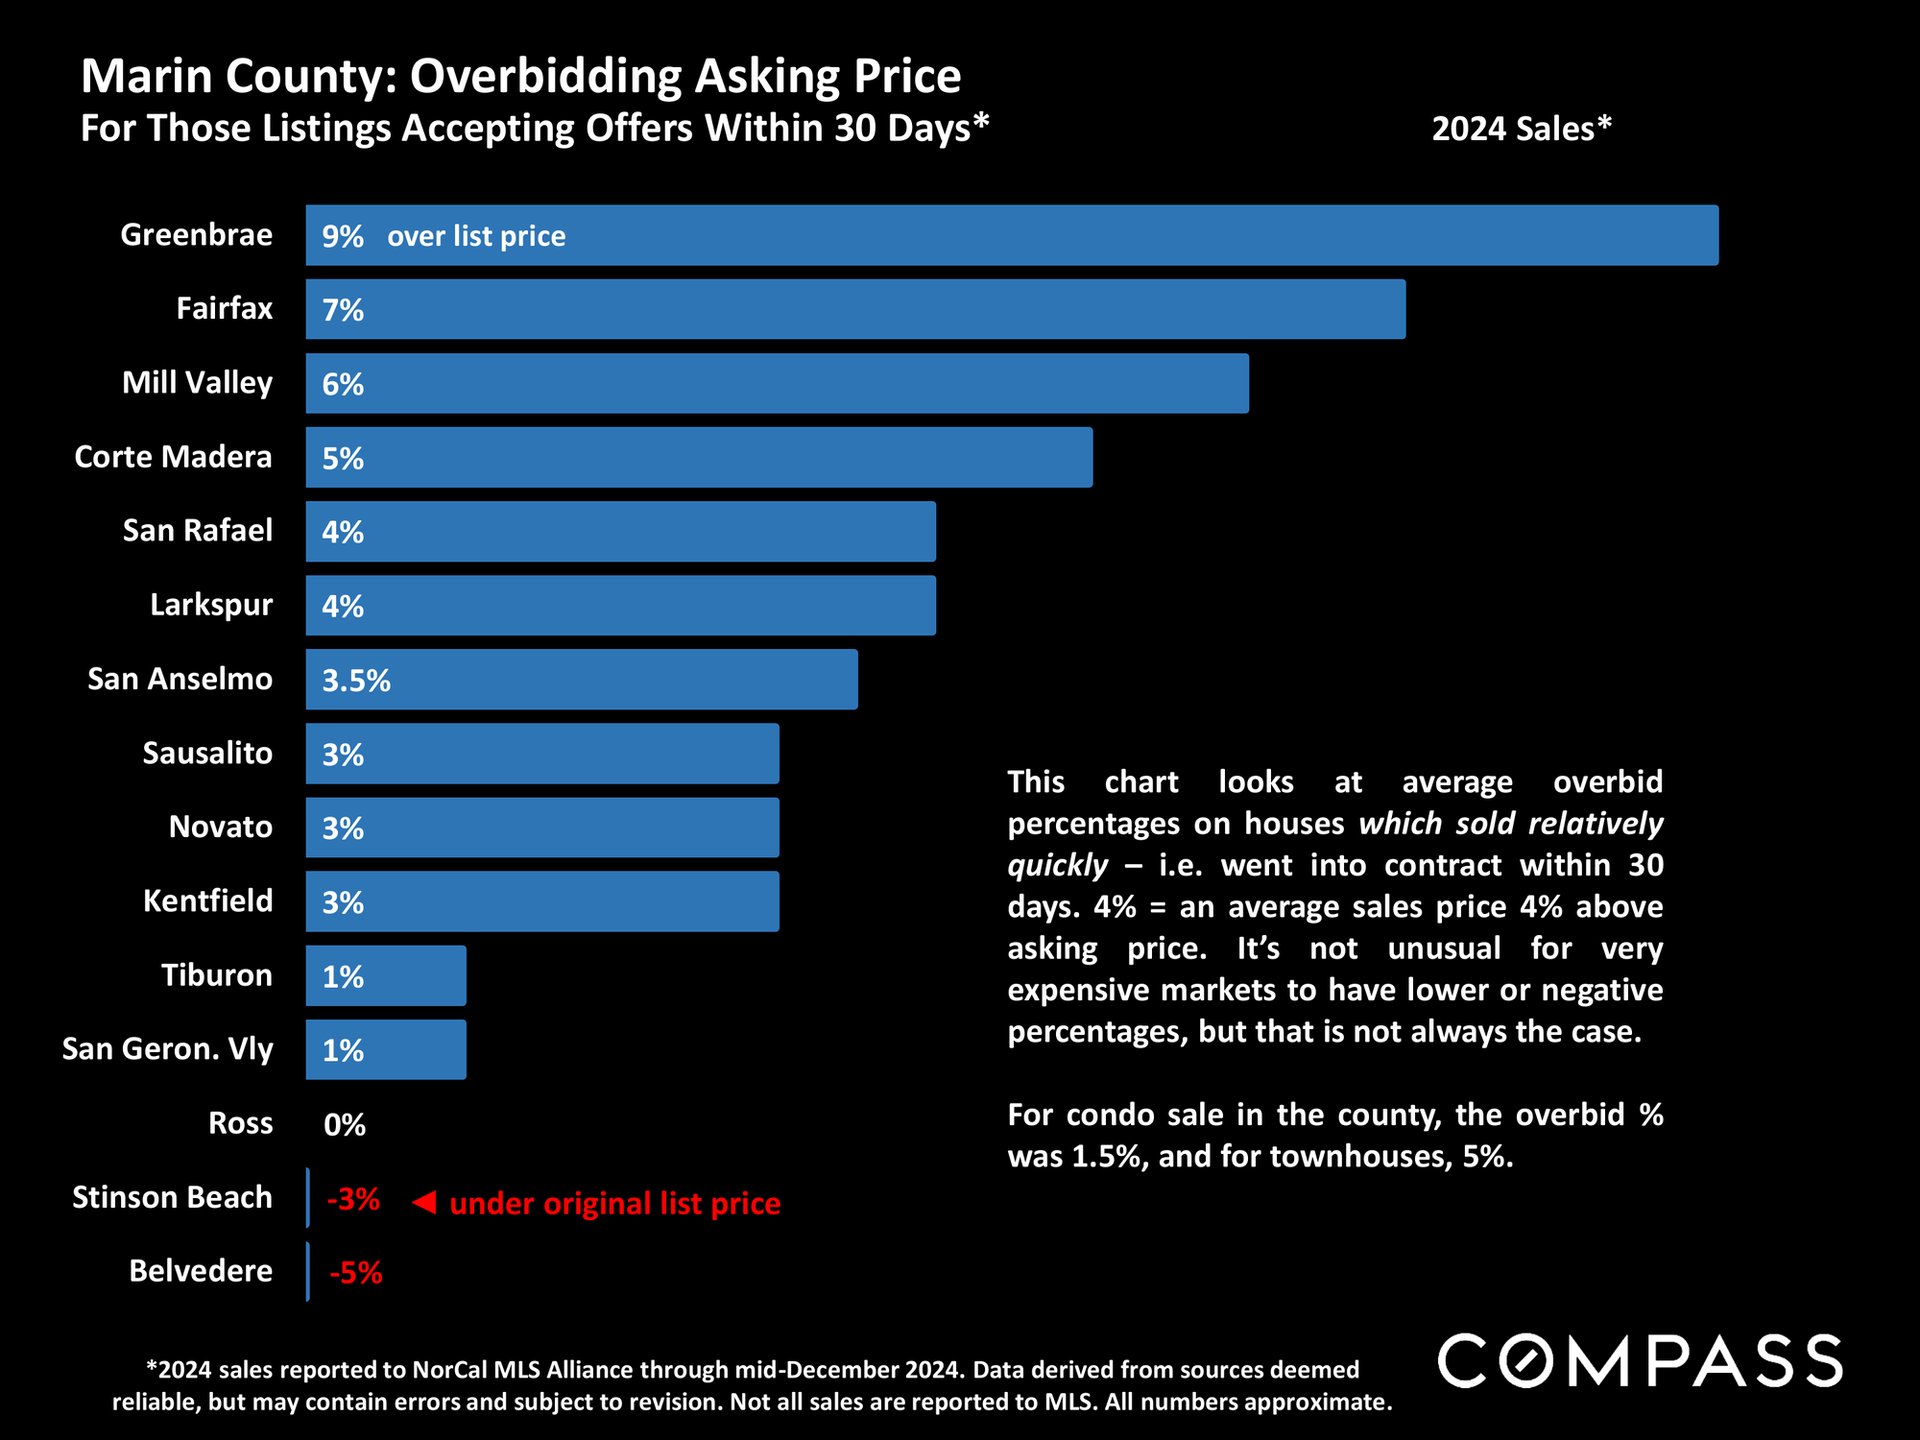
Marin County 2024 overbidding chart: Greenbrae averages 9% over asking; Belvedere averages 5% under.
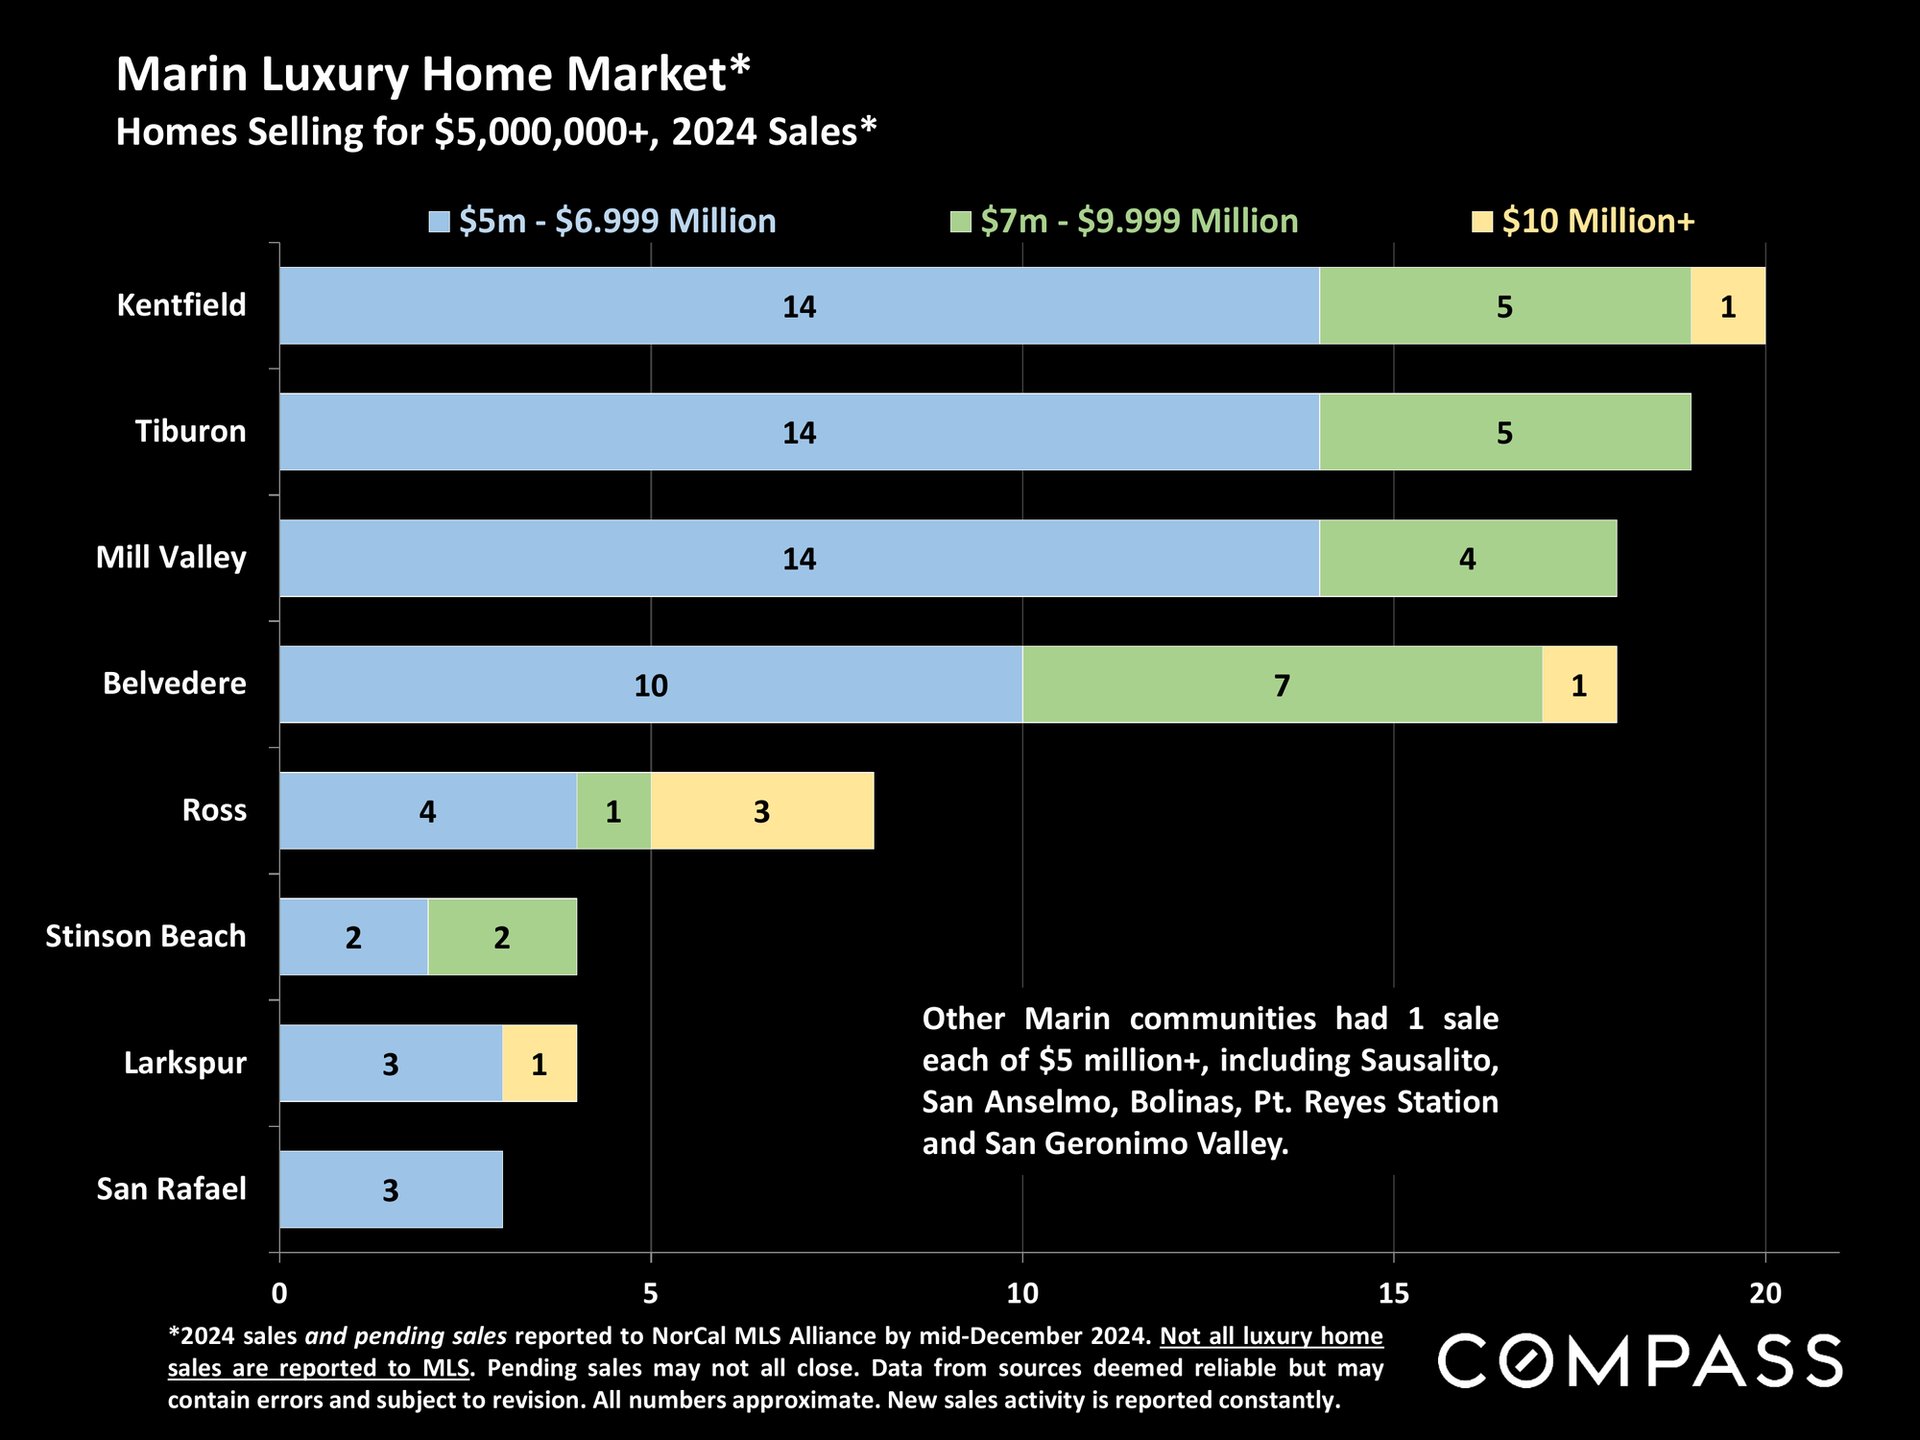
Chart of 2024 Marin County home sales over $5 million by community and price range.
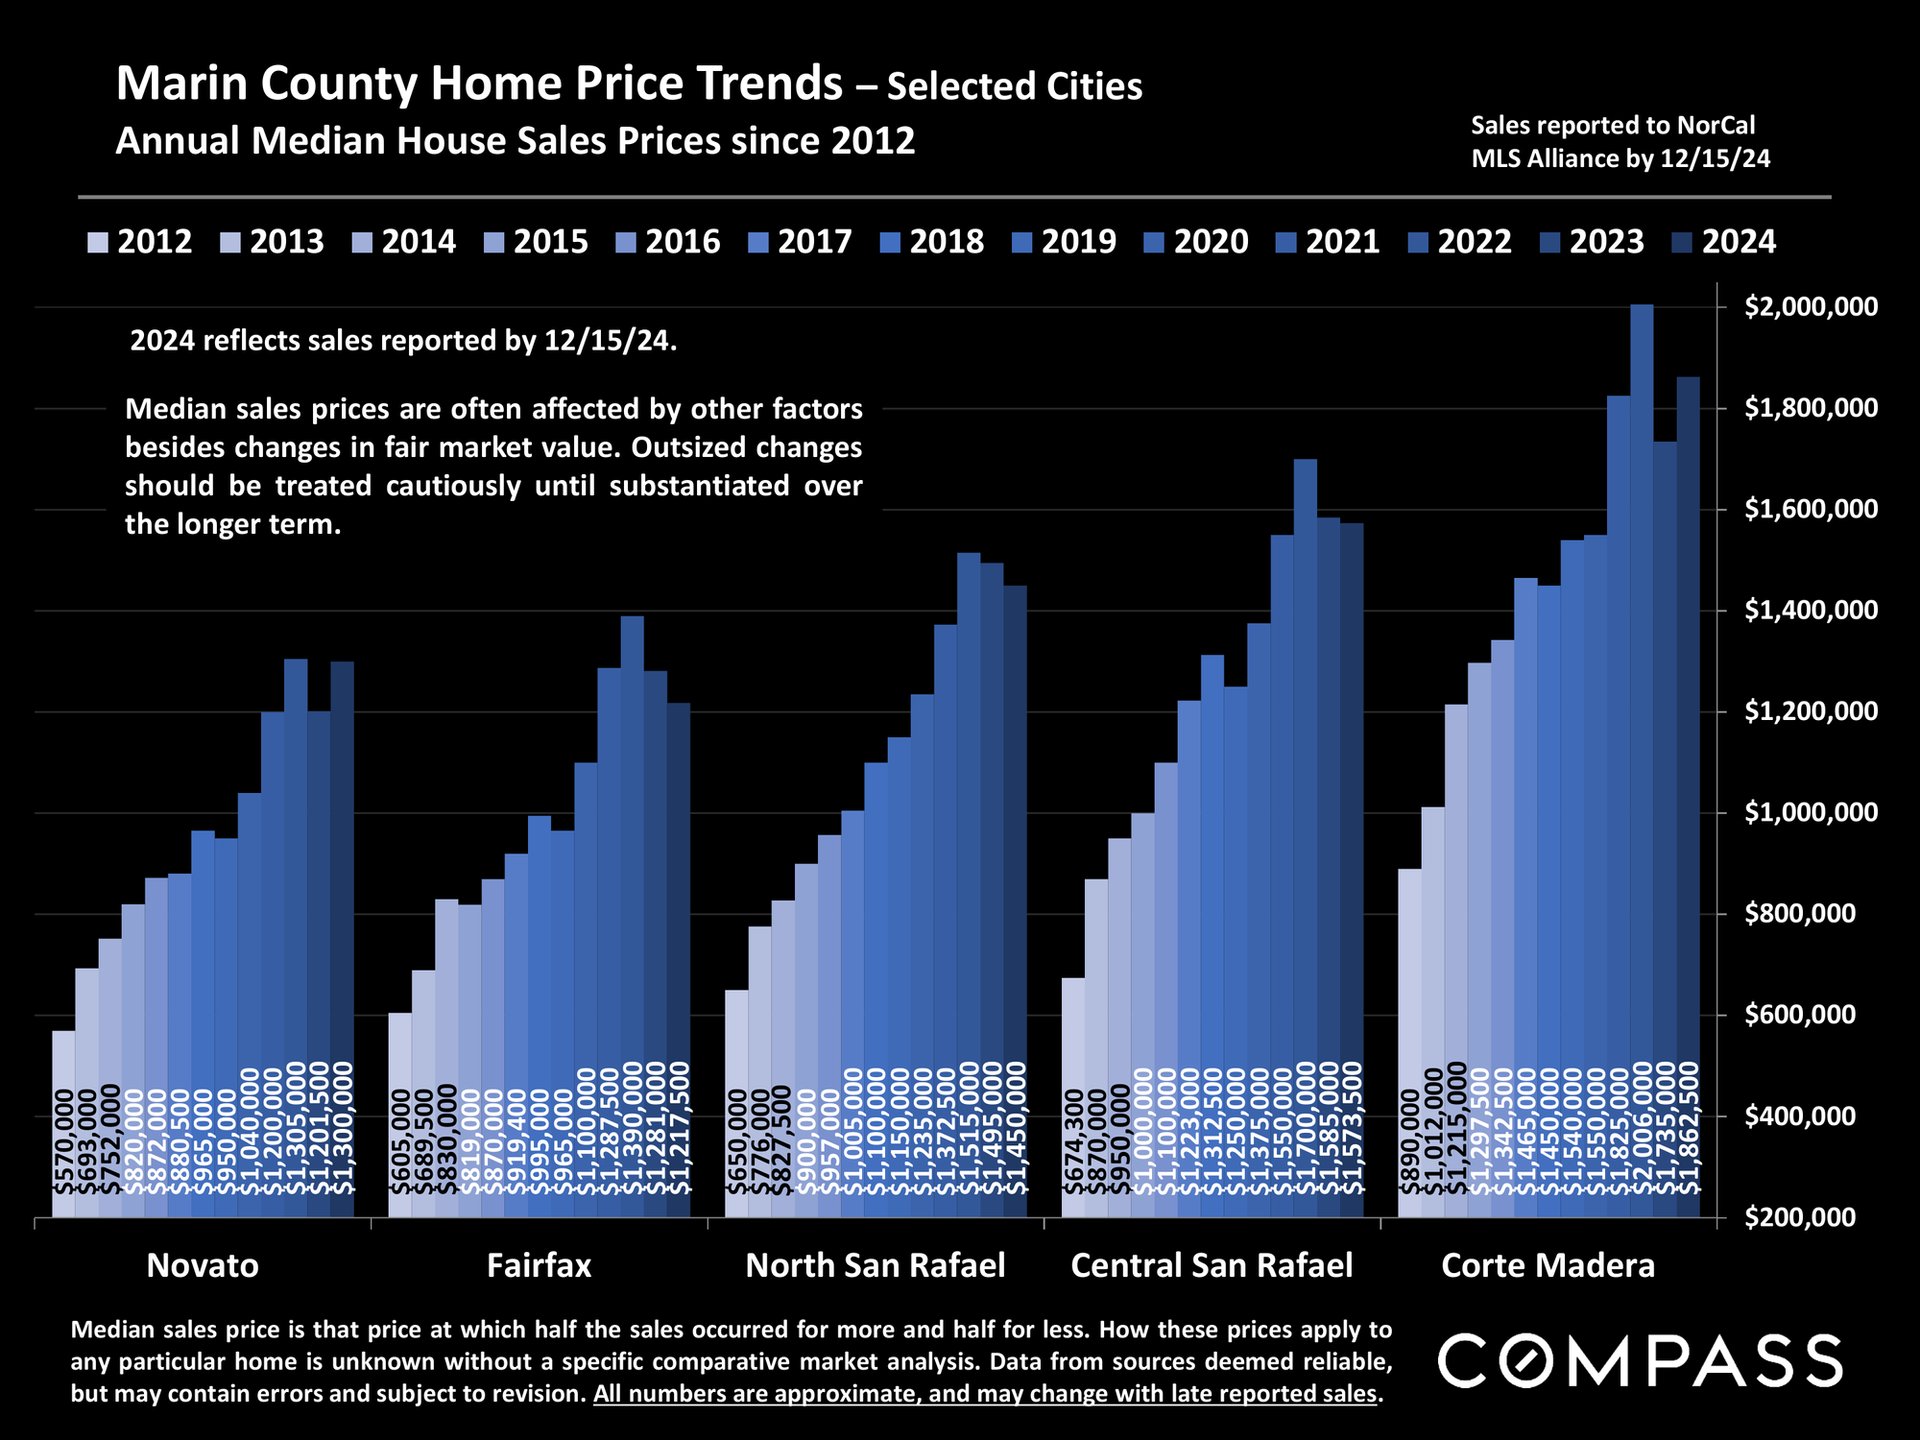
Bar chart compares annual median home prices from 2012 to 2024 across five Marin County cities.


WORK WITH US

We offer the highest level of service and expertise to our clients. Our team has built a reputation for consistently representing the finest real estate in San Francisco and Napa Valley. Results driven and dedicated to your success, whether buying, selling, renting or investing. Contact us today for a private consultation.

Contact Us