
Monterey County: September 2022

Monterey County Real Estate September 2022 report cover with a panoramic coastal landscape.
Bar chart of Monterey County median house prices, rising from 2017 to a spring 2022 peak.
Monterey County home price appreciation chart, with monthly year-over-year rates from 2020 to August 2022.
Carmel-Pebble Beach home values chart, with monthly median prices peaking above $2 million in early 2022.
Chart of Monterey County home sales over list price, peaking at 62% in April 2022 before falling to 33%.
Bar chart of Monterey County home sale prices relative to asking prices, peaking in 2021 before falling in 2022.
Monterey County average-days-on-market bar chart, January 2019–August 2022, with seasonal and pandemic-period annotations.
Monterey County active listings chart: 2022 rose to 466 in August, compared with 342 in 2021.
Bar chart of Monterey County active listings, January 2018–August 2022, showing inventory rising after a January 2022 low.
Monterey County chart comparing monthly active-listing price reductions in 2021 and 2022; 2022 rises sharply through August.
Chart of Monterey County active-listing price reductions, with monthly counts from 2018 to 2022 and a rise in 2022.
Chart comparing Monterey County pending-sale listings in 2021 and 2022, showing a 23% year-over-year decline.
Chart comparing monthly Monterey County listings going into contract in 2021 and 2022, with 2022 dropping to 26% in July.
Chart compares Monterey County monthly home sales in 2021 and 2022; August sales fell from 320 to 209.
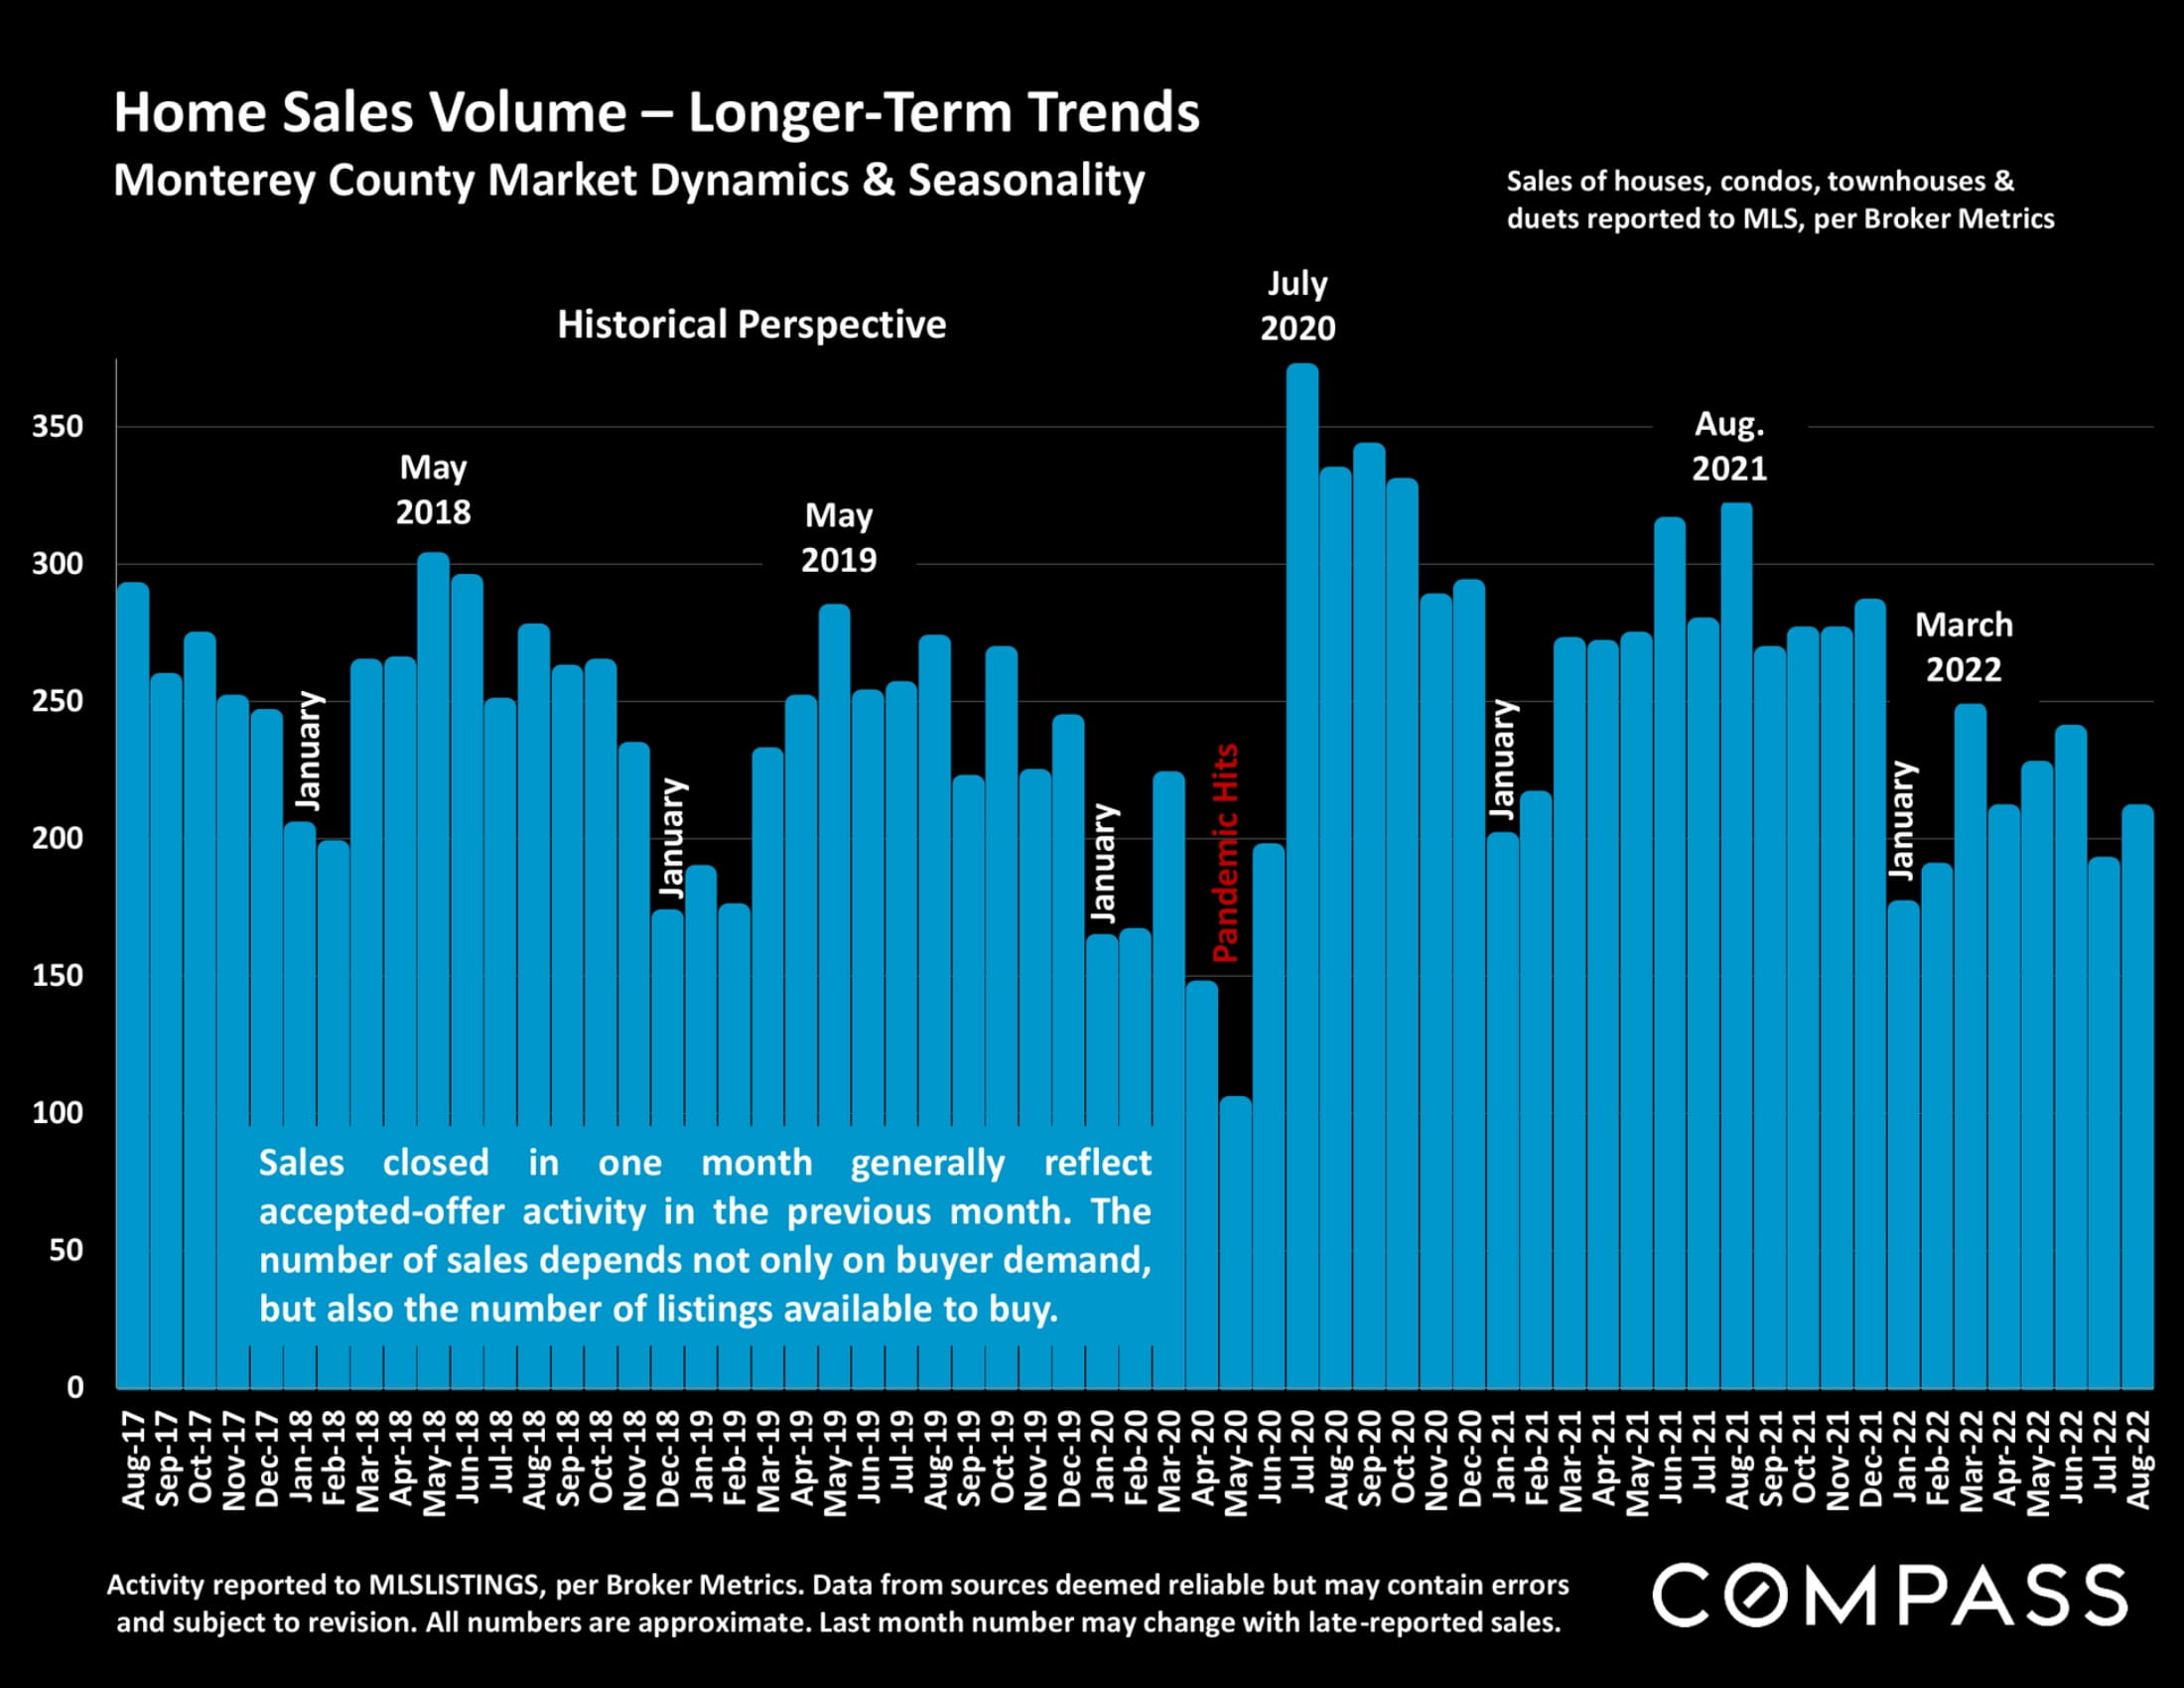
Chart of Monterey County monthly home sales, August 2017–August 2022, with a sharp 2020 drop and later peaks.
Chart comparing Monterey County home sales over $2 million in 2021 and 2022; August 2022 sales were down 39%.
Bar chart of monthly Monterey County home sales over $2 million, June 2018 to August 2022.
San Francisco Bay Area Luxury Home Market report graphic with an ornate garden gate and a prompt to access the report.
Infographic reviewing mortgage rates, consumer confidence, financial markets, inflation, and Bay Area real estate factors.
San Francisco Bay Area real estate survey graphic with the Golden Gate Bridge and a link to the full report.
Text page explaining real estate market statistics, their limitations, and Compass’s report disclaimer.


WORK WITH US

We offer the highest level of service and expertise to our clients. Our team has built a reputation for consistently representing the finest real estate in San Francisco and Napa Valley. Results driven and dedicated to your success, whether buying, selling, renting or investing. Contact us today for a private consultation.

Contact Us