
Napa County Real Estate February 2025 Report

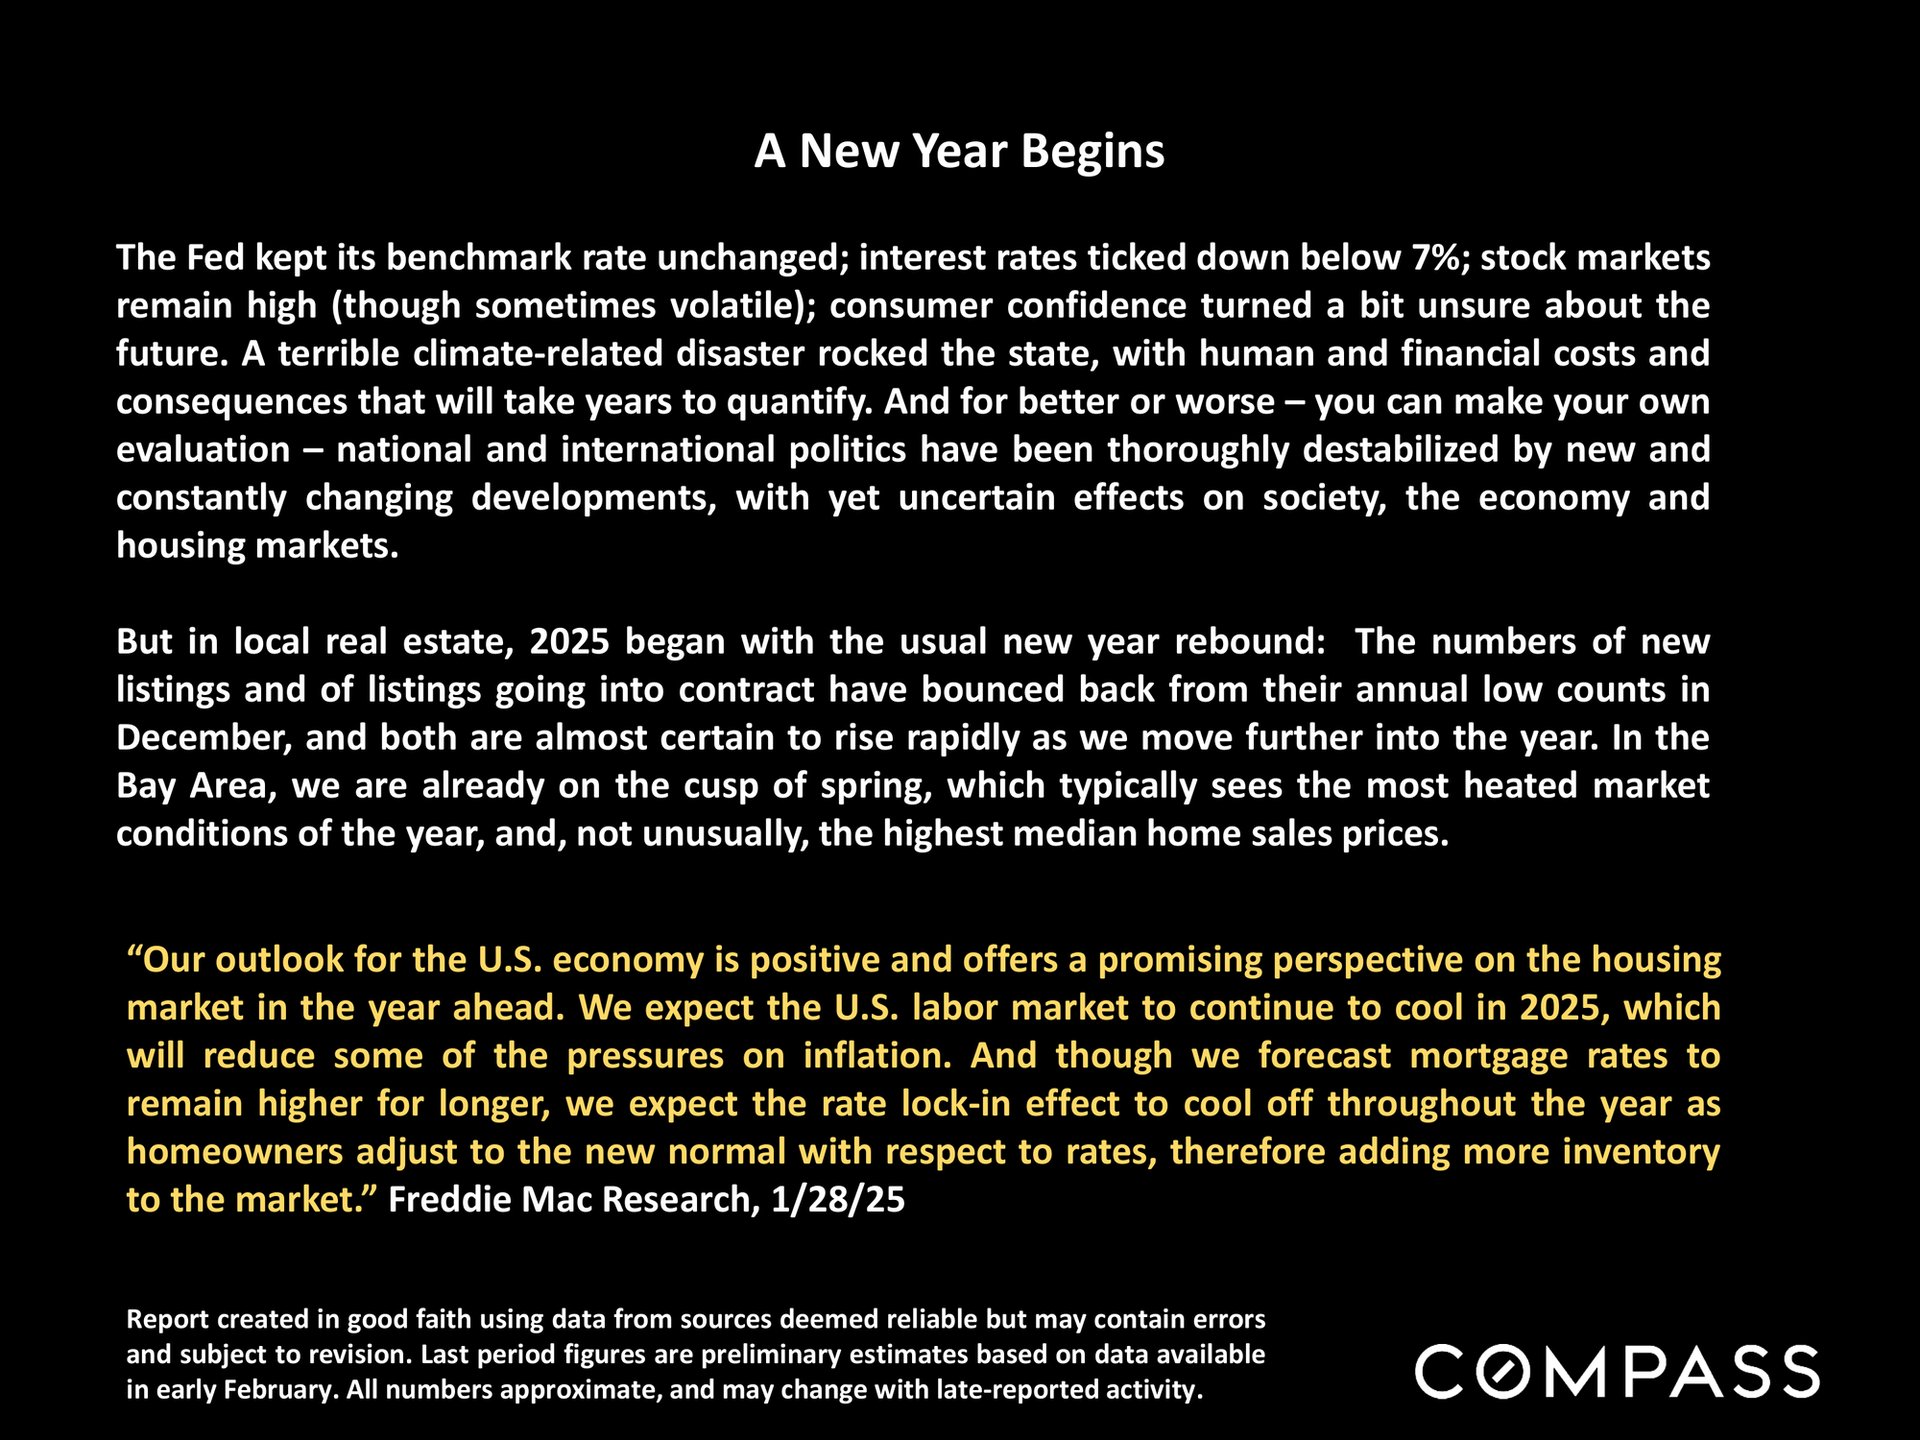
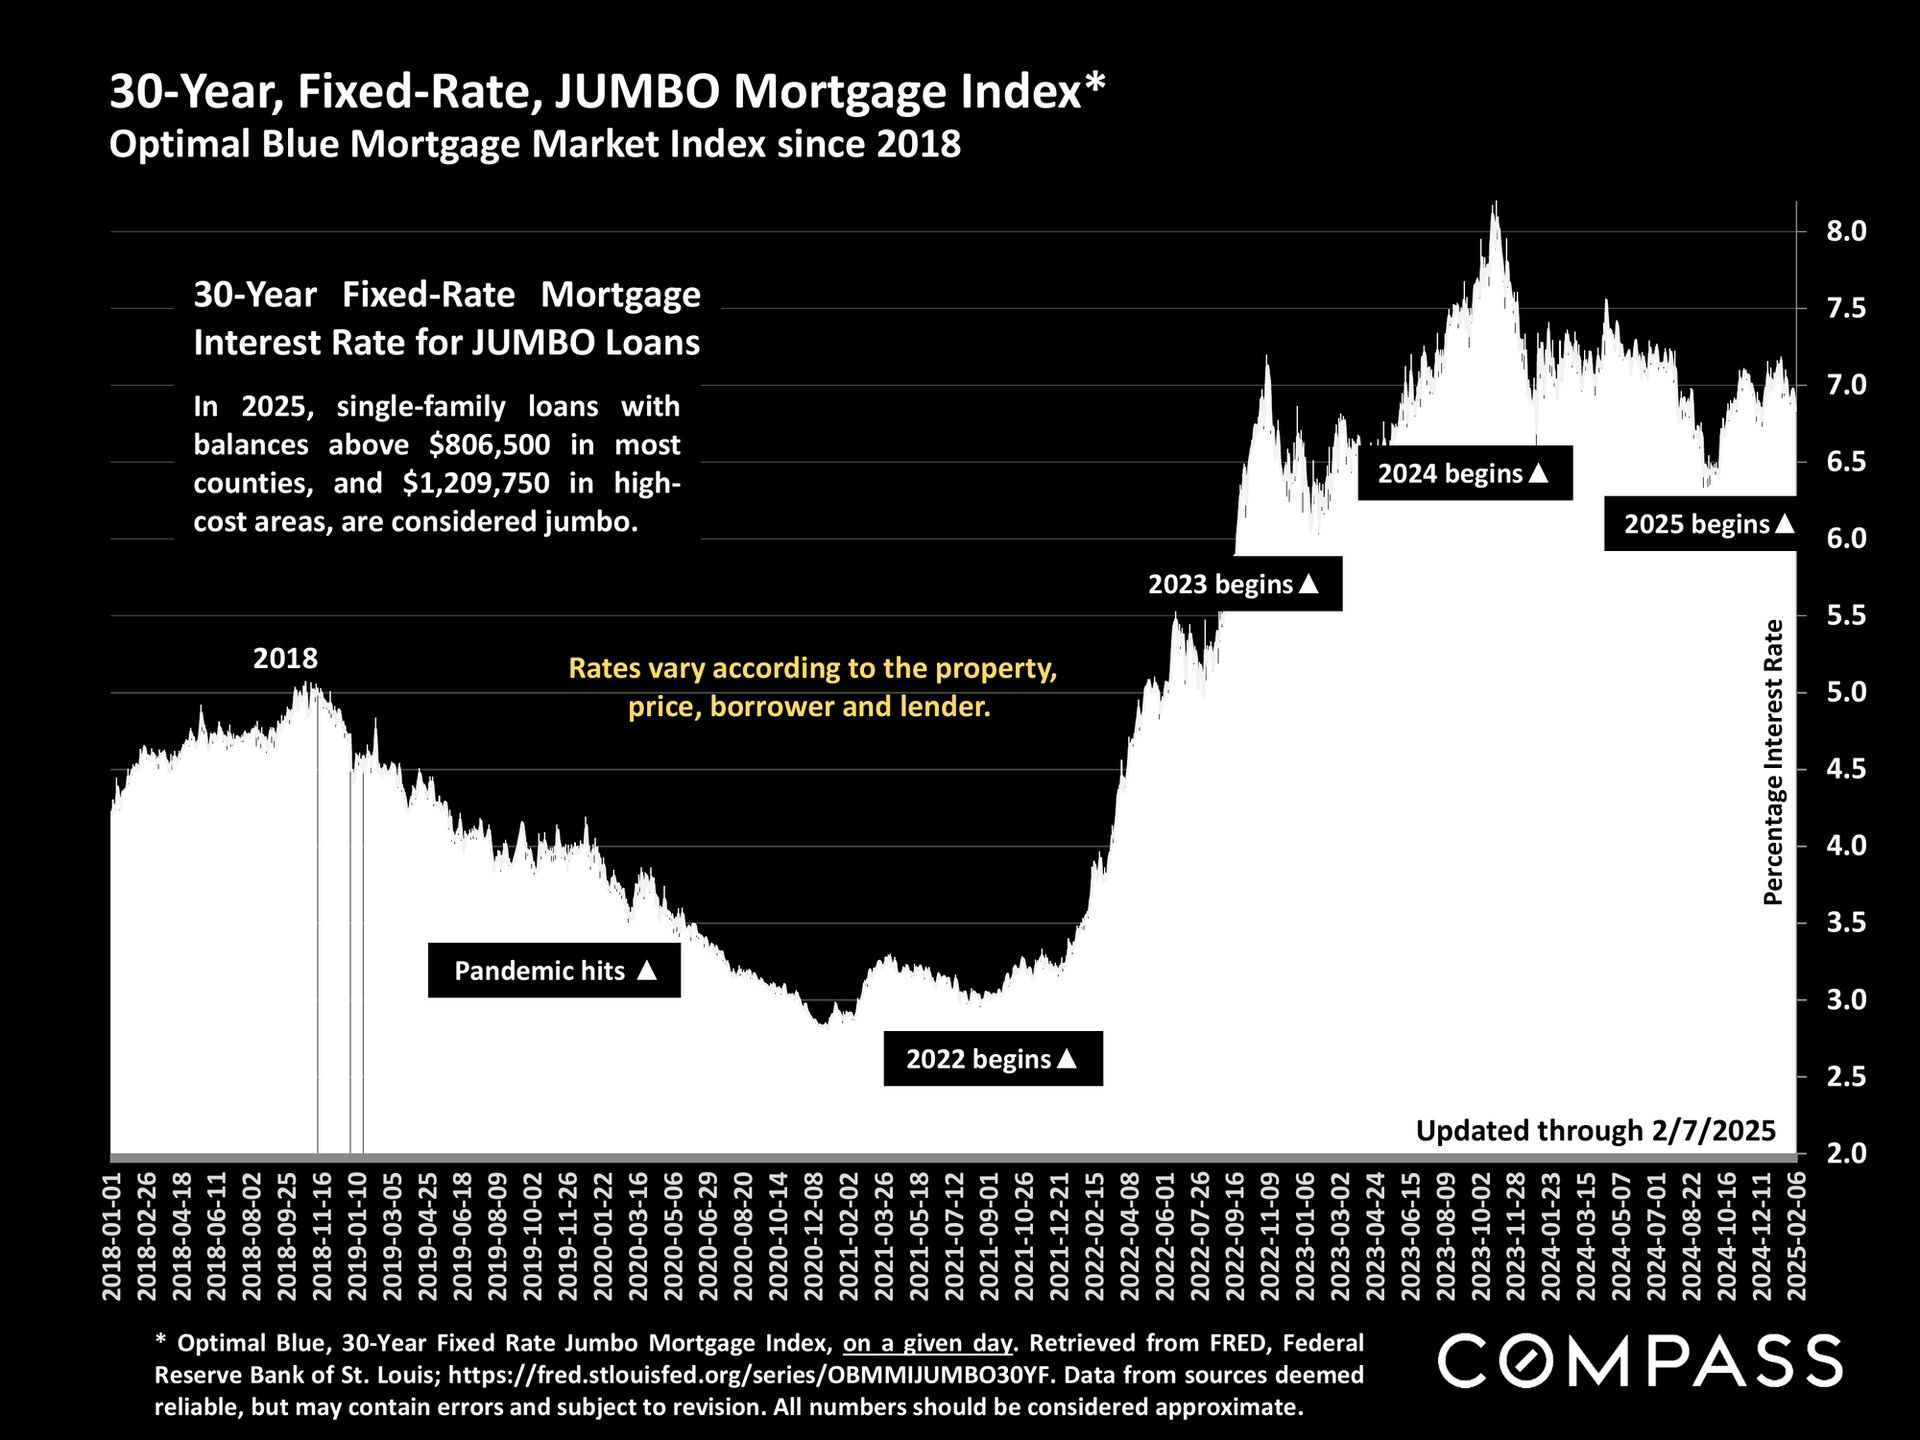
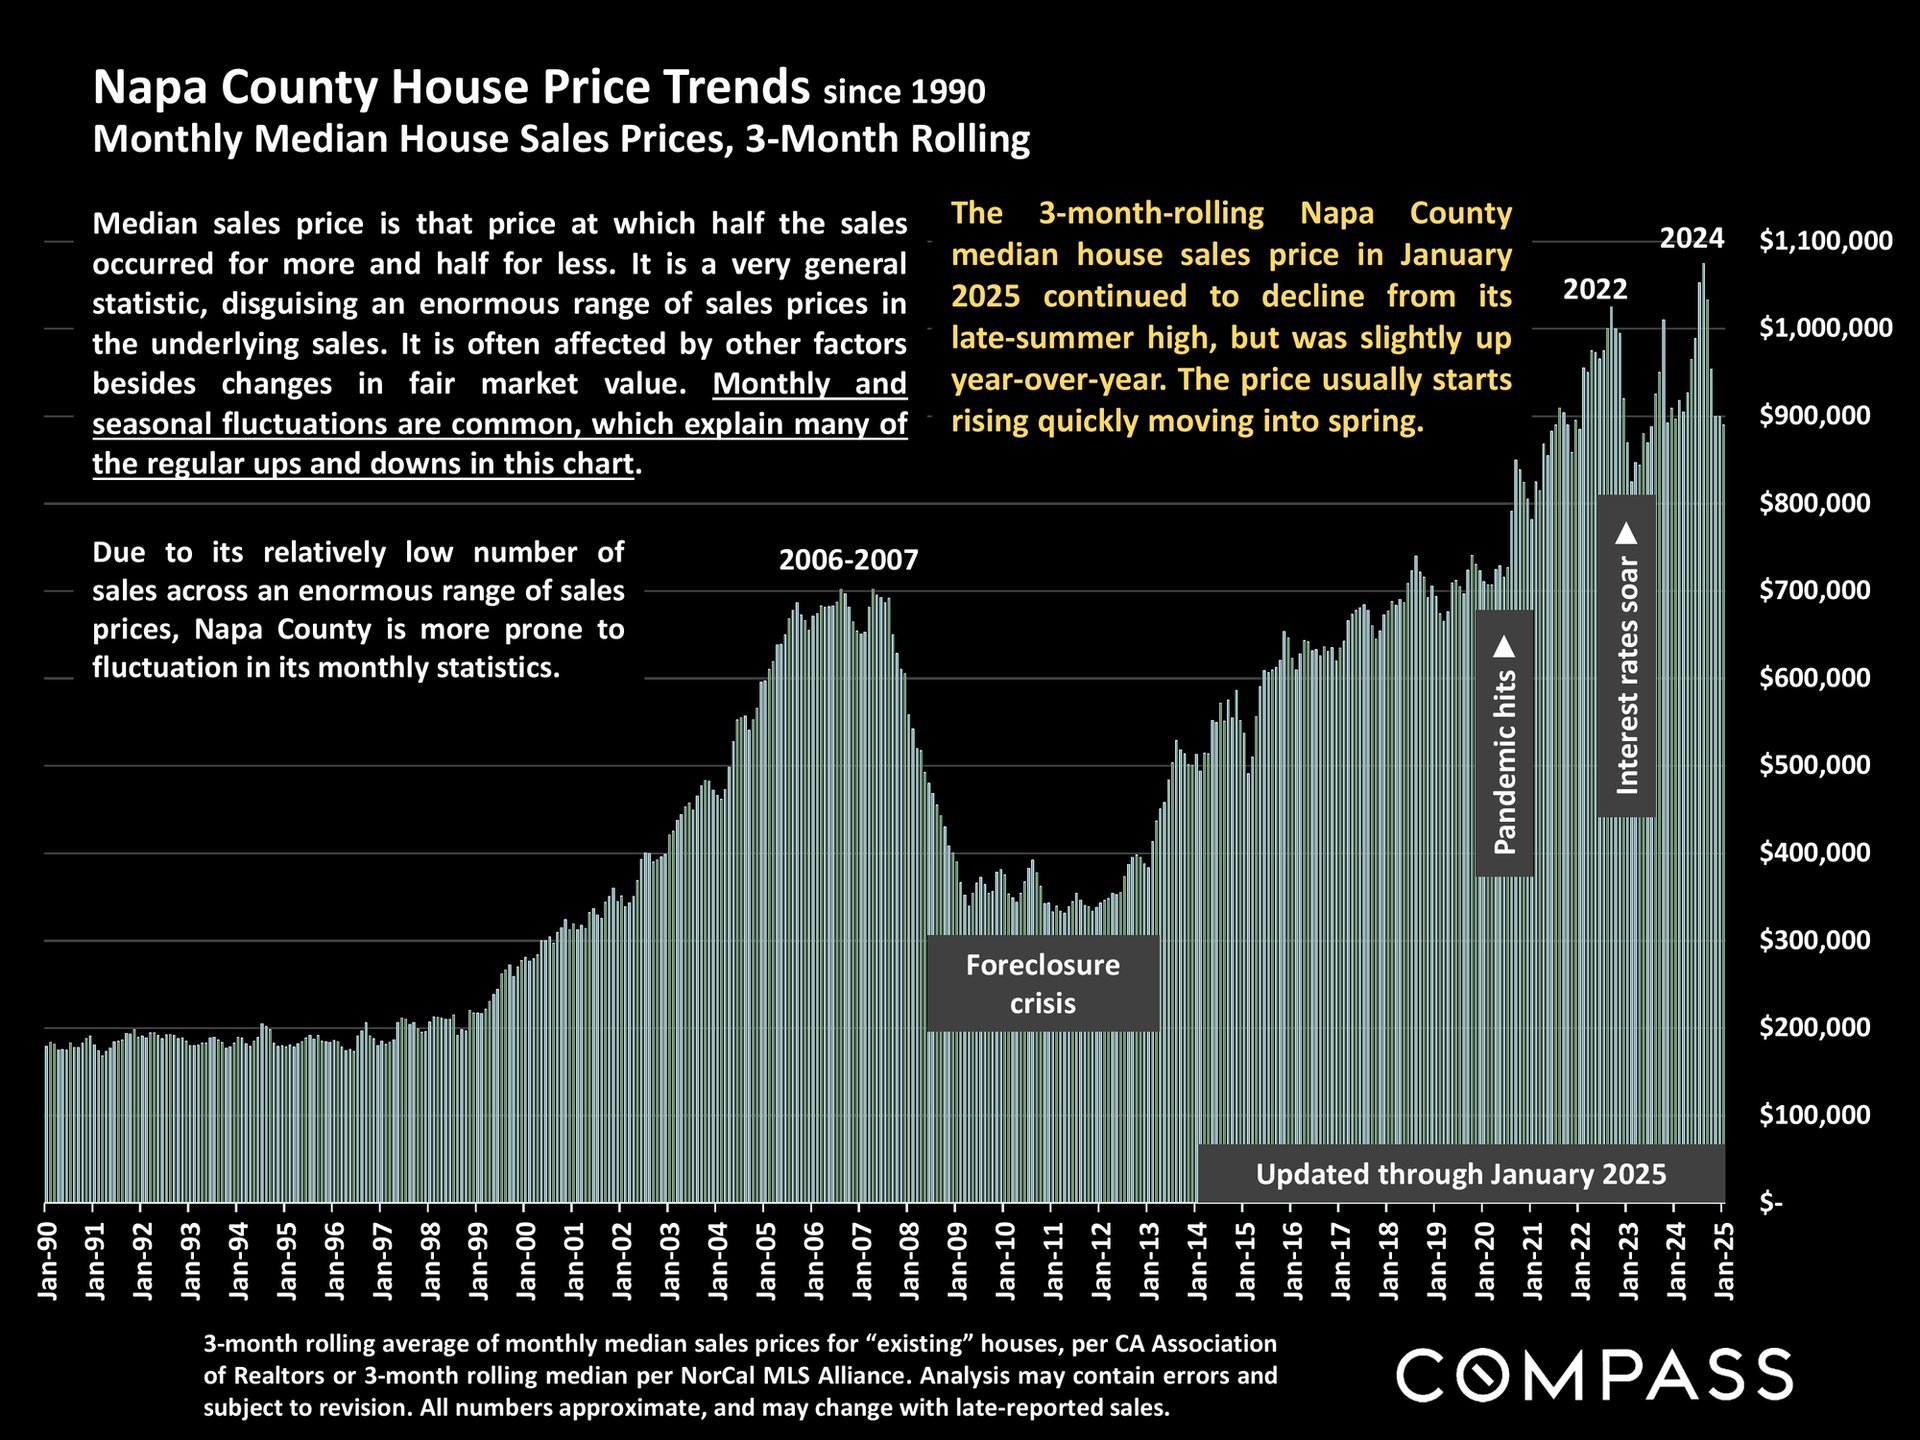
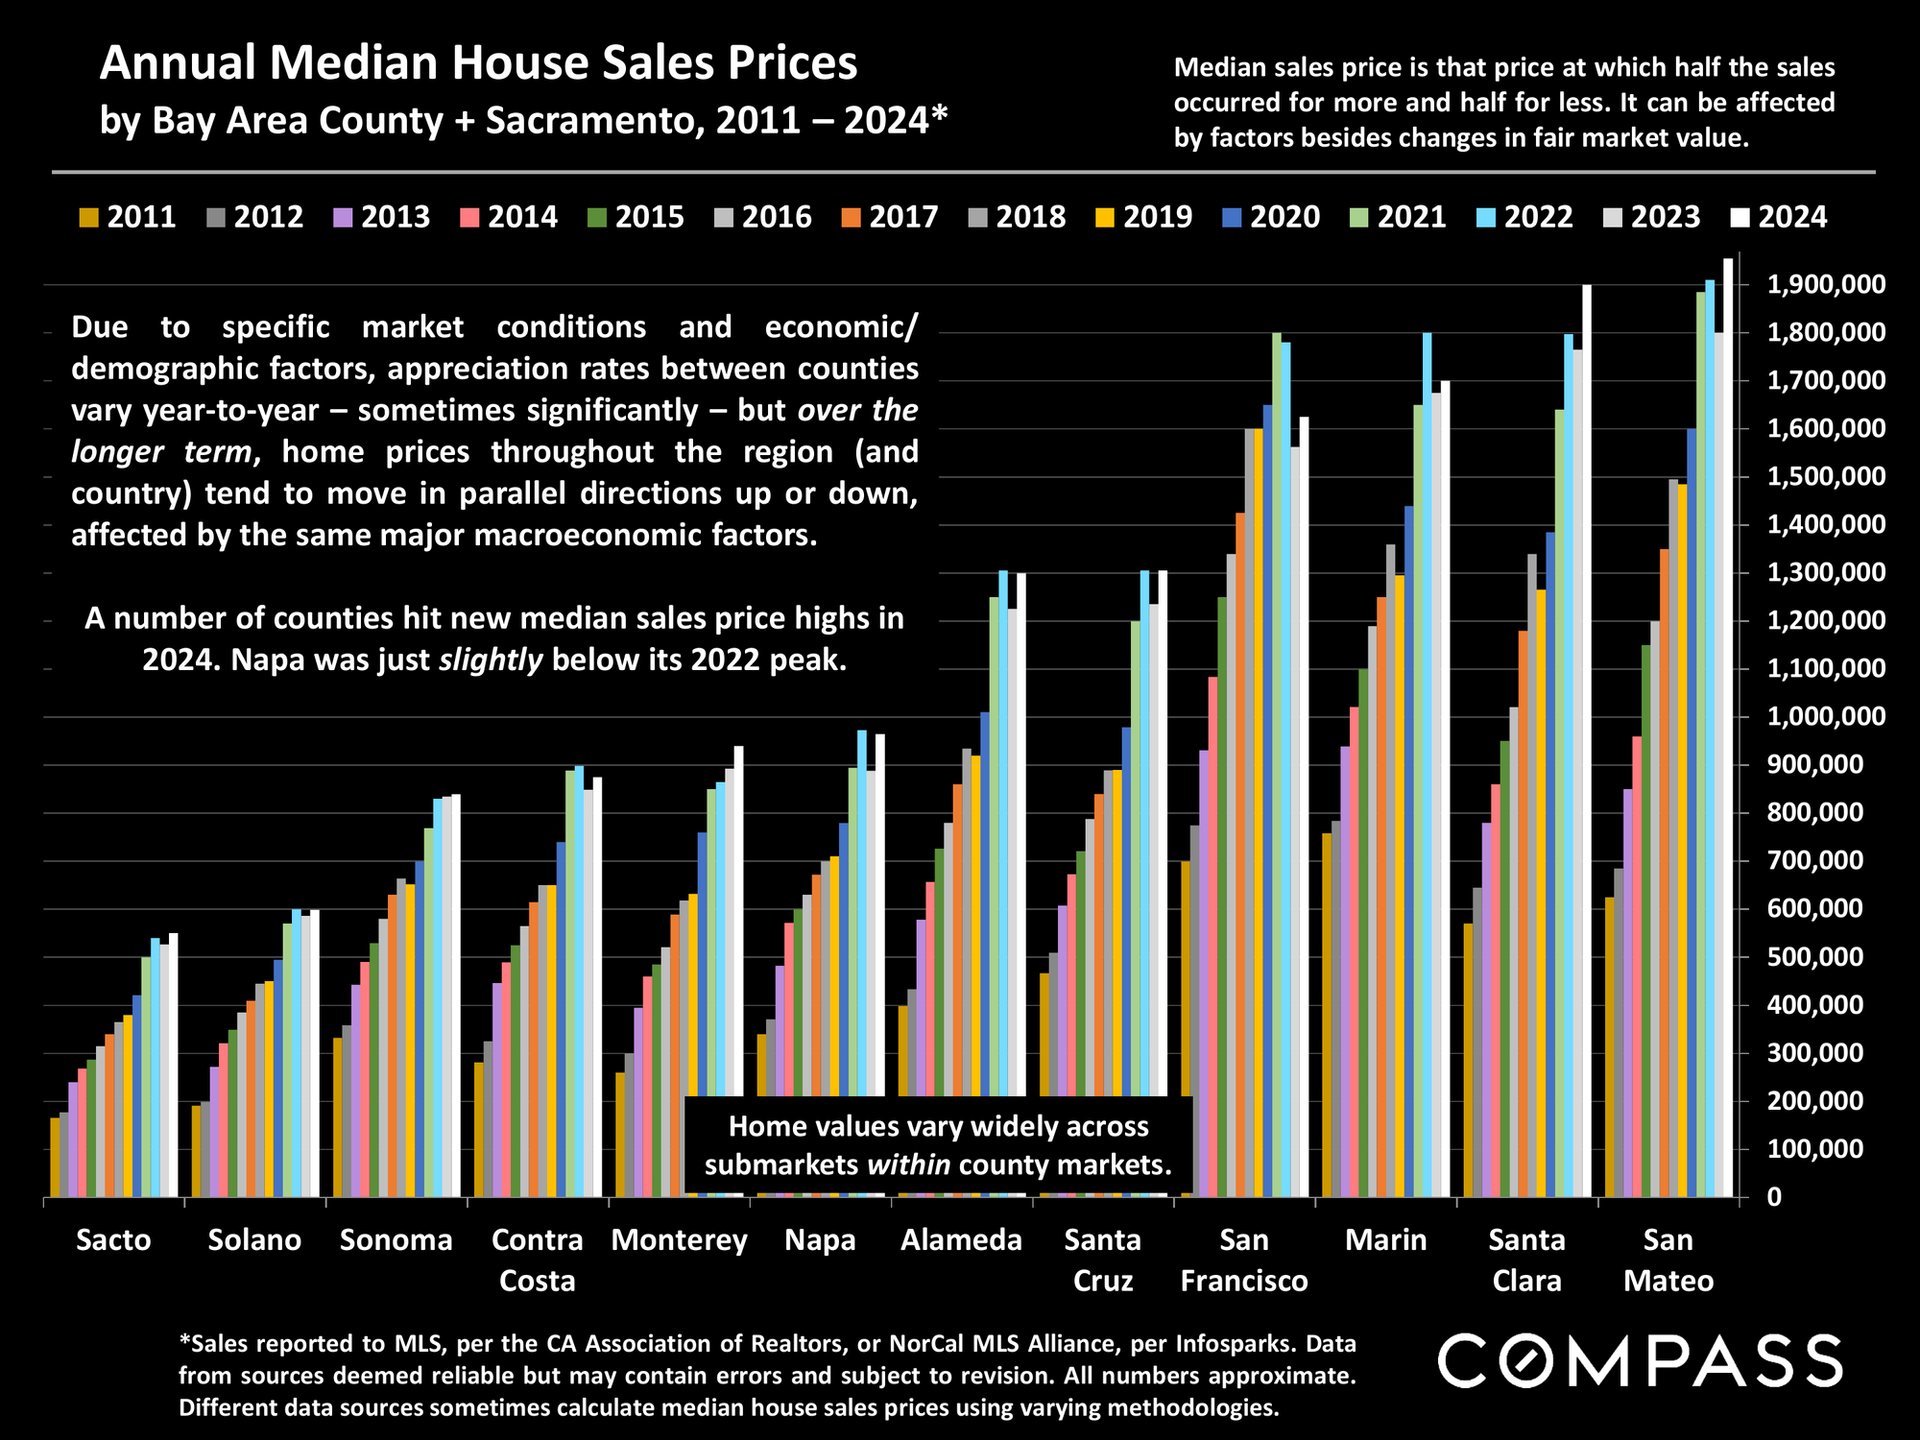
Napa County real estate report cover with a sunlit view of rugged ridges and forested valleys.A New Year Begins report summarizes economic conditions and the 2025 Bay Area housing market outlook.Chart of jumbo mortgage rates from 2018 to February 2025, peaking above 8% in 2023 and ending near 7%.Chart of Napa County median home prices from 1990 to January 2025, with peaks, declines, and market events labeled.Bar chart compares 2011–2024 median house prices across Bay Area counties; Napa’s 2024 price was slightly below its 2022 peak.
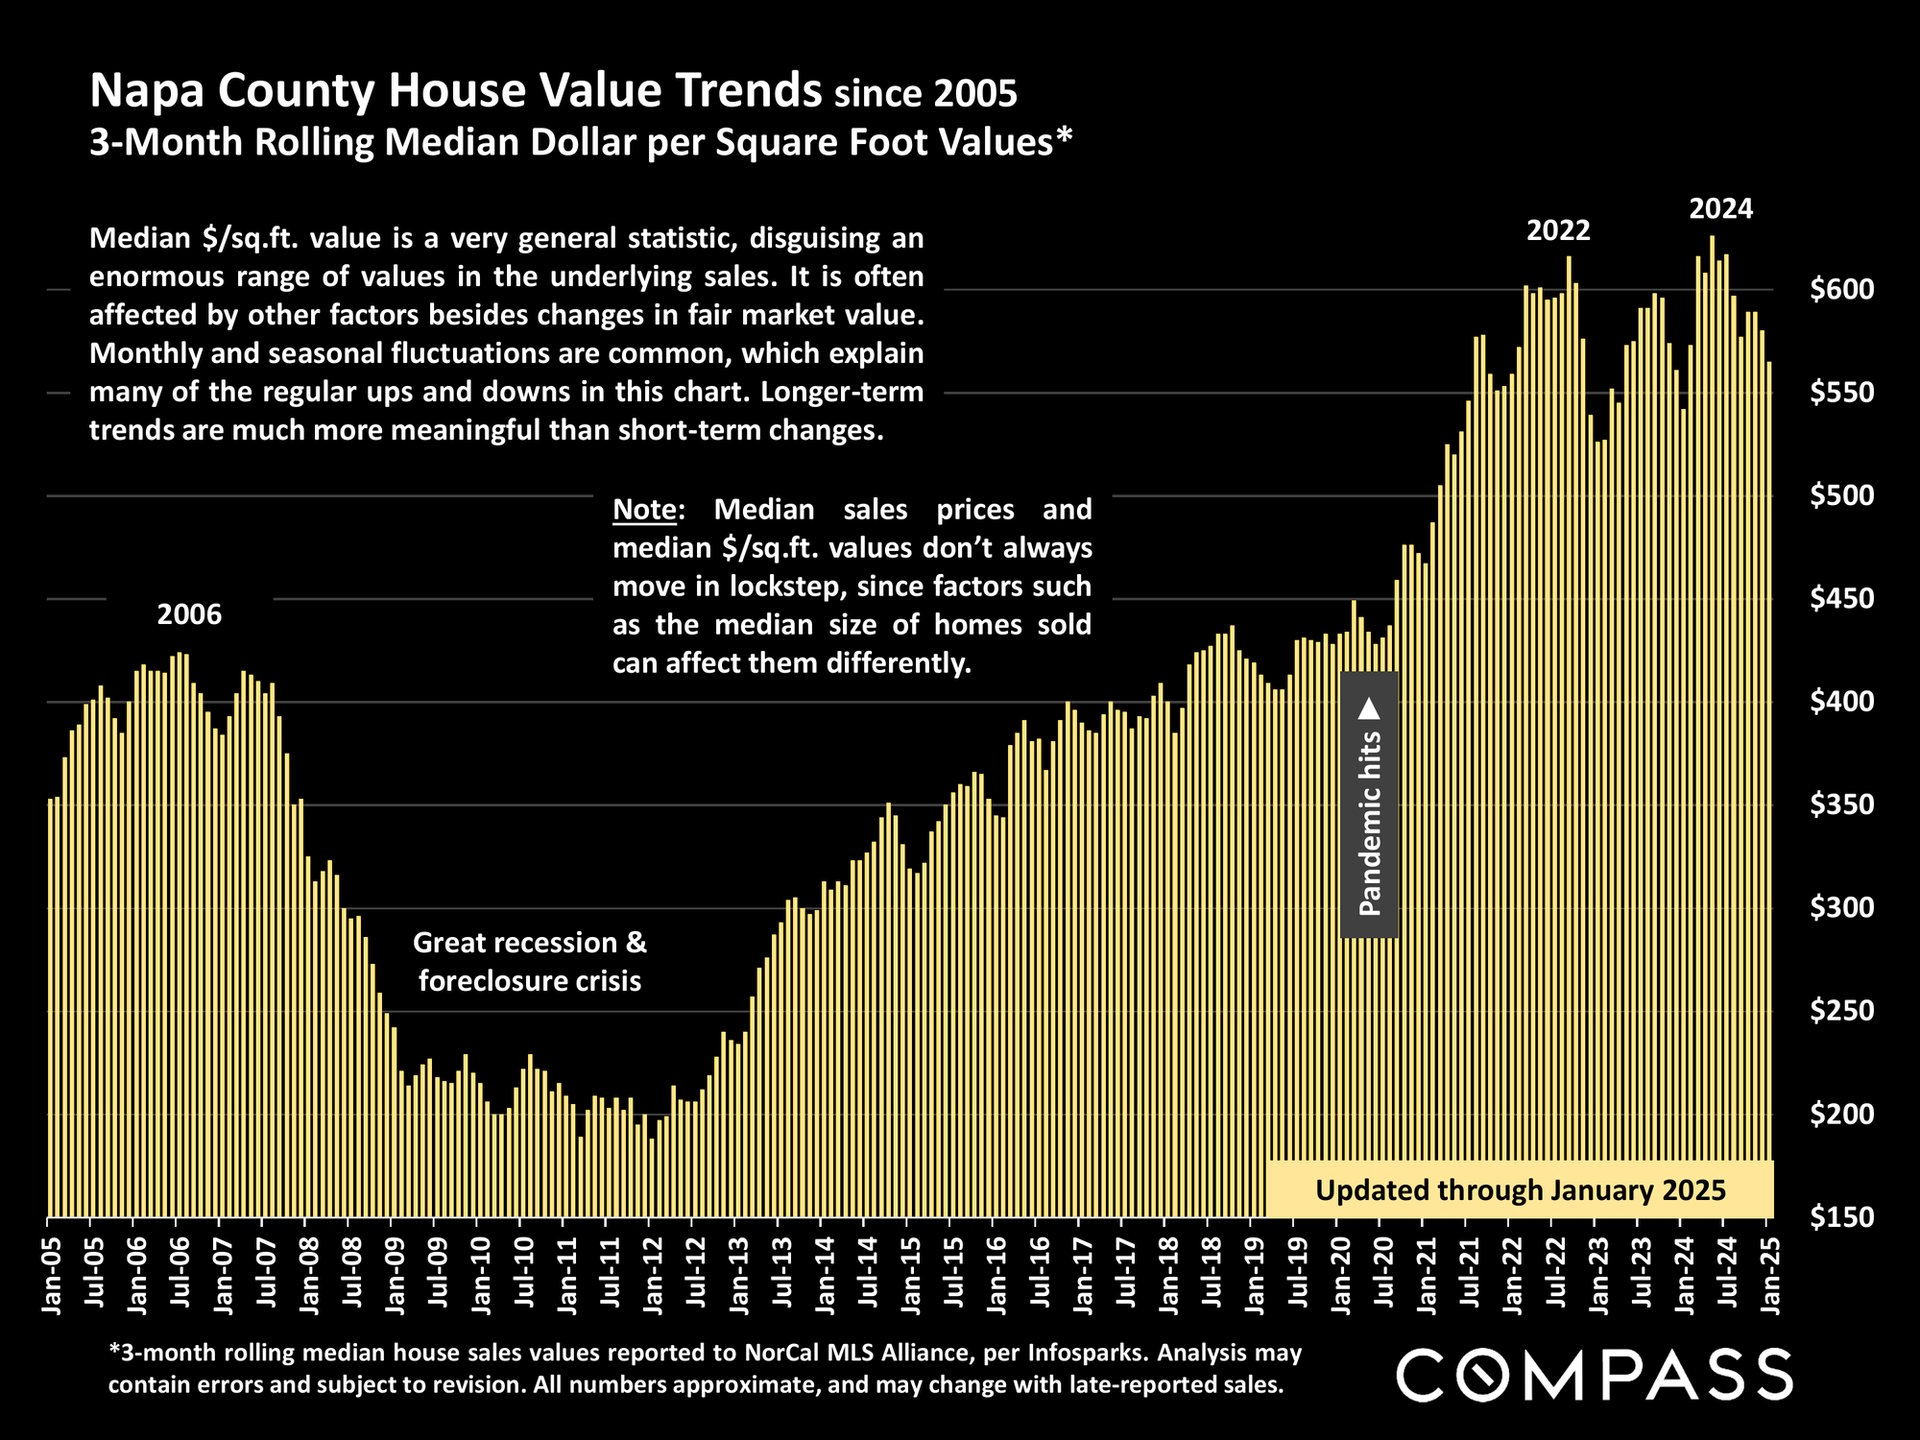
Chart of Napa County median home value per square foot, 2005–2025, with recession and pandemic milestones.
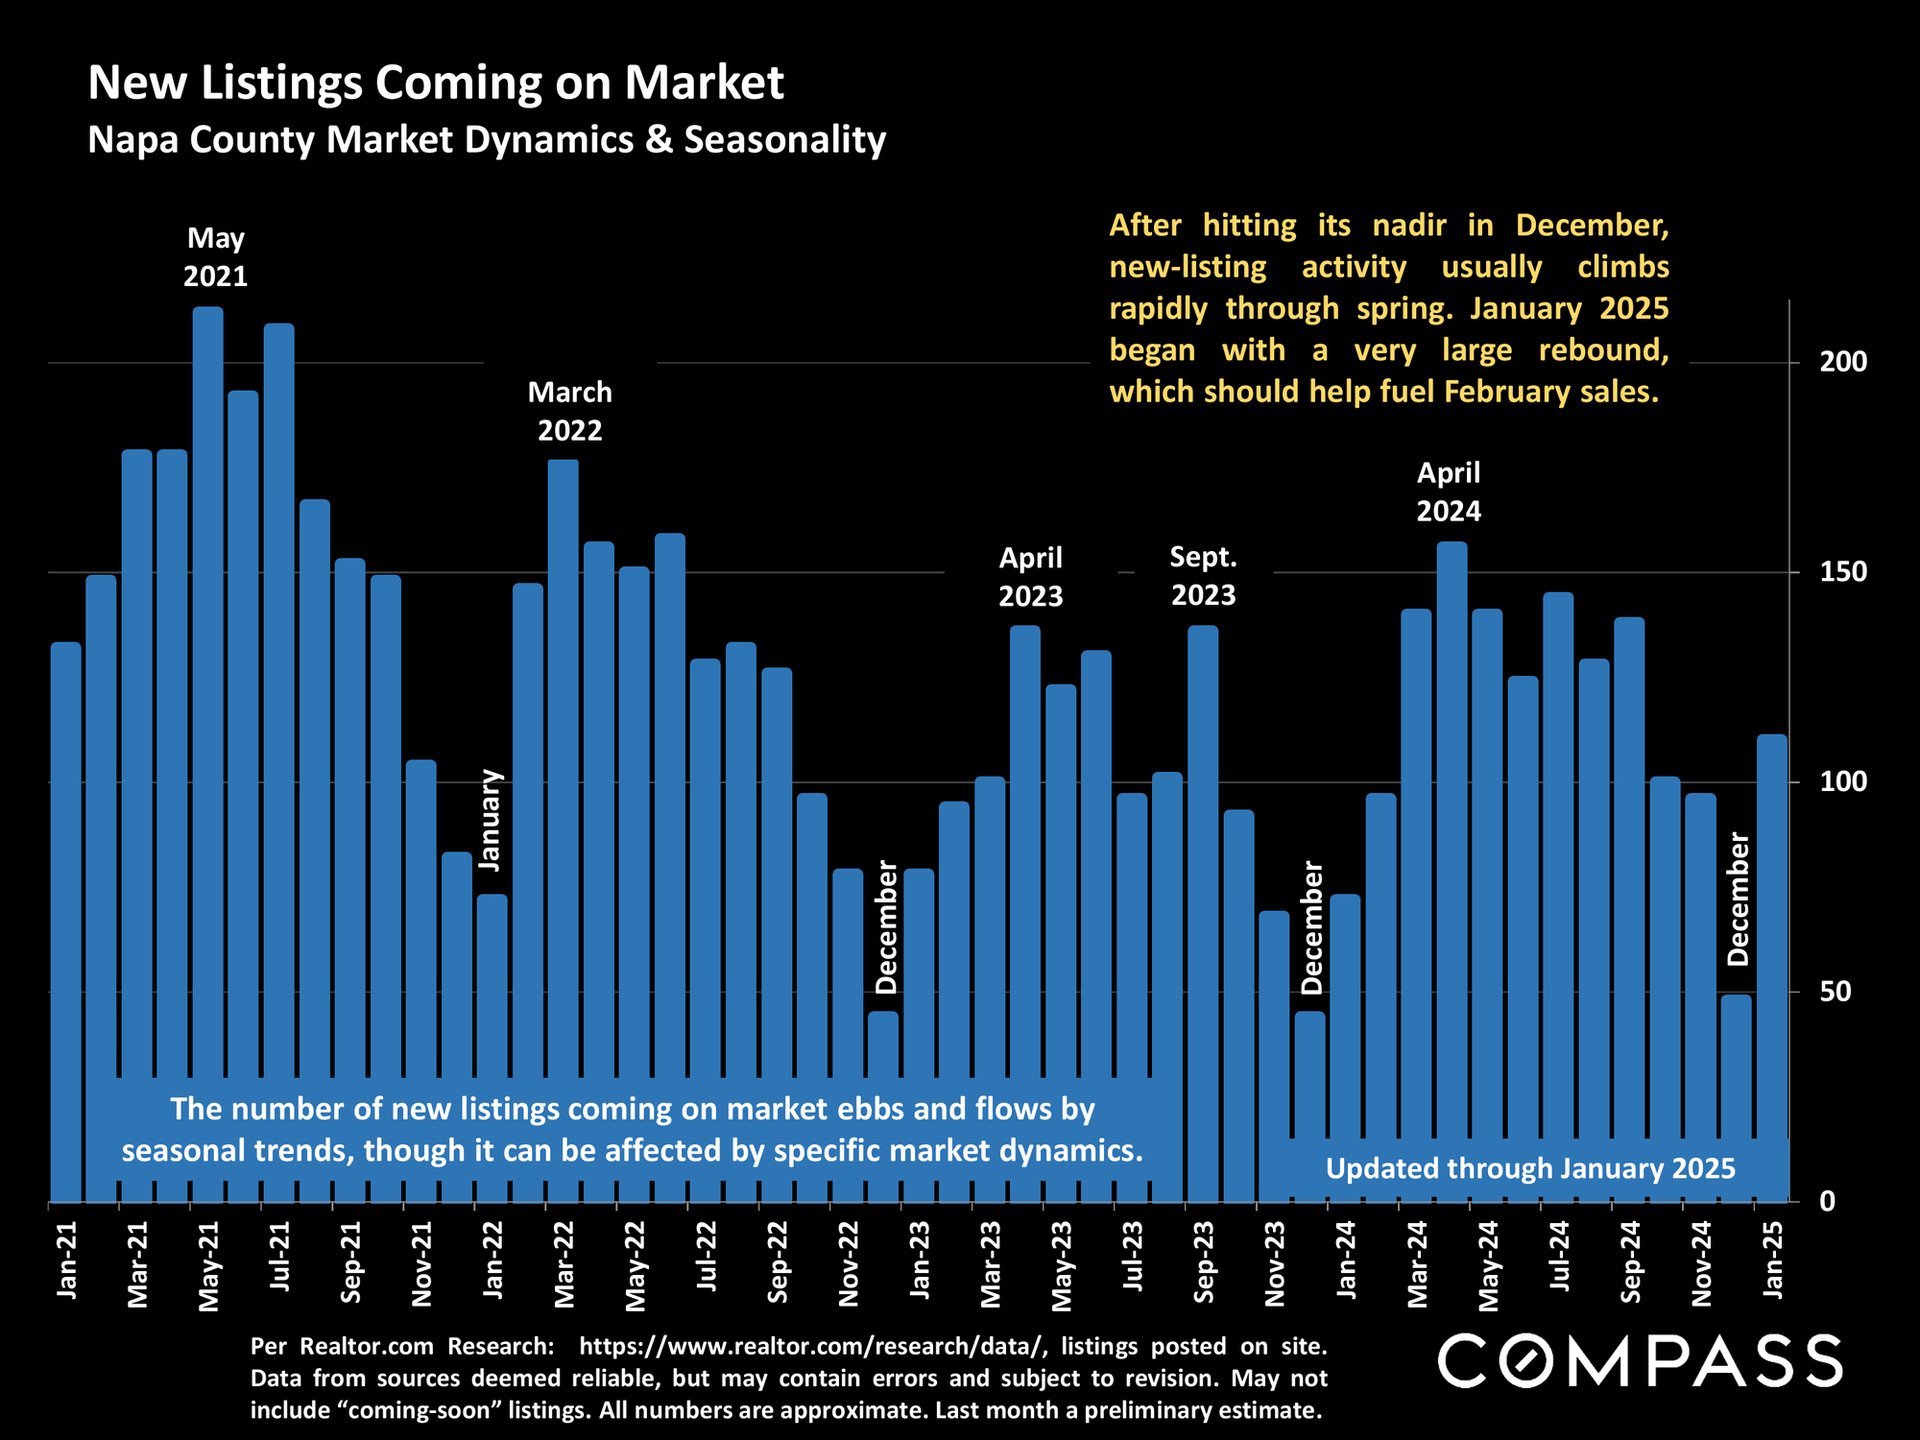
Chart of Napa County new listings, showing seasonal rises and a January 2025 rebound.
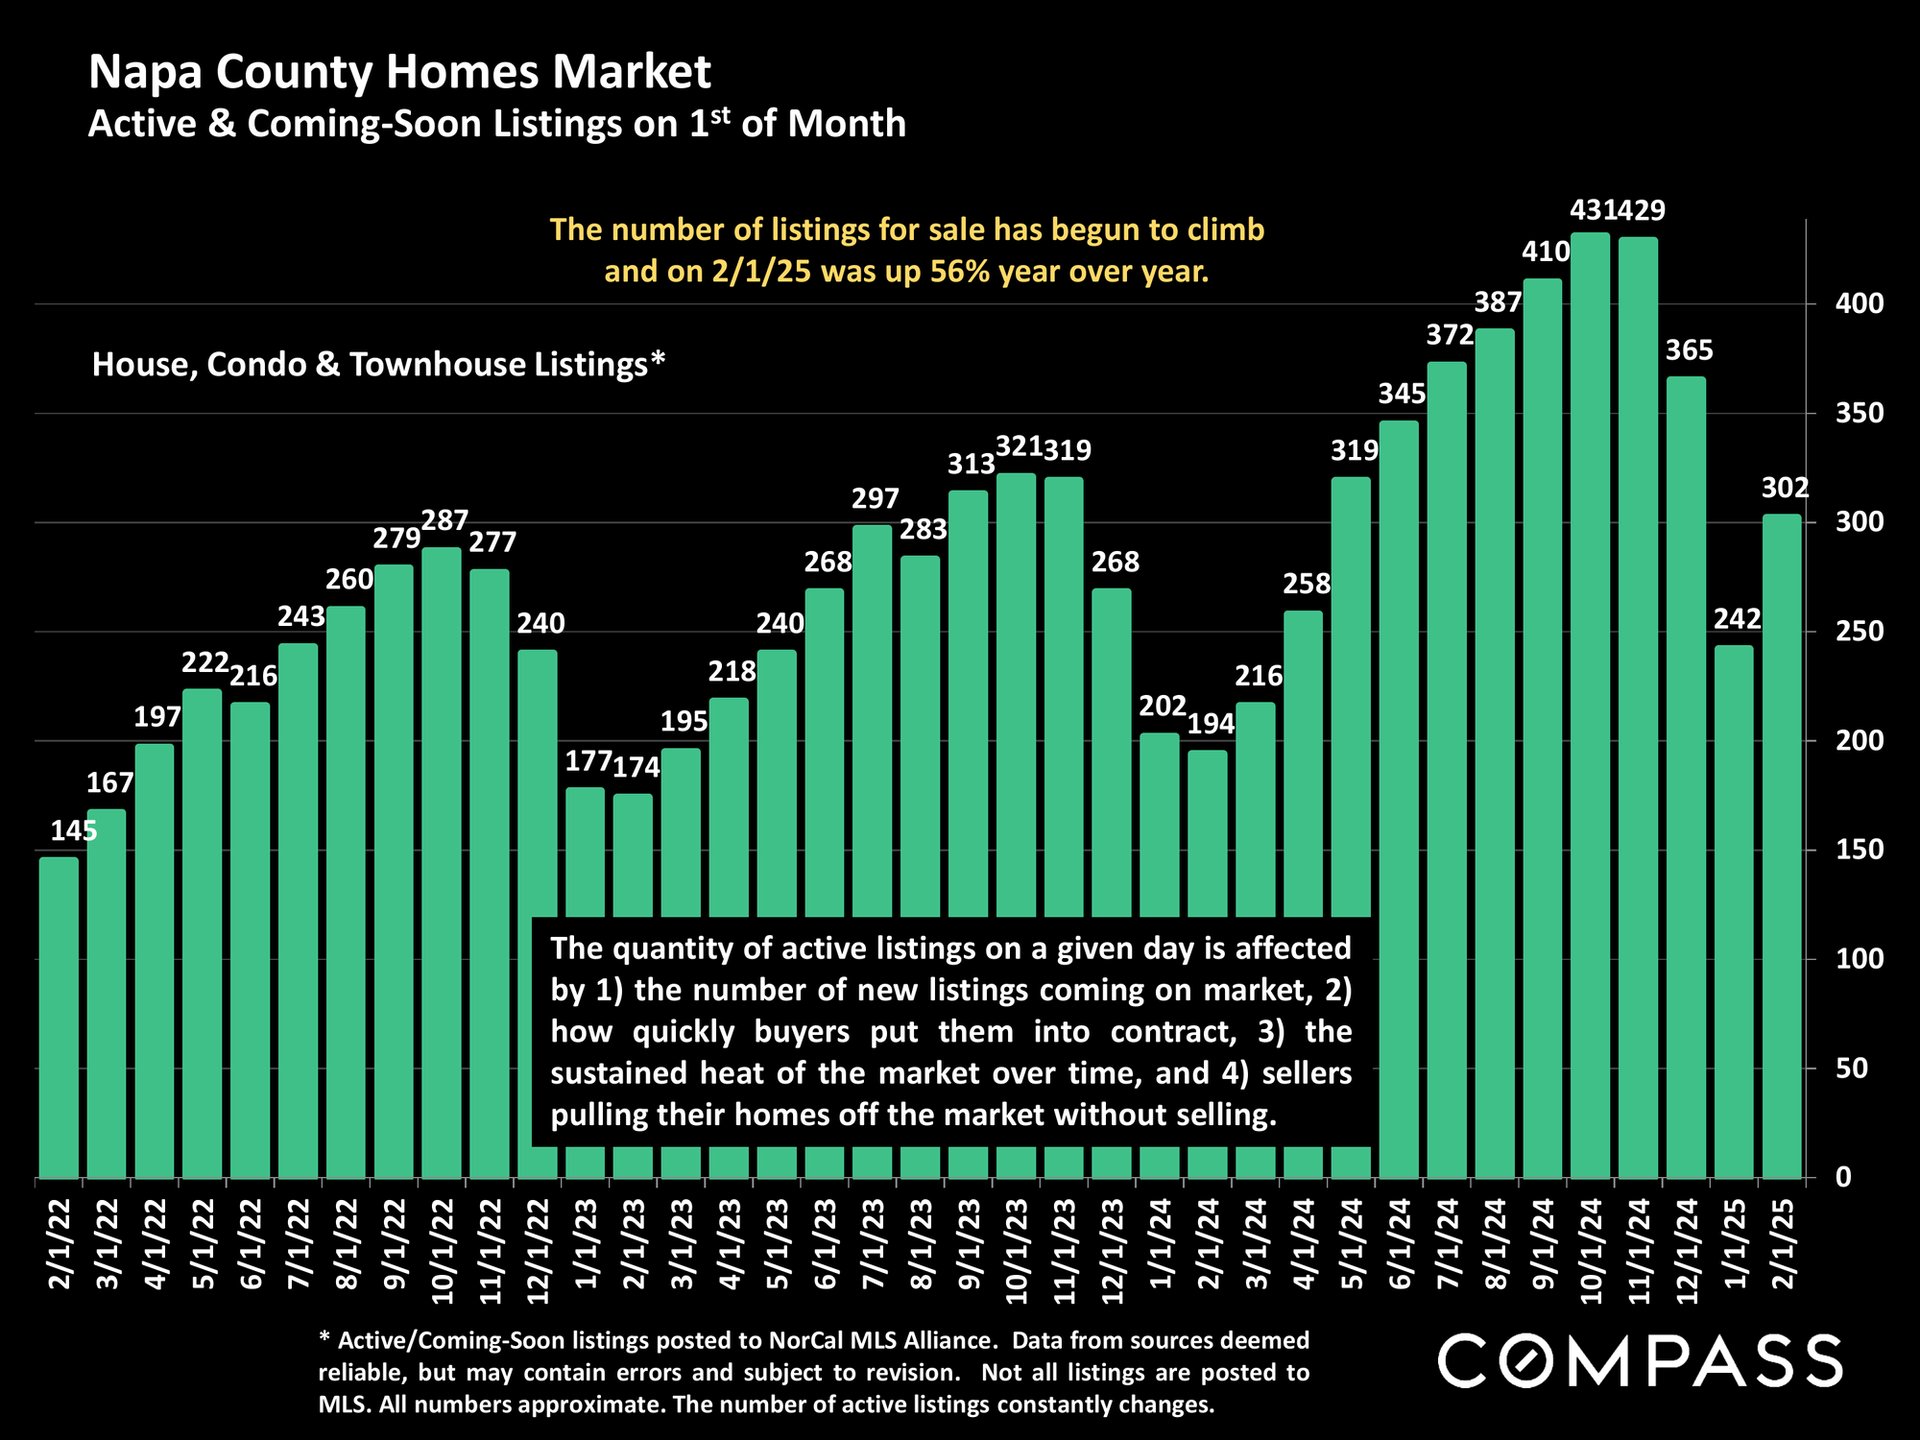
Napa County active and coming-soon listings chart, with monthly counts rising to 431 in October 2024.
Chart of Napa County listings accepting offers, showing seasonal peaks and lows from 2021 to January 2025.
Napa County monthly listing absorption-rate chart, with pandemic and interest-rate annotations, January 2019 to January 2025.
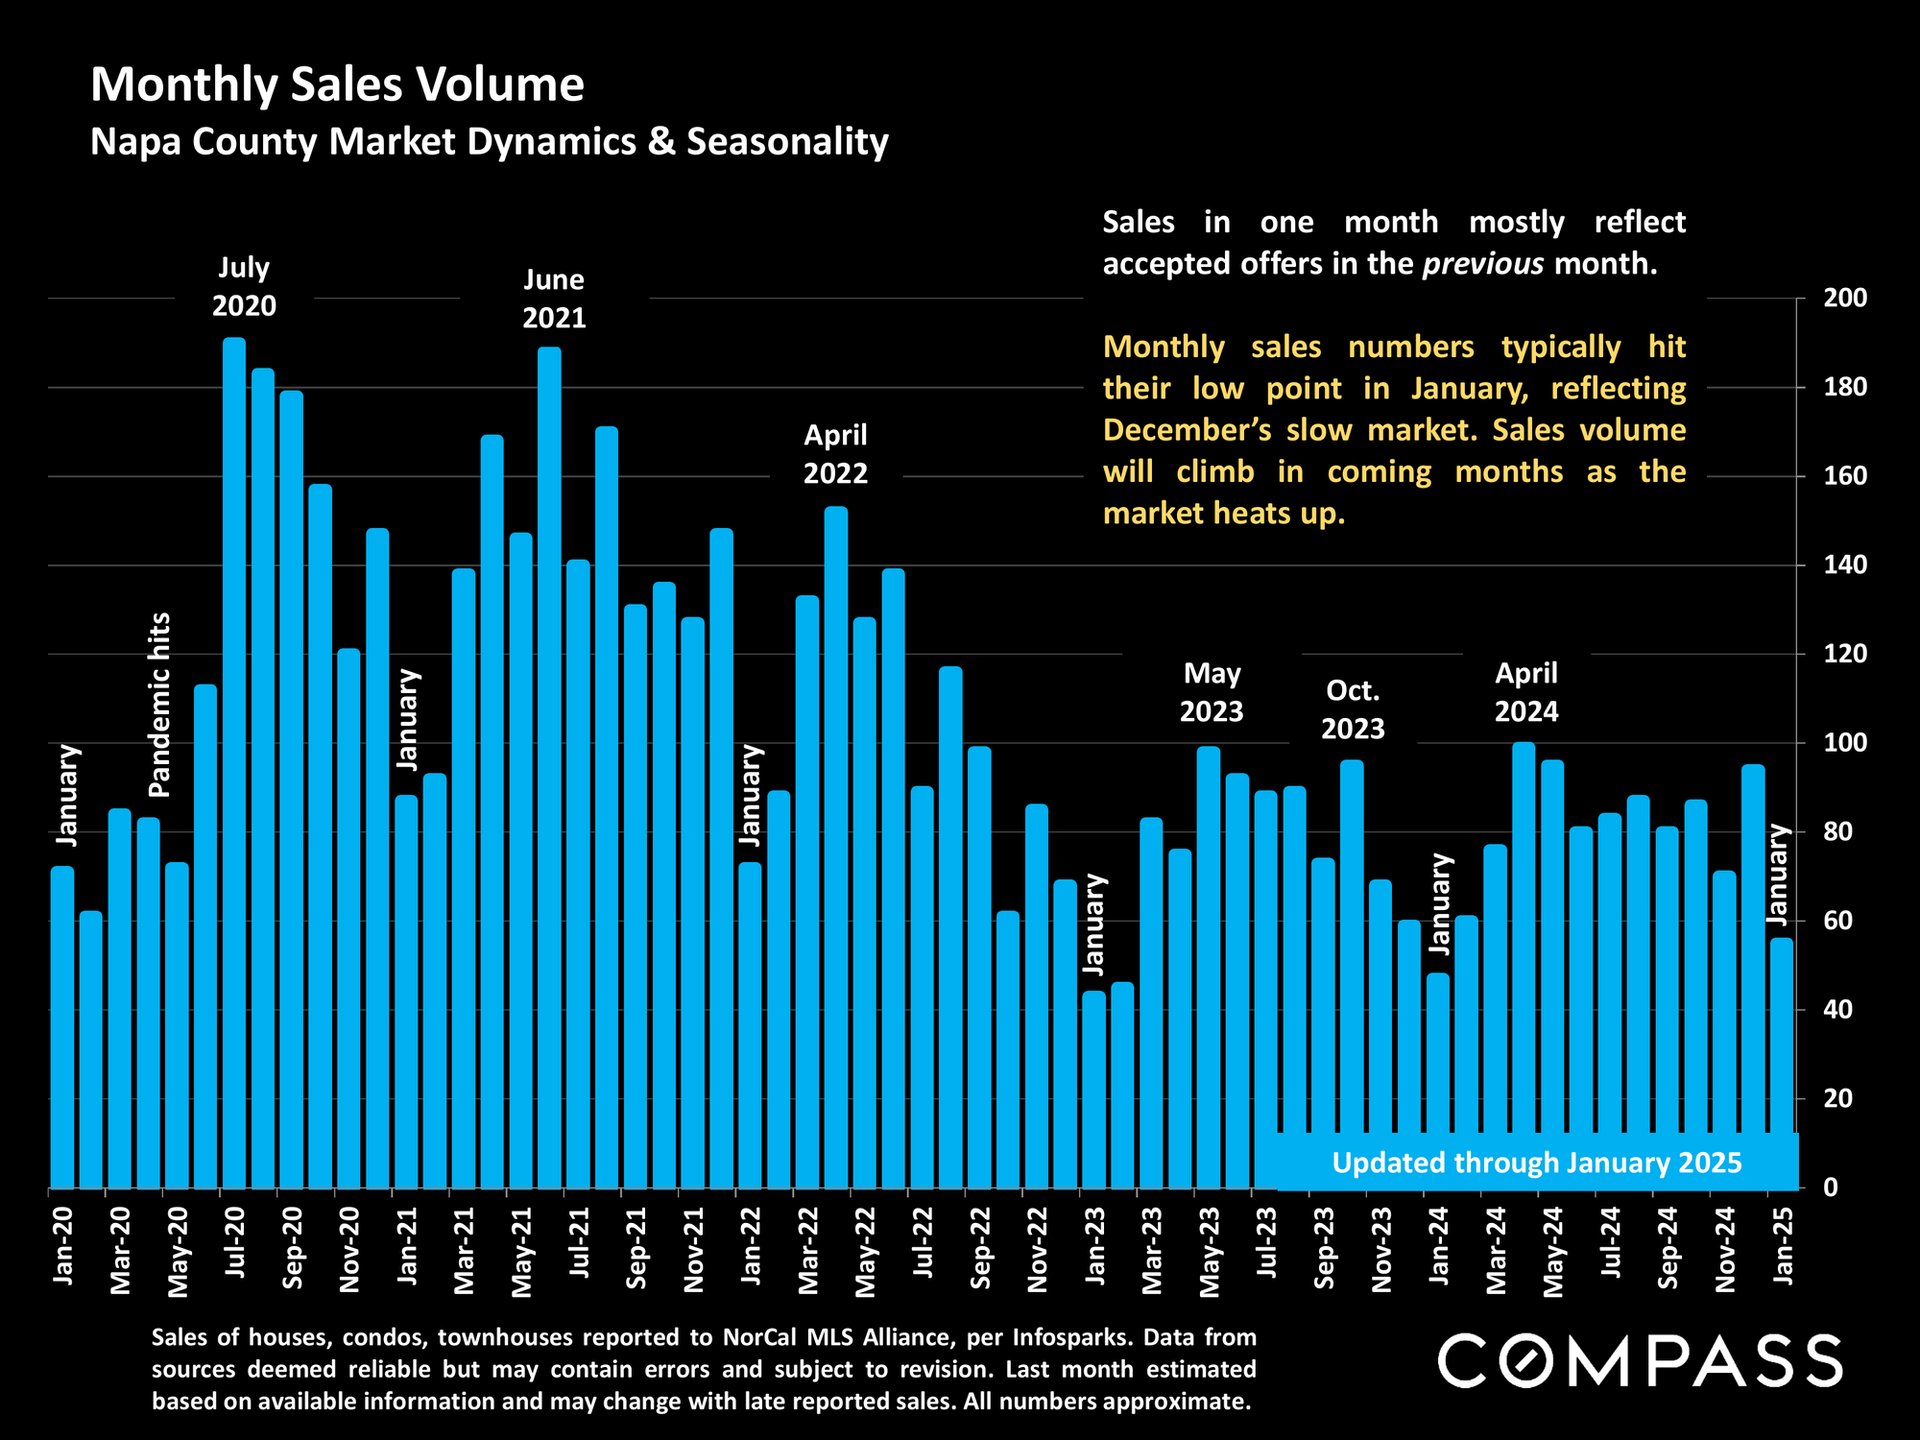
Napa County monthly home sales bar chart through January 2025, with seasonal notes and Compass branding.
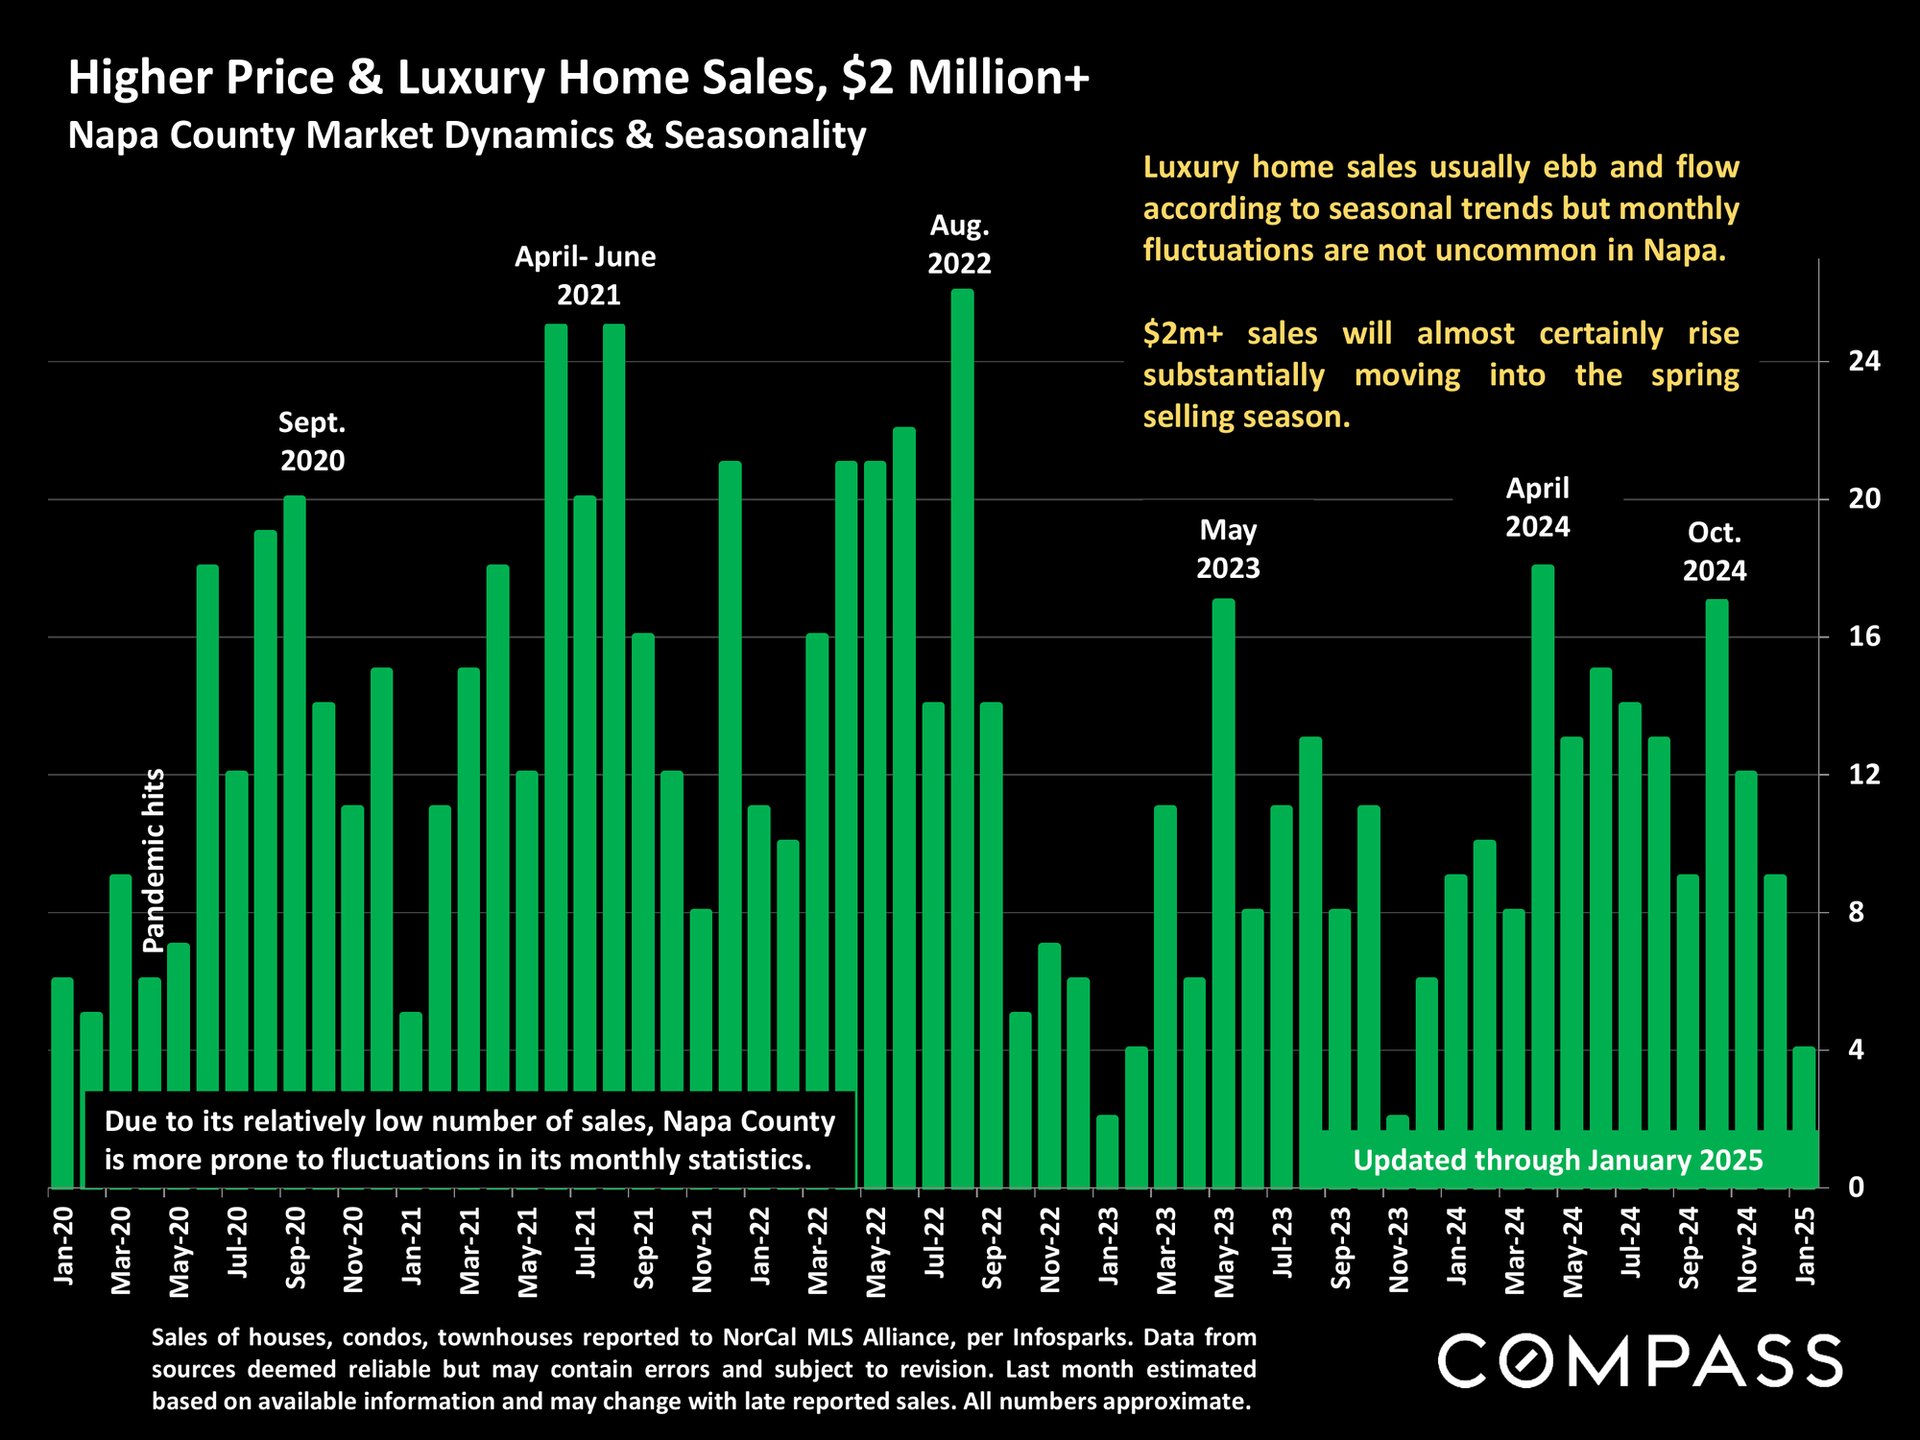
Chart of monthly Napa County home sales over $2 million, January 2020–January 2025, with seasonal annotations.
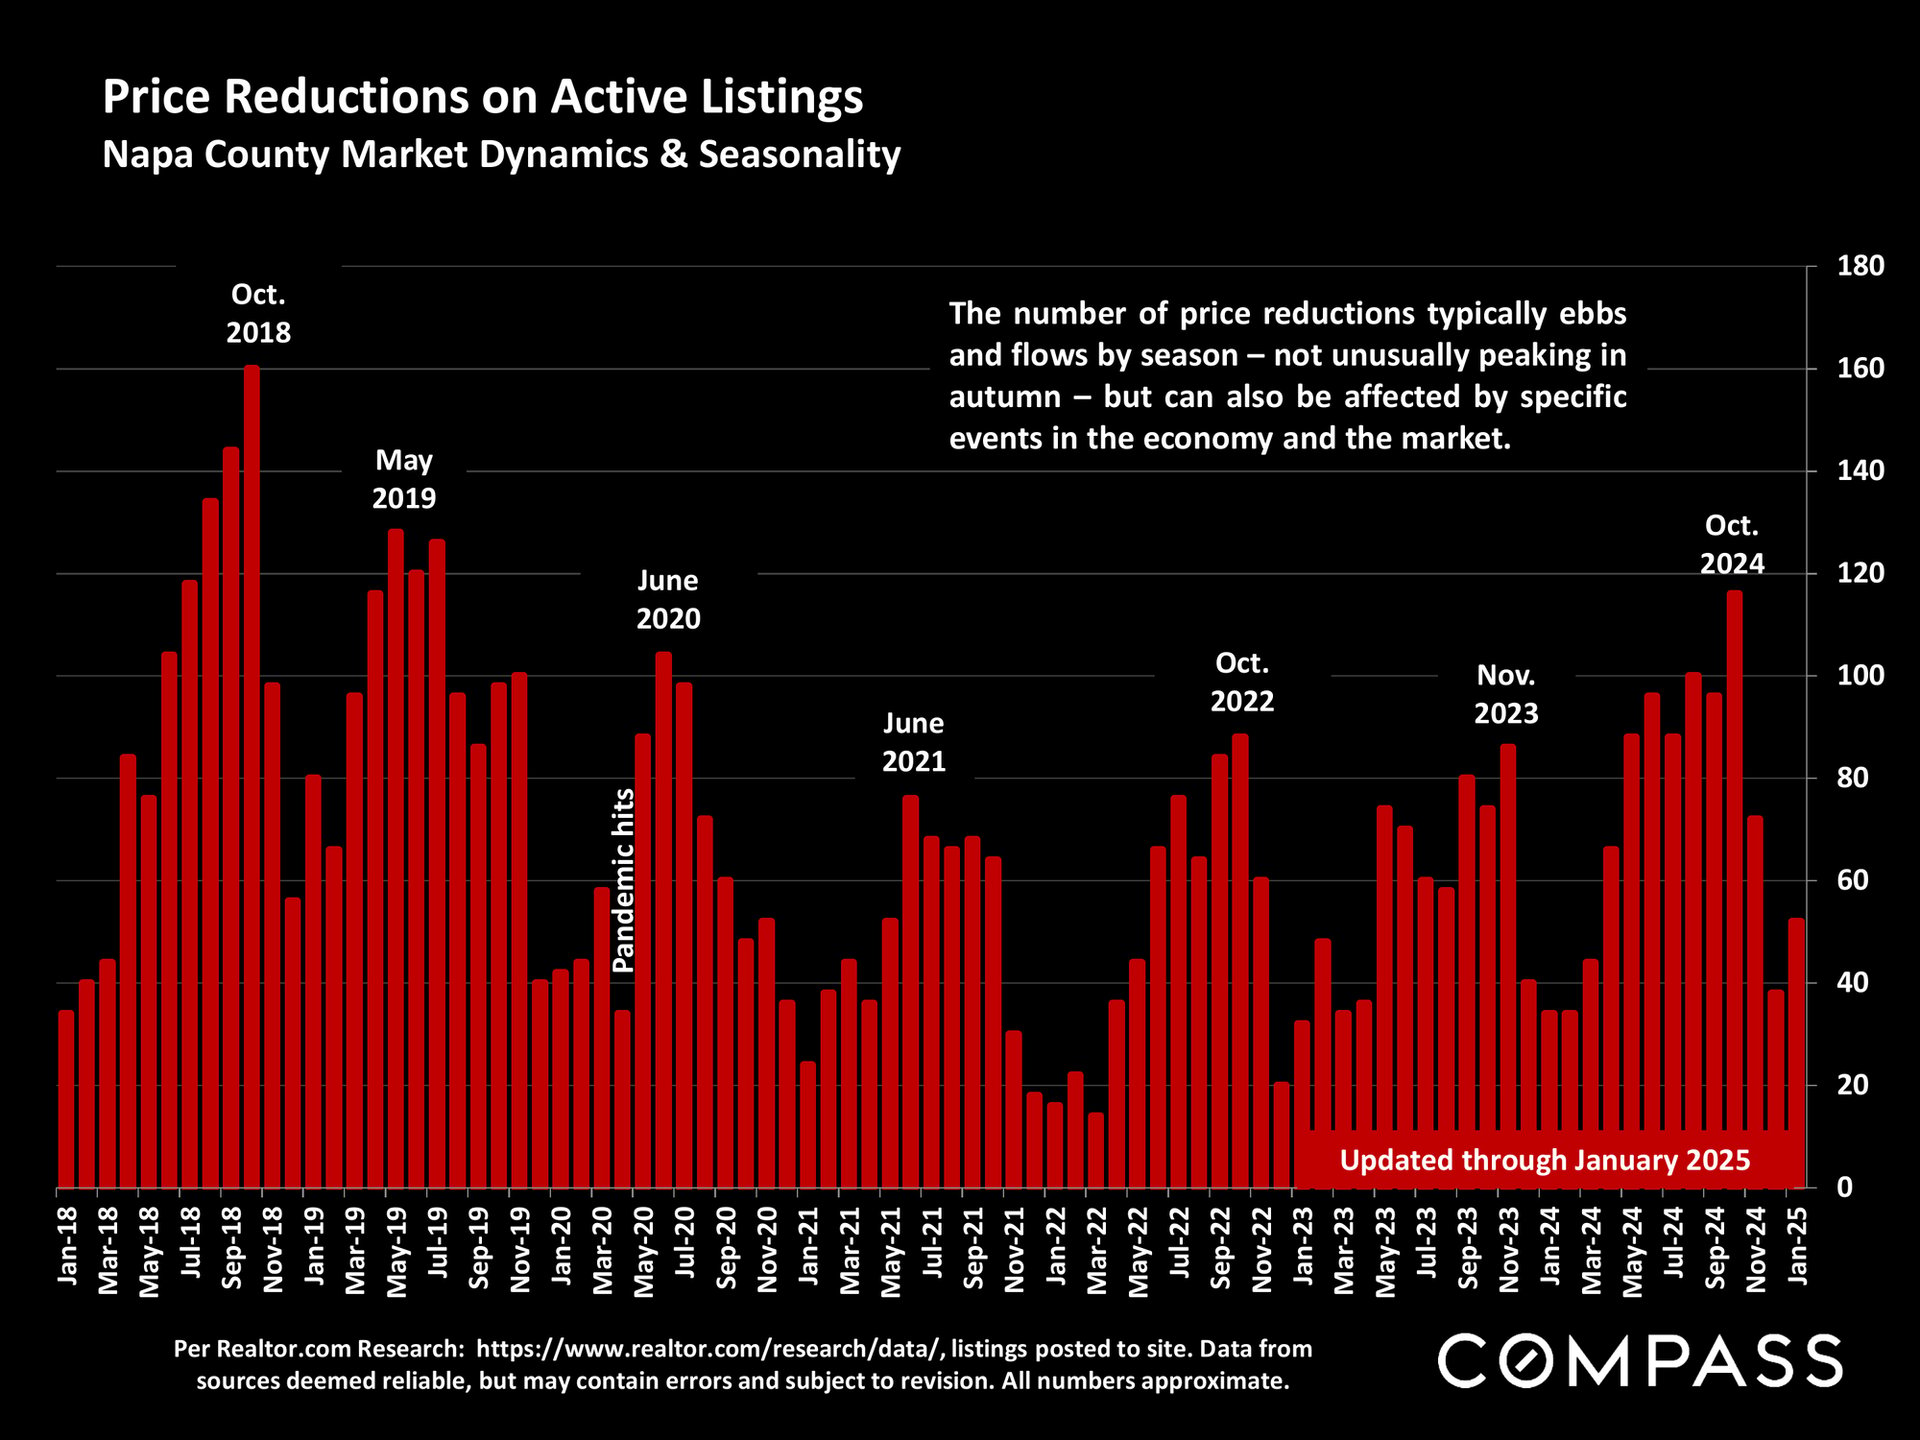
Chart of Napa County active-listing price reductions from 2018 to January 2025, with seasonal peaks and a pandemic marker.
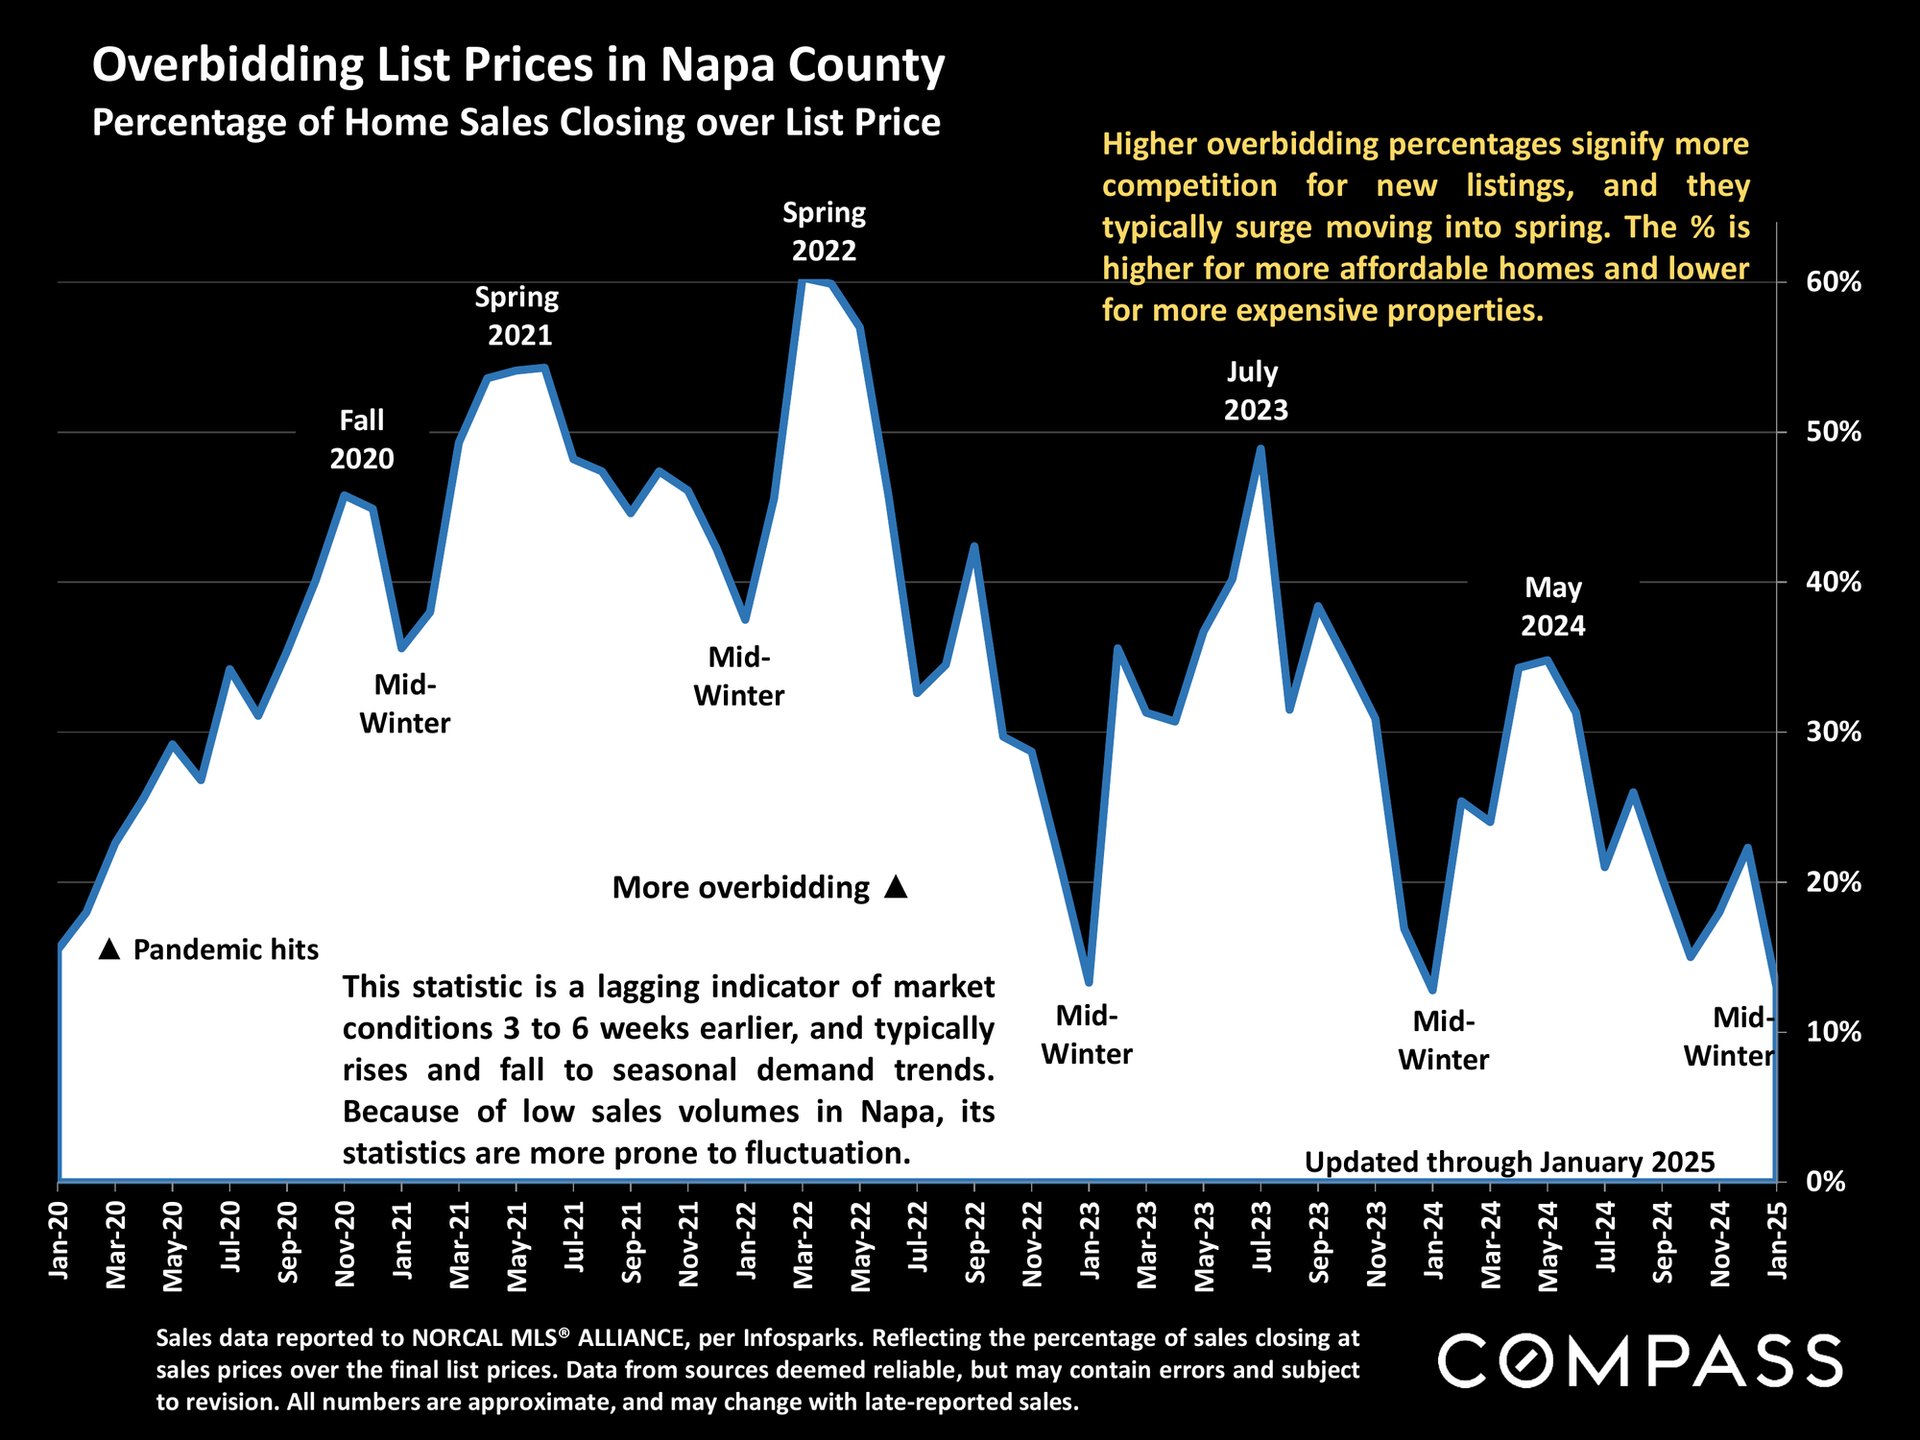
Chart of Napa County home sales closing over list price, showing monthly overbidding rates from 2020 to January 2025.
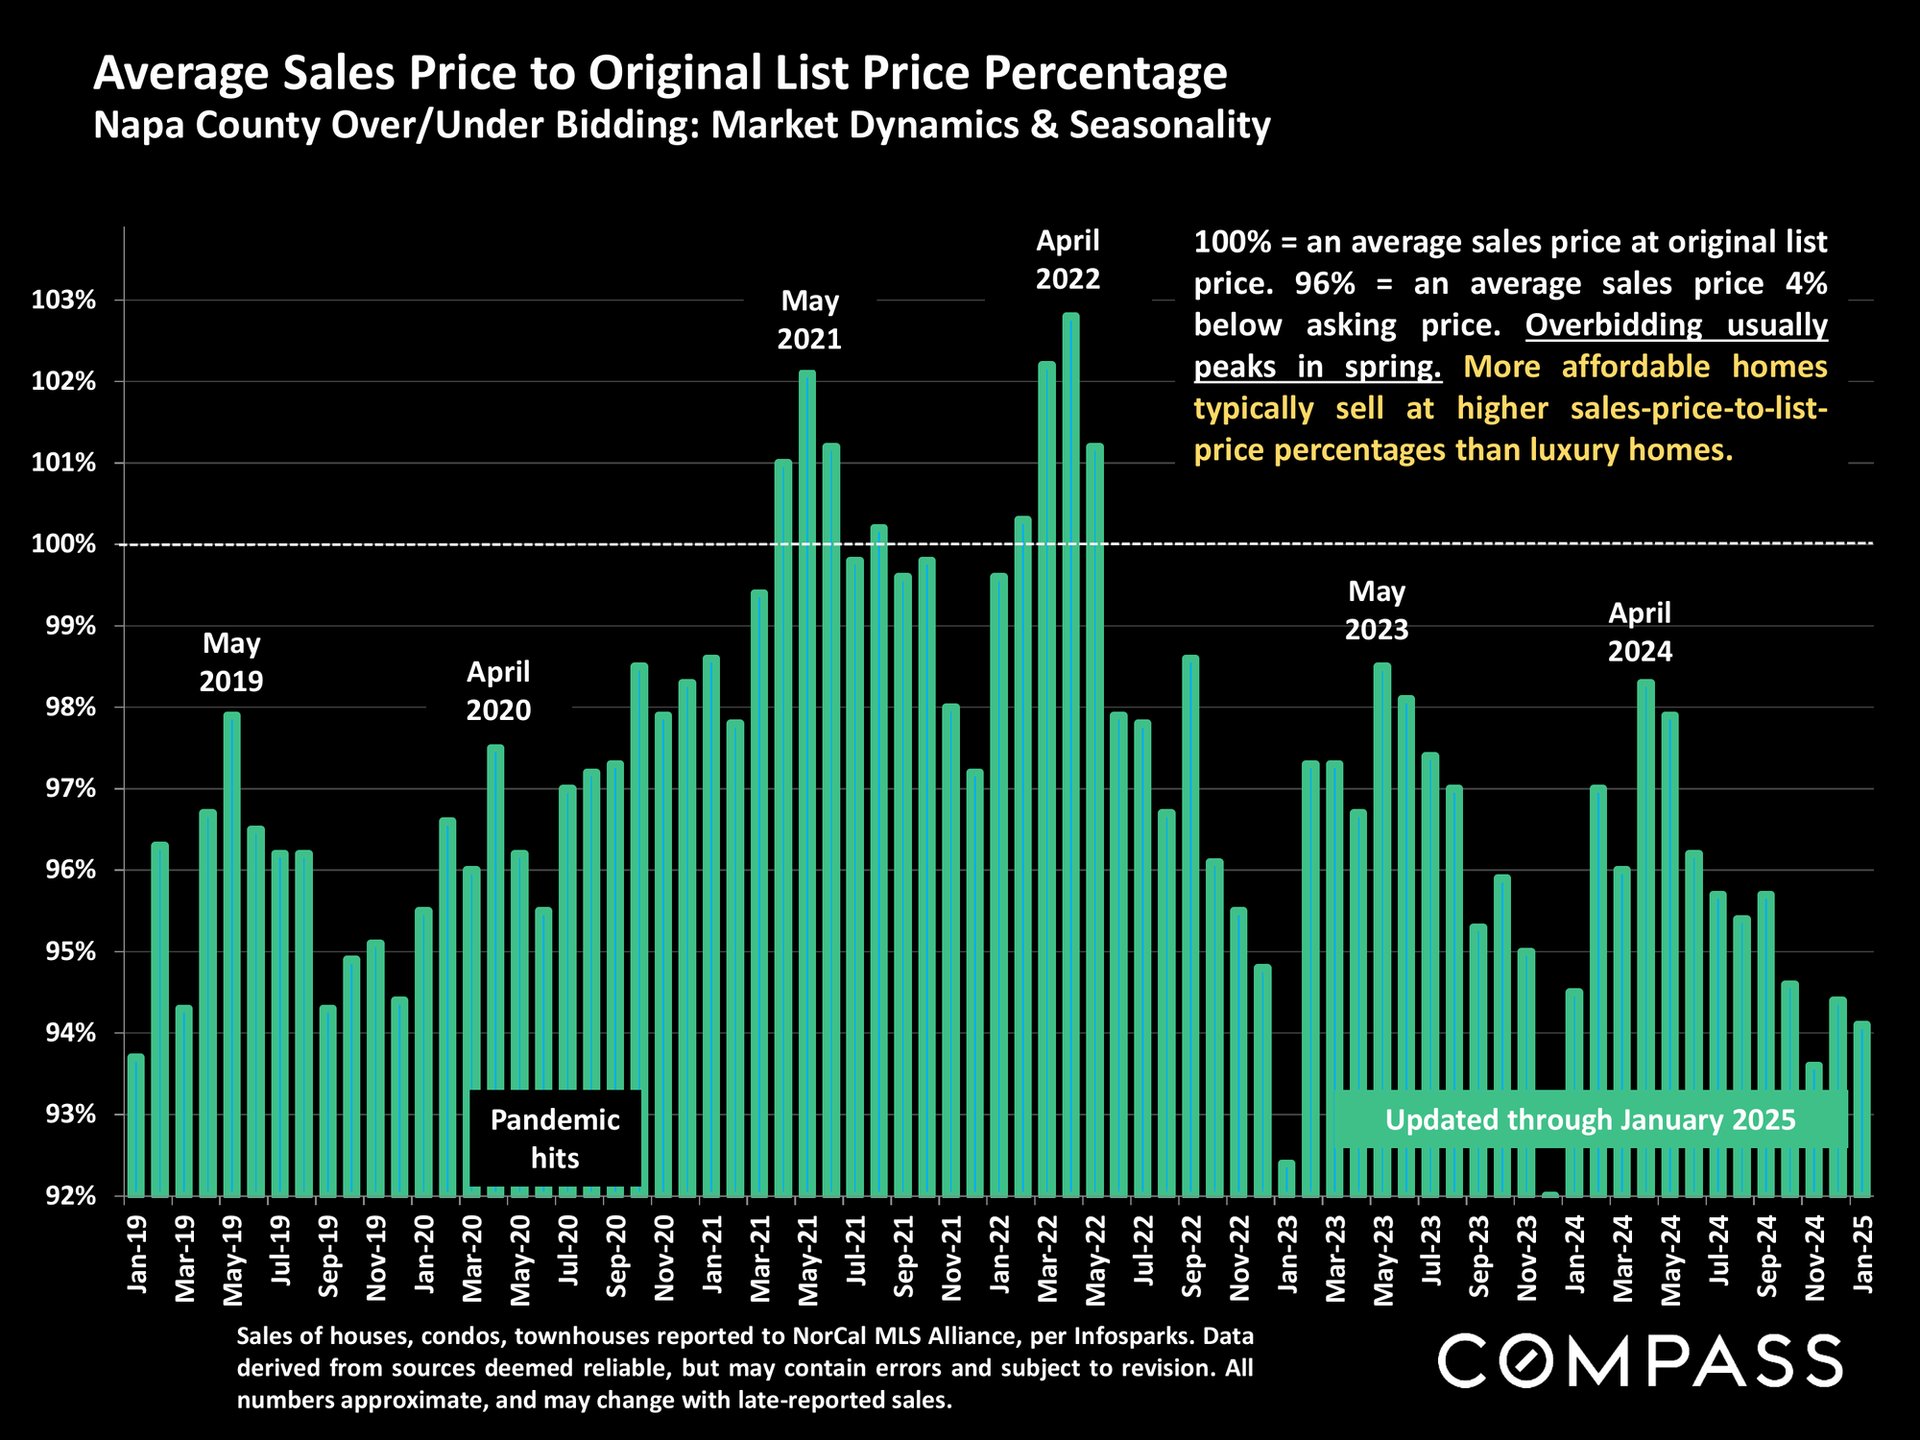
Napa County monthly sale-to-list price percentages, January 2019–January 2025, with a 100% benchmark and spring peaks.
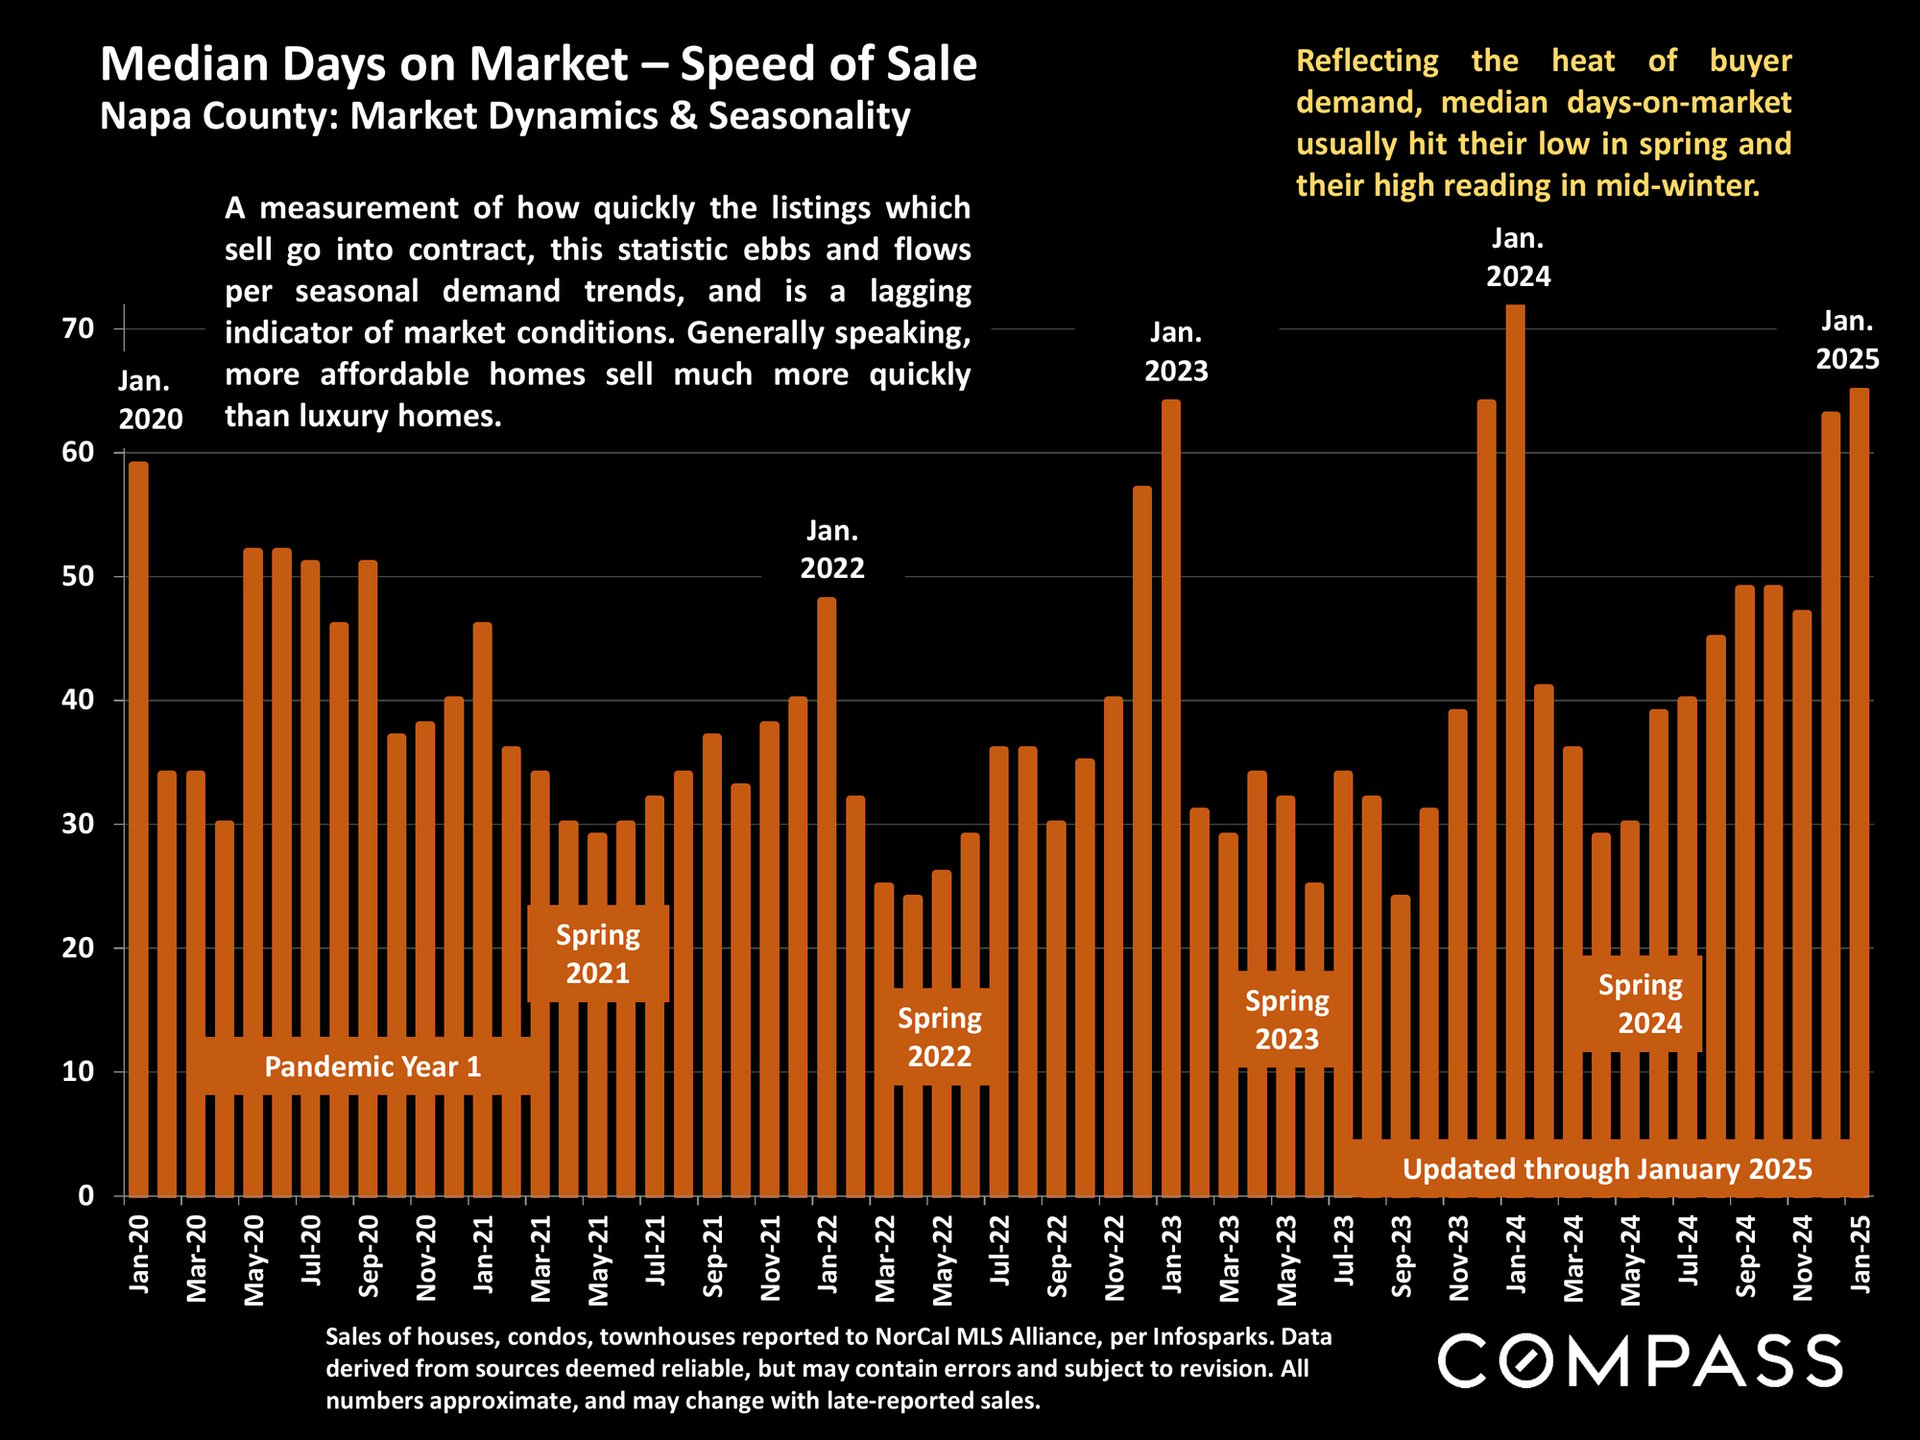
Bar chart of Napa County median days on market, January 2020–January 2025, with seasonal peaks and spring lows.
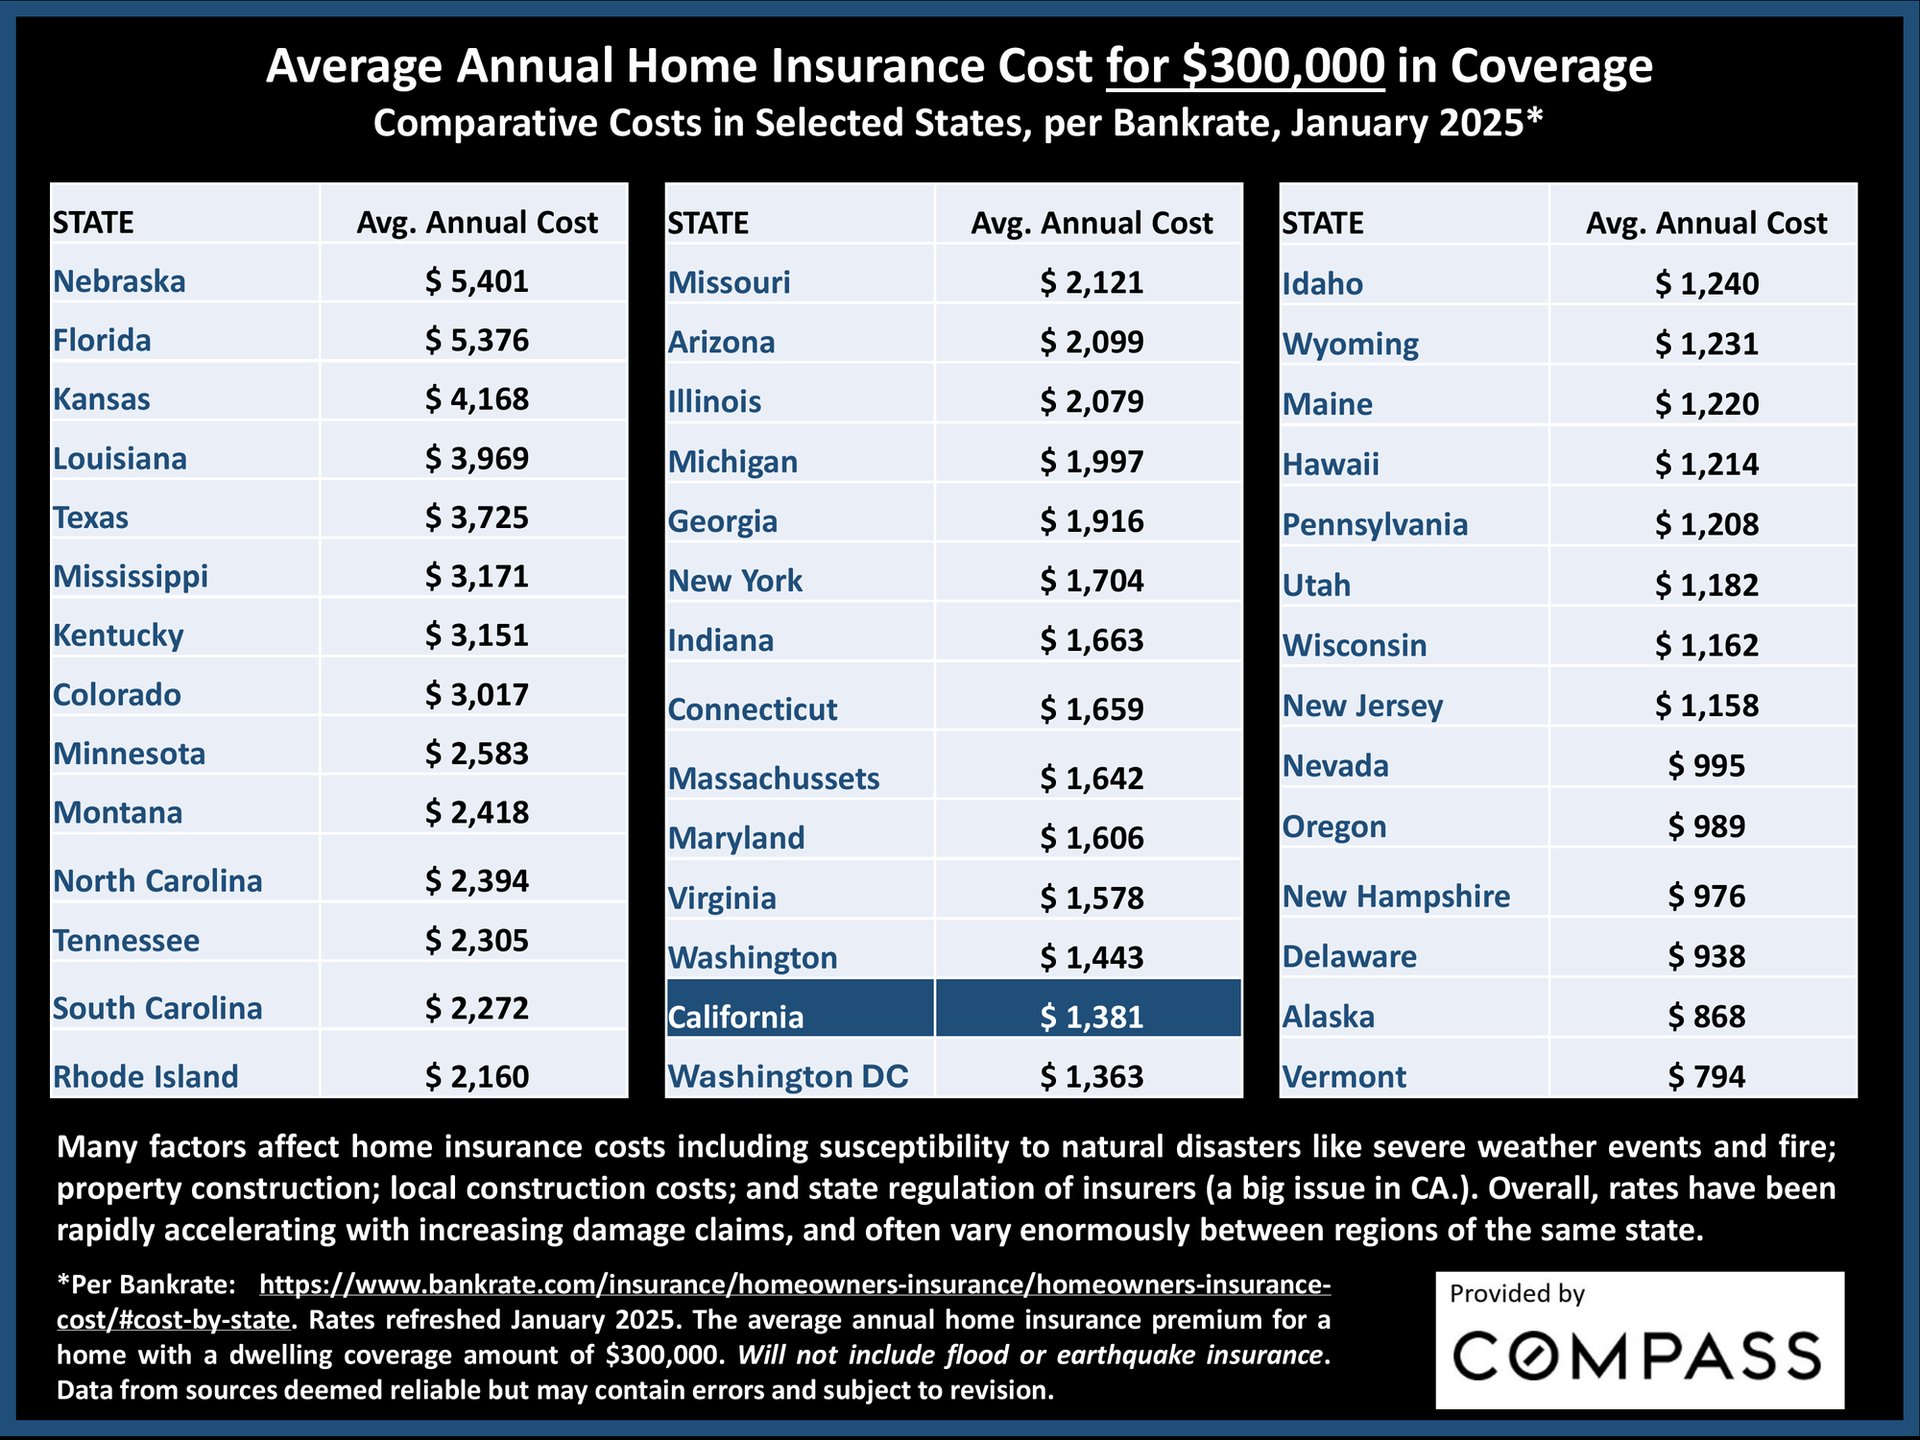
Infographic comparing annual home insurance costs by state, with California highlighted at $1,381.
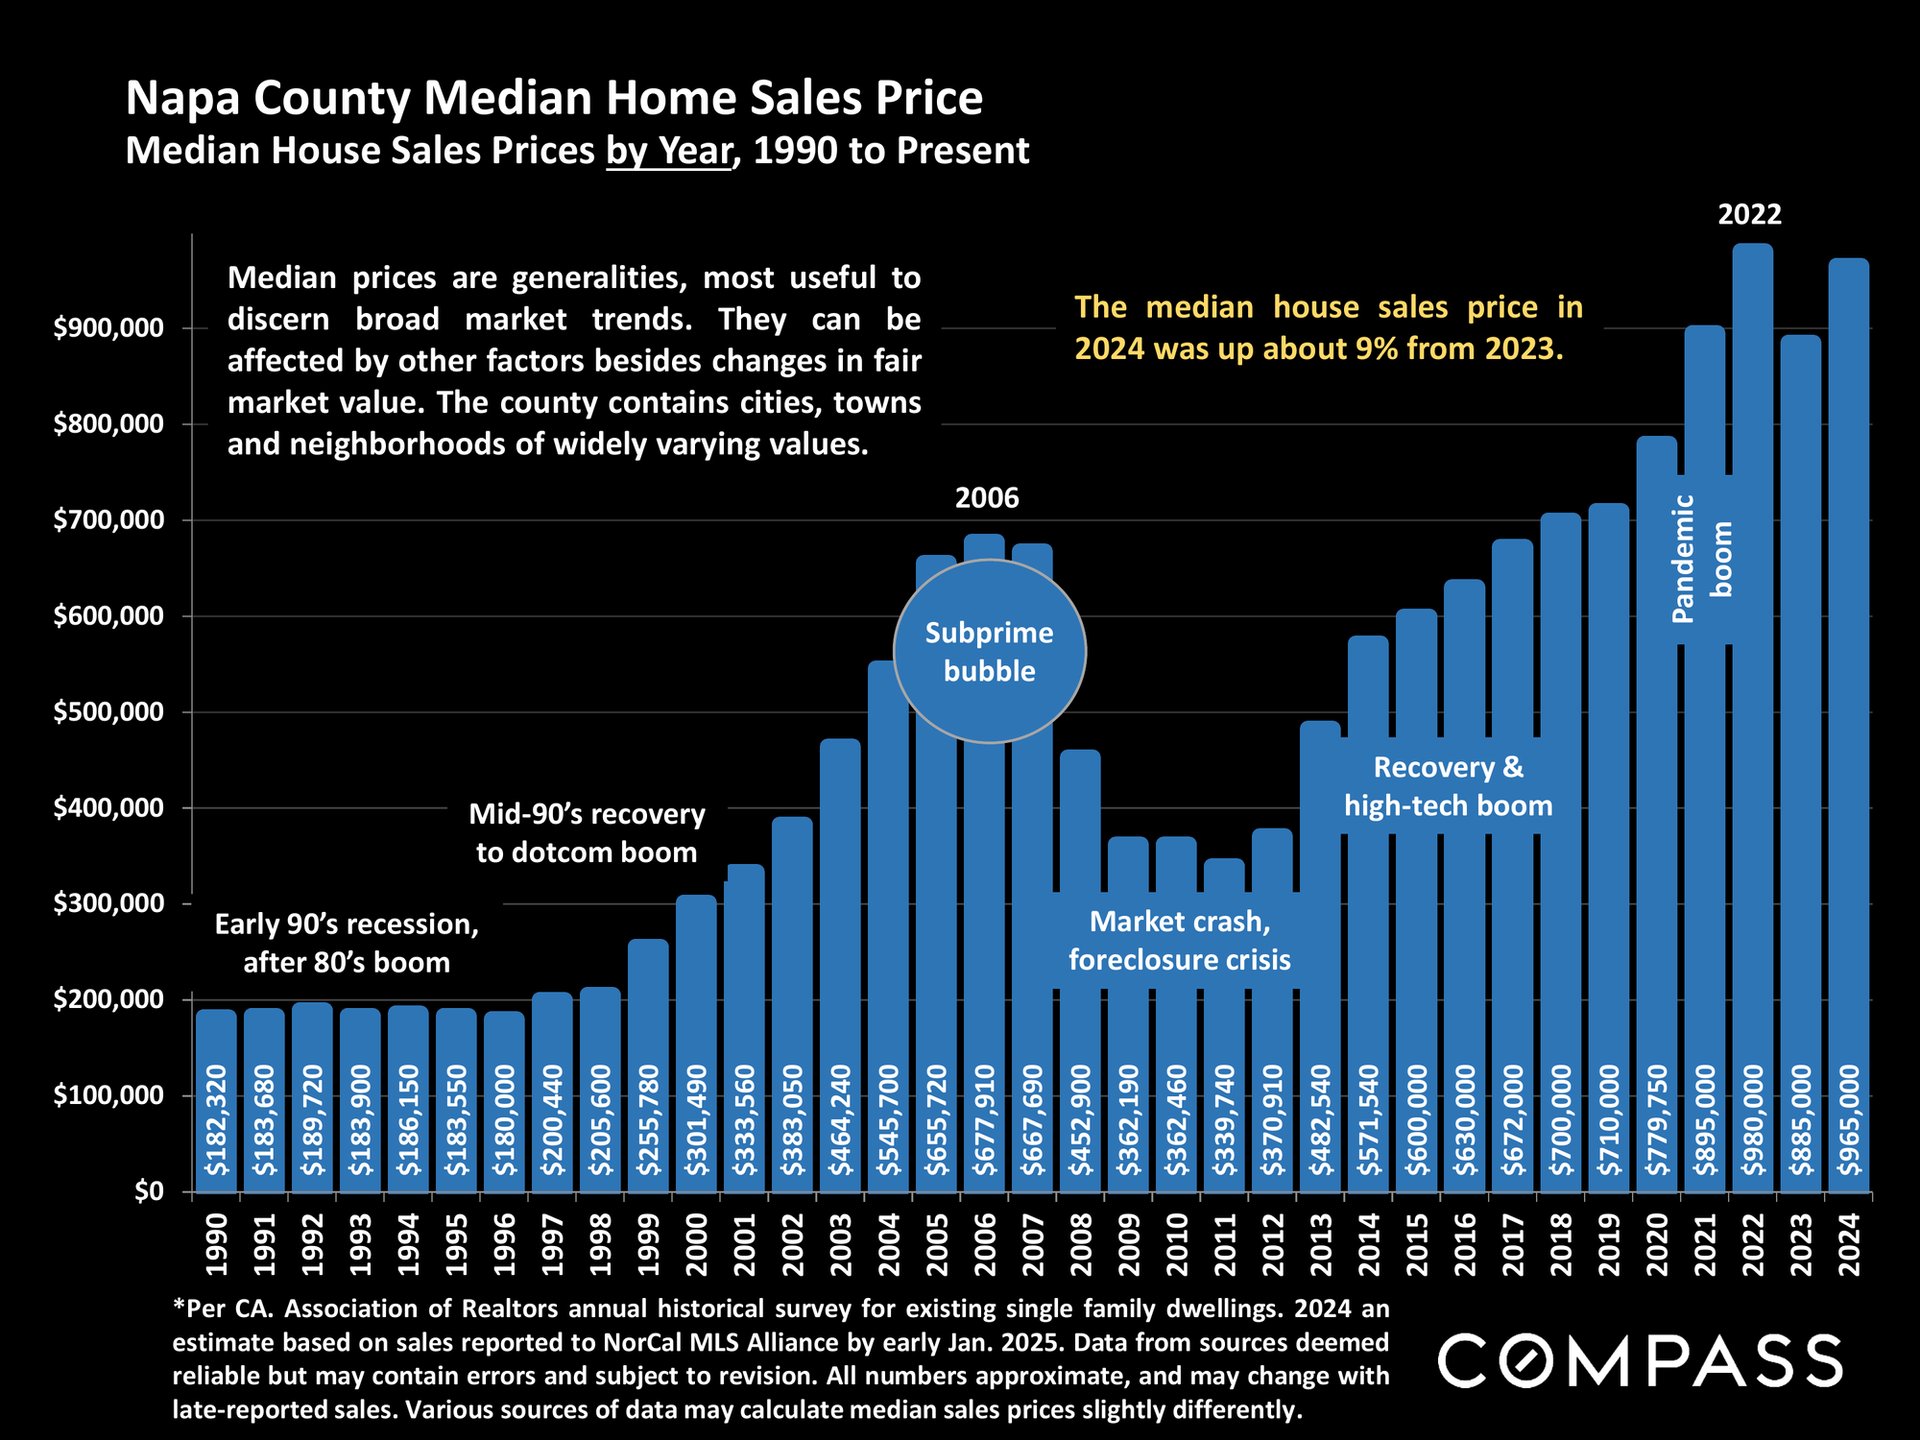
Napa County median home sale prices, 1990–2024, with market milestones and a 9% increase in 2024.
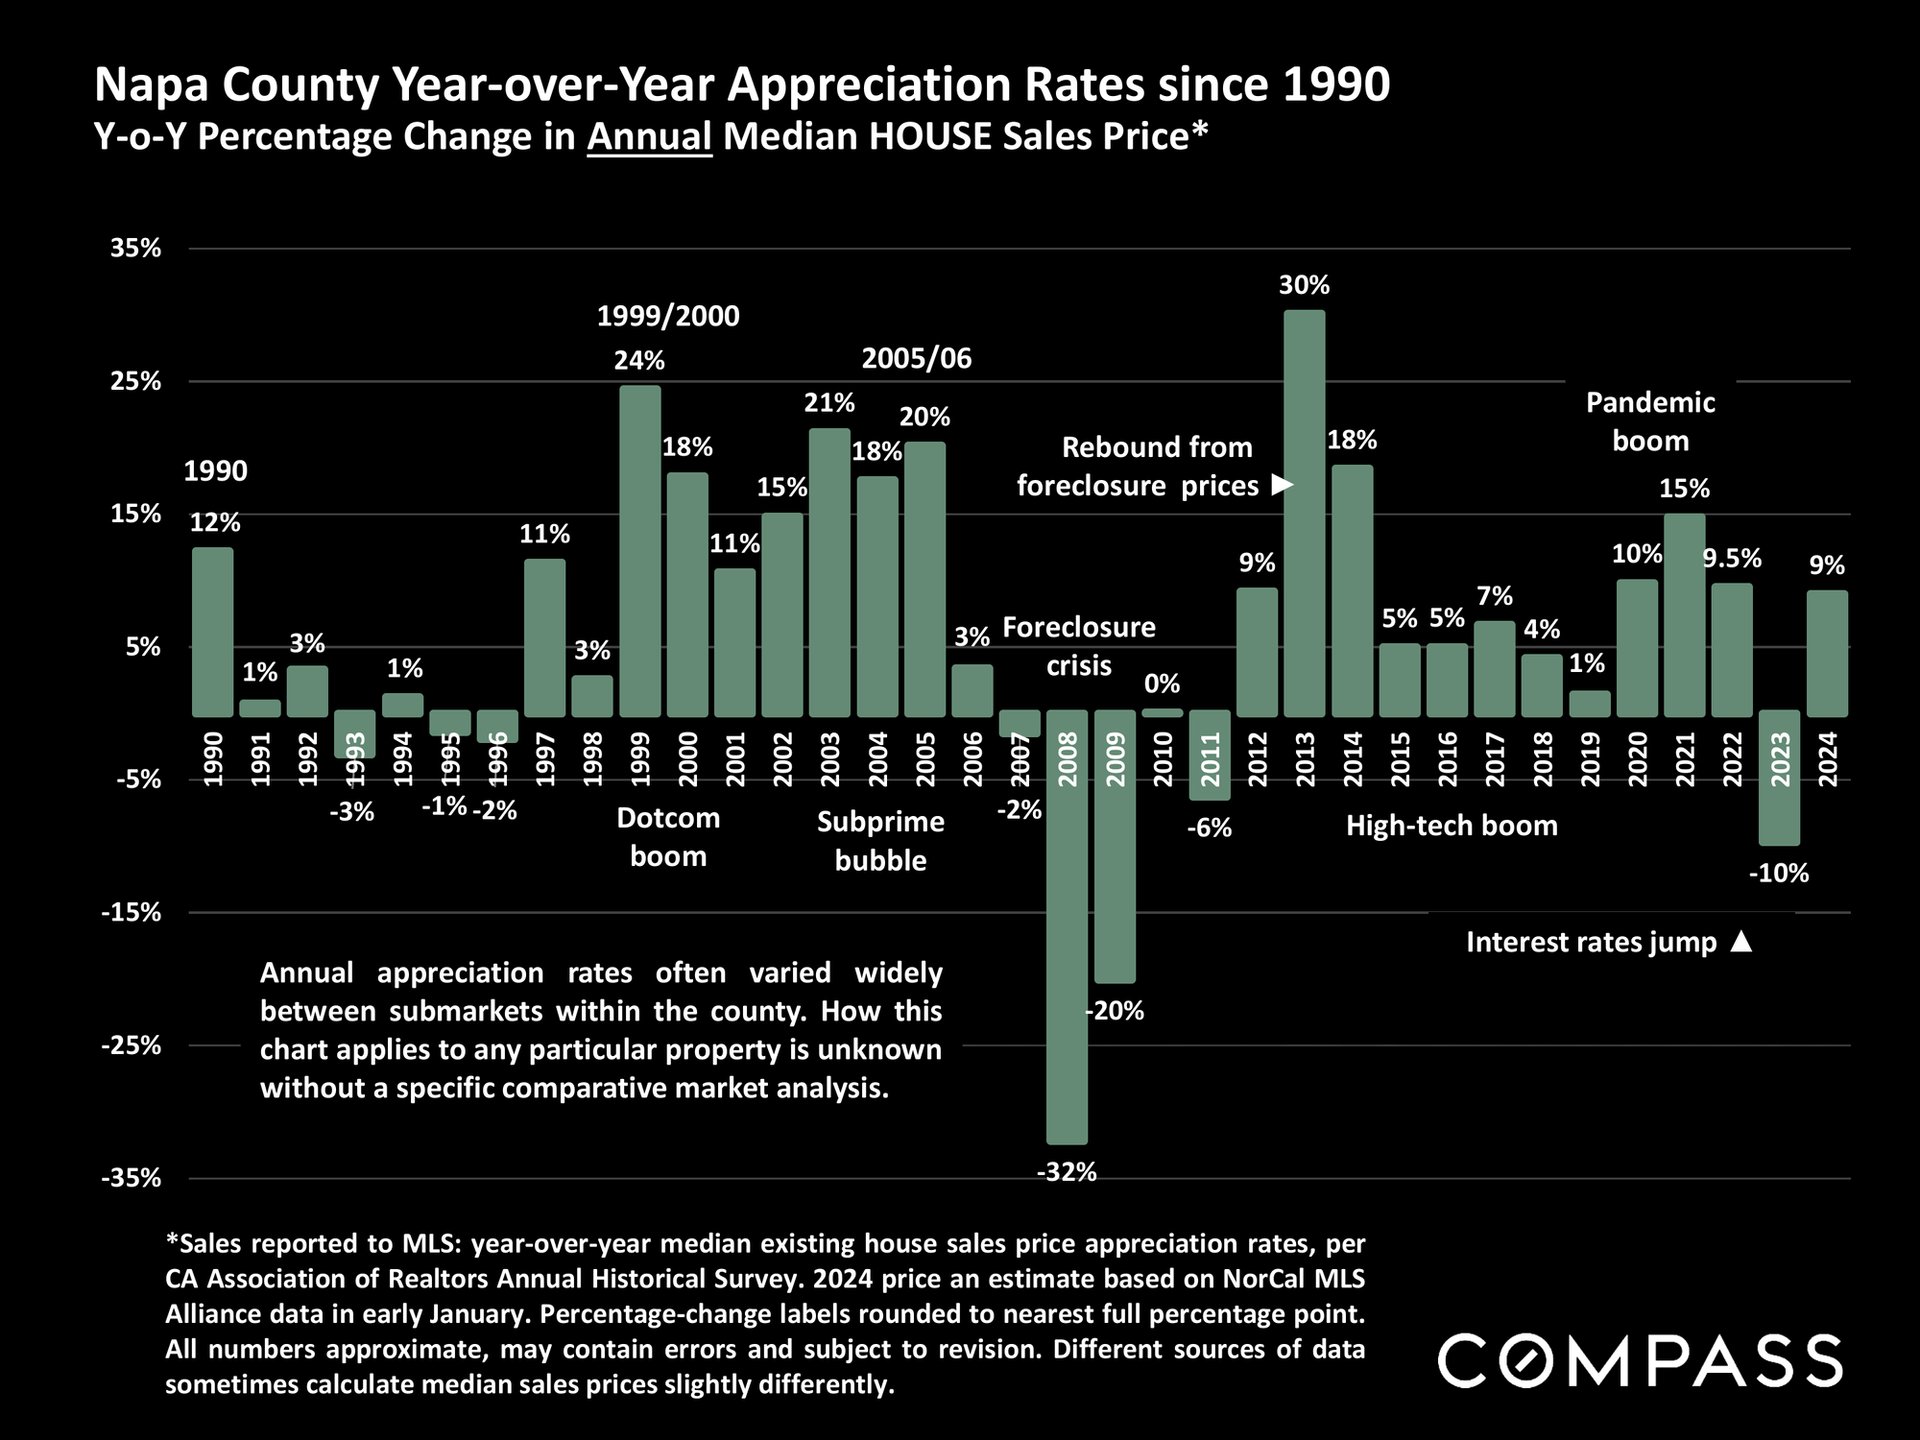
Napa County annual home price appreciation chart, 1990–2024, with a 30% peak in 2013 and 32% decline in 2008.
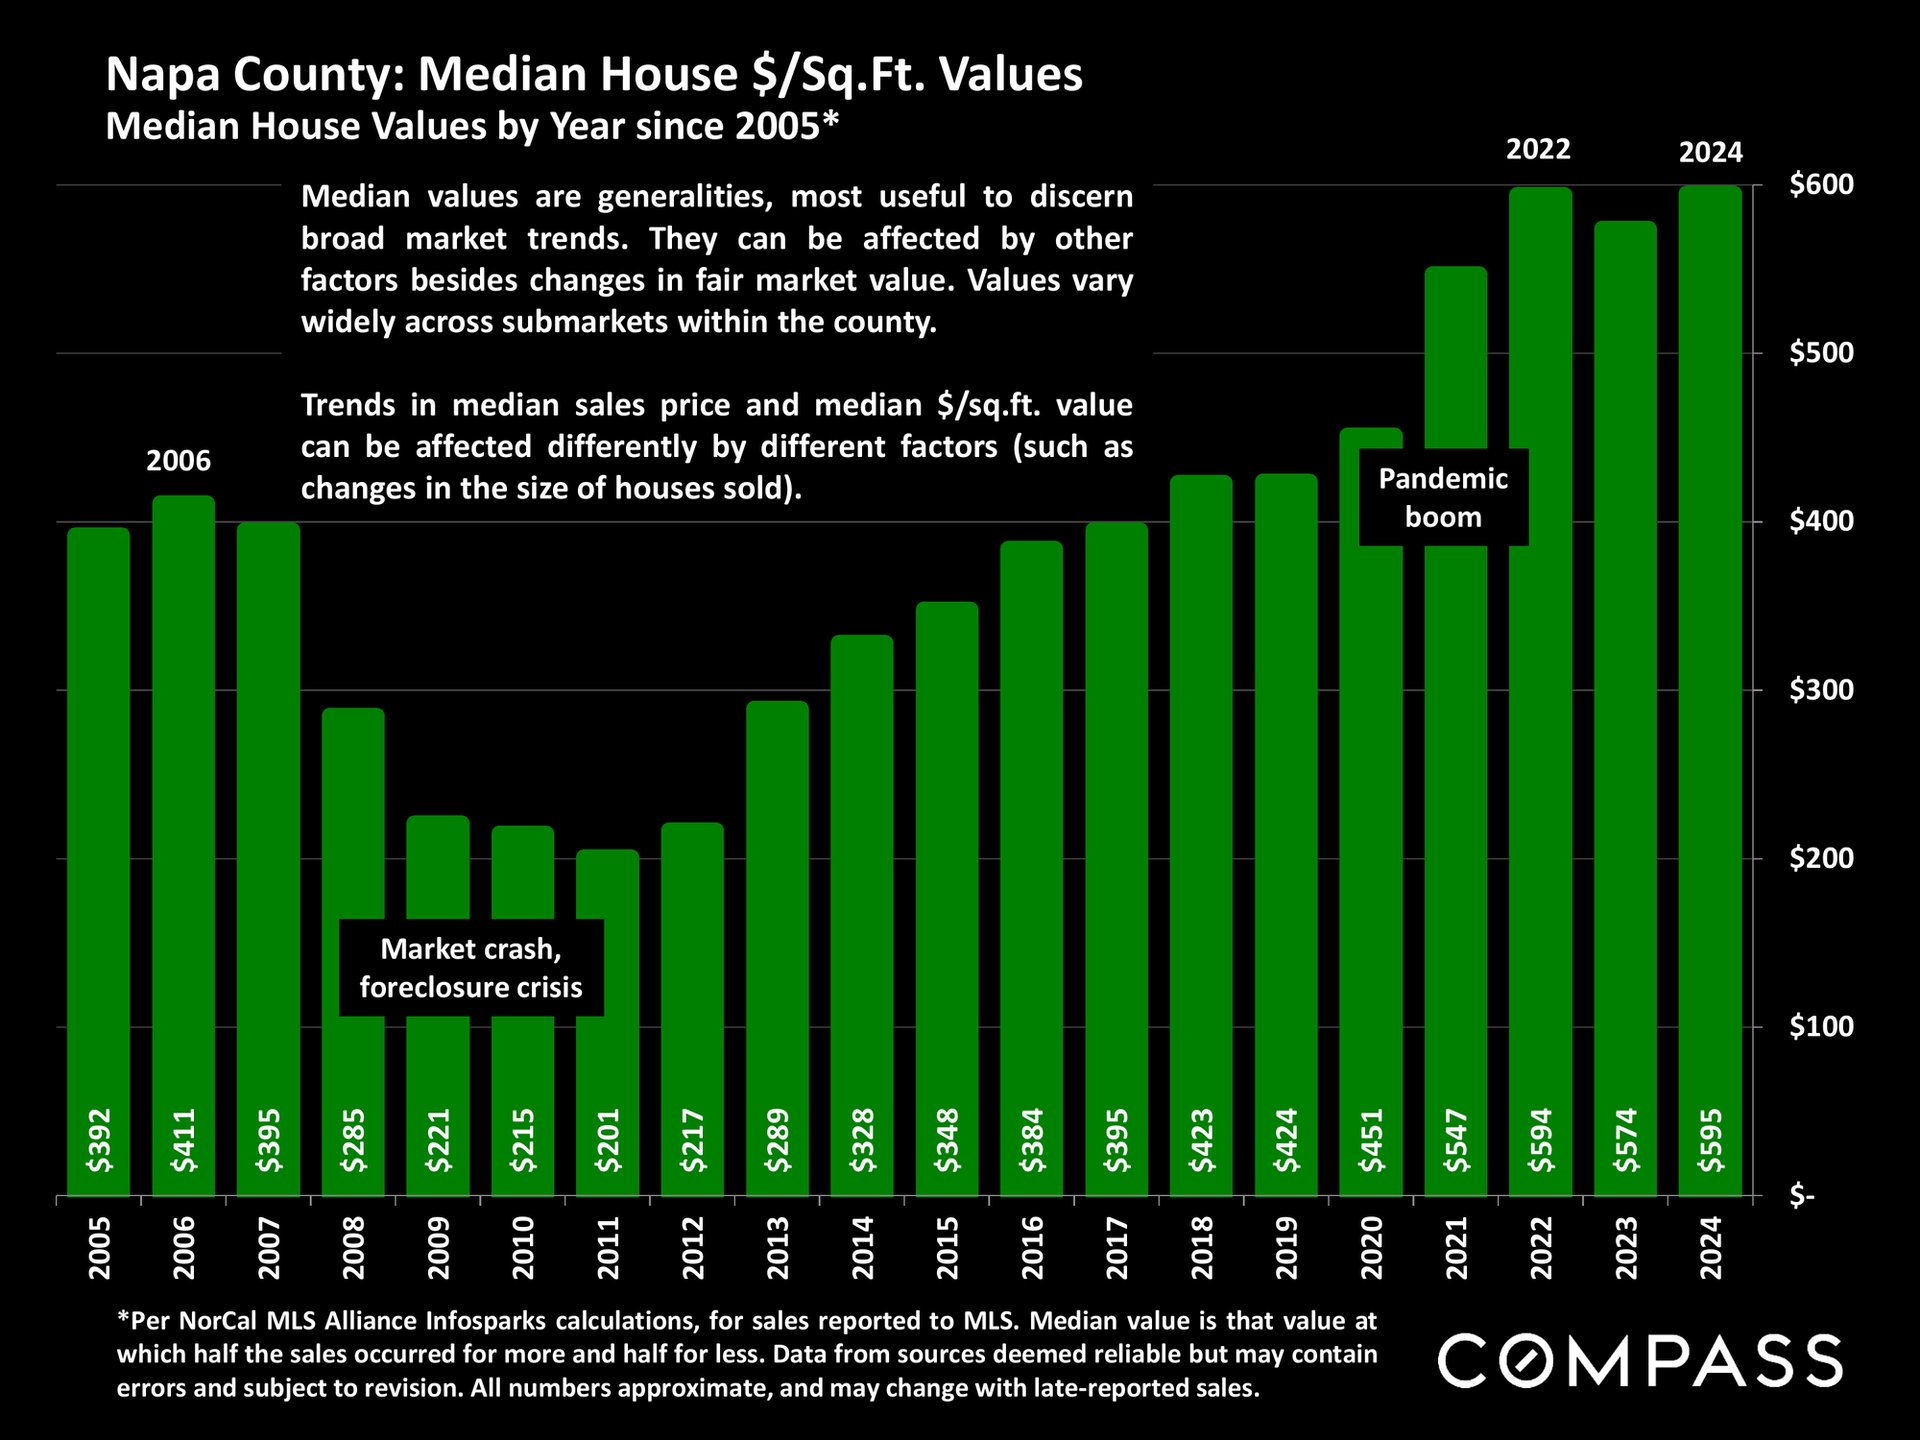
Napa County median house price-per-square-foot chart, with green bars showing annual values from 2005 to 2024.
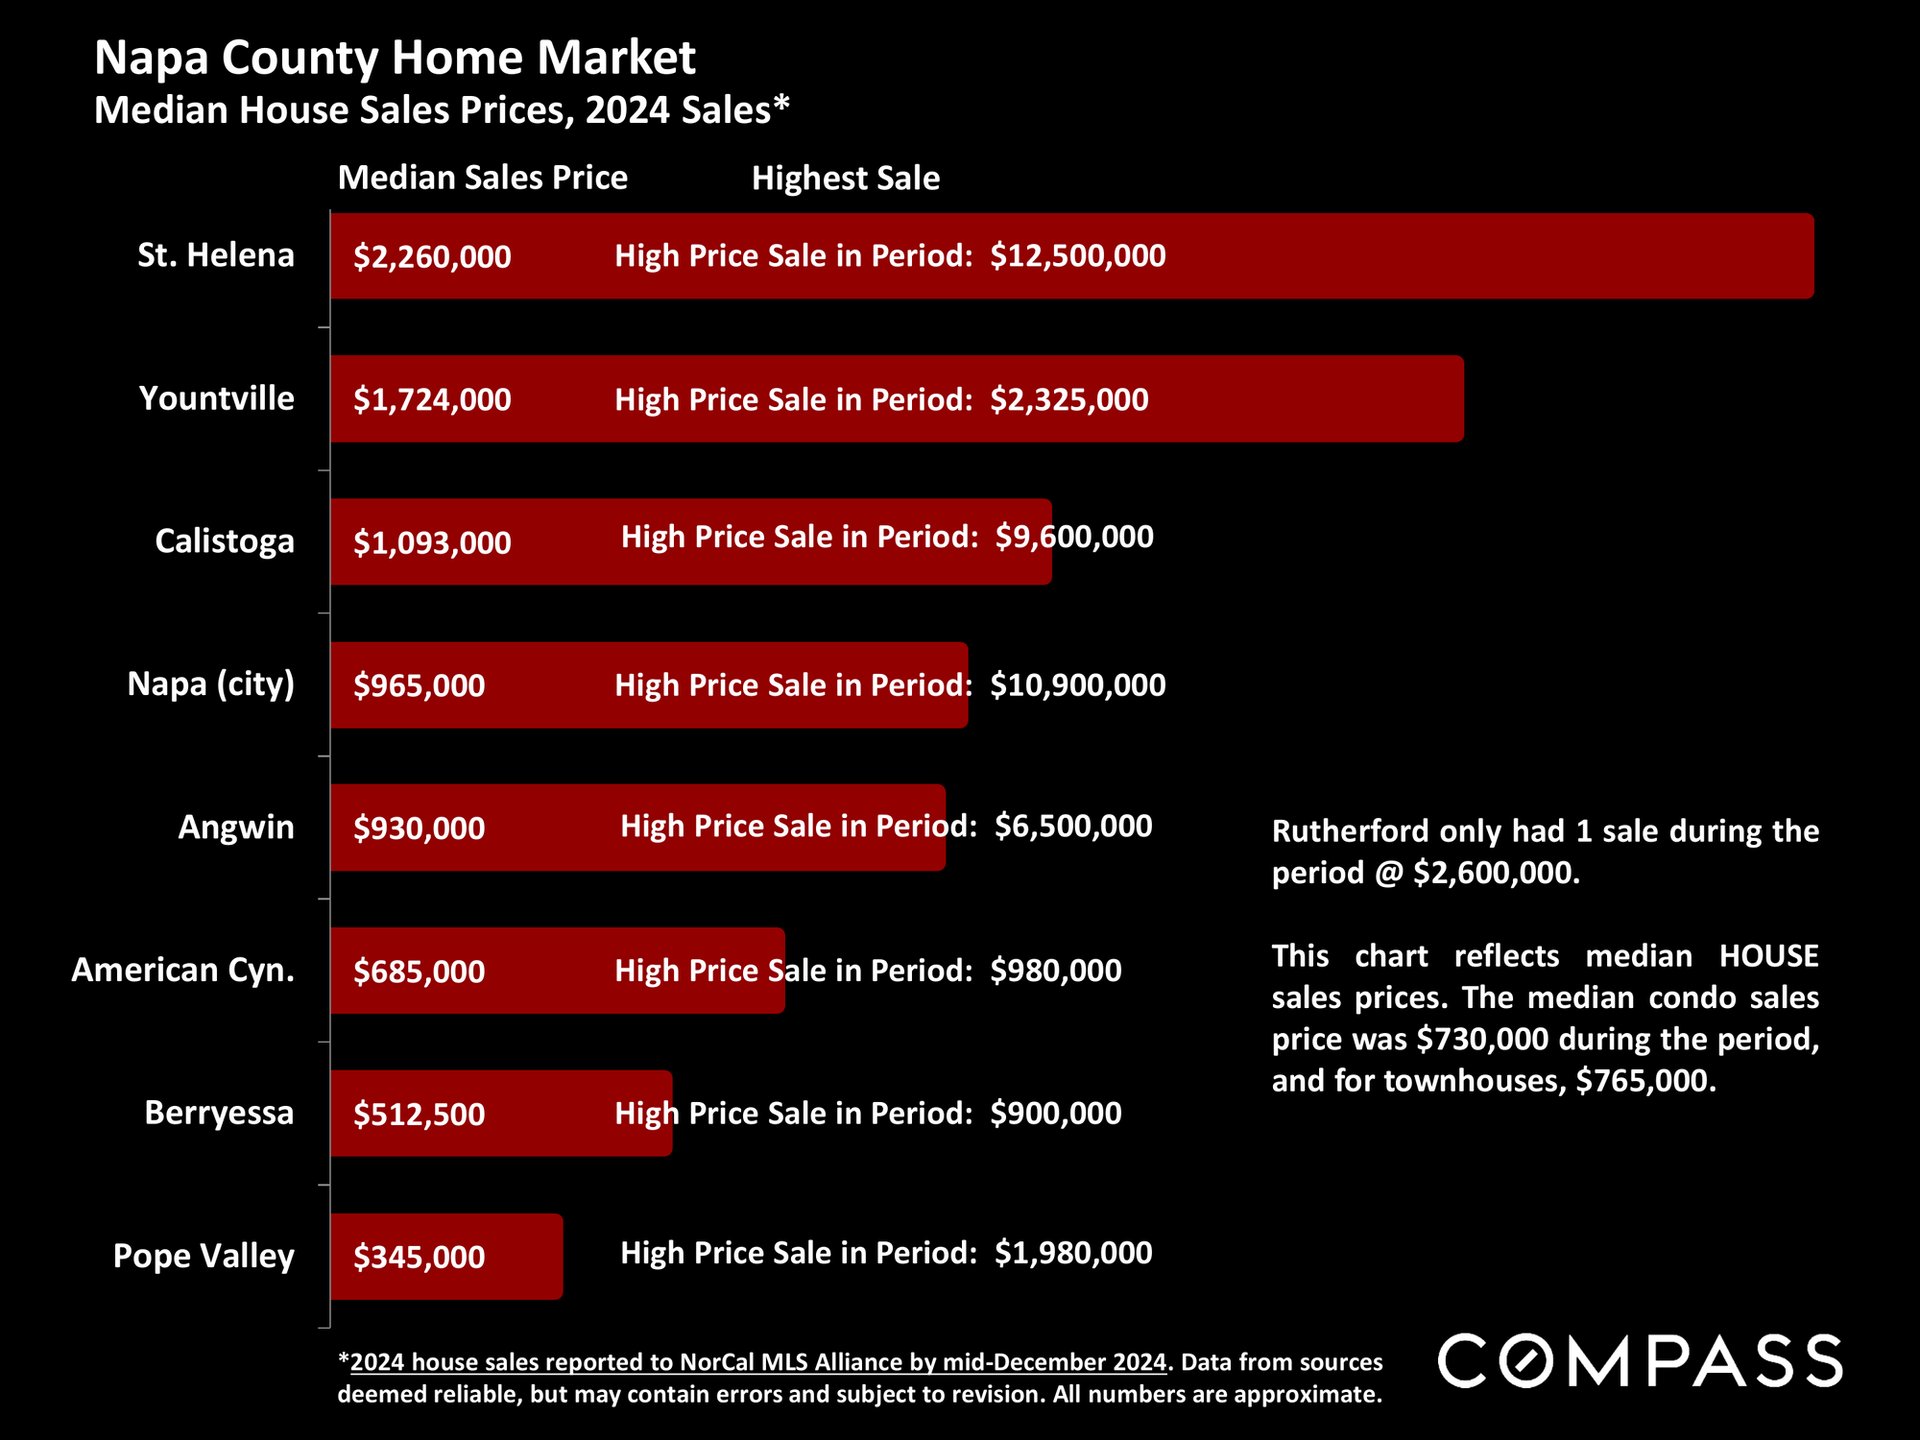
Chart comparing 2024 median house sale prices and highest sales across Napa County communities.
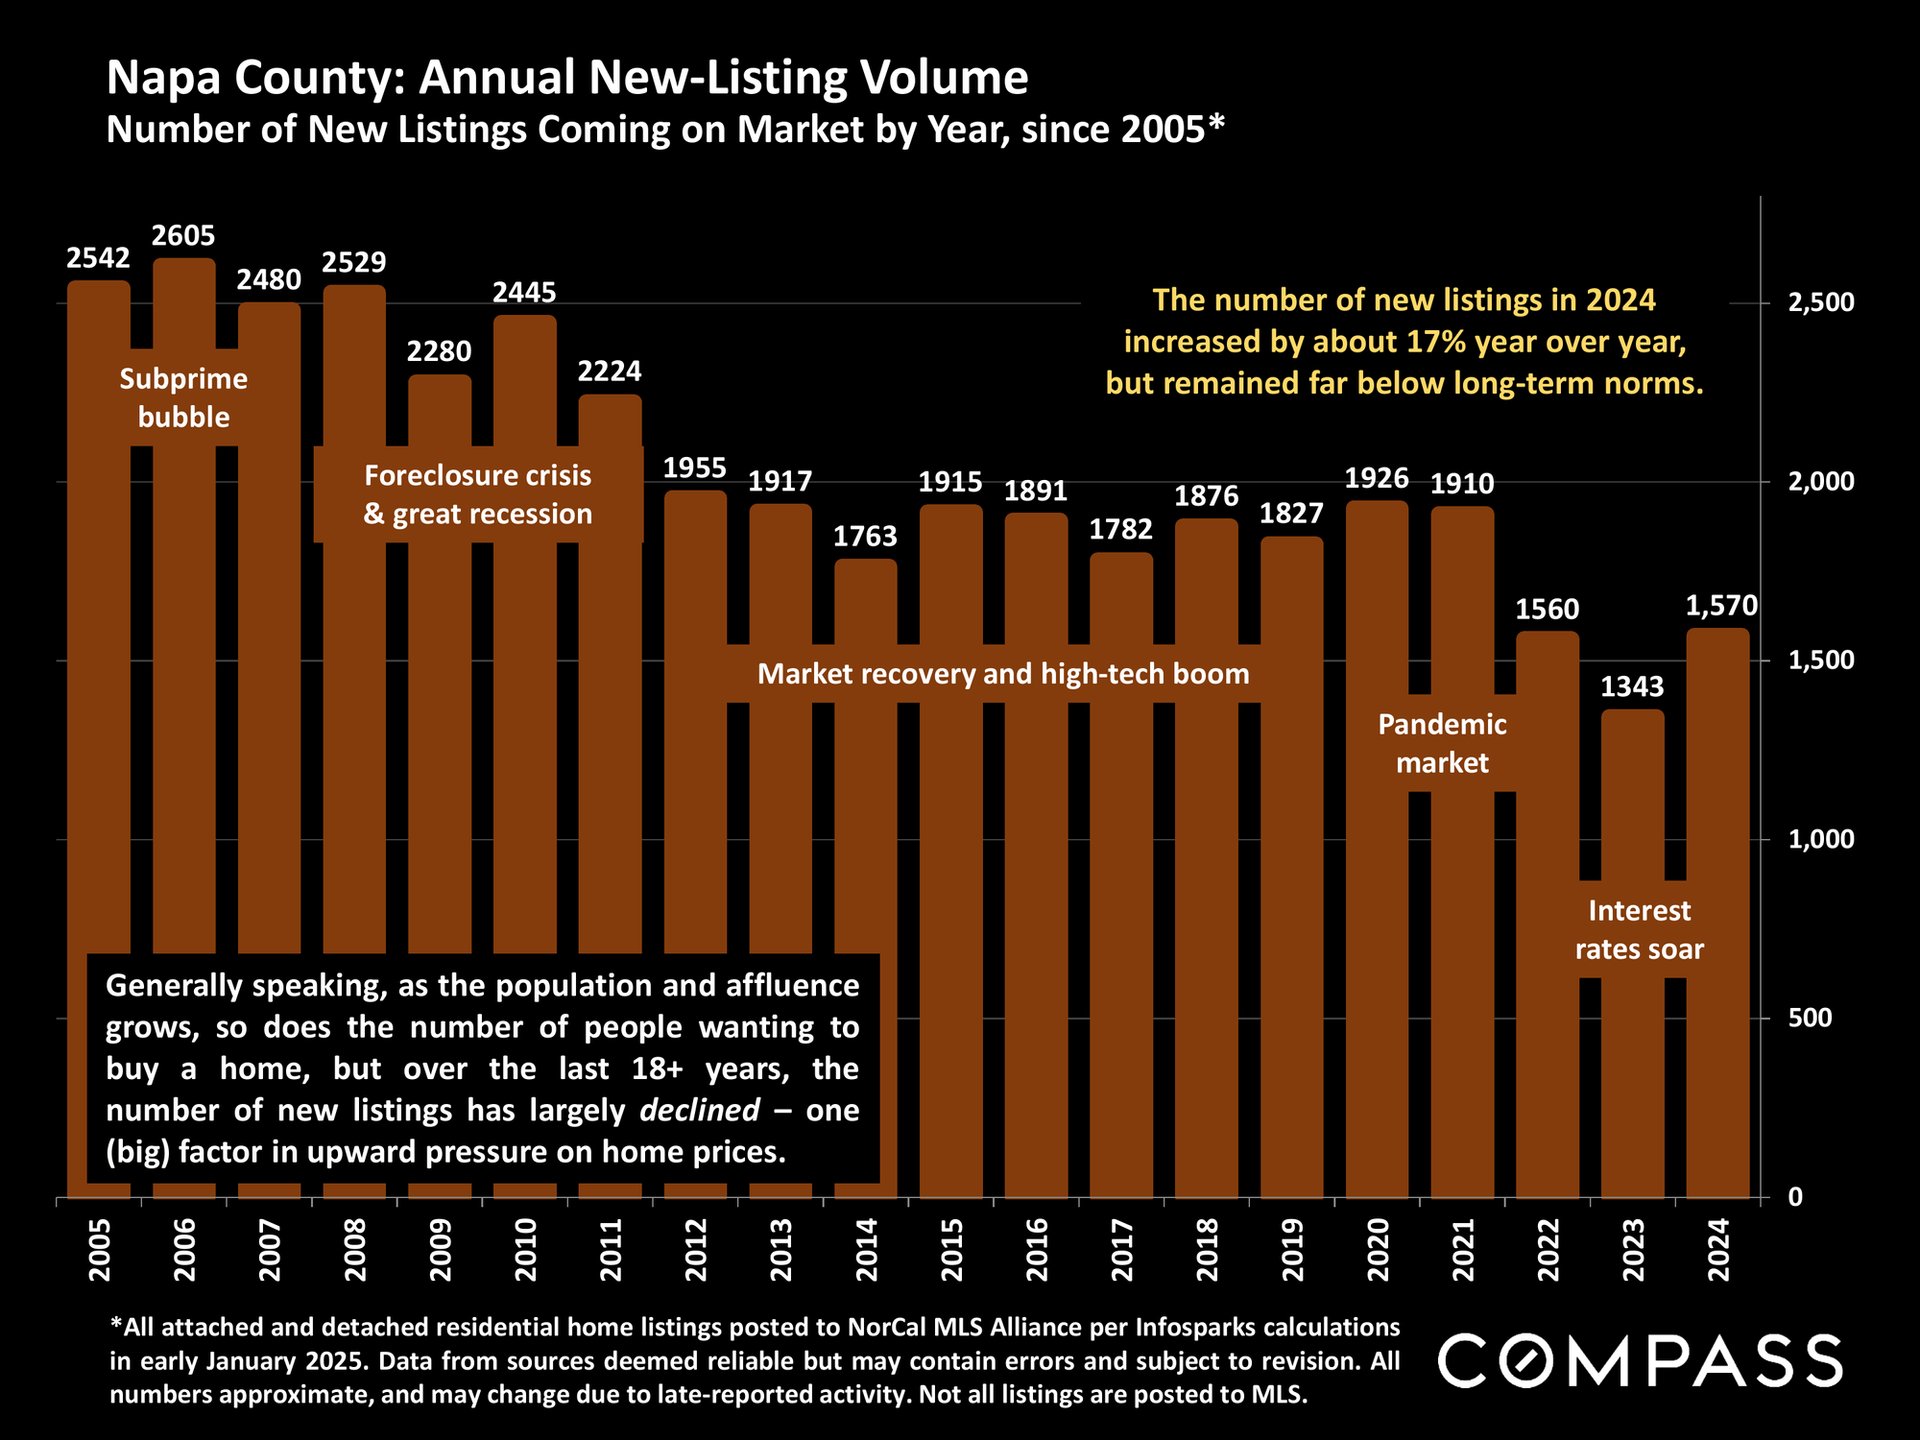
Chart of Napa County new listings from 2005–2024, showing a long-term decline and a 17% increase in 2024.
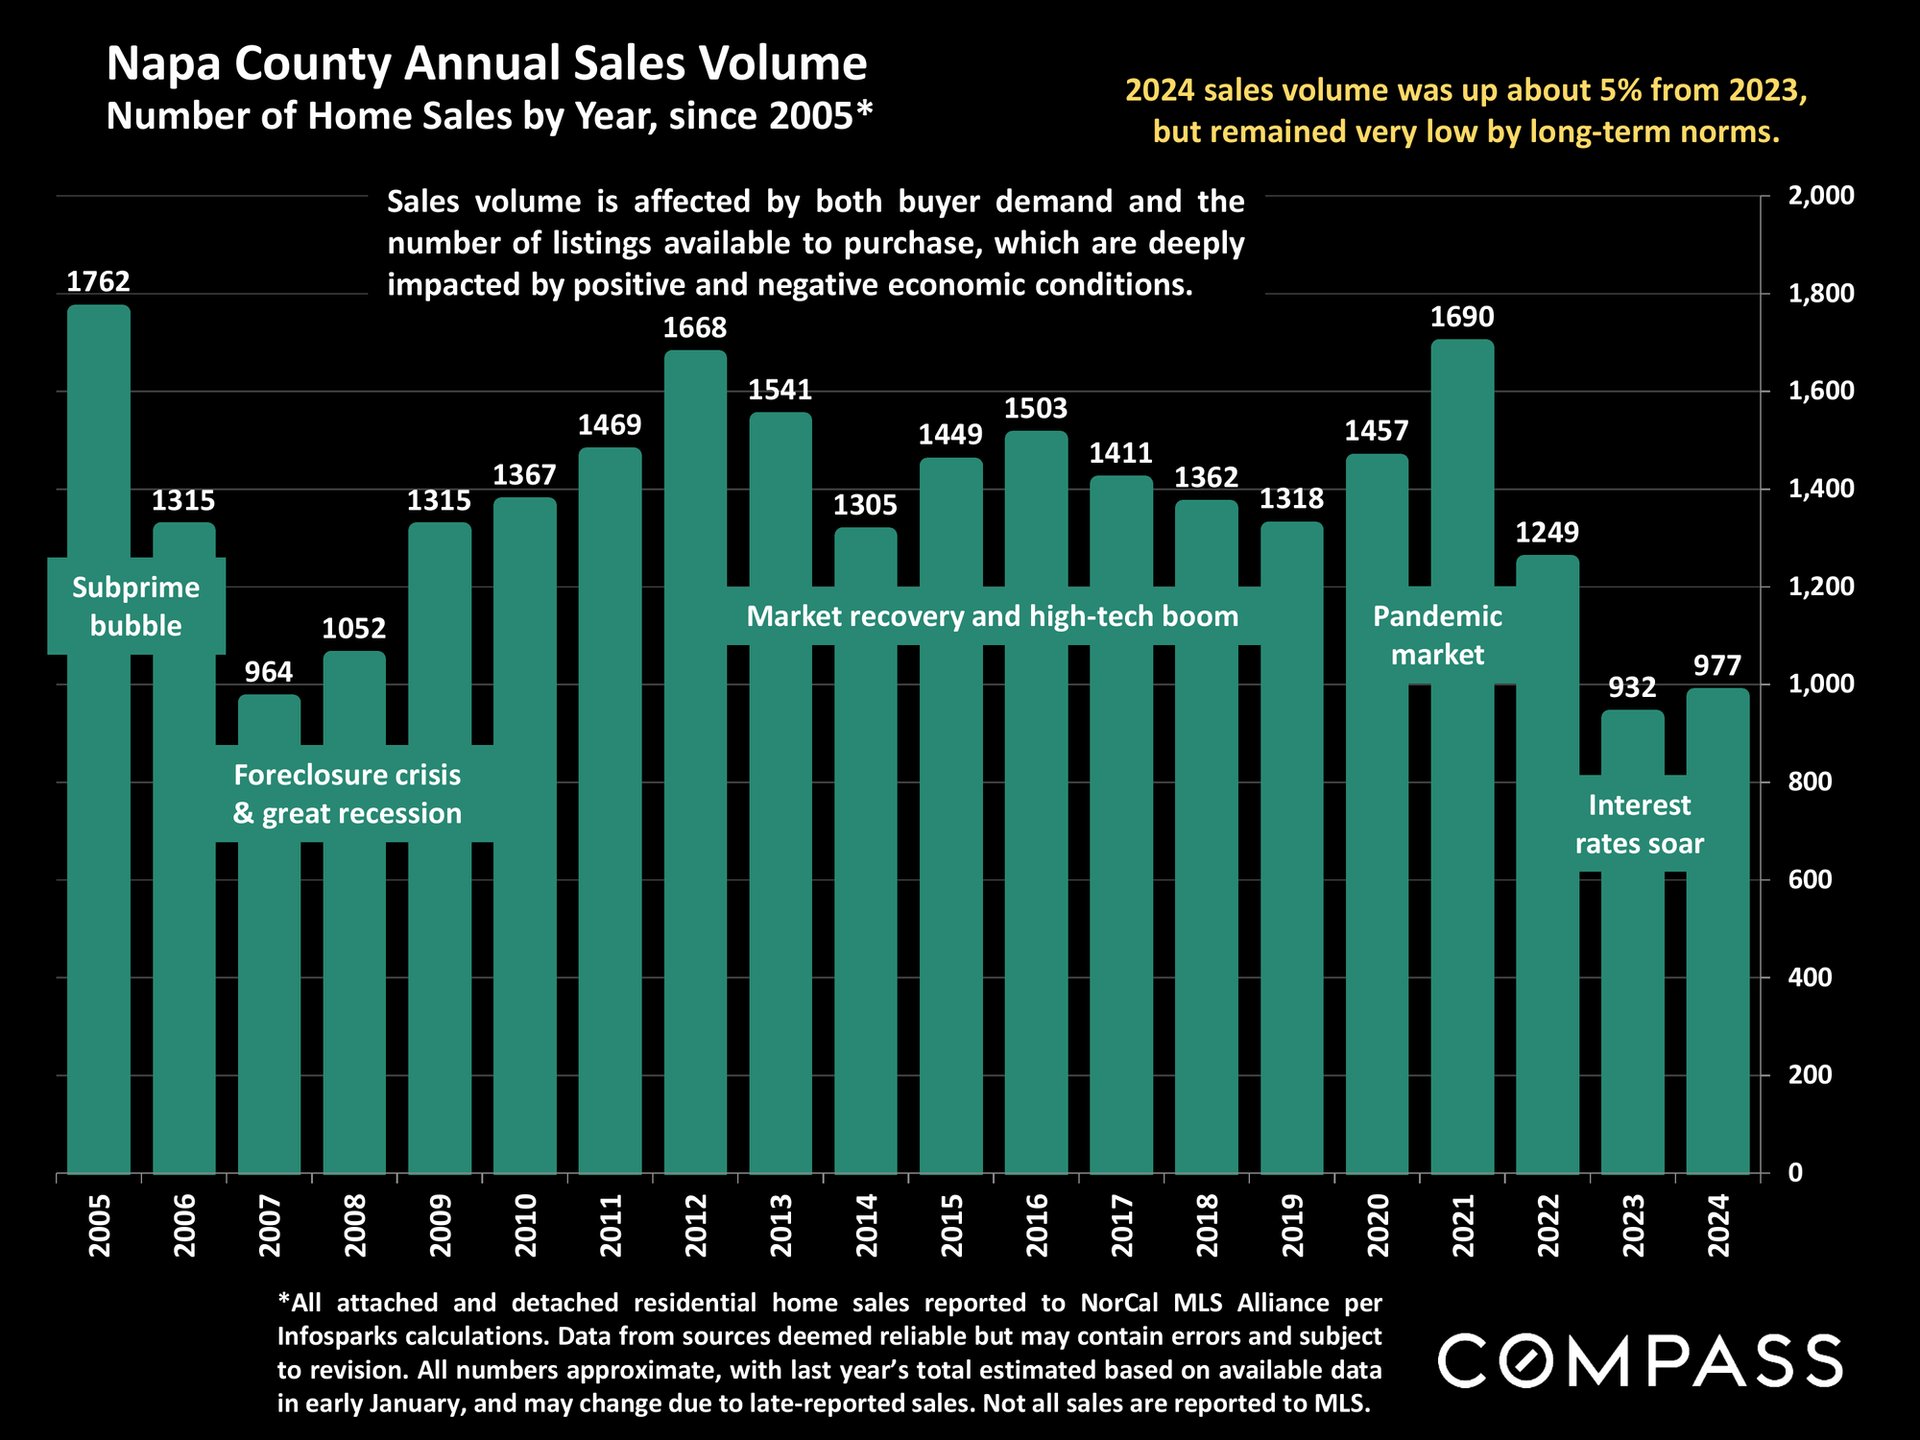
Chart of Napa County home sales by year, with 977 sales in 2024, up about 5% from 2023.
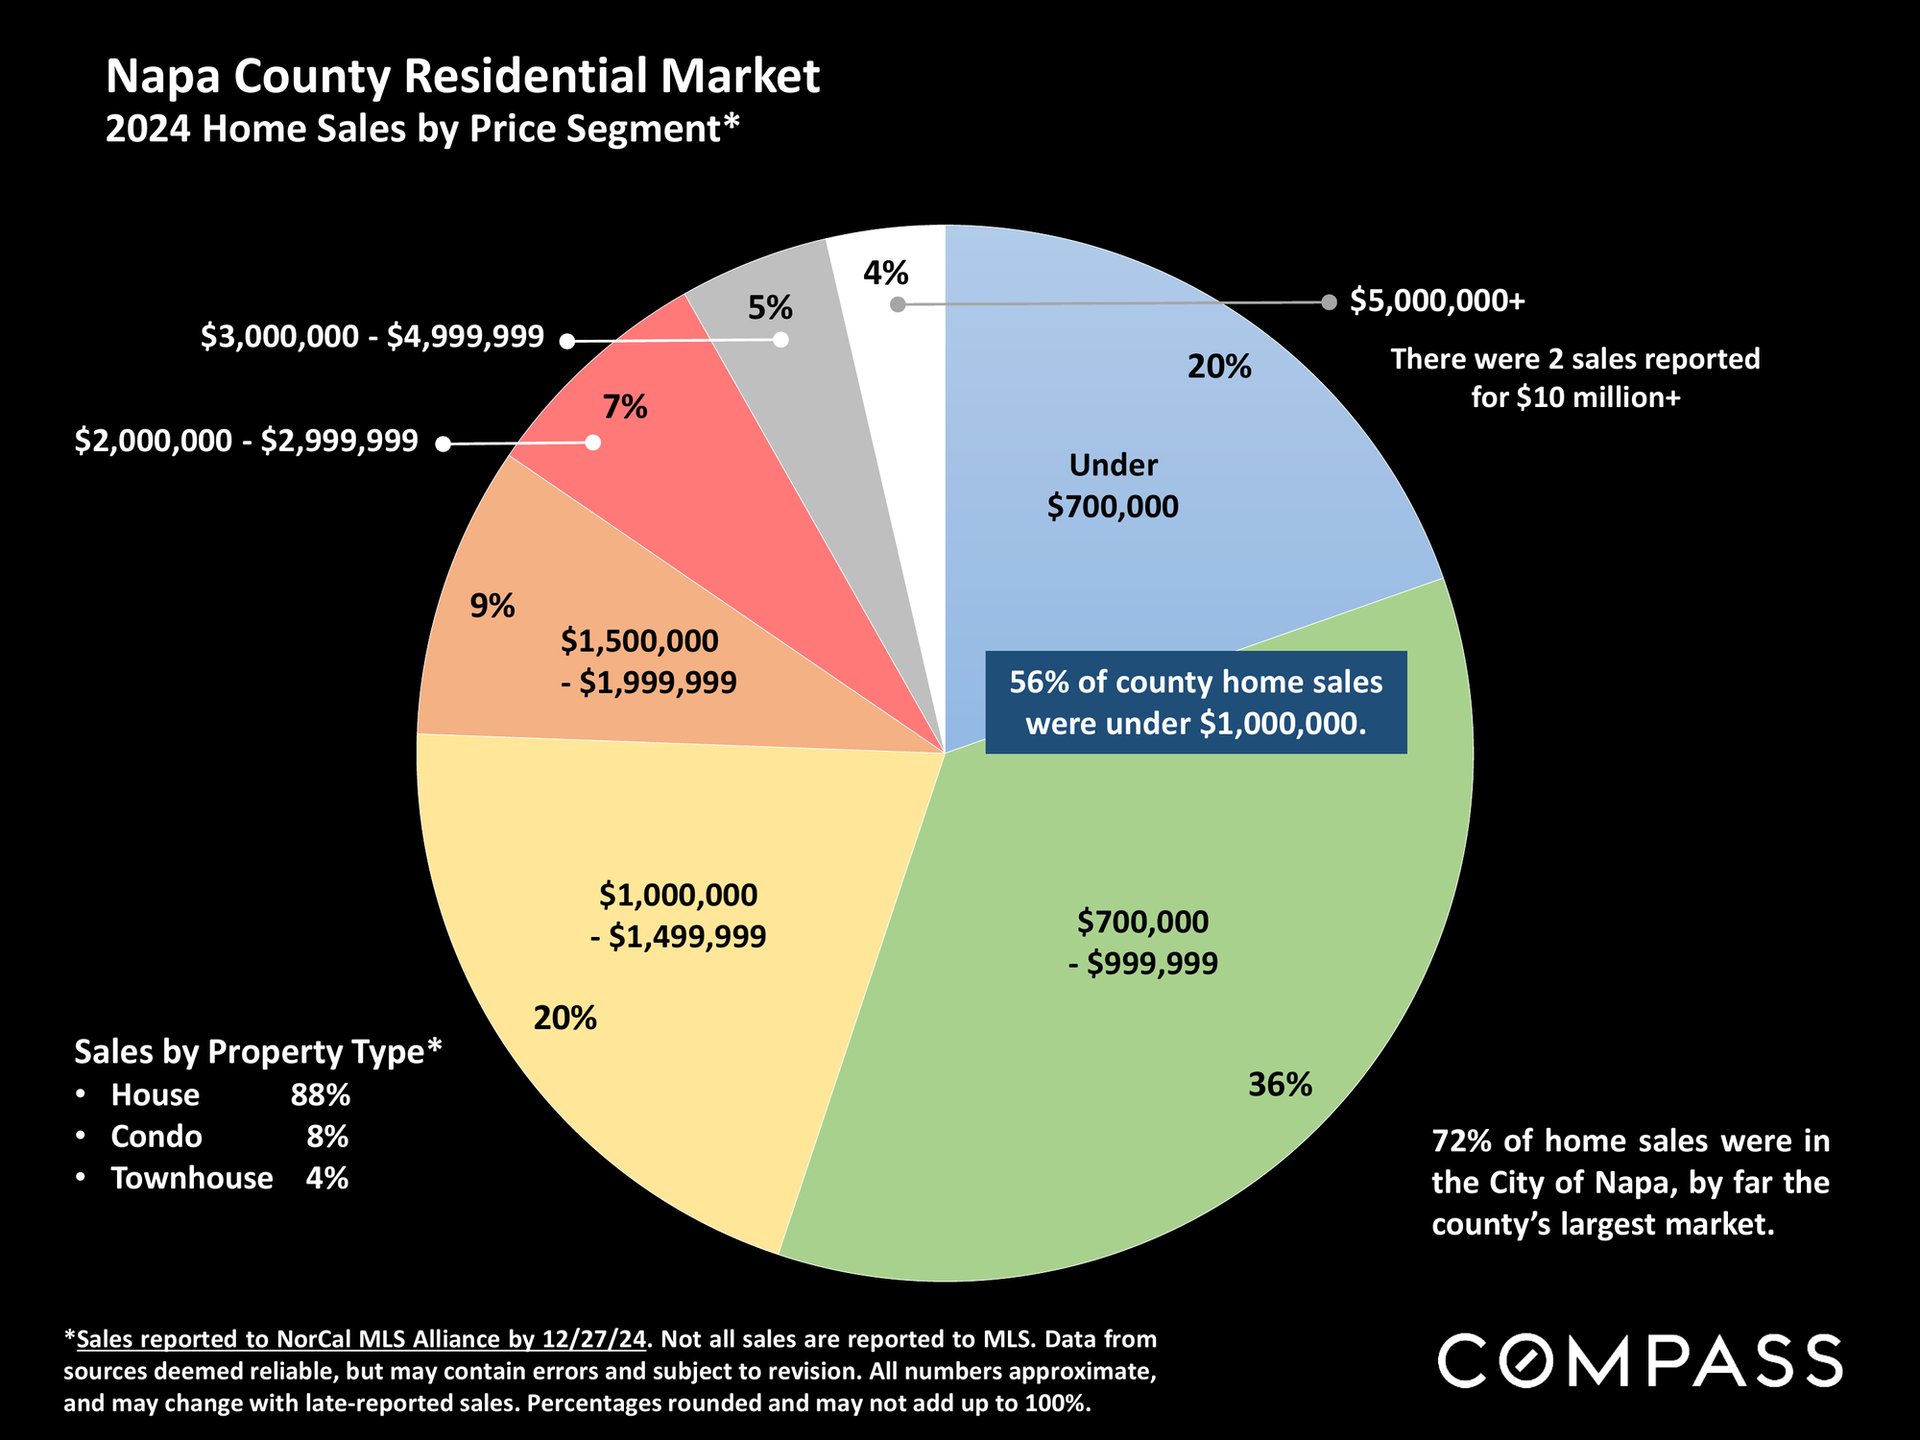
Napa County 2024 home sales price-segment pie chart, with 56% under $1 million and 72% in the City of Napa.
Chart of Napa County luxury home sales from 2005–2024, with $3 million-plus sales in gold and $5 million-plus sales in green.
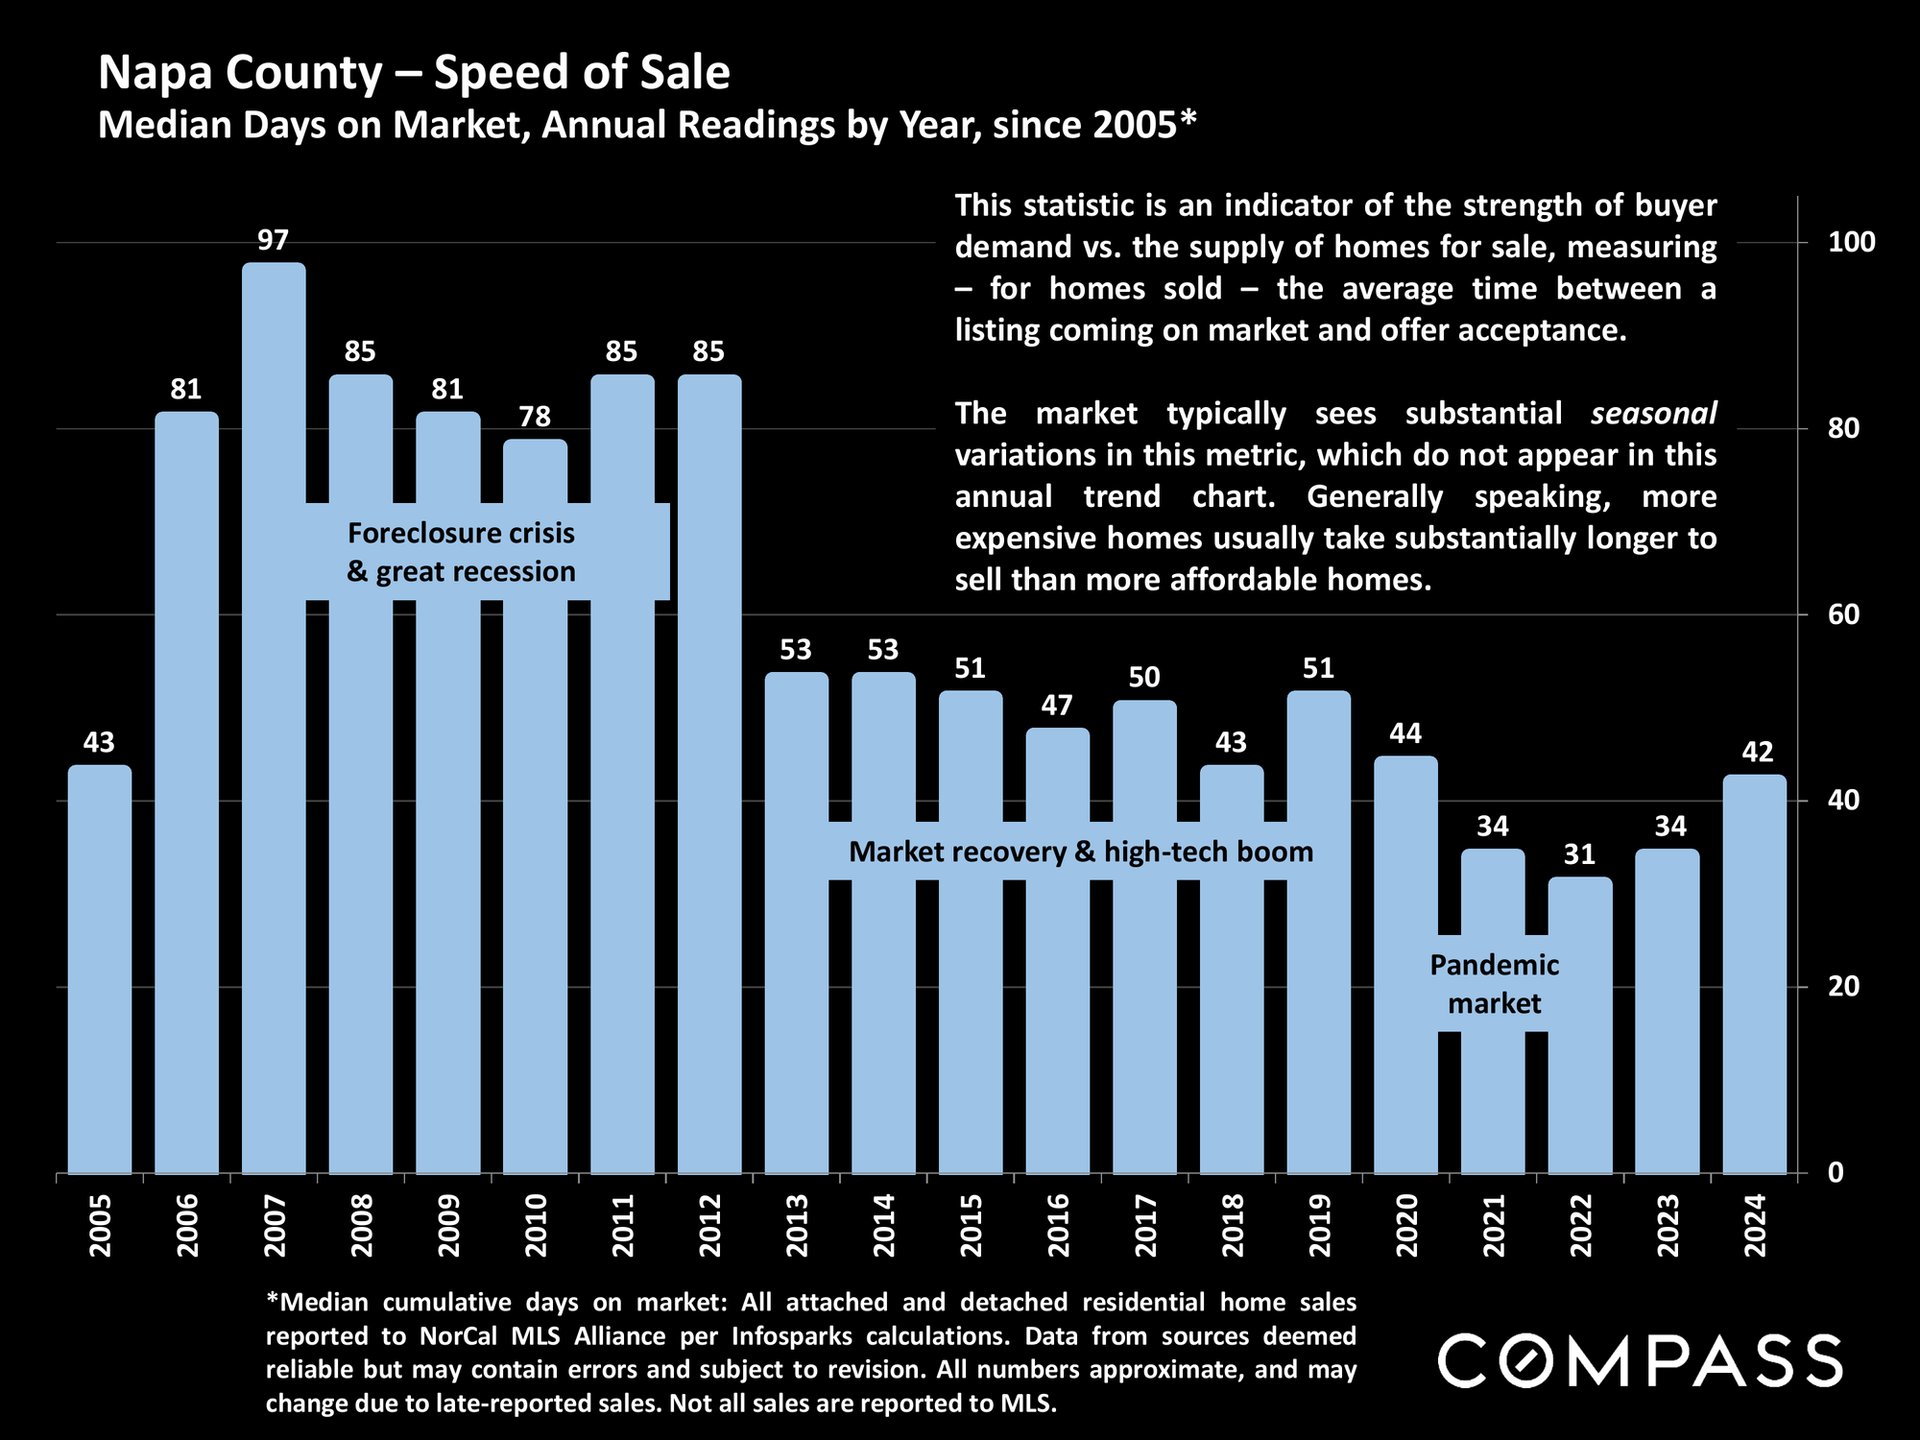
Napa County median days on market, 2005–2024, with historical market annotations.
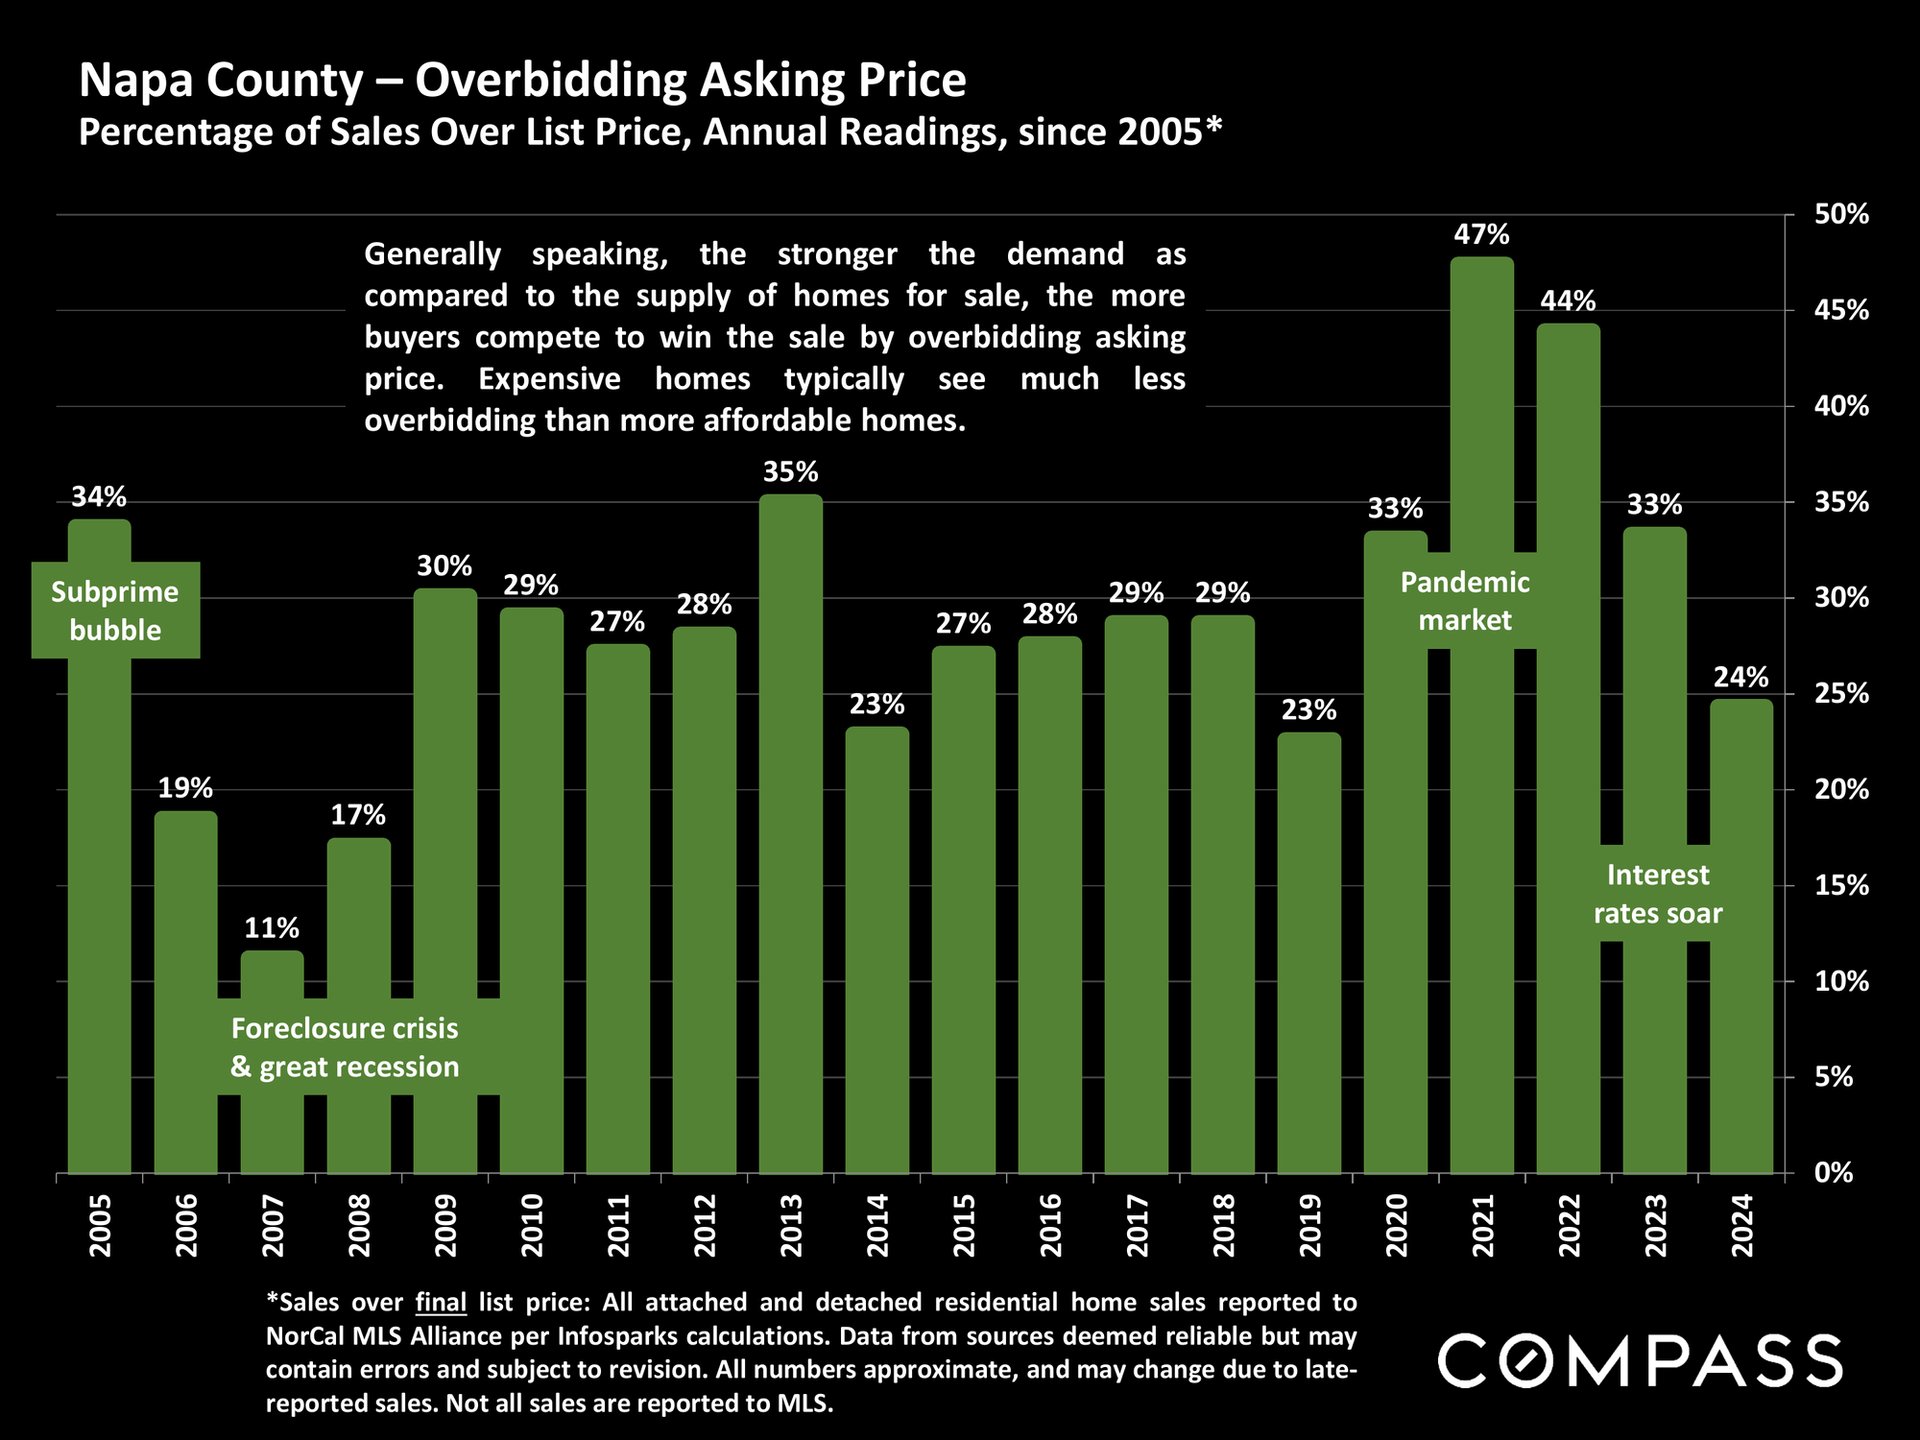
Bar chart of Napa County home sales over list price, peaking at 47% in 2021 and falling to 24% in 2024.
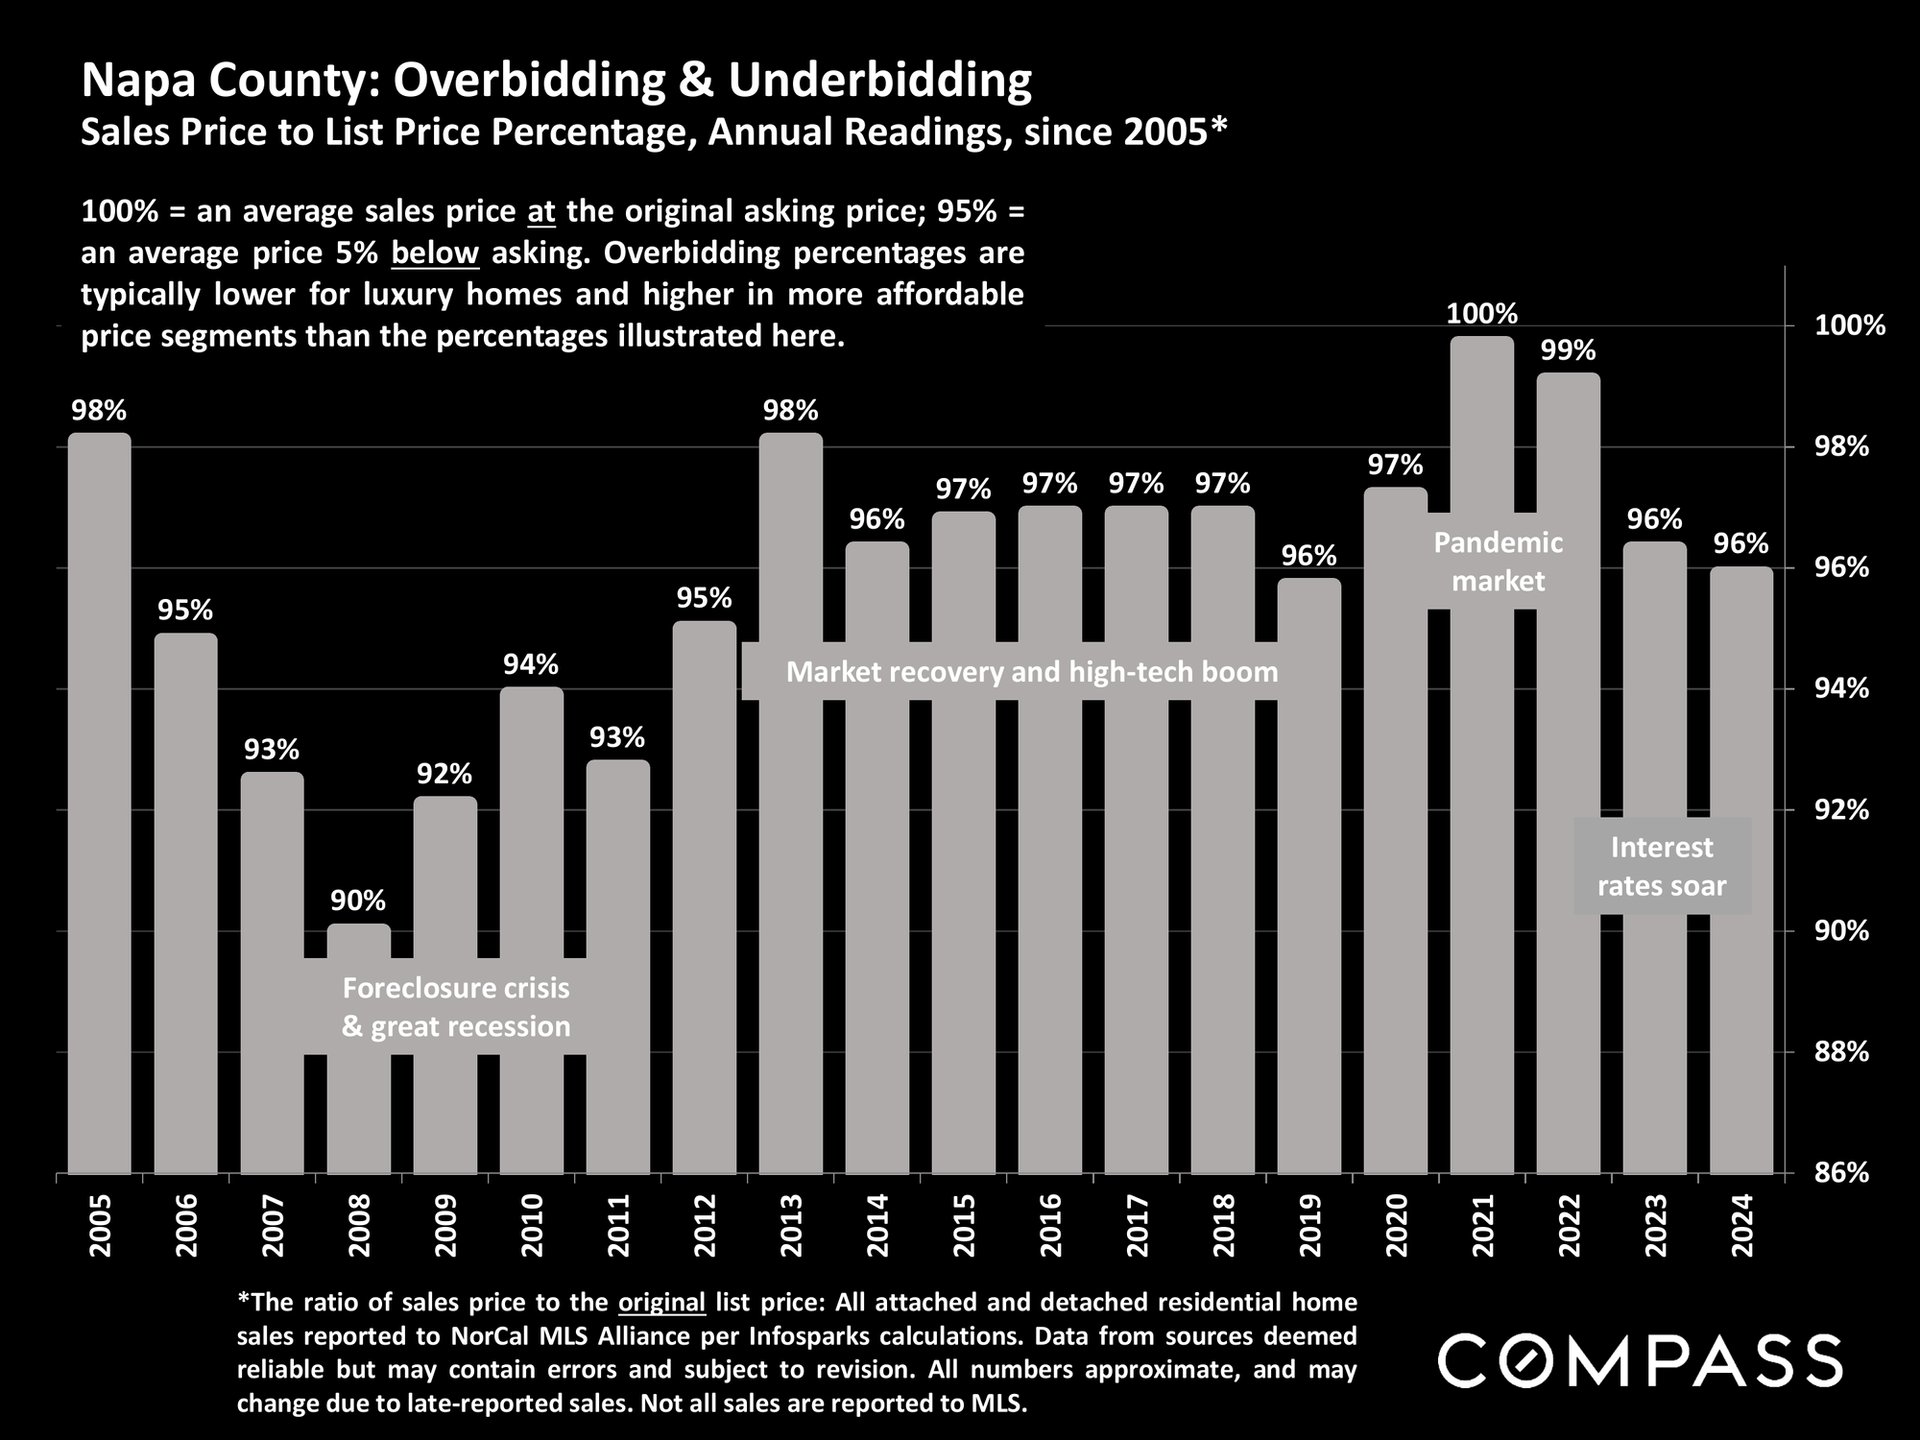
Napa County sales-to-list price chart, 2005–2024, with pandemic market and foreclosure crisis annotations.
Chart compares 2024 median home prices and price per square foot across 11 Bay Area counties, highlighting Napa County.
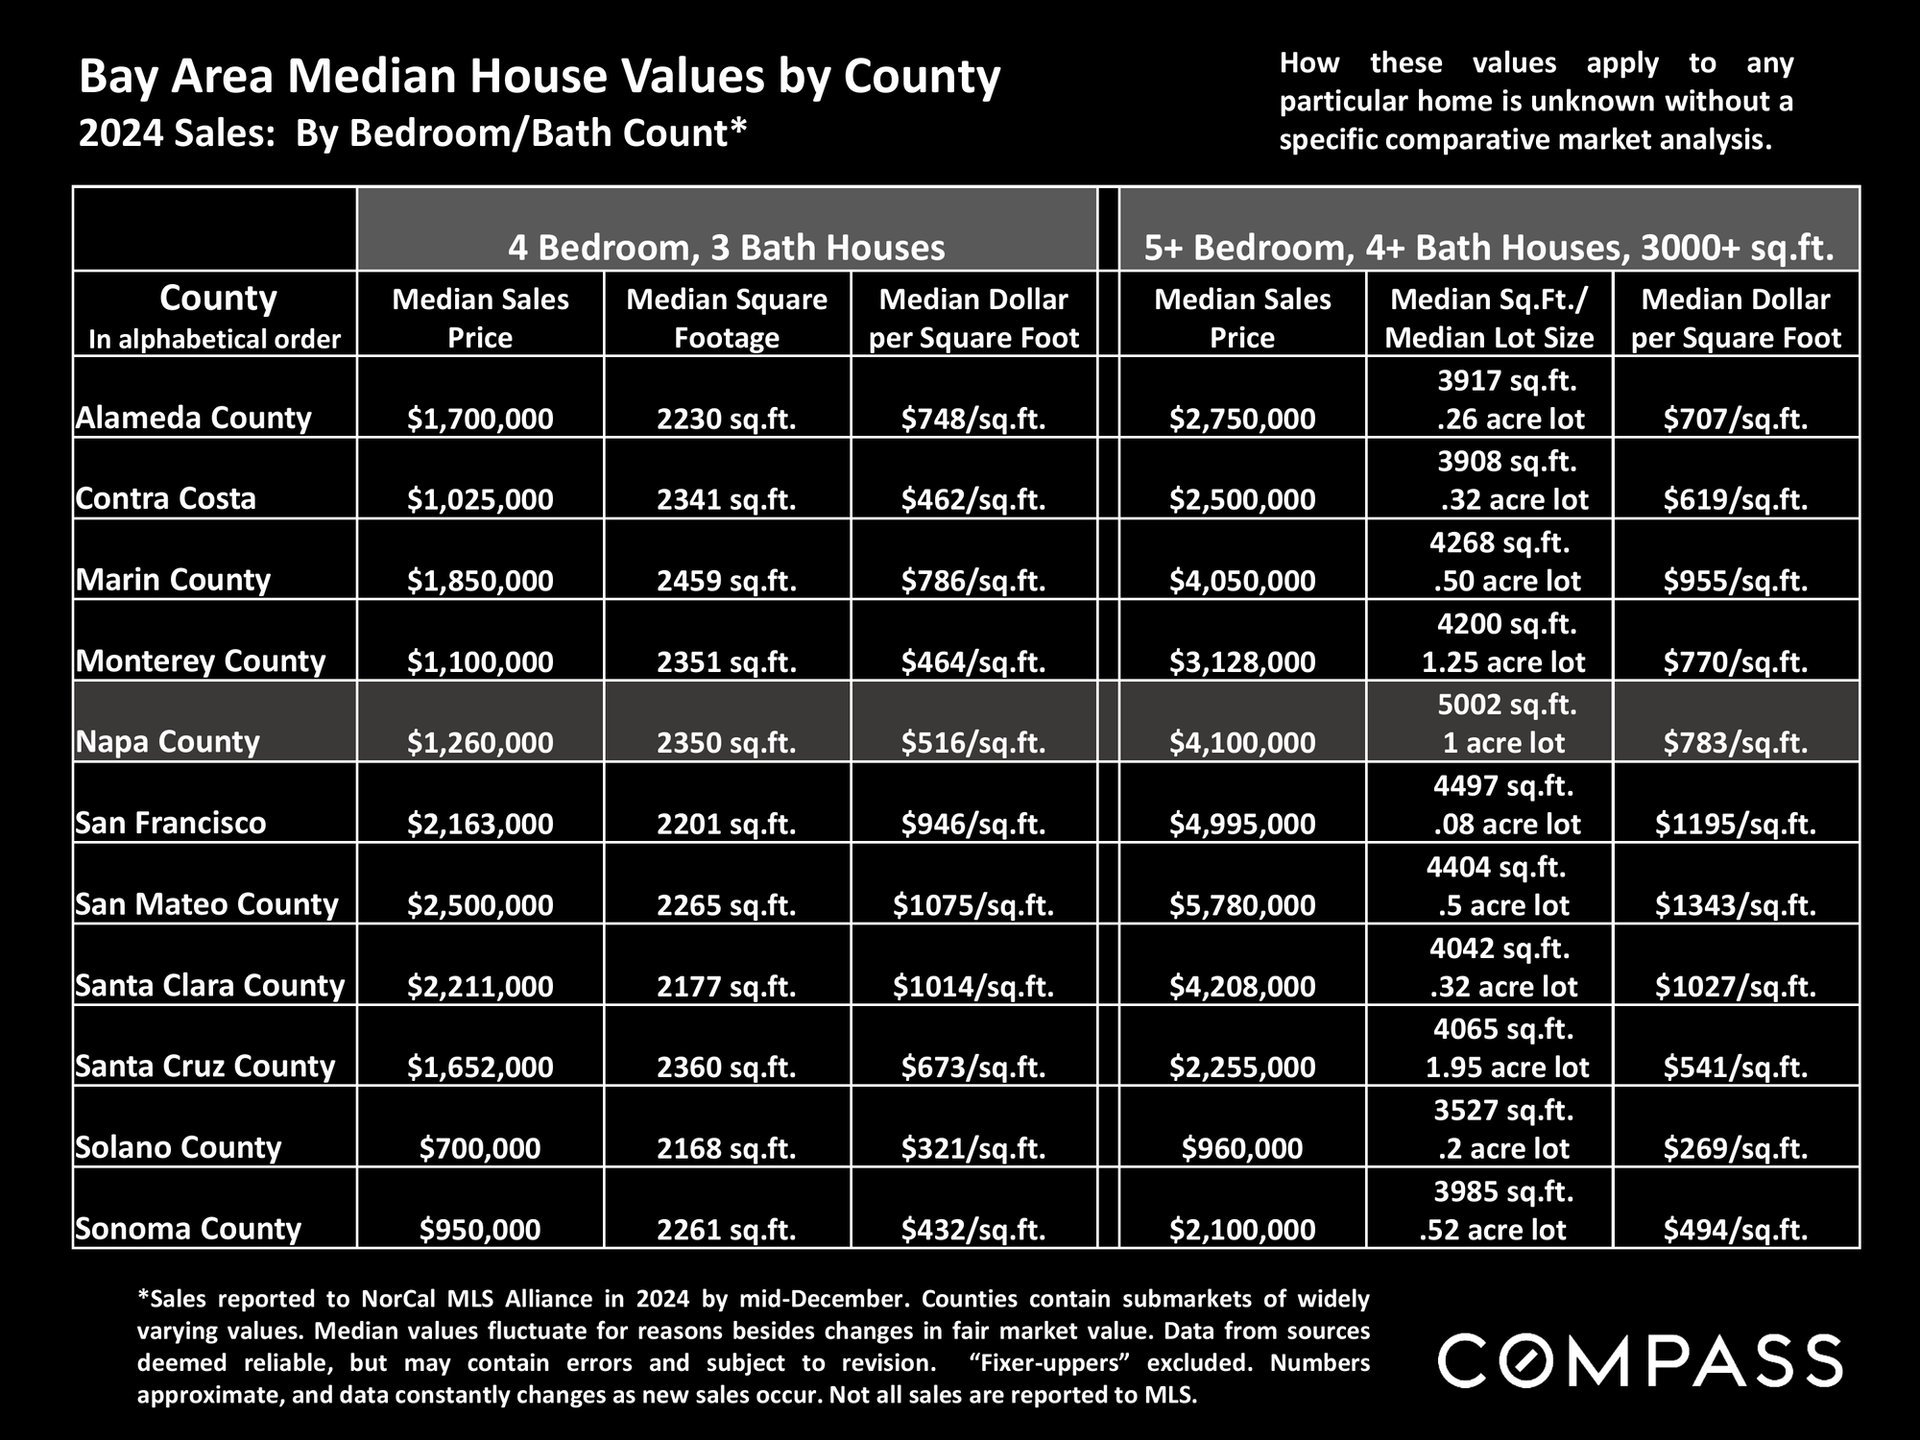
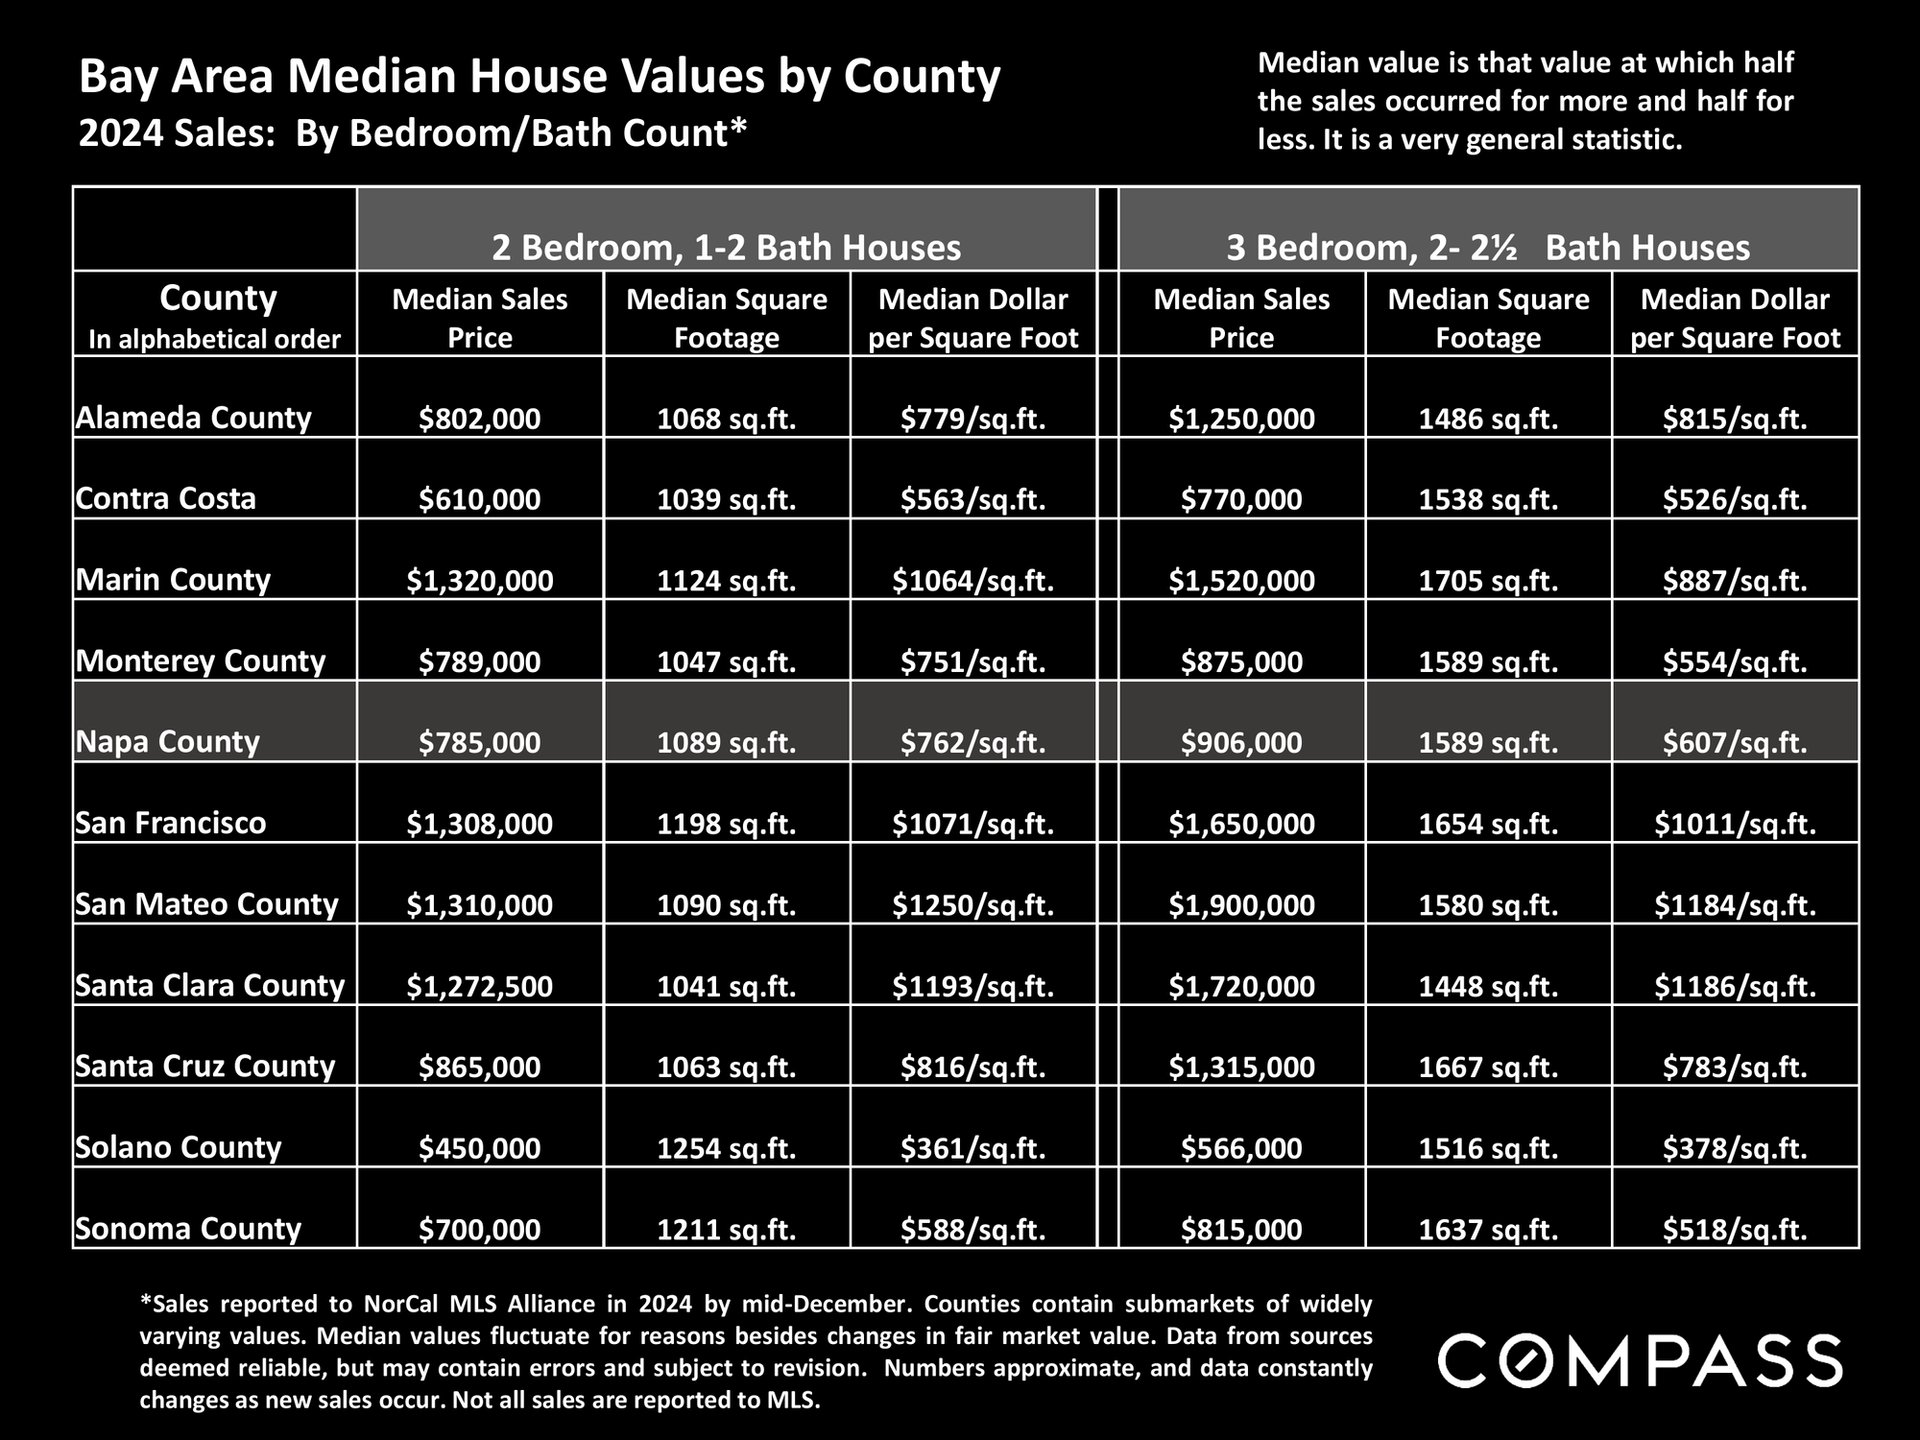
2024 Bay Area median home values by county and bedroom-bath count, with Napa County highlighted.
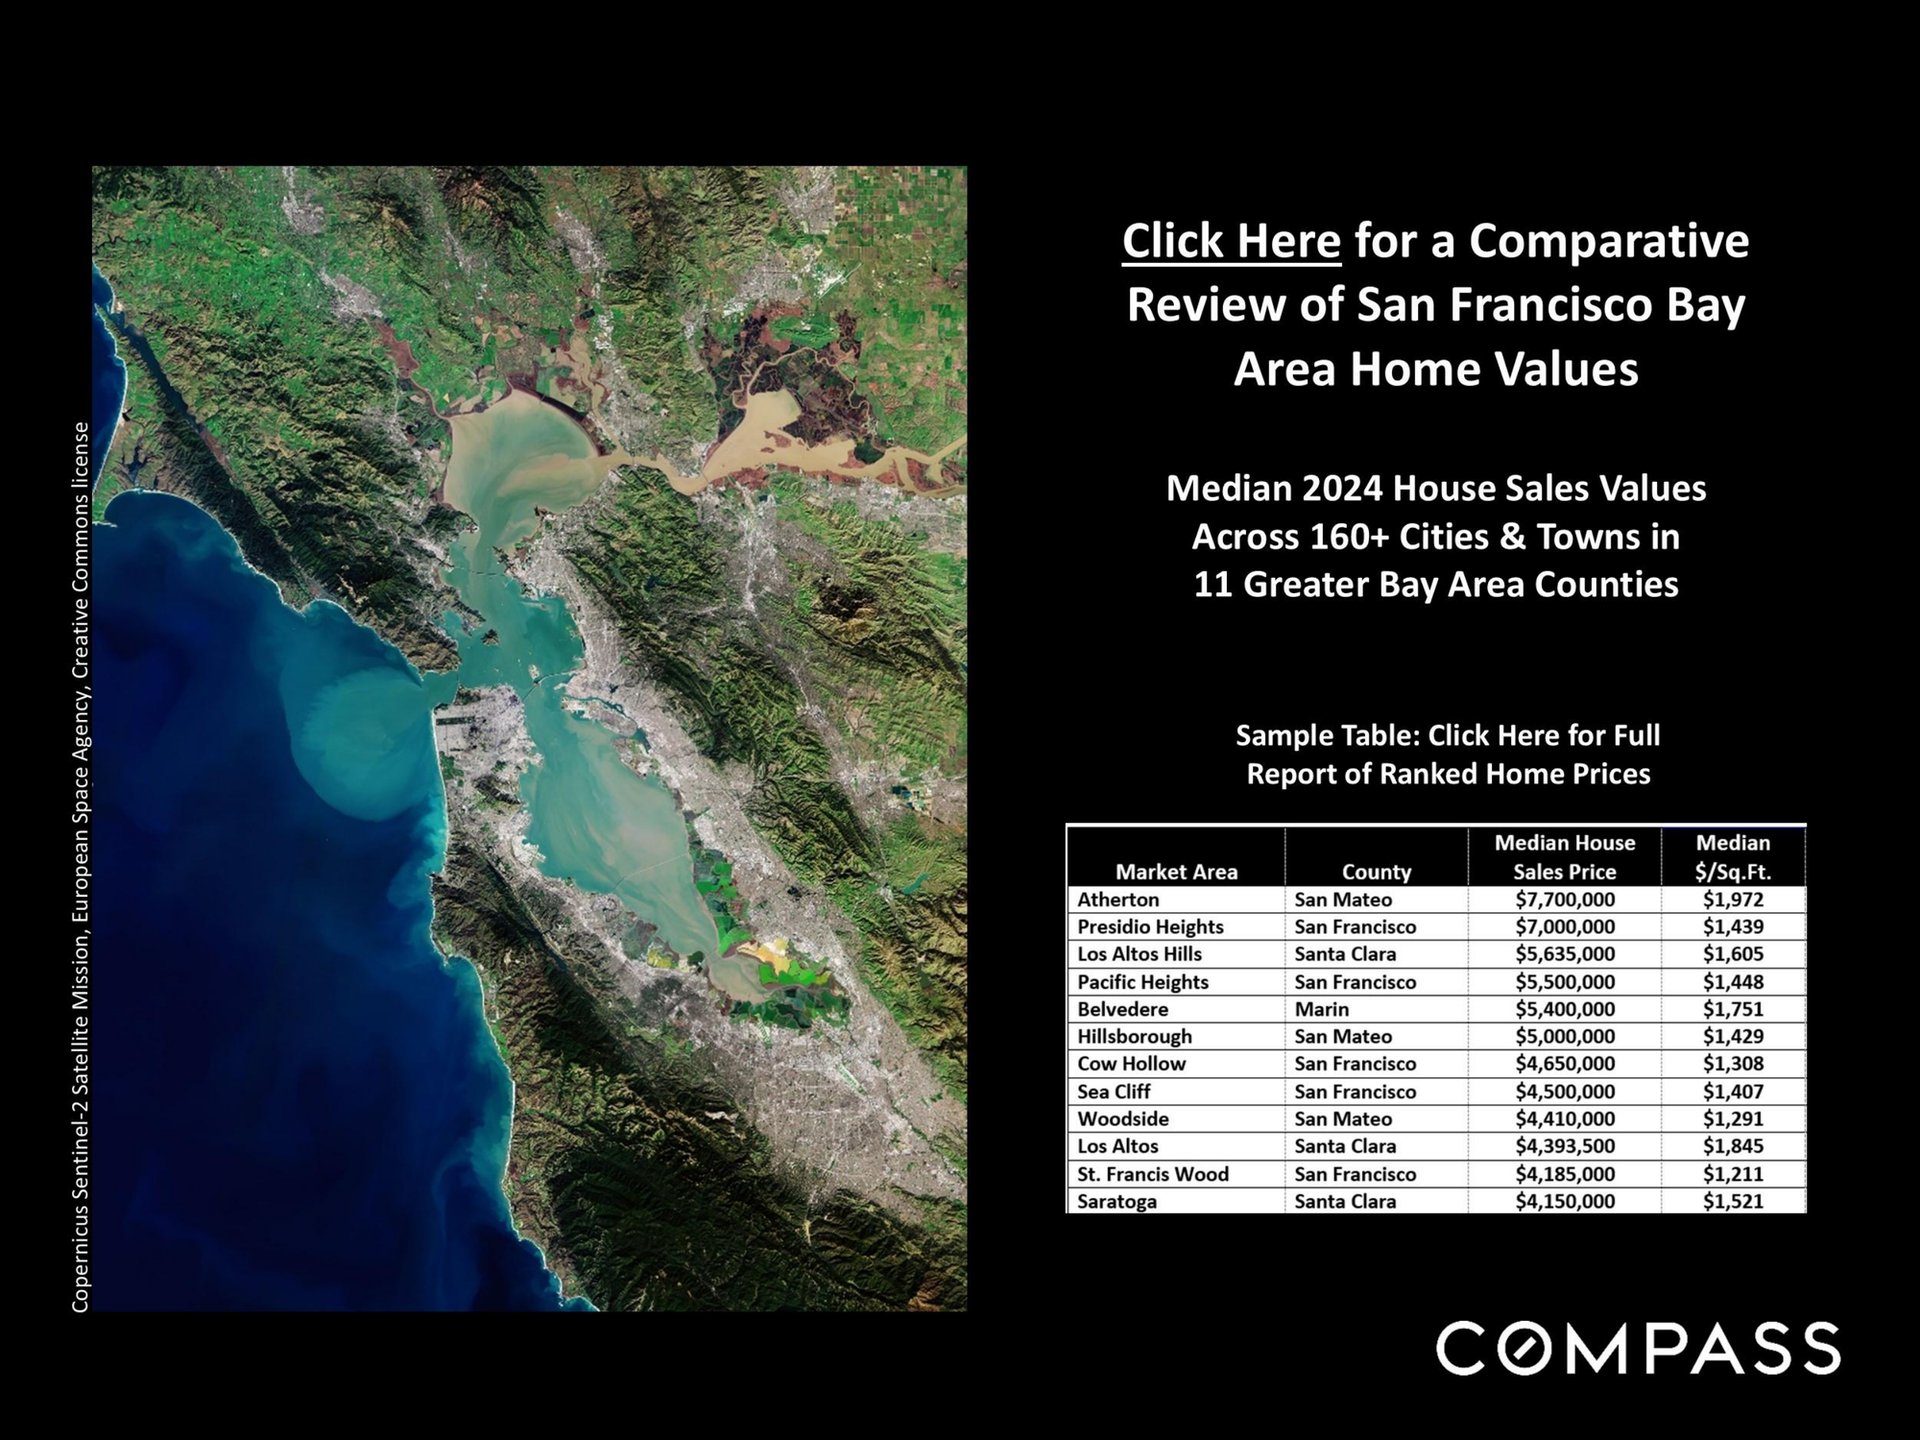
Greater Bay Area home-price infographic with a satellite map and sample table of 2024 median sales prices.
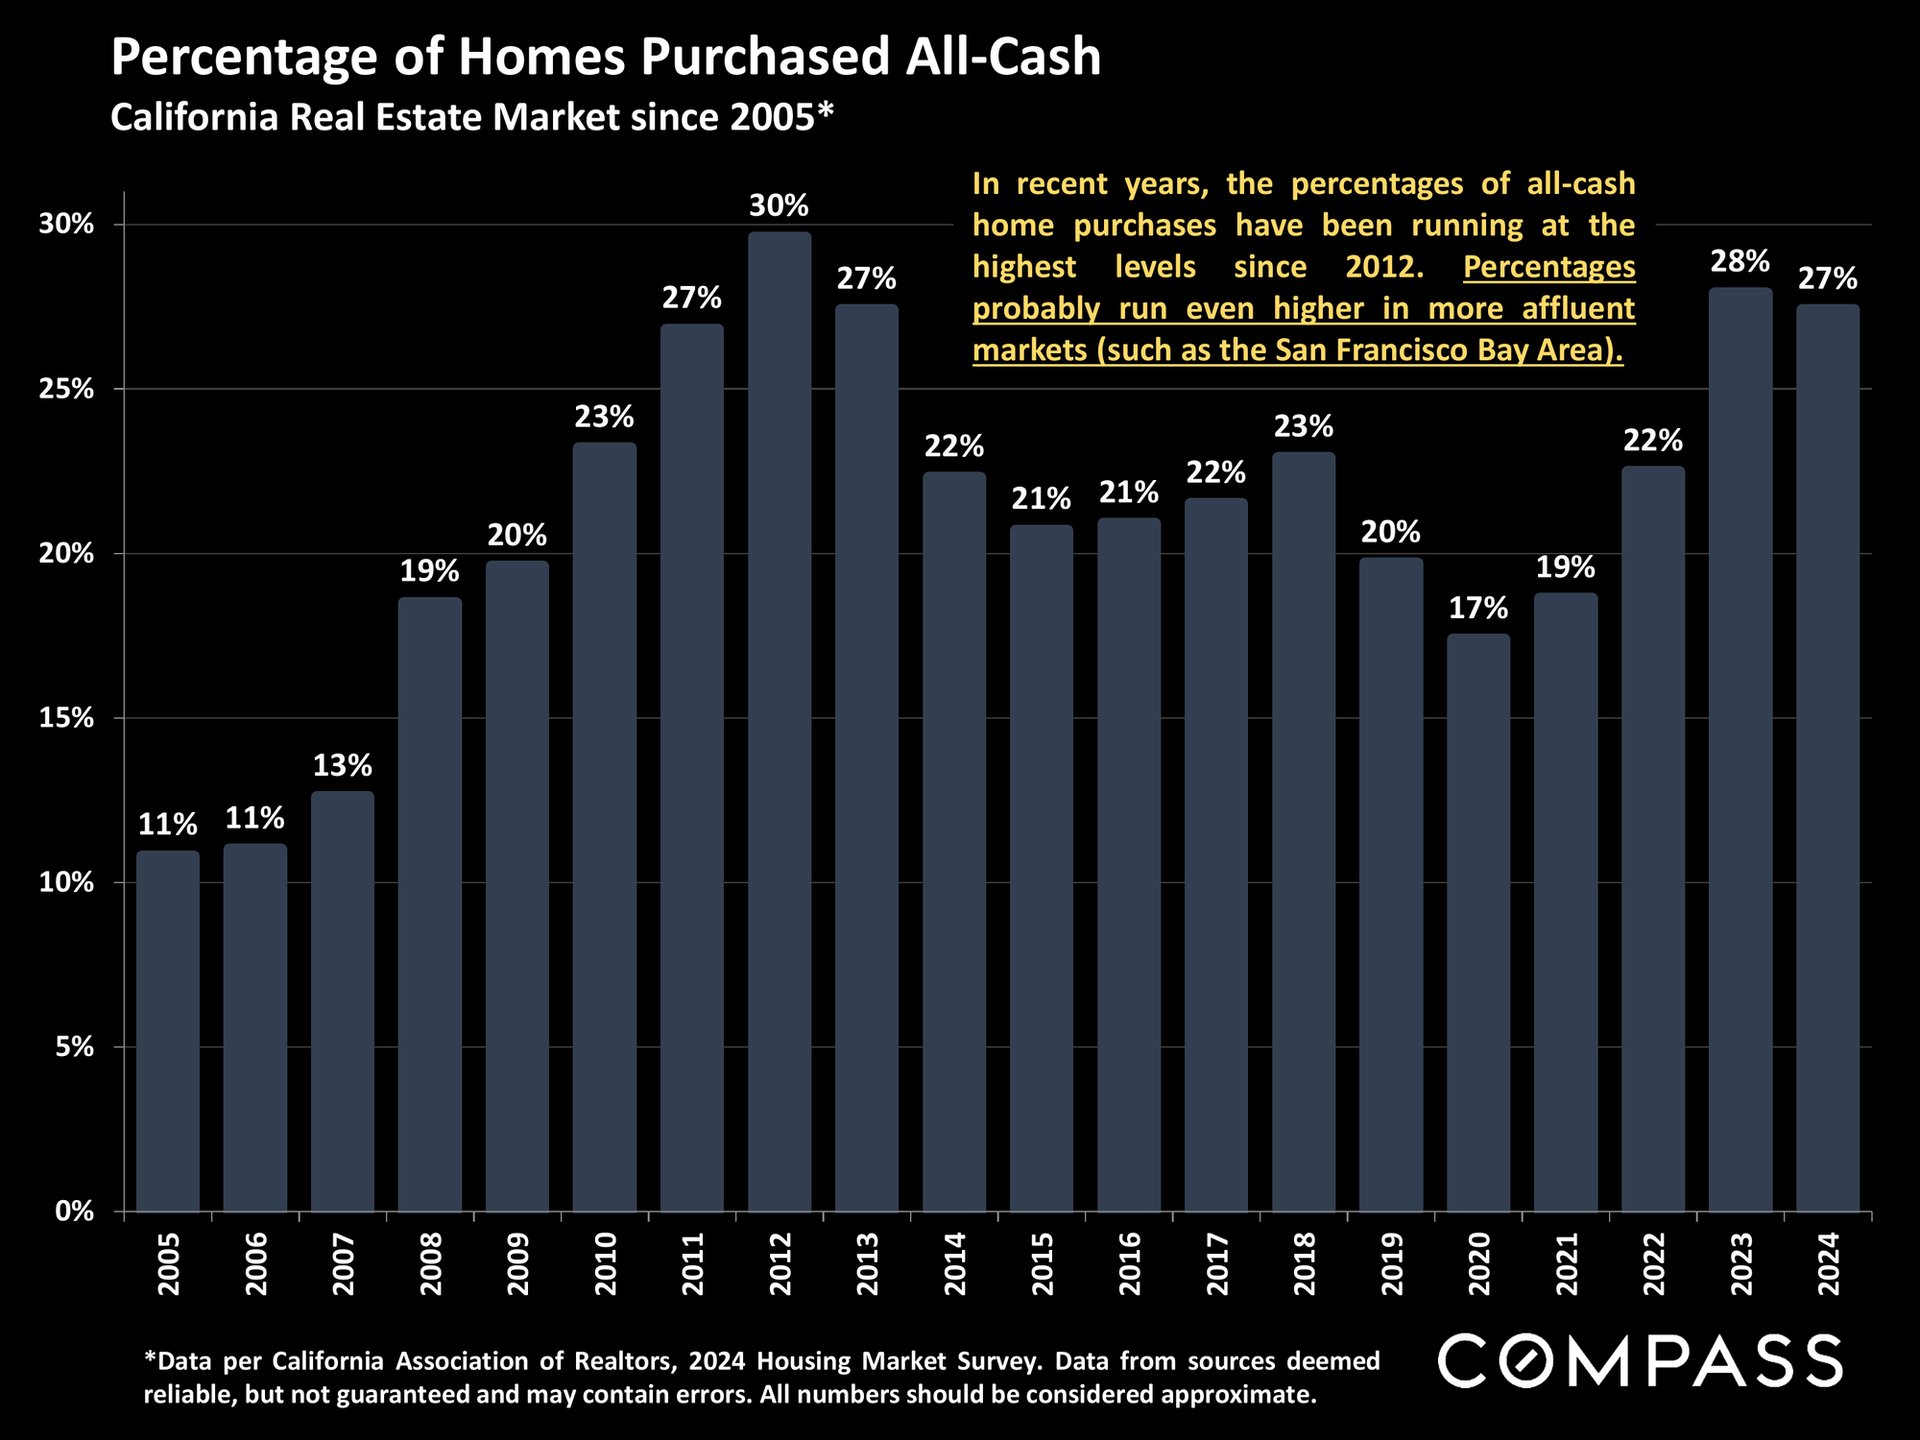
Bar chart of California all-cash home purchases, rising to 27% in 2024 after a 2020 low of 17%.
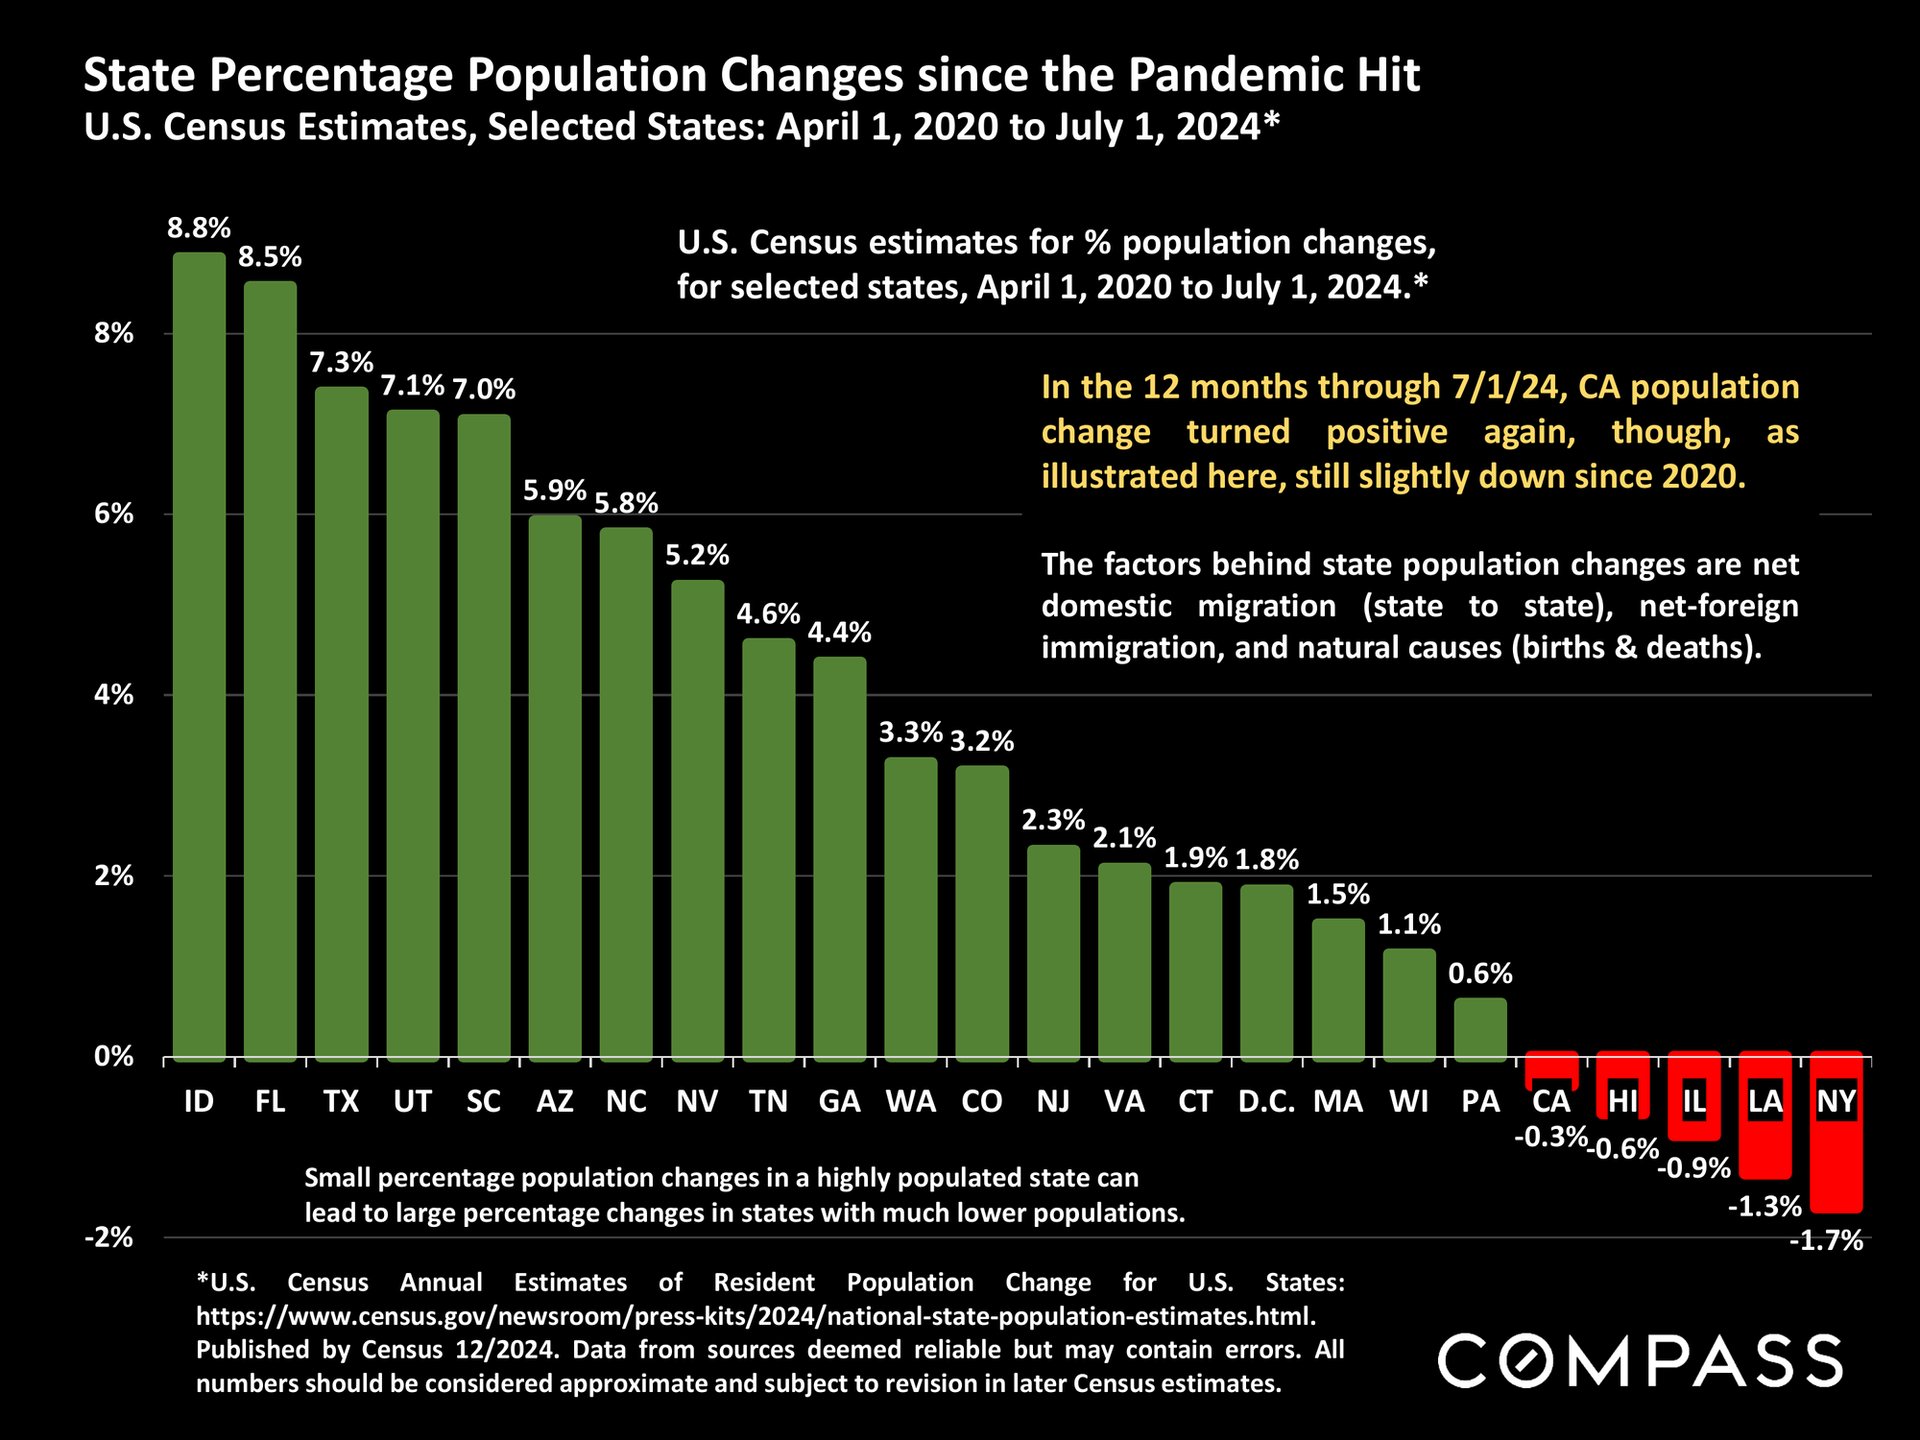
Bar chart of state population changes since 2020, with Idaho highest and New York lowest.
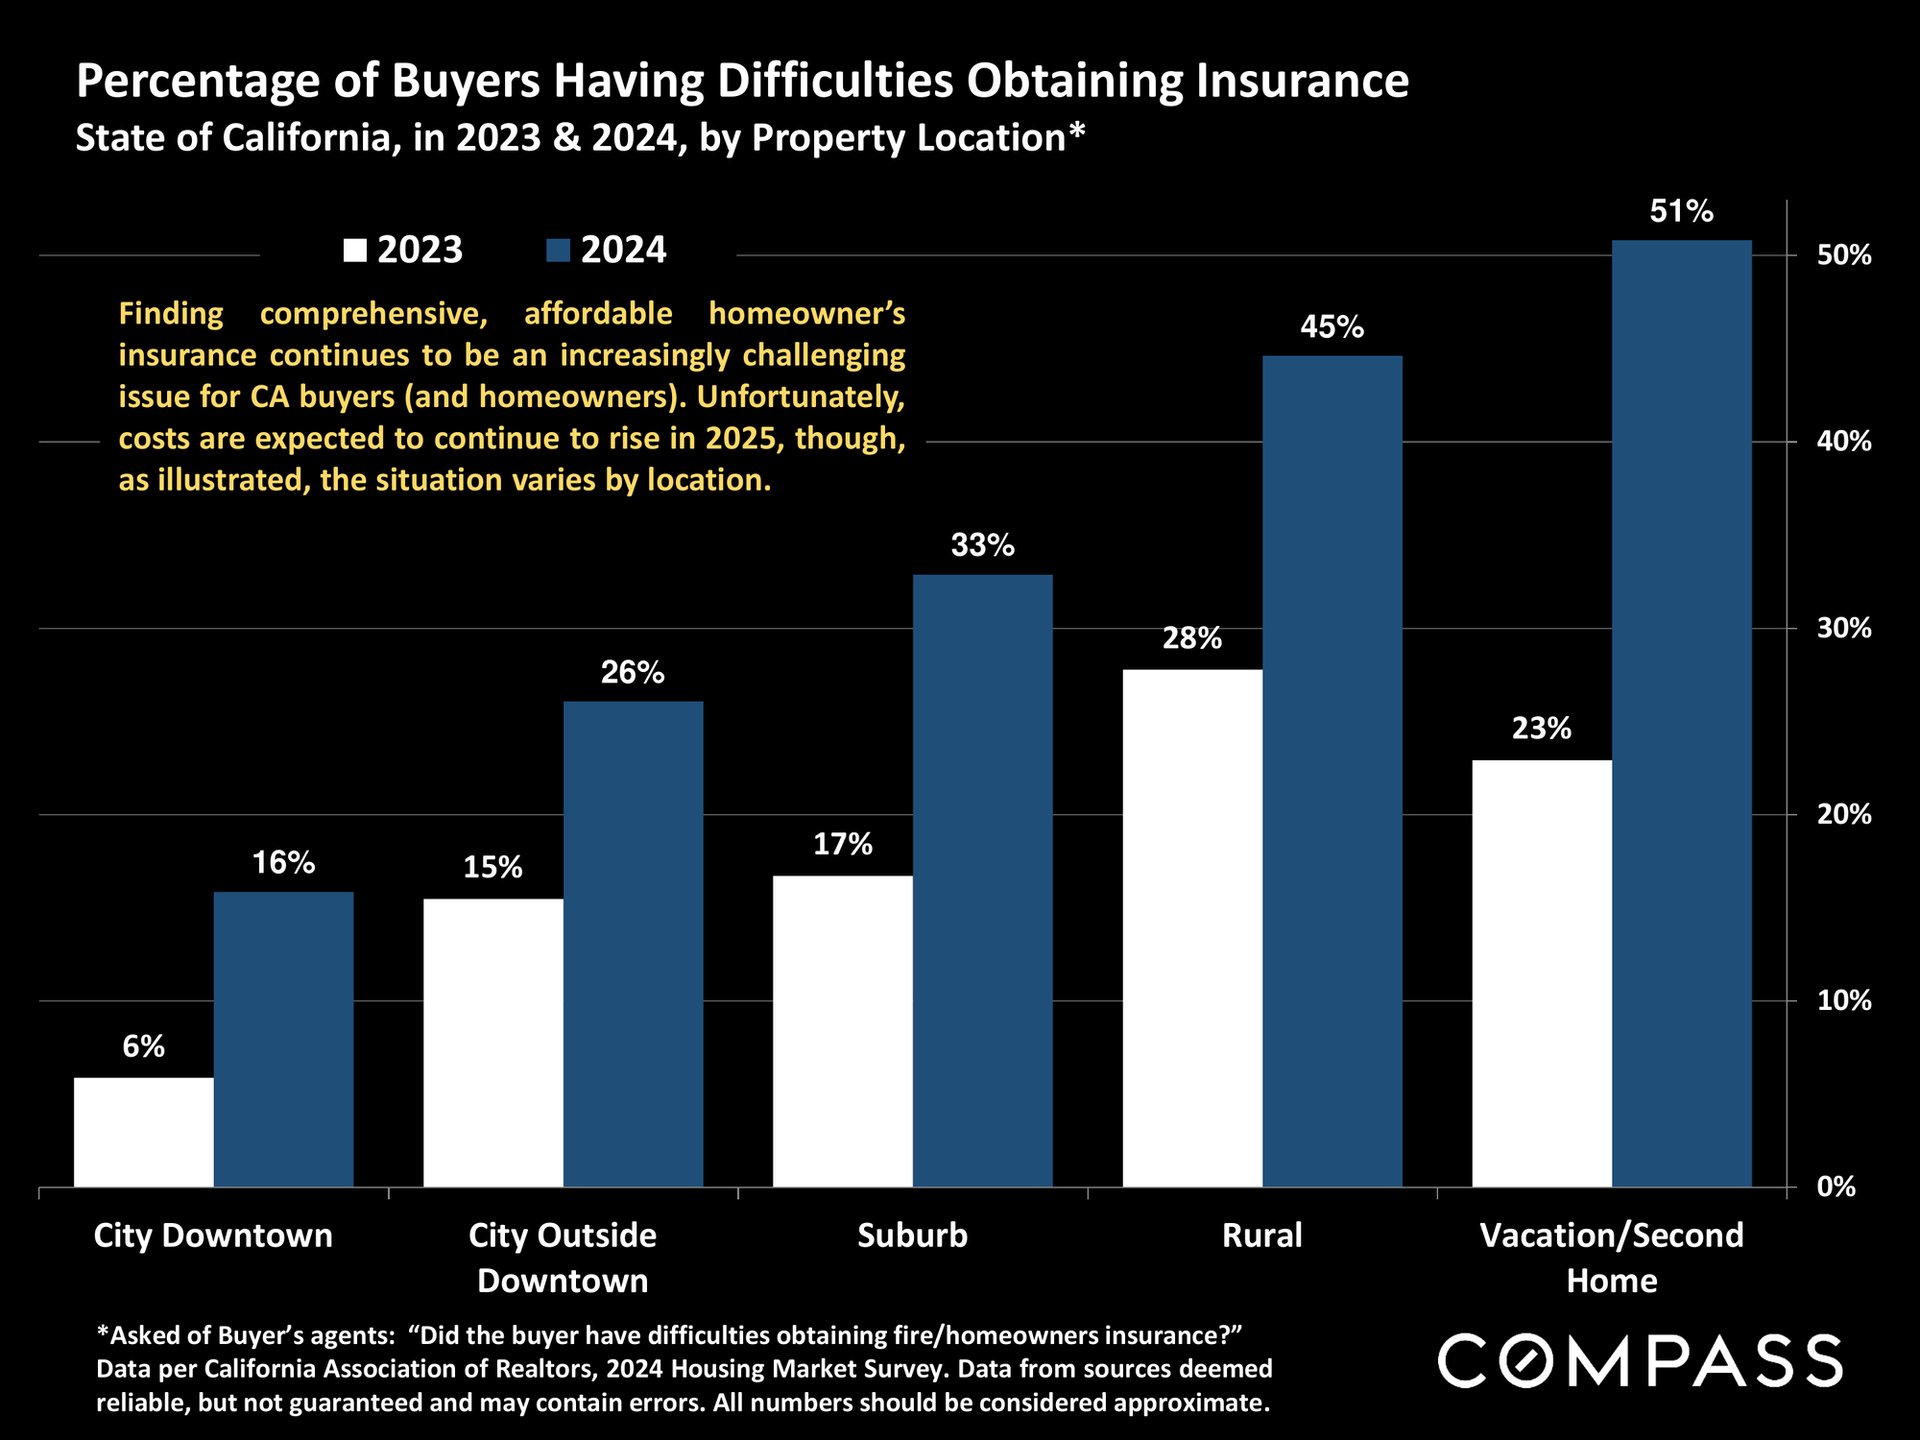
Chart comparing California buyers’ insurance difficulties in 2023 and 2024 across five property locations; rates rose in every category.
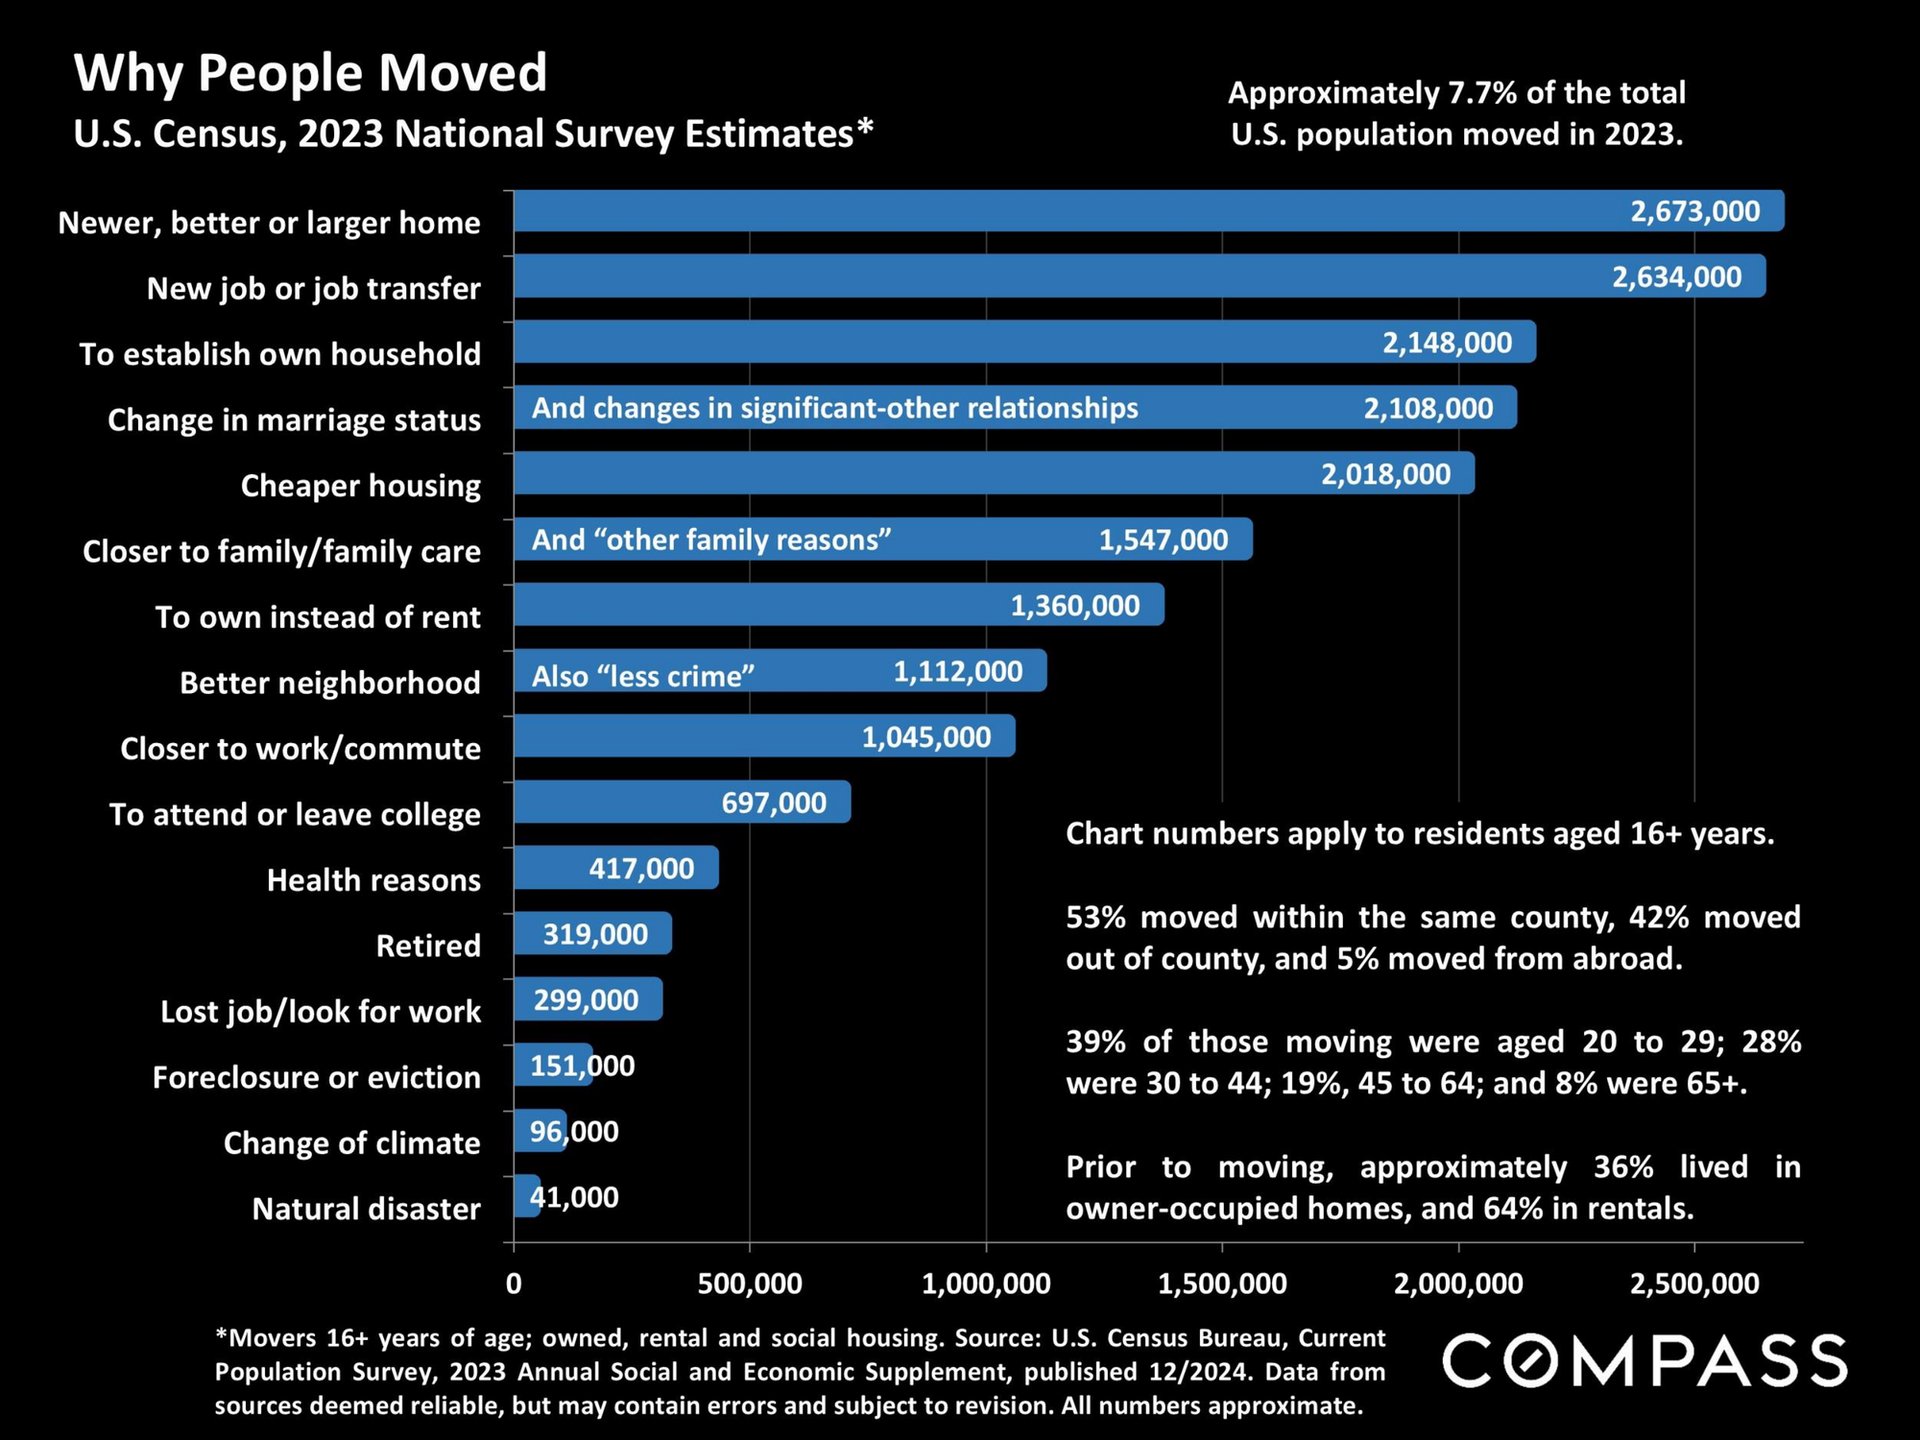
Chart of U.S. Census estimates for reasons people moved in 2023, led by a better home and a new job.
Real estate report notes explain statistics, valuation measures, square-foot calculations, and legal disclaimers.
Napa County comparative review of city and town markets, 2024 sales.
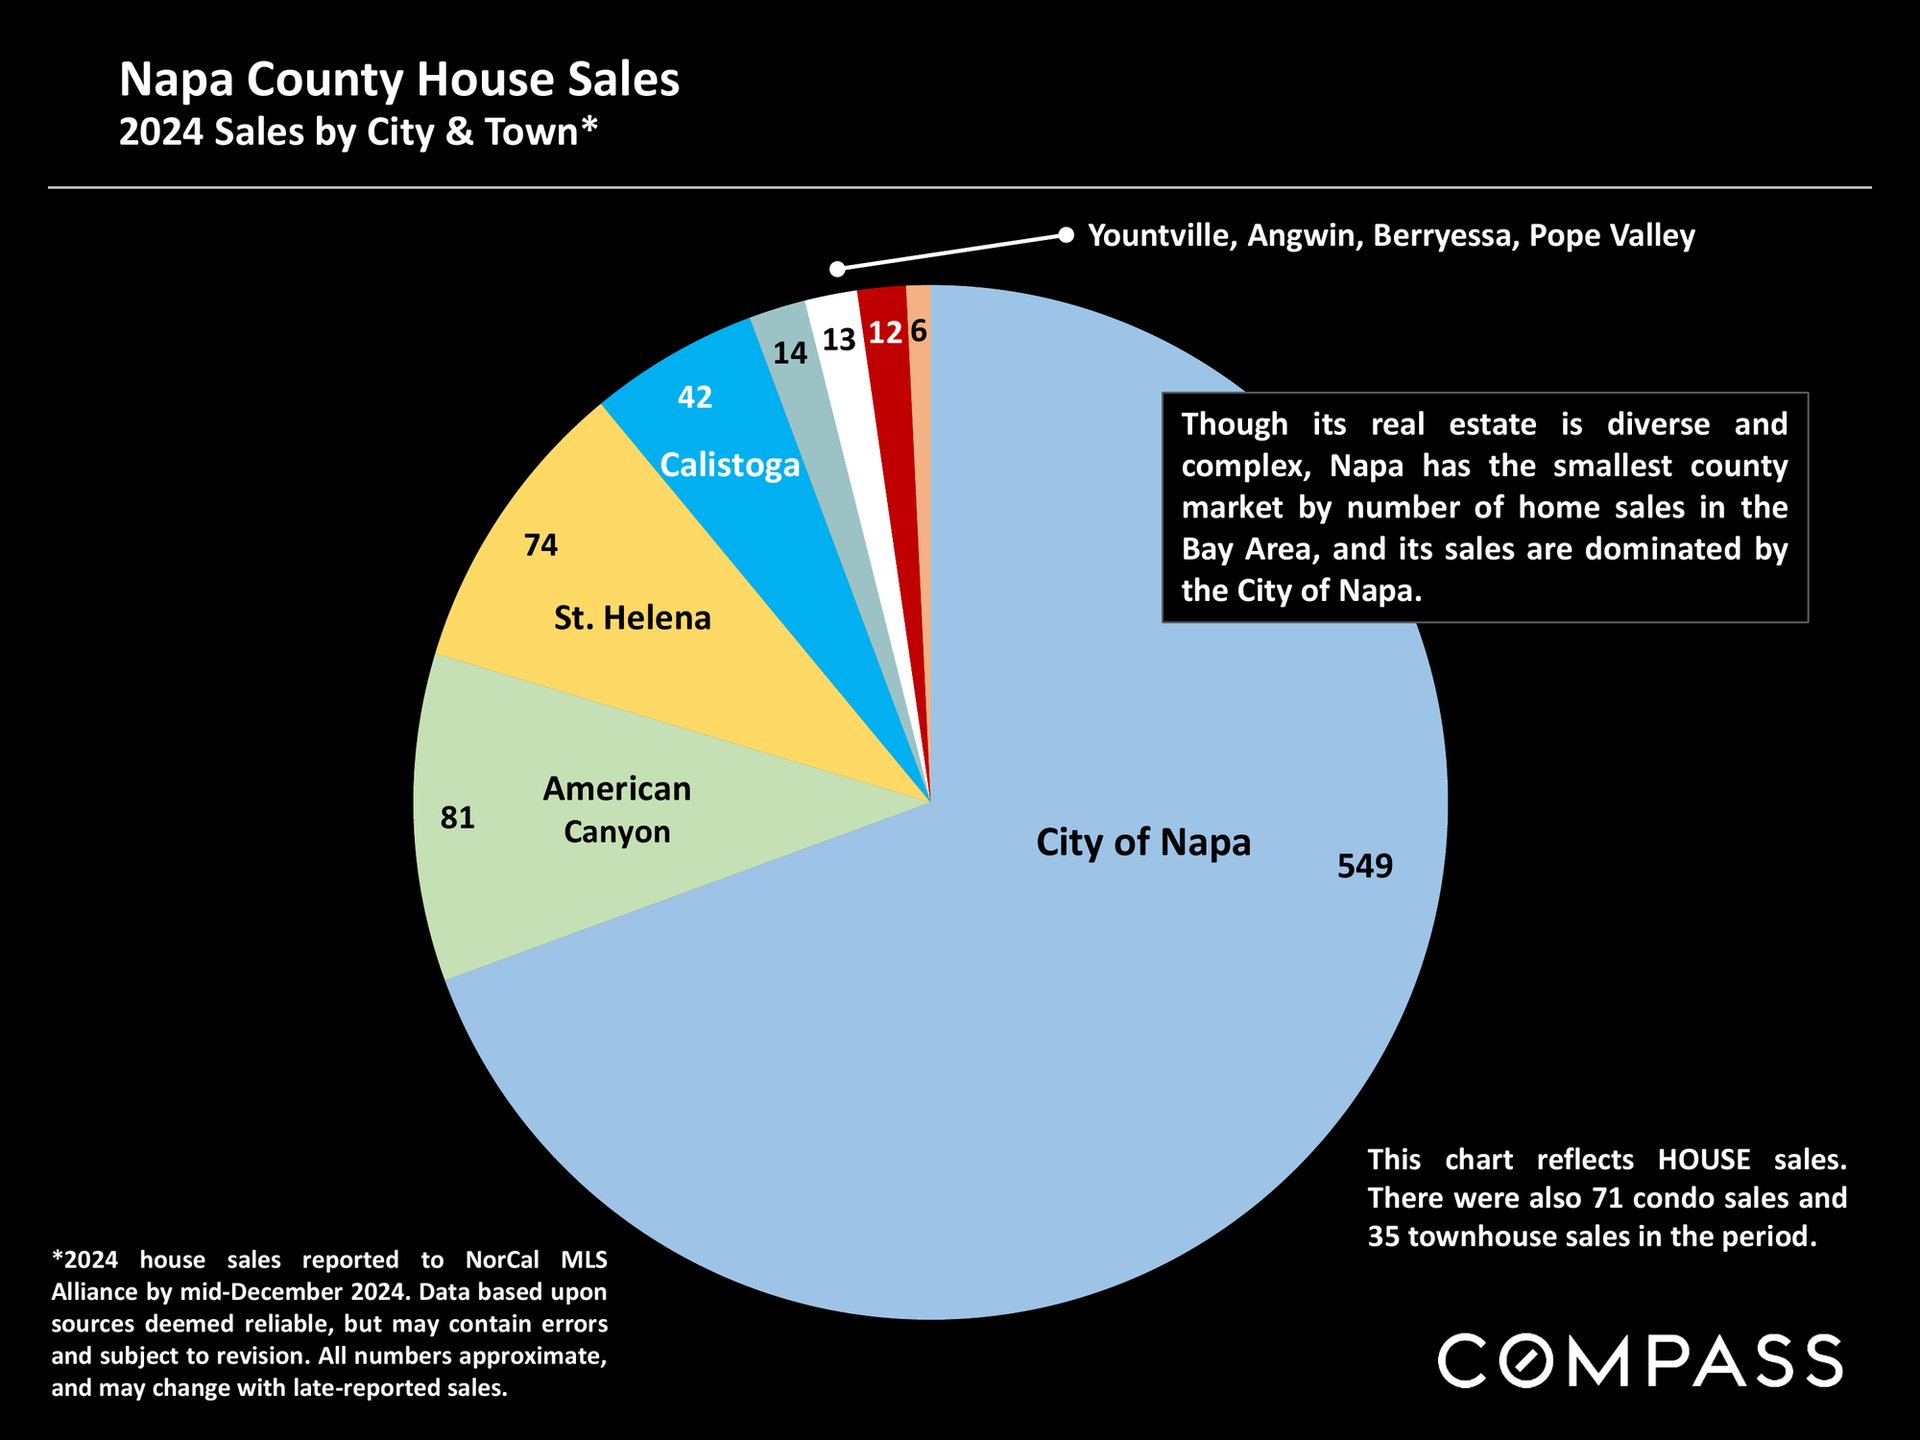
Pie chart of 2024 Napa County house sales, led by the City of Napa with 549 sales.
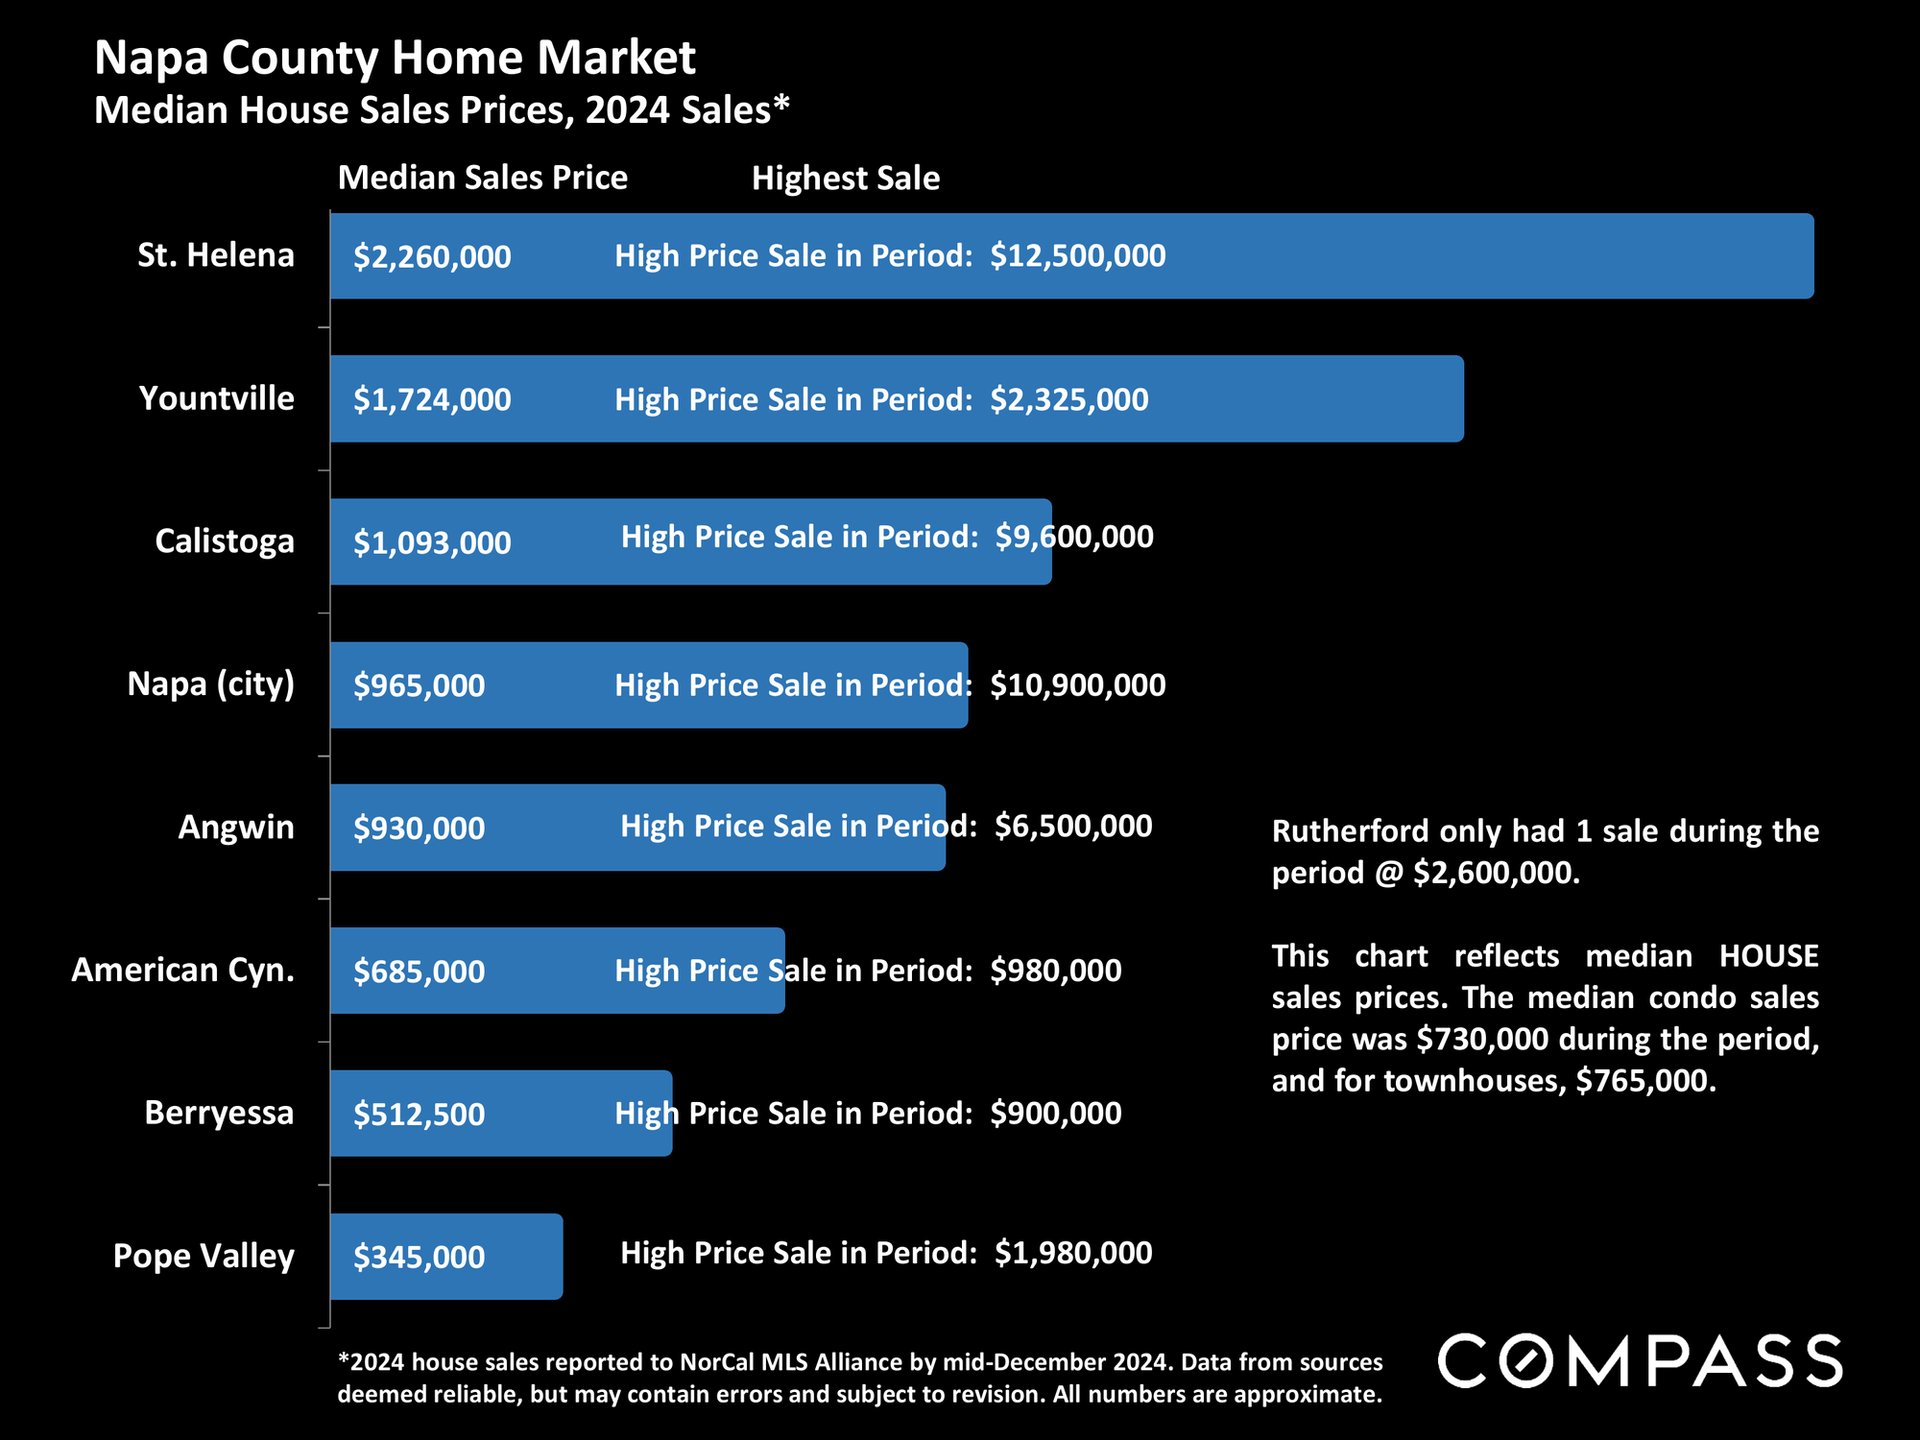
Chart of 2024 median house sale prices across Napa County communities, led by St. Helena at $2.26 million.
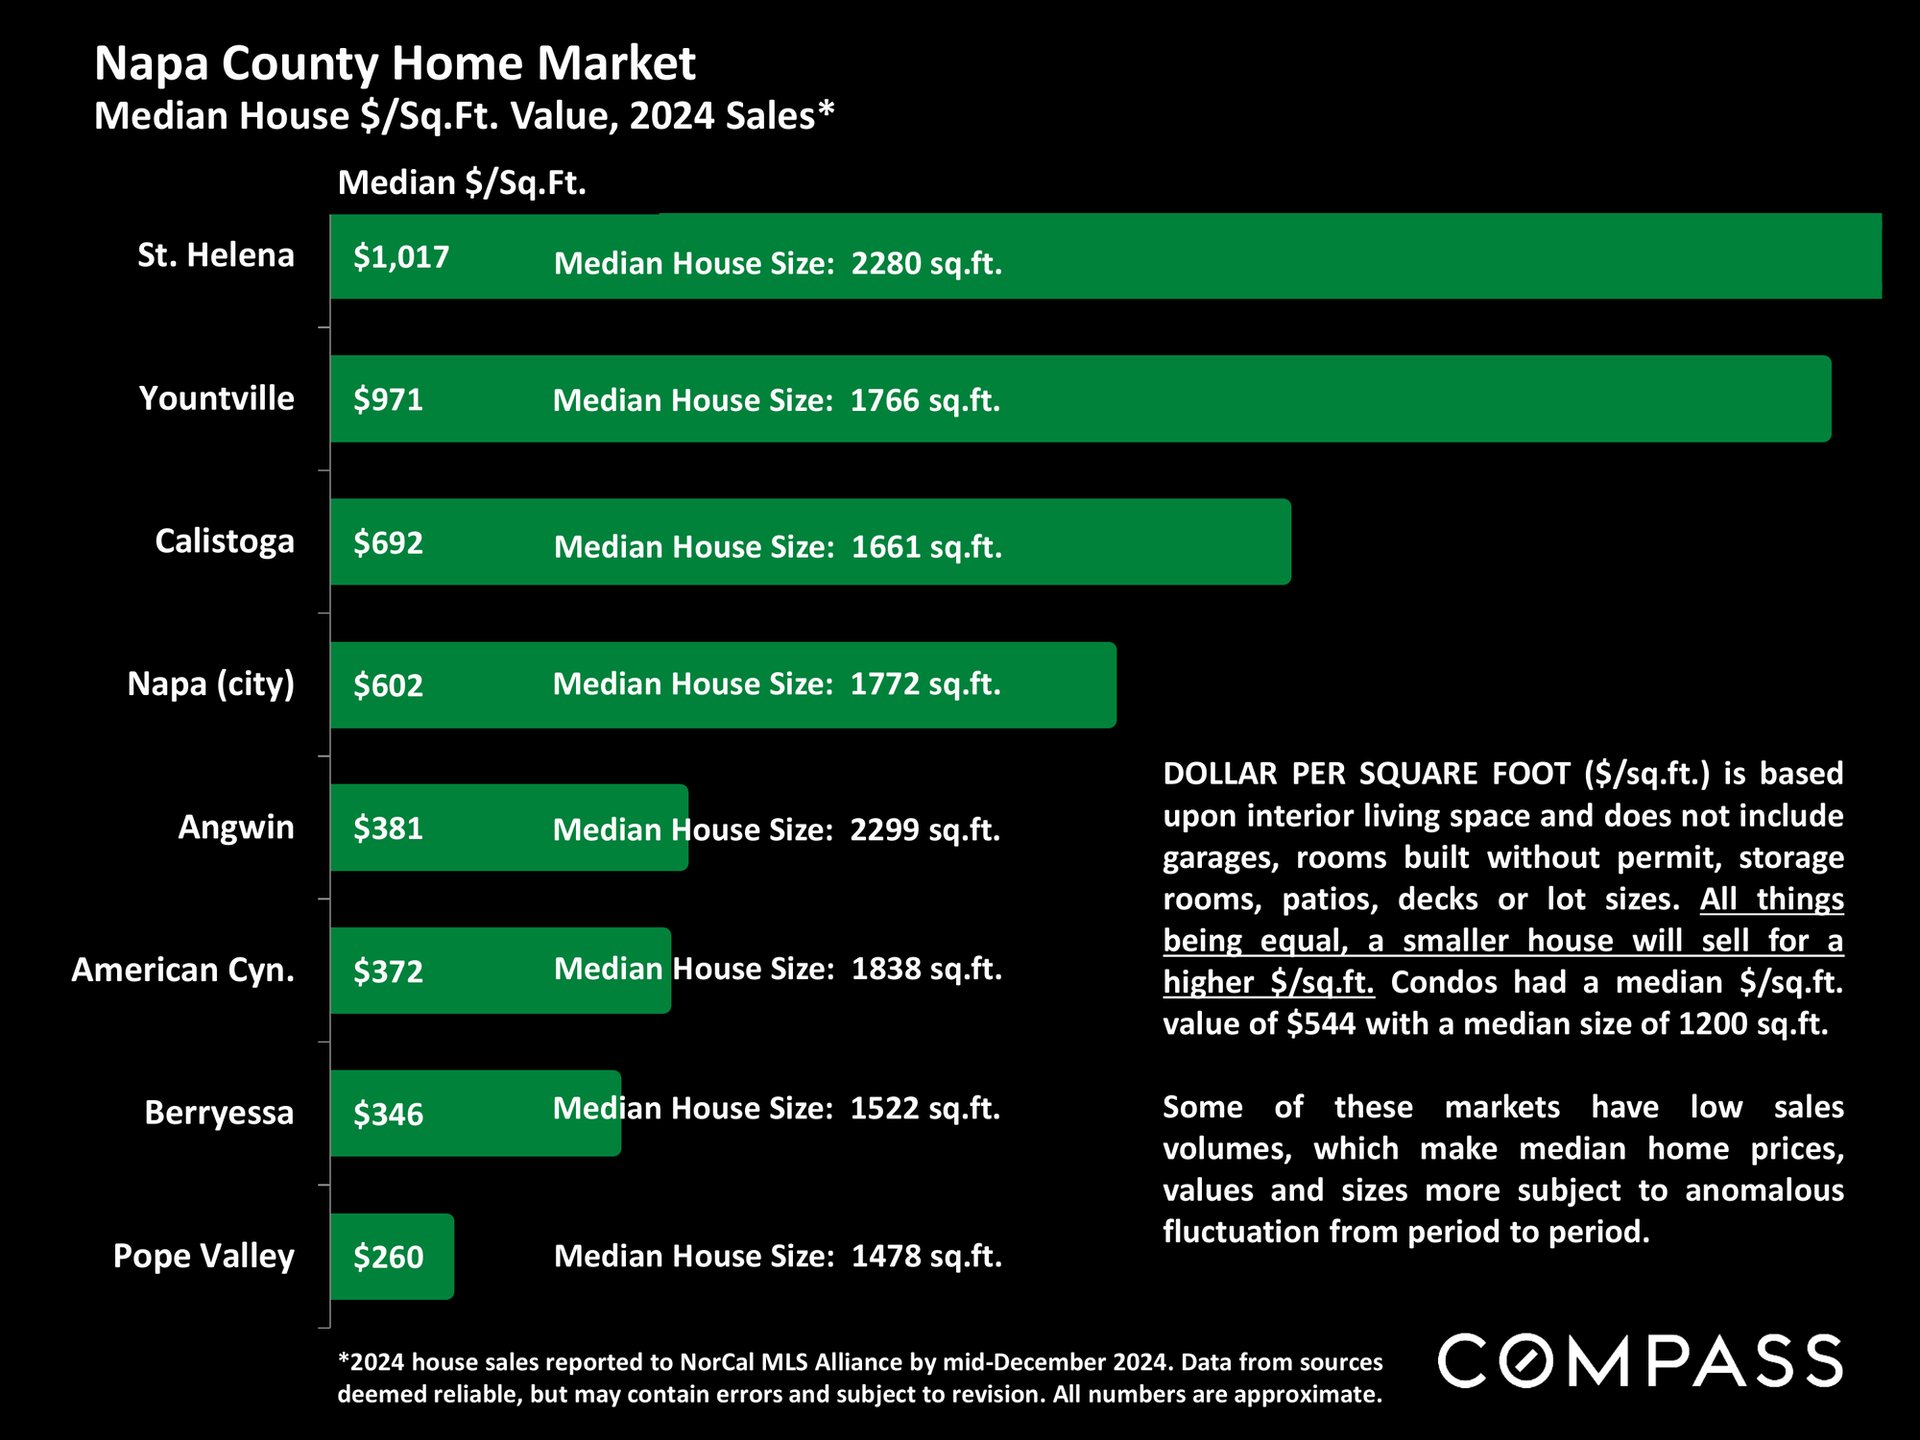
Napa County home market chart compares 2024 median sale prices per square foot and median house sizes by community.
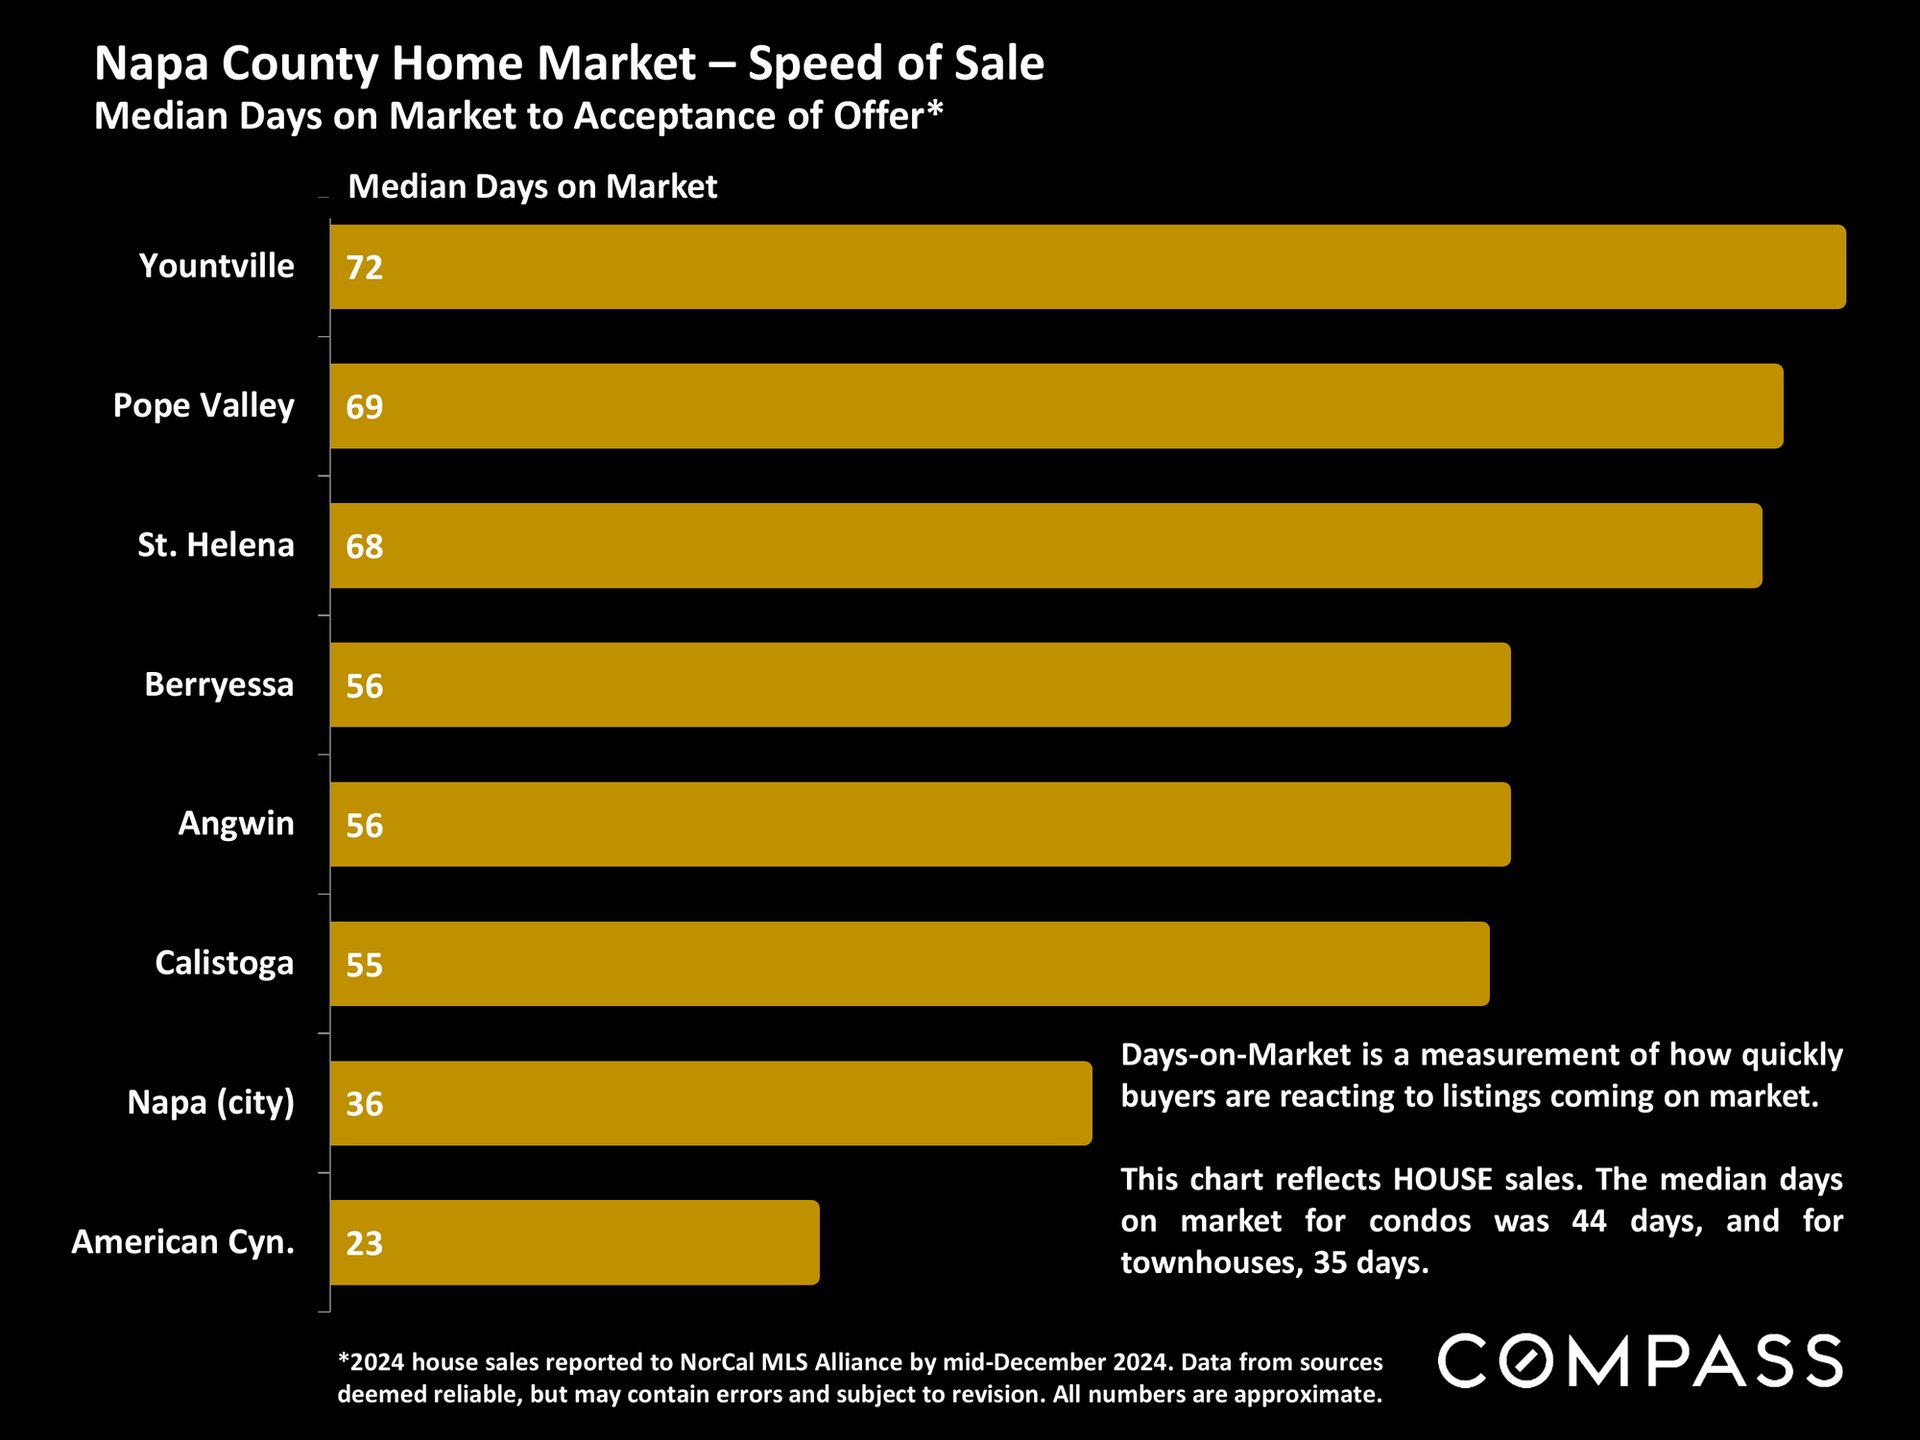
Napa County median days-on-market chart, led by Yountville at 72 days and ending with American Canyon at 23.
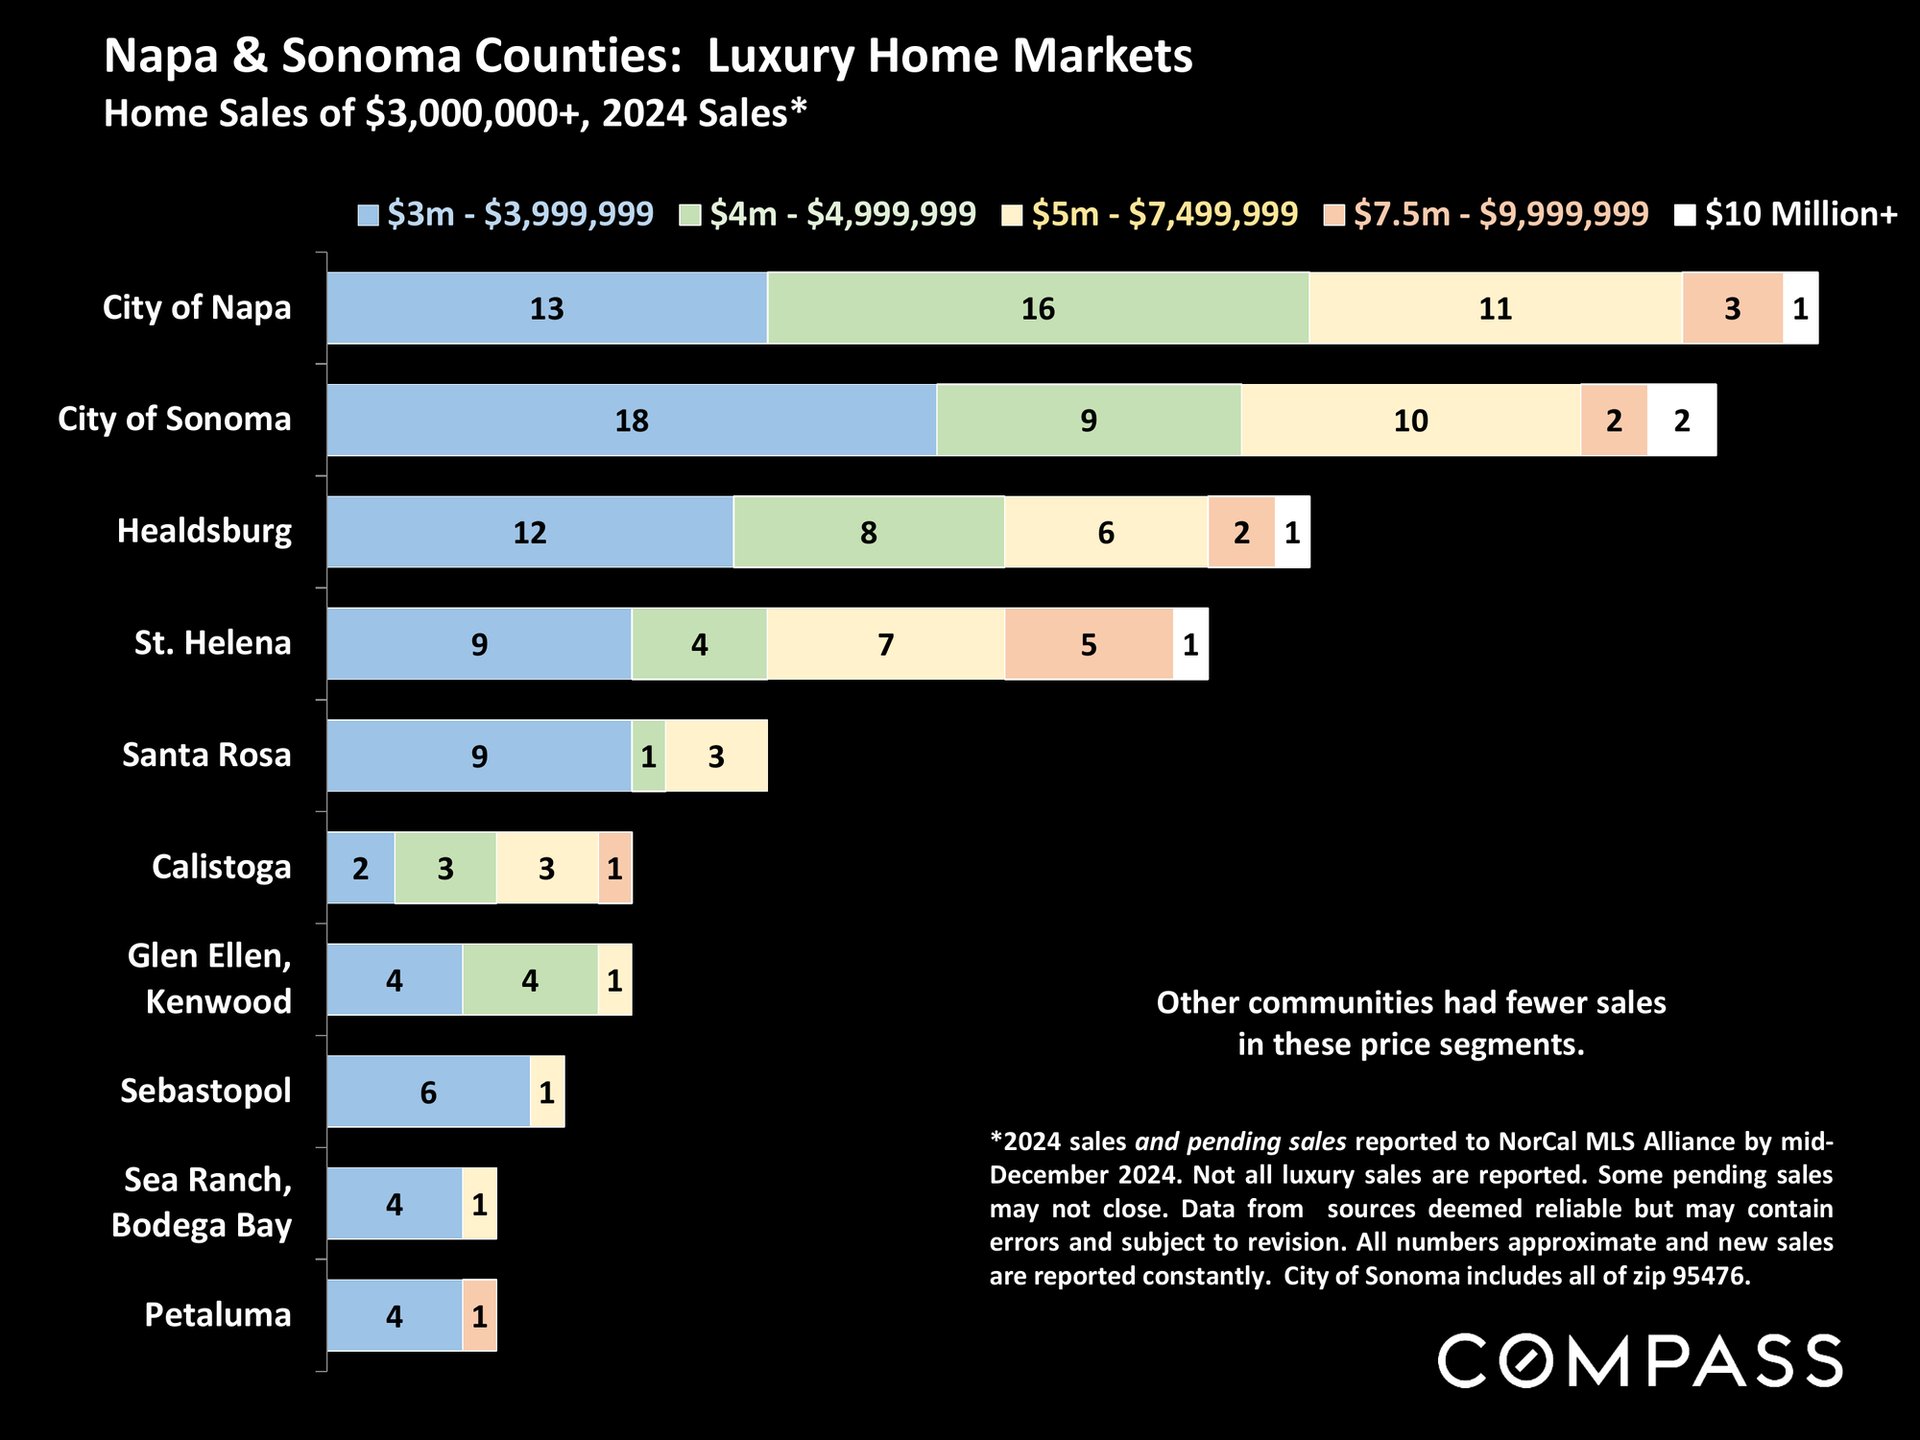
Chart compares 2024 luxury home sales by price range across Napa and Sonoma County communities.
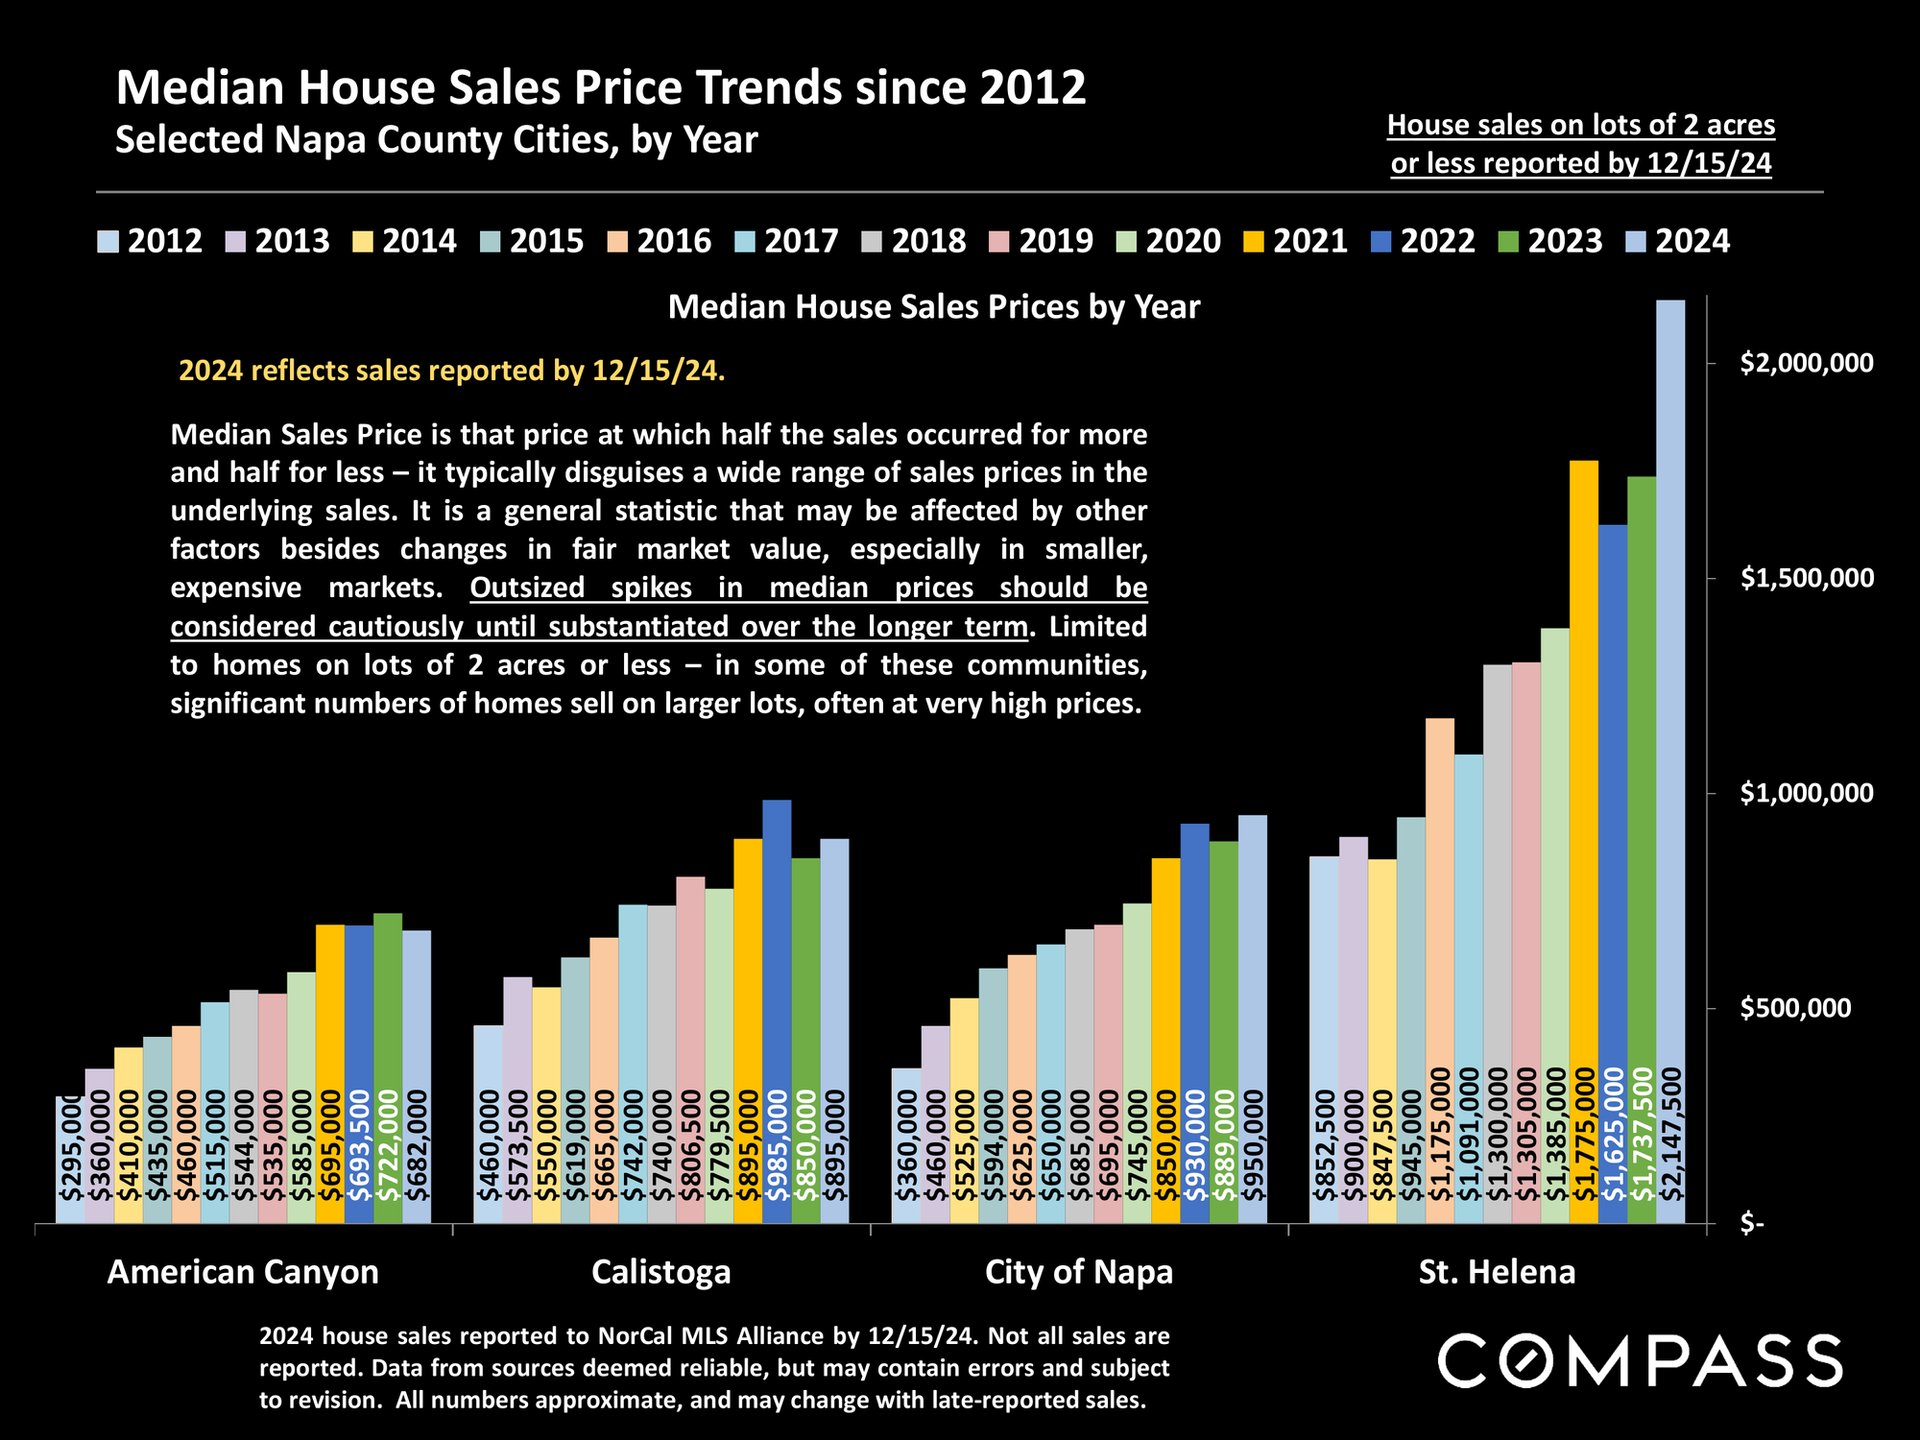
Chart comparing Napa County city median home sale prices from 2012 to 2024, with St. Helena highest.
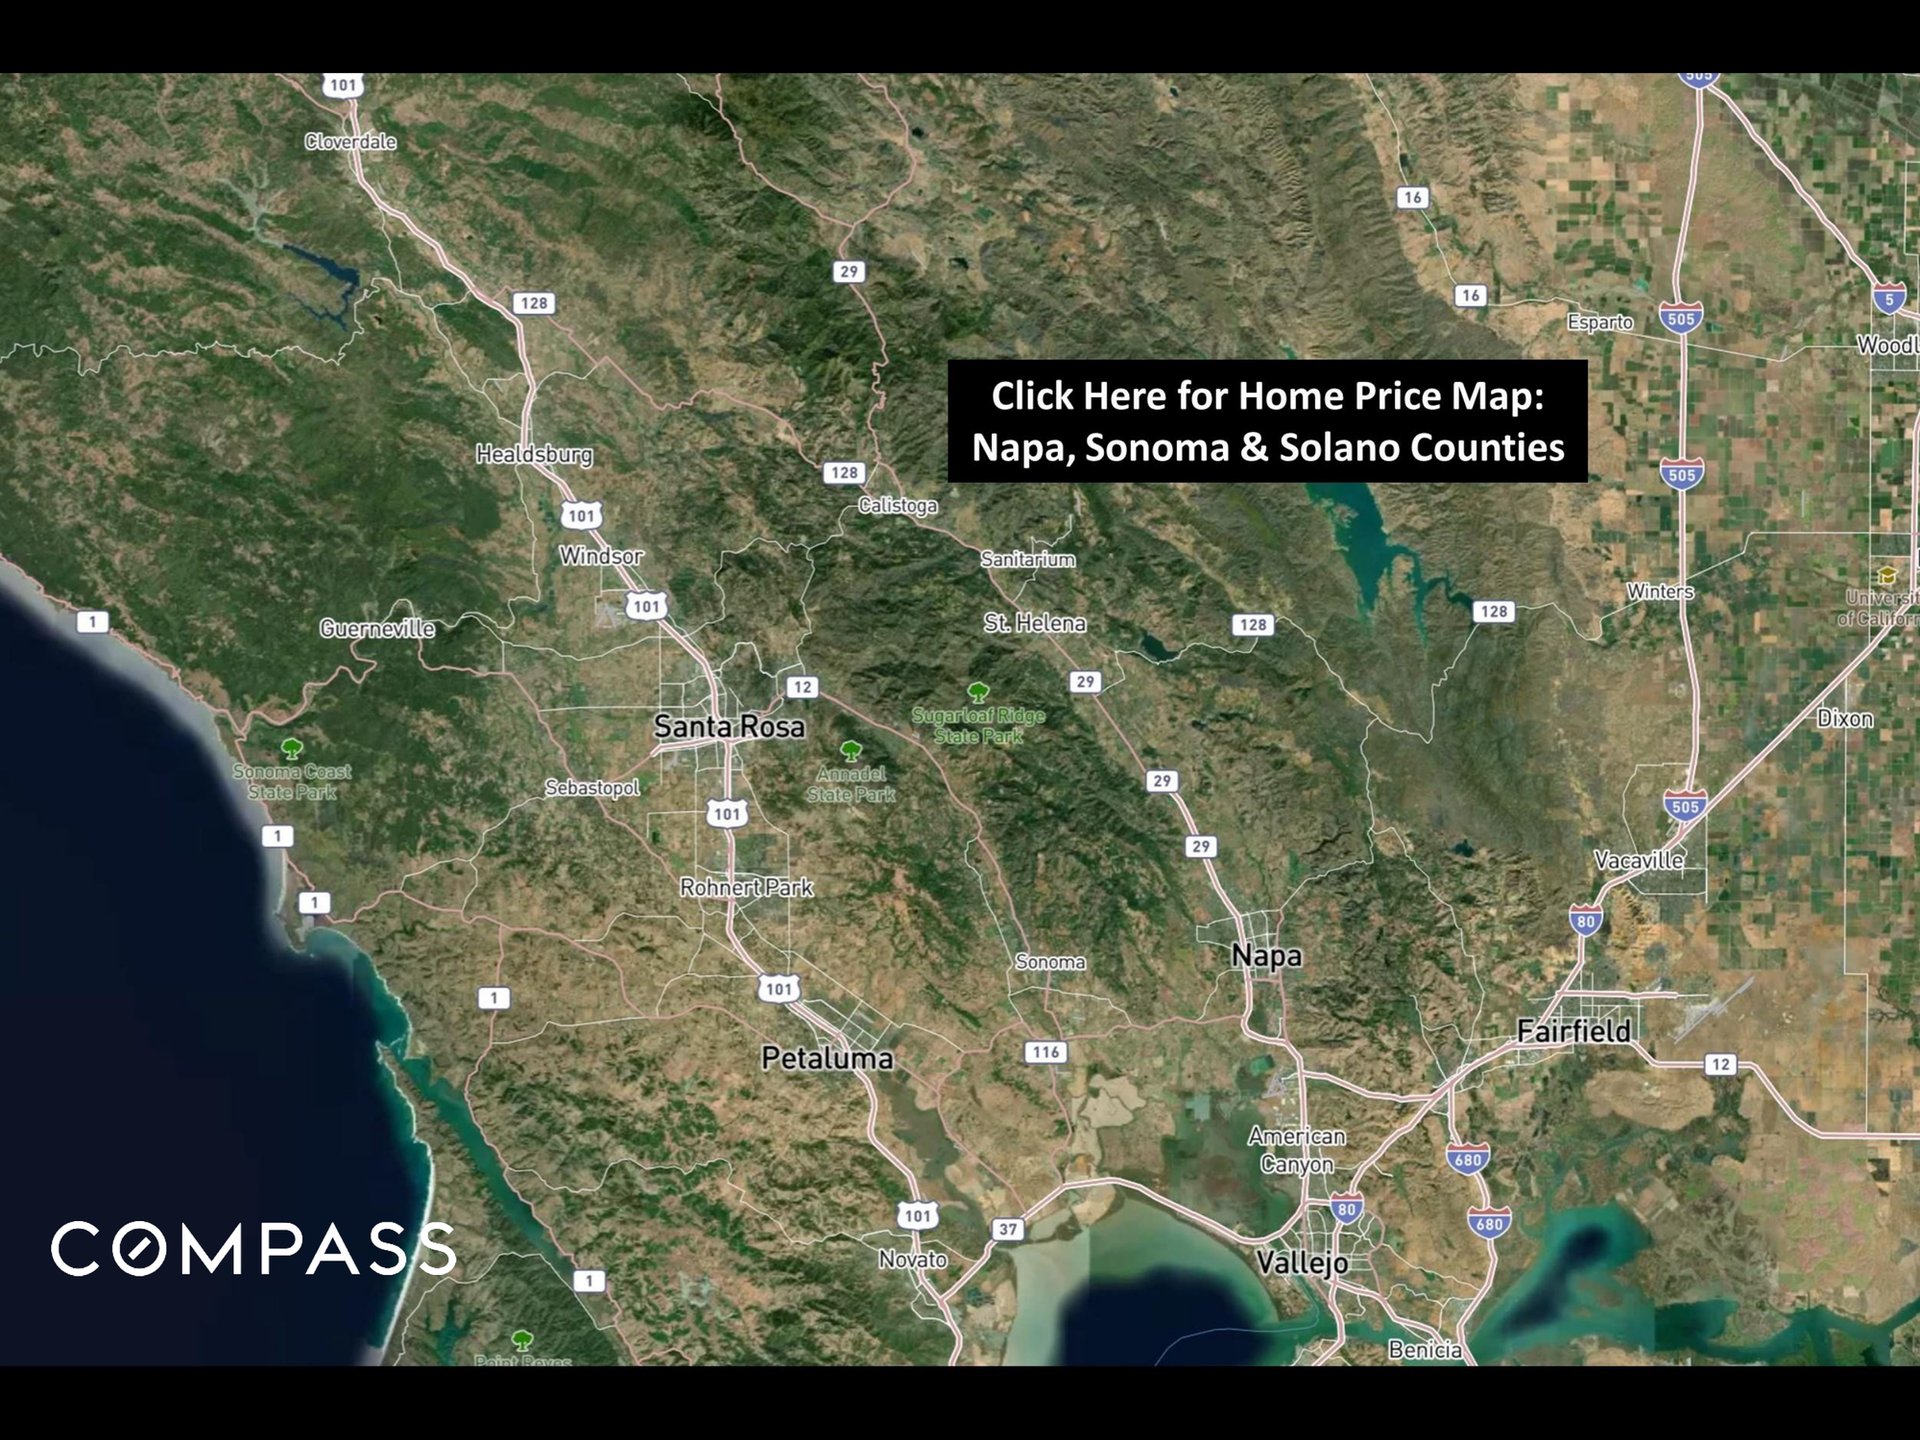
Map of Napa, Sonoma, and Solano counties showing cities, highways, and a link to the home price map.
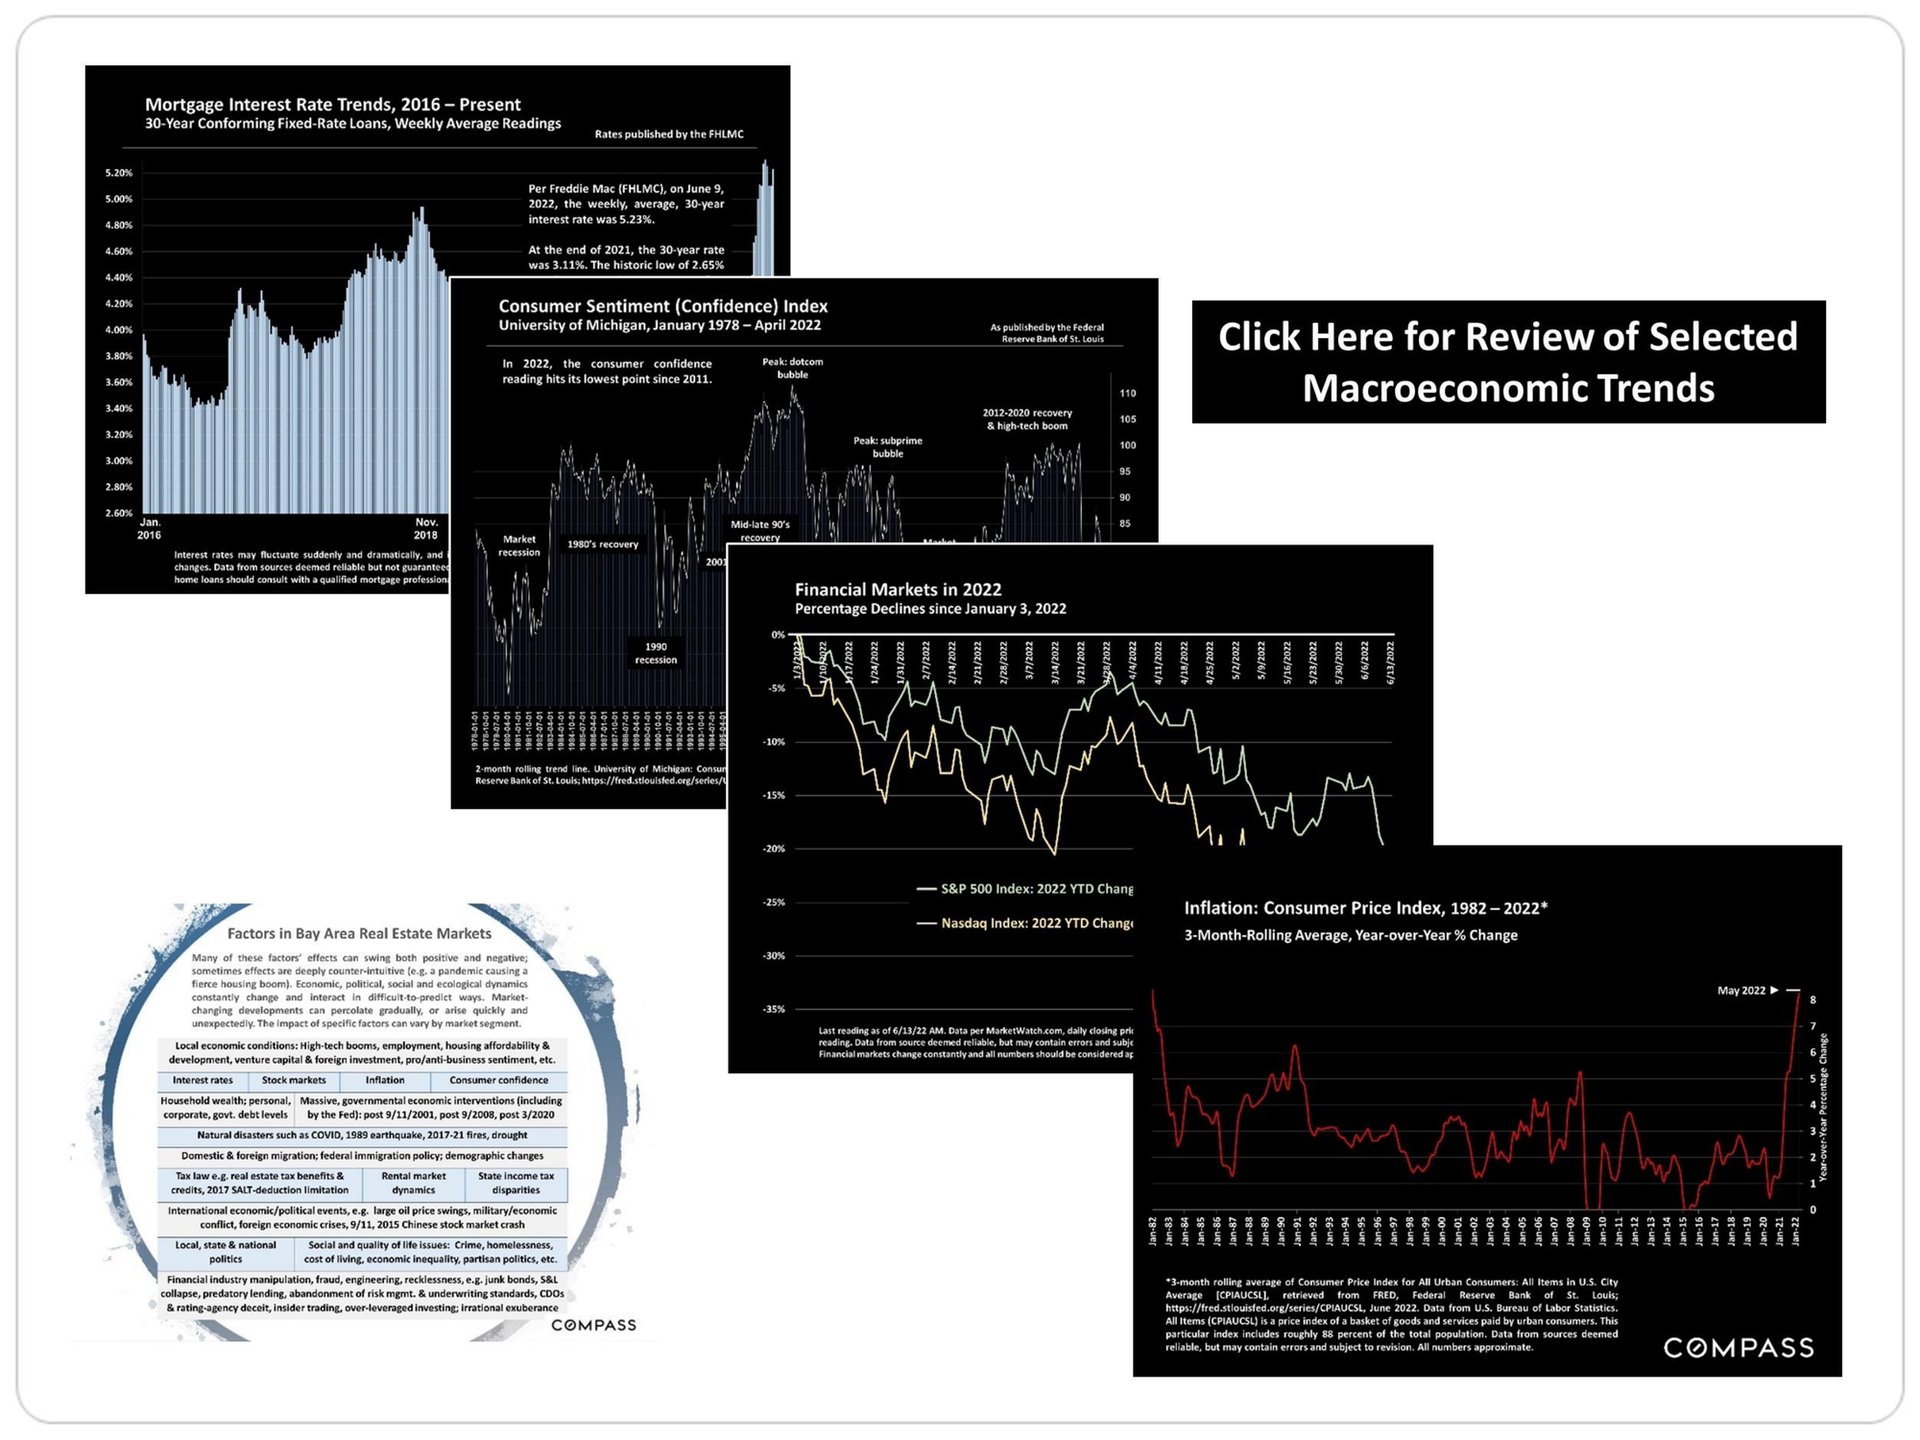
Compass macroeconomic charts and an infographic on factors affecting Bay Area real estate markets.
Napa County home sales chart comparing 2021–2024 counts across six price segments.
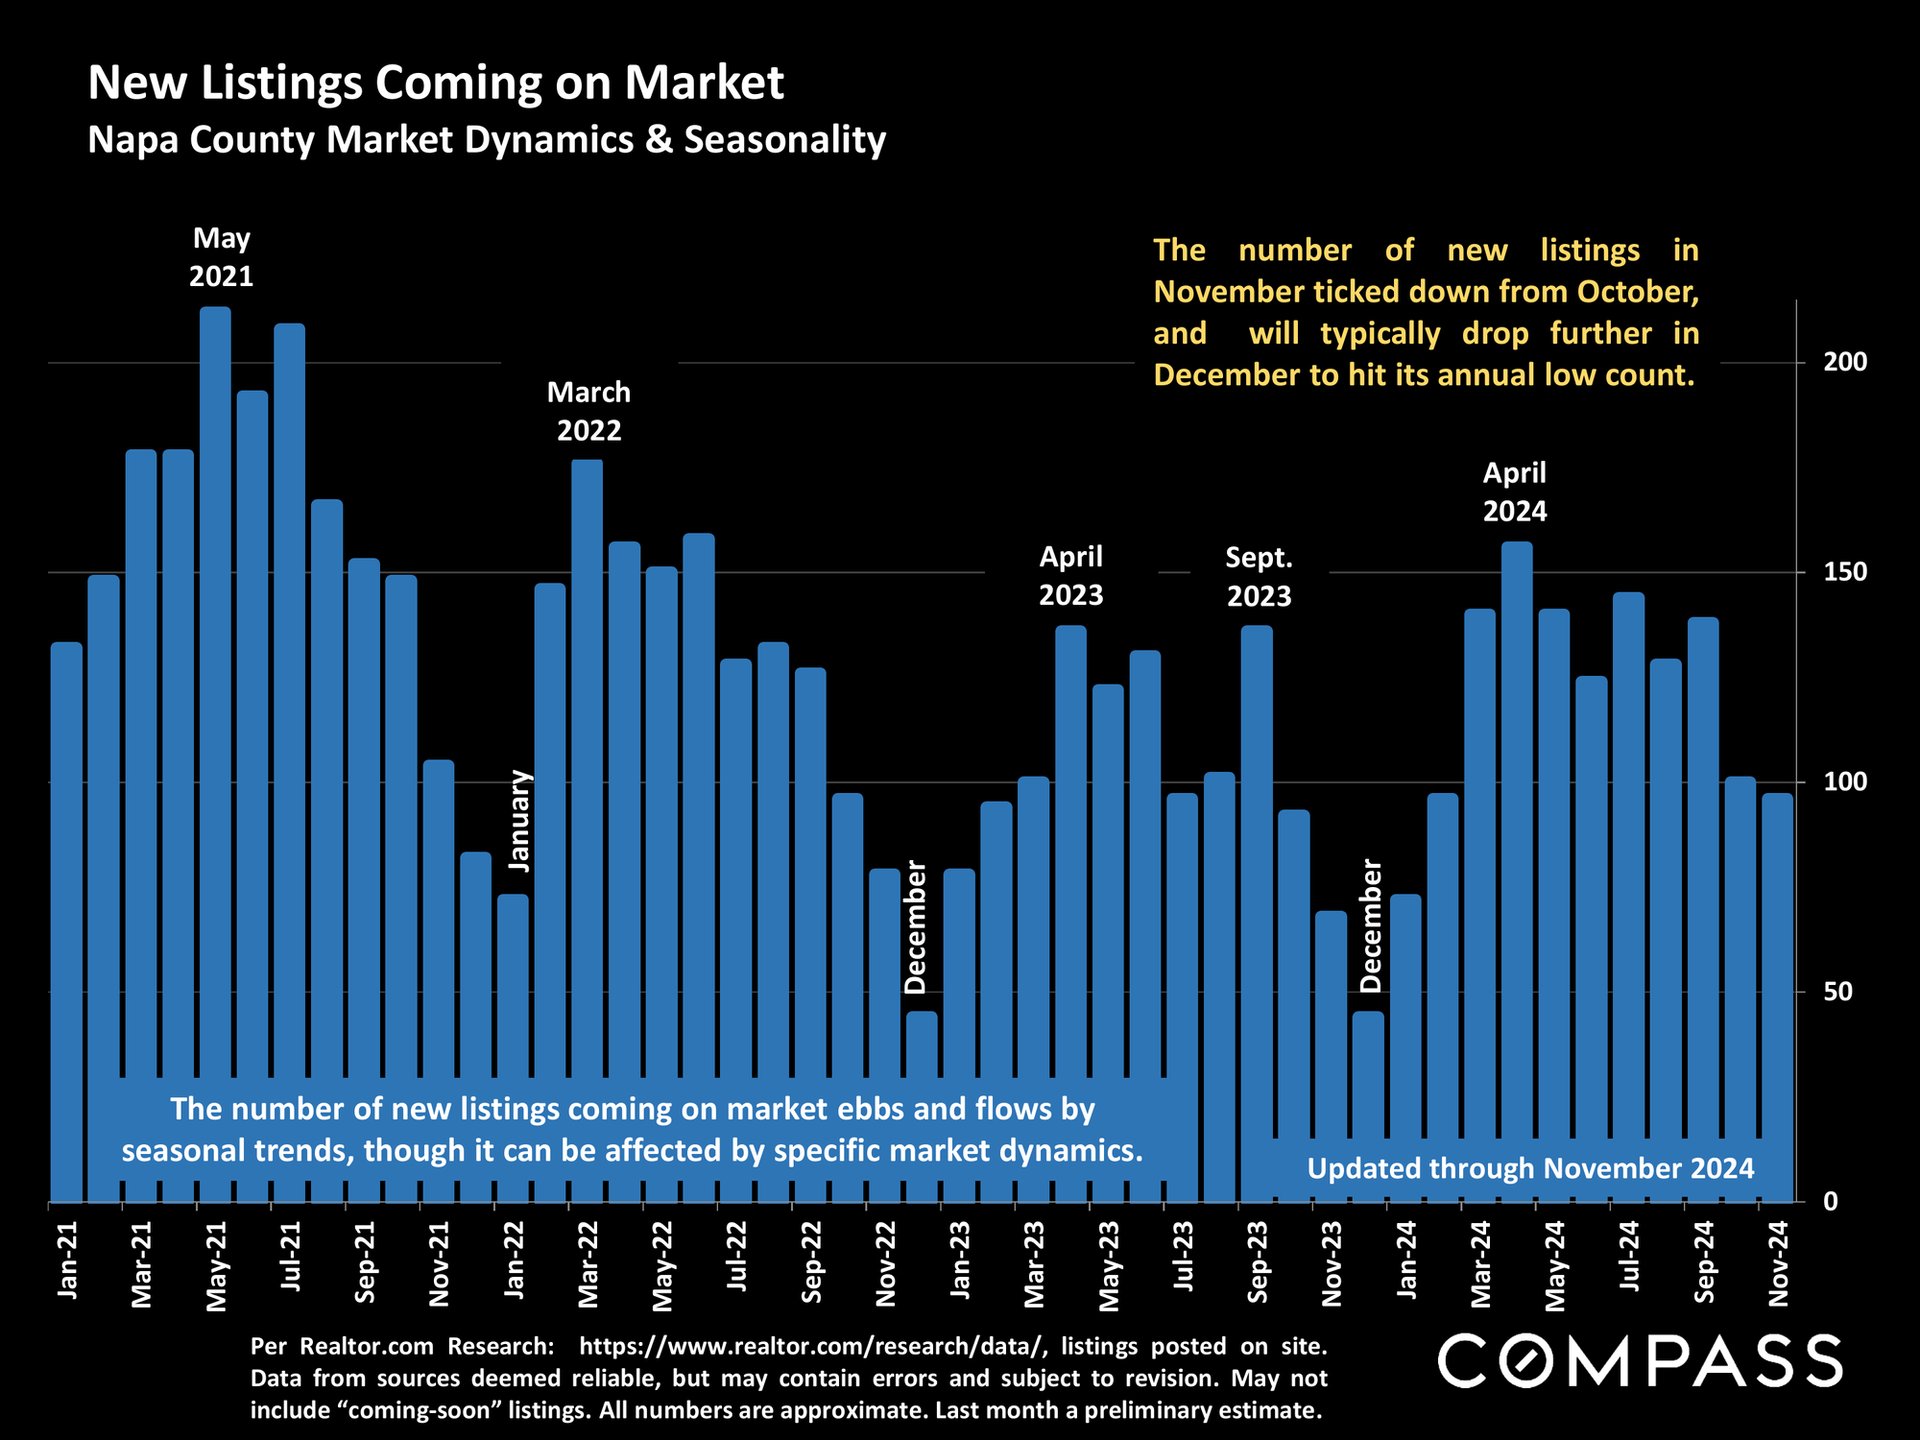
Napa County new-listings bar chart from January 2021 through November 2024, with seasonal notes and a Compass wordmark.
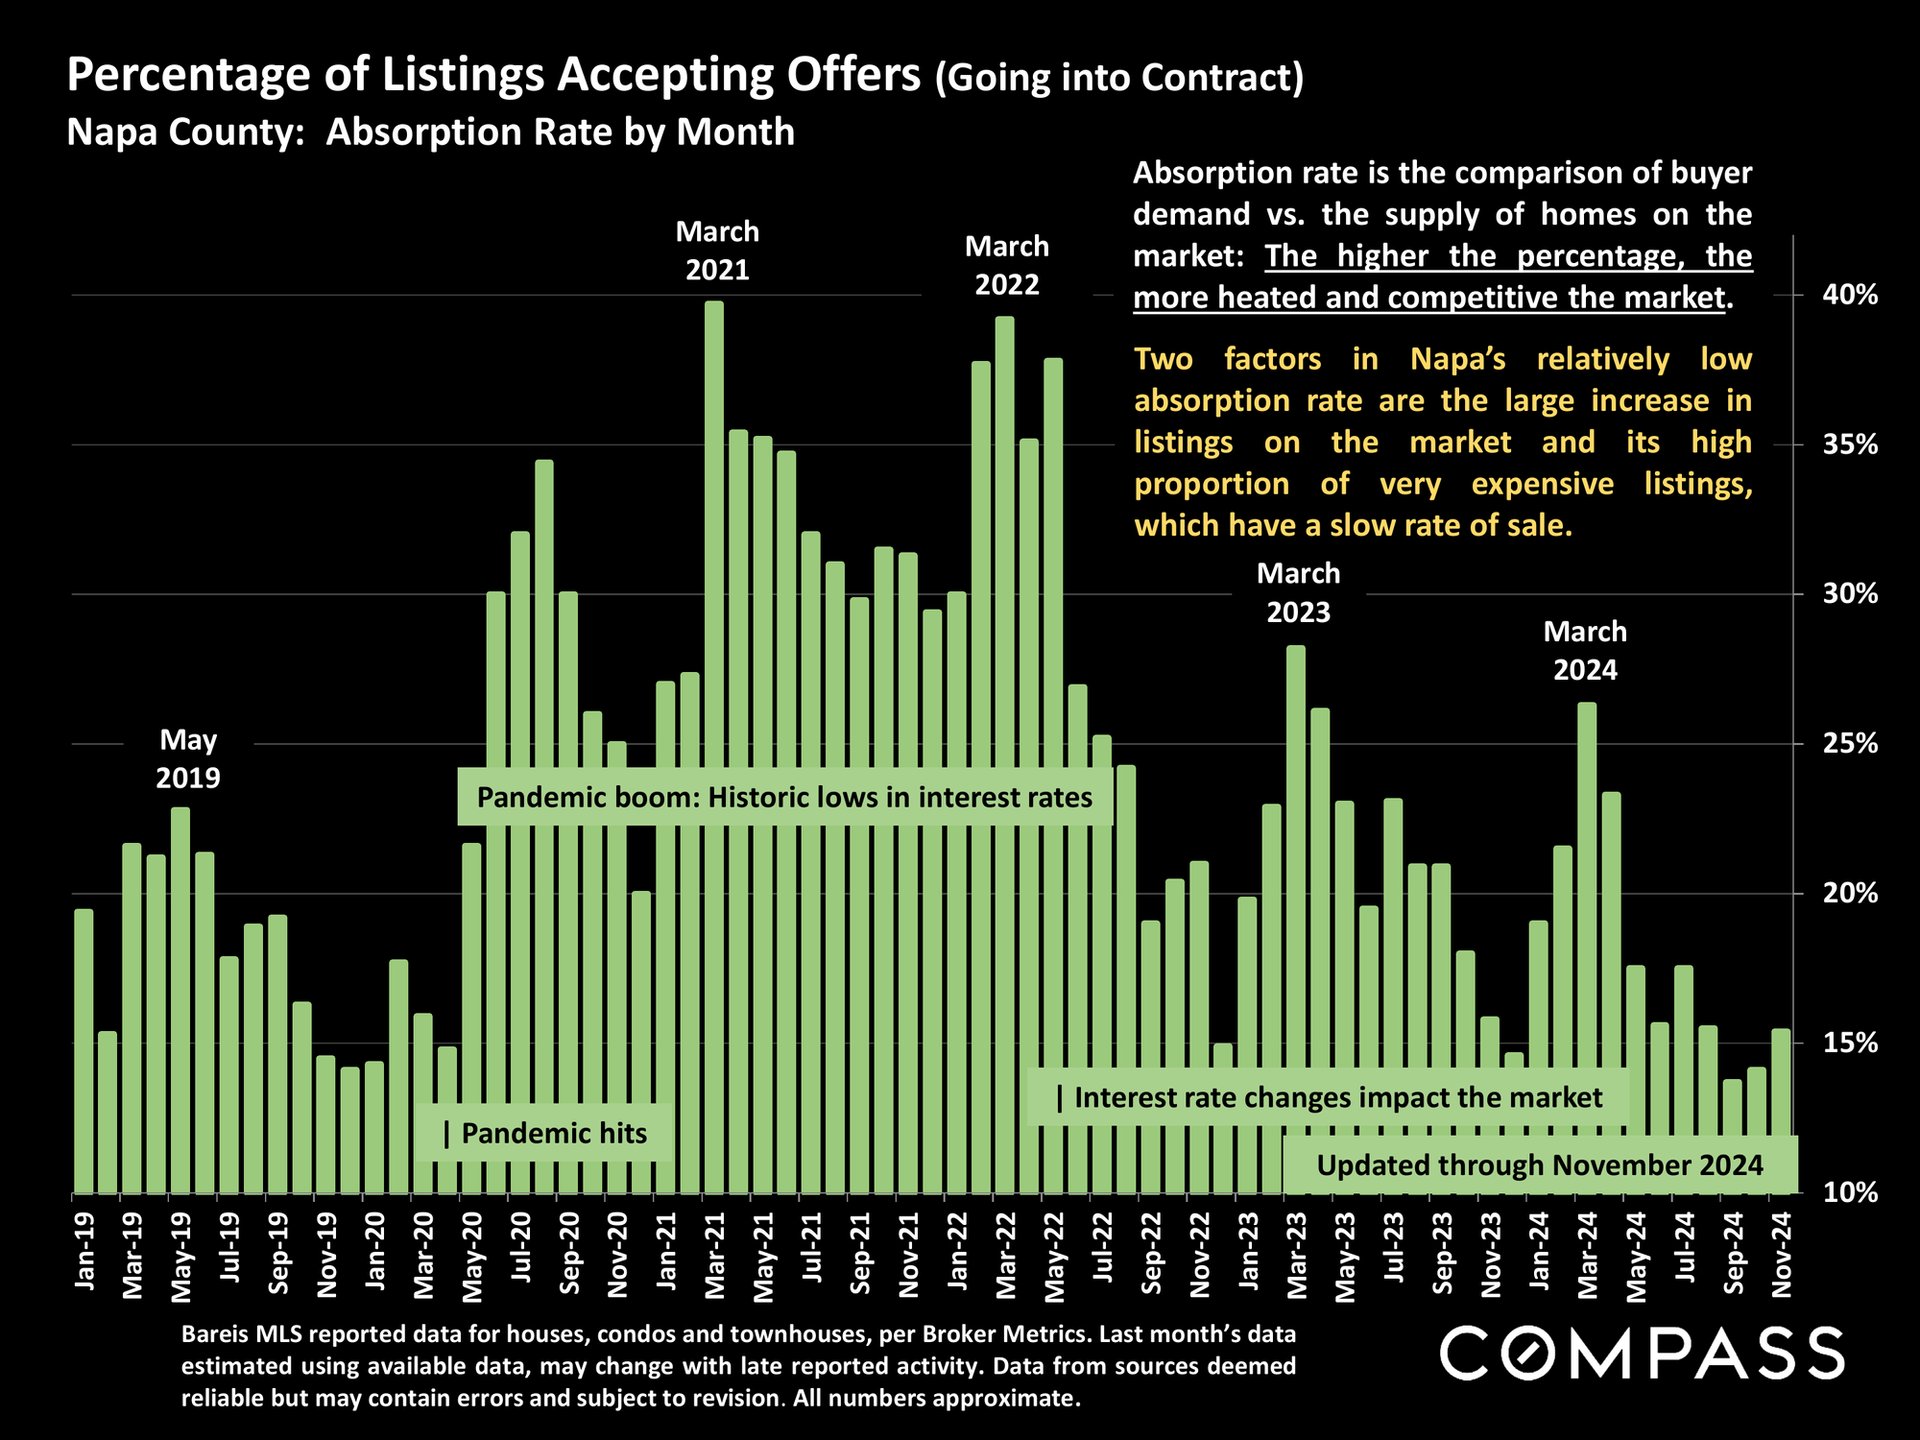
Bar chart of Napa County listings accepting offers by month from January 2019 to November 2024.
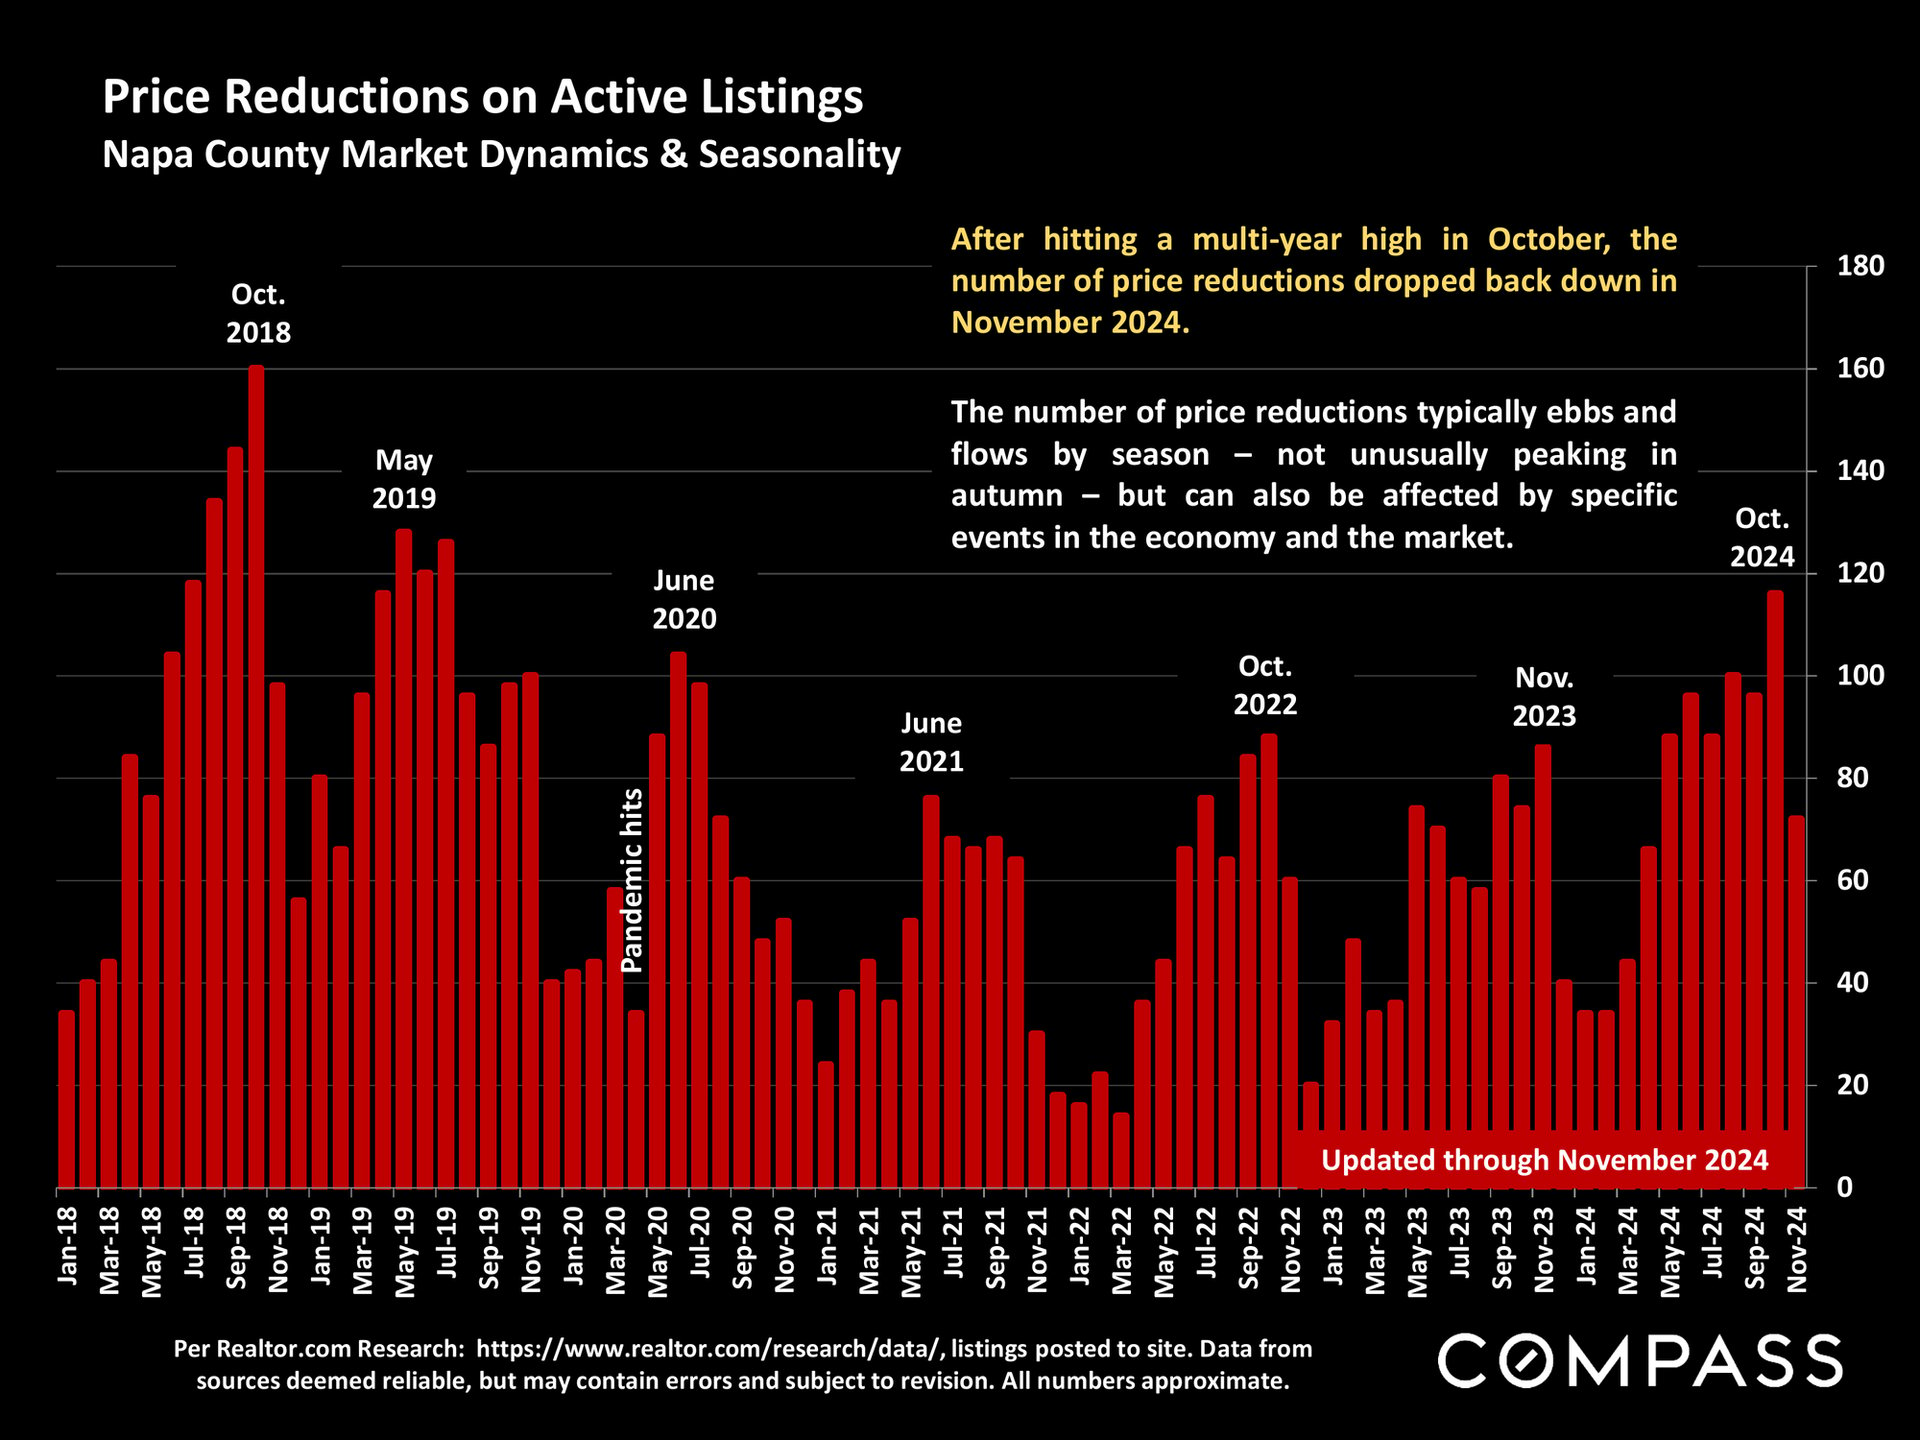
Chart of monthly Napa County active-listing price reductions, January 2018–November 2024, with red bars and historical peaks.


WORK WITH US

We offer the highest level of service and expertise to our clients. Our team has built a reputation for consistently representing the finest real estate in San Francisco and Napa Valley. Results driven and dedicated to your success, whether buying, selling, renting or investing. Contact us today for a private consultation.

Contact Us