Napa County - October 2023

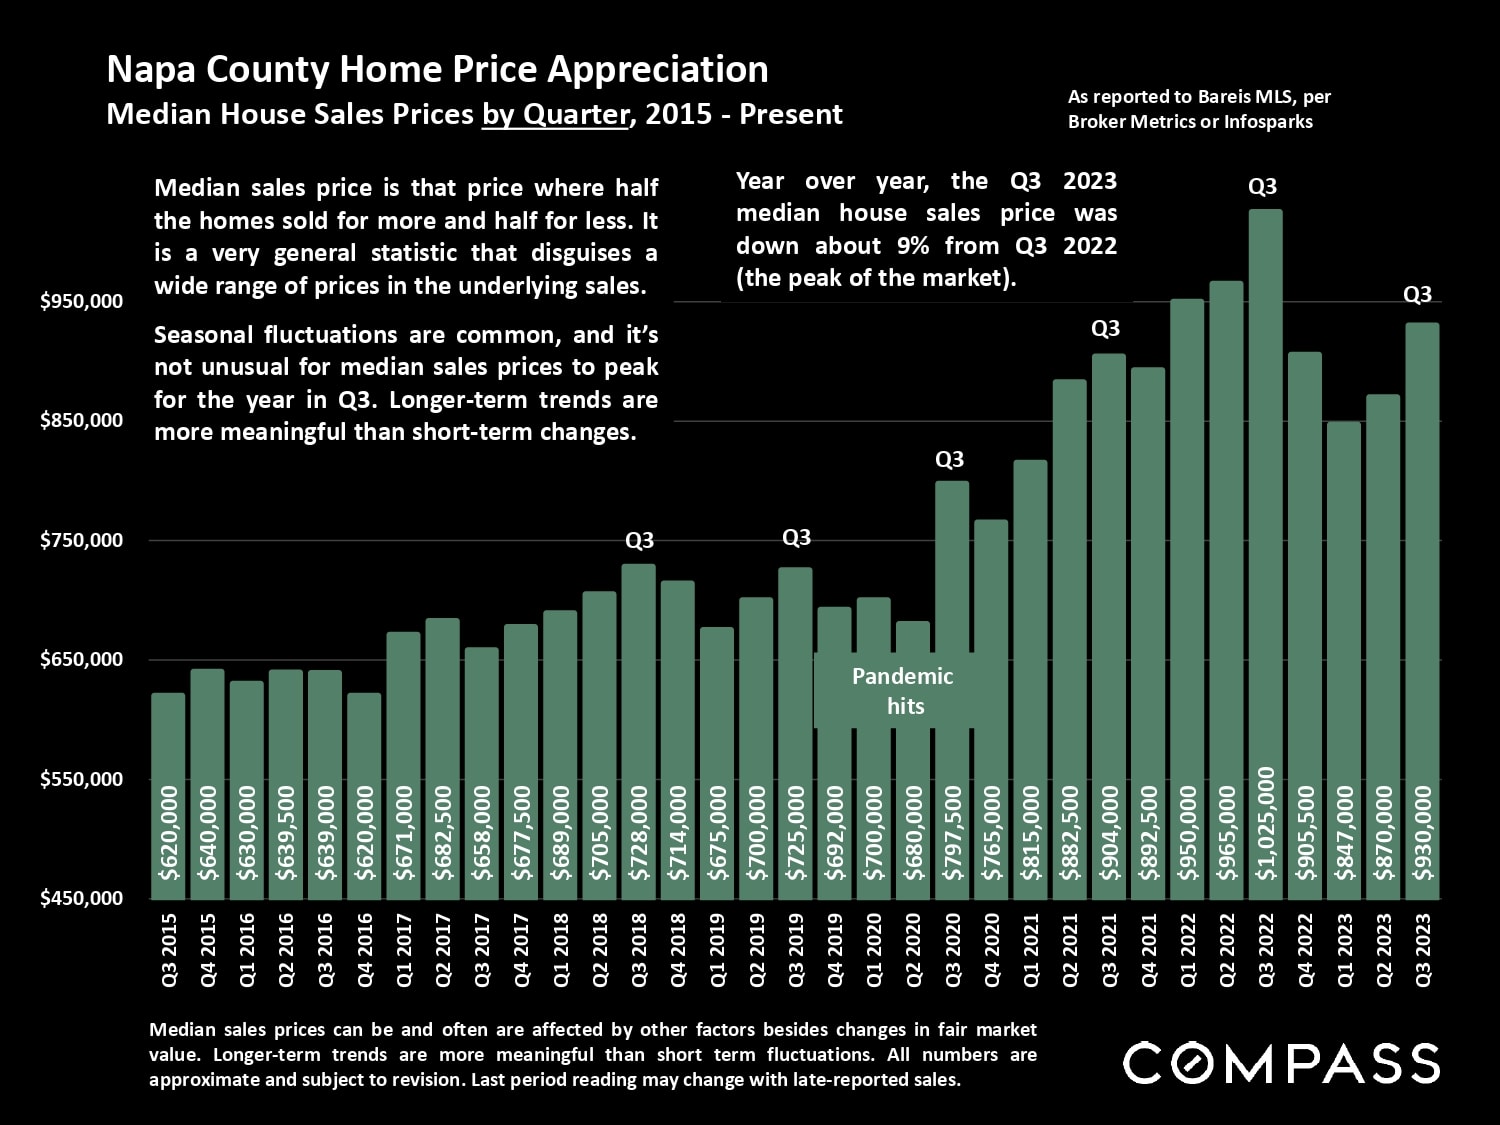
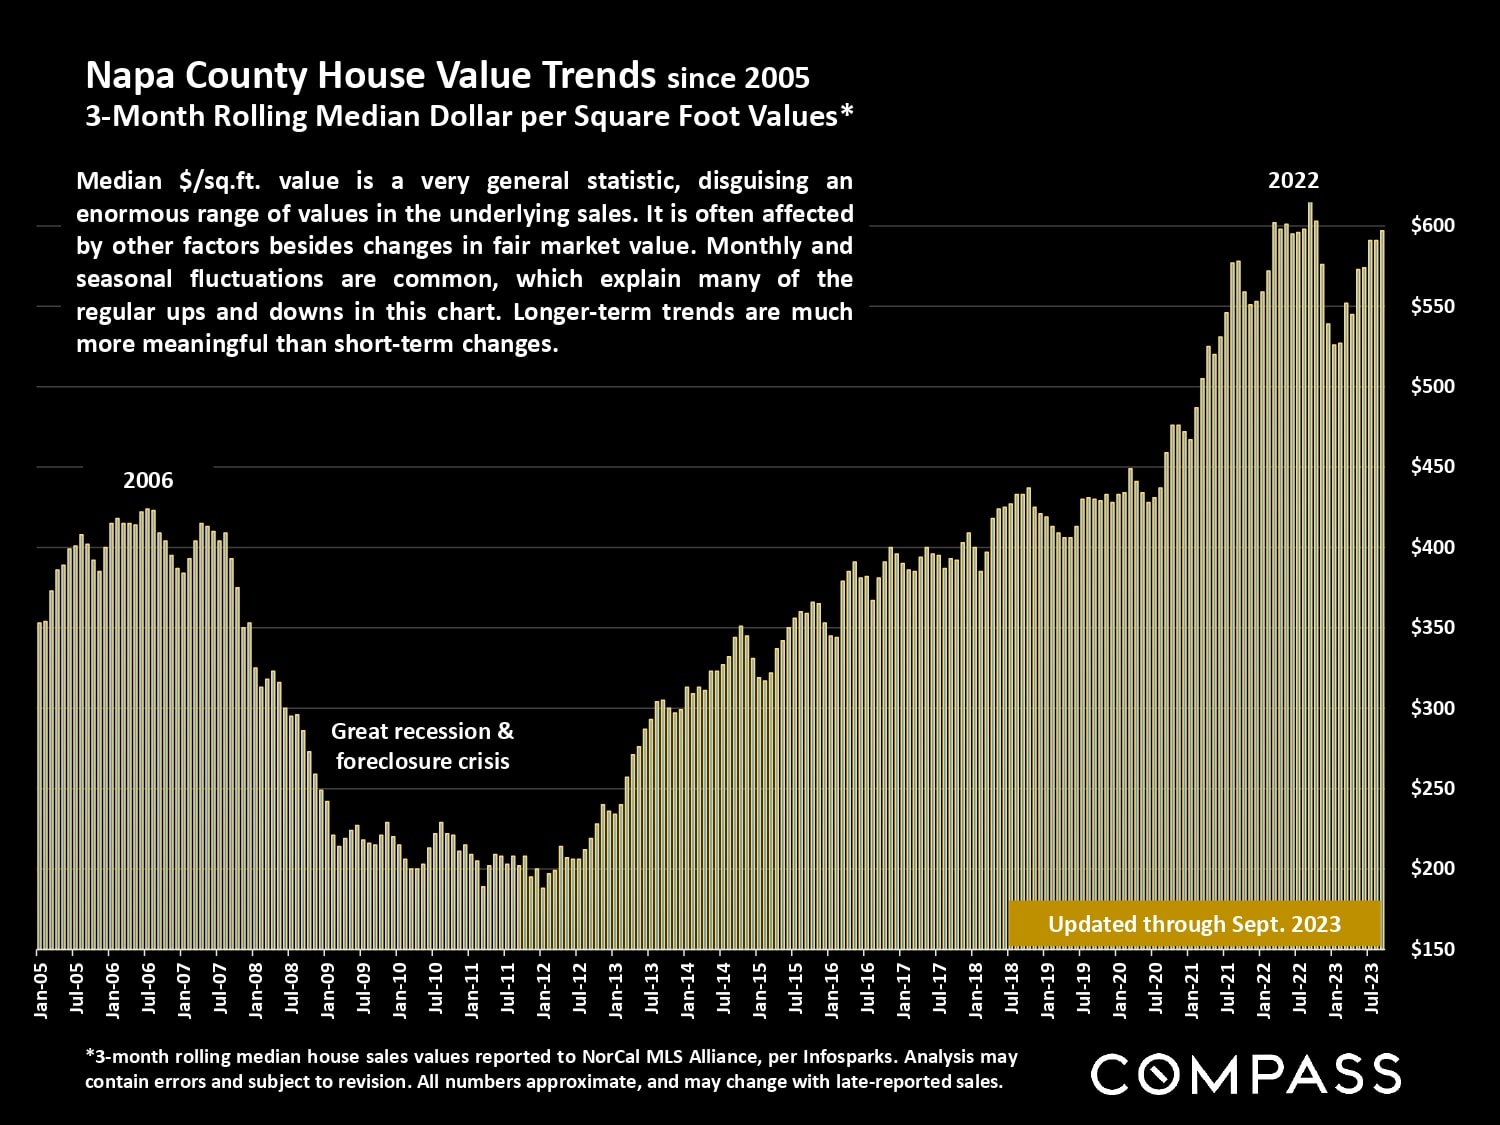
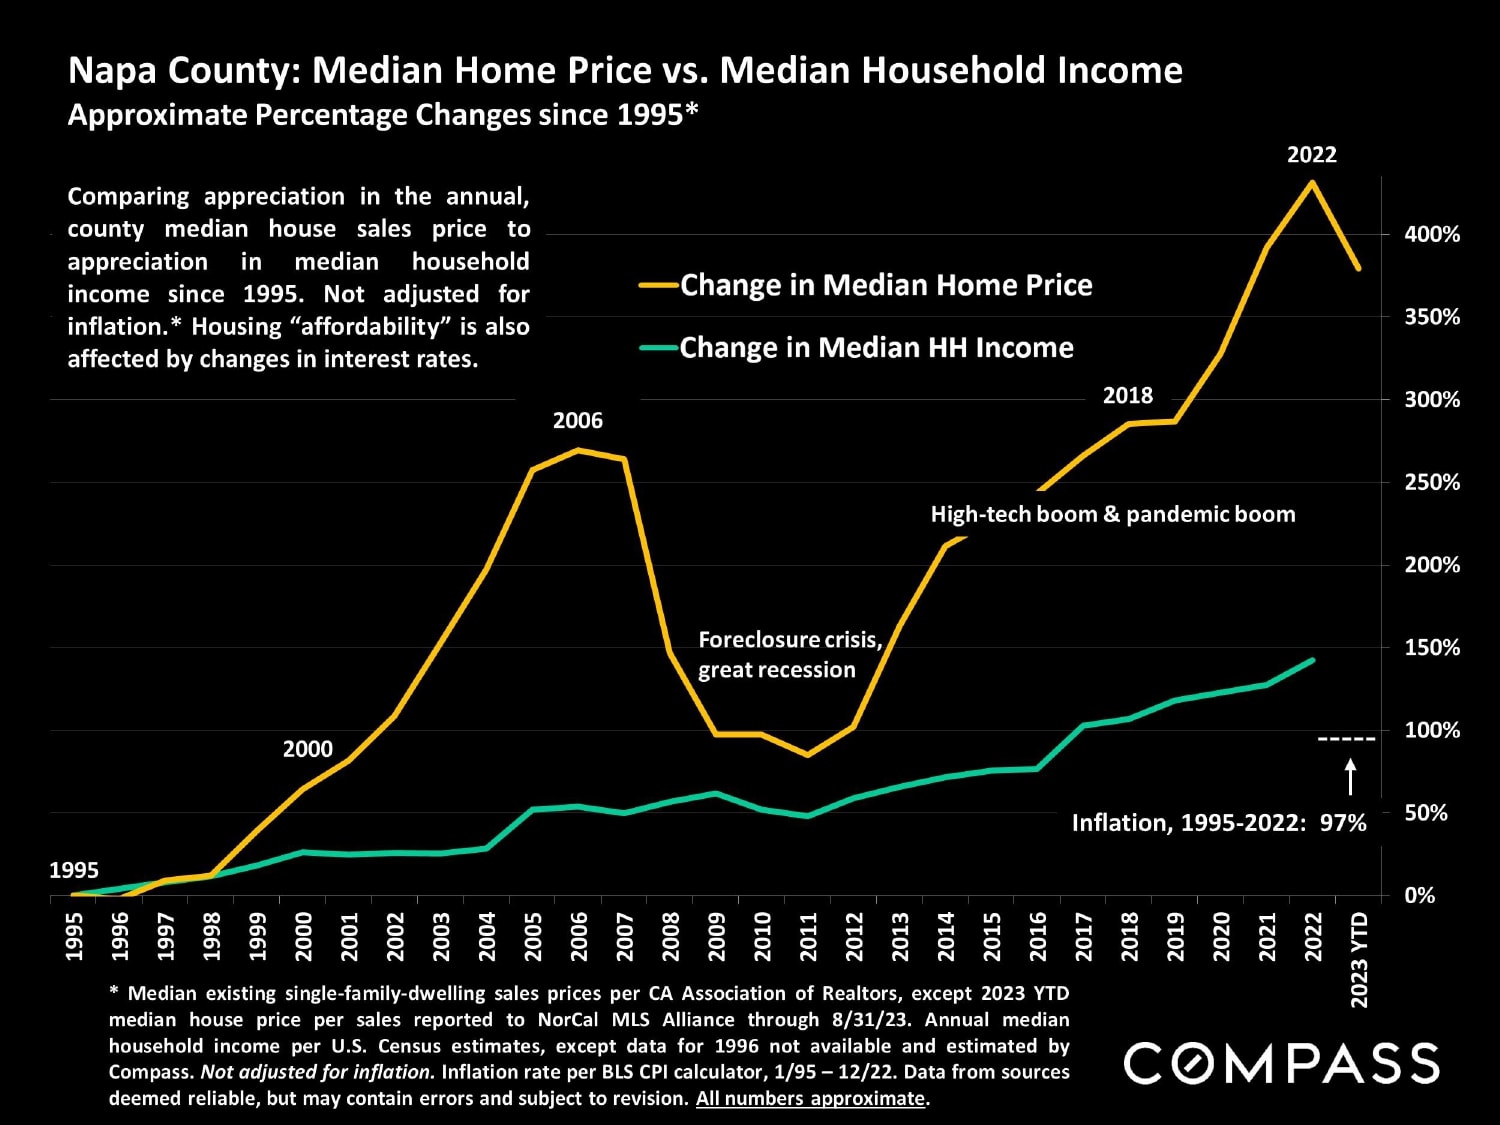
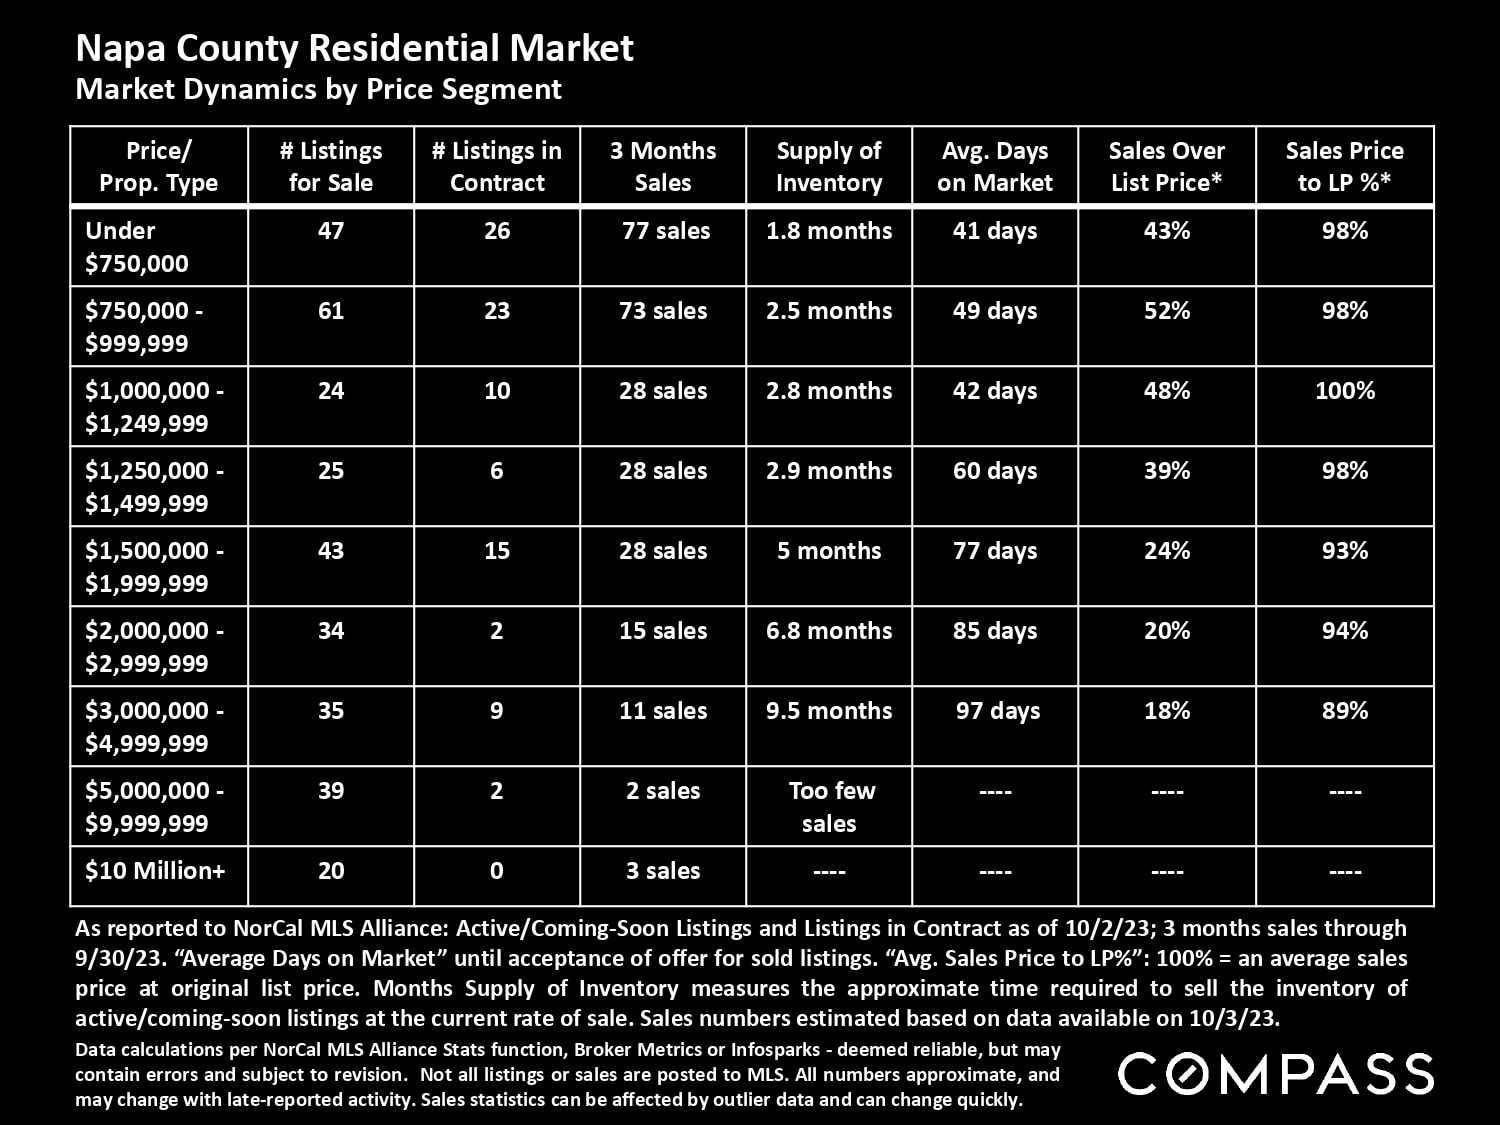
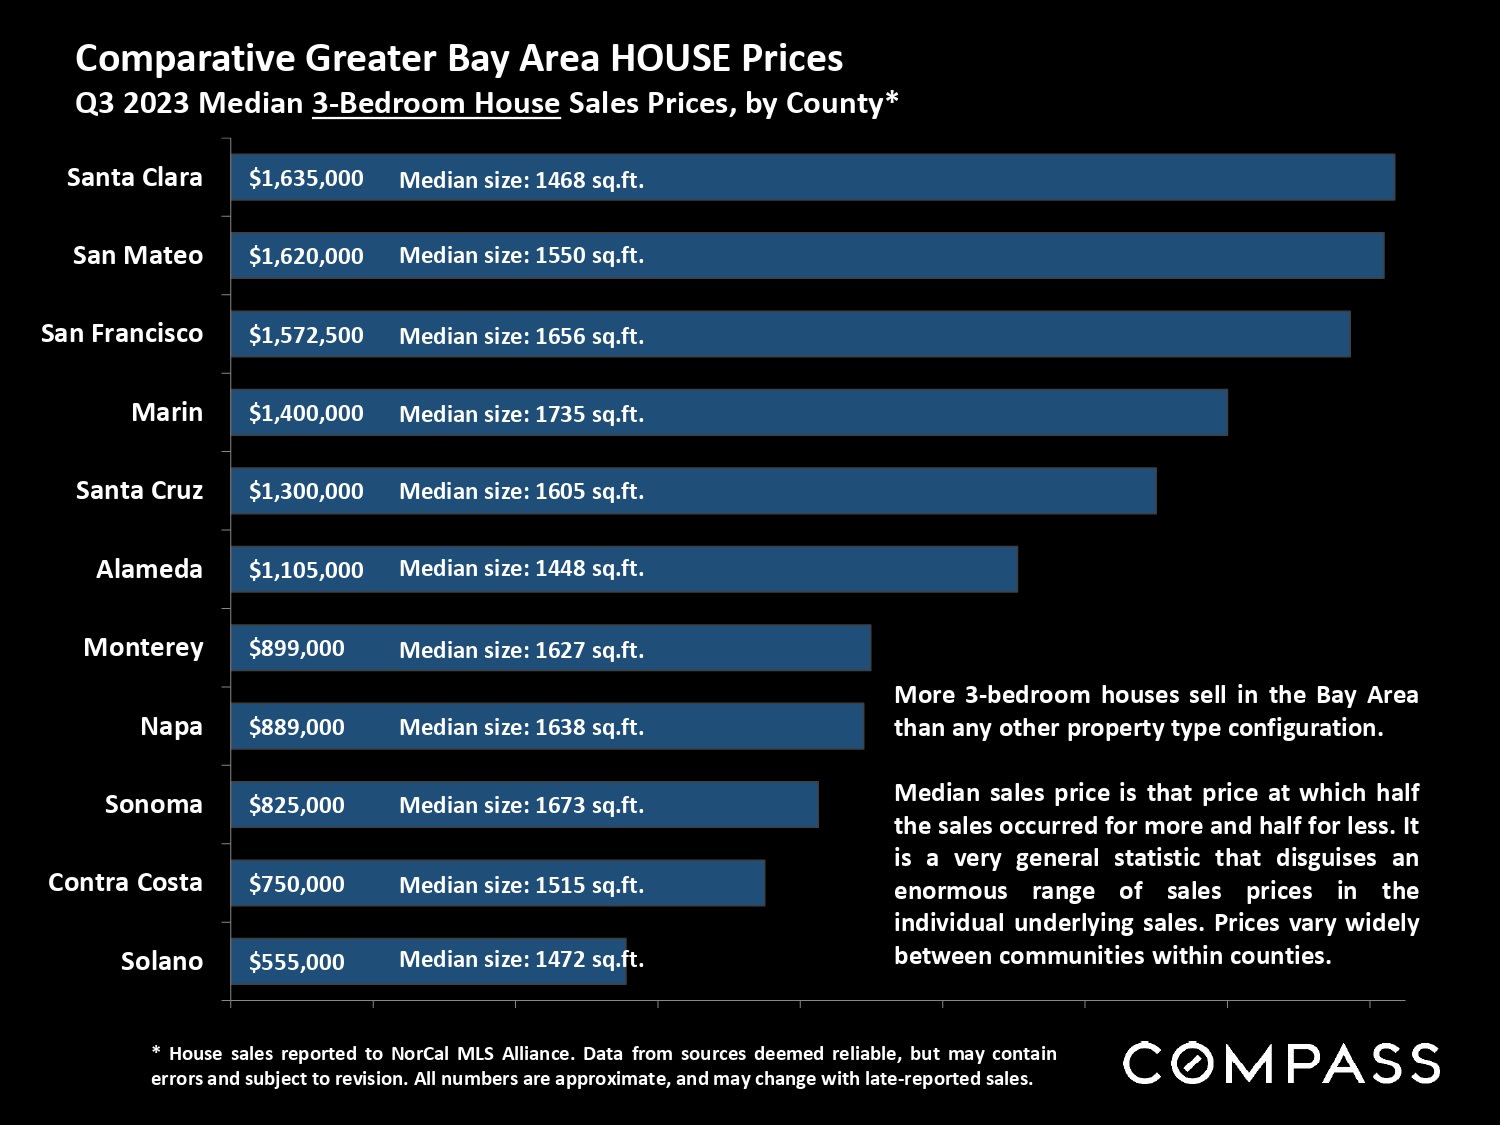
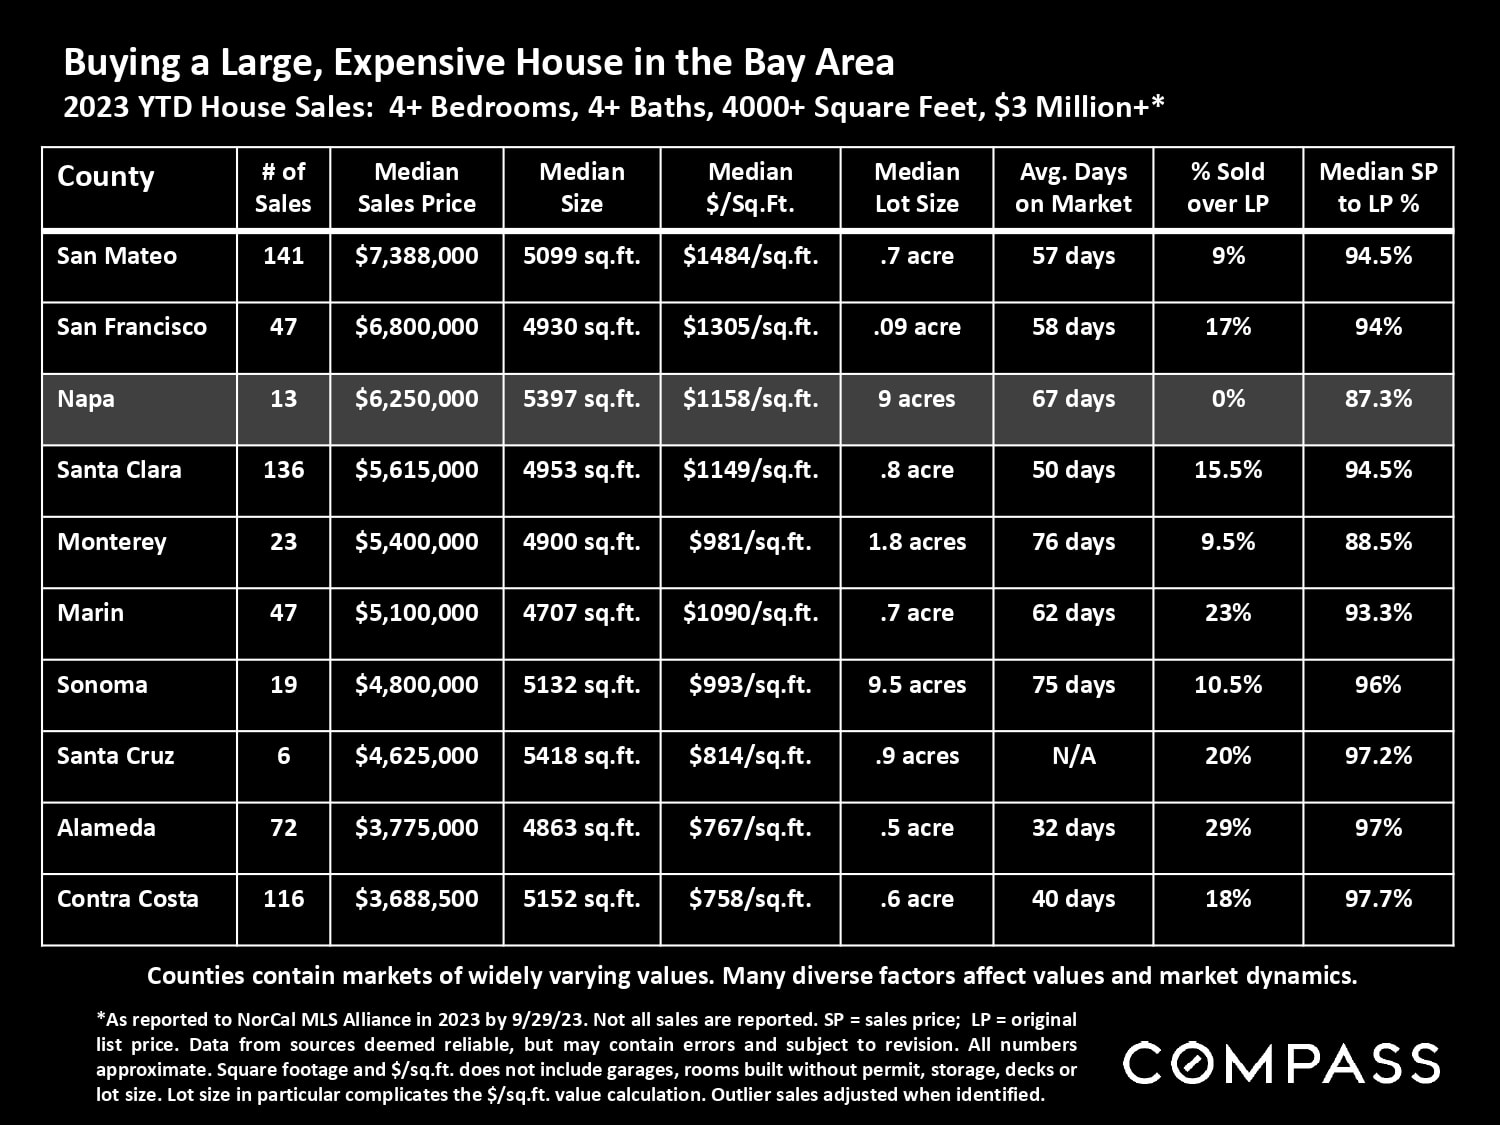
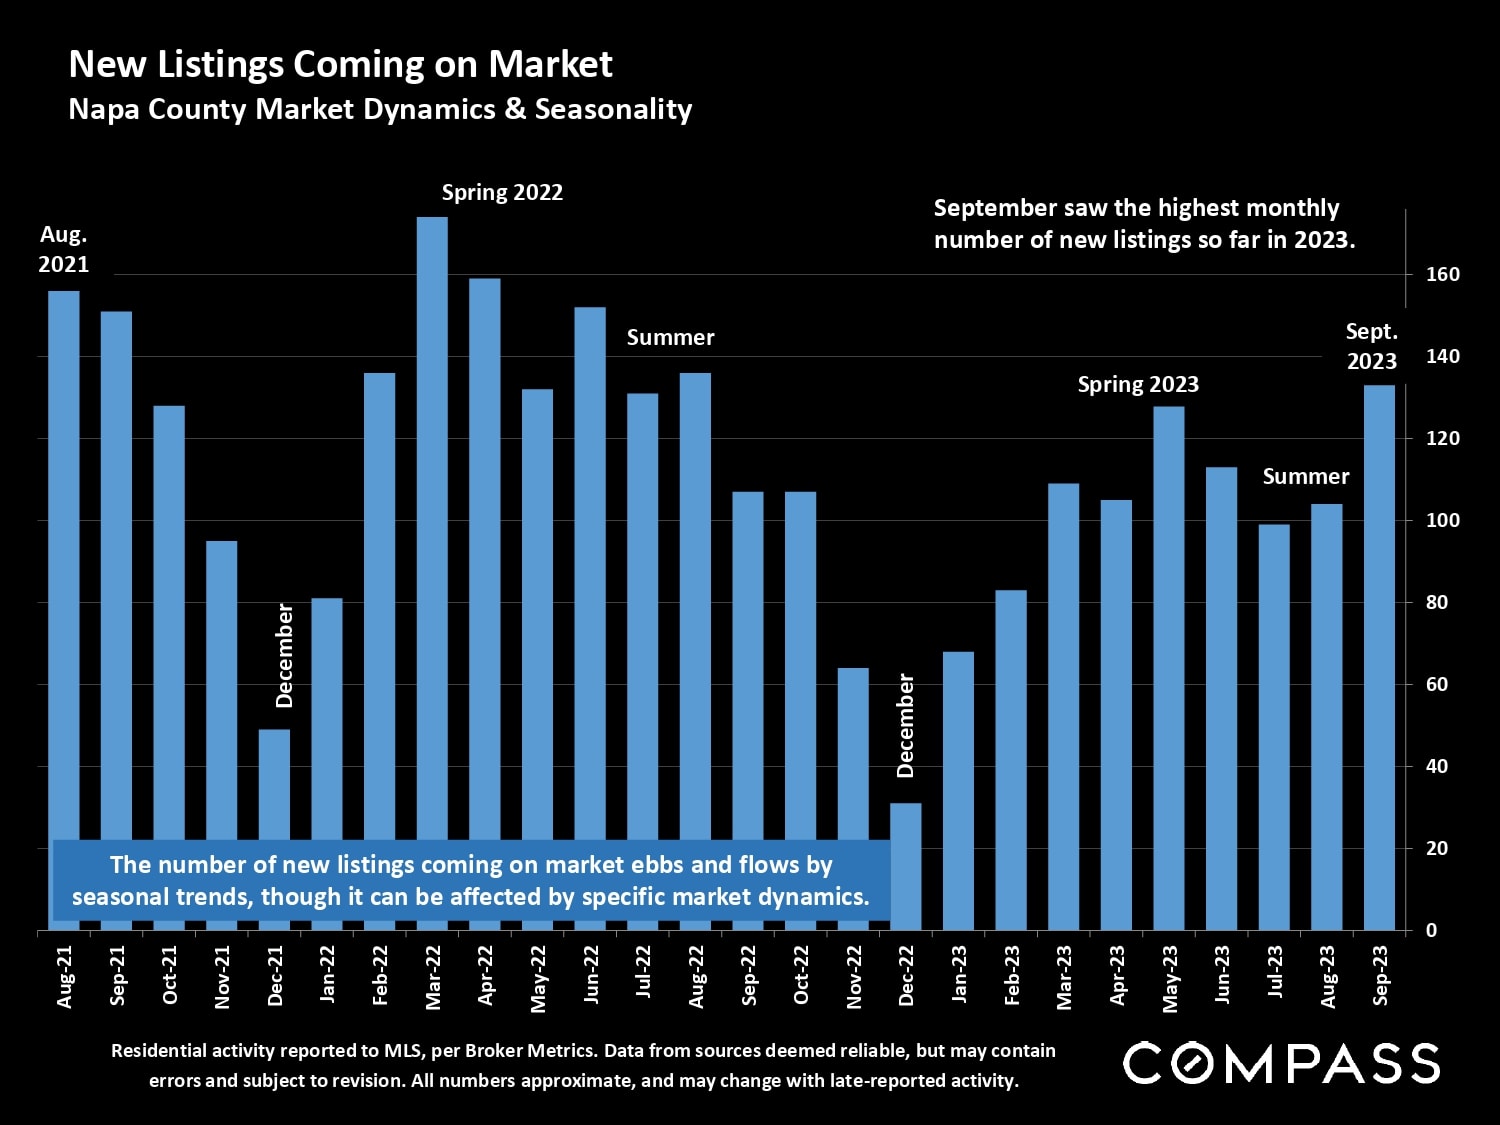
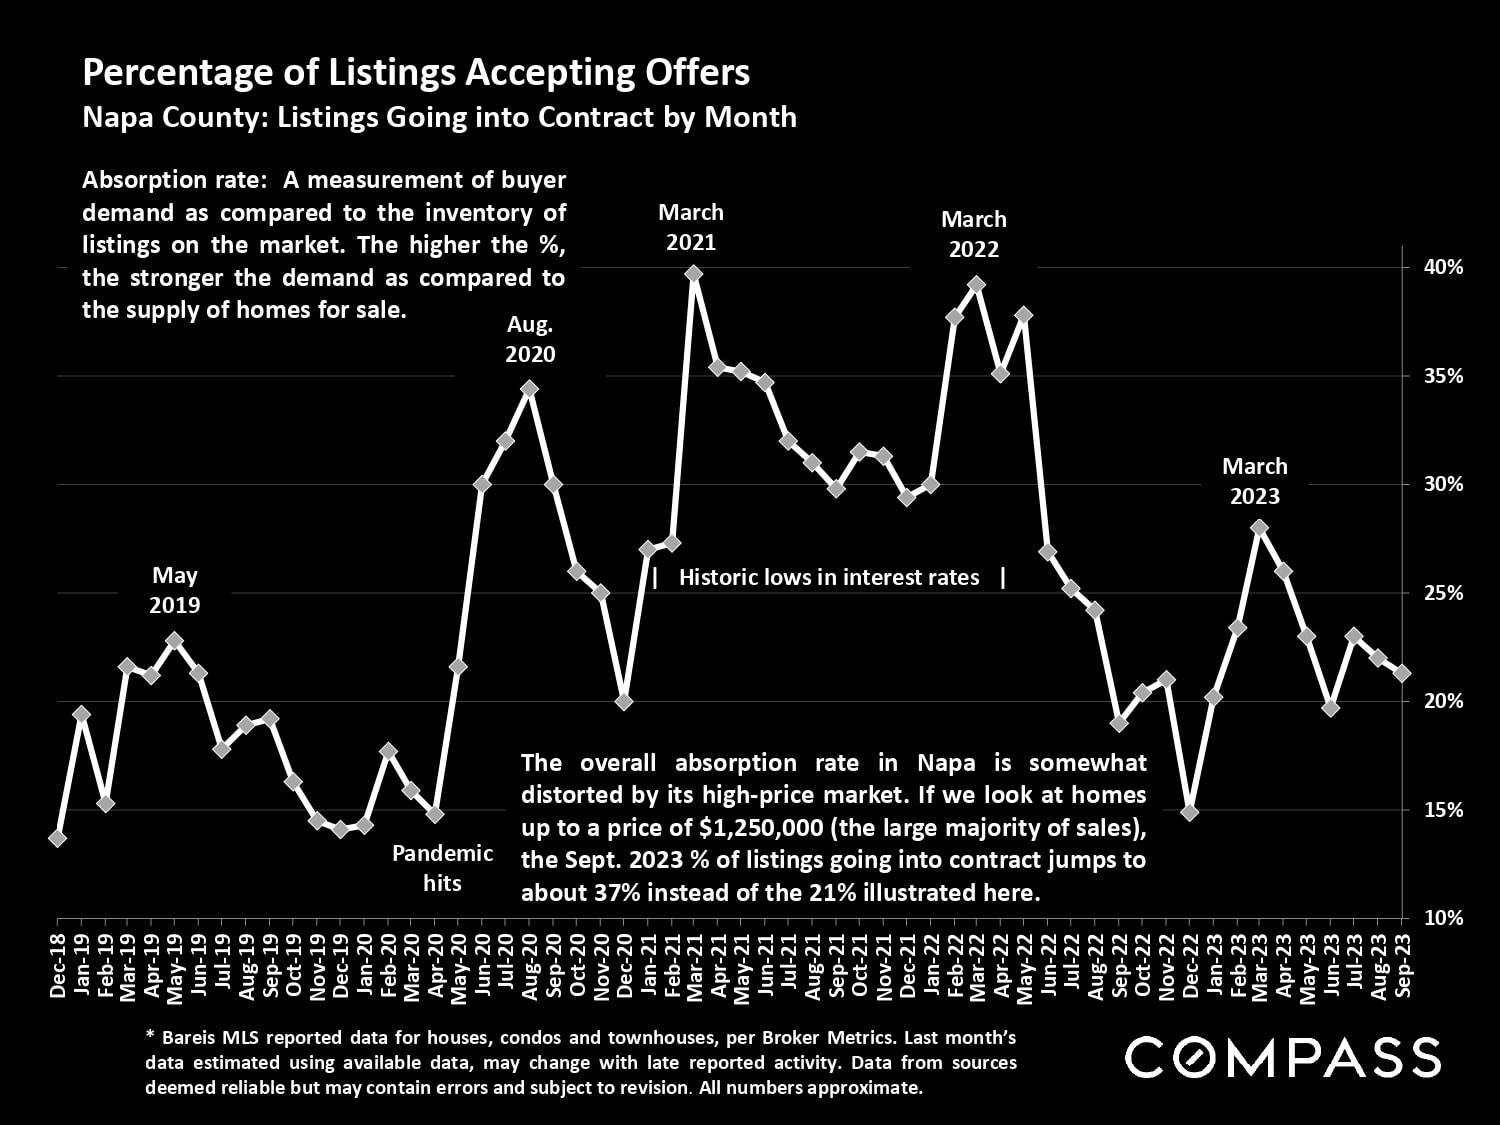
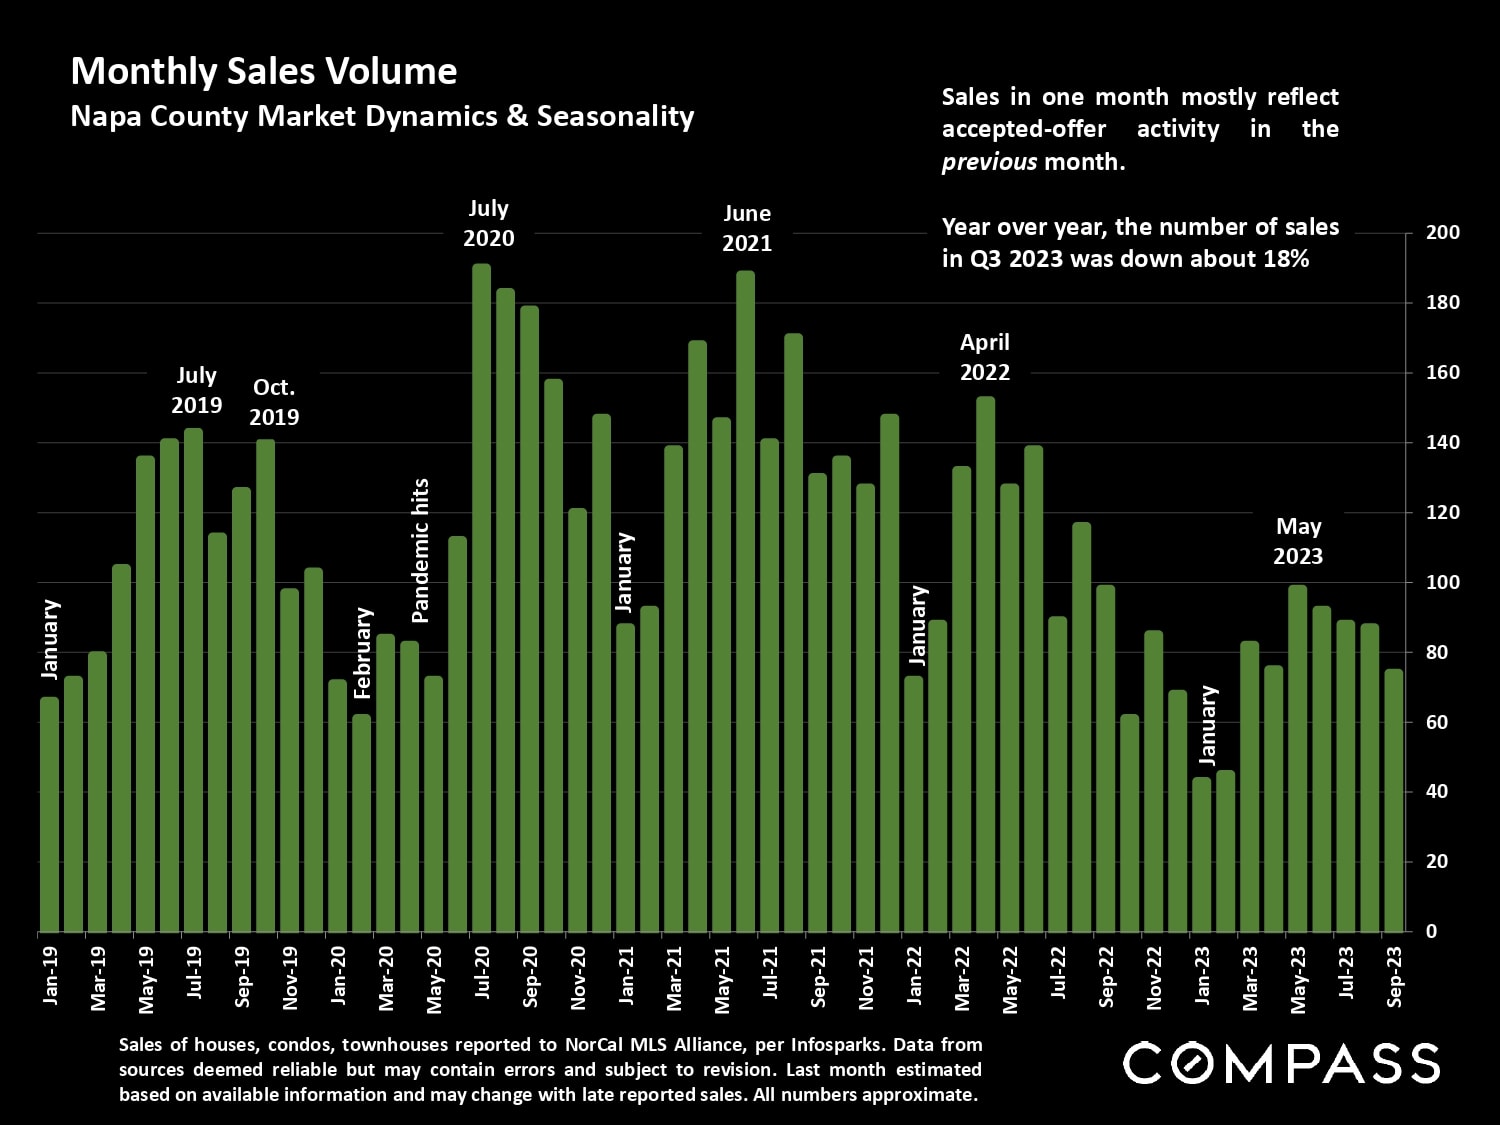
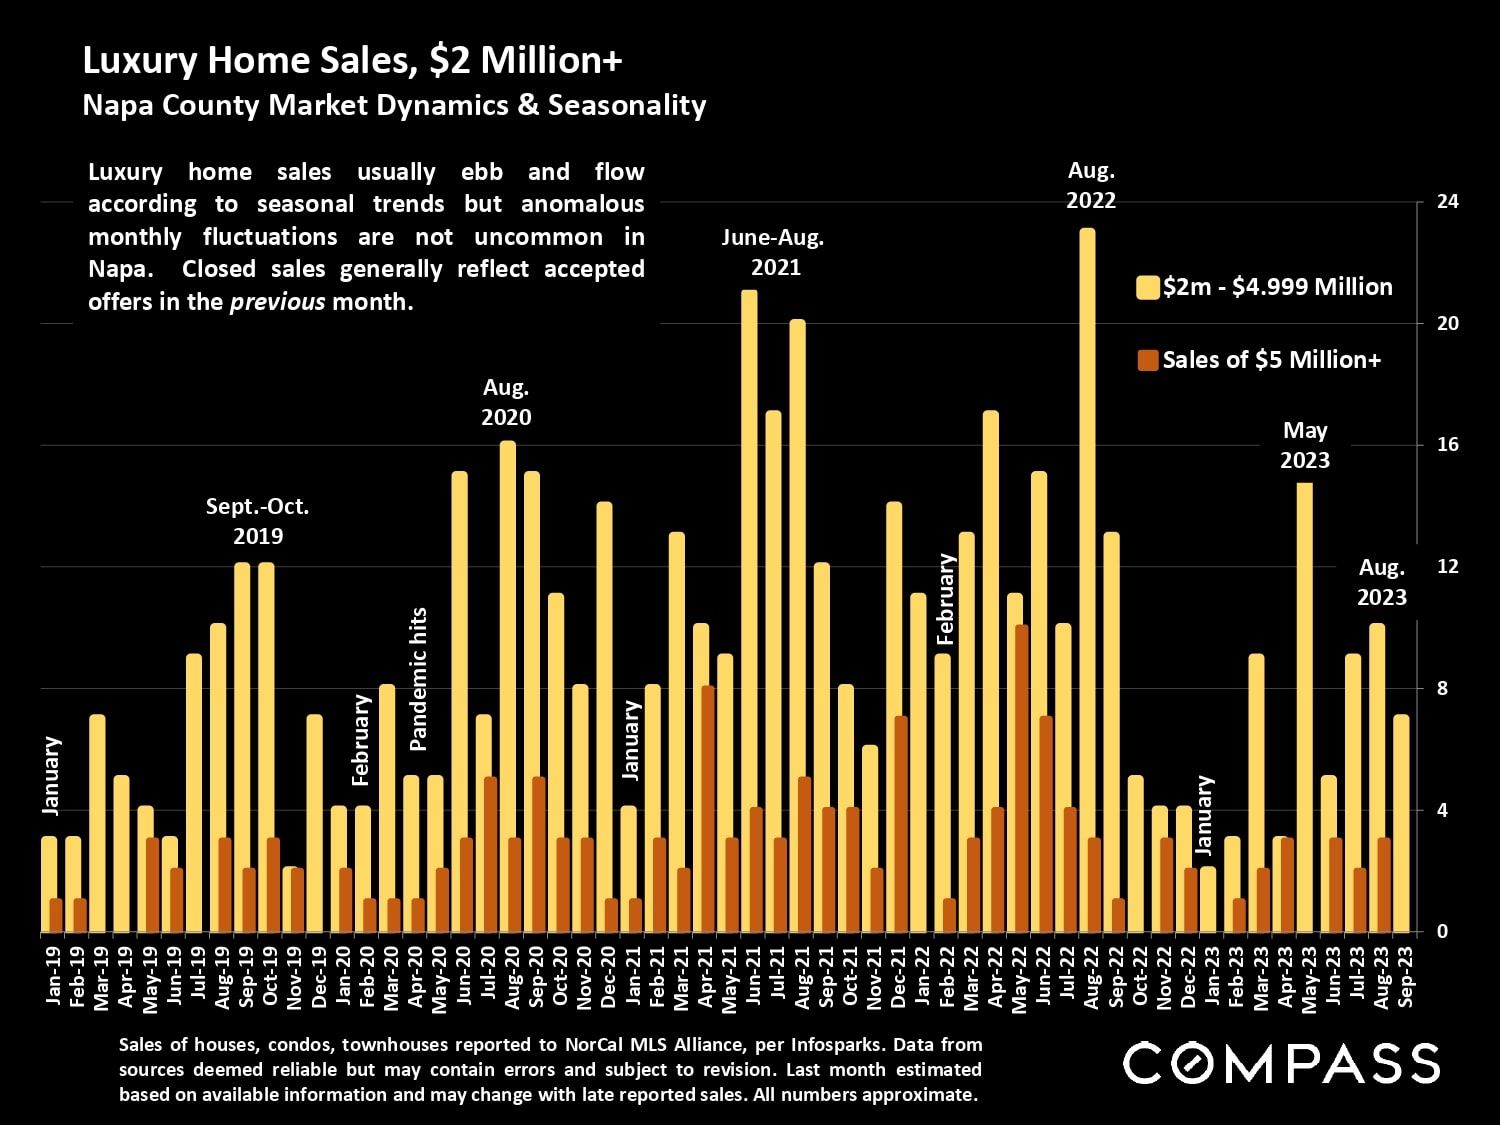
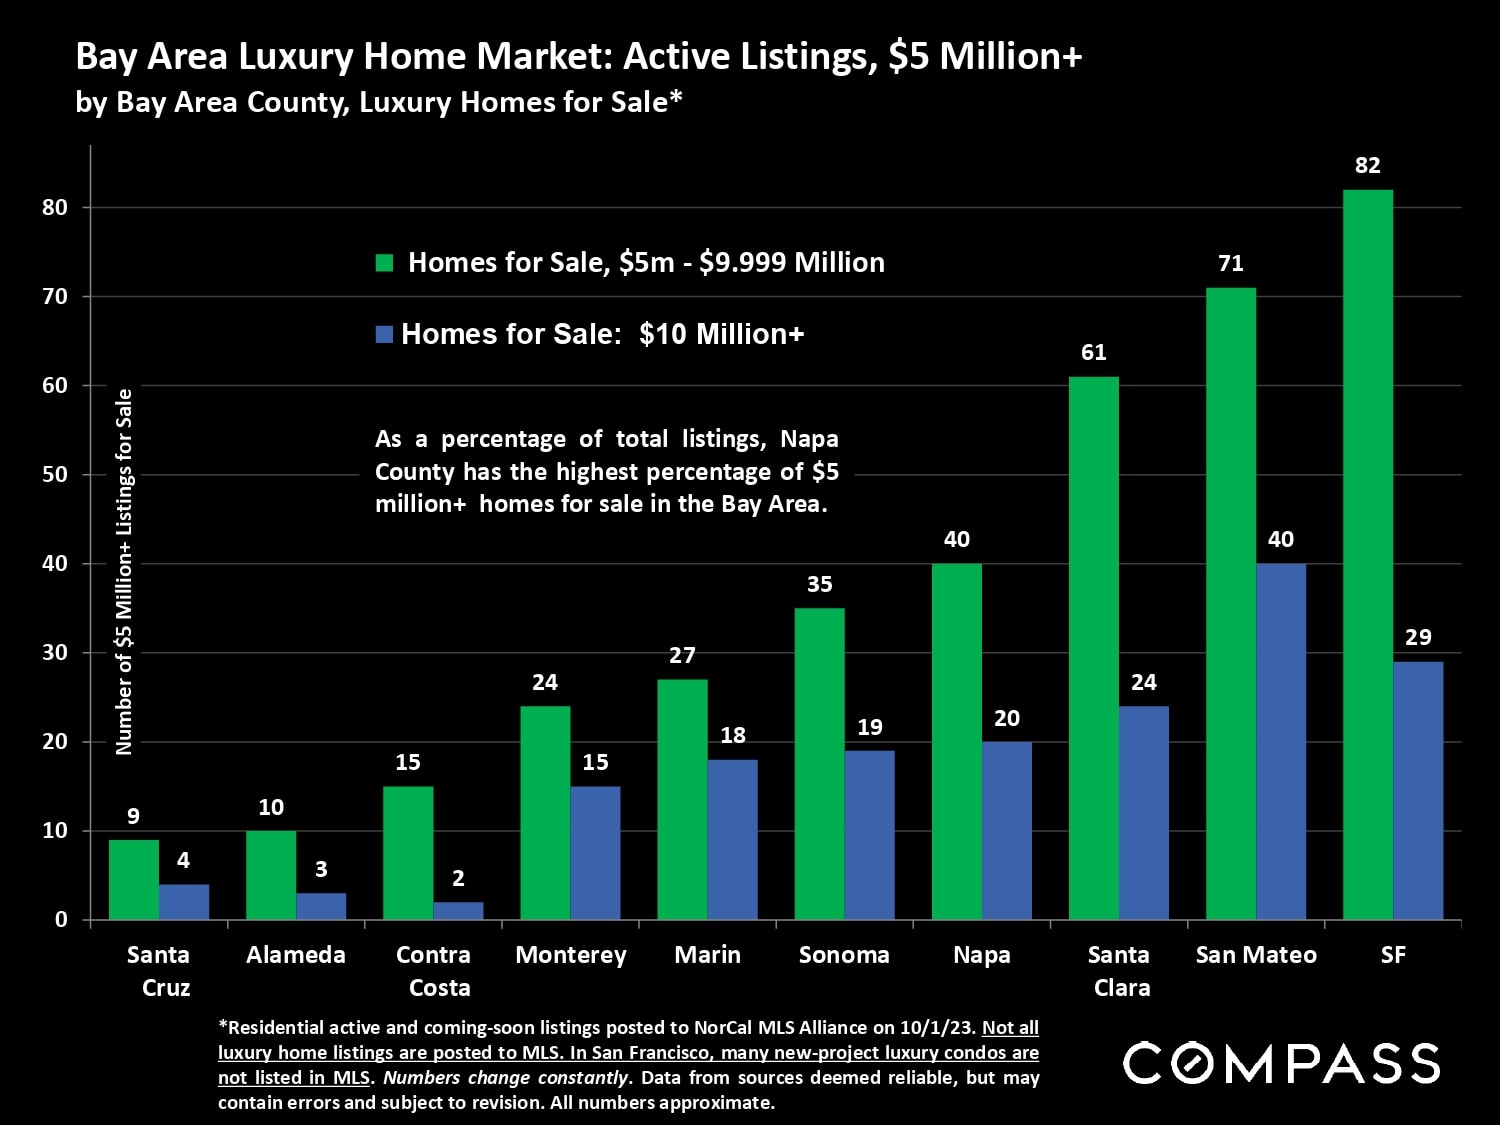
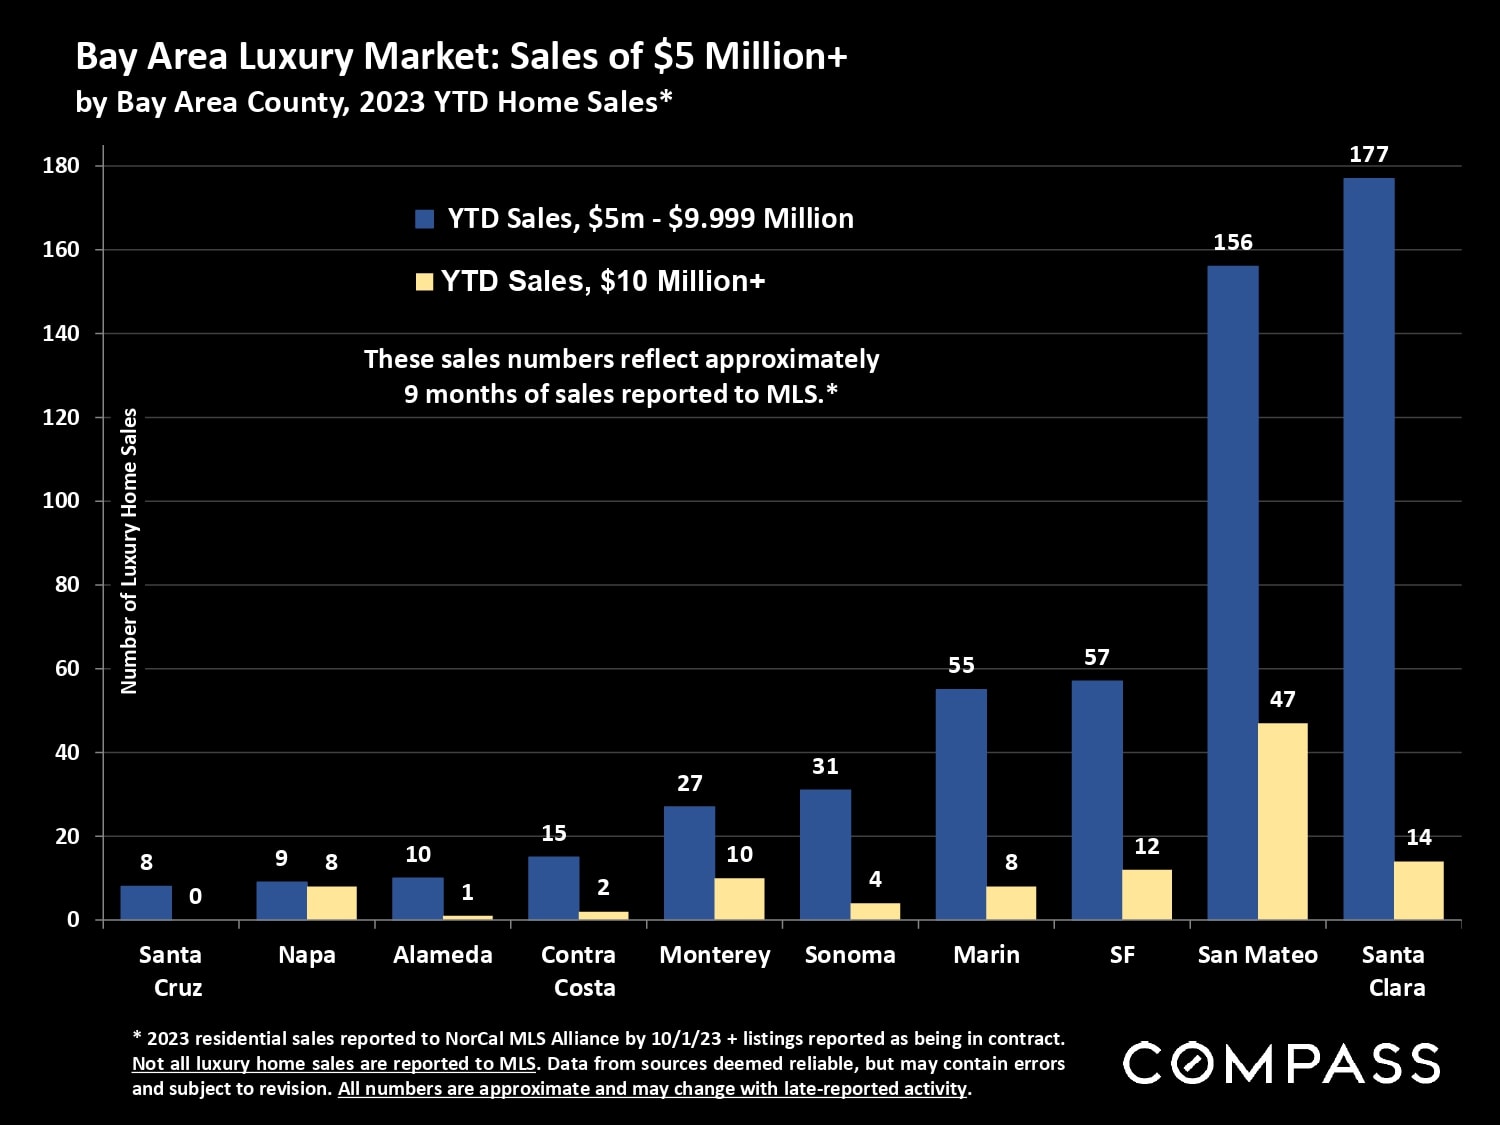
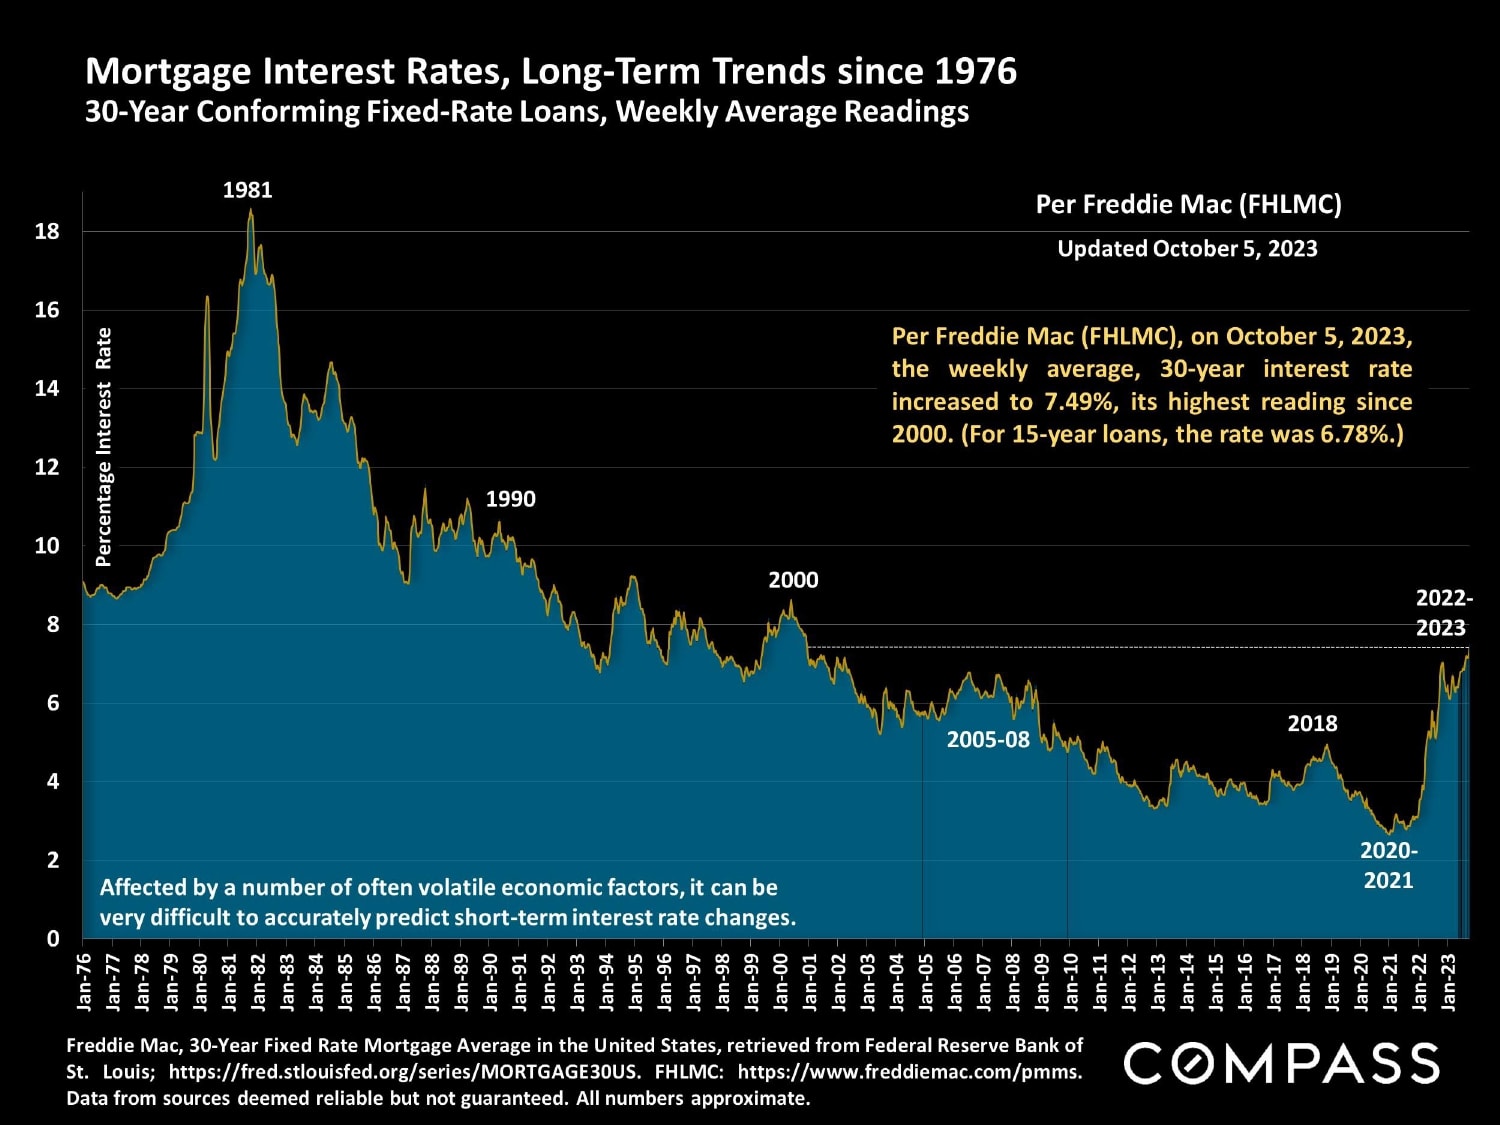
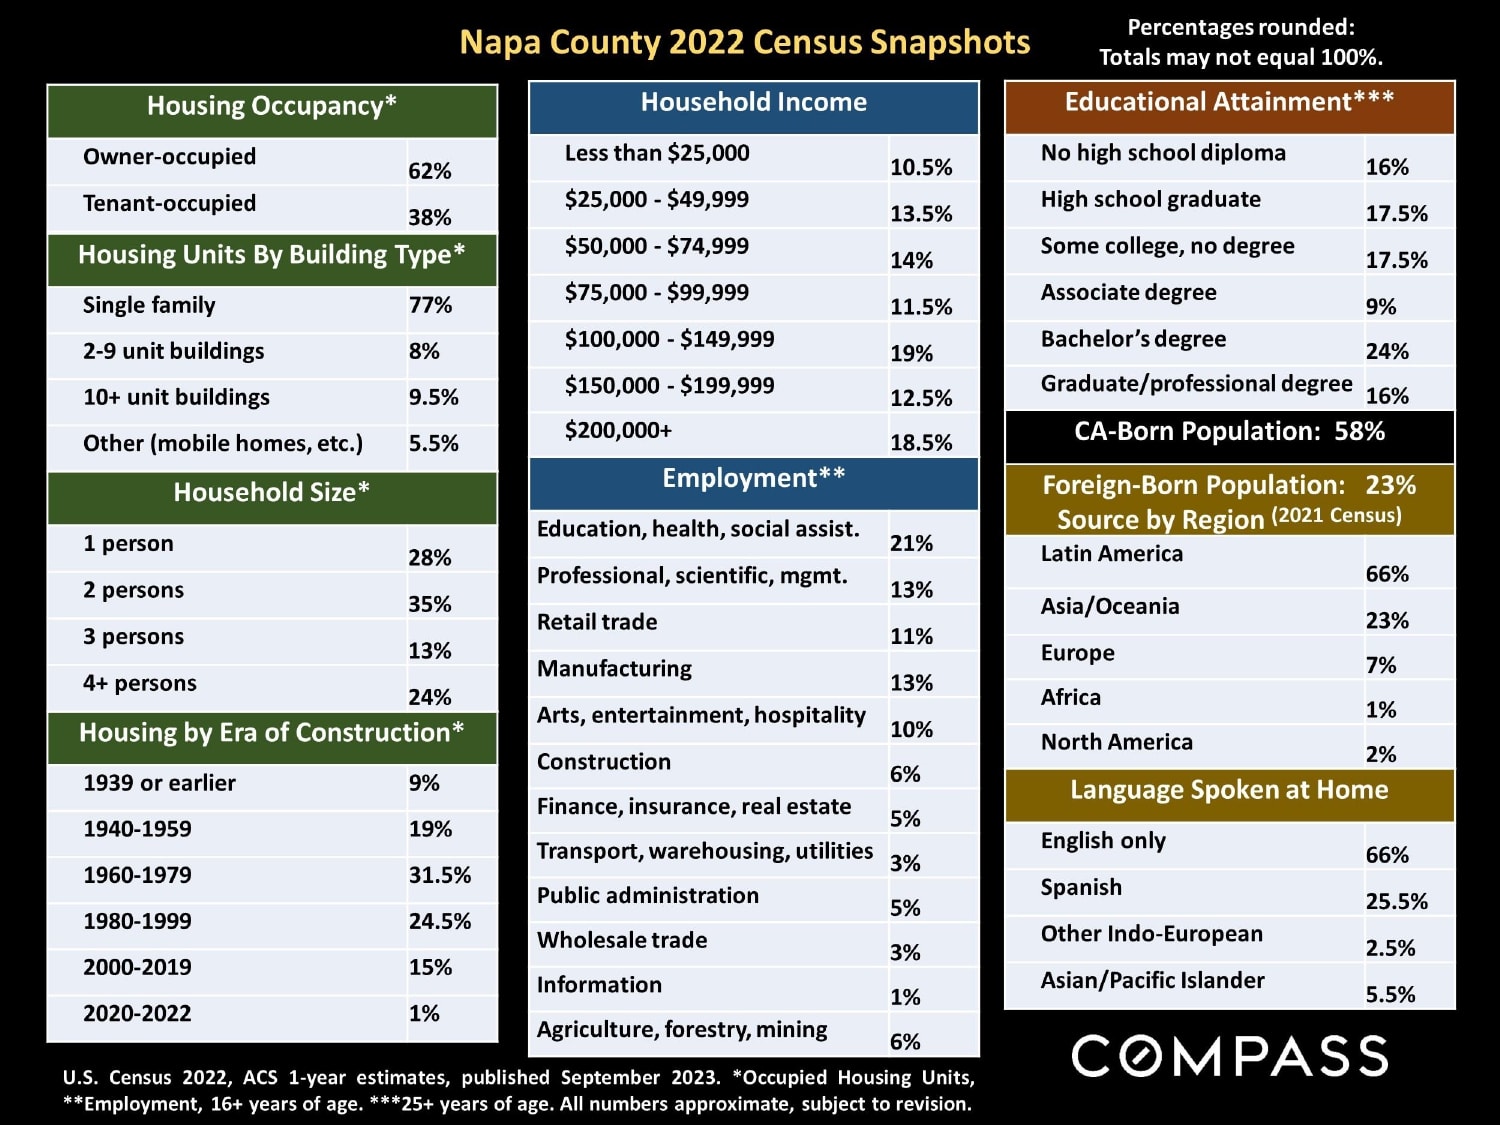
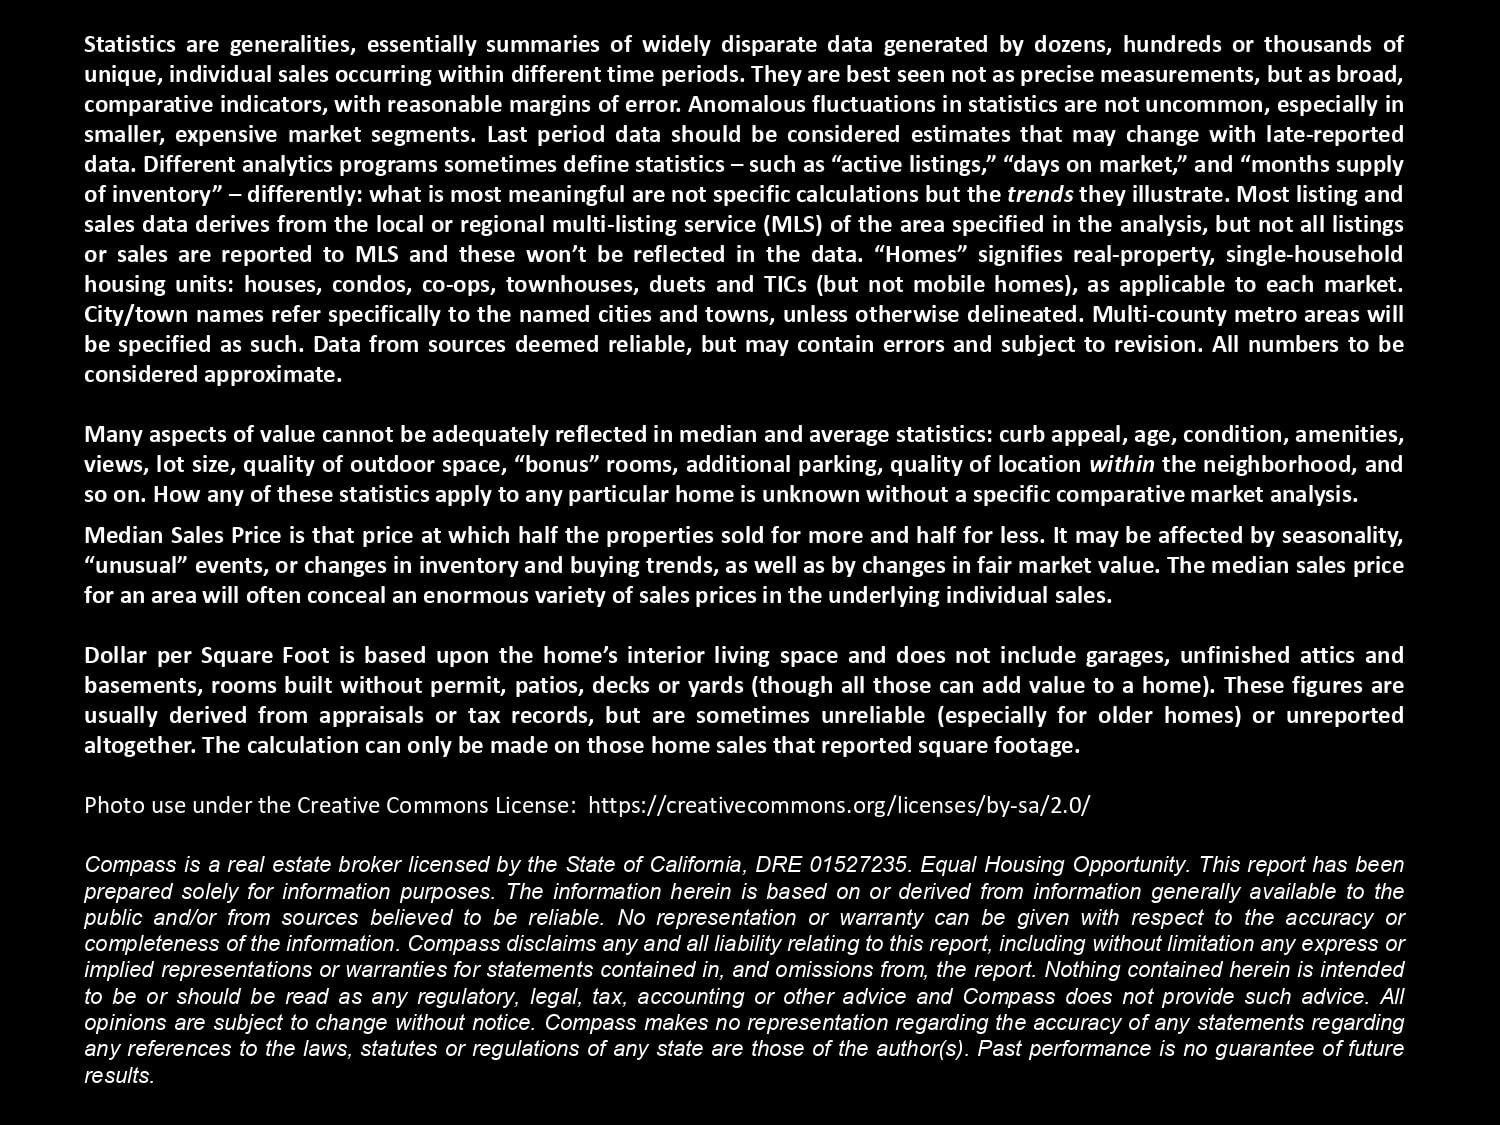
Napa County Real Estate October 2023 Report cover with sunlit grapes and the COMPASS wordmark. Napa County housing market update with Q3 2023 sales figures and a highlighted California 2024 market forecast. Napa County quarterly median home sale price chart, showing a 9% year-over-year decline in Q3 2023. Chart of Napa County median house values per square foot from 2005 to 2023, including the recession-era decline and later rise. Chart comparing Napa County home-price and household-income growth since 1995; home prices rose much faster, peaking above 400% in 2022. Napa County residential market table comparing sales and listing statistics across nine price ranges. Chart comparing Q3 2023 median three-bedroom house prices and sizes across 11 Greater Bay Area counties. Table comparing 2023 sales of large, expensive homes across Bay Area counties, with Napa highlighted. Bar chart of Napa County monthly new listings, August 2021–September 2023; September is the 2023 high. Napa County active listings chart, with monthly gold bars from 2019 to September 2023 and seasonal market annotations. Napa County pending-sale listings bar chart from January 2019 to September 2023, with a peak in August 2020. Napa County monthly listings-to-contract chart, with absorption rates from December 2018 through September 2023. Napa County monthly sales volume chart, January 2019–September 2023, with a note on the Q3 year-over-year decline. Chart comparing luxury home sales by price range across Napa and Sonoma County communities. Table of the most expensive reported home sales in selected Bay Area markets in 2023, with locations and prices. Chart of monthly Napa County luxury home sales from 2019 to 2023, divided into two price ranges. Bar chart comparing $5 million-plus active home listings across Bay Area counties and San Francisco. Chart comparing 2023 Bay Area luxury home sales by county and price category; San Mateo leads $10 million-plus sales. Chart of U.S. 30-year fixed mortgage rates, showing the 1981 peak and sharp rise to 7.49% in October 2023. Napa County 2022 census snapshots of housing, income, employment, education, and demographics. Compass economic trends graphic with charts on mortgage rates, consumer sentiment, financial markets, inflation, and Bay Area real estate factors. Real estate market-statistics definitions, data limitations, Creative Commons photo notice, and Compass legal disclaimer.


WORK WITH US

We offer the highest level of service and expertise to our clients. Our team has built a reputation for consistently representing the finest real estate in San Francisco and Napa Valley. Results driven and dedicated to your success, whether buying, selling, renting or investing. Contact us today for a private consultation.

Contact Us