North Contra Costa County Real Estate

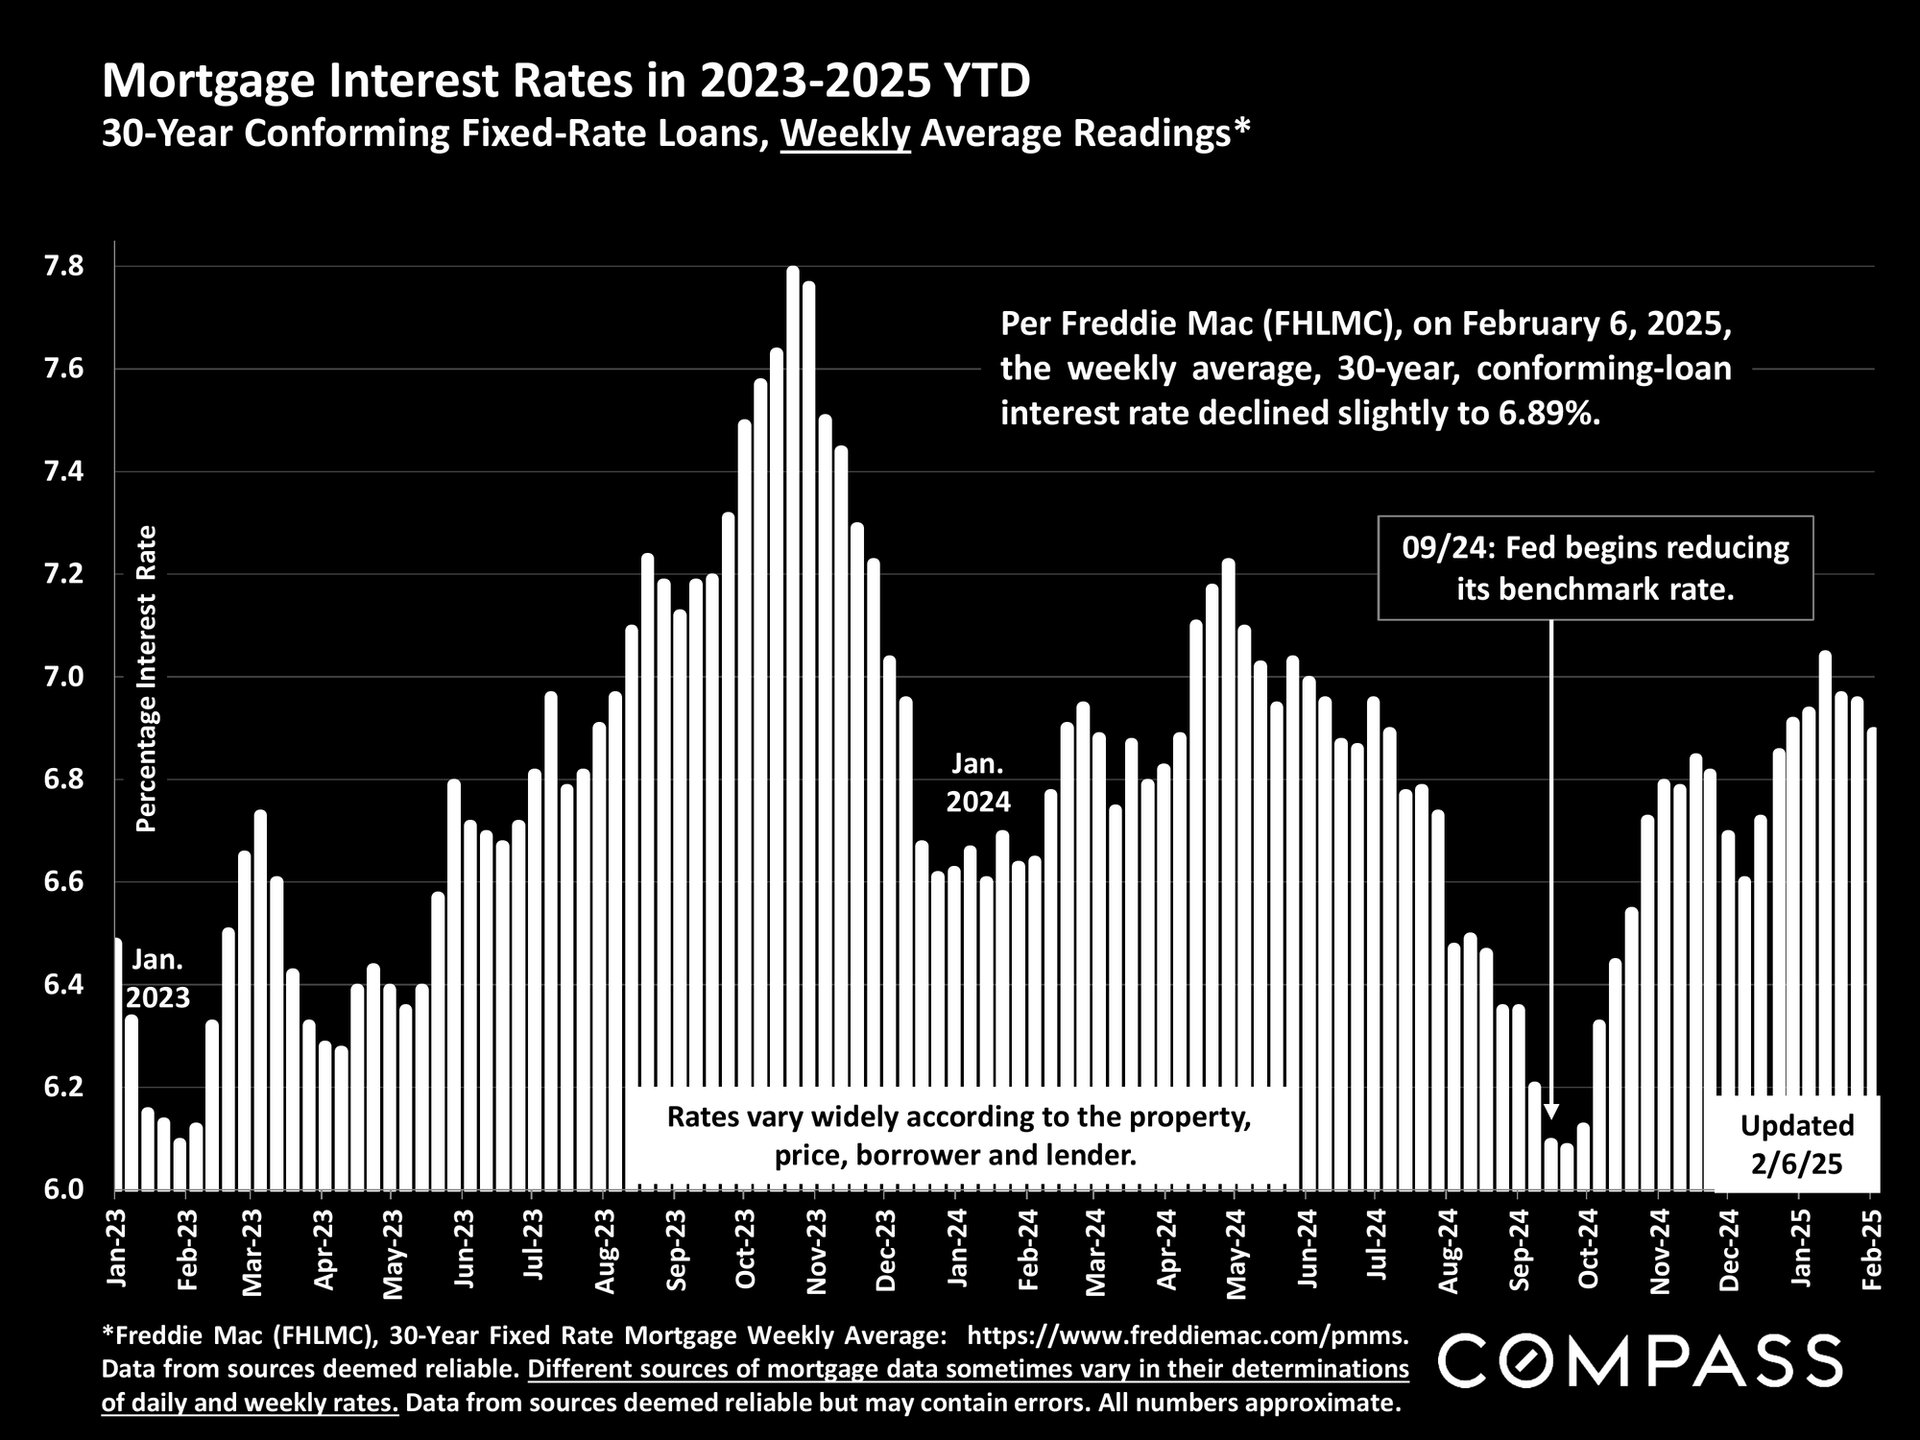
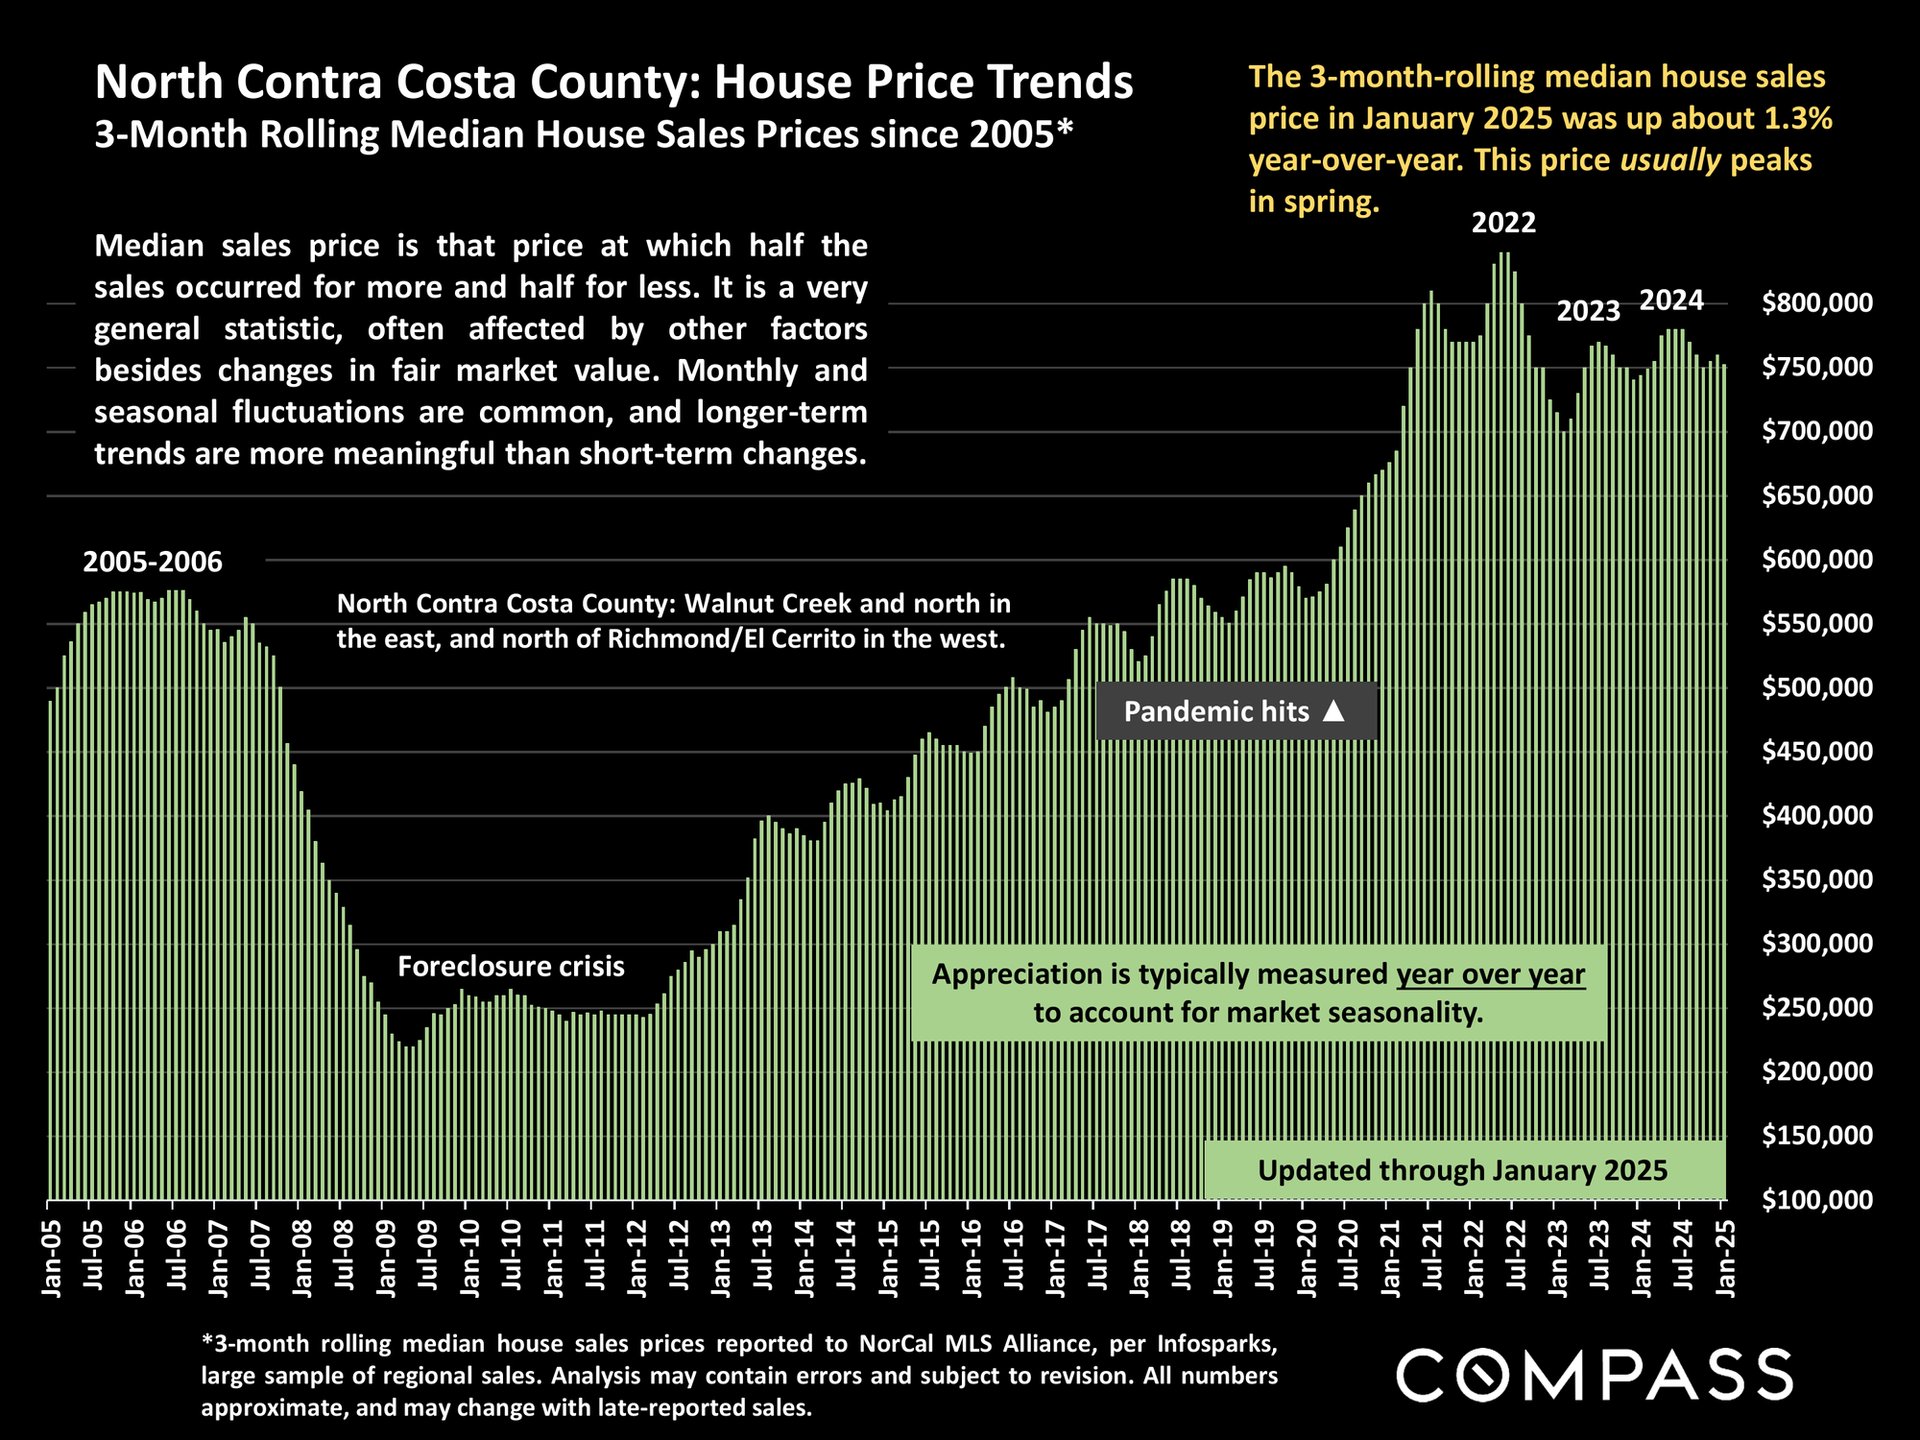
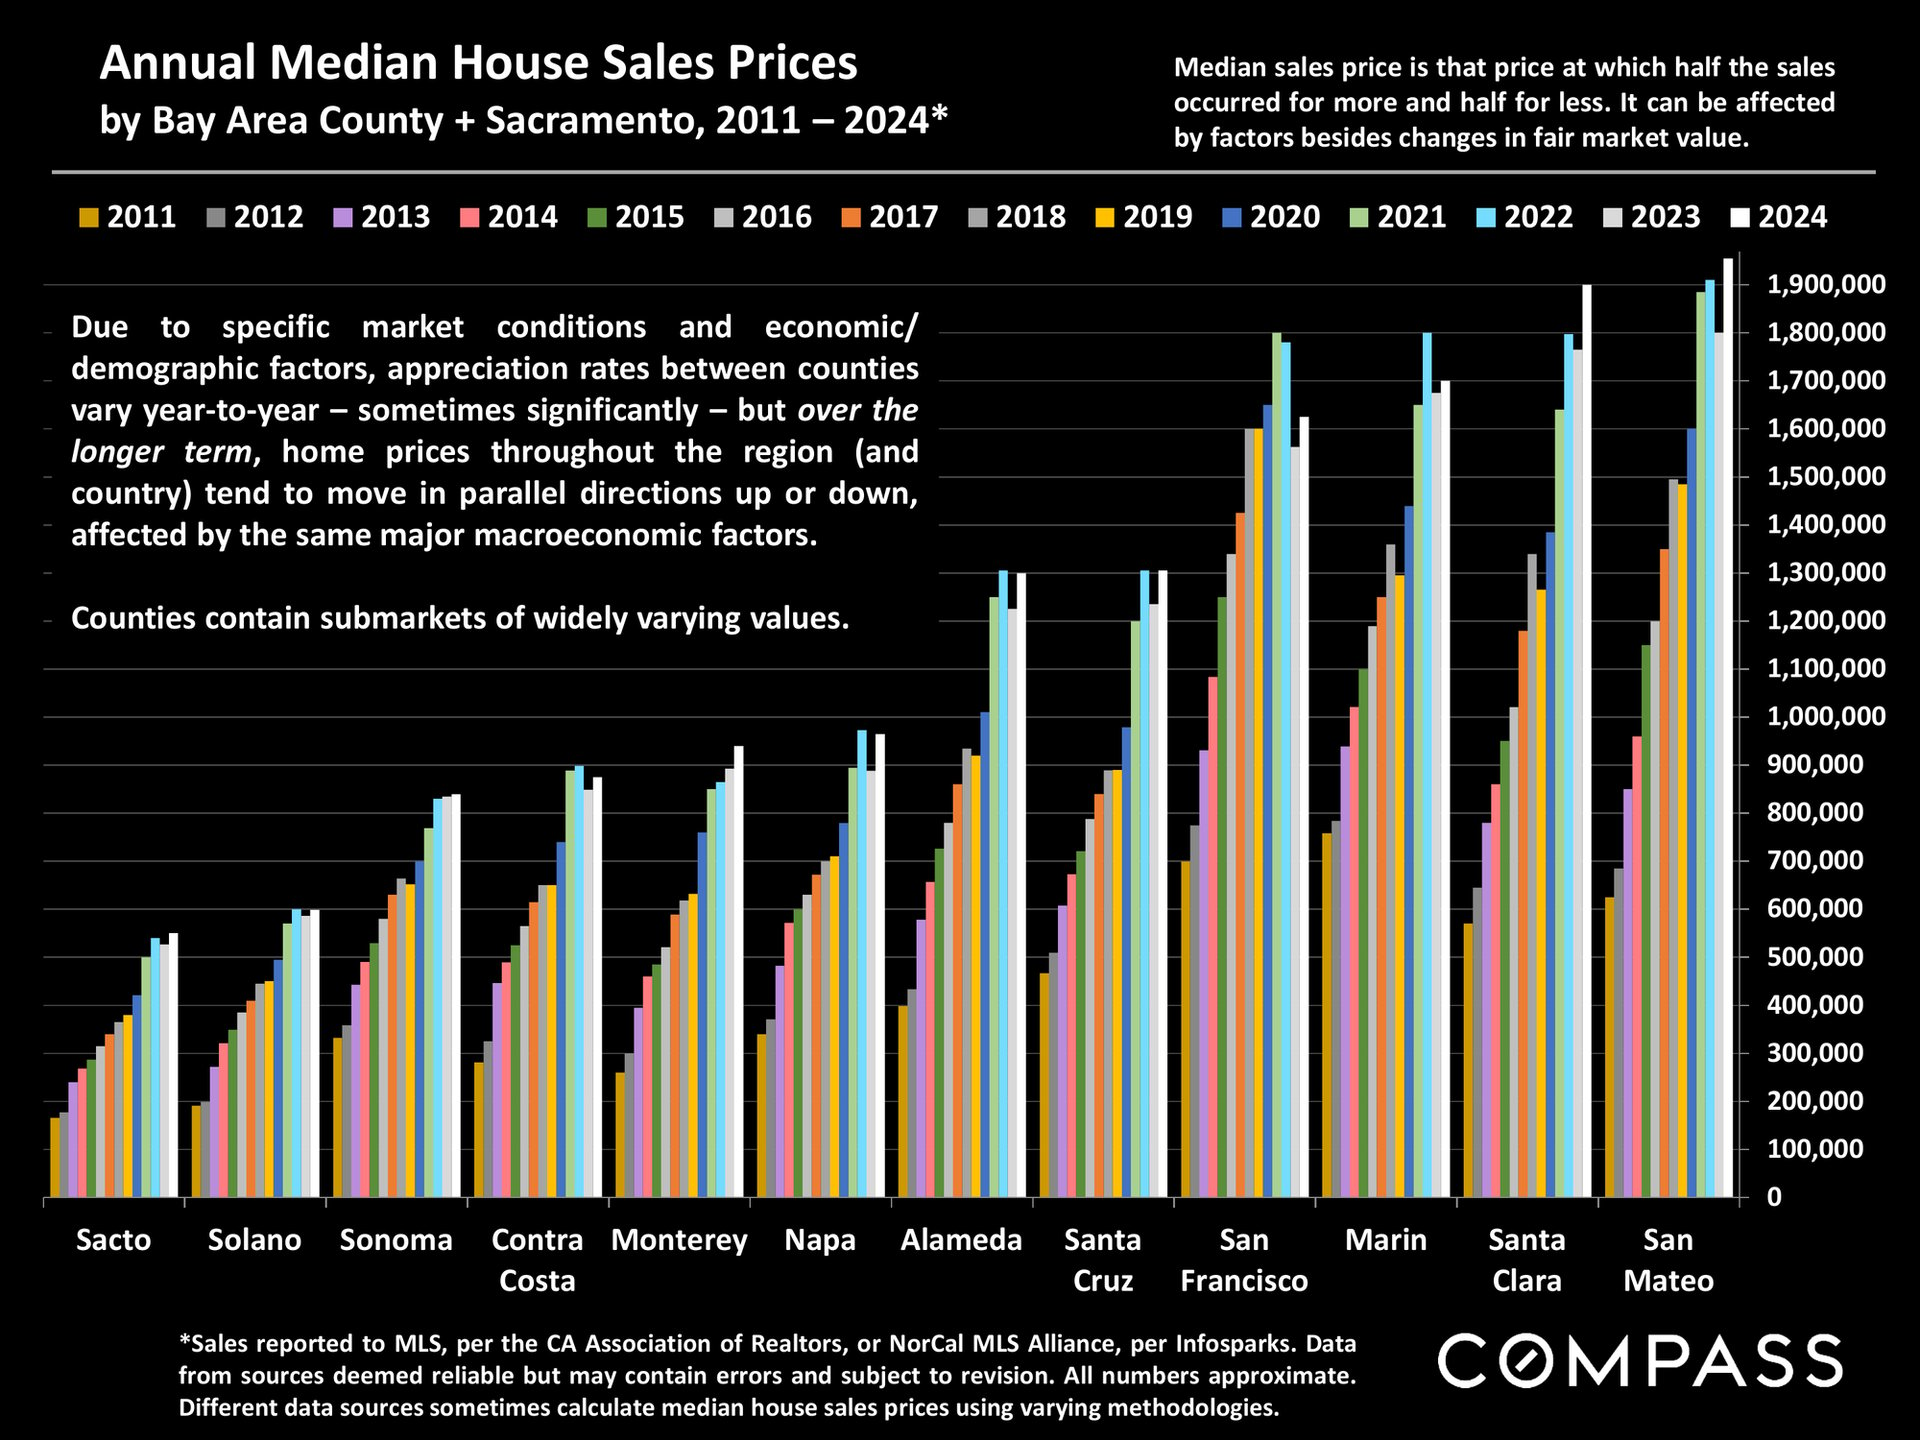
North Contra Costa County Real Estate February 2025 report cover, with green hills, a park landscape, and Compass branding.2025 North Contra Costa County real estate outlook with housing market commentary and a Freddie Mac forecast.Bar chart of weekly 30-year mortgage rates from January 2023 to February 2025, peaking near 7.8%.Chart of North Contra Costa County median home prices, 2005–January 2025, with a 2022 peak above $800,000.Bar chart comparing annual median house sale prices across 12 Bay Area counties and Sacramento from 2011 to 2024.
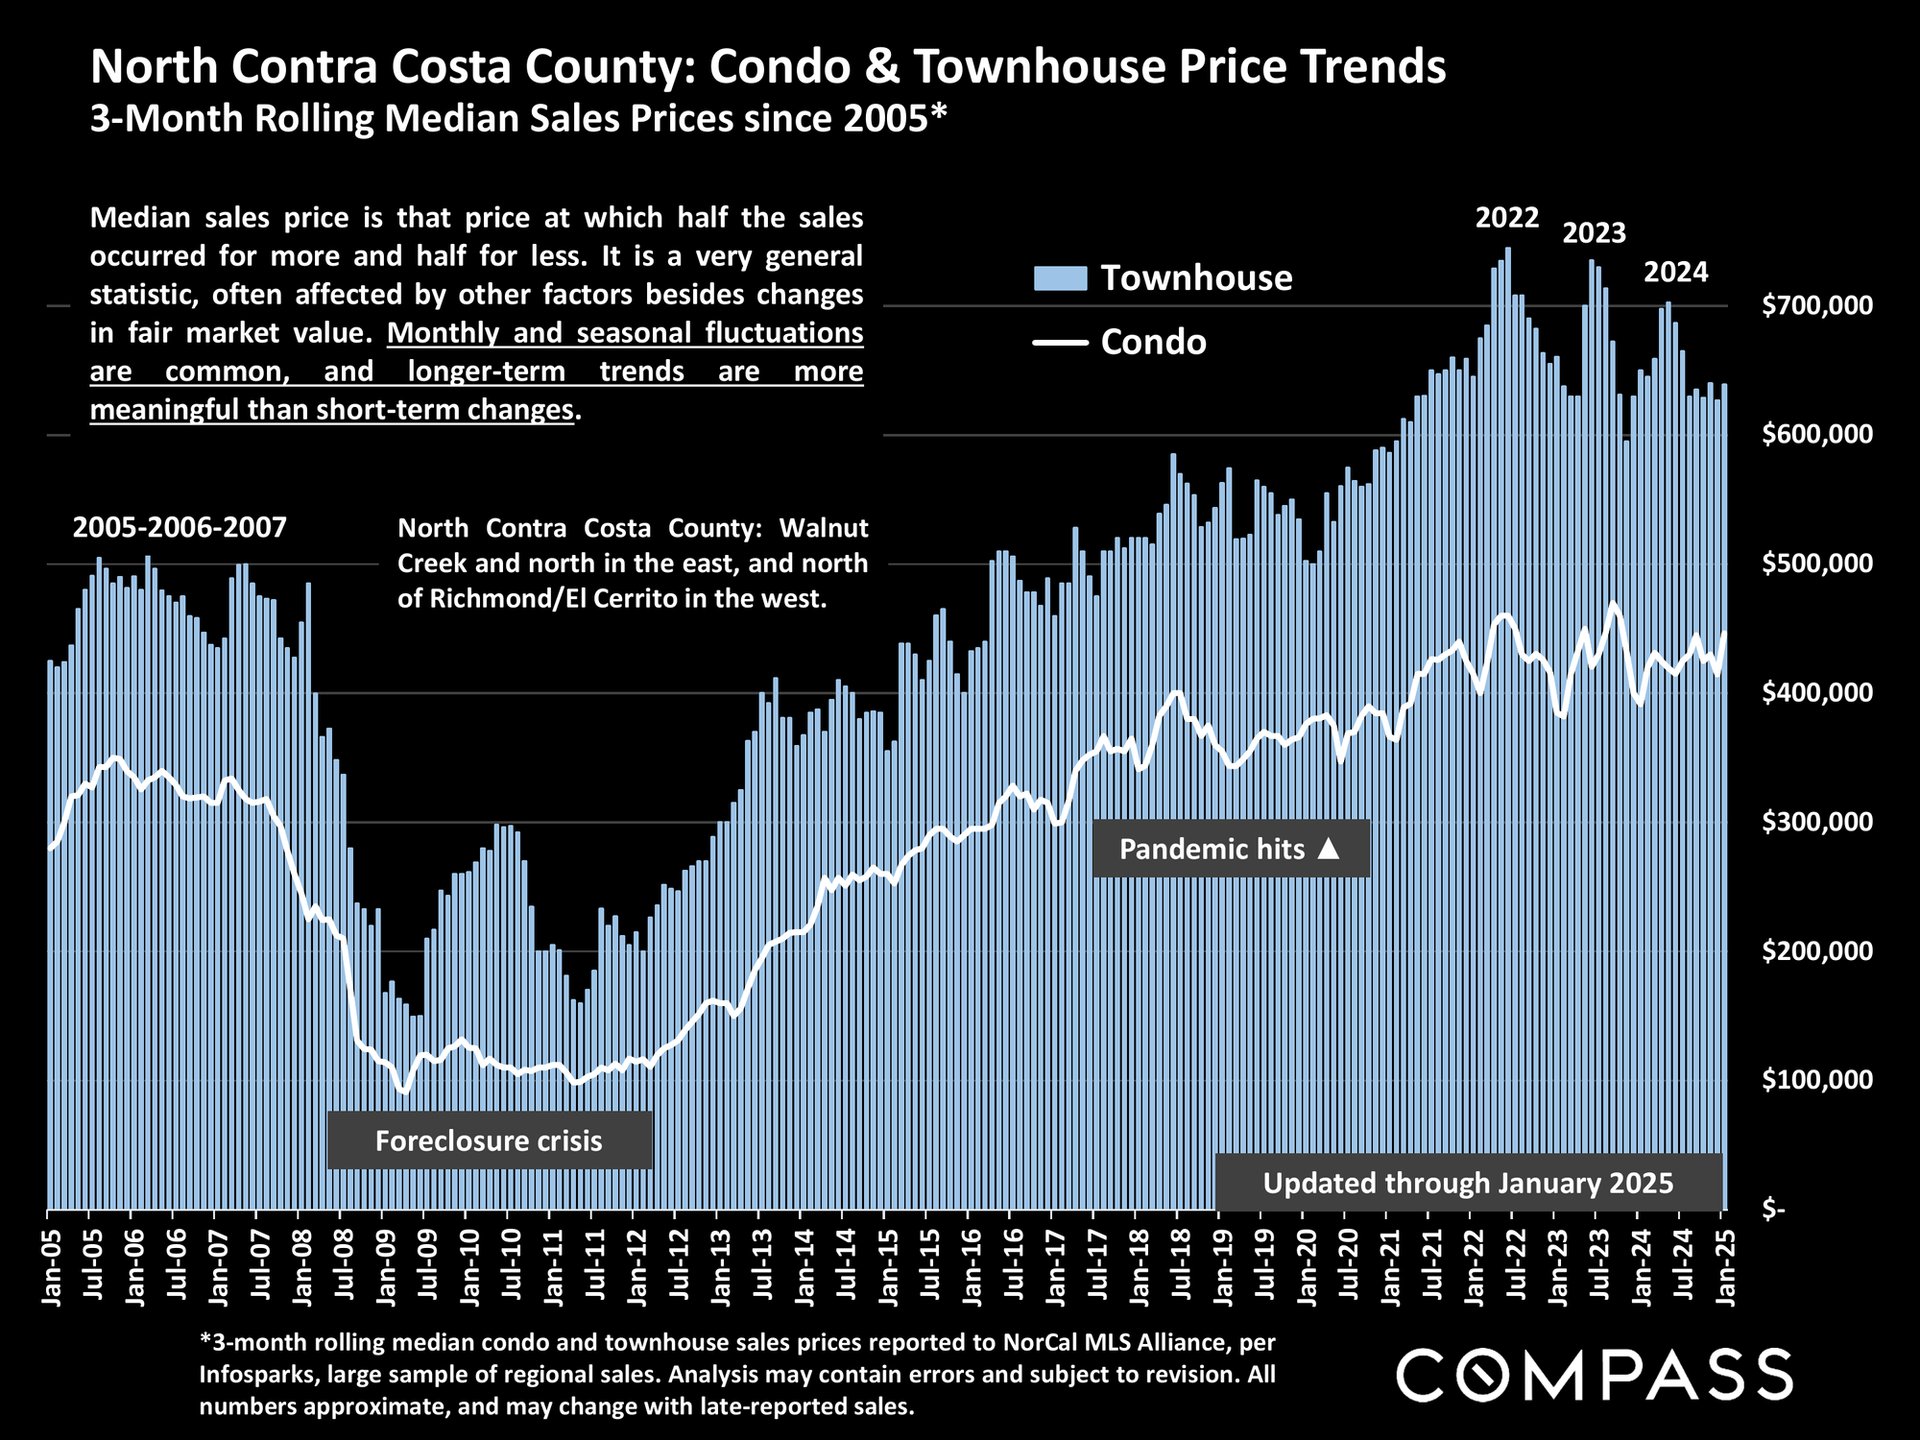
Chart of North Contra Costa County condo and townhouse prices, 2005–2025, showing long-term trends and market events.
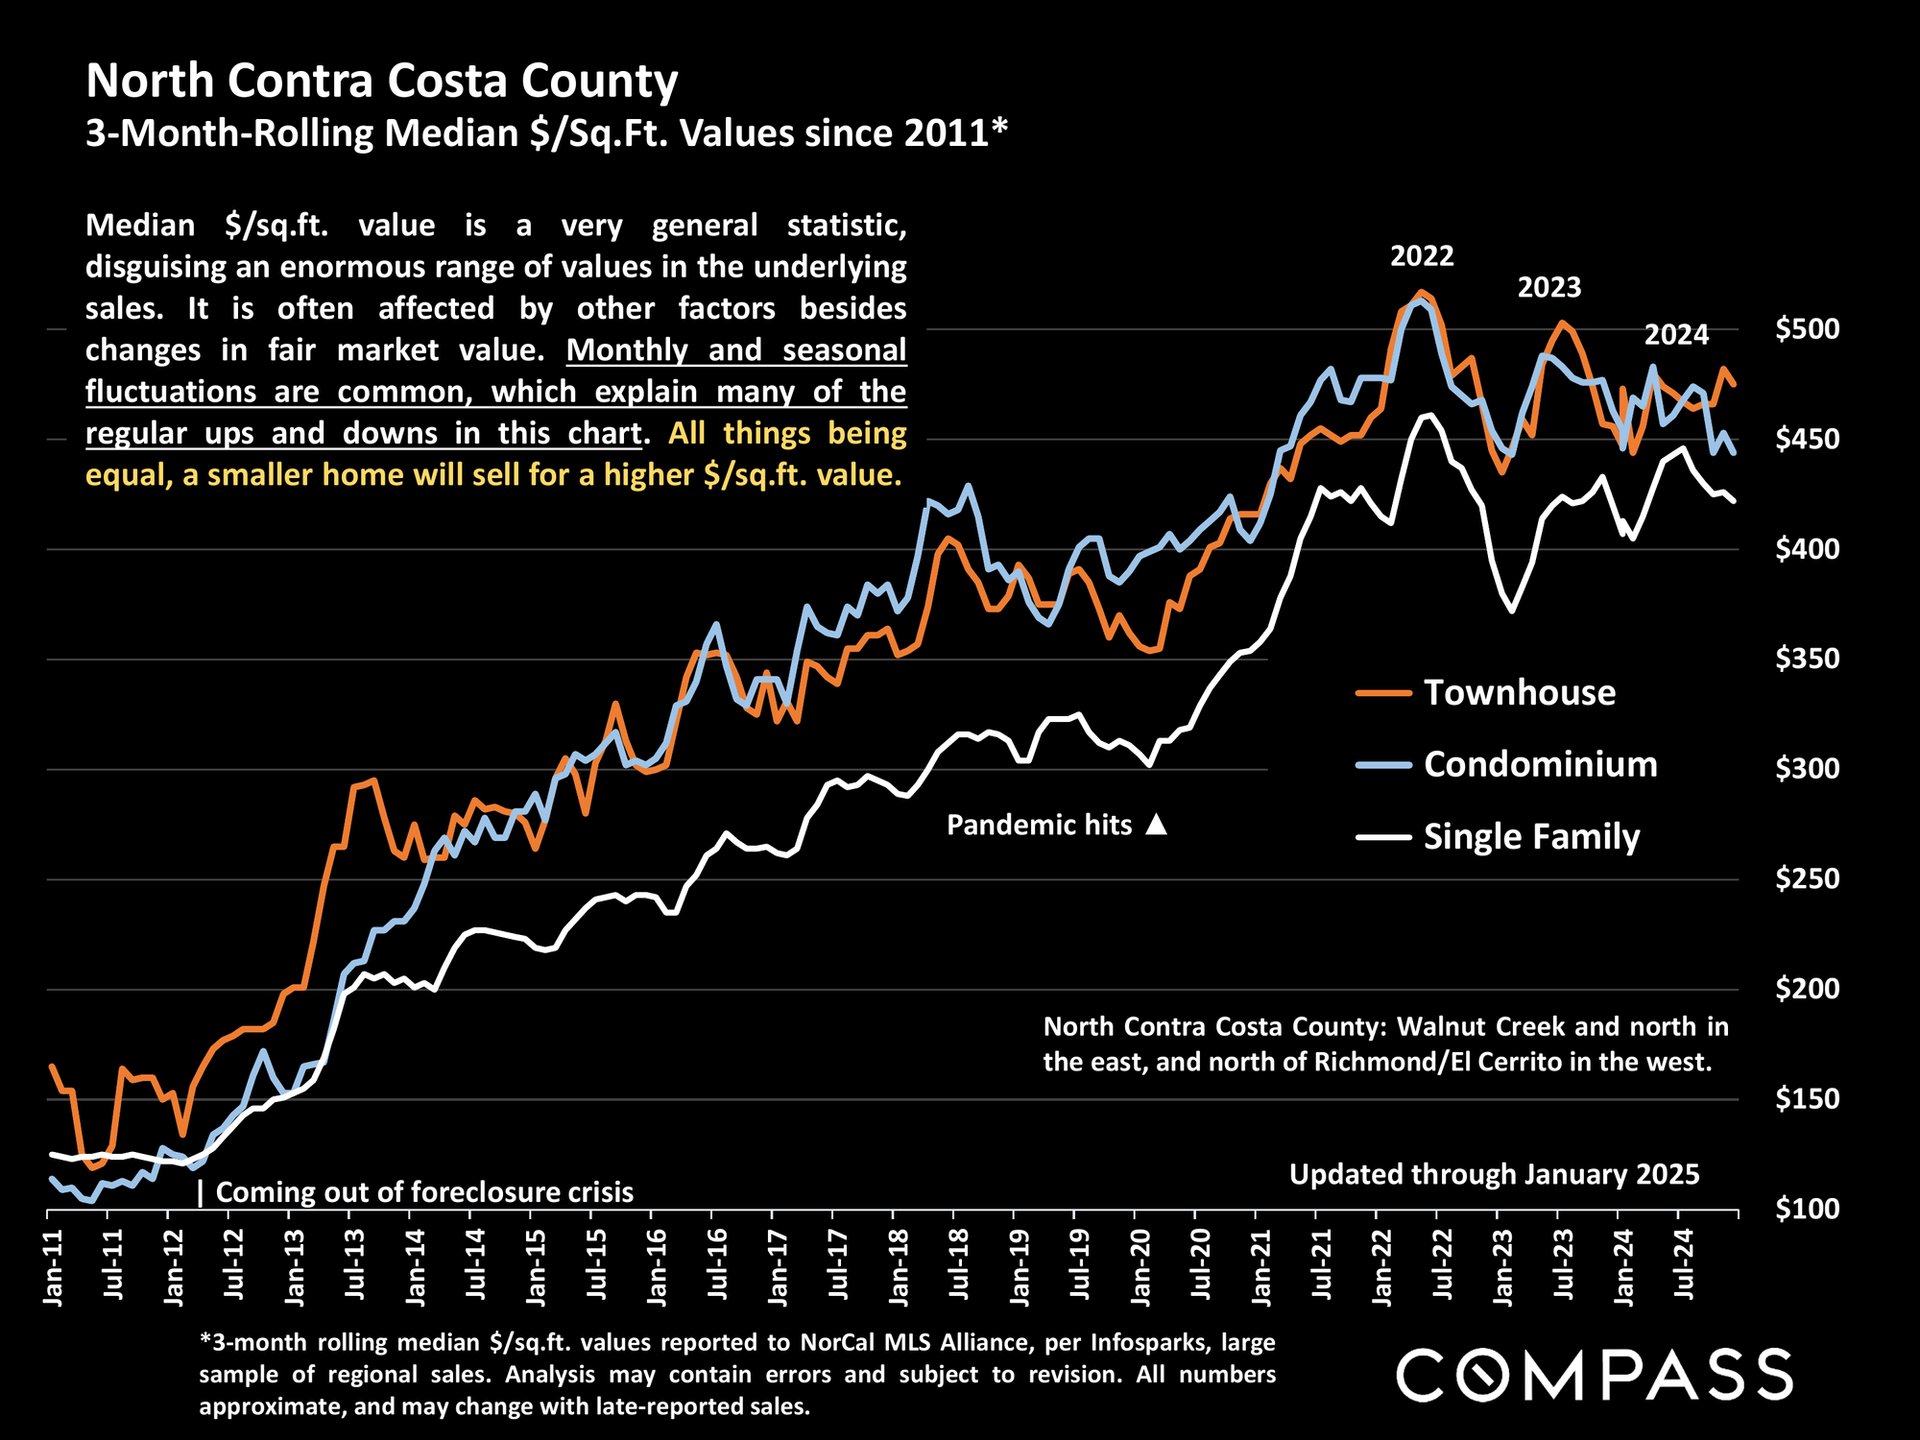
North Contra Costa County price-per-square-foot chart comparing townhouses, condominiums, and single-family homes since 2011.
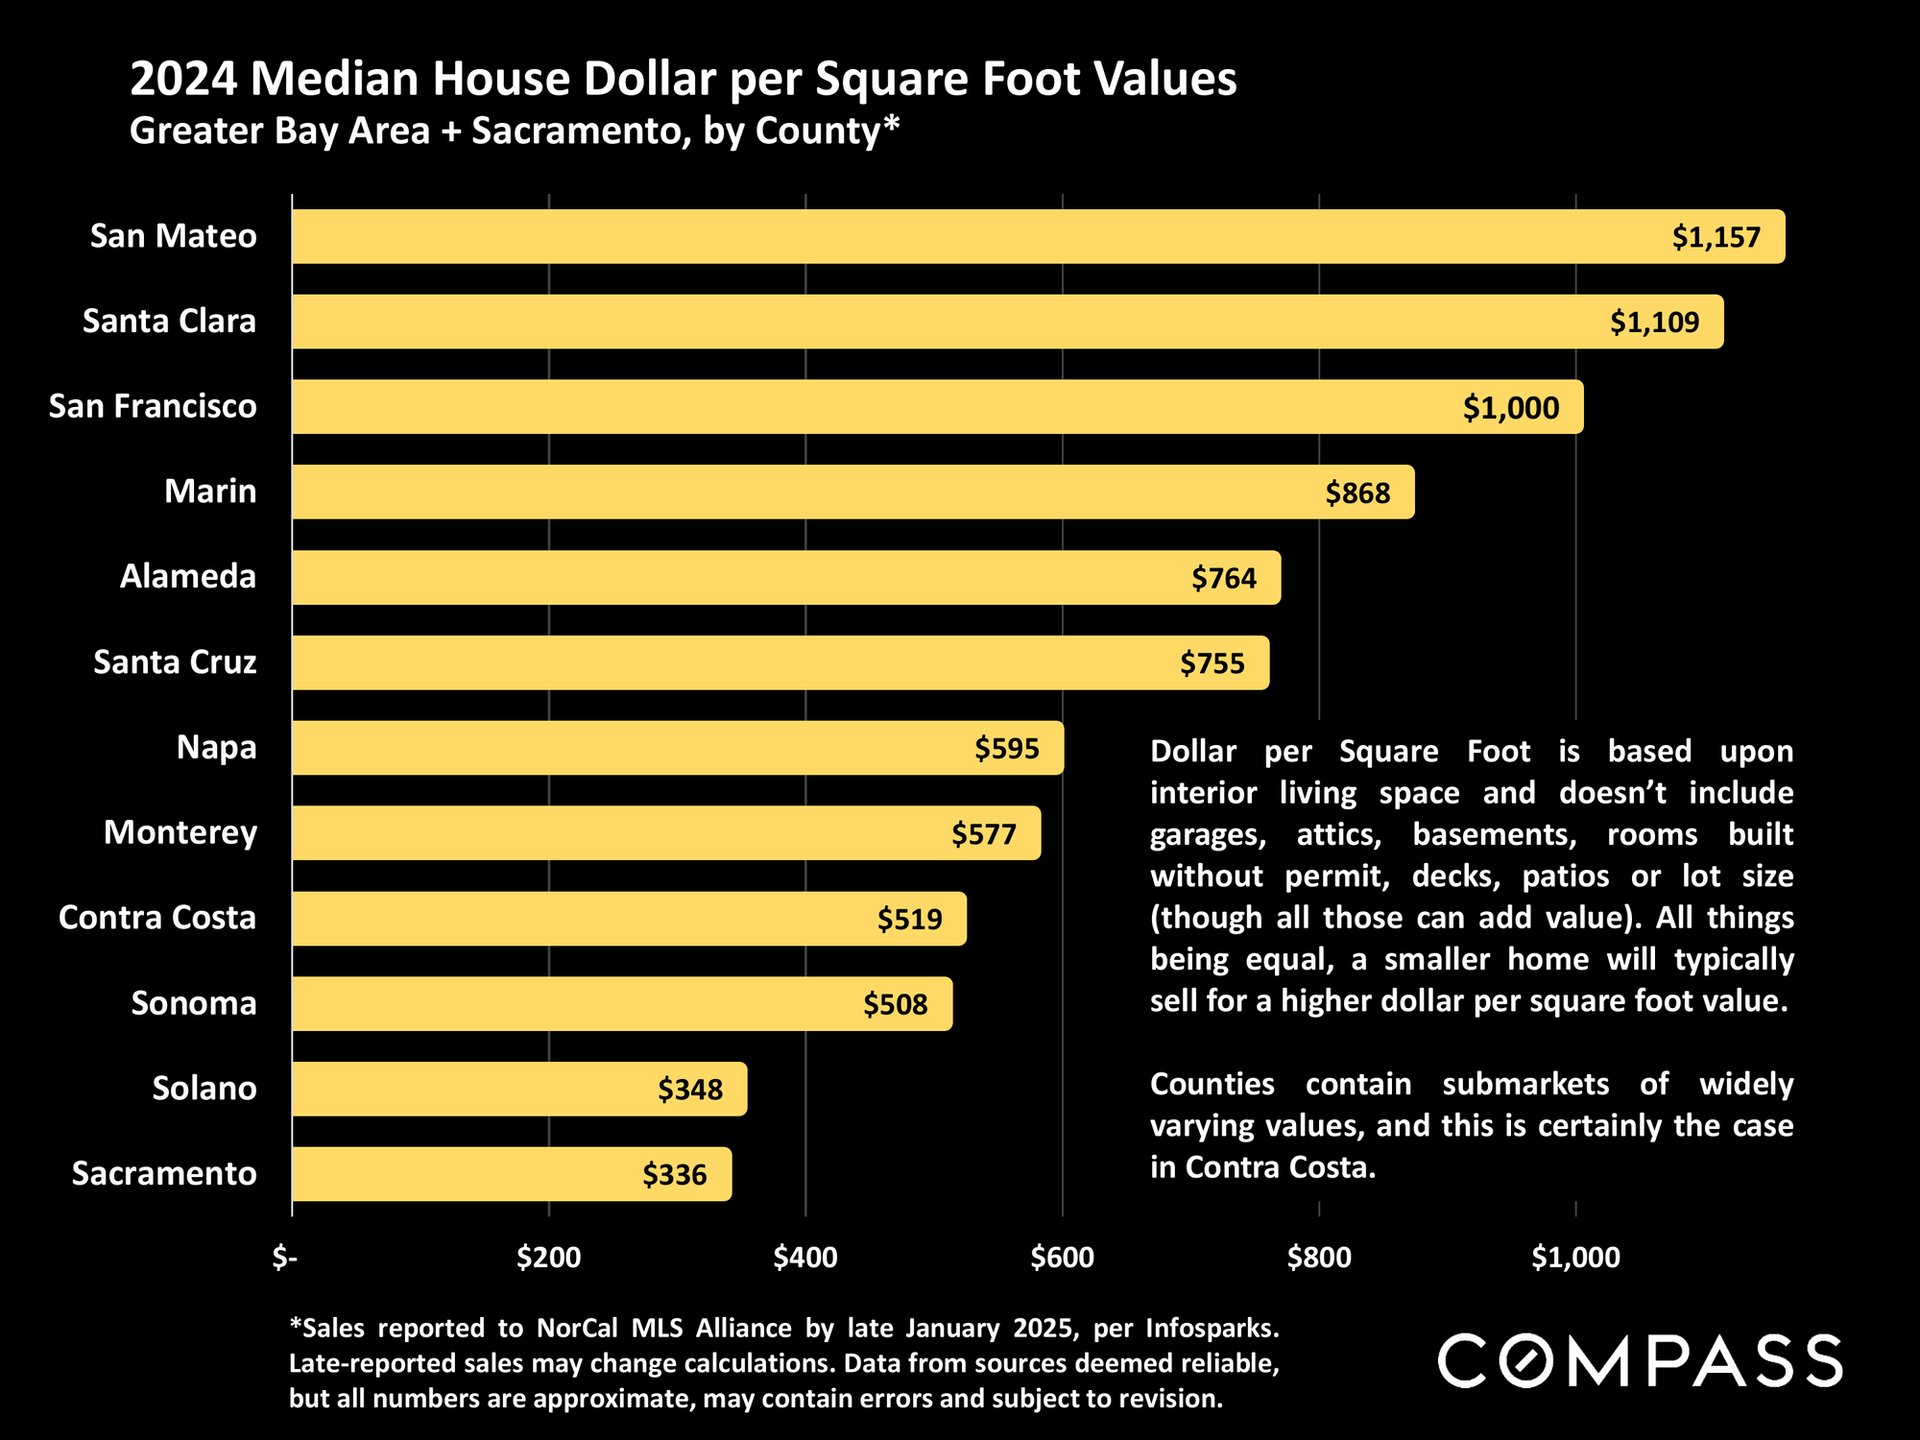
Bar chart of 2024 home values per square foot by county; Contra Costa is $519, San Mateo leads at $1,157.
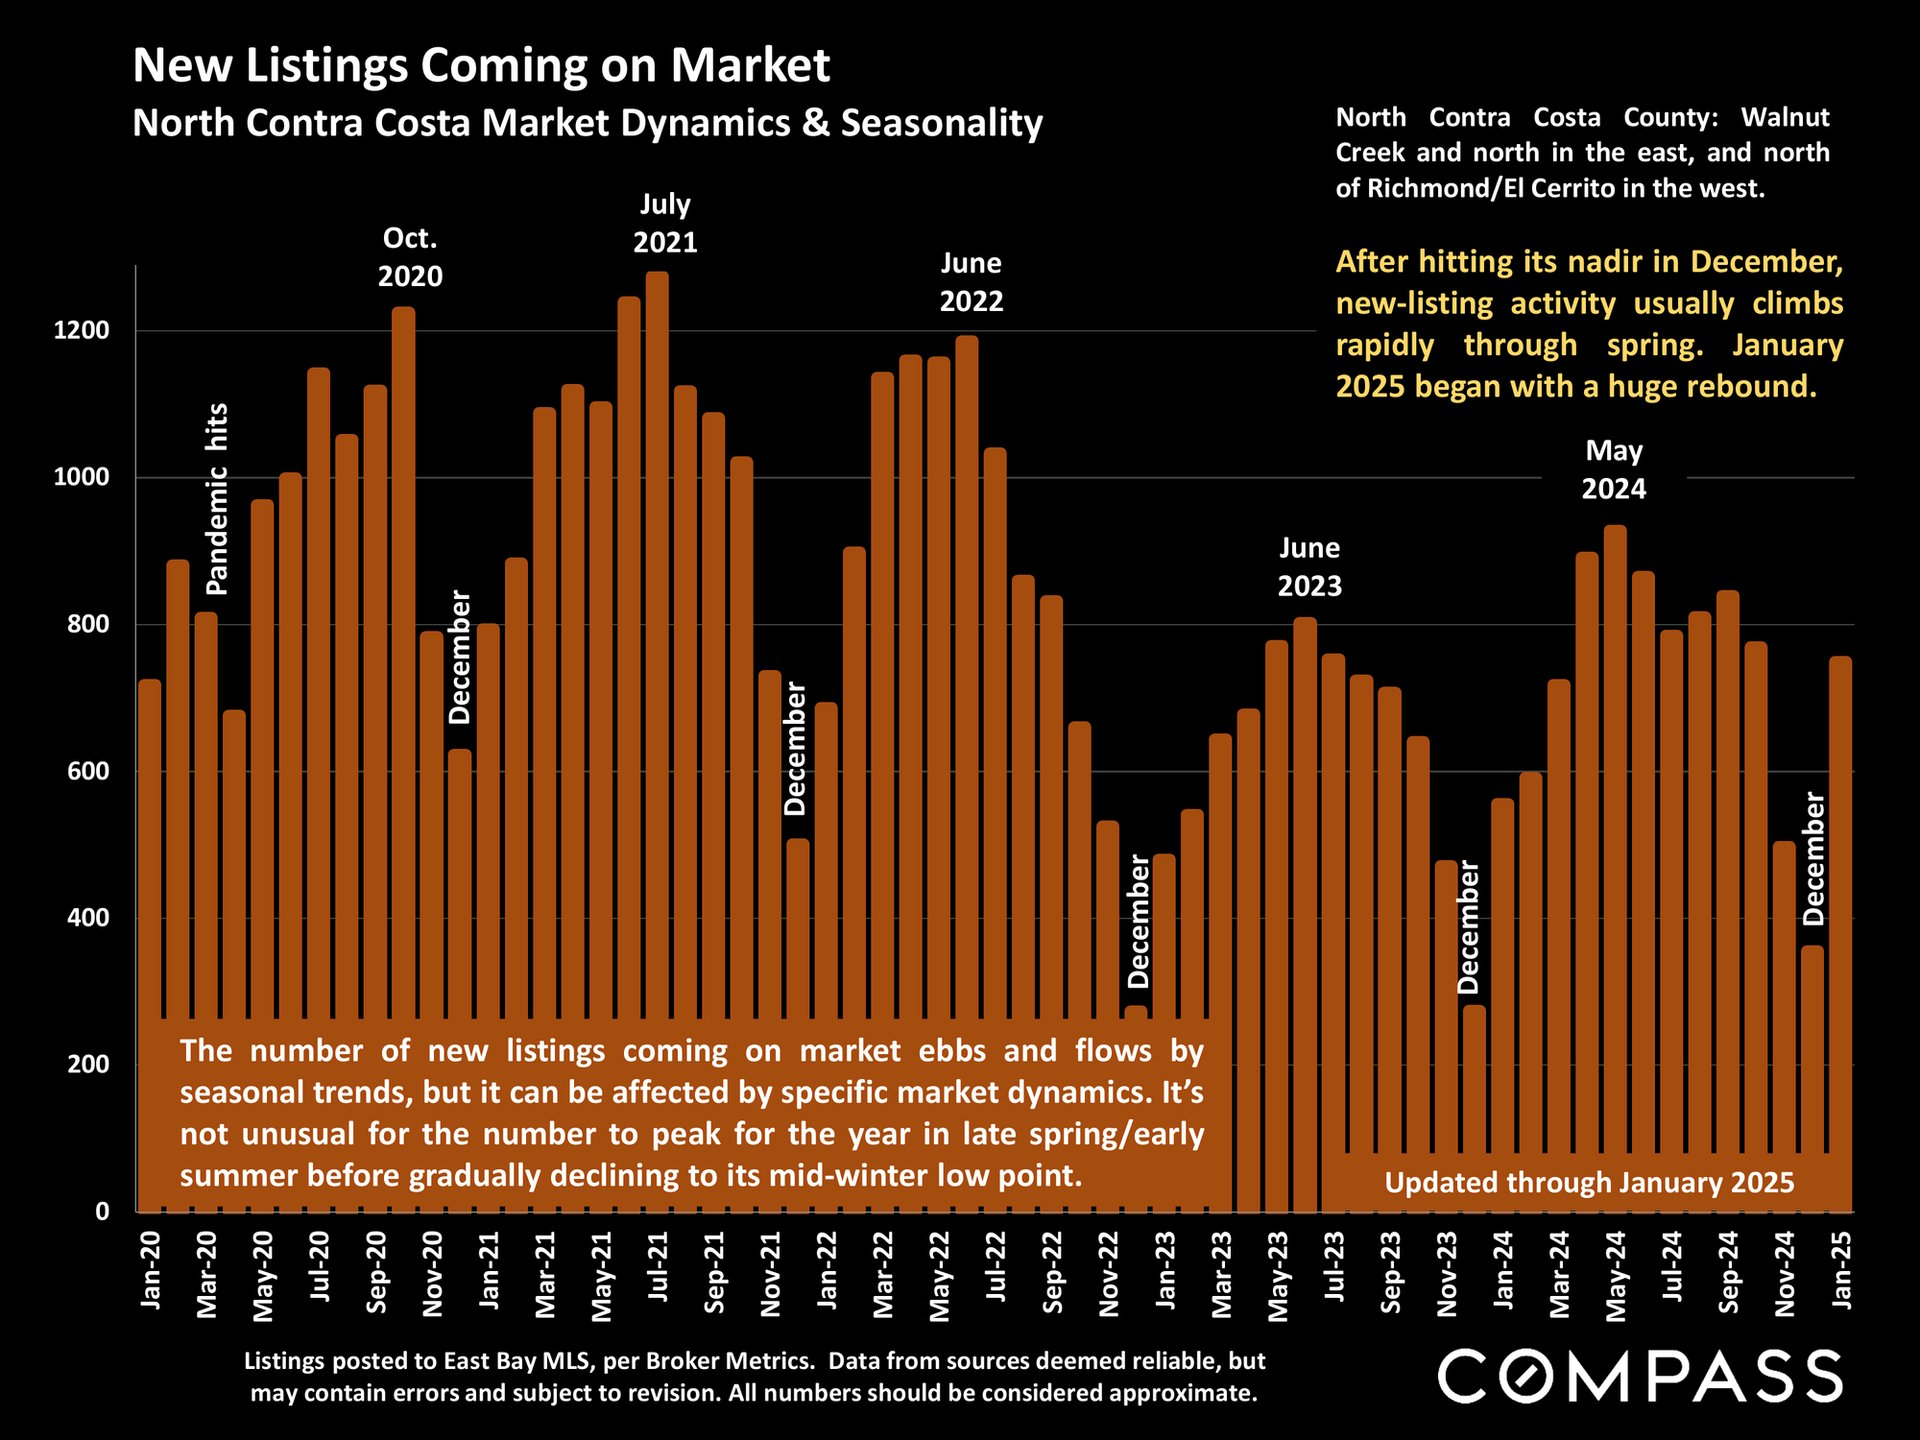
Bar chart of North Contra Costa County new listings from 2020 to January 2025, showing seasonal peaks and winter lows.
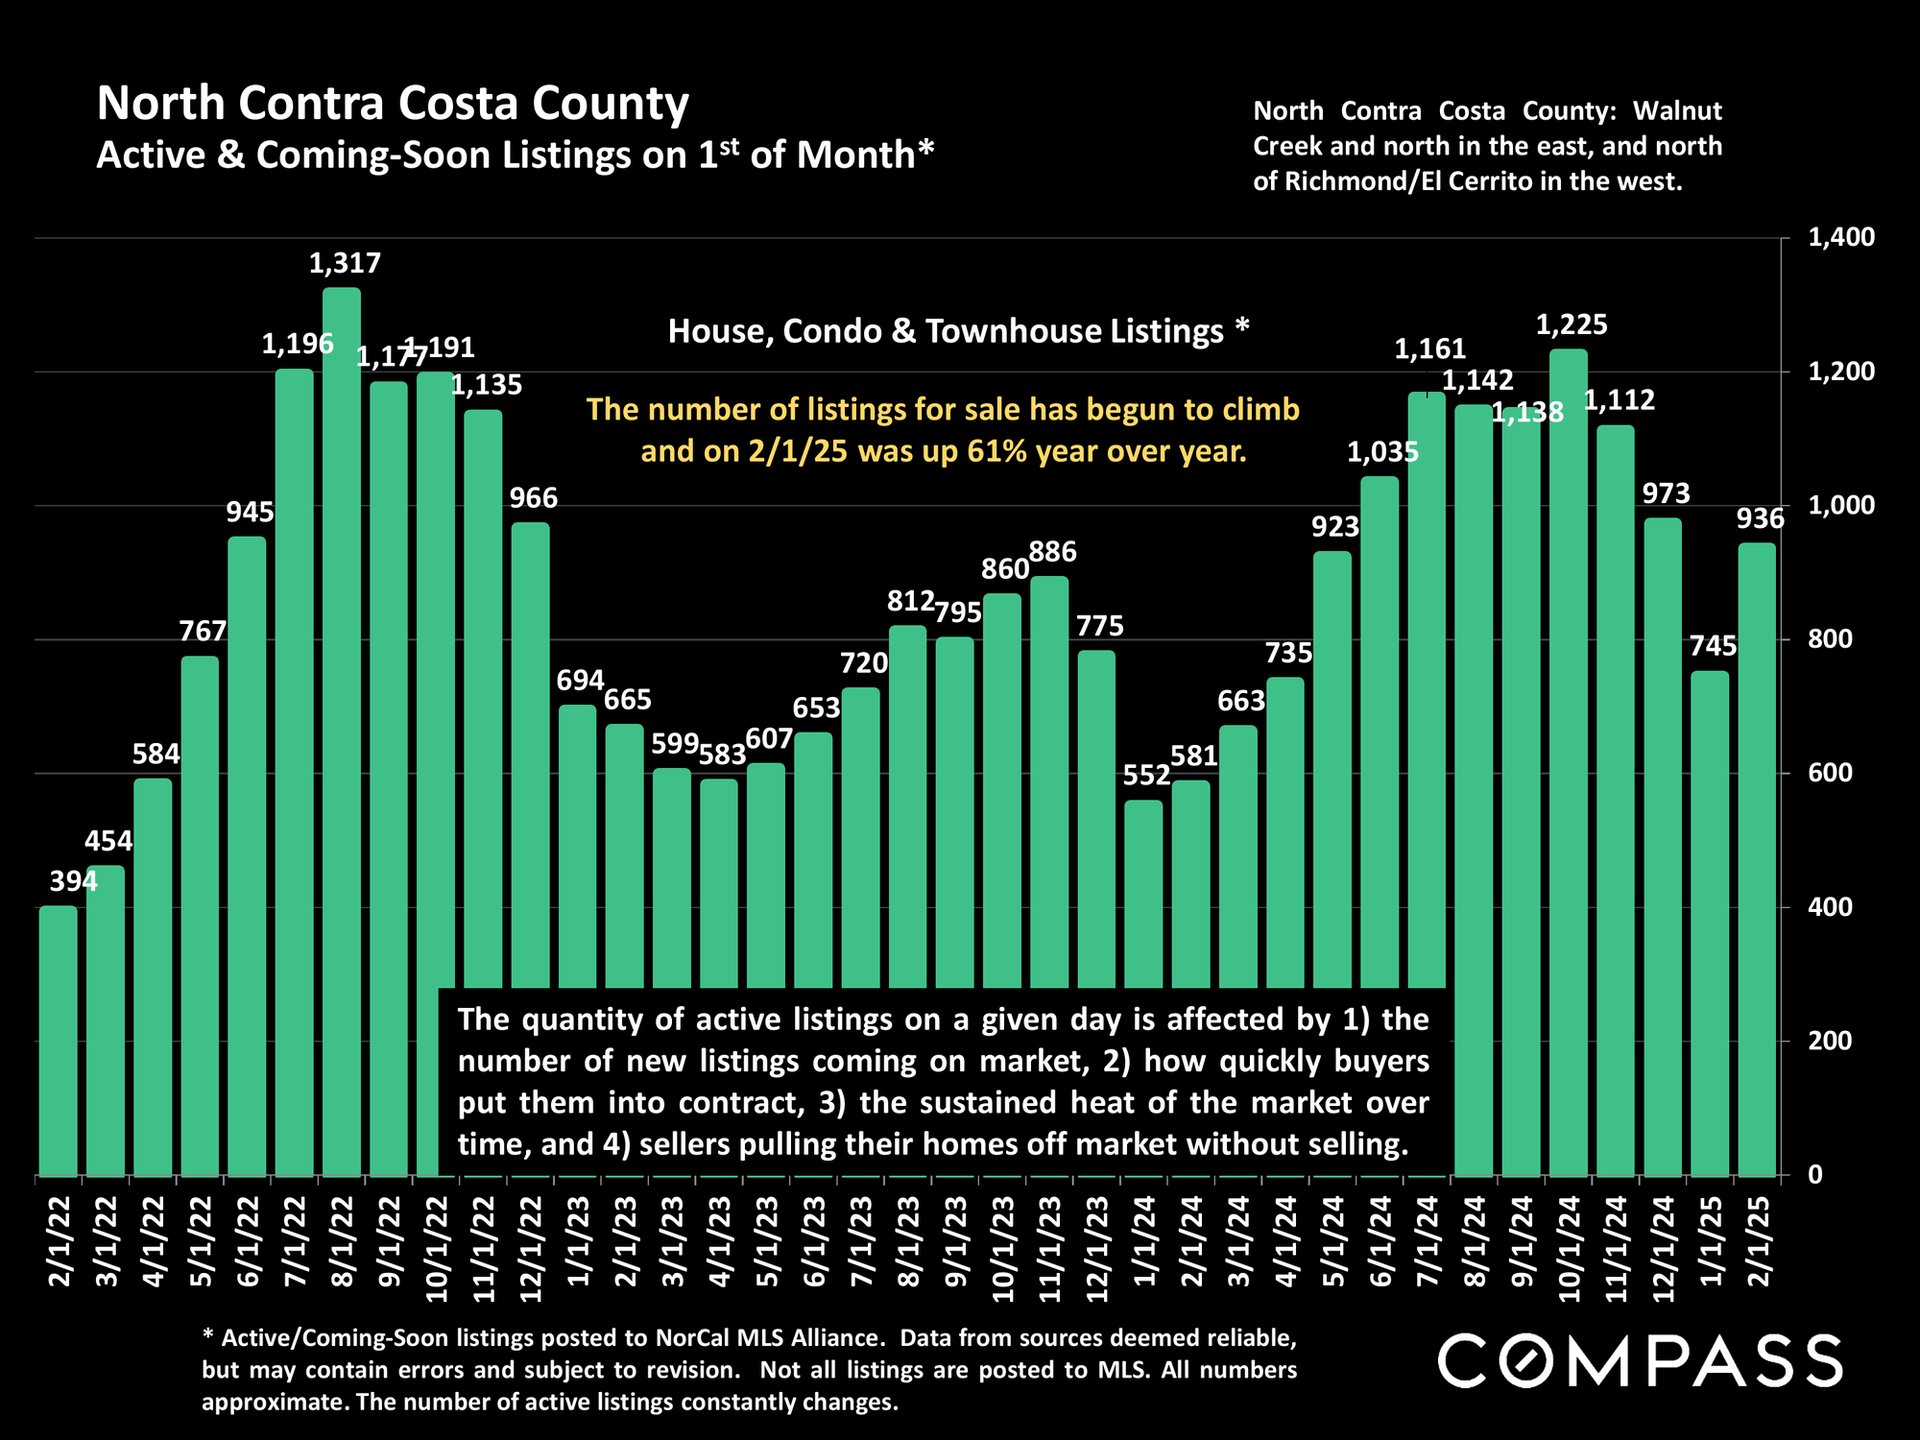
Bar chart of North Contra Costa County listings, showing 936 active and coming-soon listings in February 2025, up 61% year over year.
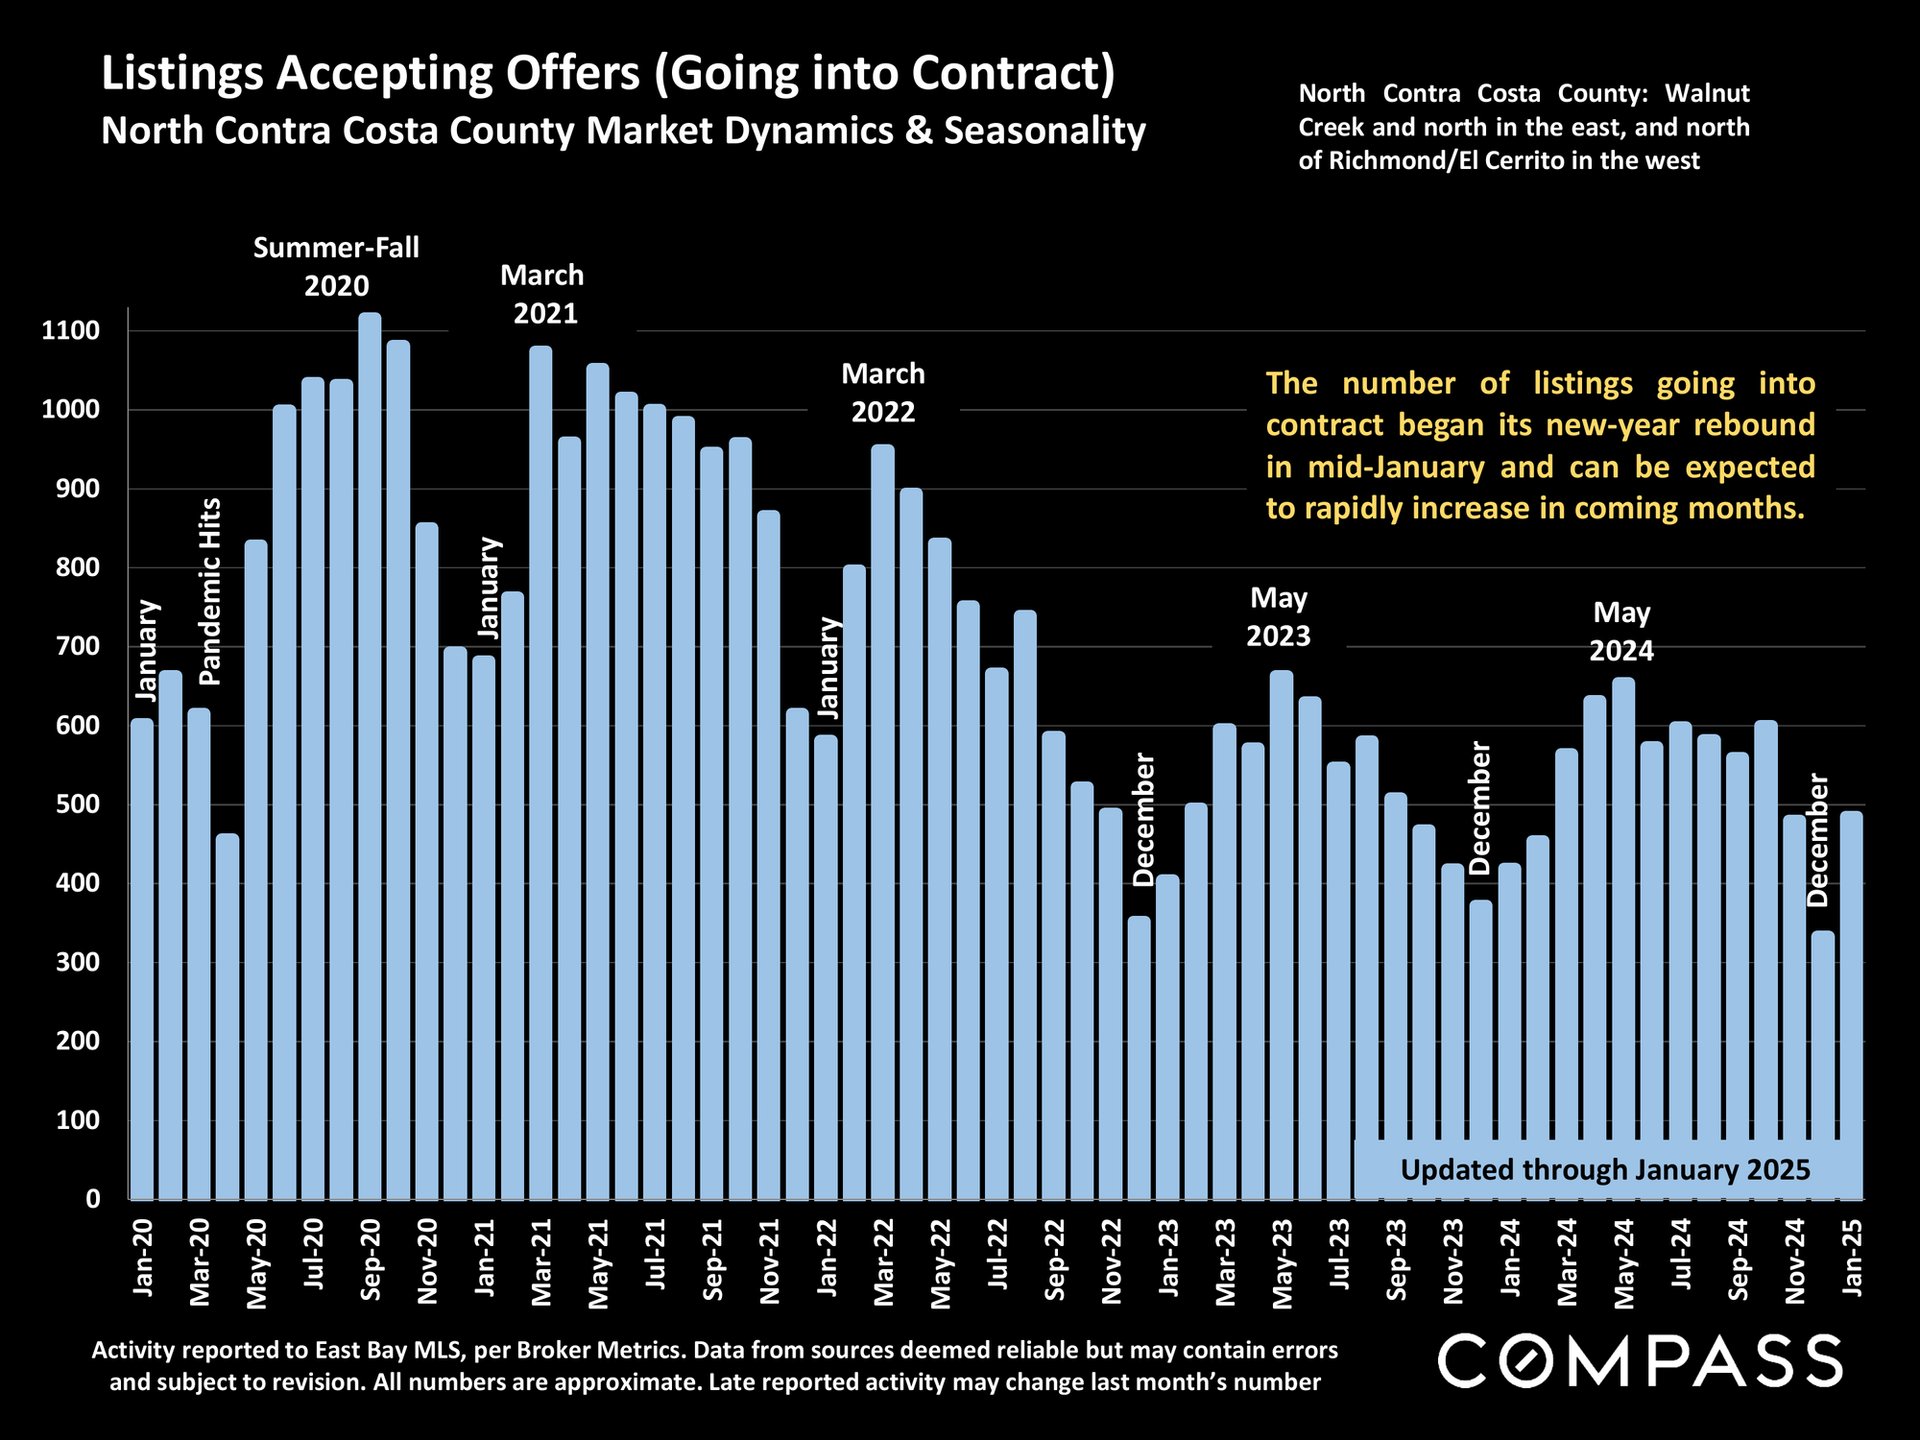
Chart of North Contra Costa County listings going under contract monthly from 2020 through January 2025.
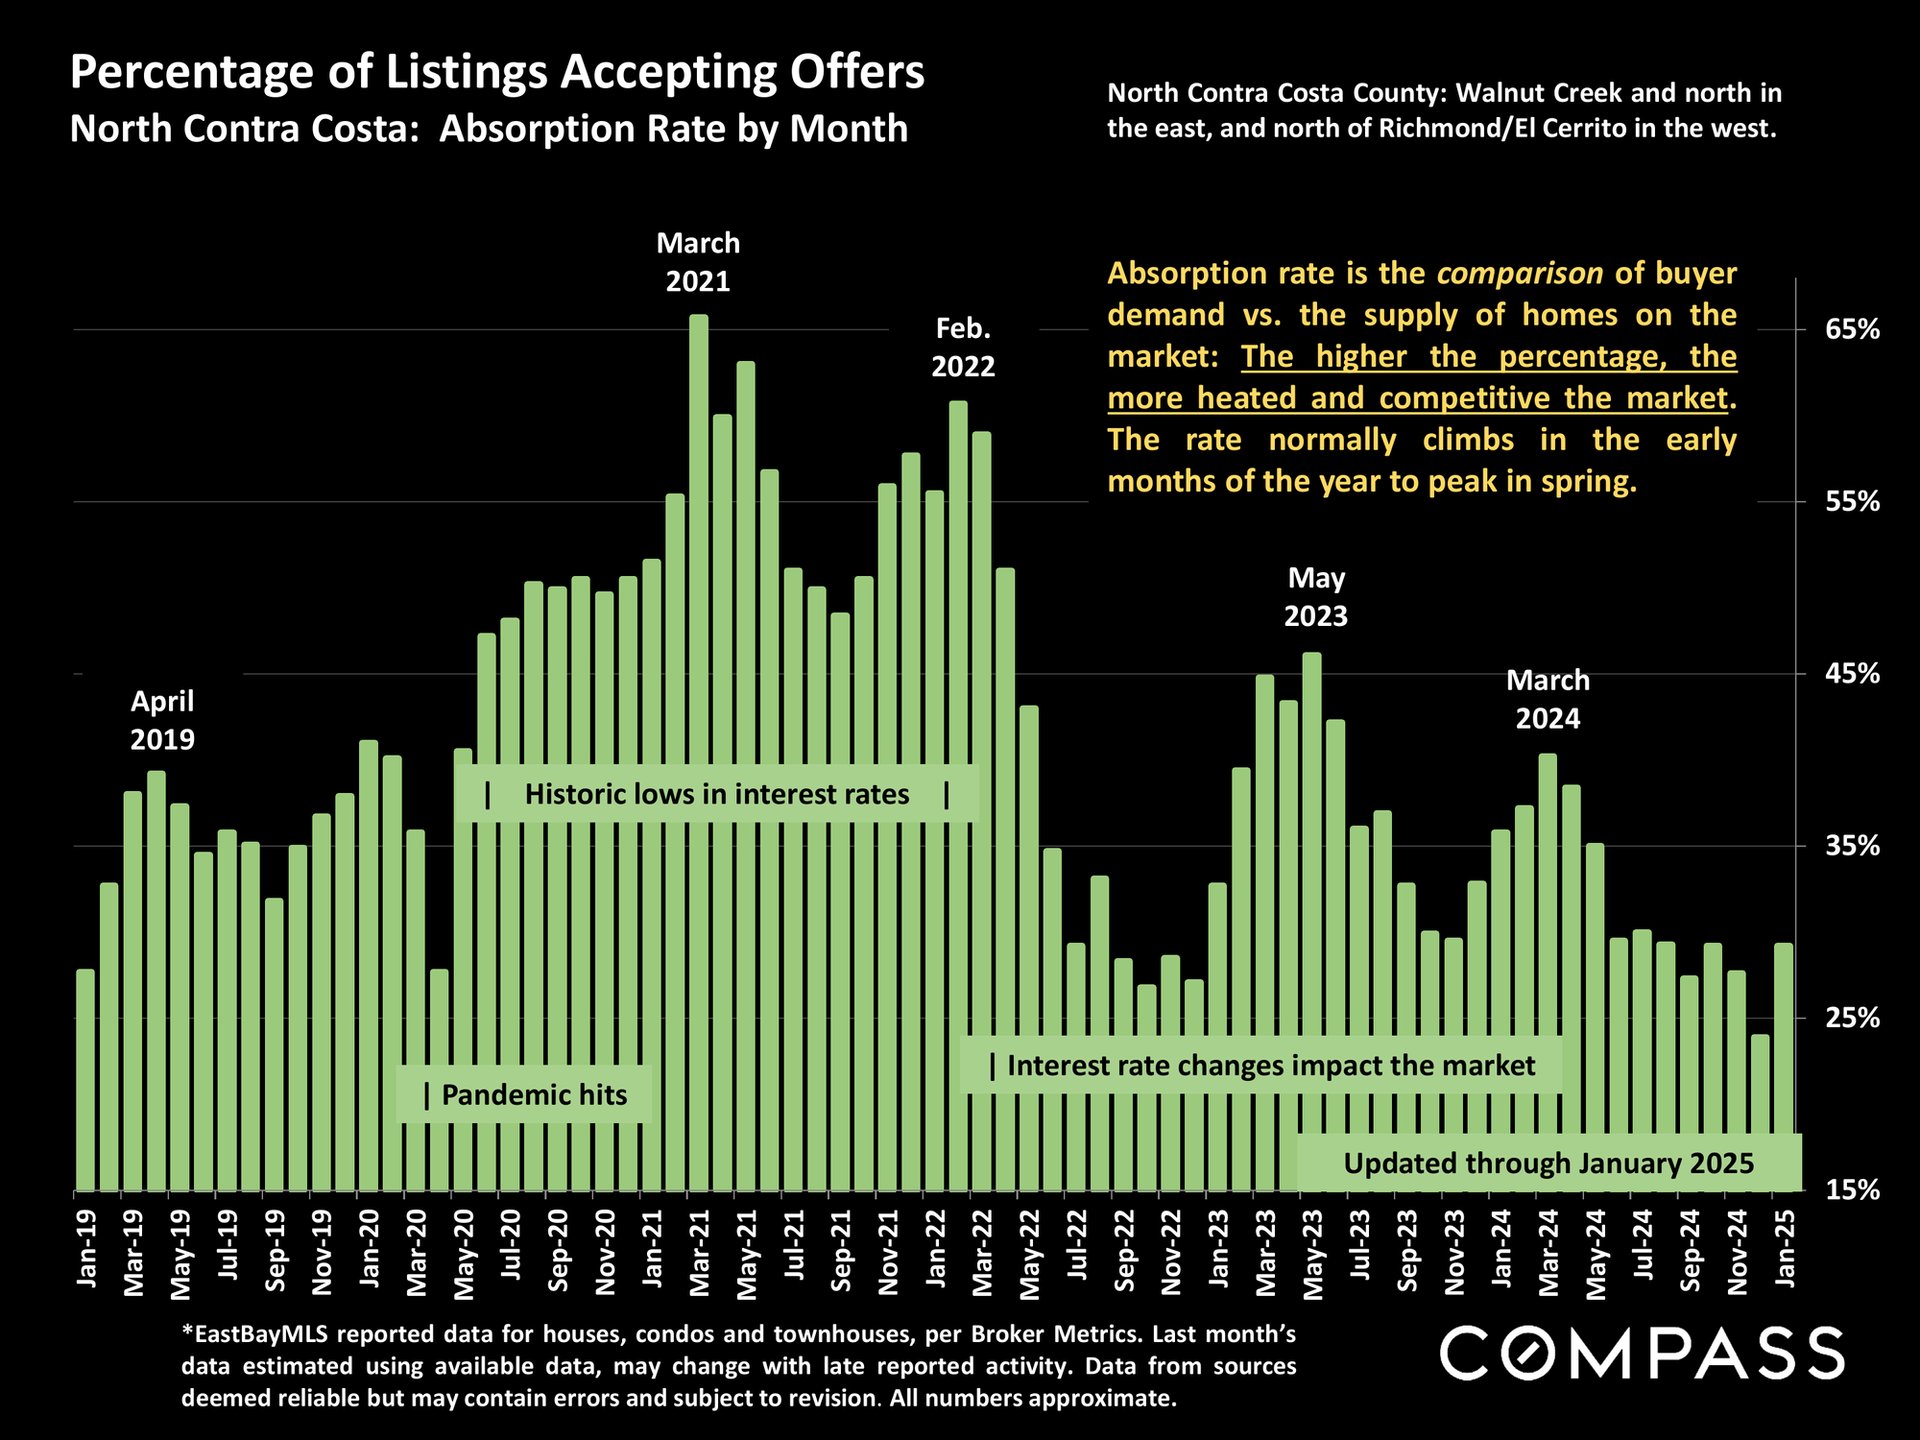
North Contra Costa listing absorption-rate chart, January 2019–January 2025, with annotations on market events.
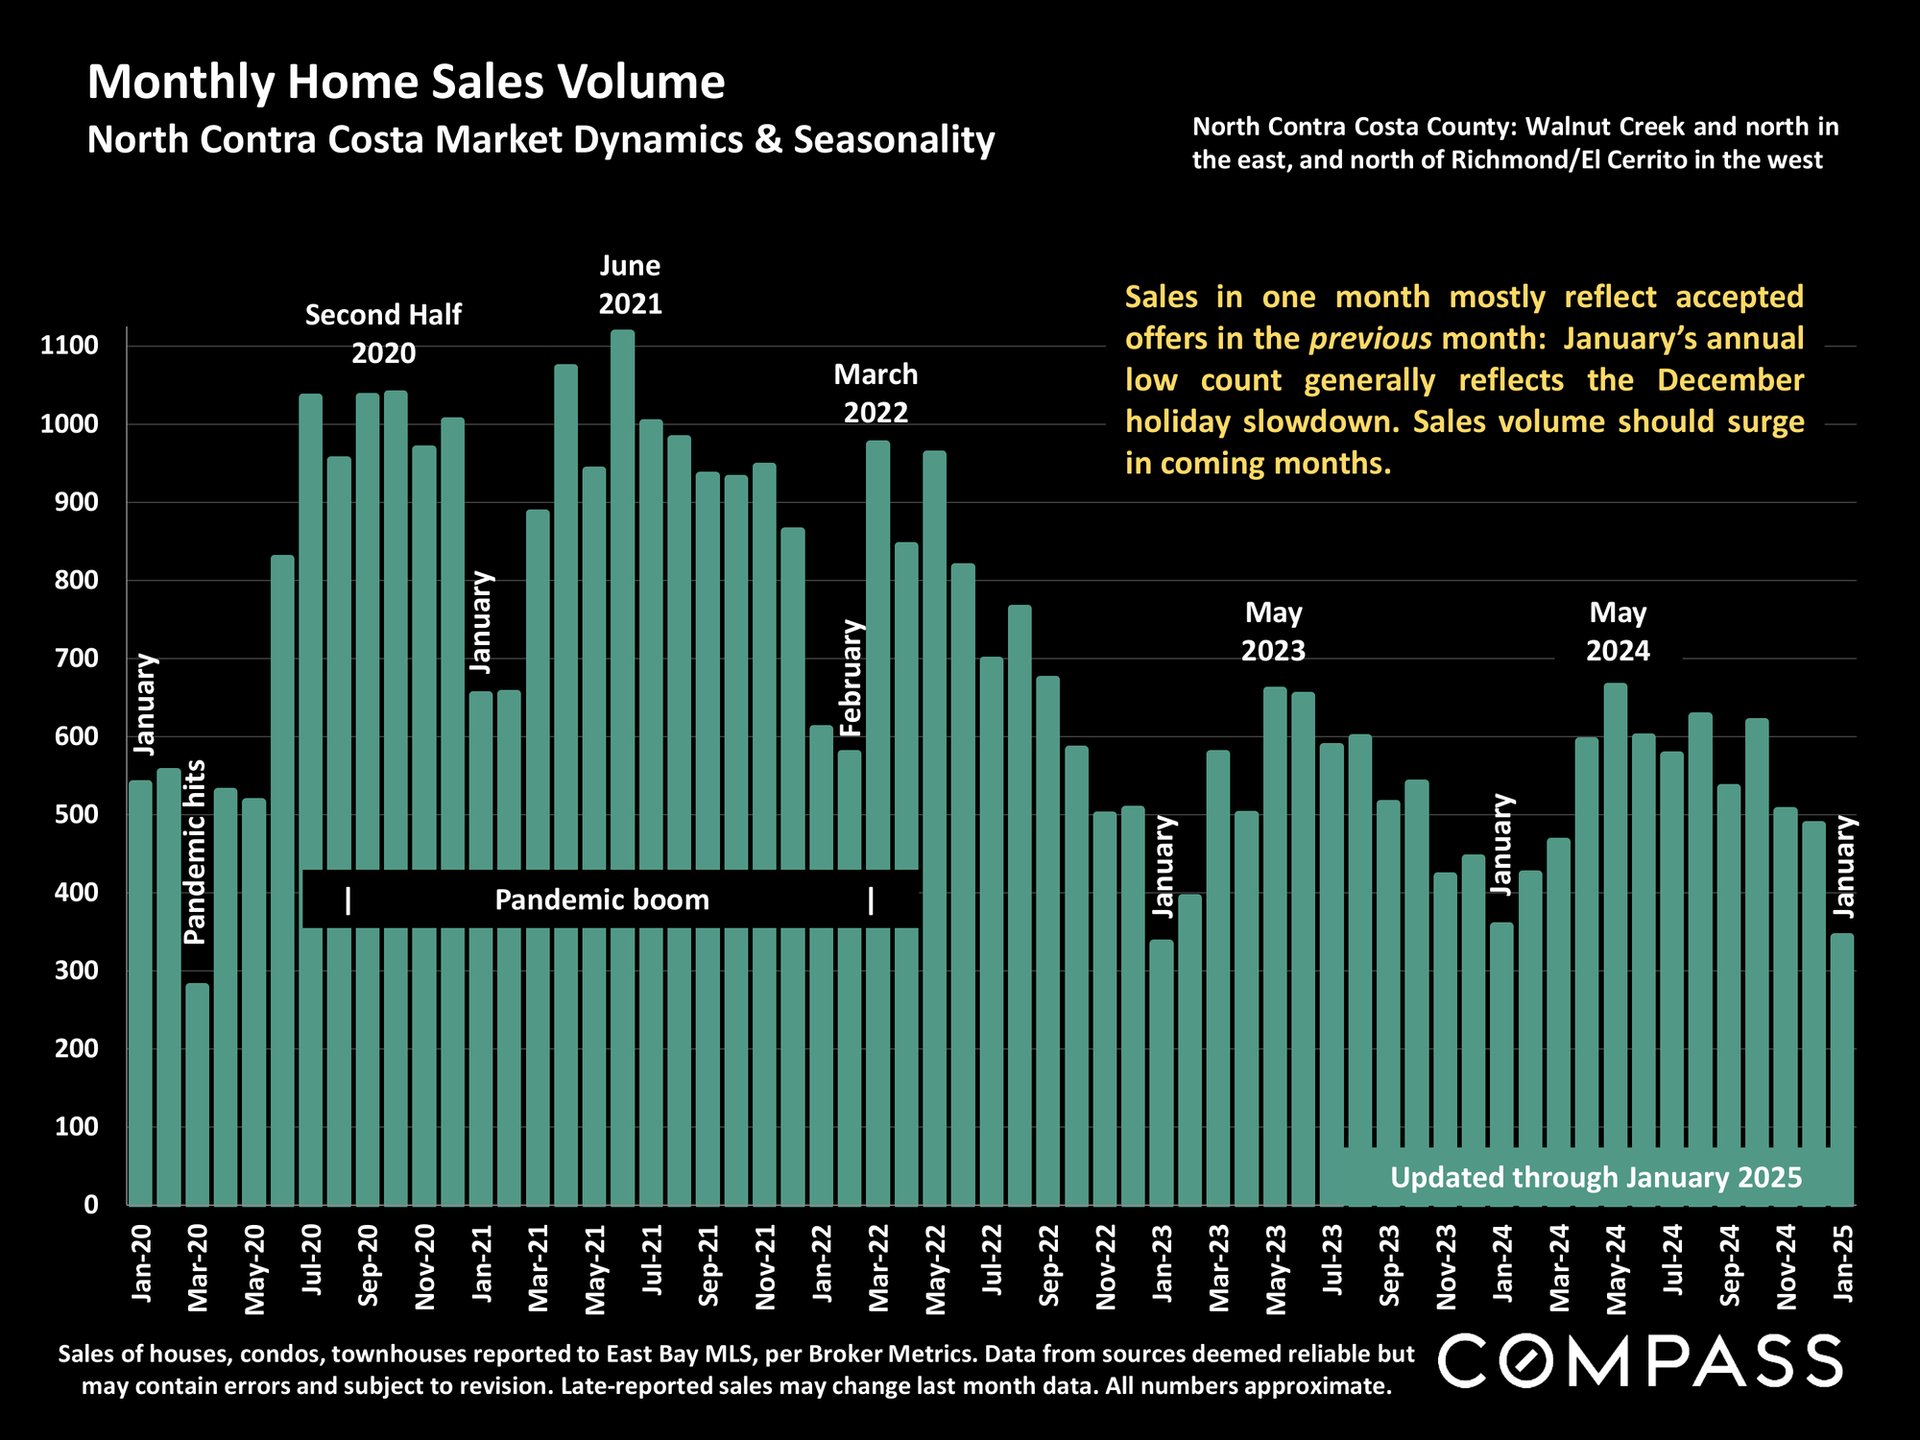
Bar chart of monthly North Contra Costa County home sales, January 2020–January 2025, highlighting the pandemic boom.
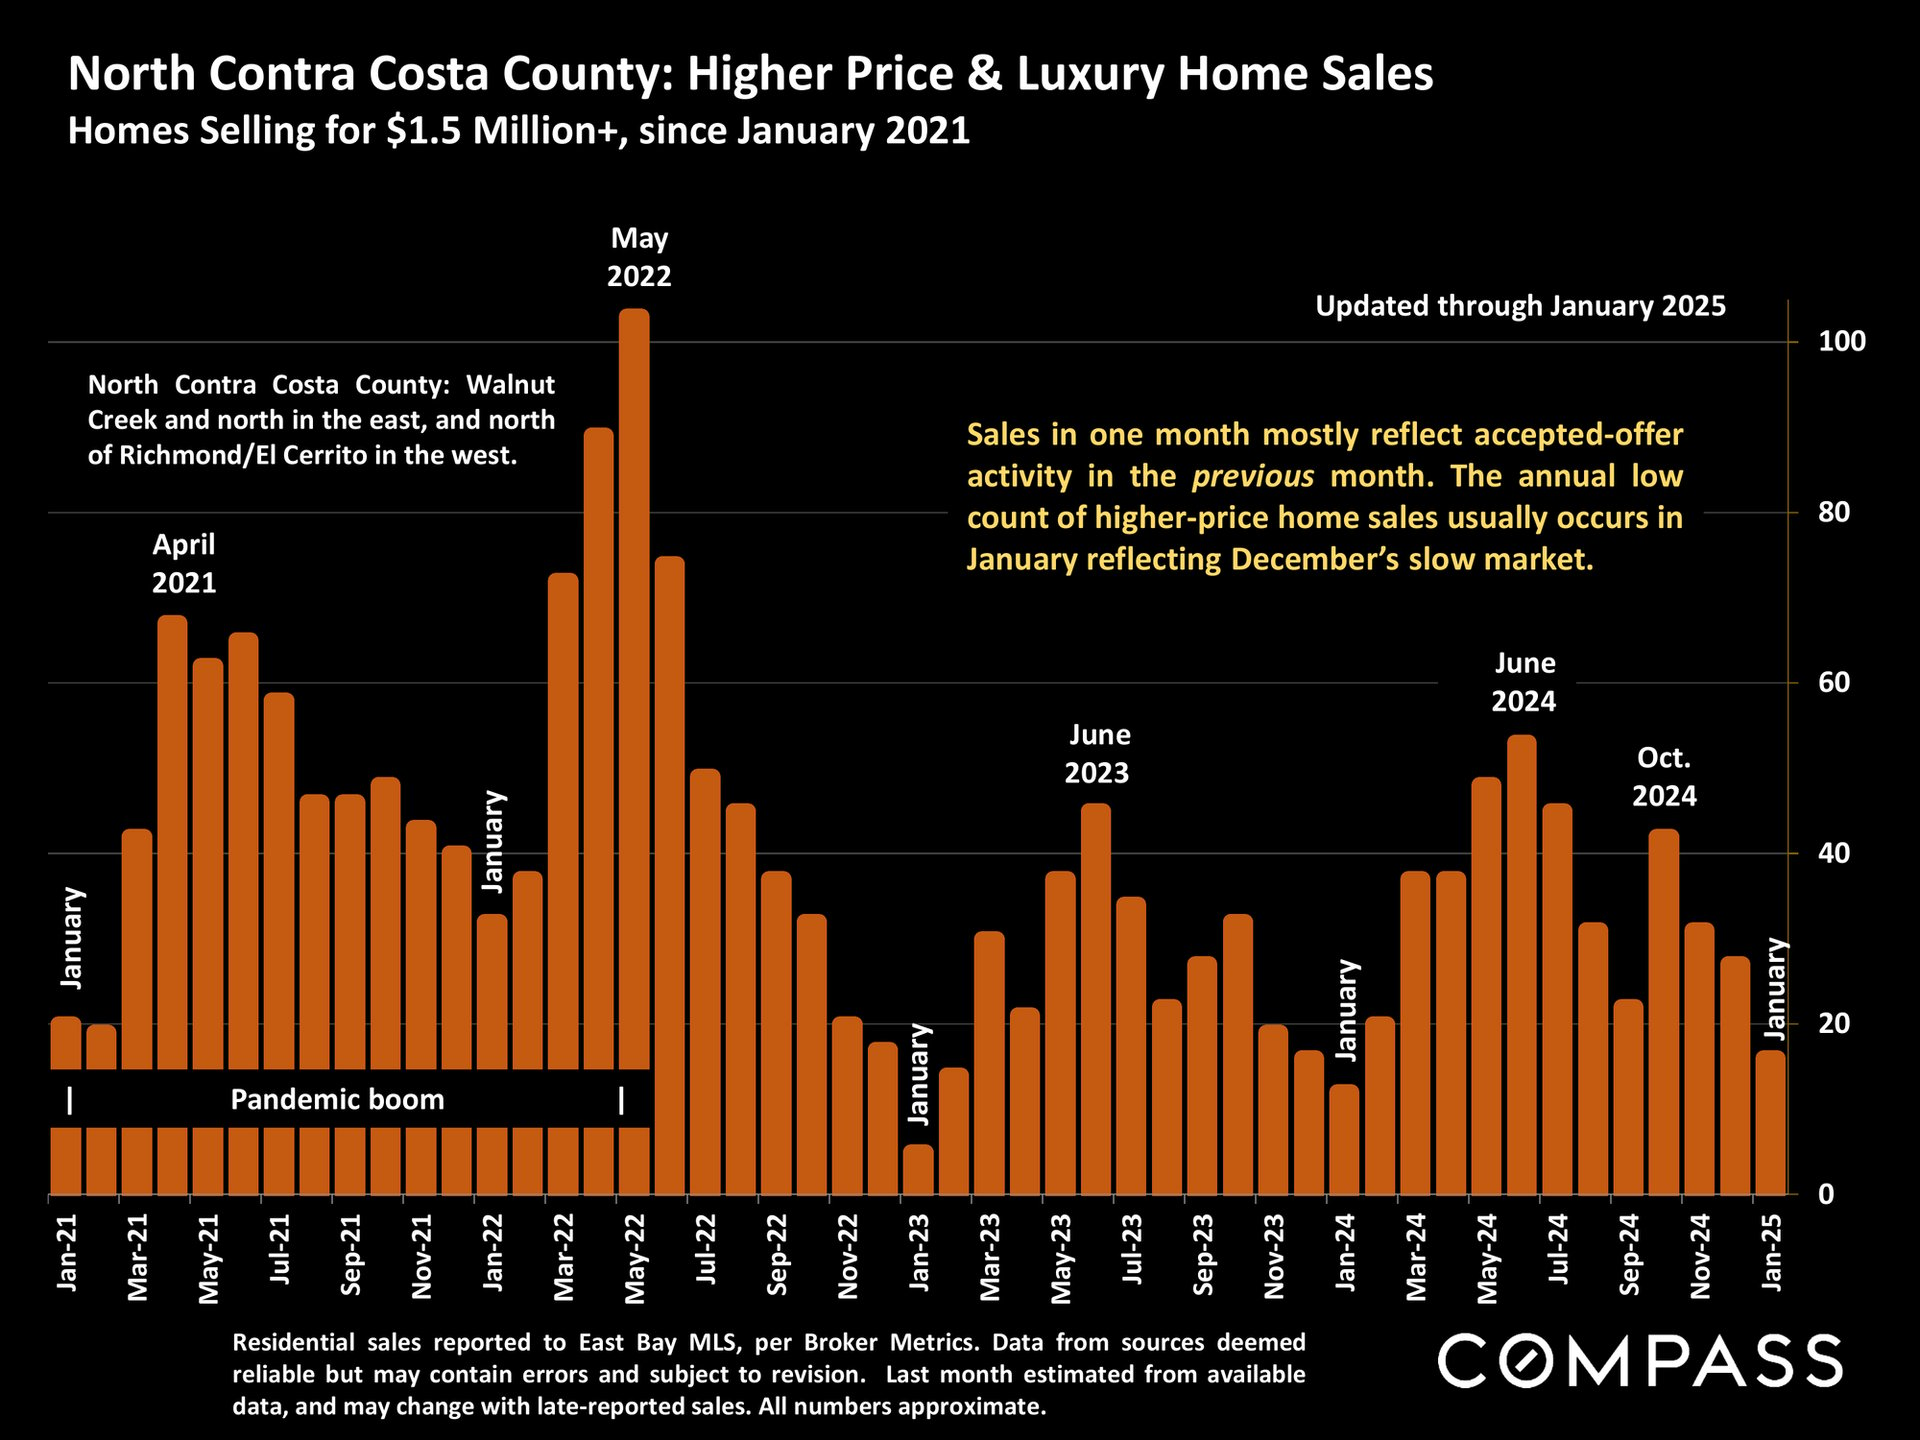
Bar chart of North Contra Costa County home sales over $1.5 million, January 2021–January 2025, peaking in May 2022.
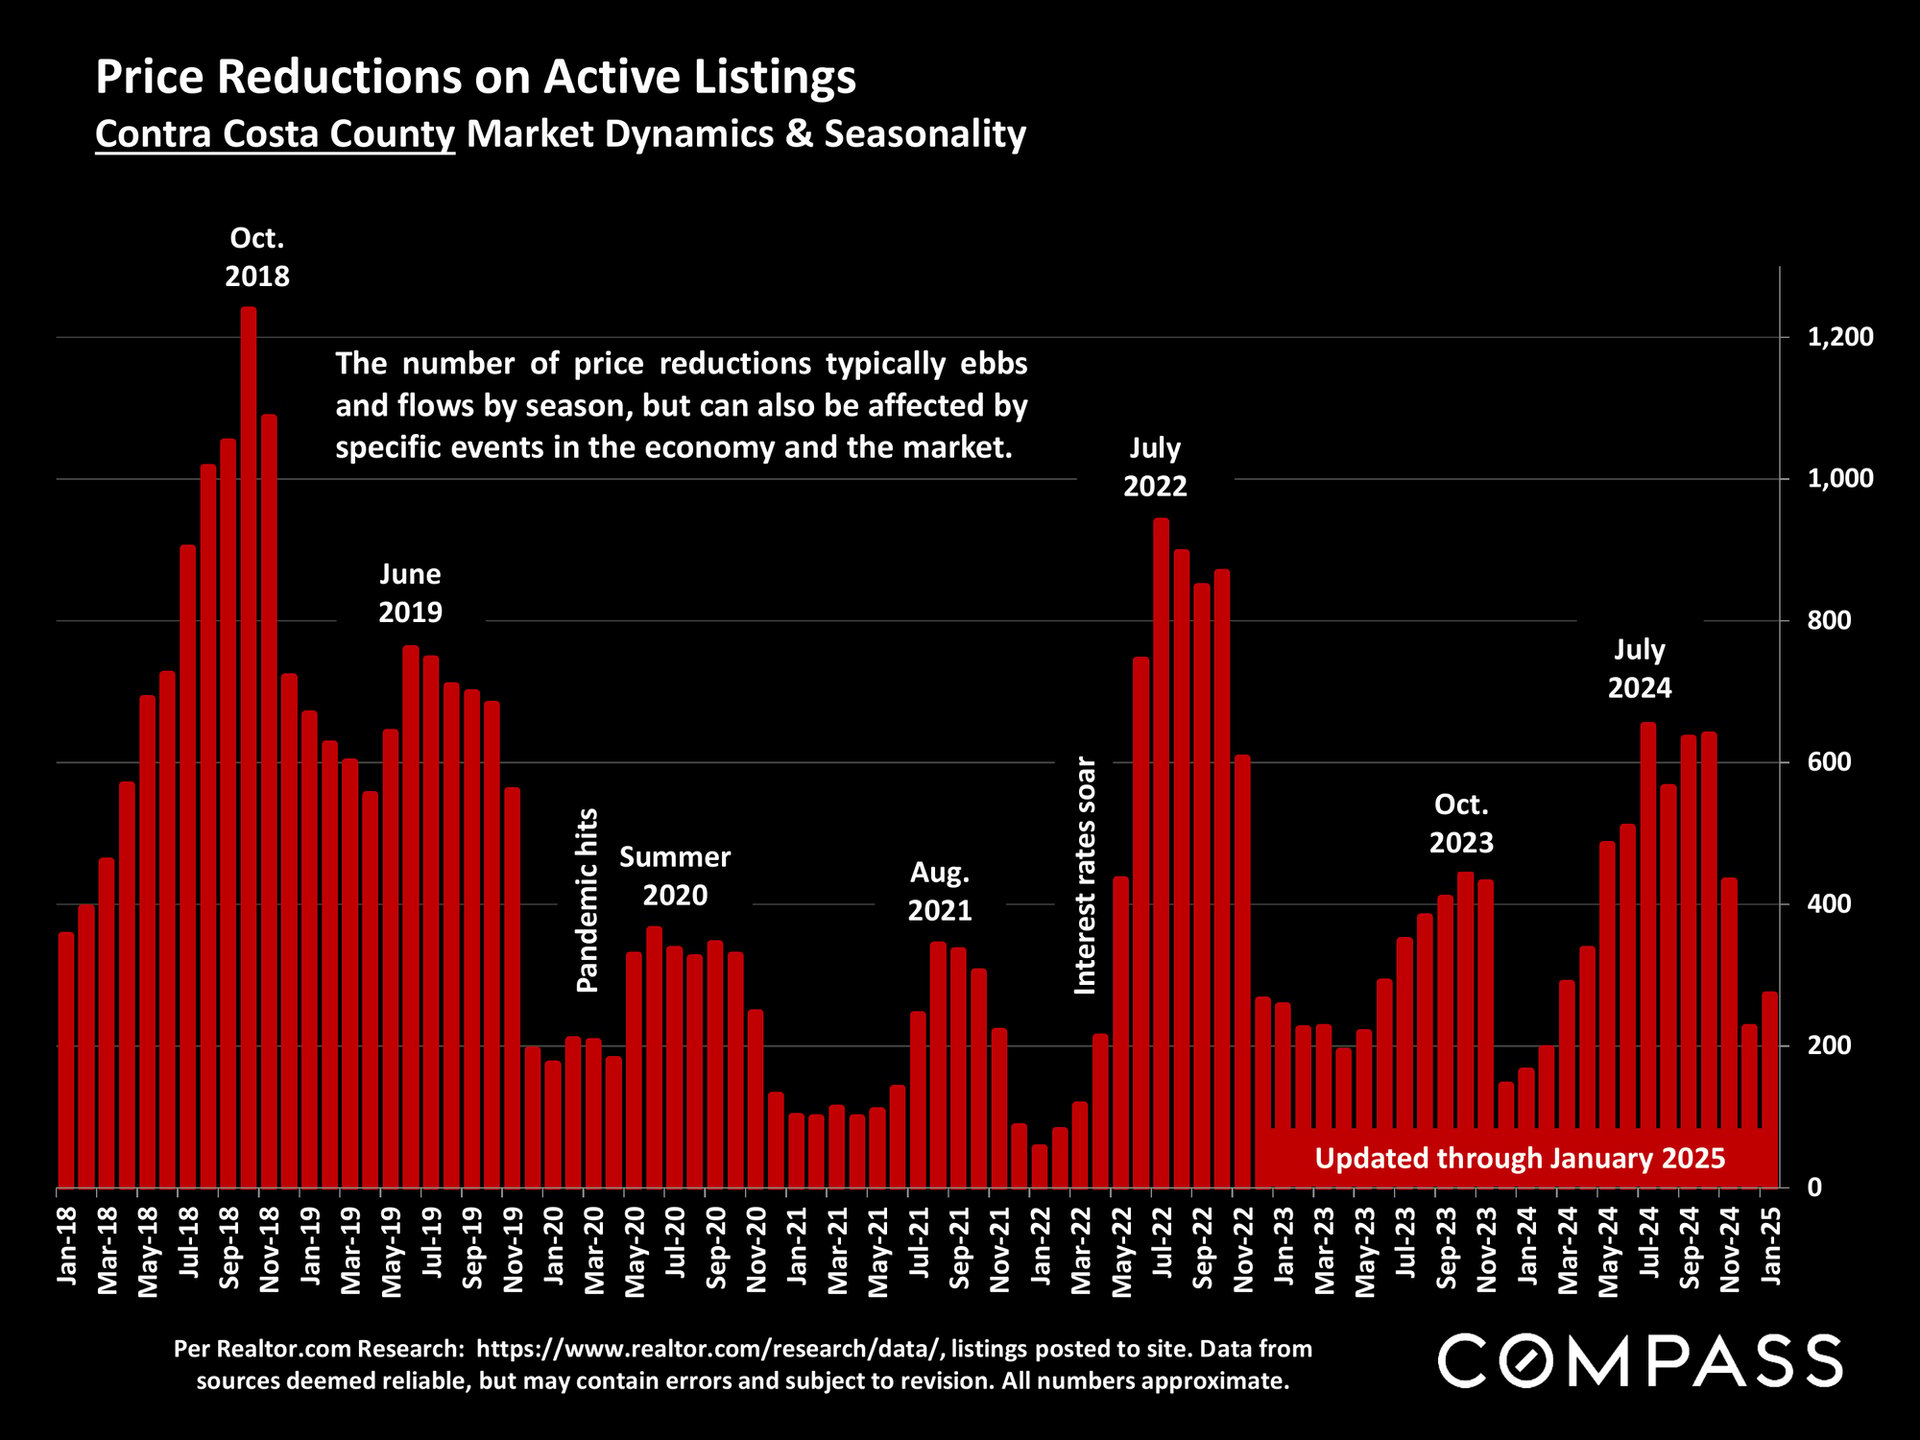
Chart of Contra Costa County listing price reductions, January 2018–January 2025, with red bars and market-event annotations.
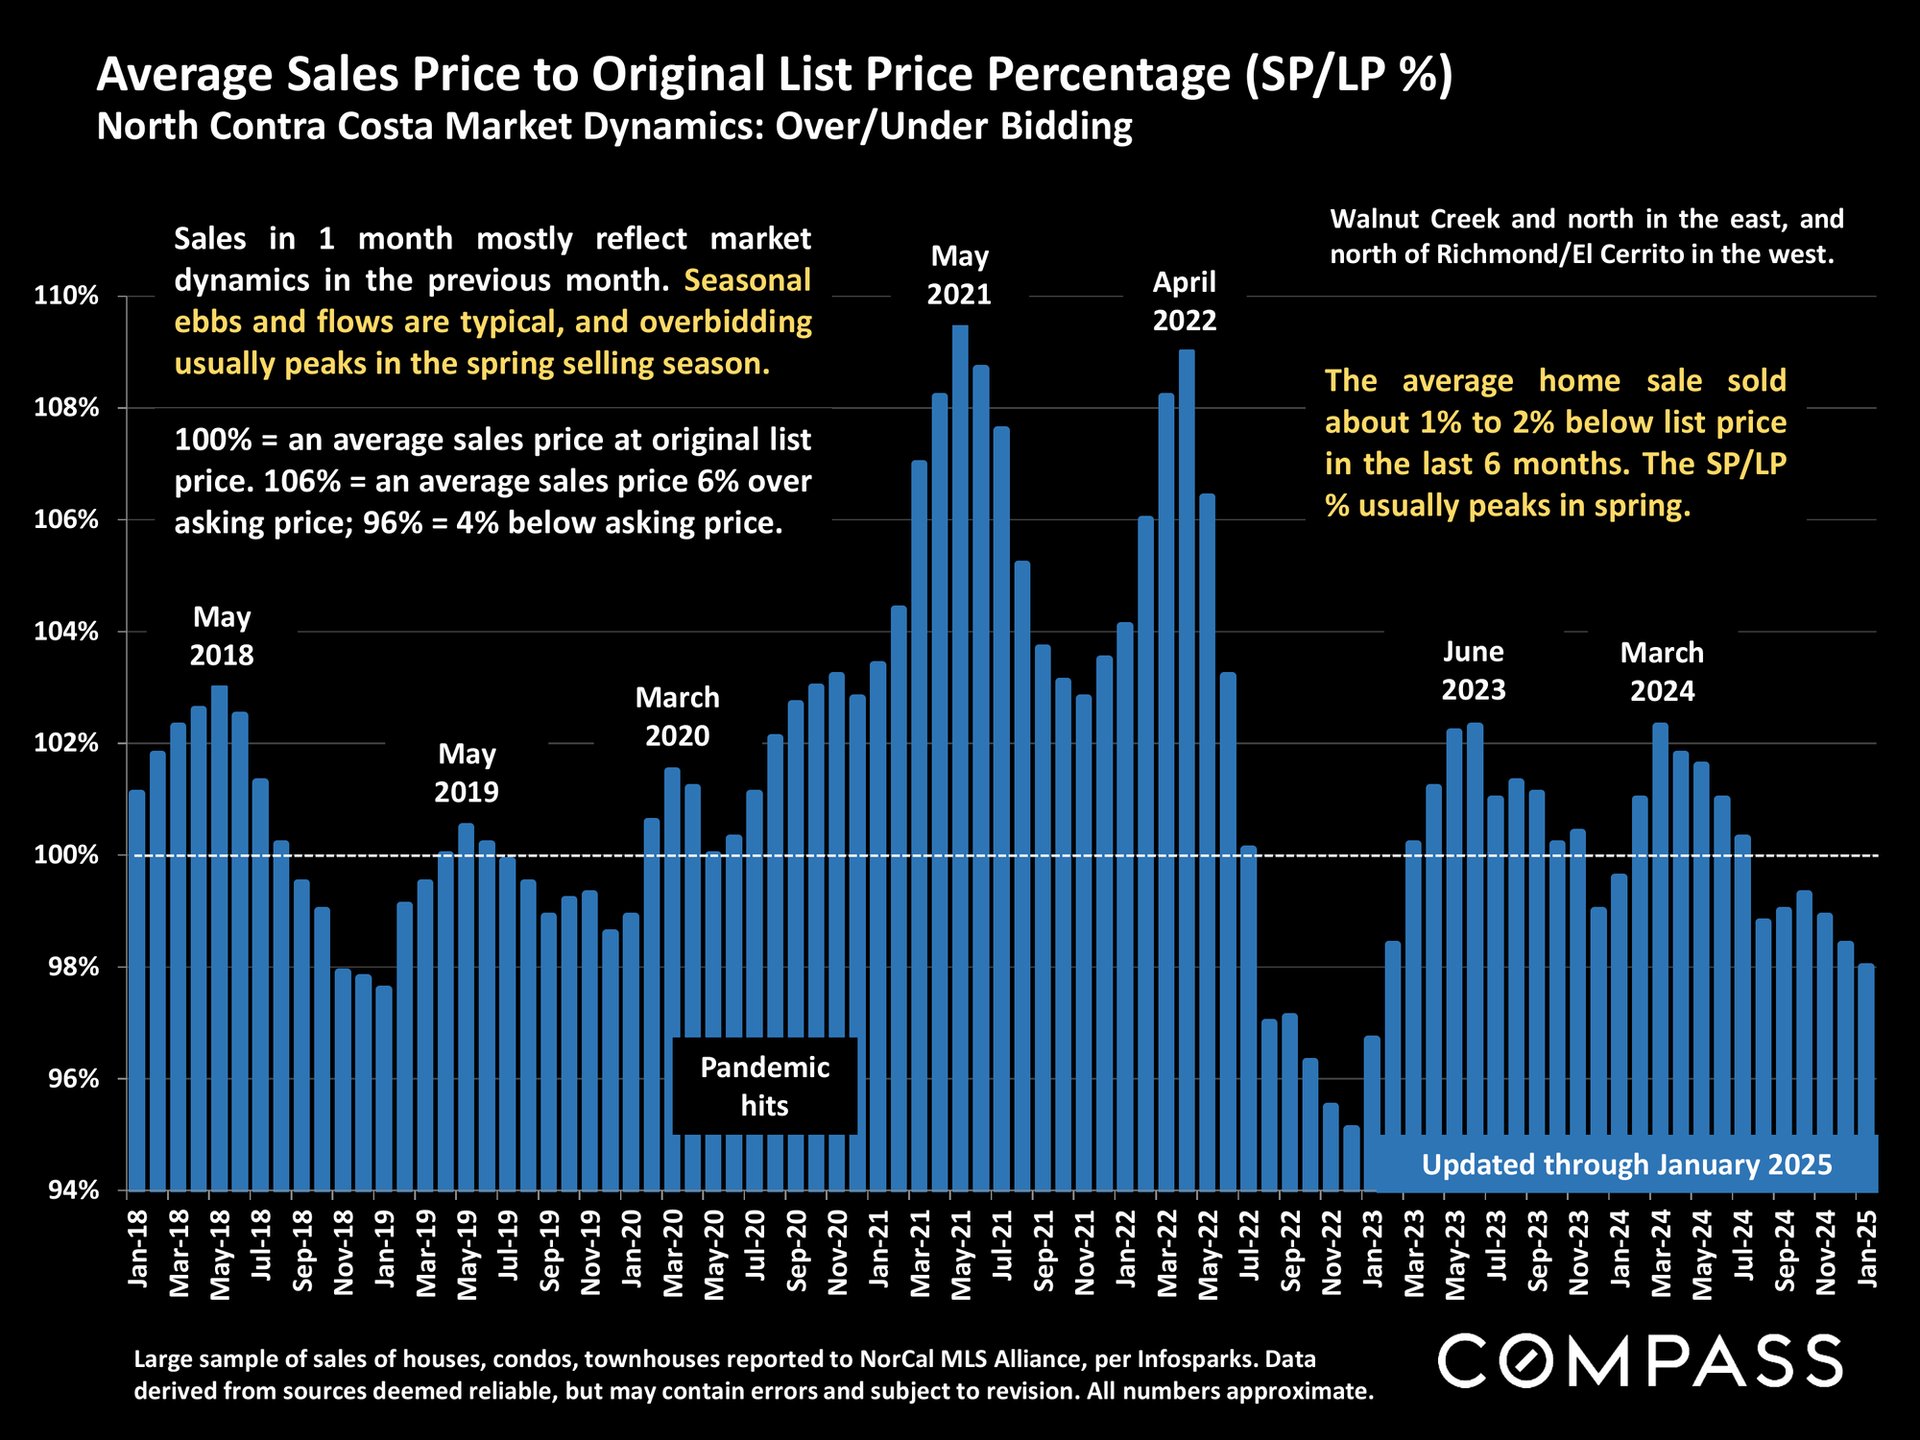
Chart of North Contra Costa sale-to-list price percentages, with monthly bars from 2018 to January 2025.
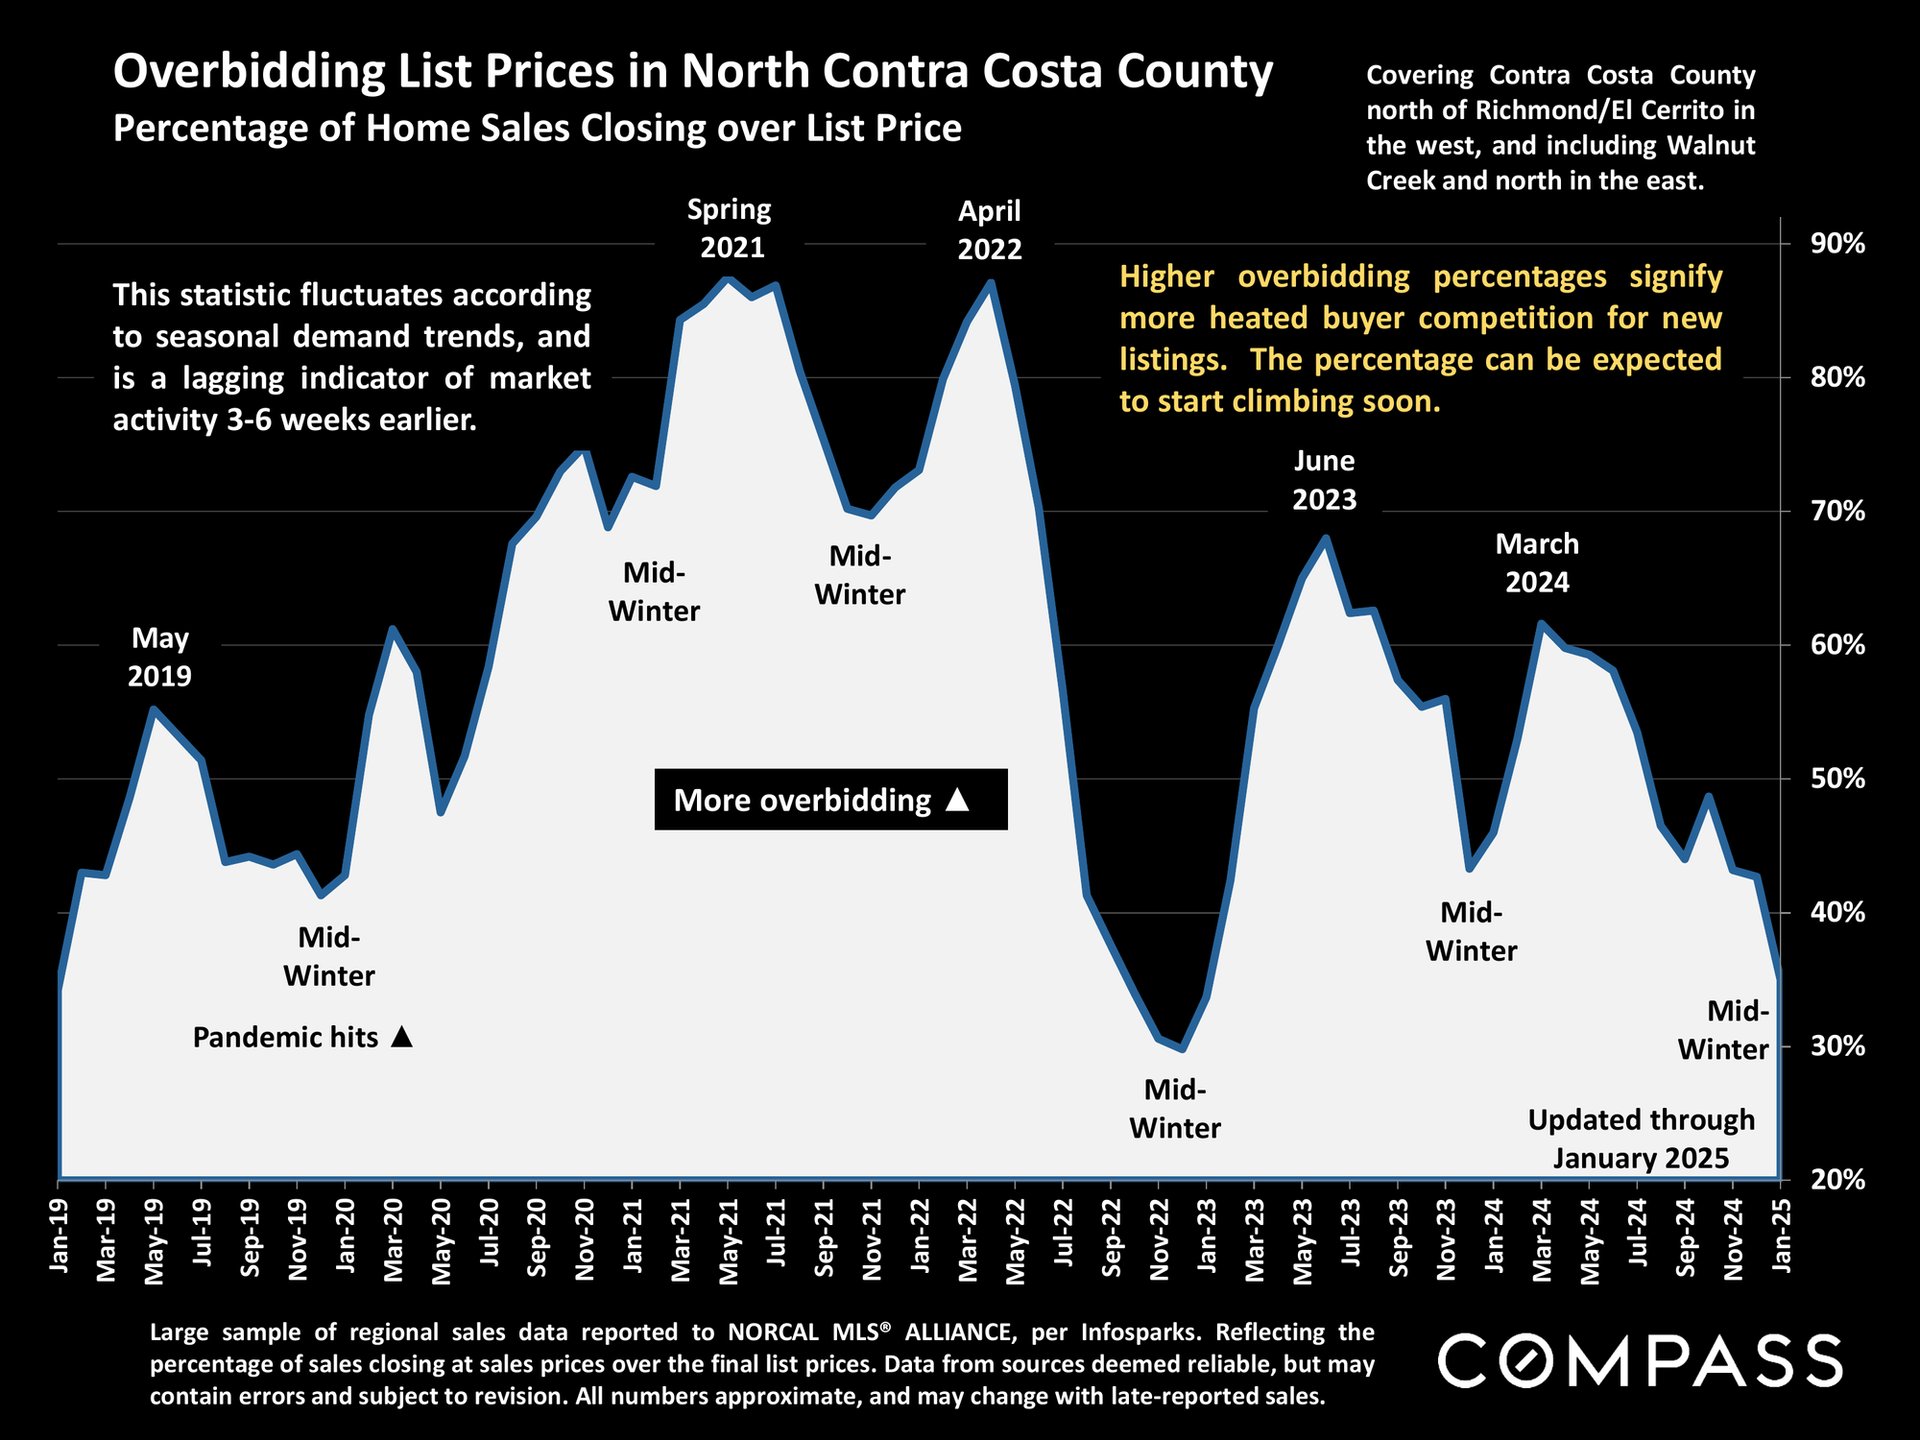
Chart of North Contra Costa County home sales closing over list price, peaking near 90% in 2021 and 2022.
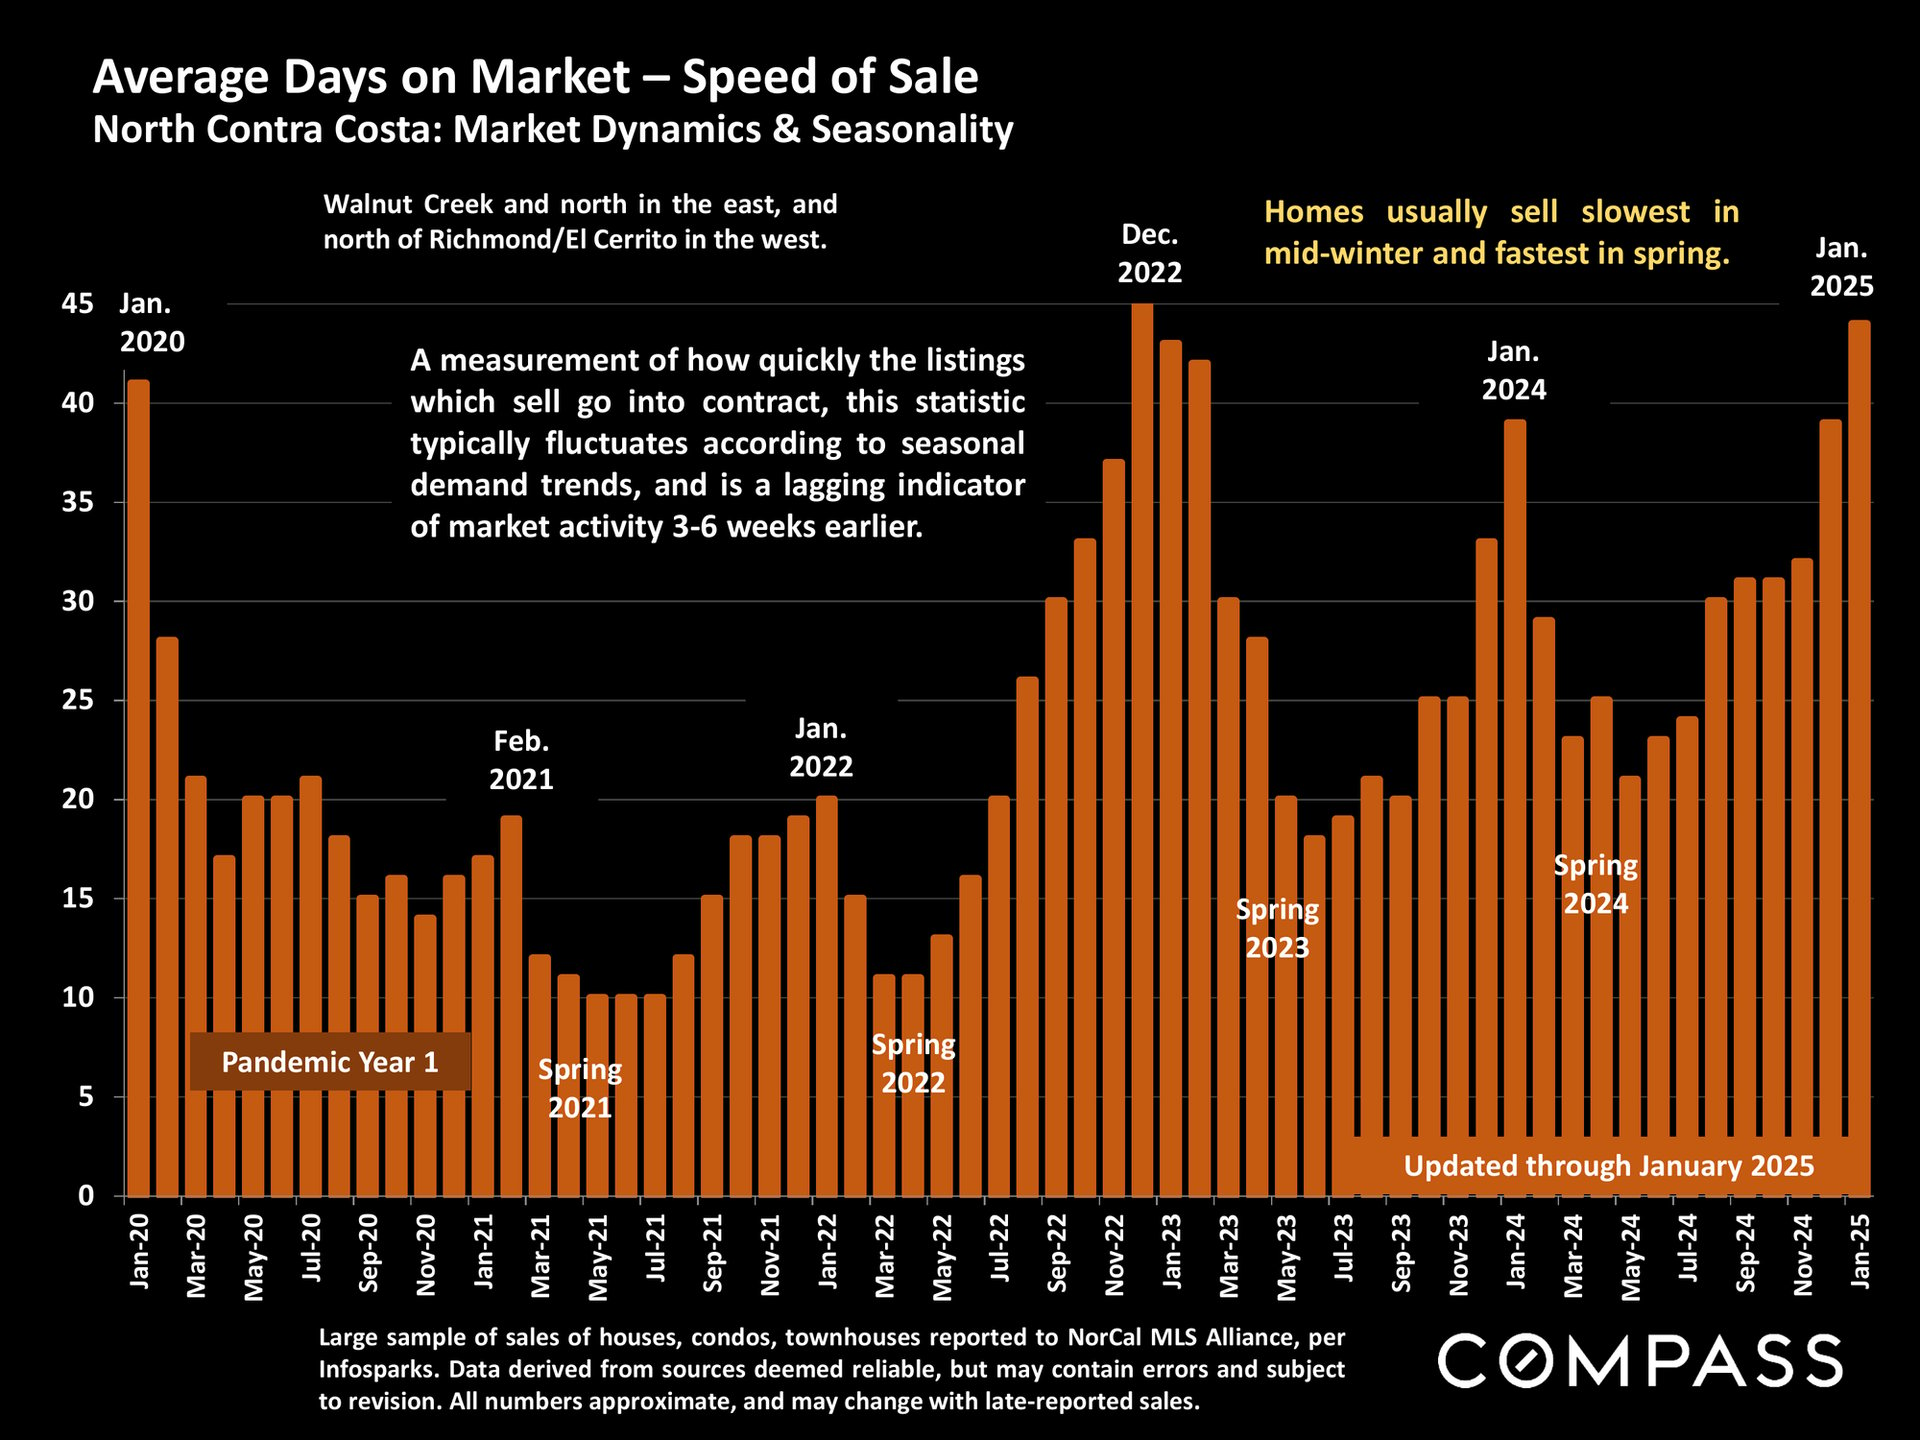
Chart of North Contra Costa County days on market from 2020 to 2025, with orange bars and seasonal annotations.
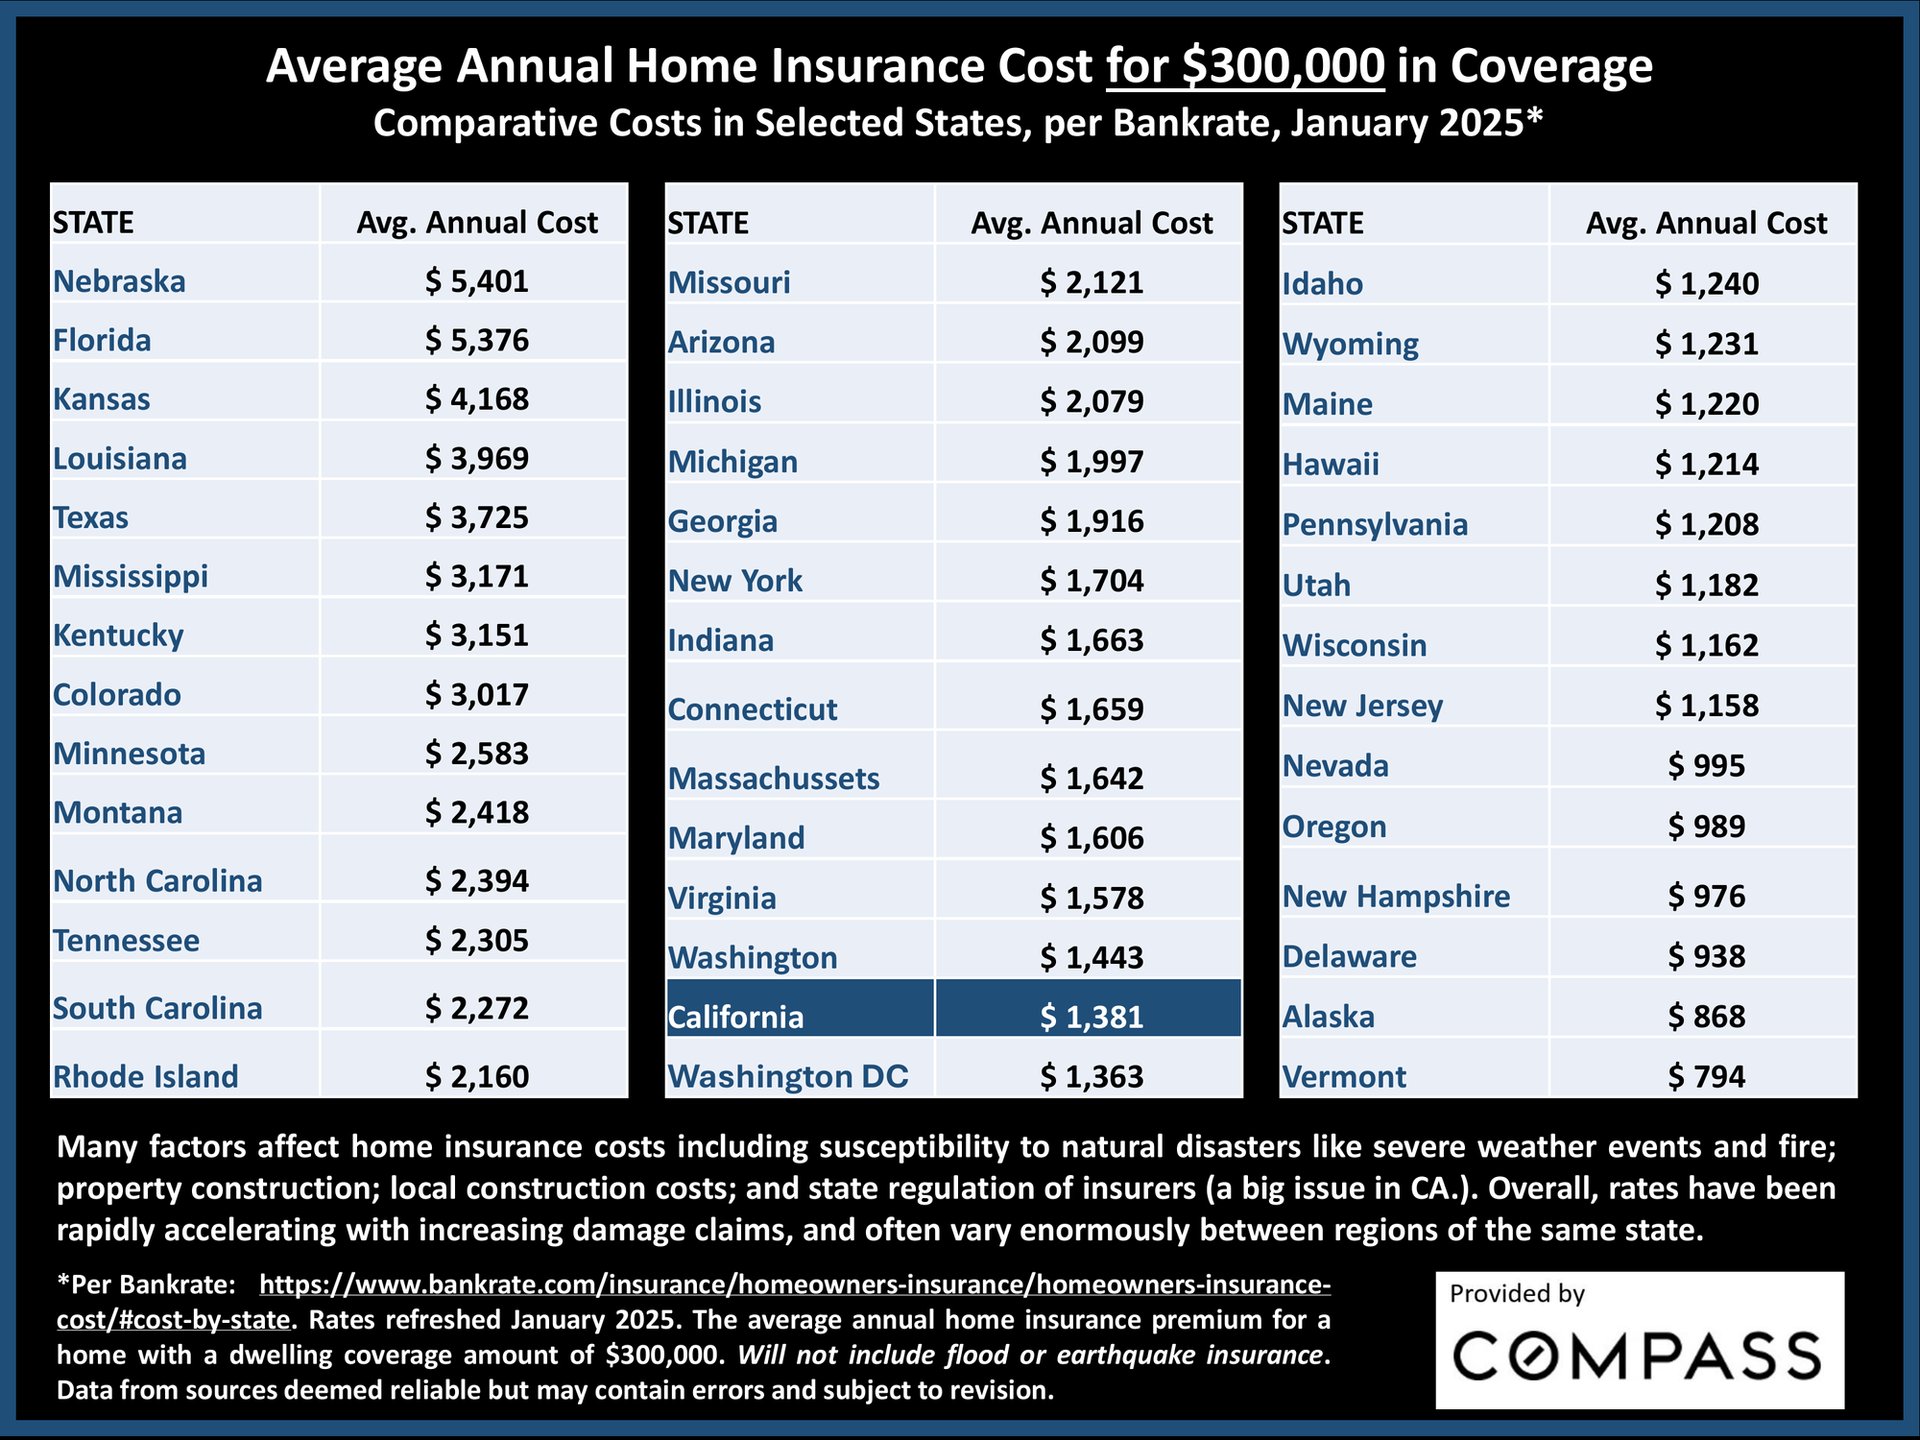
Infographic compares 2025 average annual home insurance costs by state, highlighting California at $1,381 for $300,000 coverage.
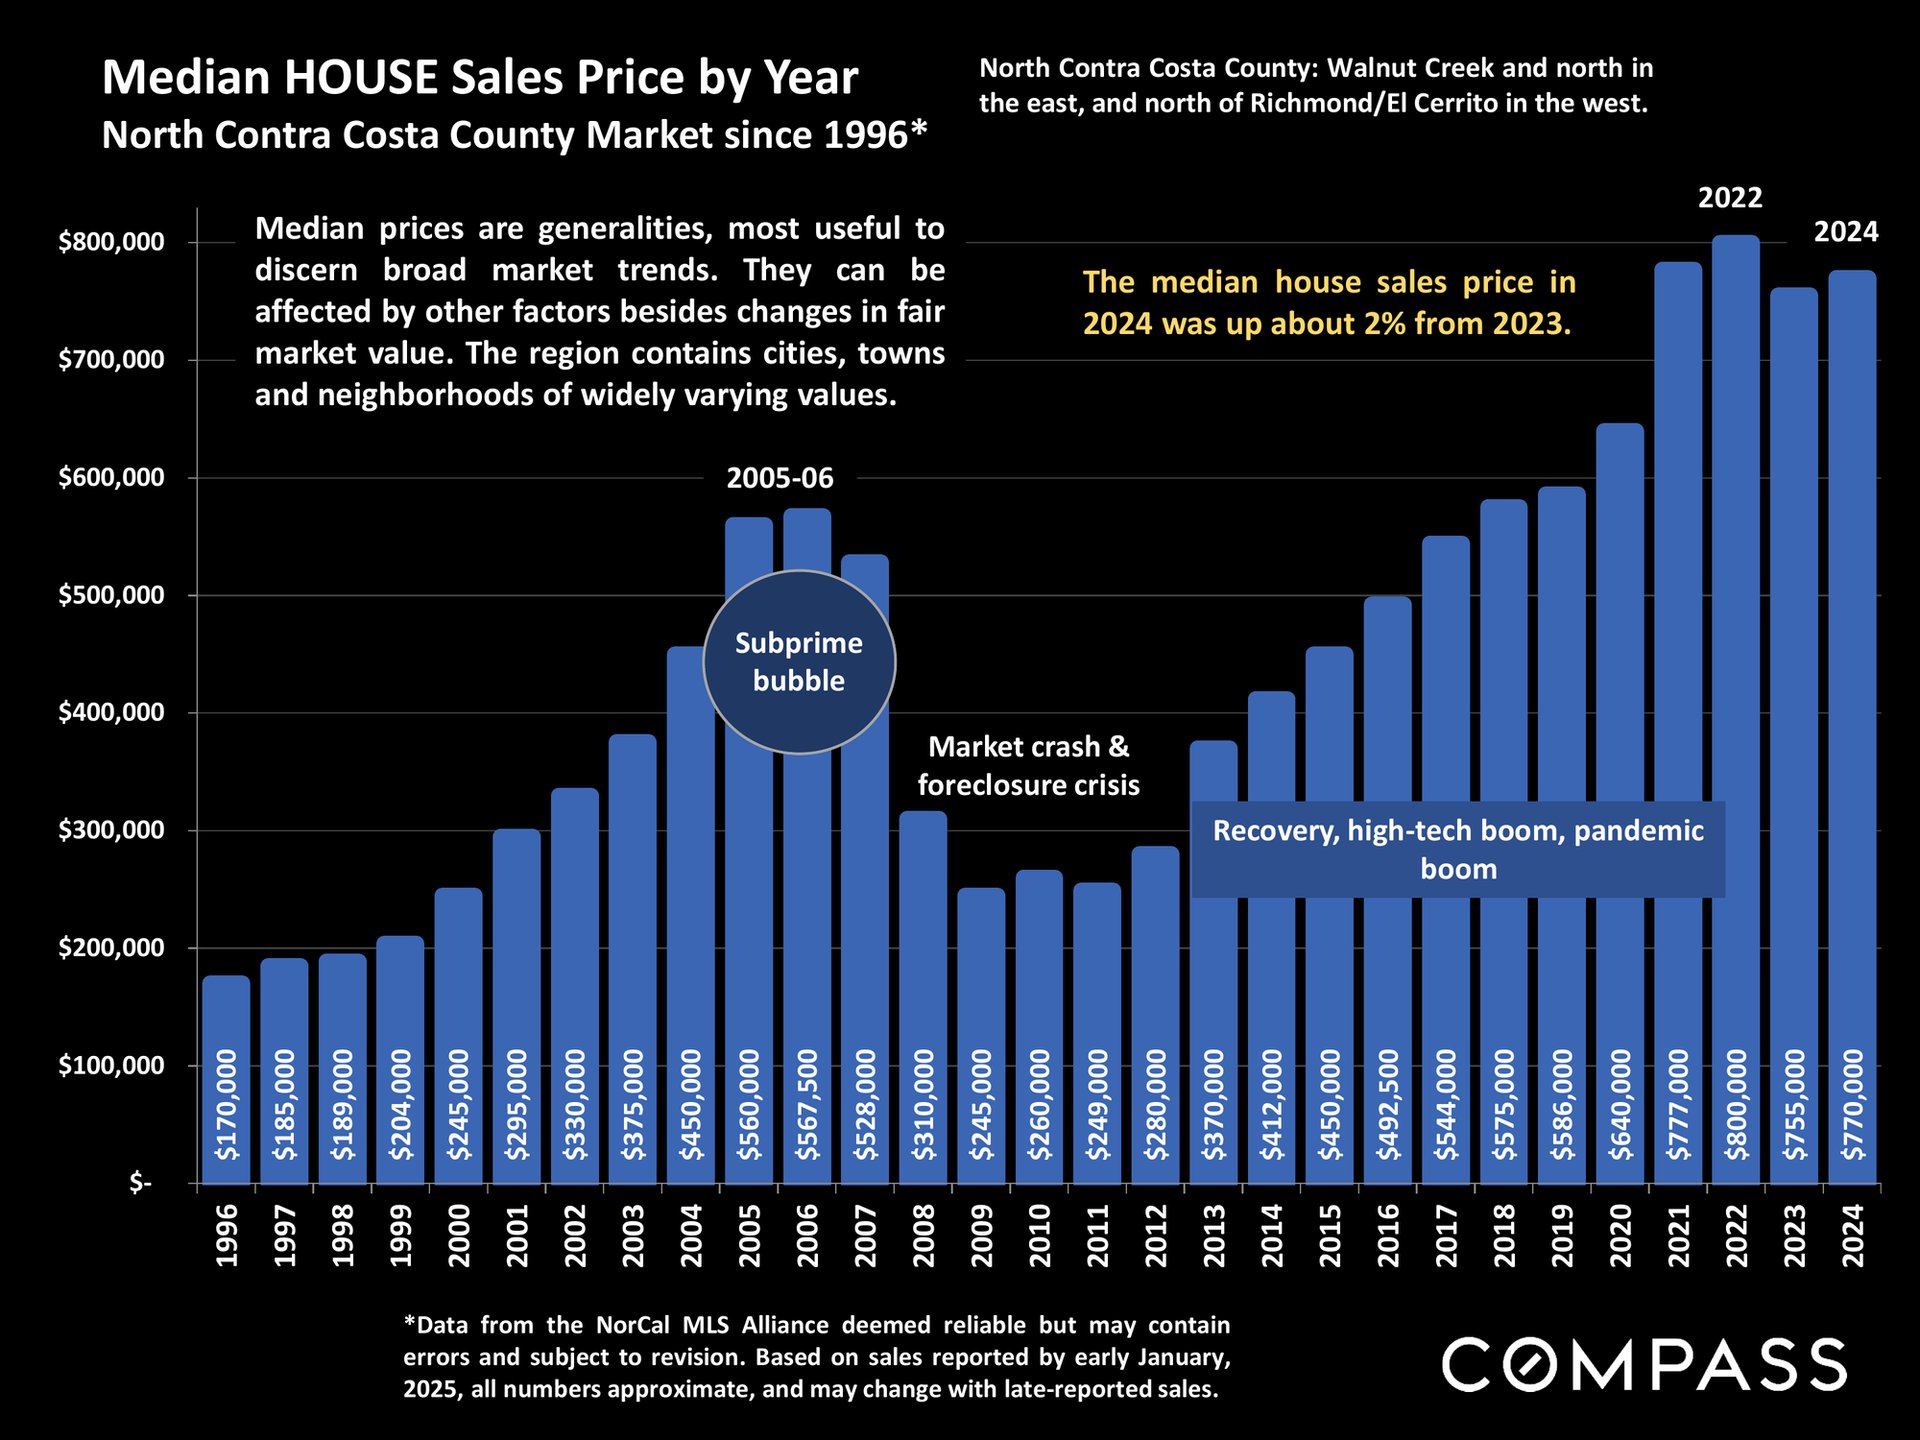
Bar chart of North Contra Costa County median house sale prices, rising from $170,000 in 1996 to $770,000 in 2024.
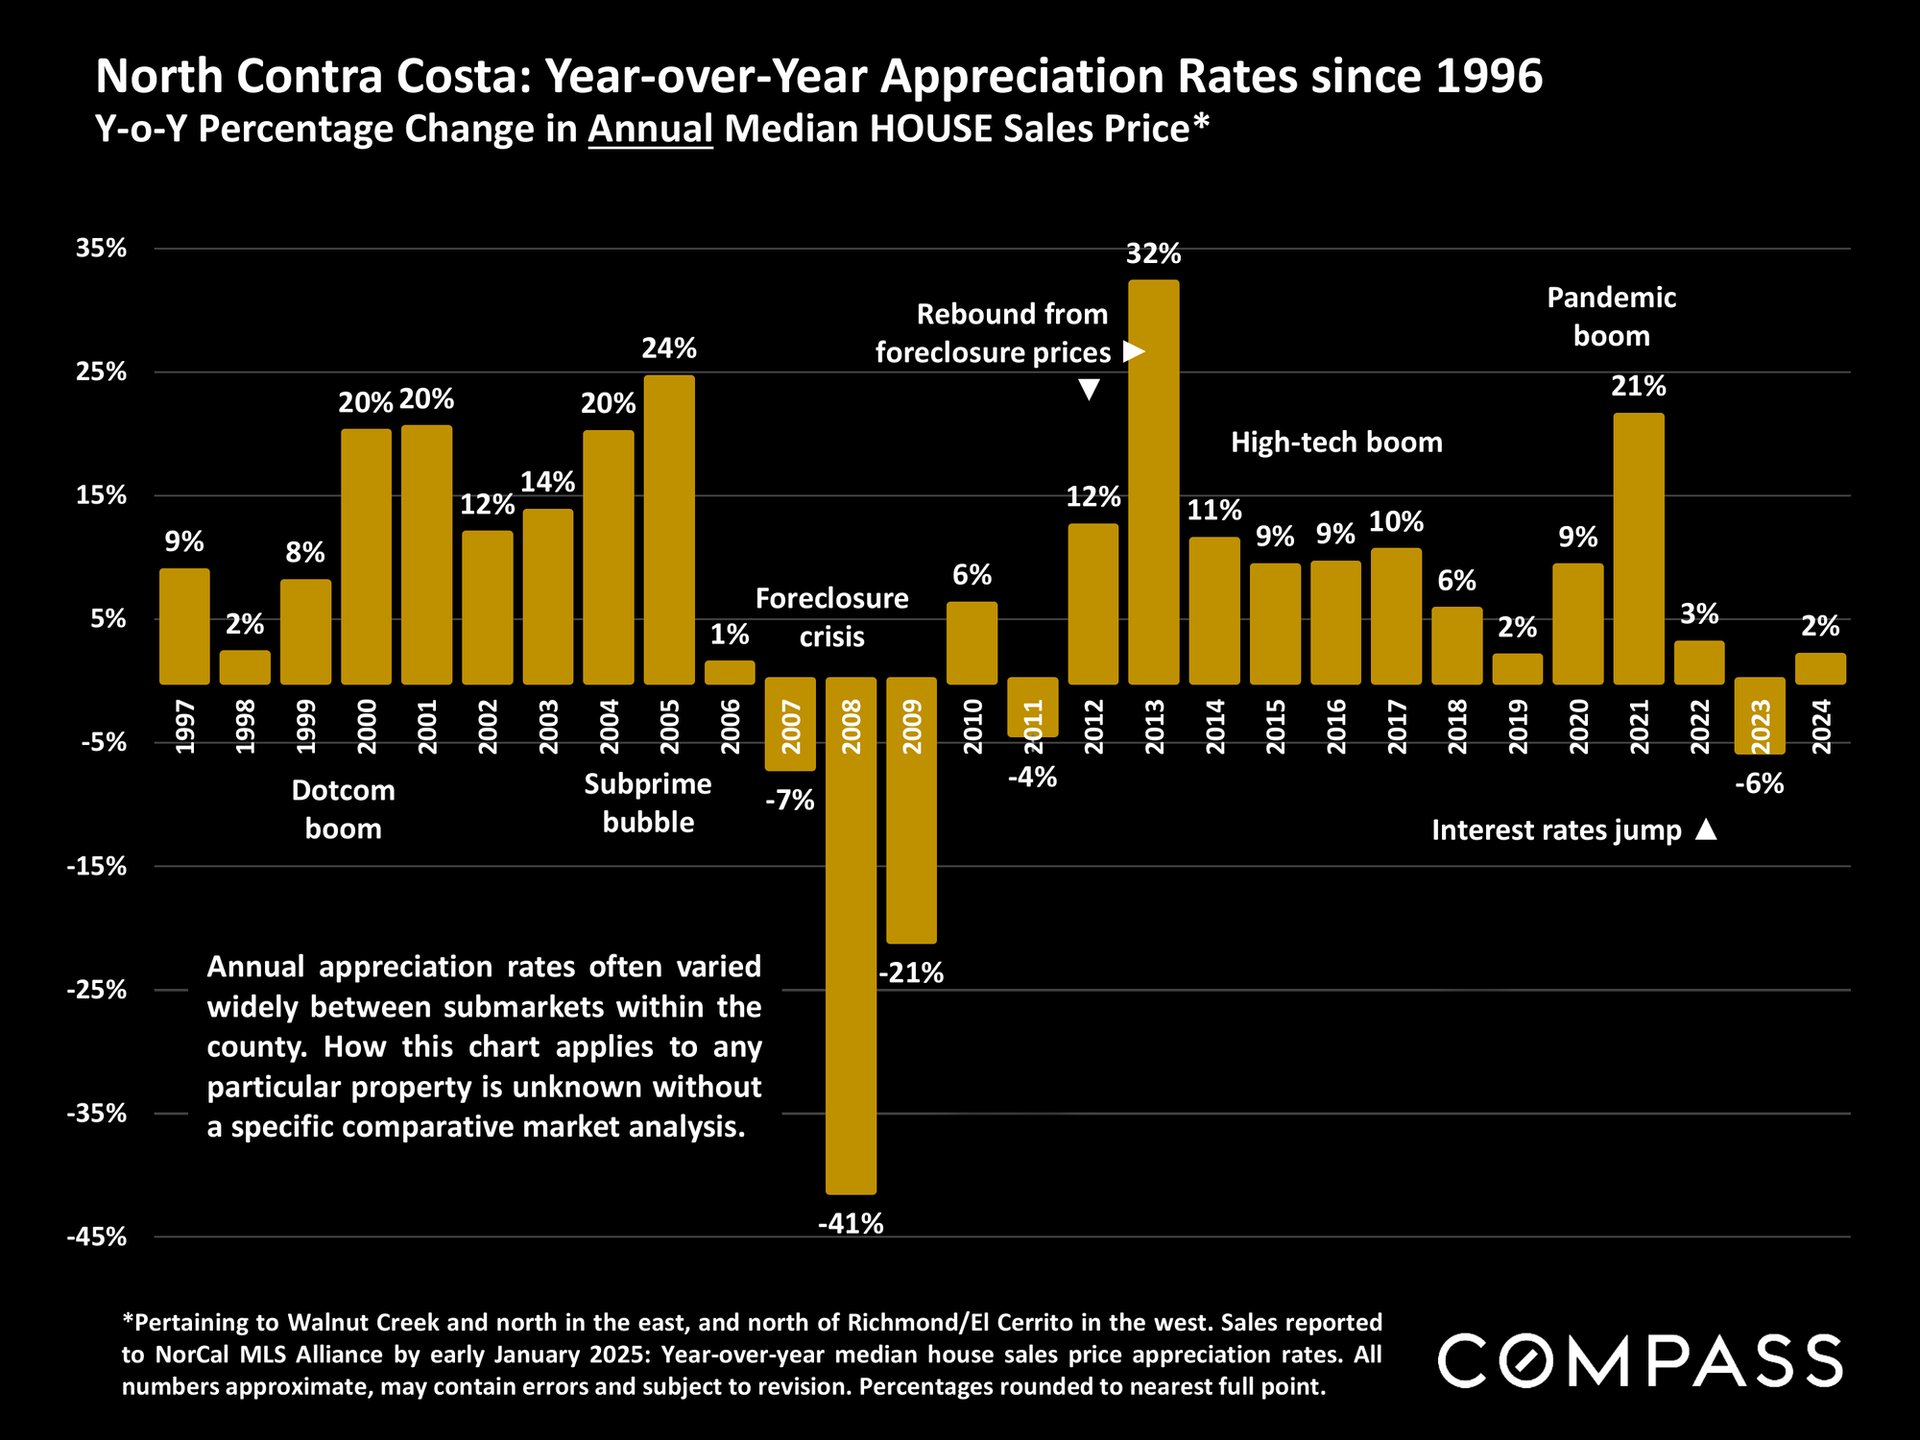
Chart of North Contra Costa annual home-price appreciation rates, with a 41% drop in 2008 and 32% rise in 2013.
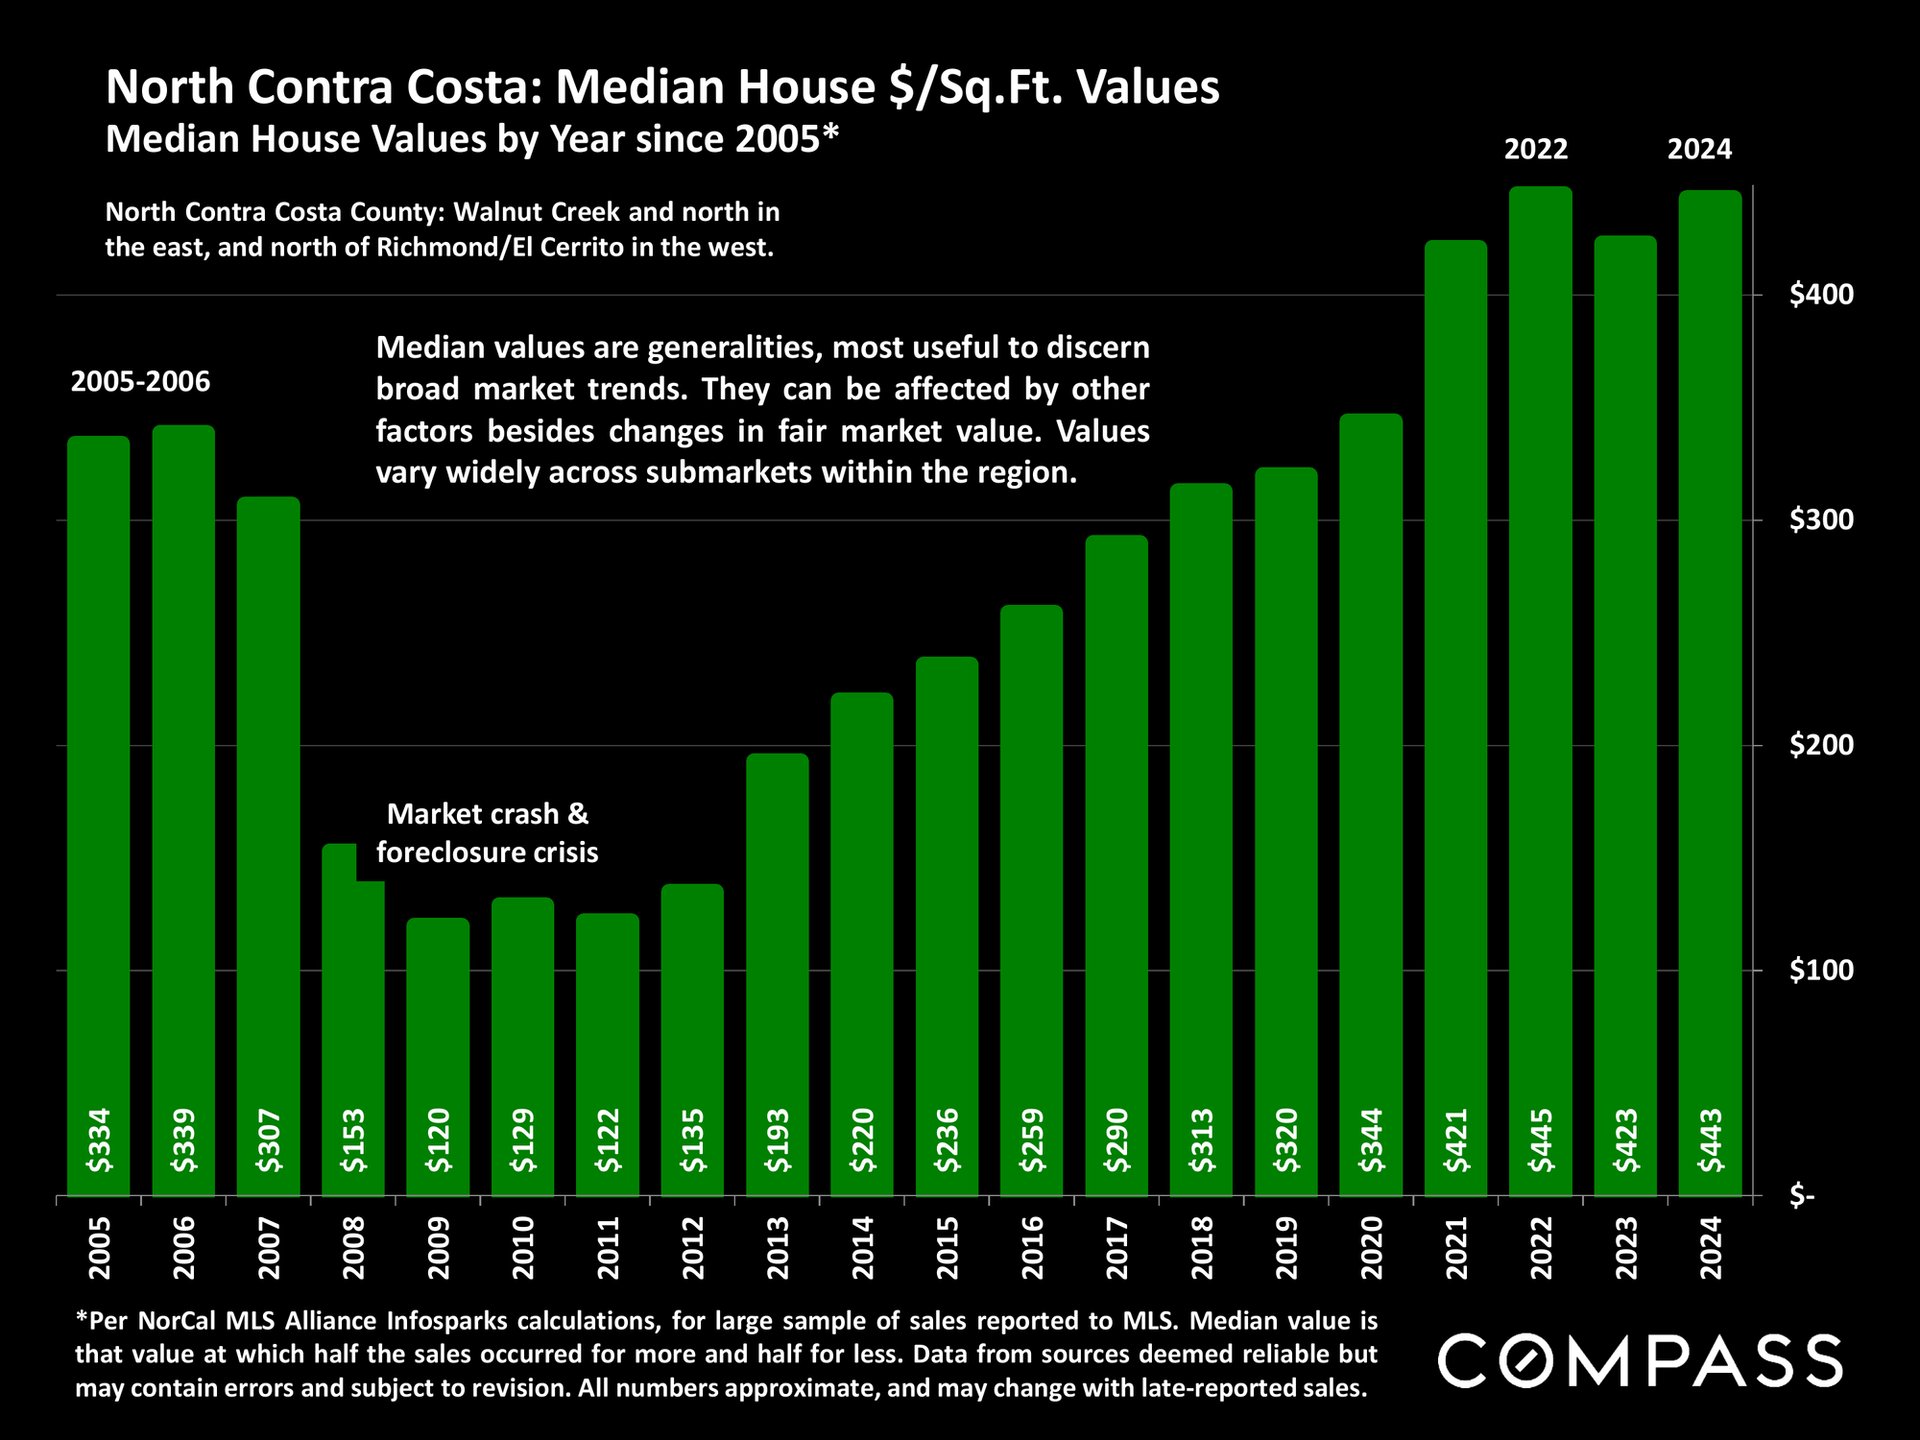
North Contra Costa County median house values per square foot, charted annually from 2005 to 2024.
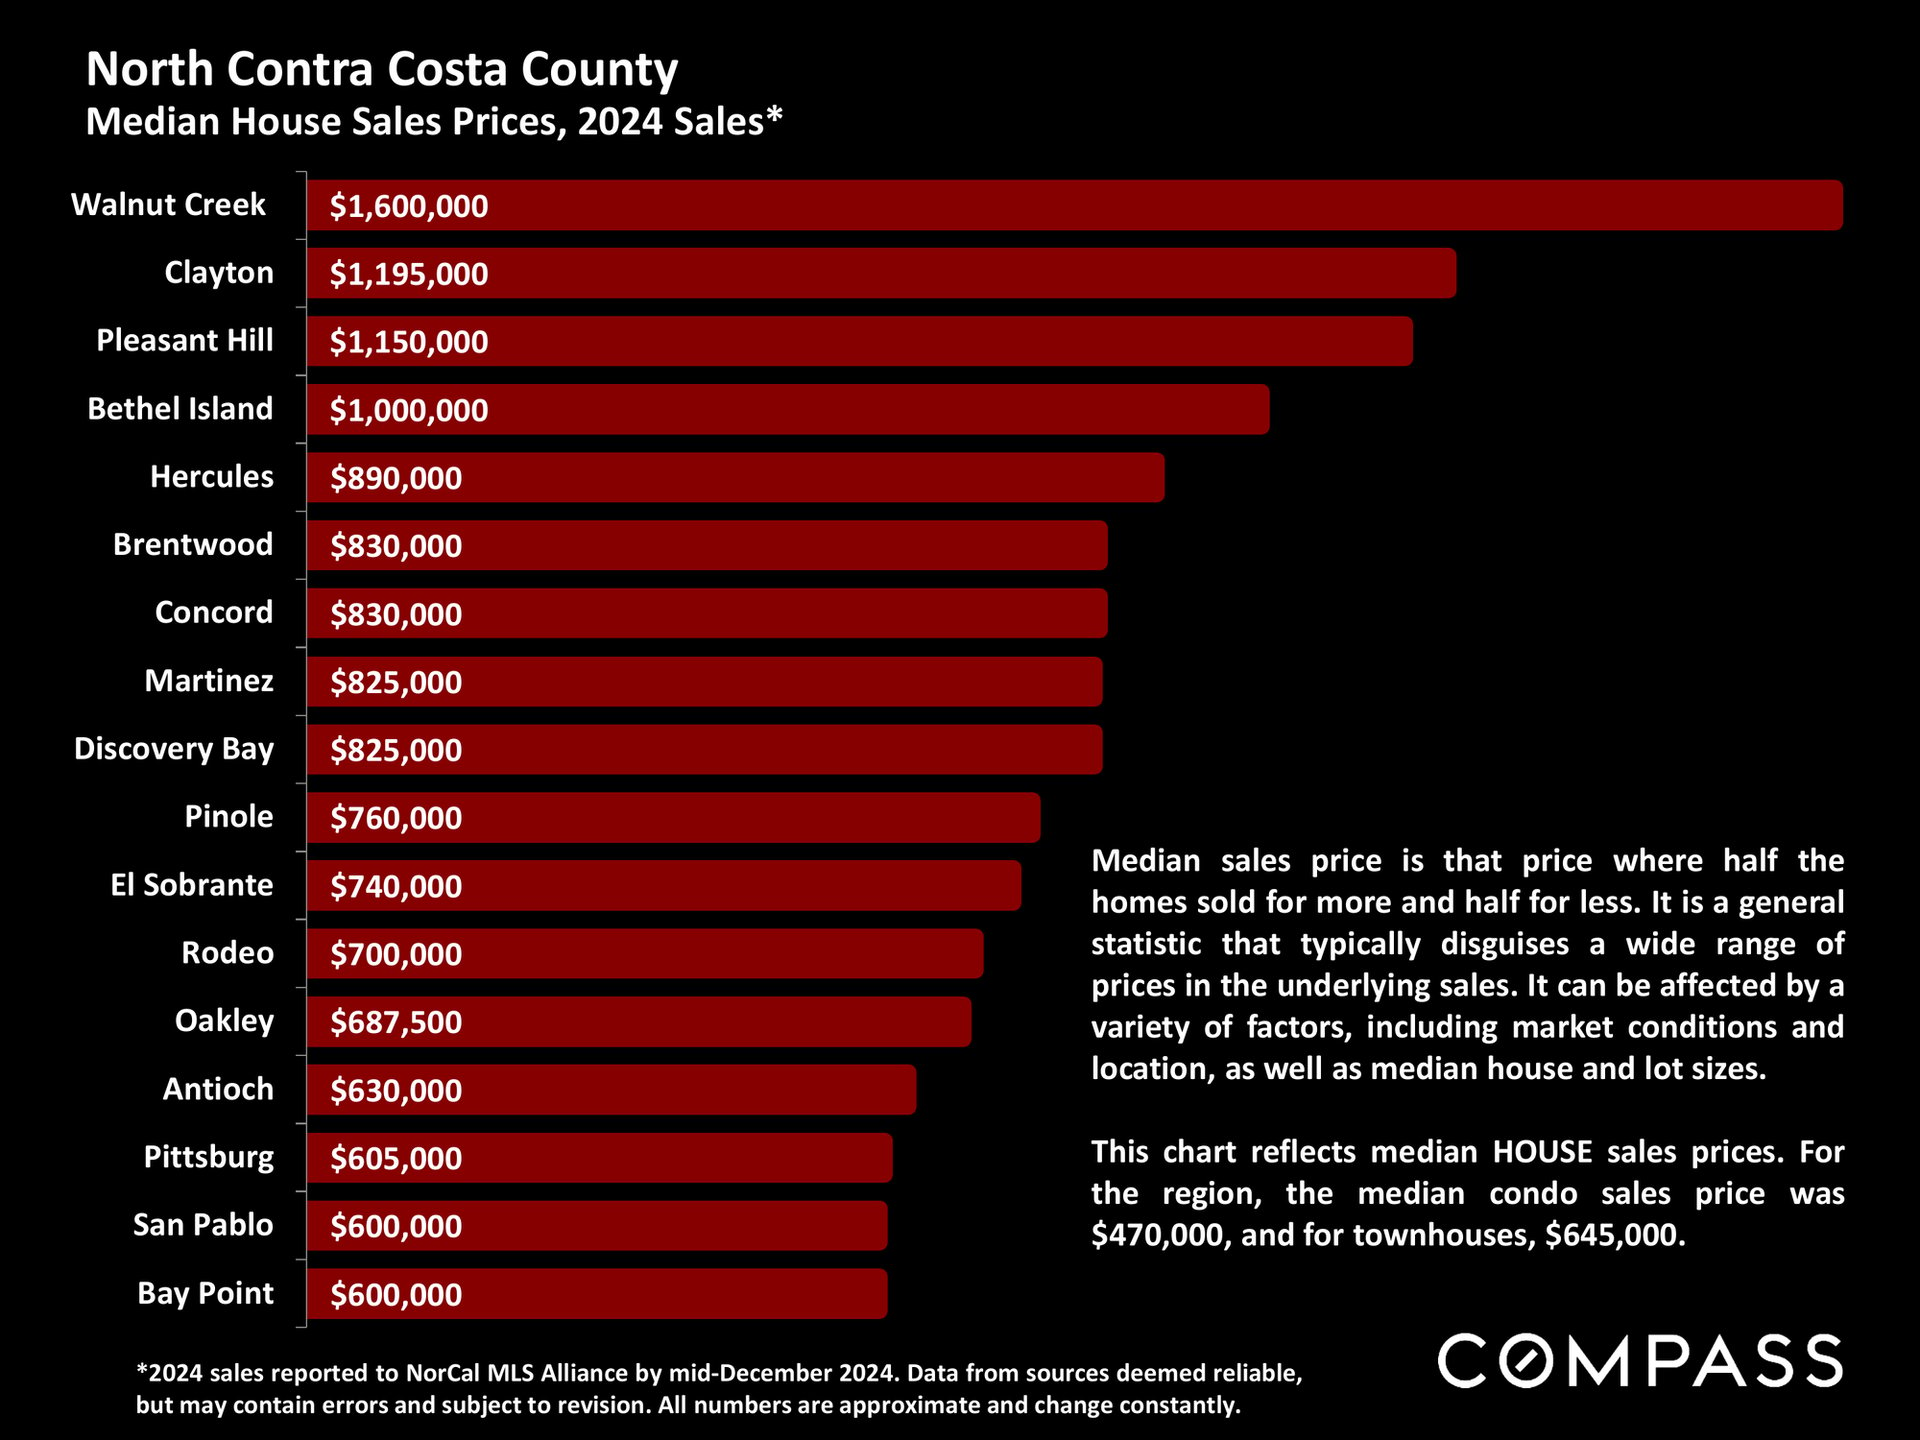
Bar chart of 2024 median house sale prices across North Contra Costa County cities.
North Contra Costa County real estate report graphic with a panoramic valley view and an invitation to view updated market data.
Bar chart of Contra Costa County new listings, 2007–2024, showing a 16% rise in 2024 from 2023.
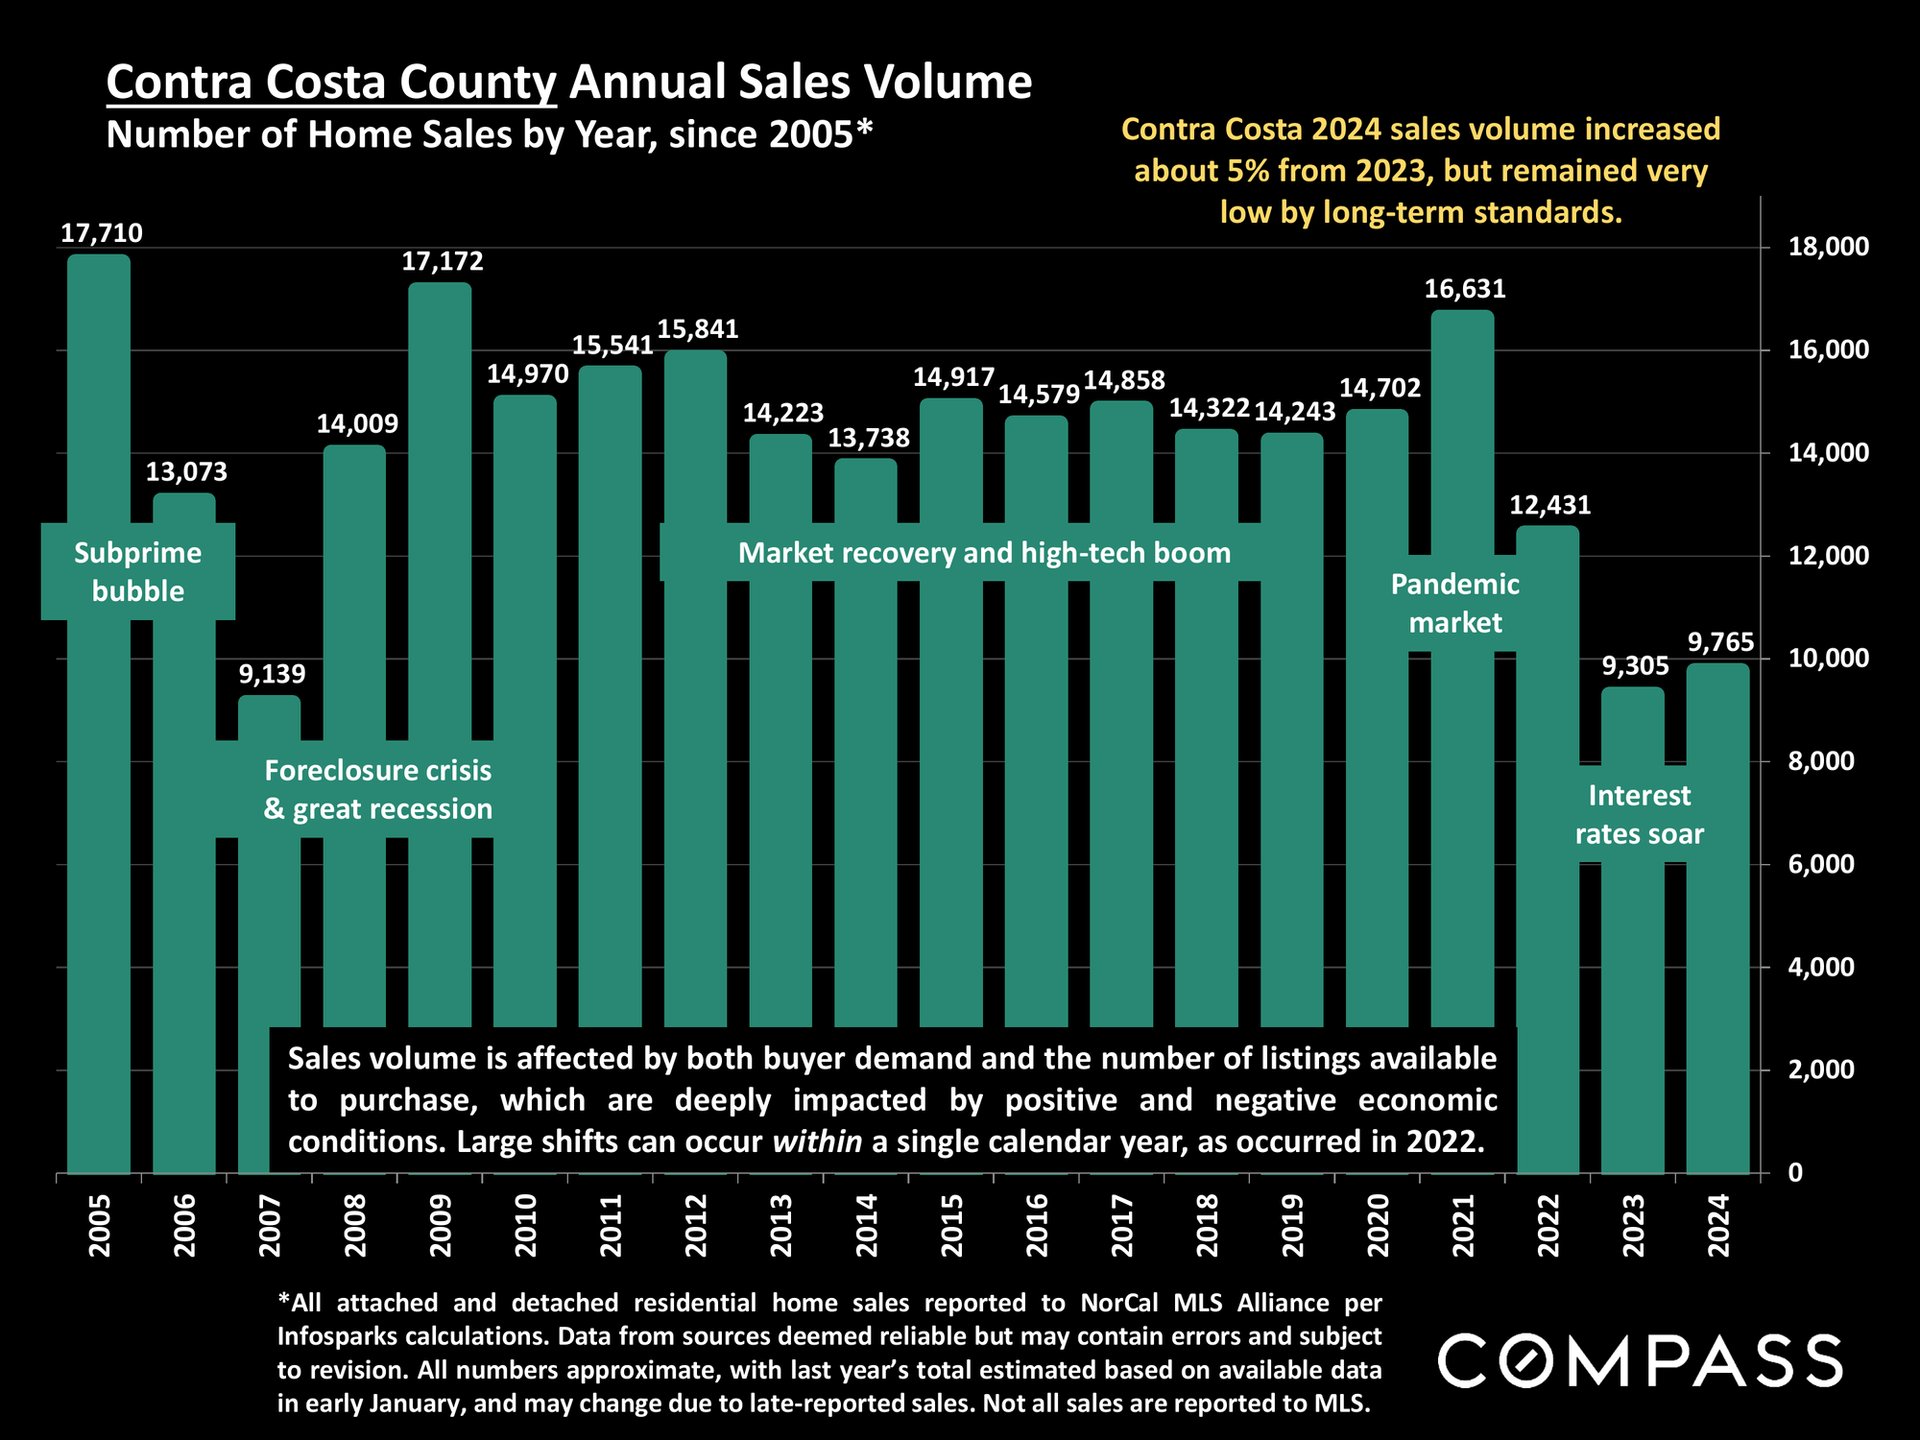
Bar chart of Contra Costa County home sales from 2005 to 2024, with 2024 sales at 9,765.
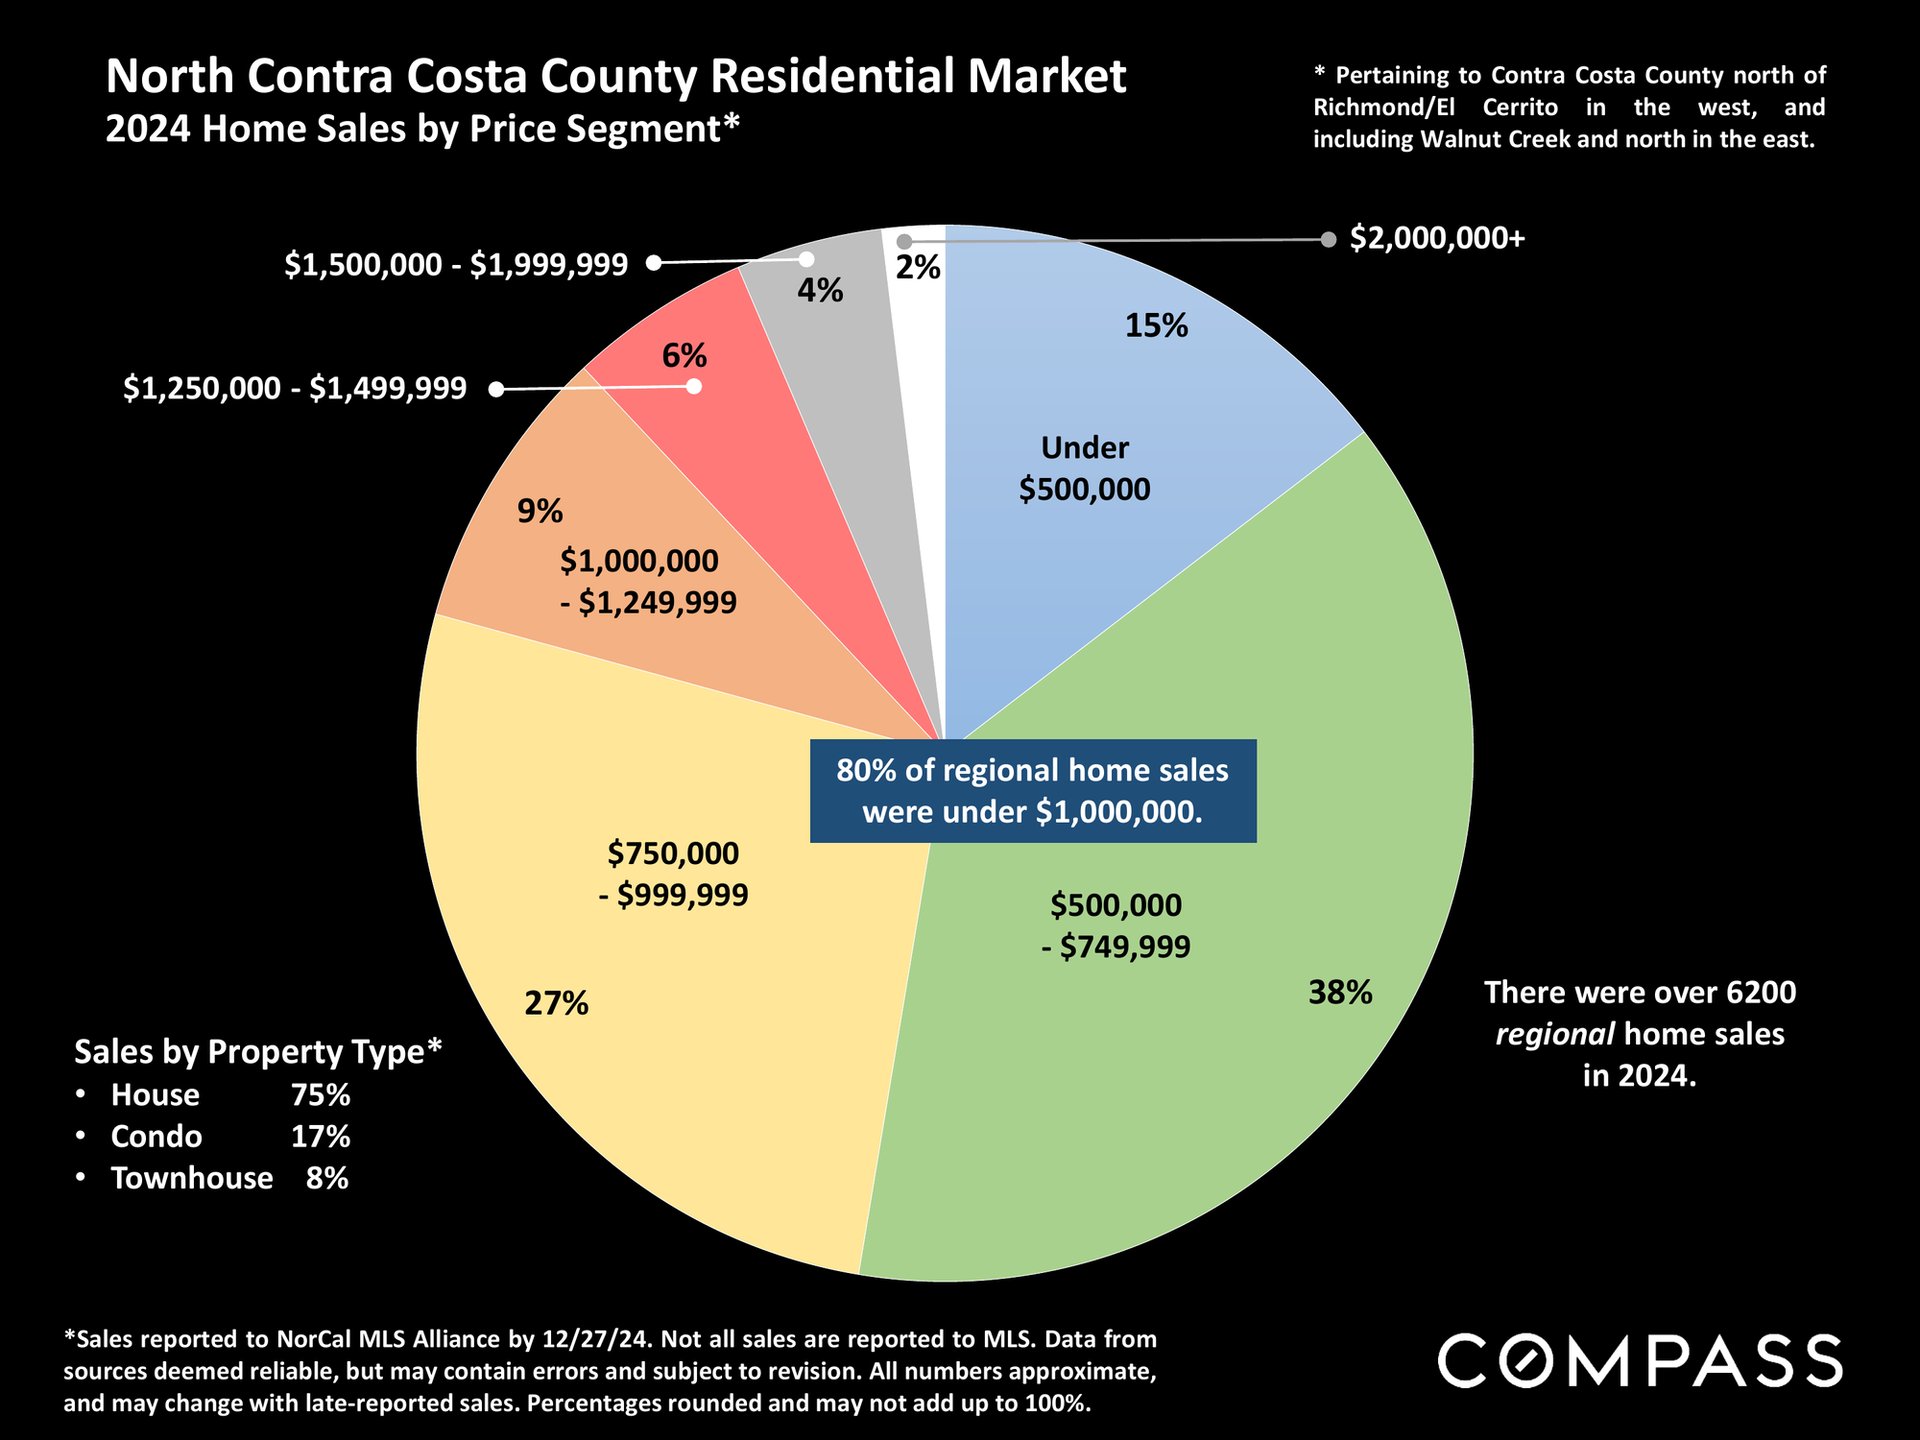
2024 North Contra Costa County home sales pie chart by price segment, with most sales between $500,000 and $749,999.
Bar chart of North Contra Costa County days on market, 2005–2024, annotated with major real estate market periods.
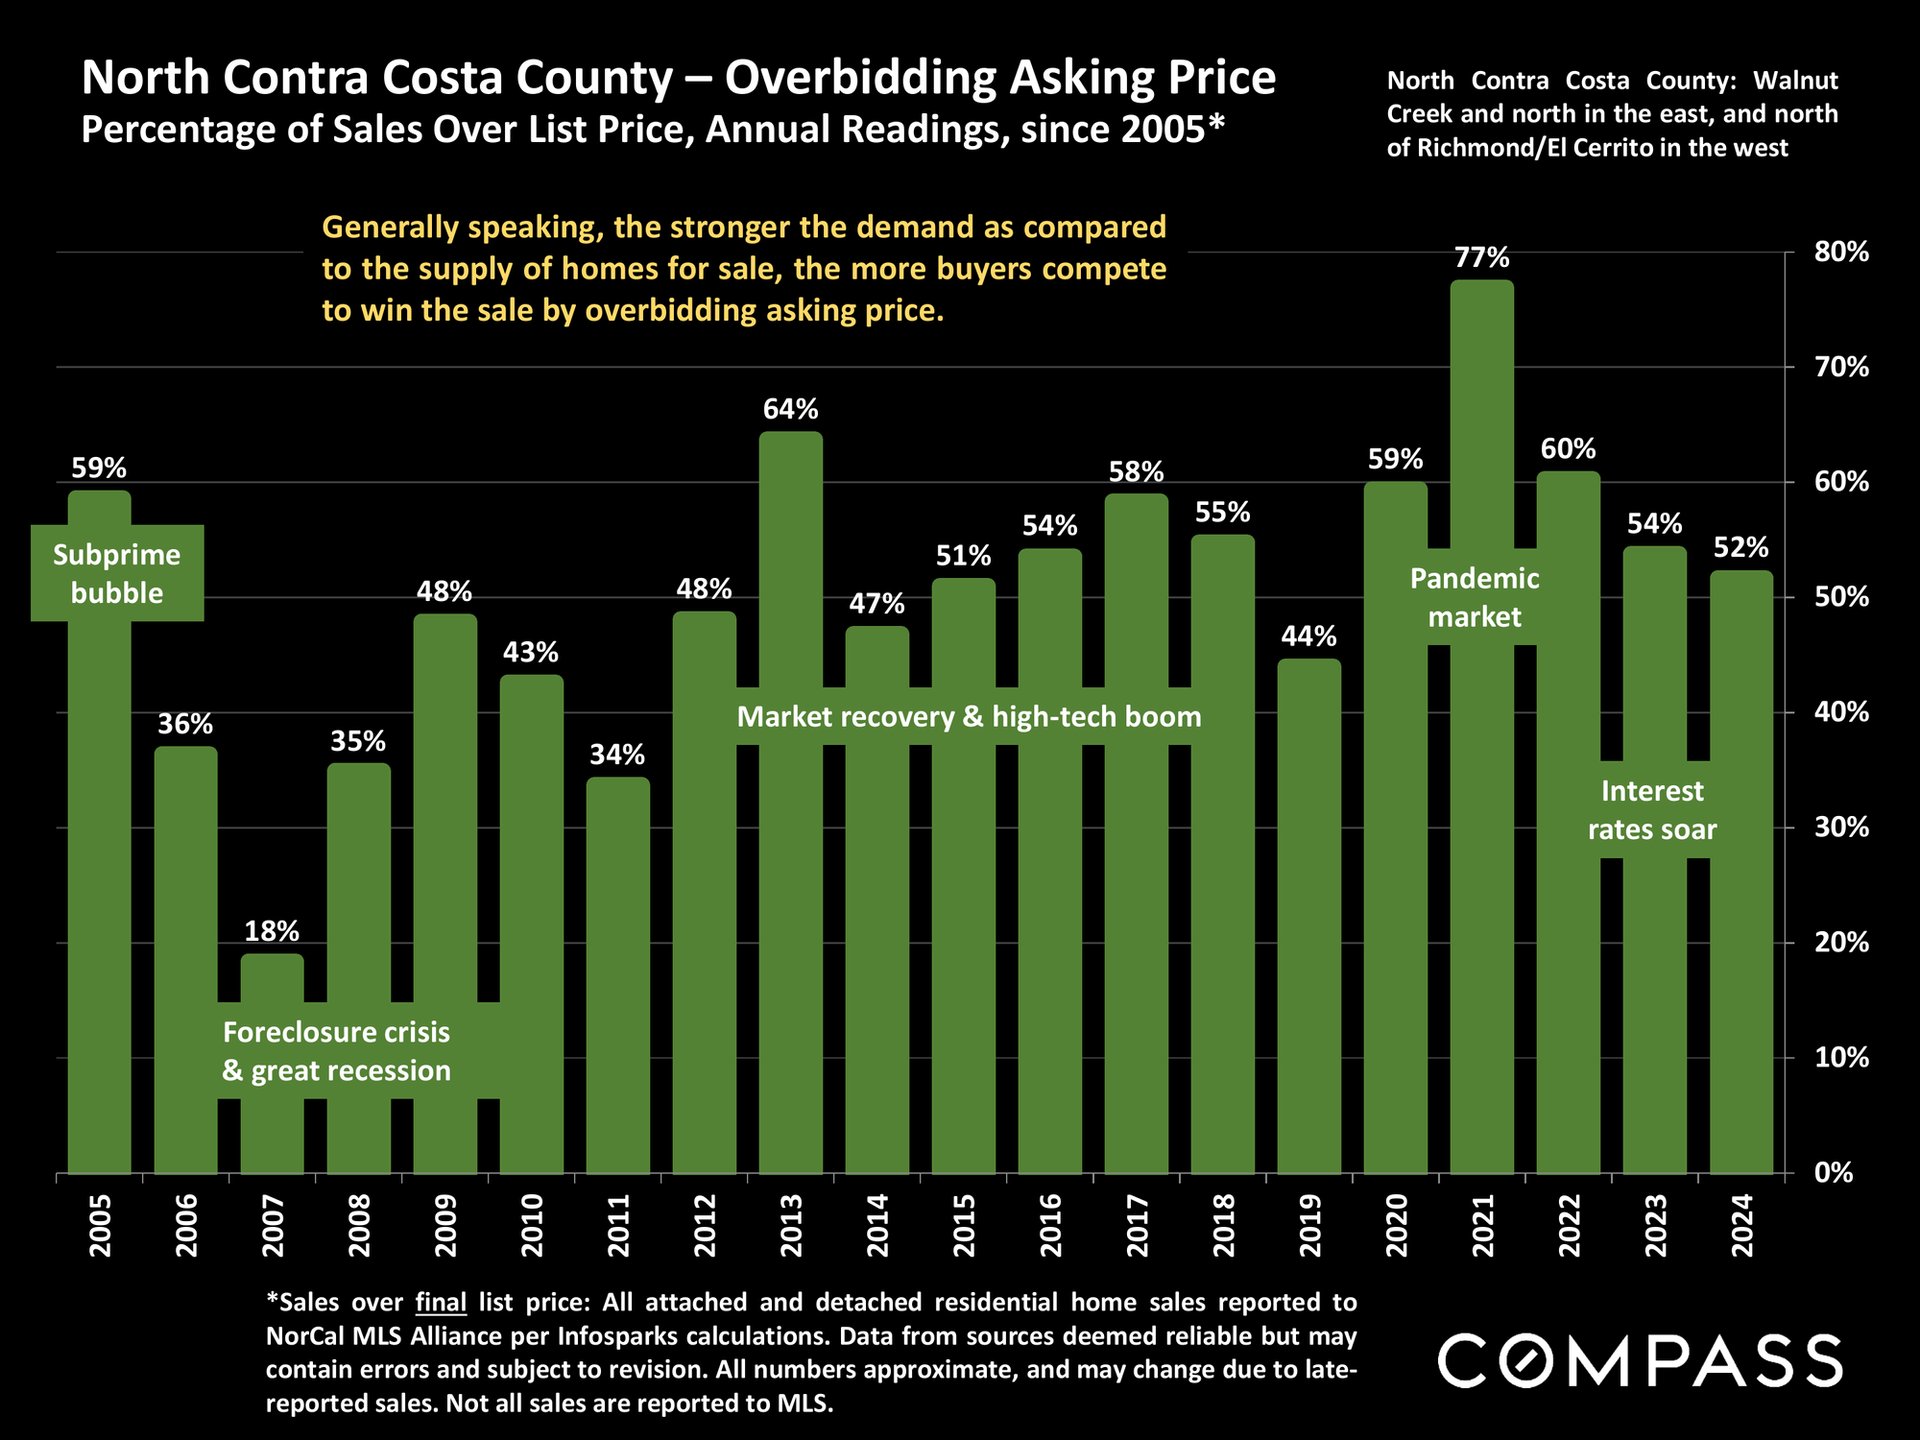
Chart of North Contra Costa County home sales over list price, 2005–2024, with market-era annotations.
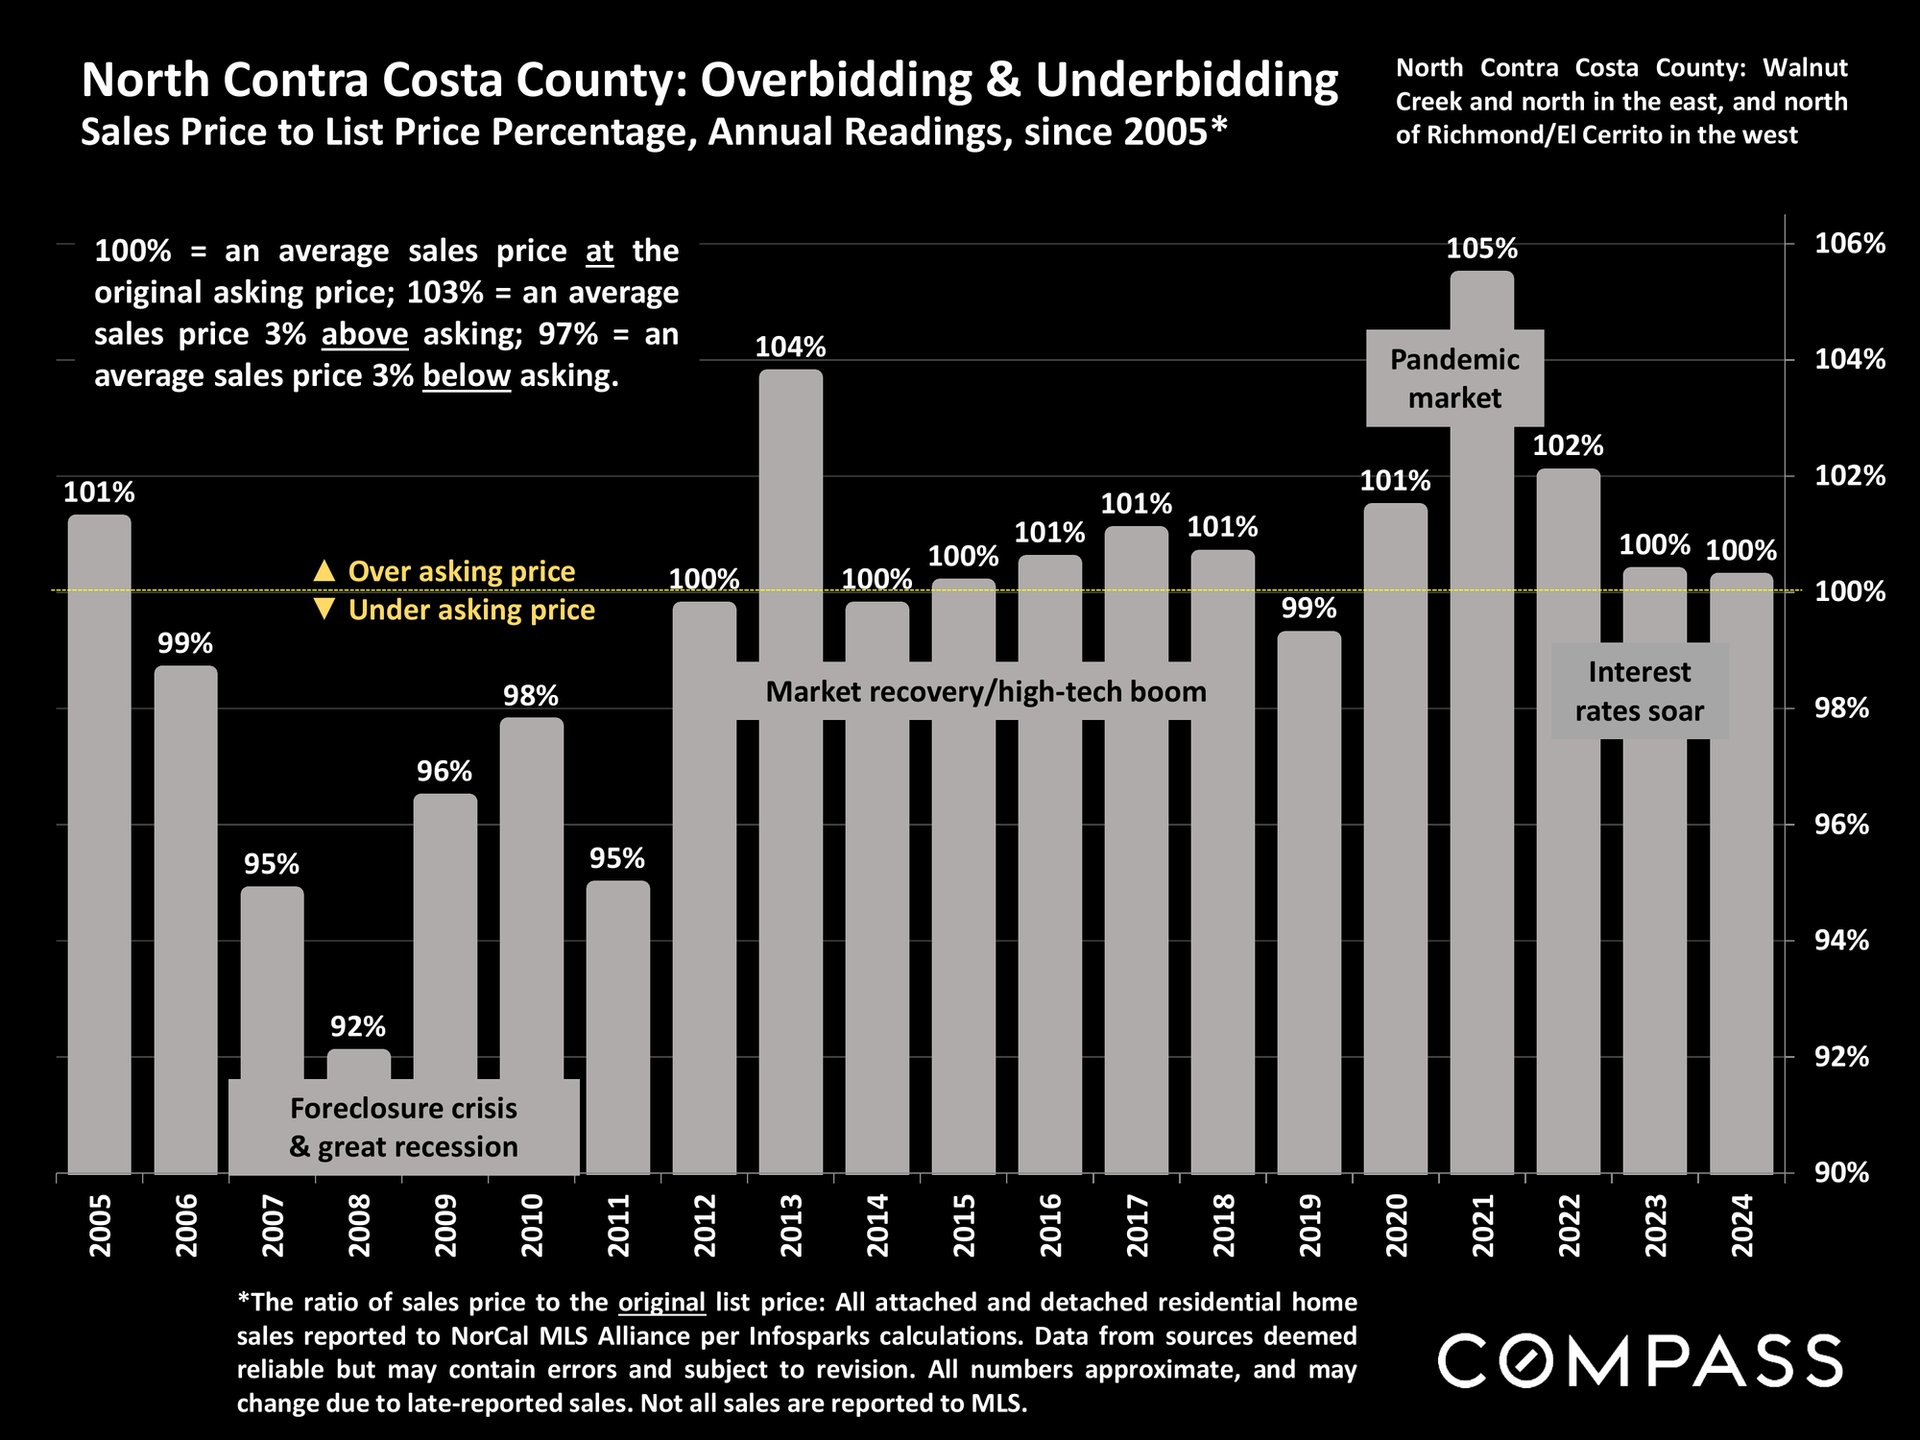
Chart of North Contra Costa County sale-to-list percentages, 2005–2024, peaking at 105% in 2021.
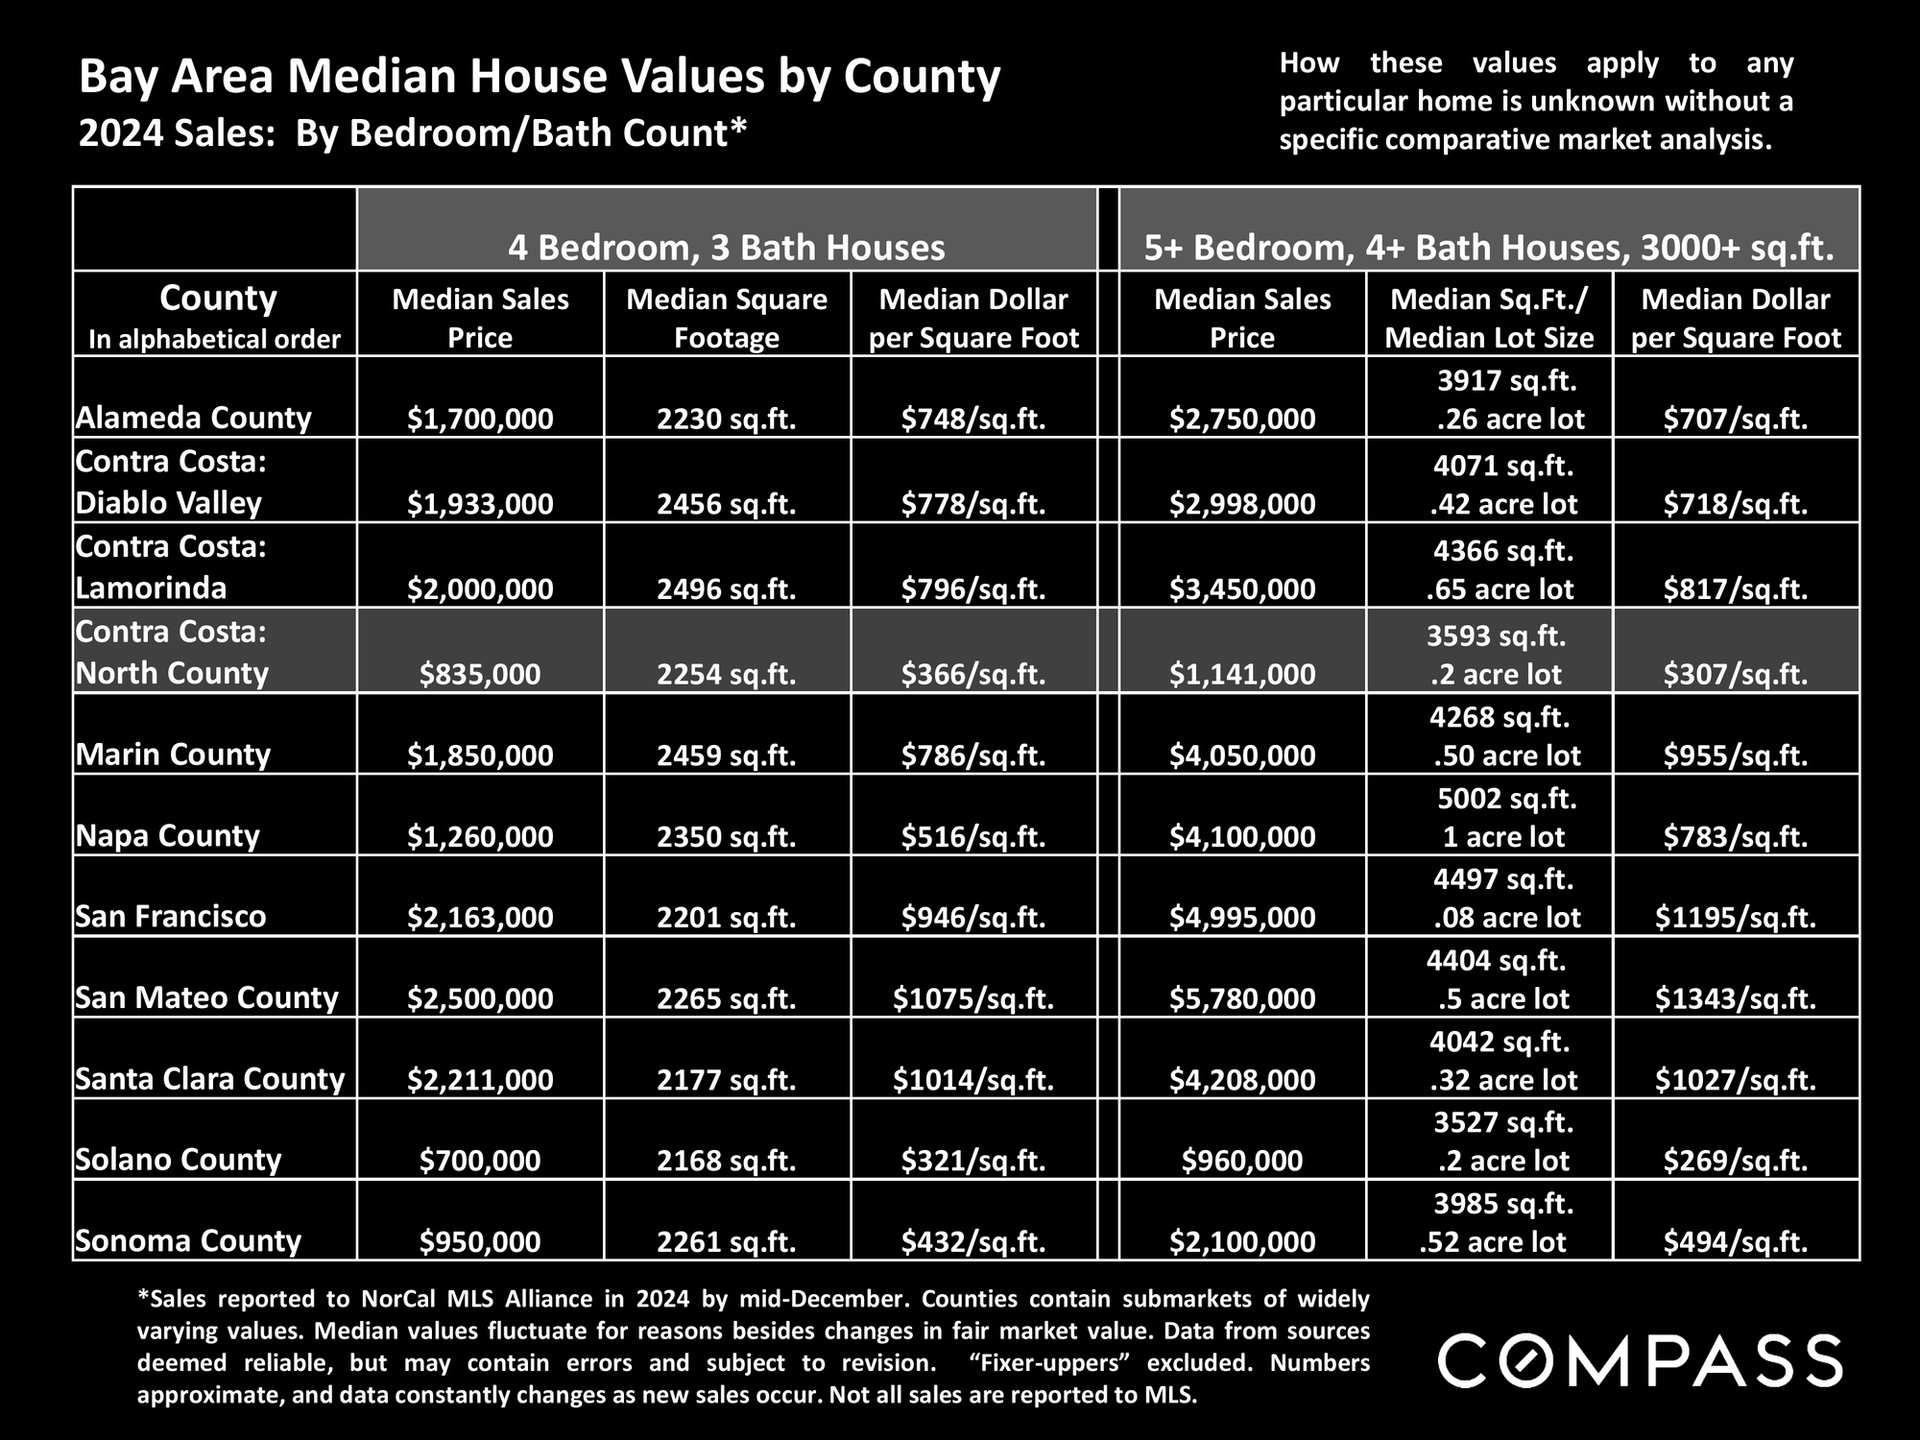
2024 Bay Area median home values by county, comparing 4-bedroom homes and larger homes with four or more baths.
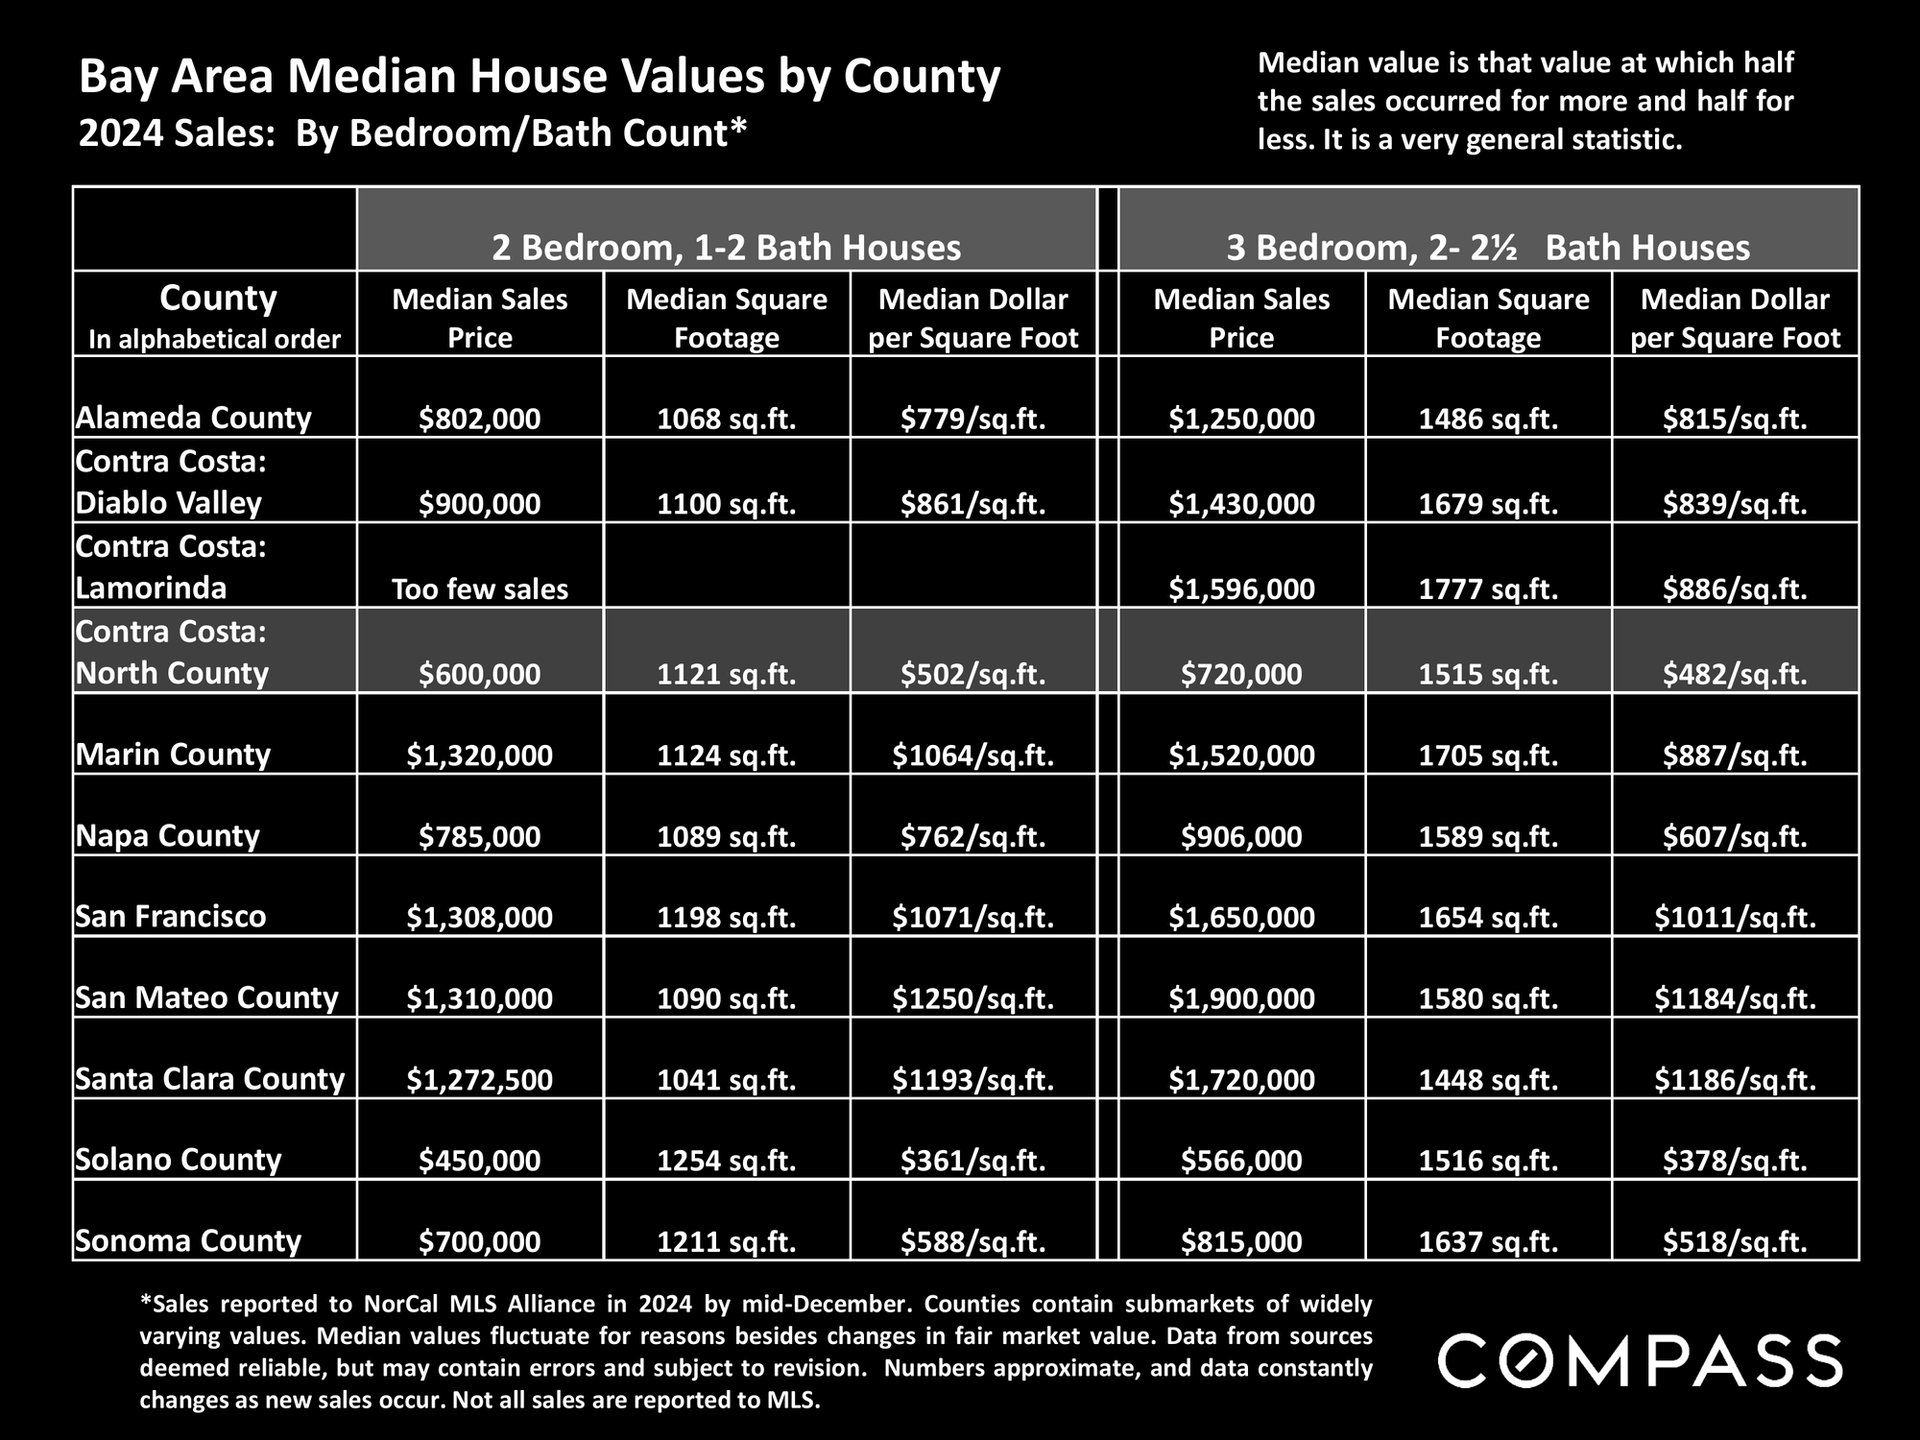
Chart comparing 2024 median home prices, square footage, and price per square foot across Bay Area counties by bedroom and bath count.
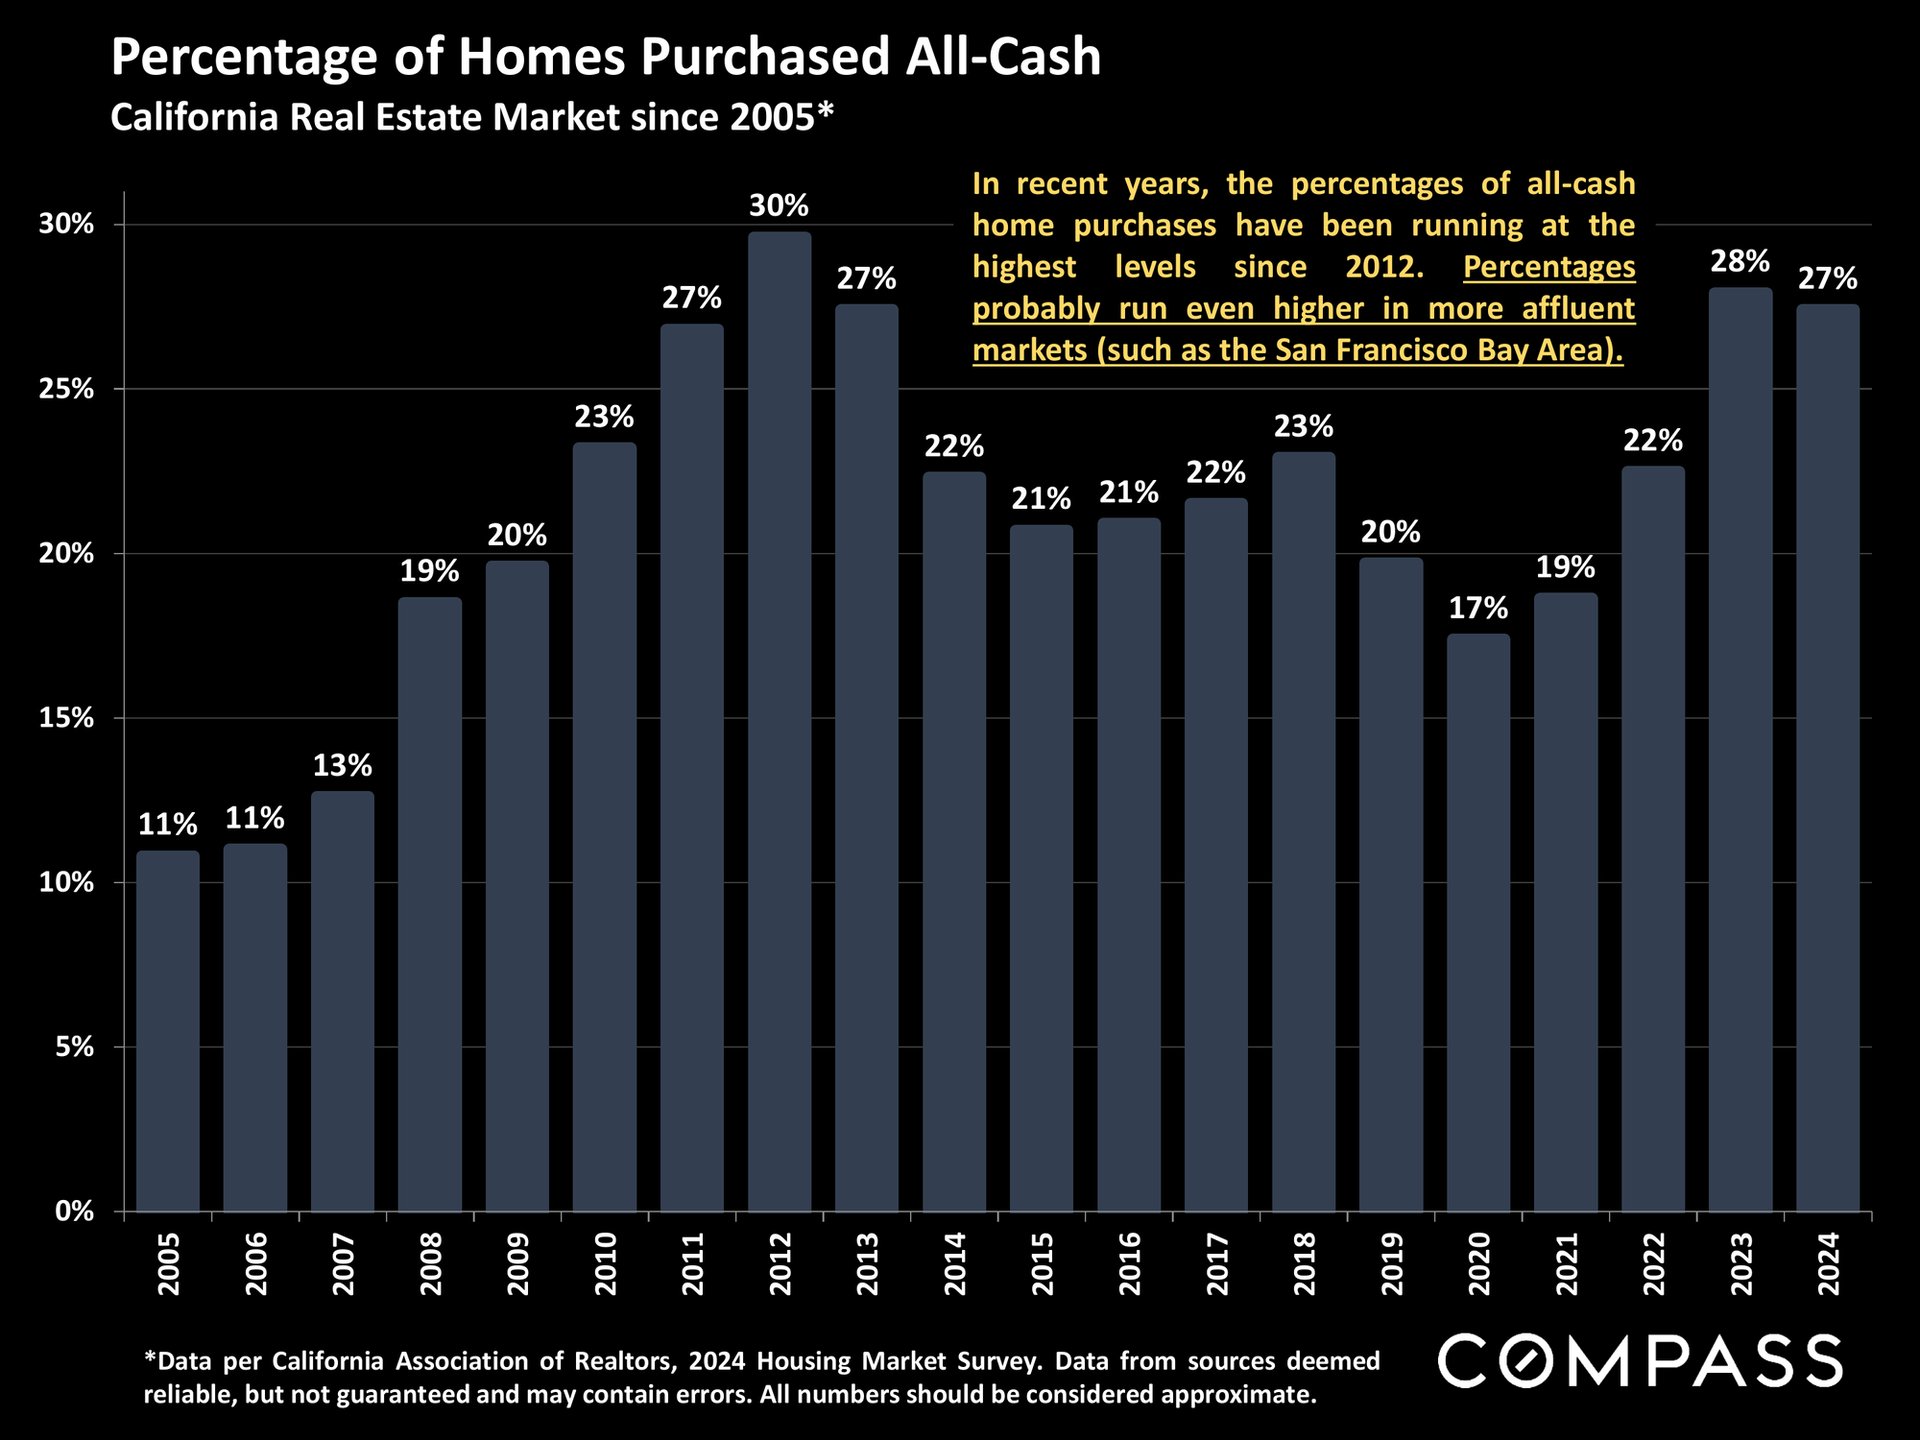
California all-cash home purchases peaked at 30% in 2012 and reached 28% in 2023.
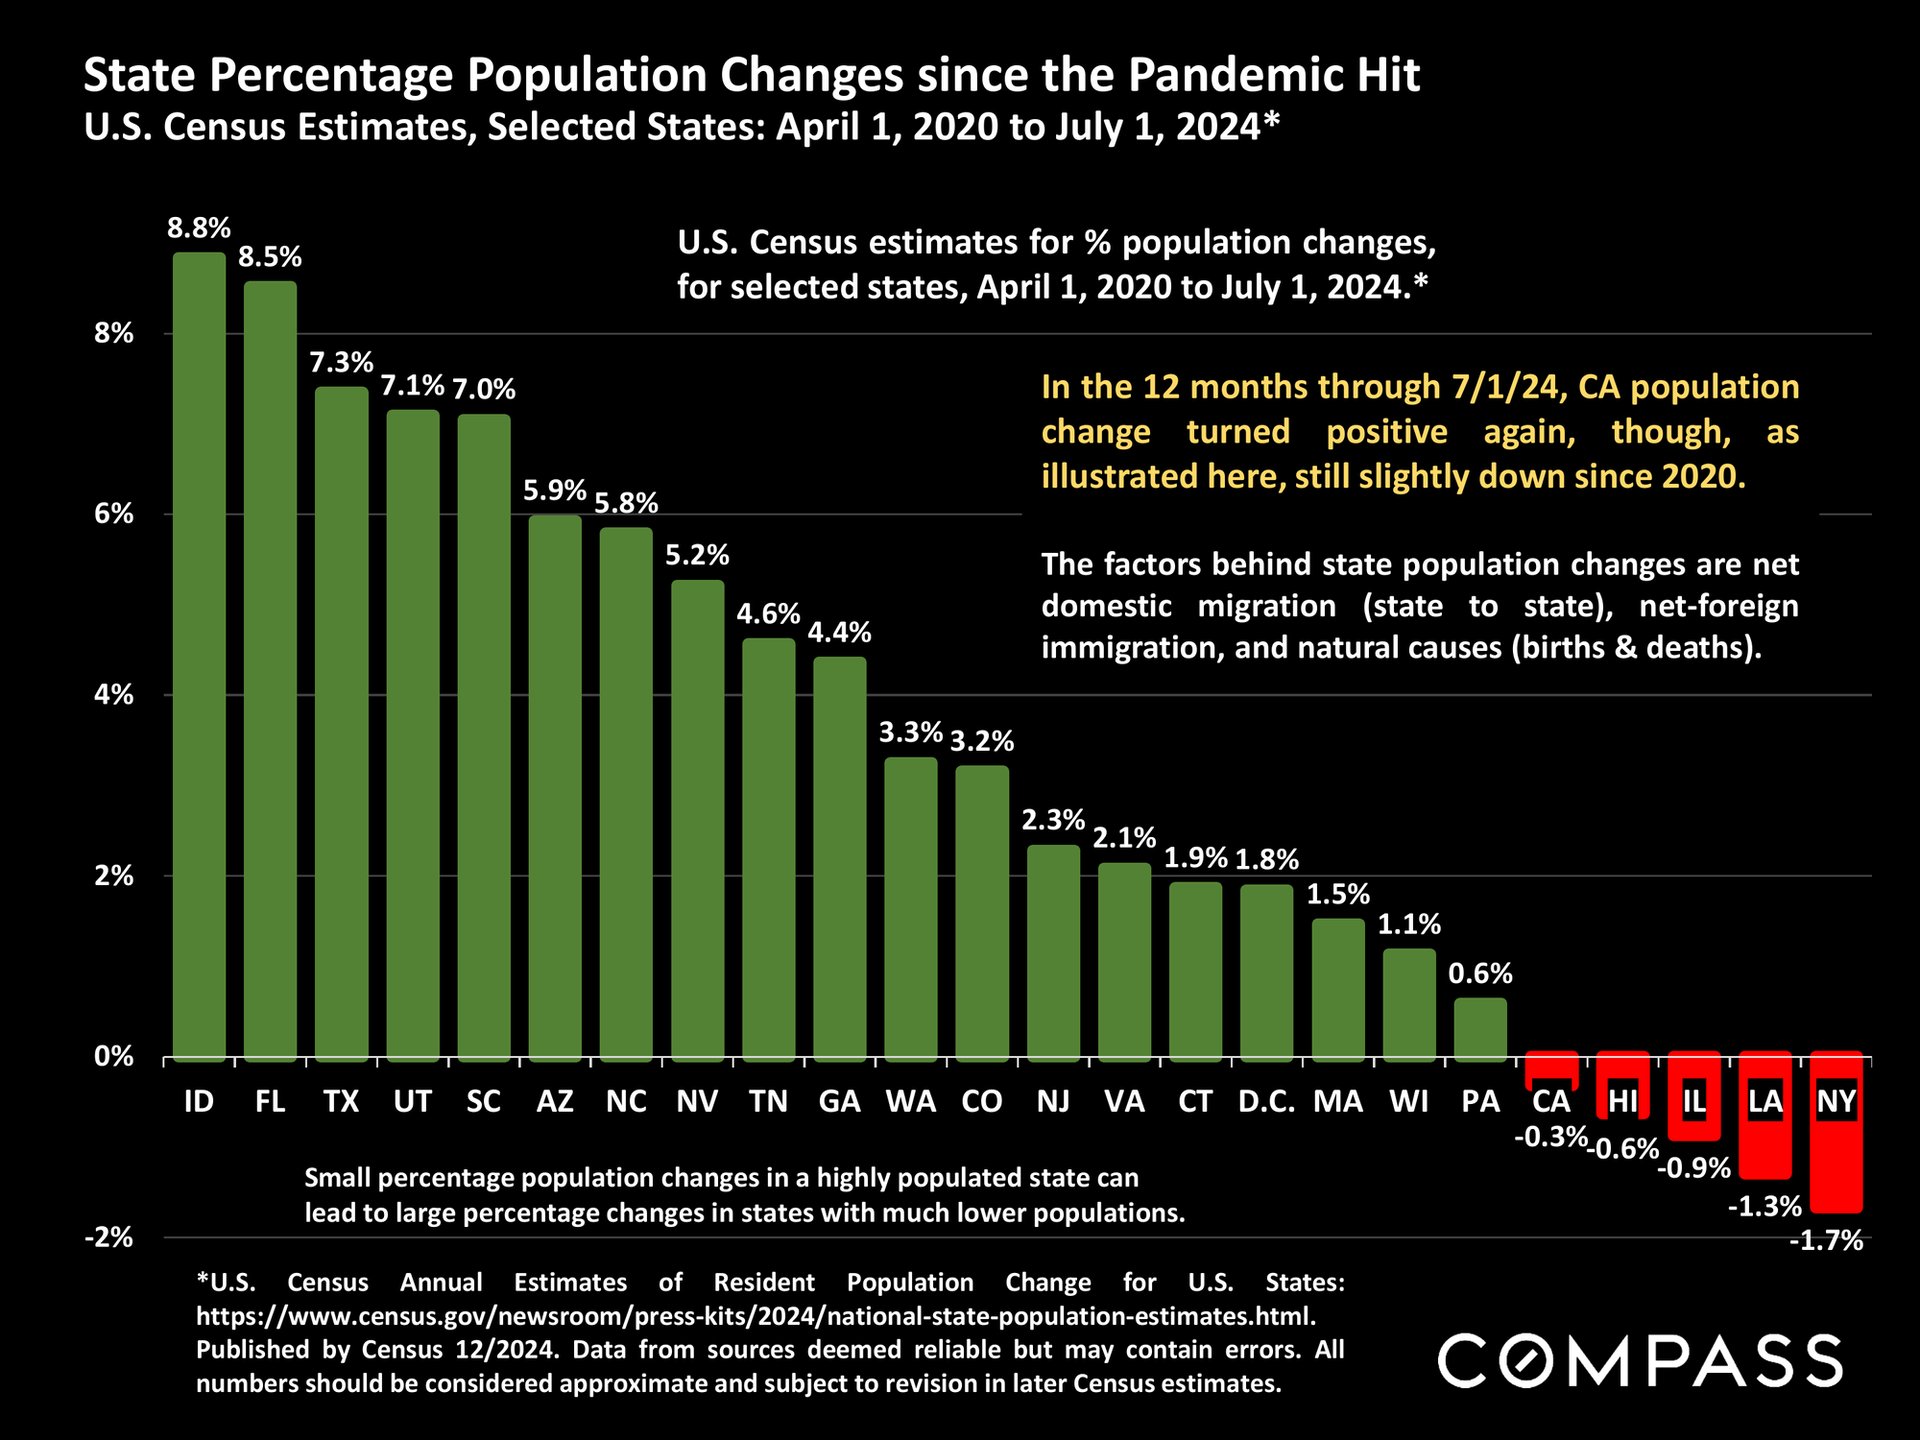
Bar chart of state population changes since 2020, with Idaho highest and New York showing the largest decline.
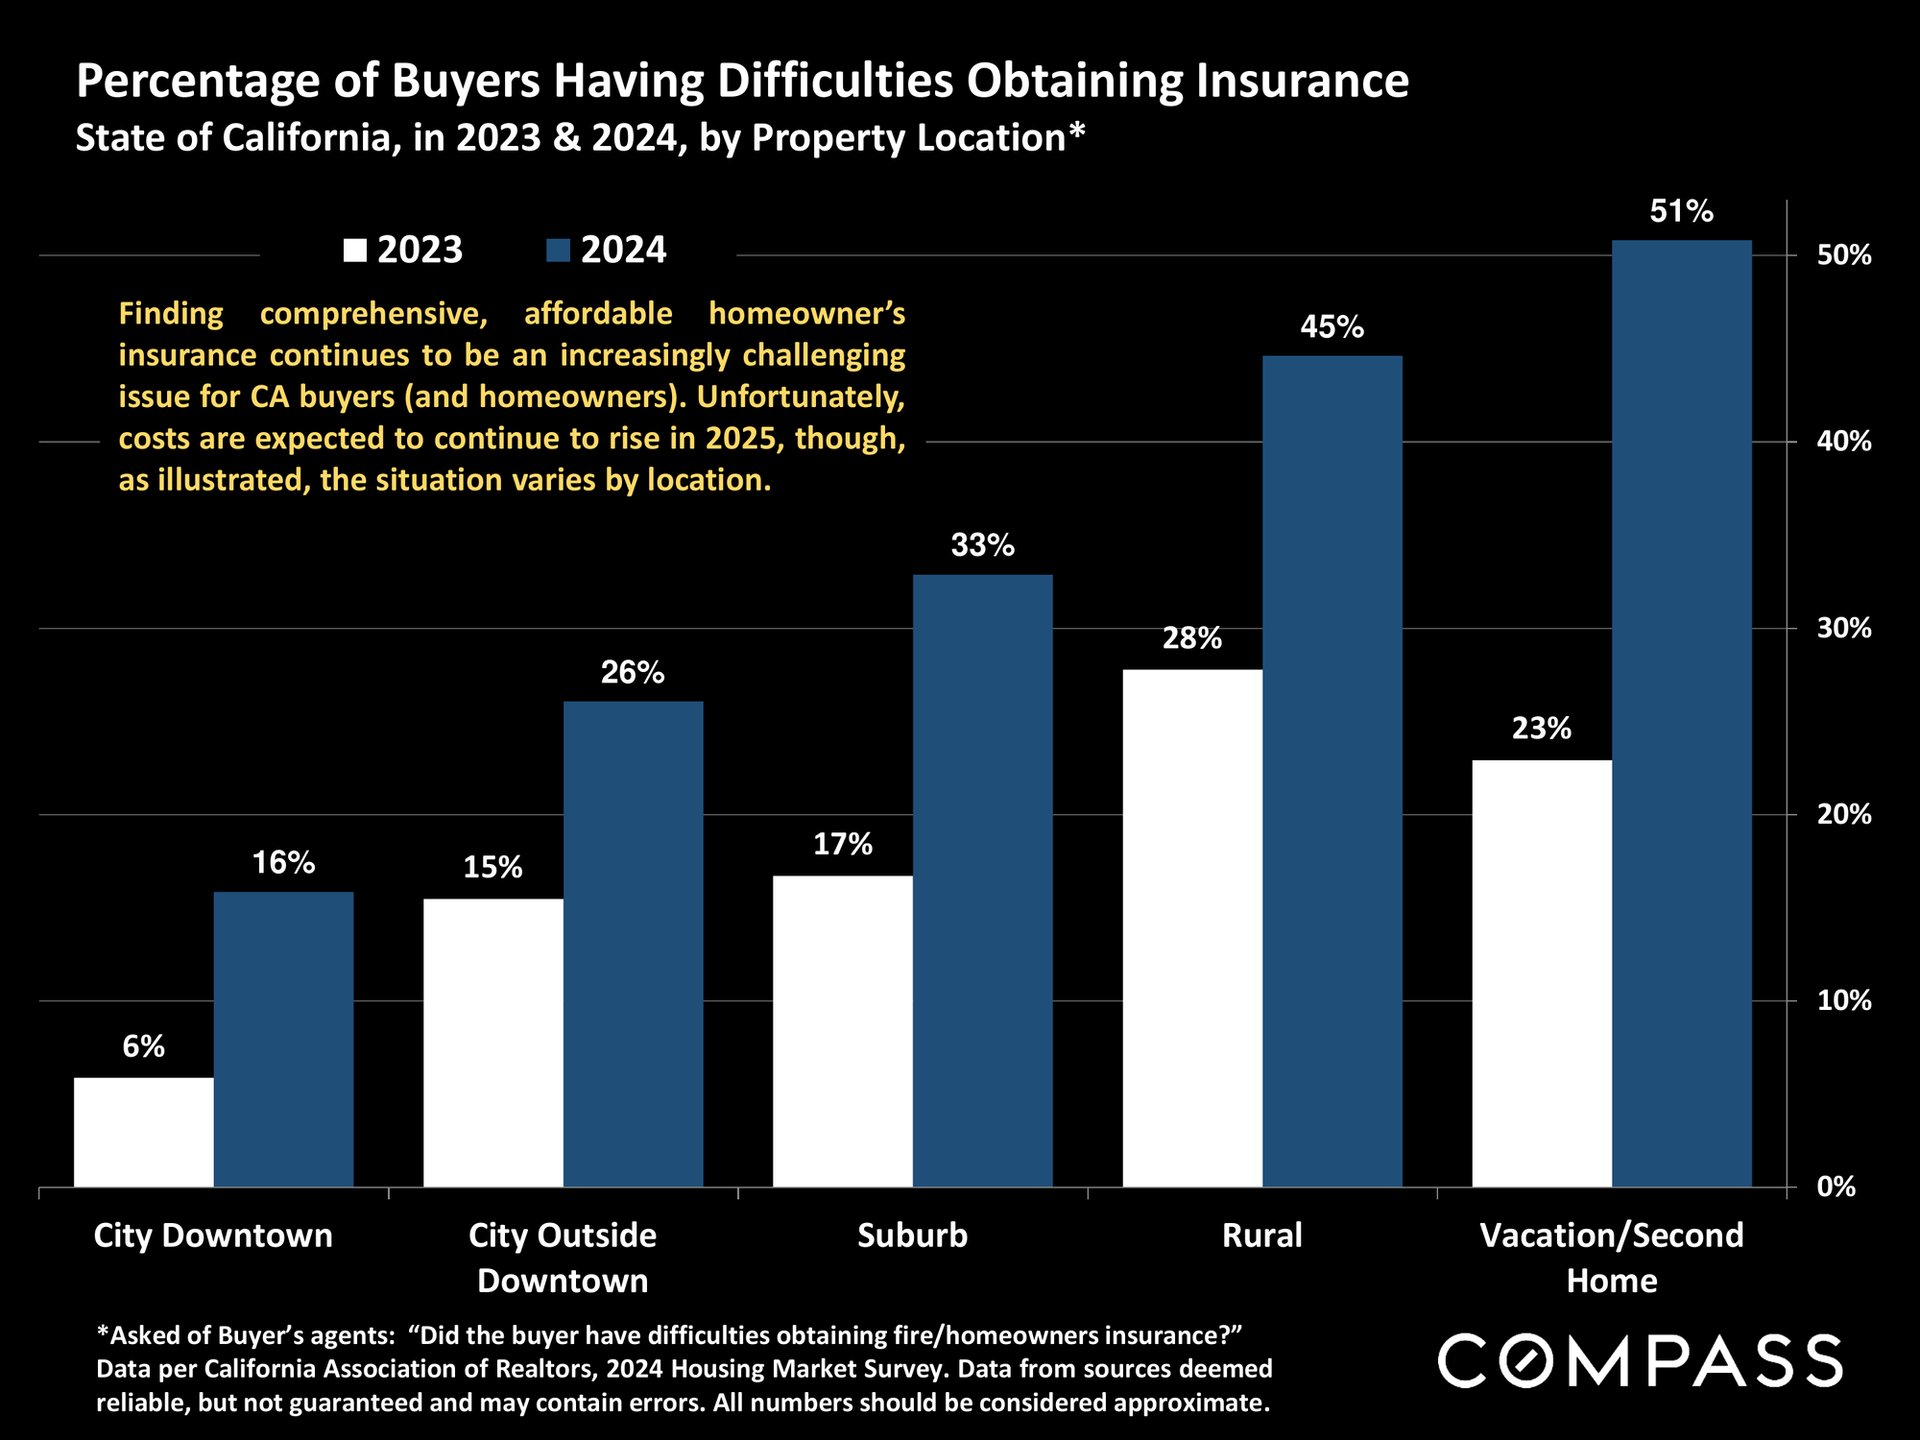
Chart comparing California buyers’ insurance difficulties by property location in 2023 and 2024.
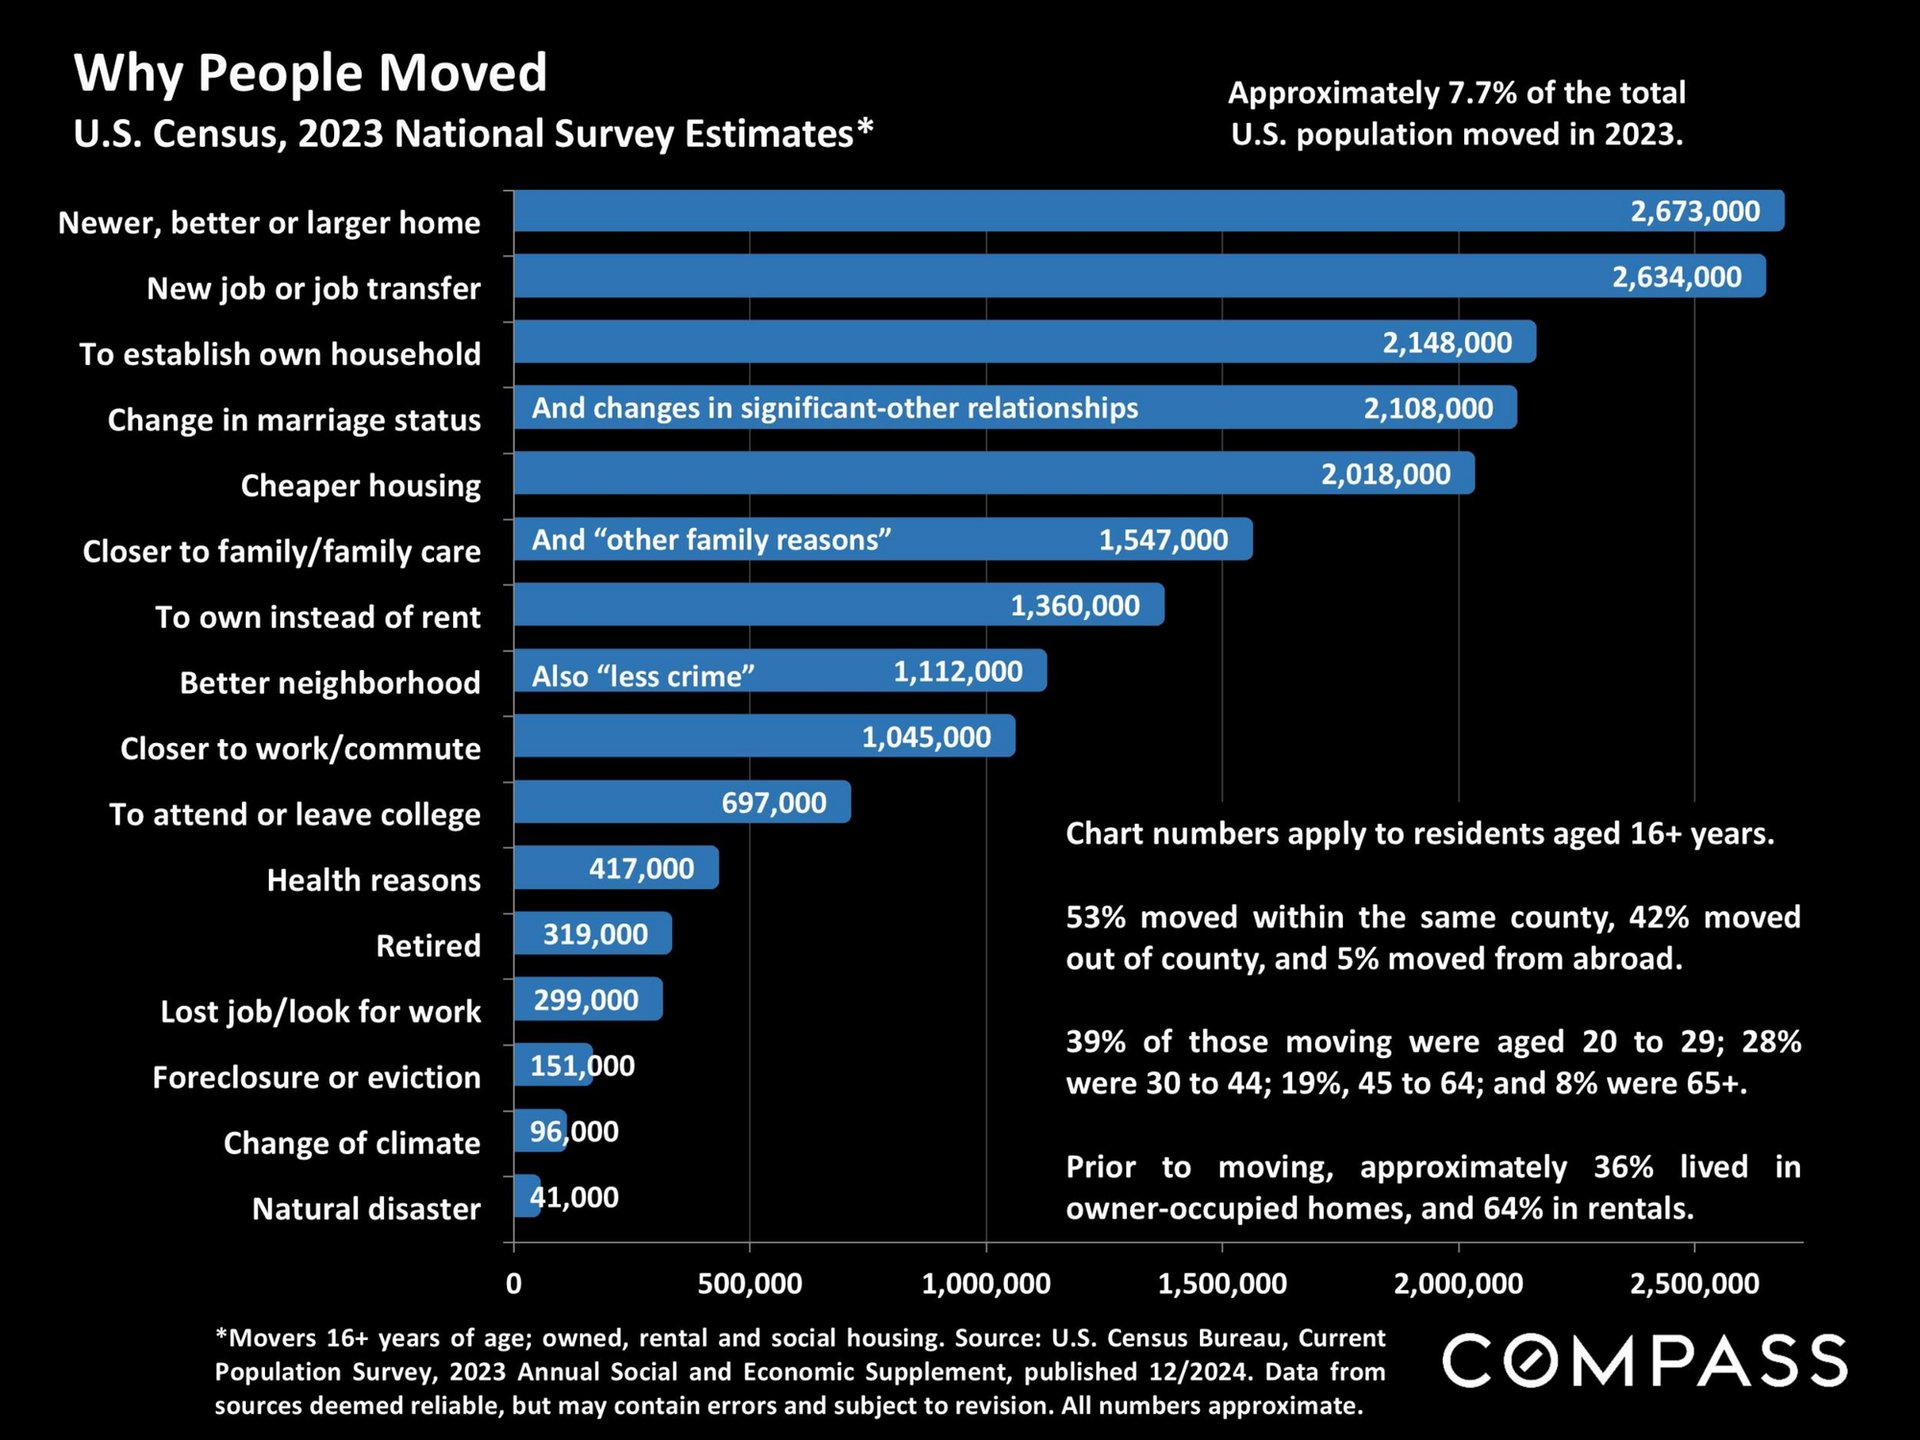
Infographic of 2023 U.S. moving reasons, led by seeking a better home and changing jobs.
Text panel explaining real estate statistics and metrics, followed by photo-use terms and a Compass disclaimer.
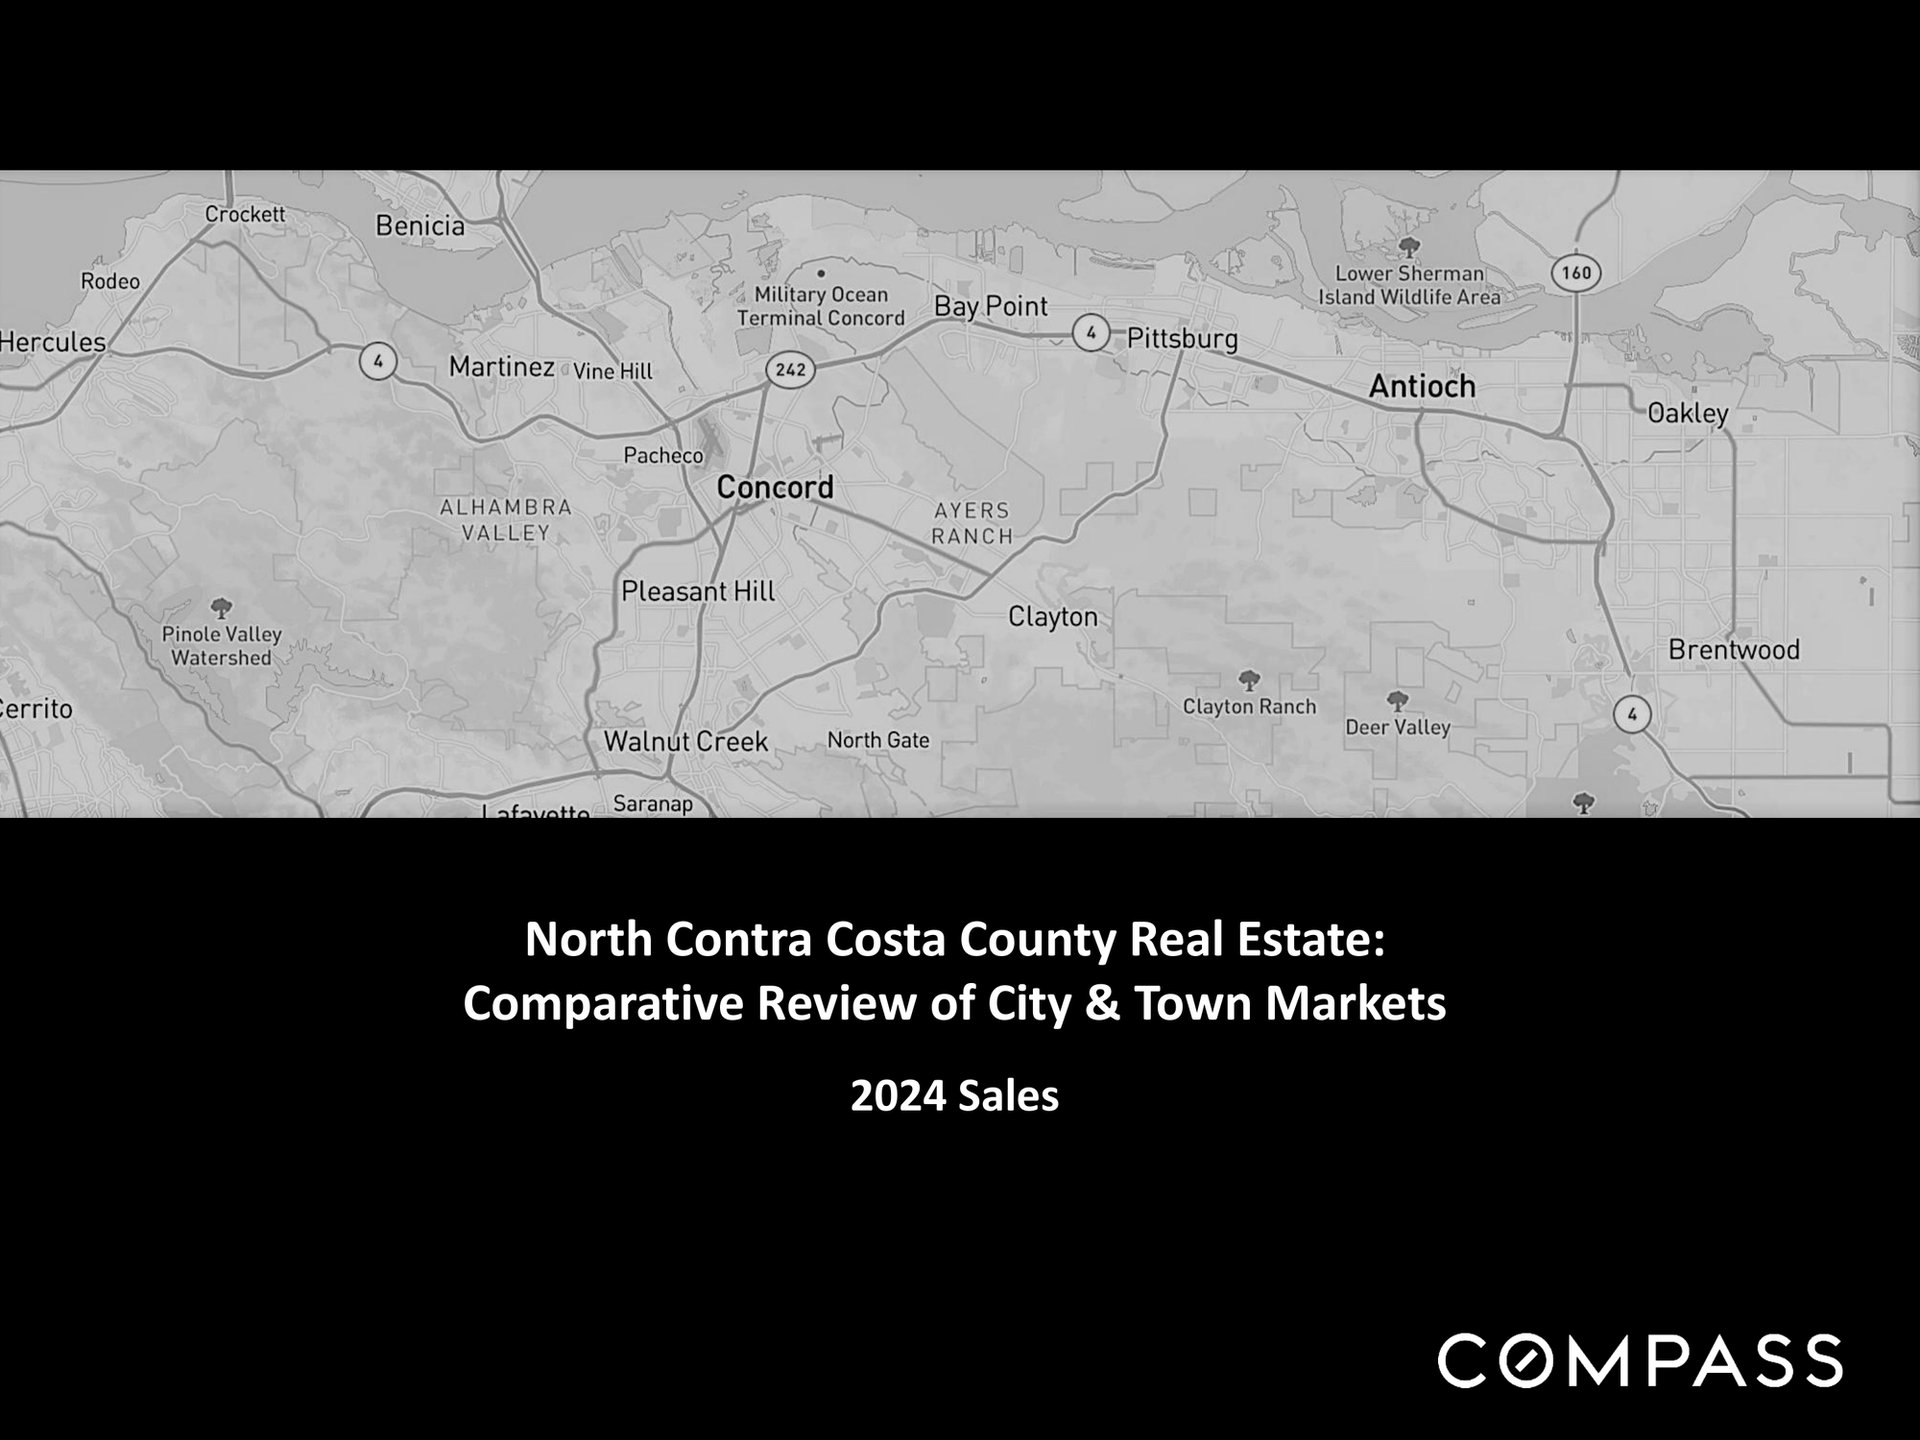
North Contra Costa County 2024 sales review title graphic with a labeled regional map.
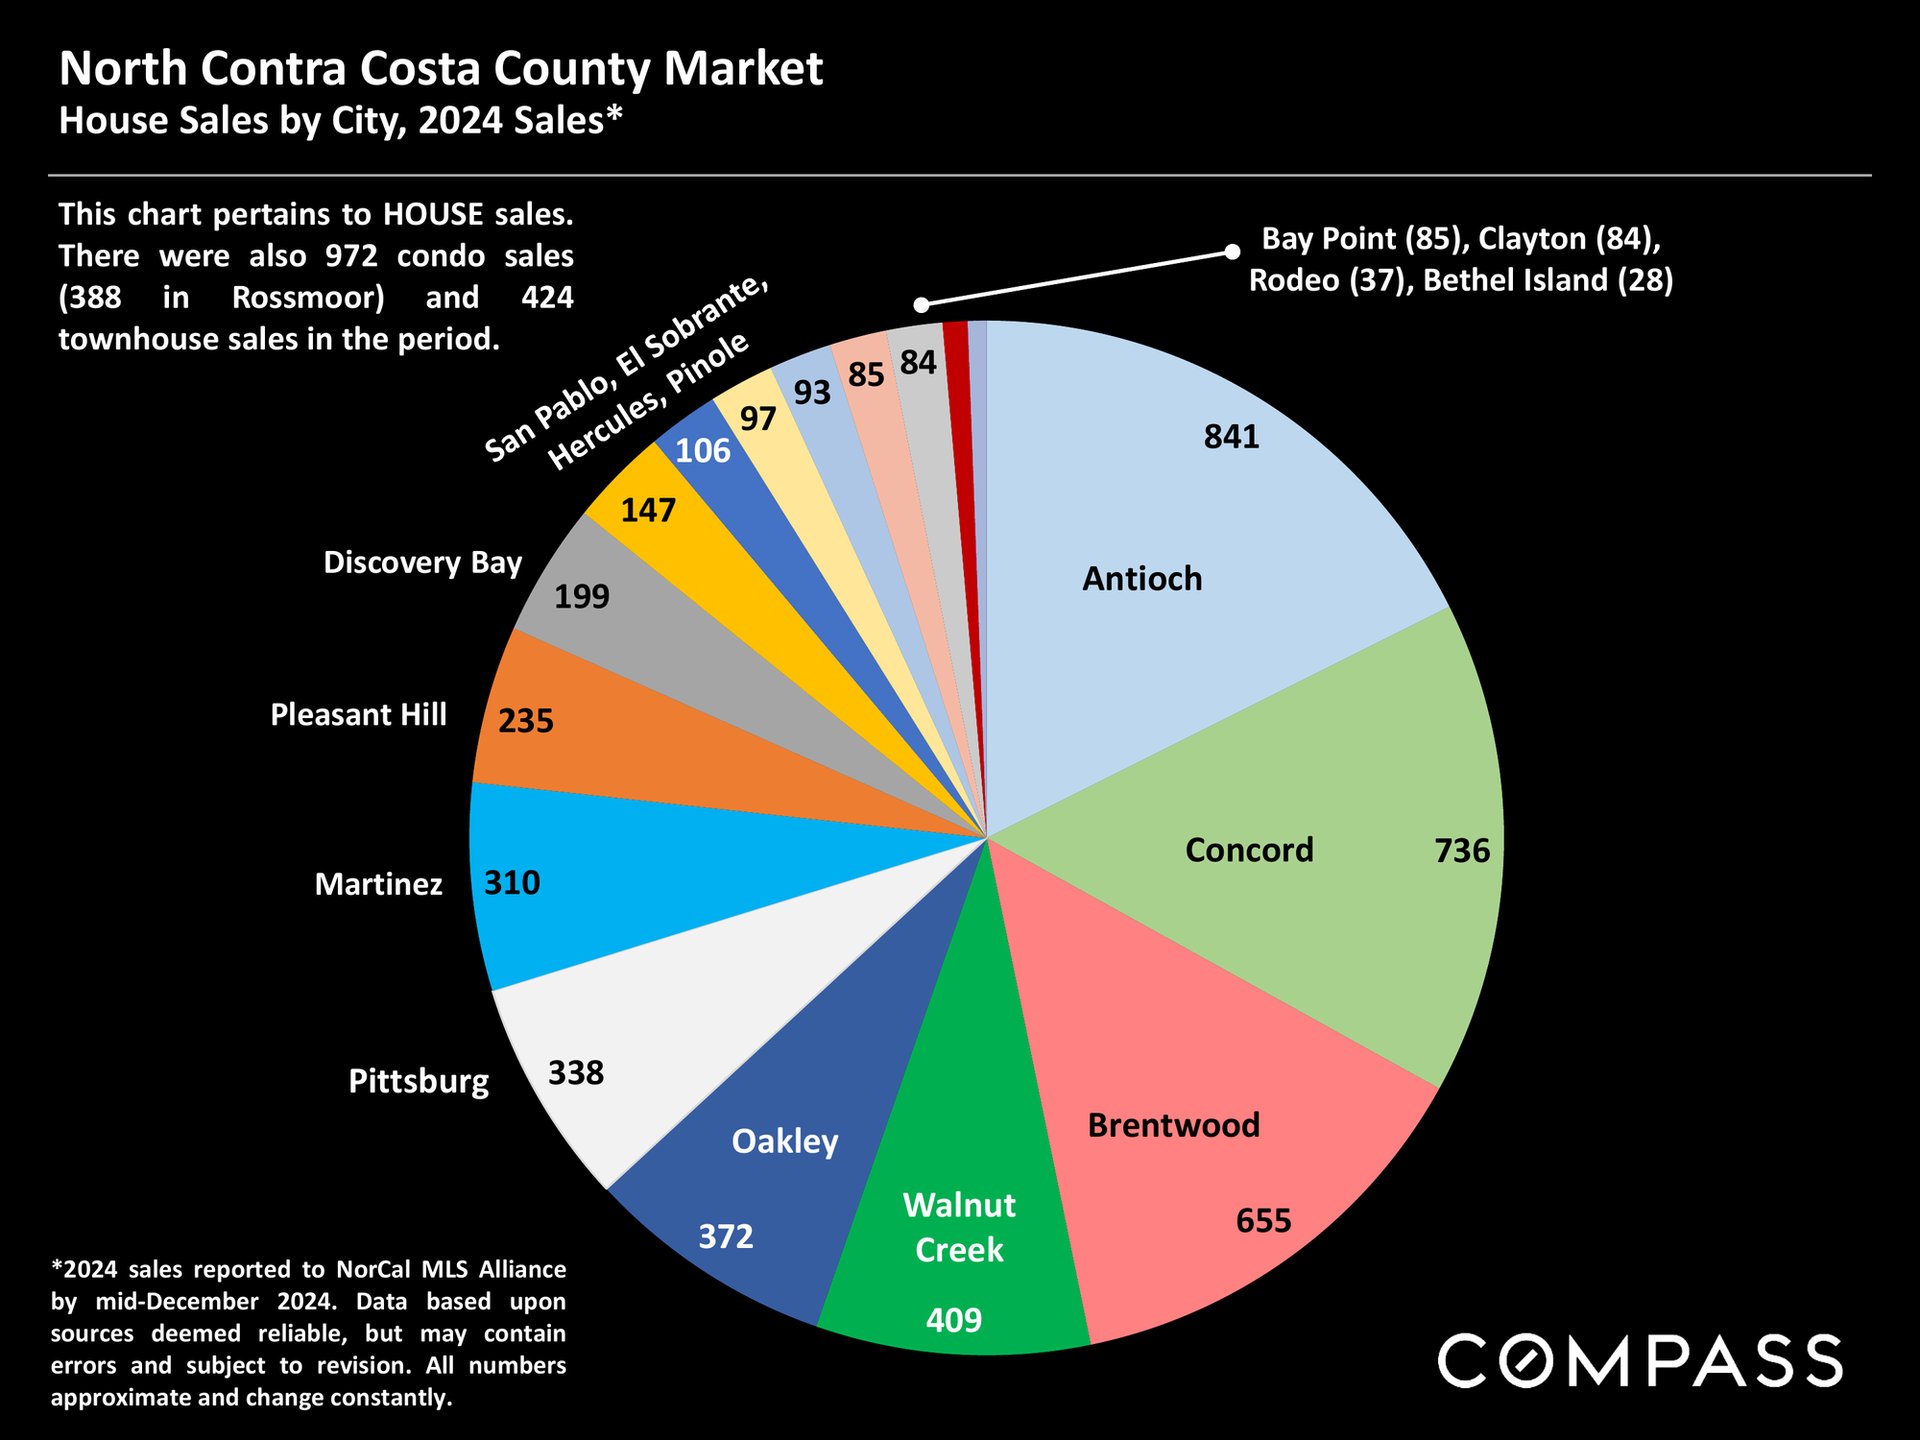
Pie chart comparing 2024 house sales by city in North Contra Costa County, led by Antioch, Concord, and Brentwood.
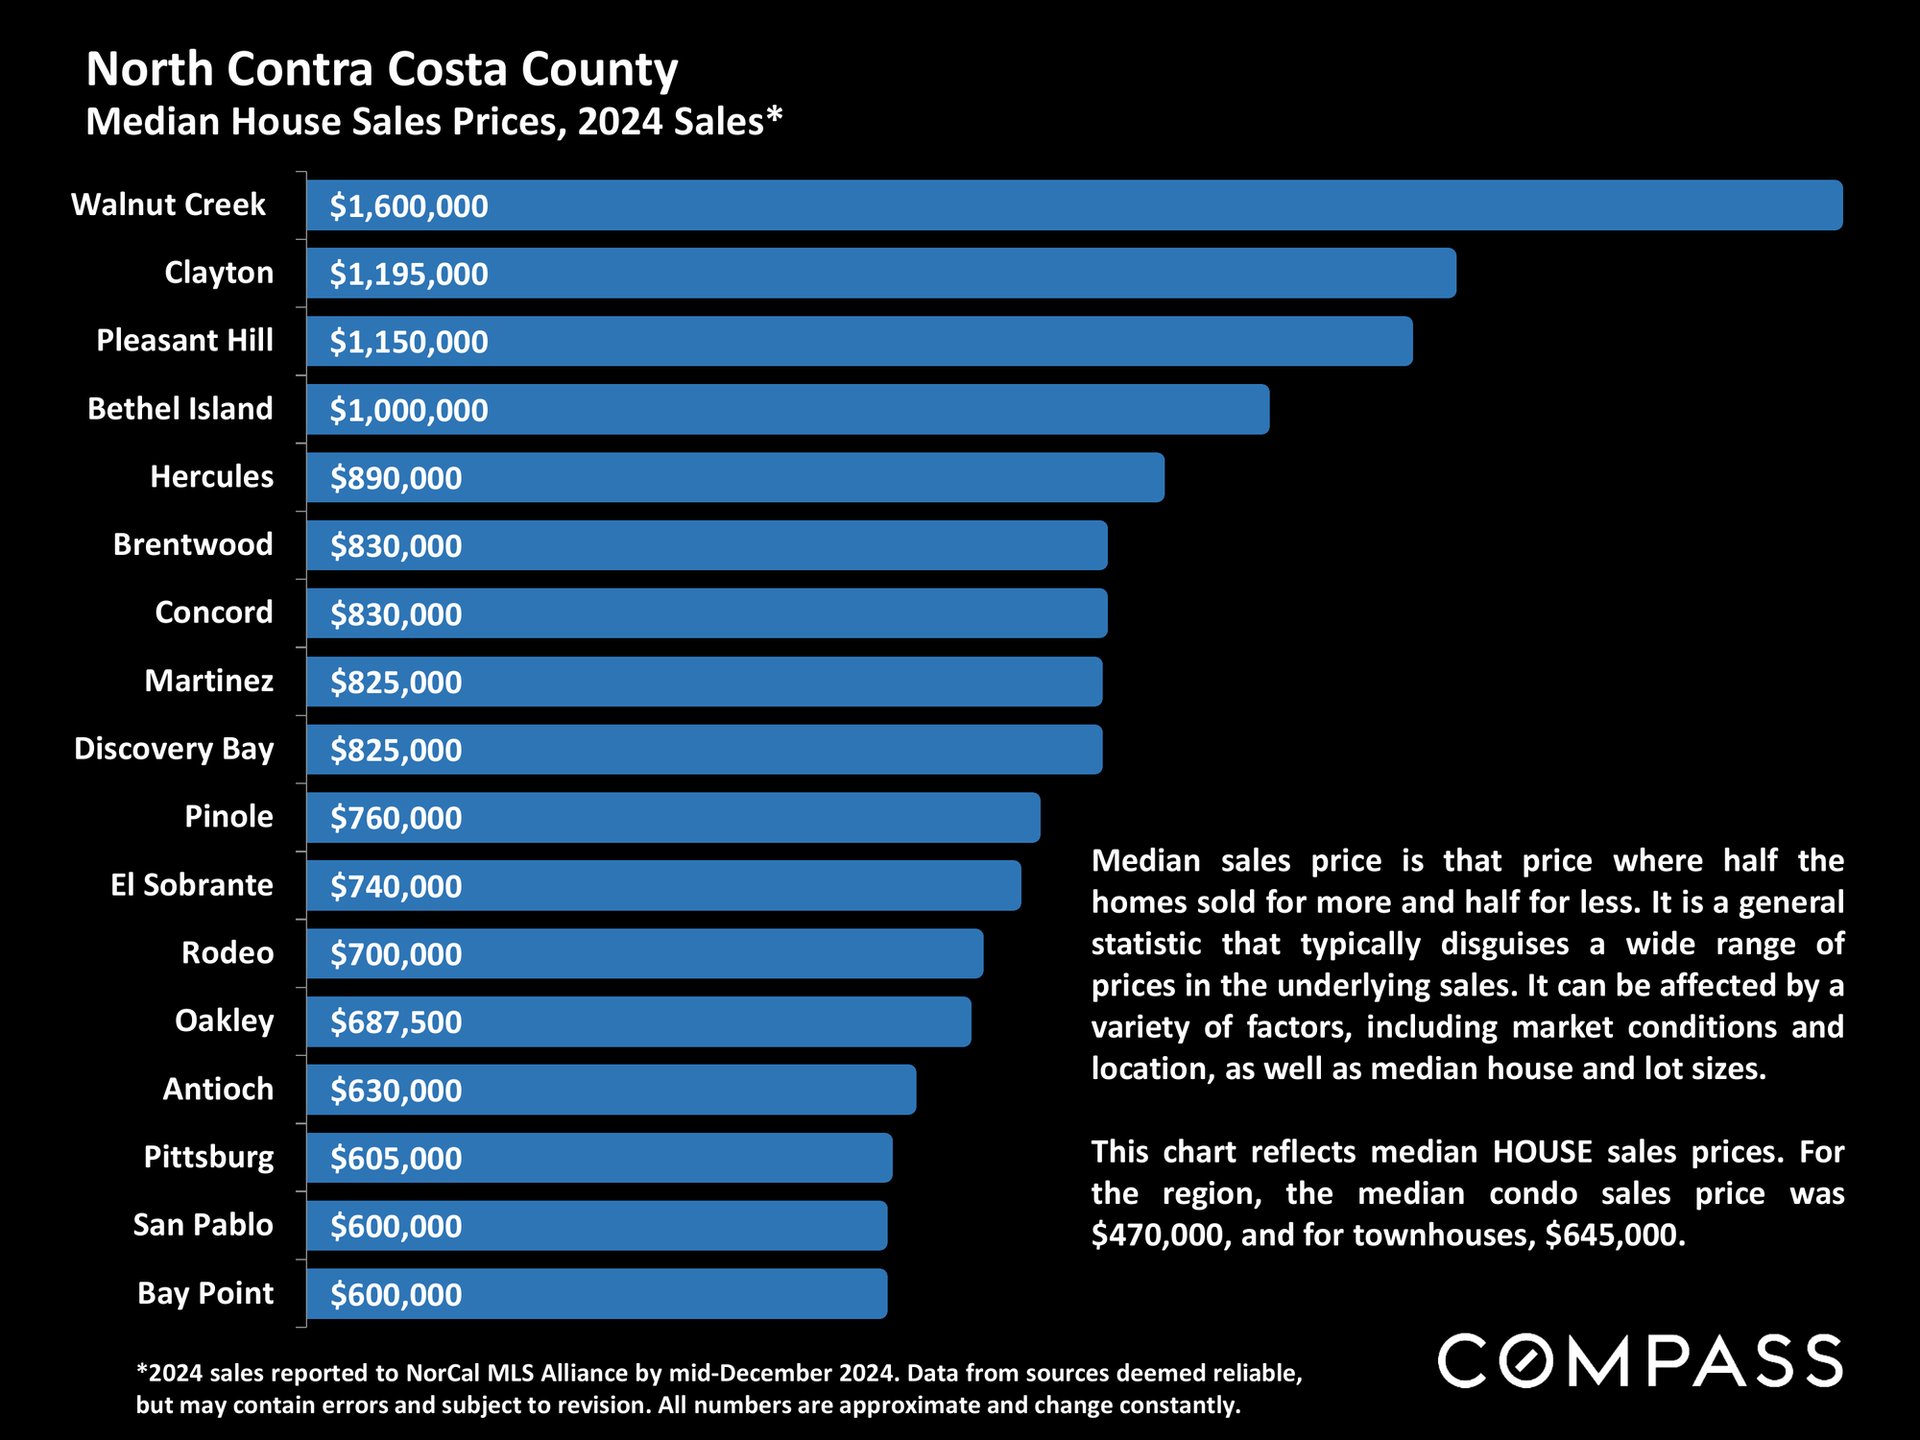
North Contra Costa County 2024 median house sale prices by city, led by Walnut Creek at $1.6 million.
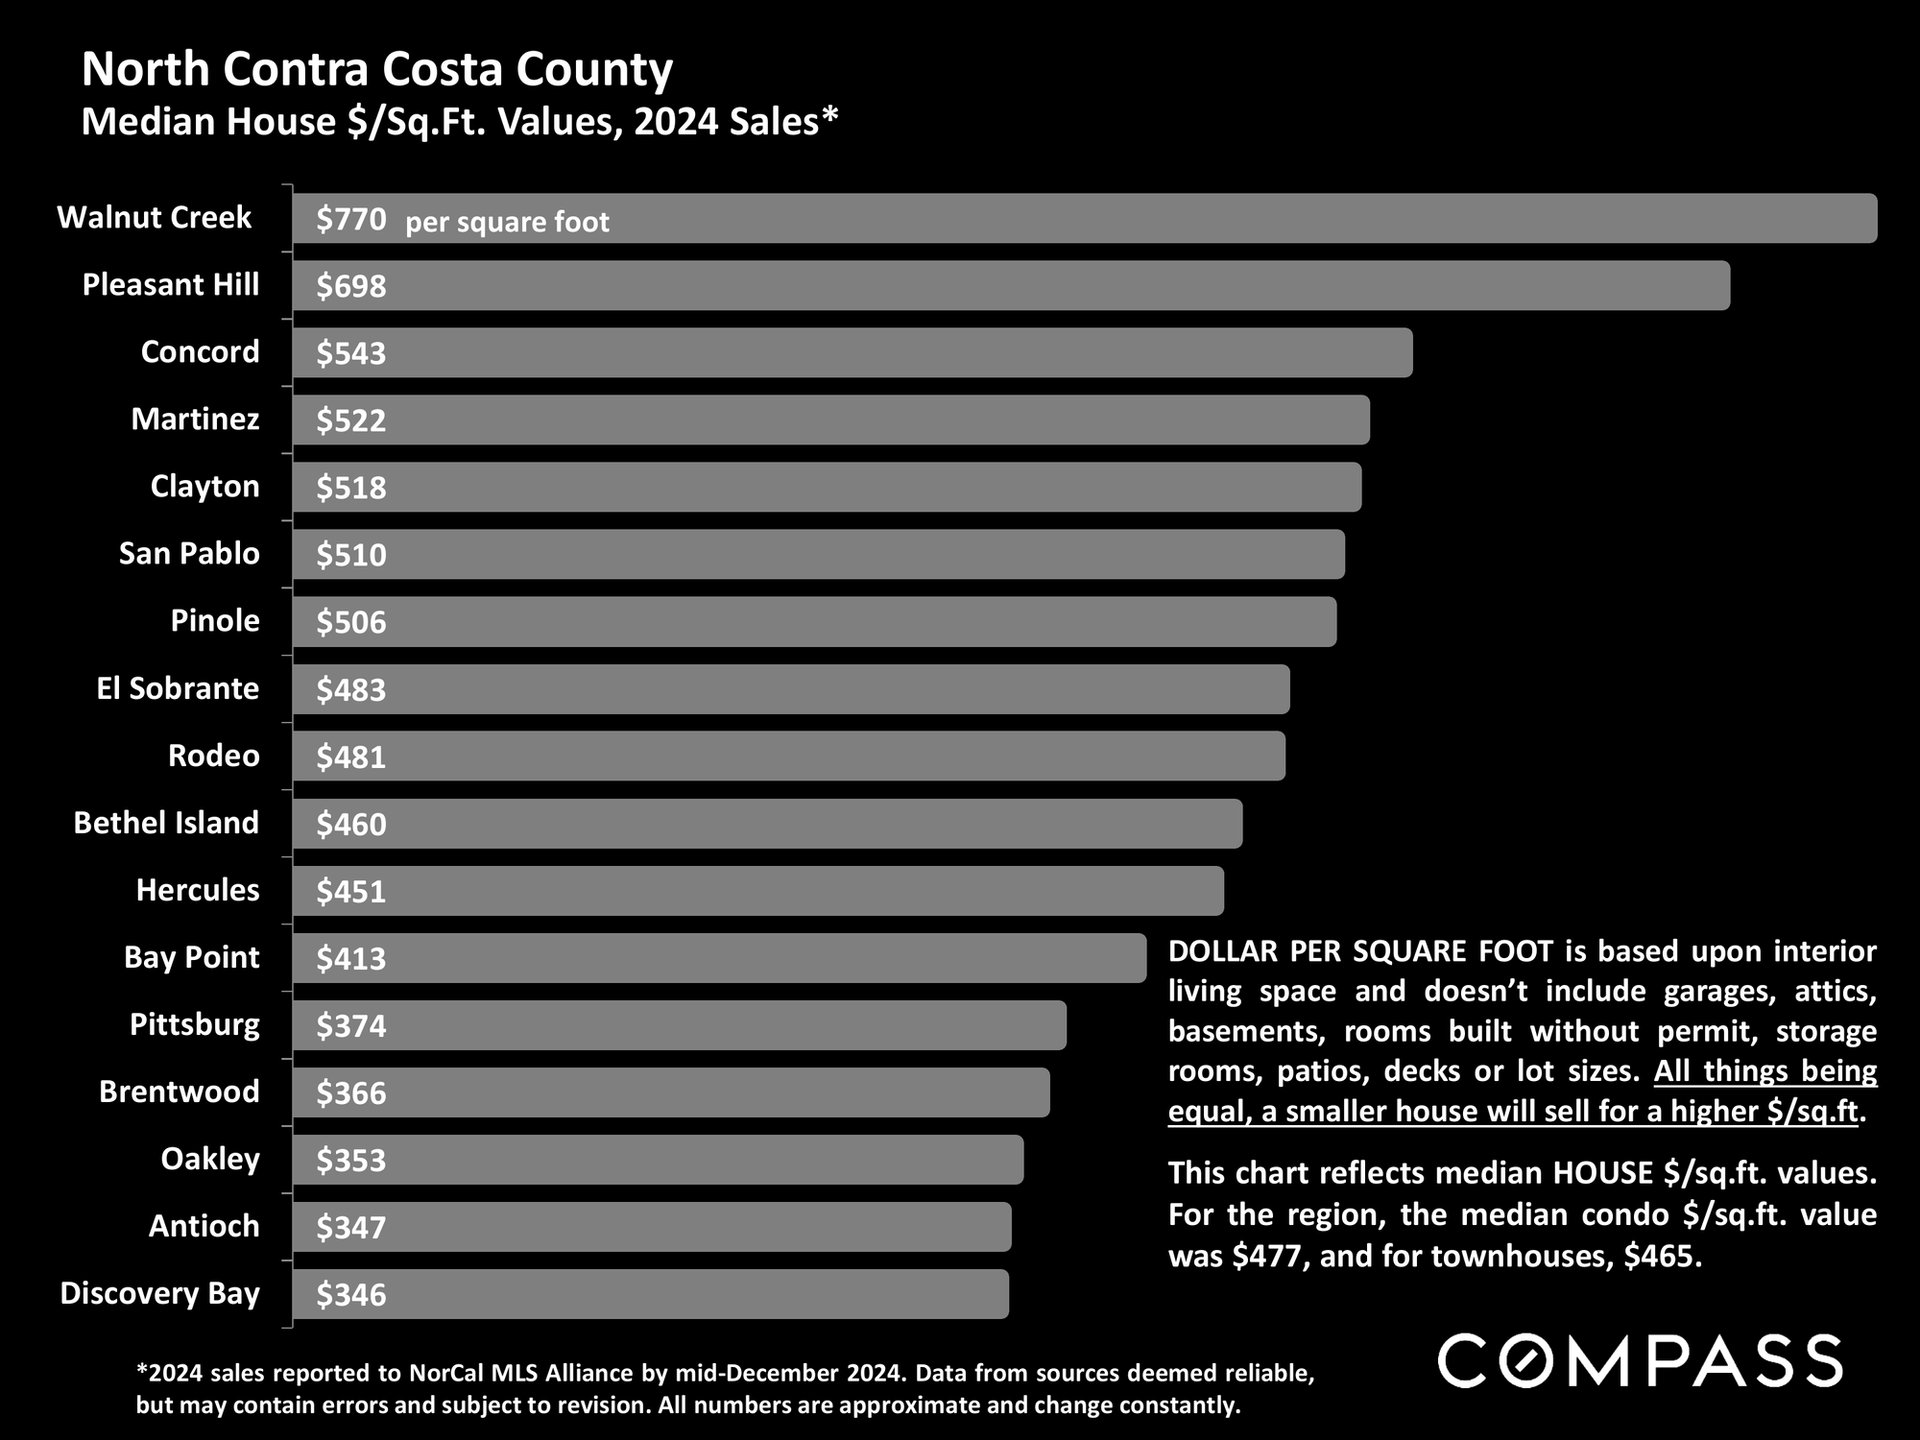
Bar chart comparing 2024 median house price per square foot across North Contra Costa County cities.
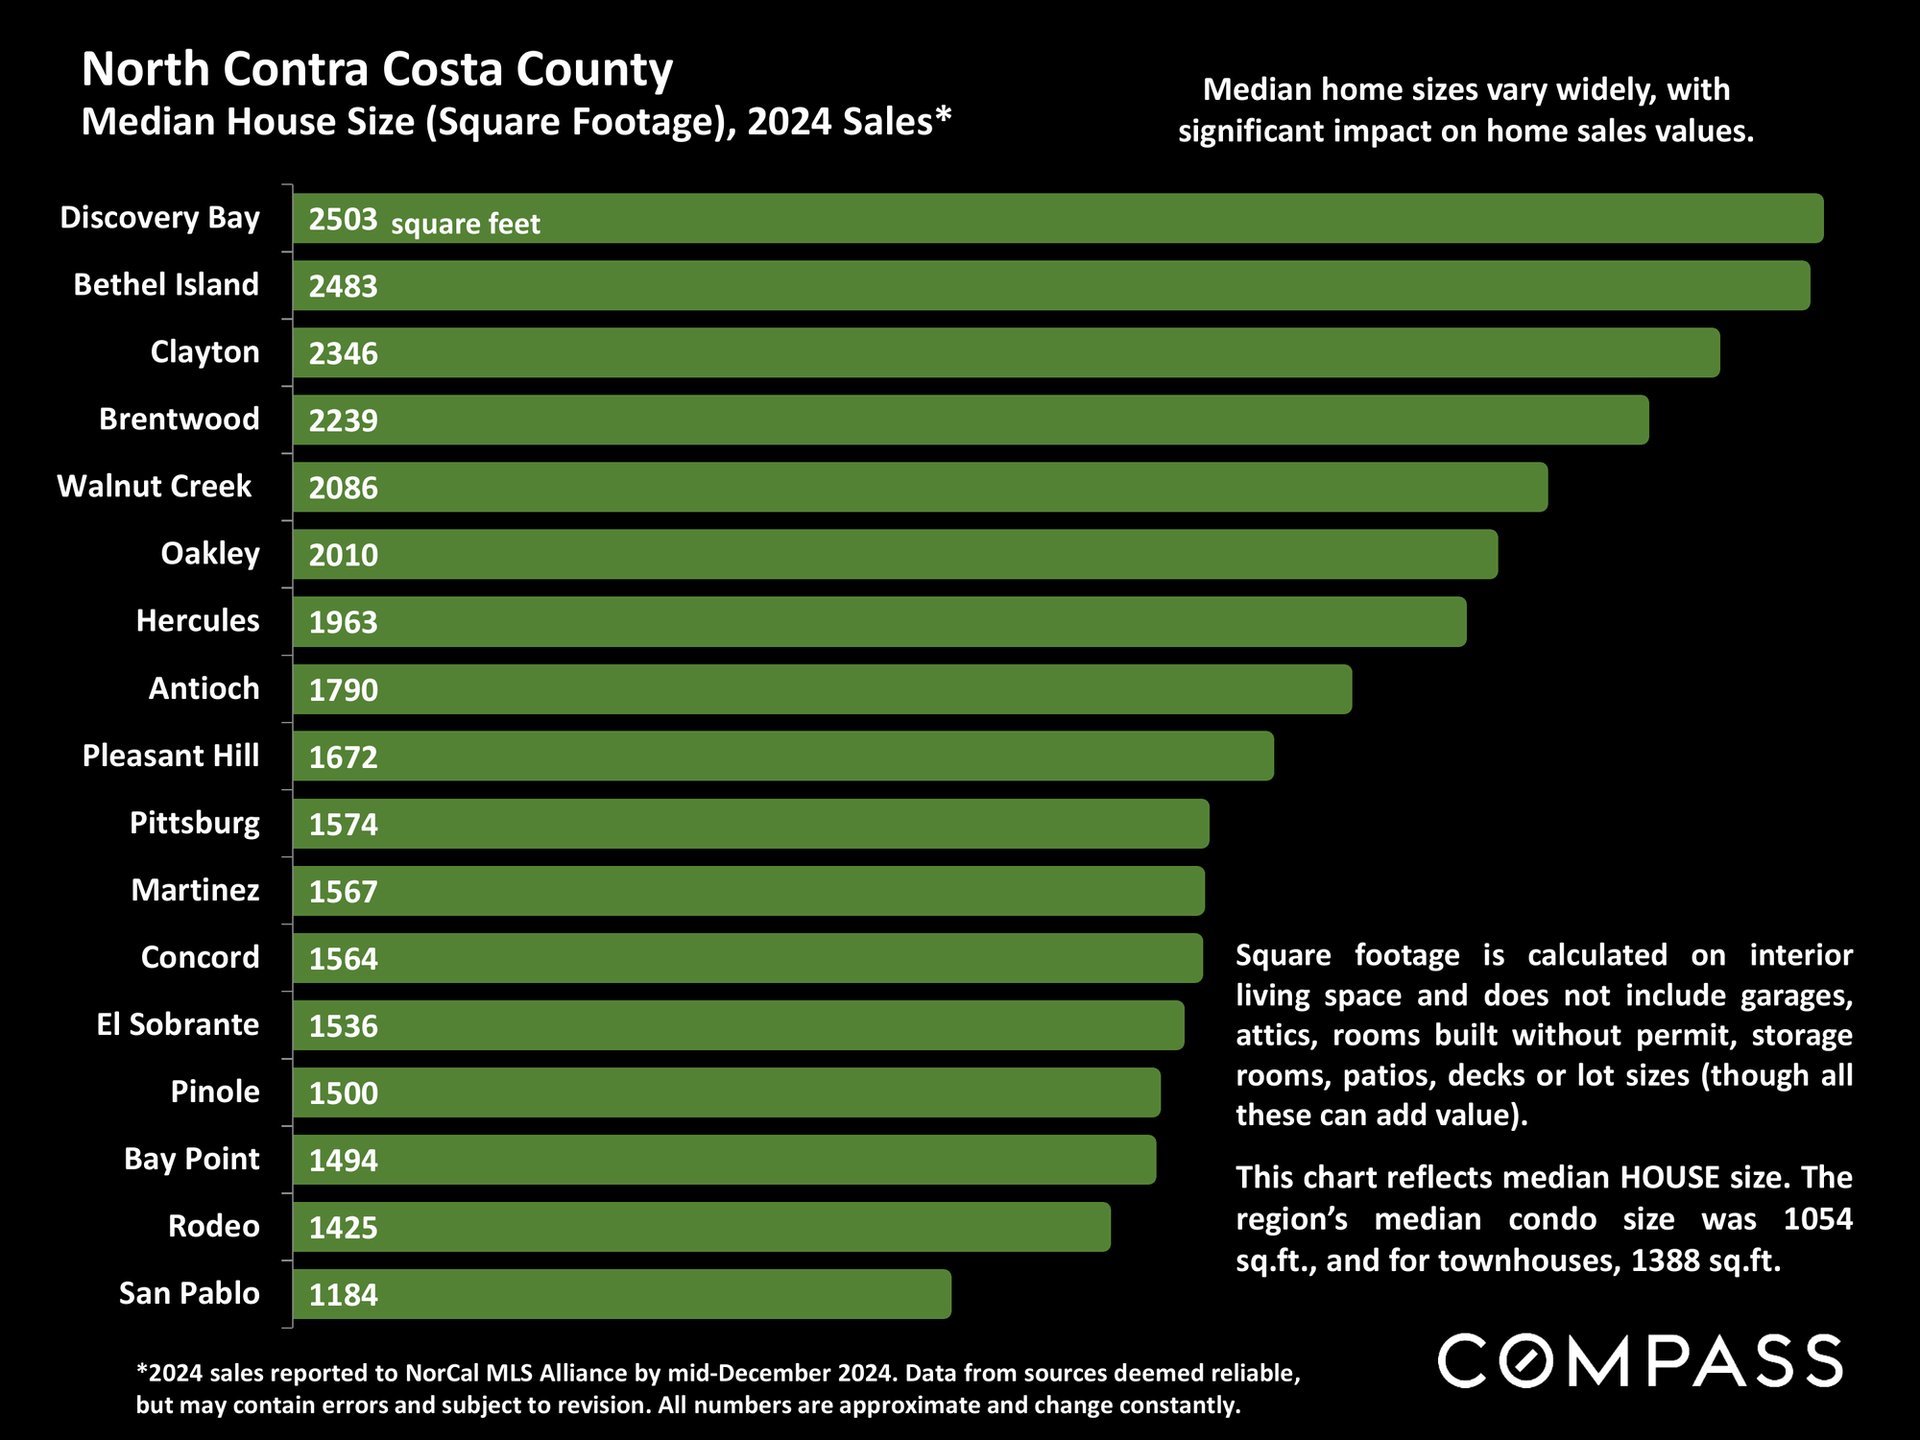
Chart compares 2024 median house sizes across North Contra Costa County communities, from Discovery Bay at 2,503 square feet to San Pablo at 1,184.
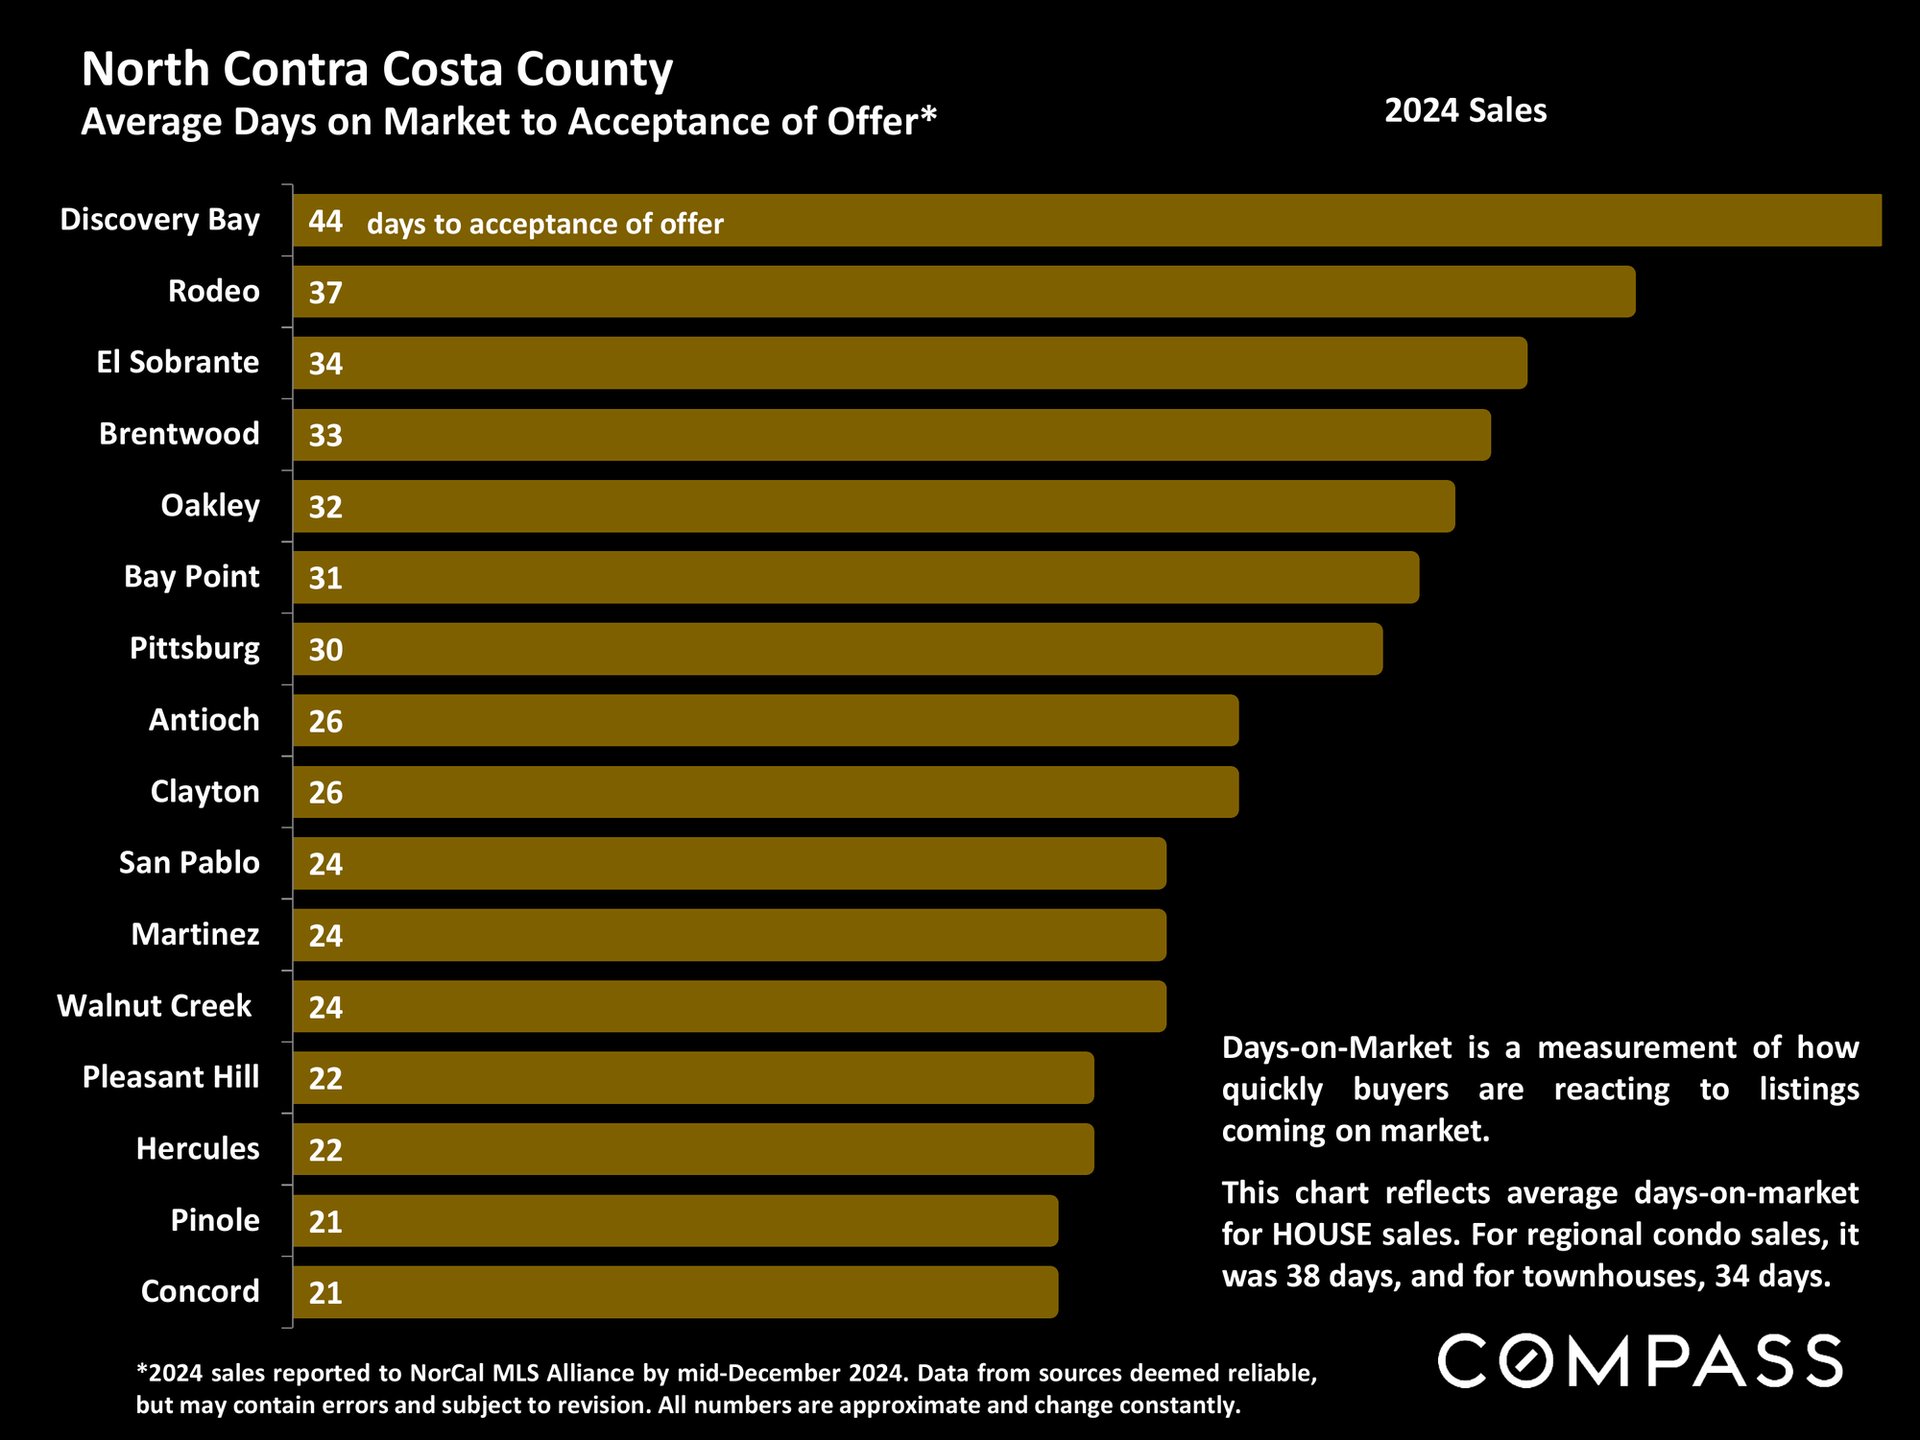
Chart comparing 2024 average days on market across 16 North Contra Costa County cities; Discovery Bay leads at 44 days.
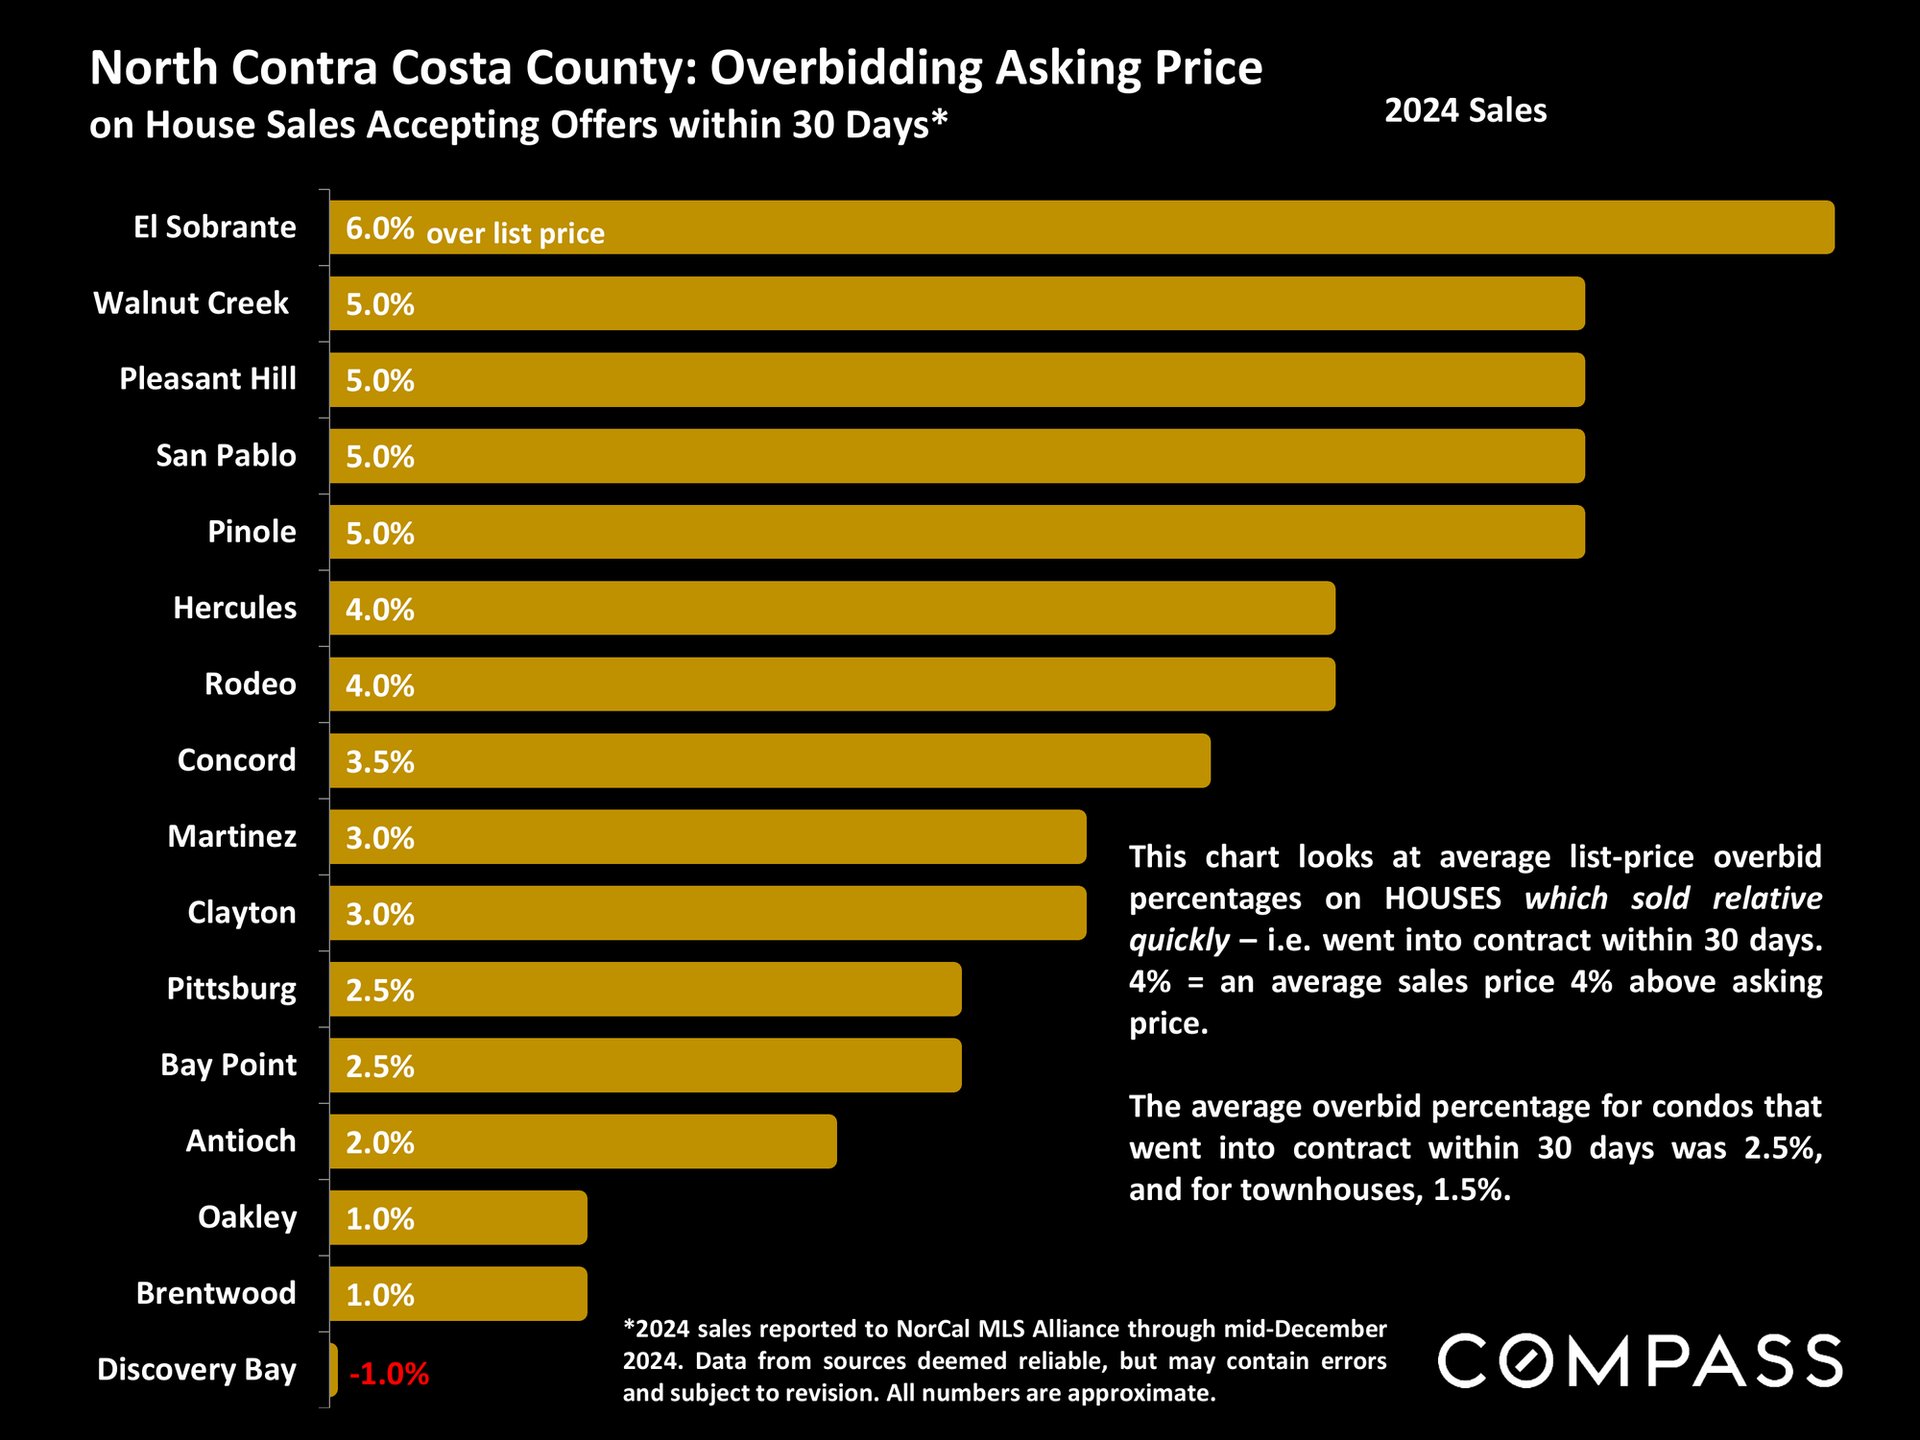
Chart of 2024 North Contra Costa County home overbids, led by El Sobrante at 6%; Discovery Bay shows -1%.
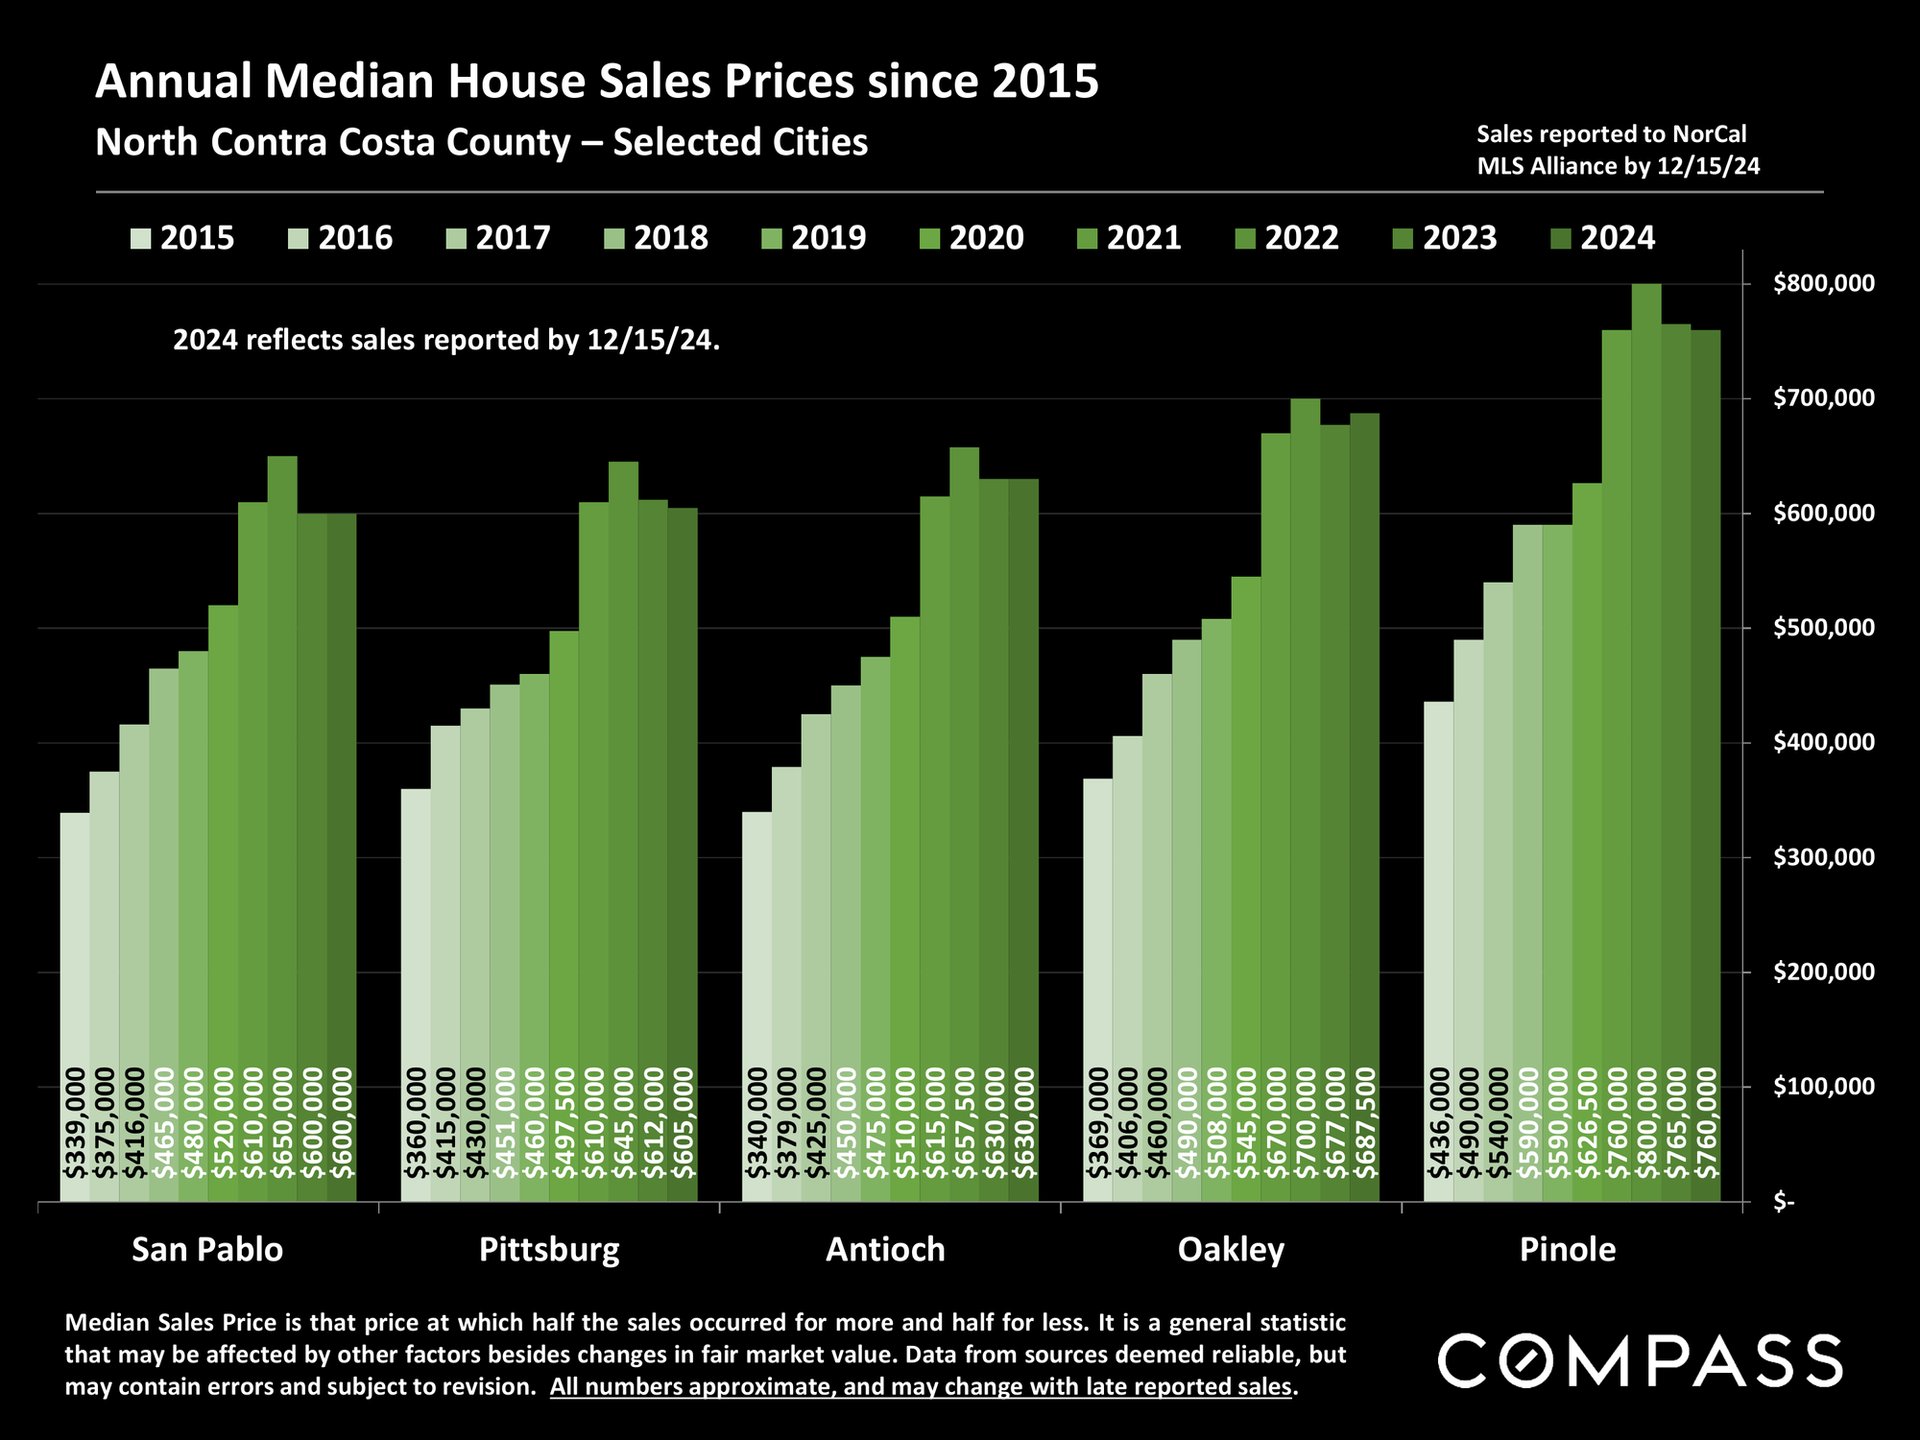
Bar chart comparing annual median house sale prices in five North Contra Costa County cities, 2015–2024.
Chart comparing annual median home sale prices from 2015 to 2024 across five North Contra Costa County cities.
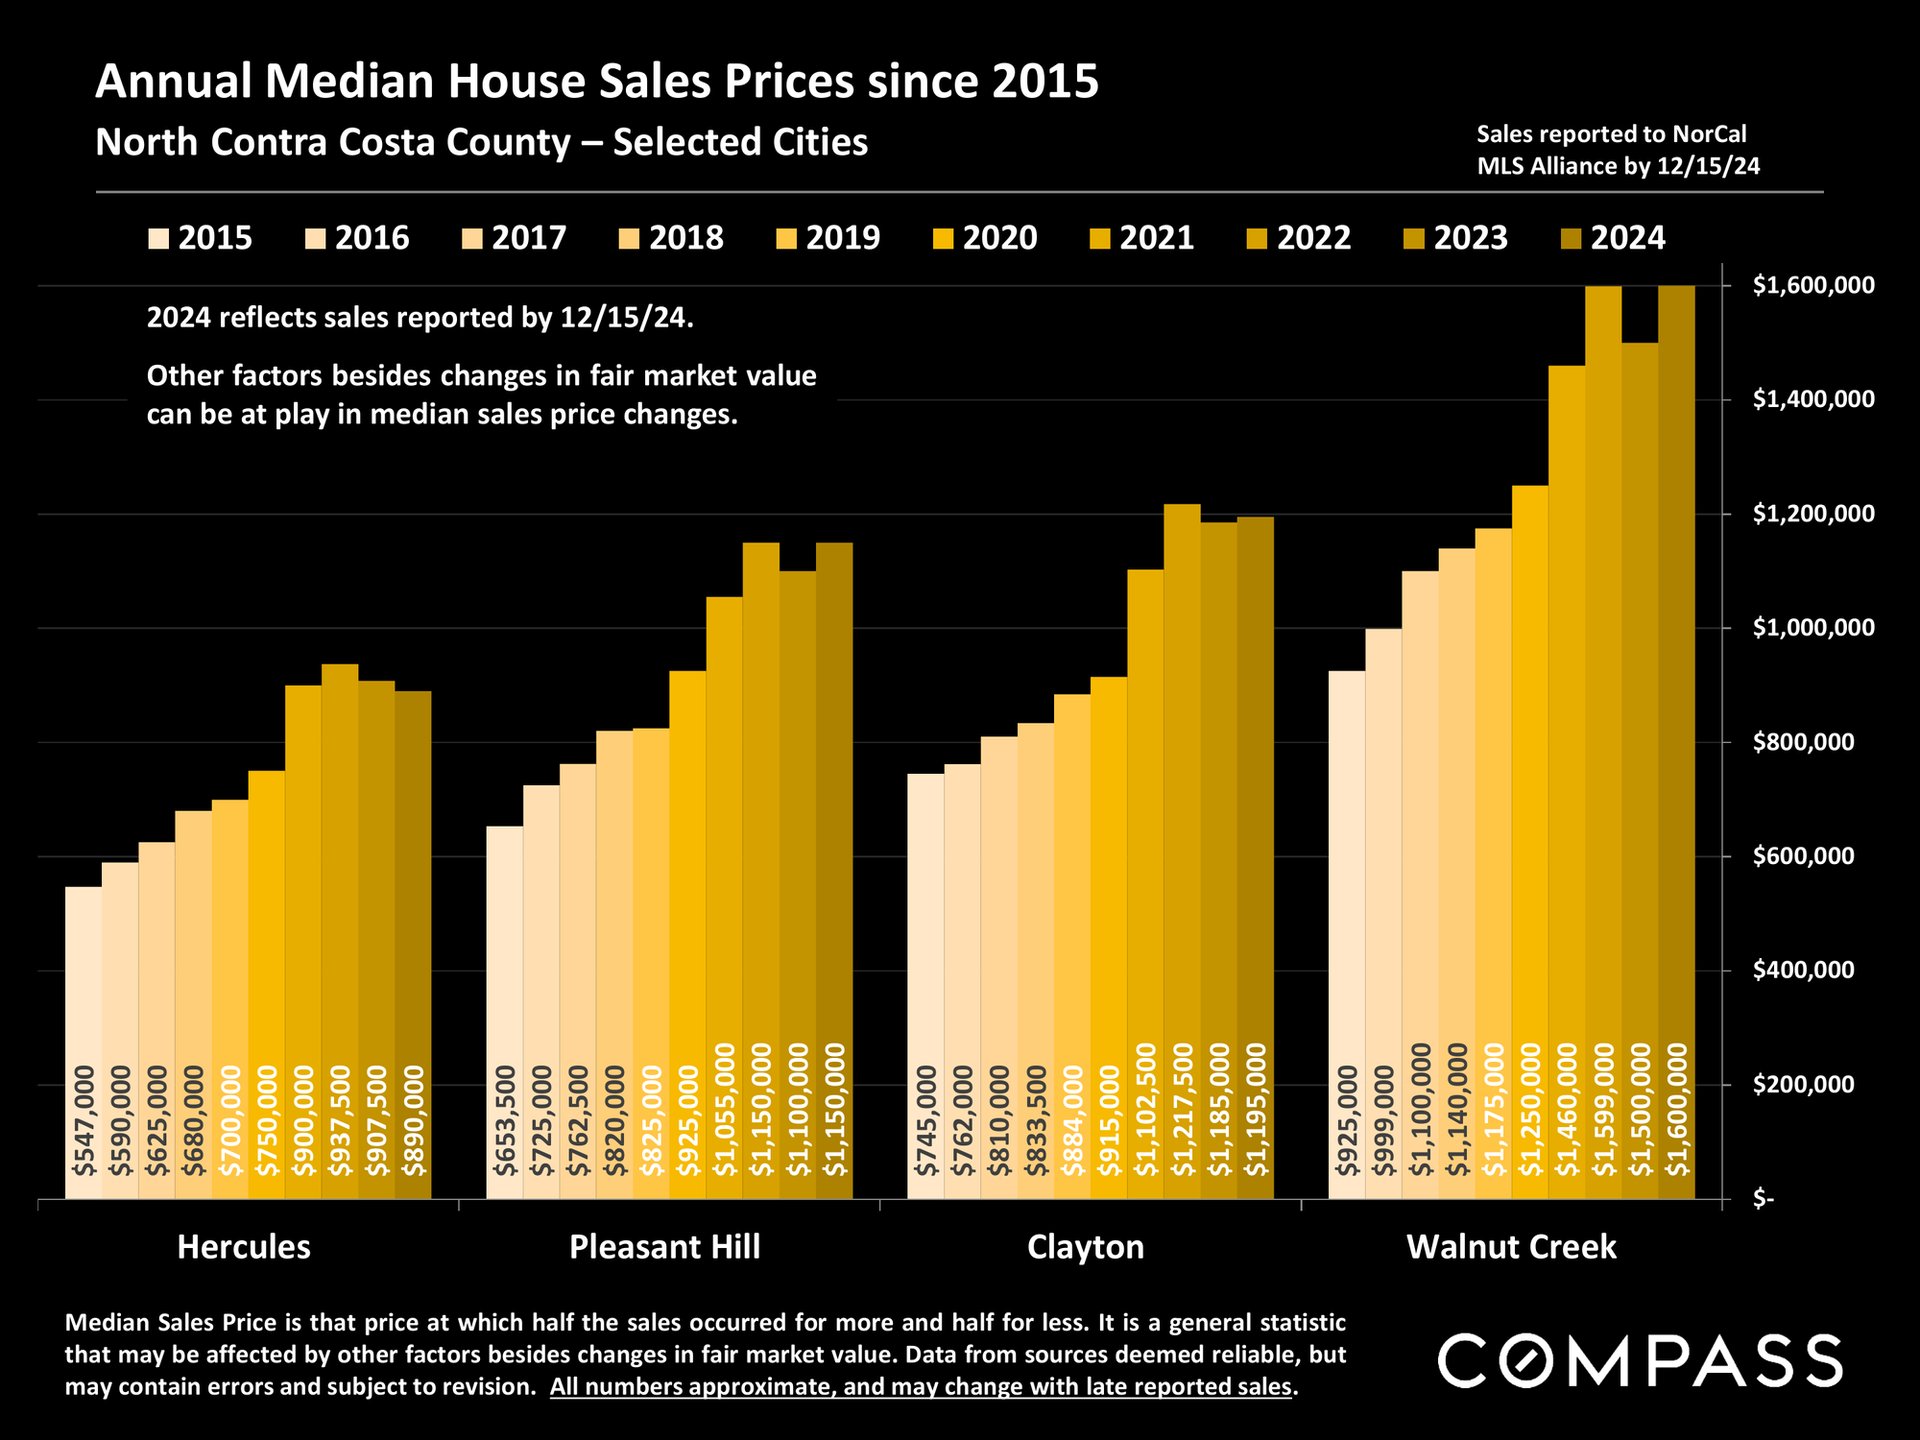
Chart of annual median home sale prices since 2015 in Hercules, Pleasant Hill, Clayton, and Walnut Creek.


WORK WITH US

We offer the highest level of service and expertise to our clients. Our team has built a reputation for consistently representing the finest real estate in San Francisco and Napa Valley. Results driven and dedicated to your success, whether buying, selling, renting or investing. Contact us today for a private consultation.

Contact Us