November 2020 Report

House & Condo Market Dynamics Dramatically Diverge

SF house and condo markets have been affected differently by the pandemic. This report attempts a deeper dive into the data across the city and within different city districts.

The market typically starts a big slowdown in mid-November, running through the mid-winter holidays, until it begins to wake up in mid-January. High-price segments normally see the most dramatic plunges in mid-winter activity.

This year, the pandemic upended seasonality: Spring, usually the strongest selling season, saw a crash in activity; summer, which typically slows down - especially for luxury home sales - saw high demand; and the summer market accelerated into autumn. But supply has been accelerating even faster than demand.

We suspect late Q4 will see something of a slowdown, but remain more active than in past years.

Link to a comparative review of Bay Area County Markets.

General City Dynamics, House & Condo

Sales rebounded strongly from the early-spring pandemic crash: House sales are higher than in recent years and condo, co-op and TIC sales are at levels comparable to peak sales volumes over that period.
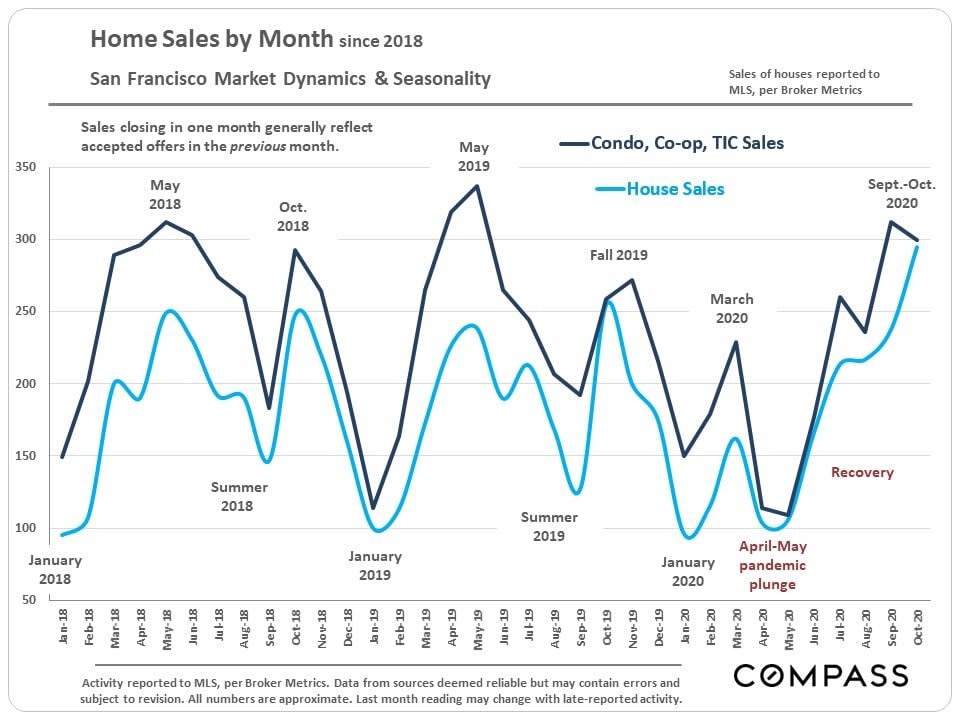
San Francisco condo and house sales by month, 2018 through October 2020.

The most dramatic change is the increase in the number of listings for sale. Condo, co-op and TIC listings in MLS are at their highest point ever, approximately 85% higher than one year ago. House listings are also up, but much less dramatically, running about 20% to 25% higher than in autumn 2019.

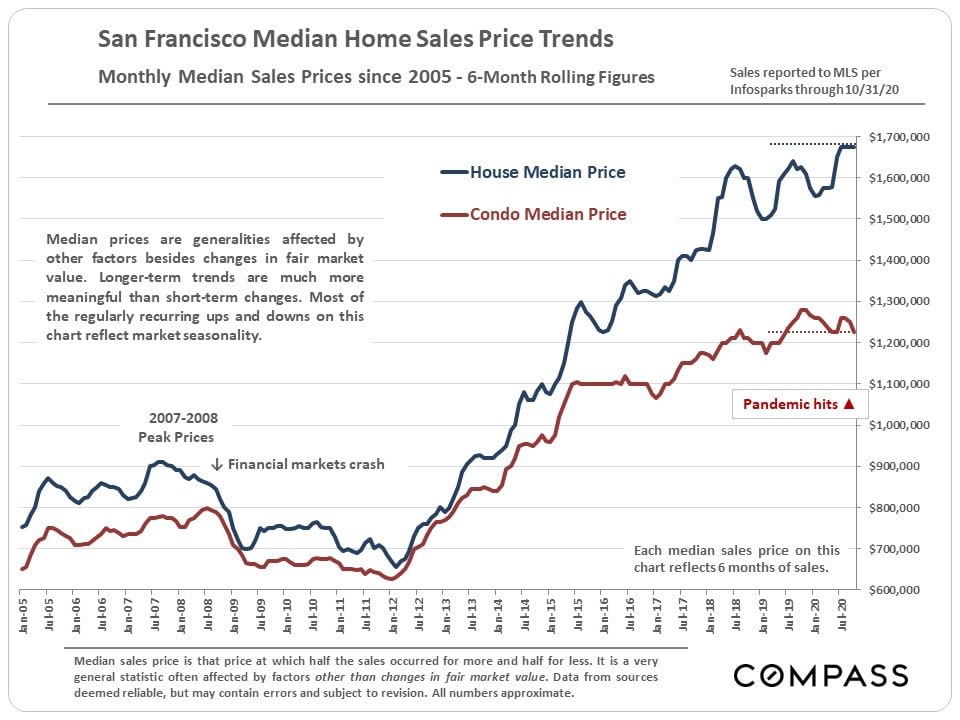
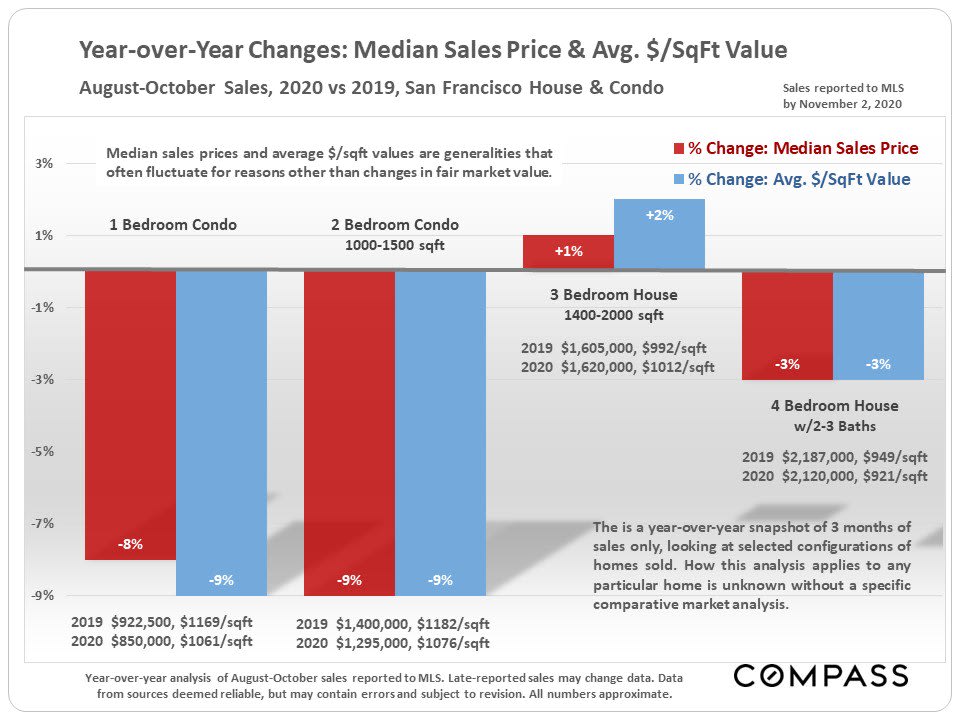
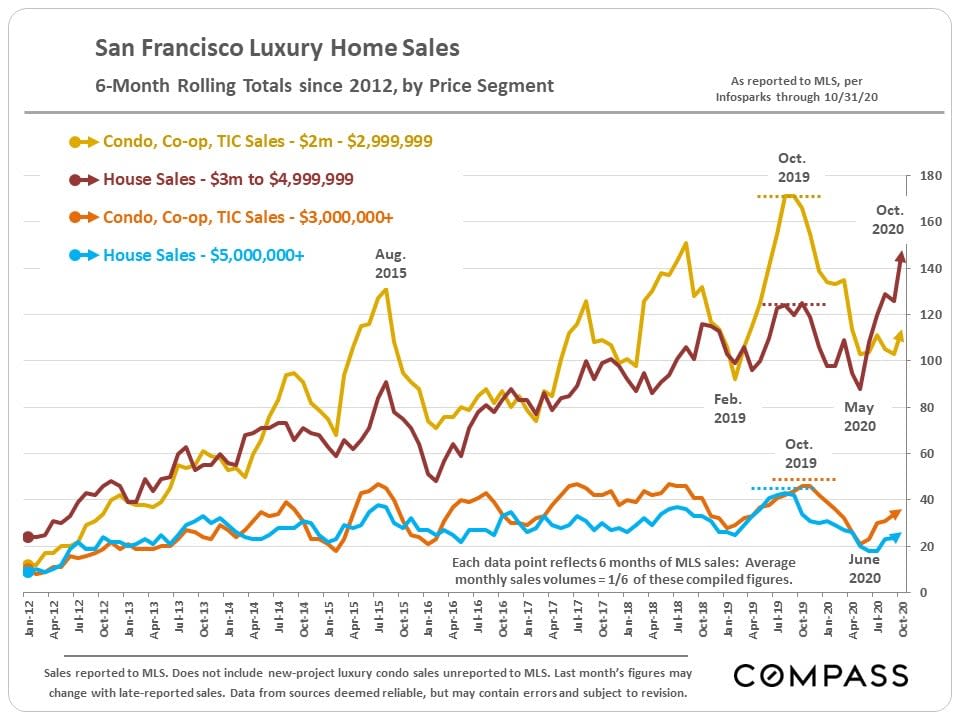
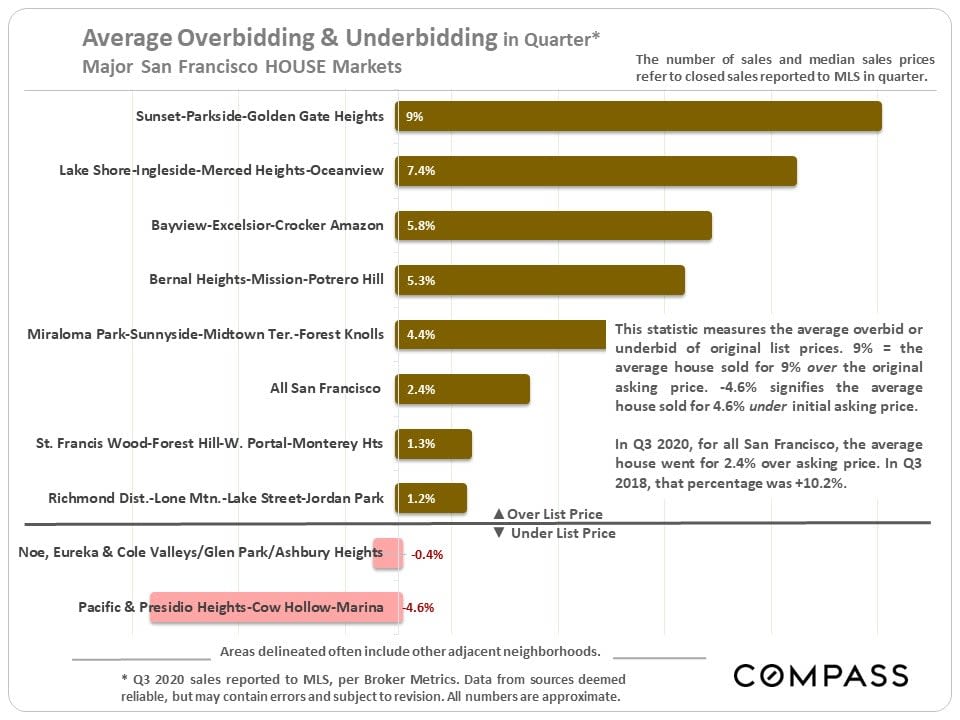
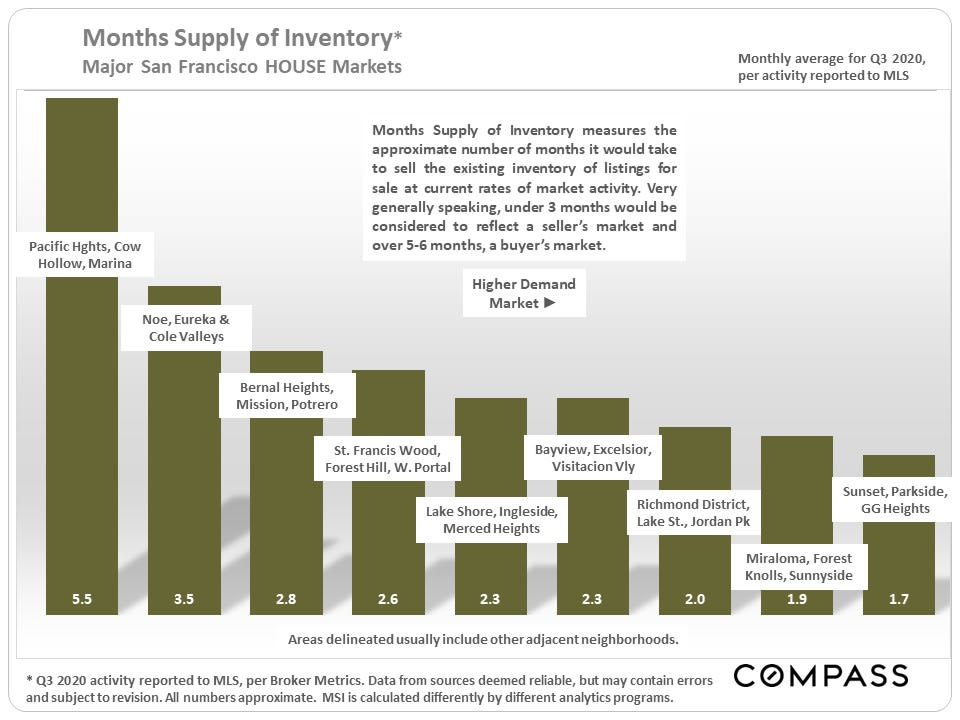
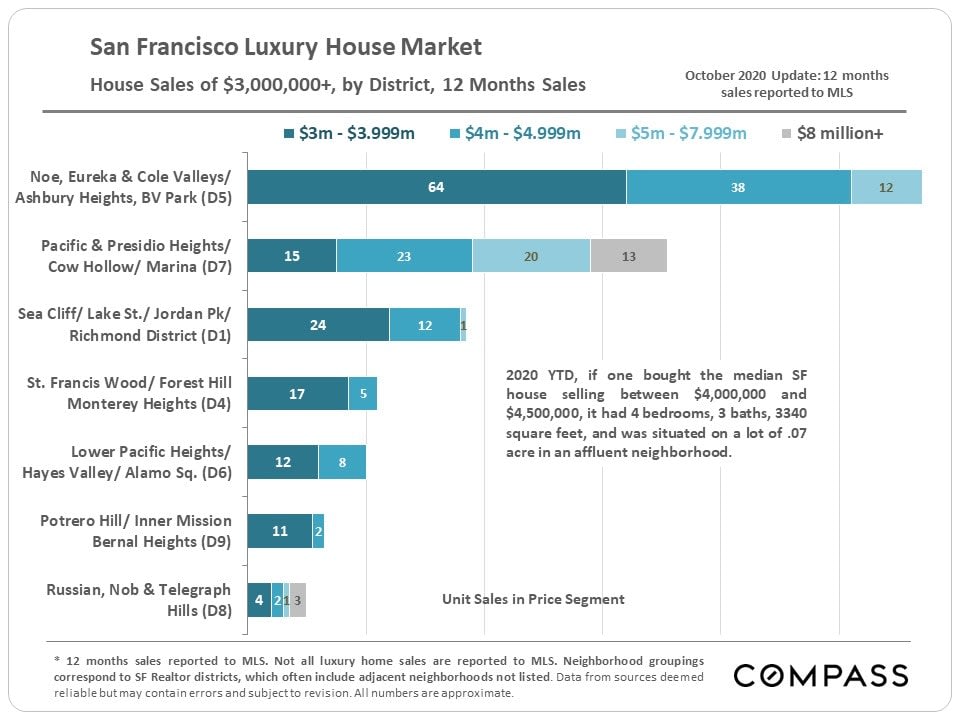
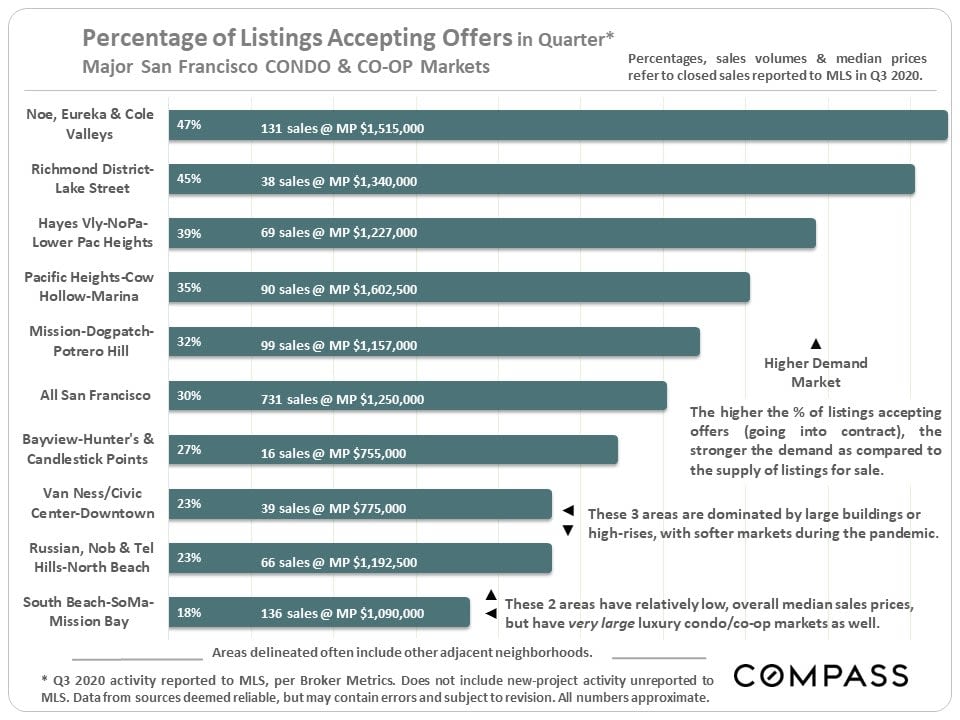
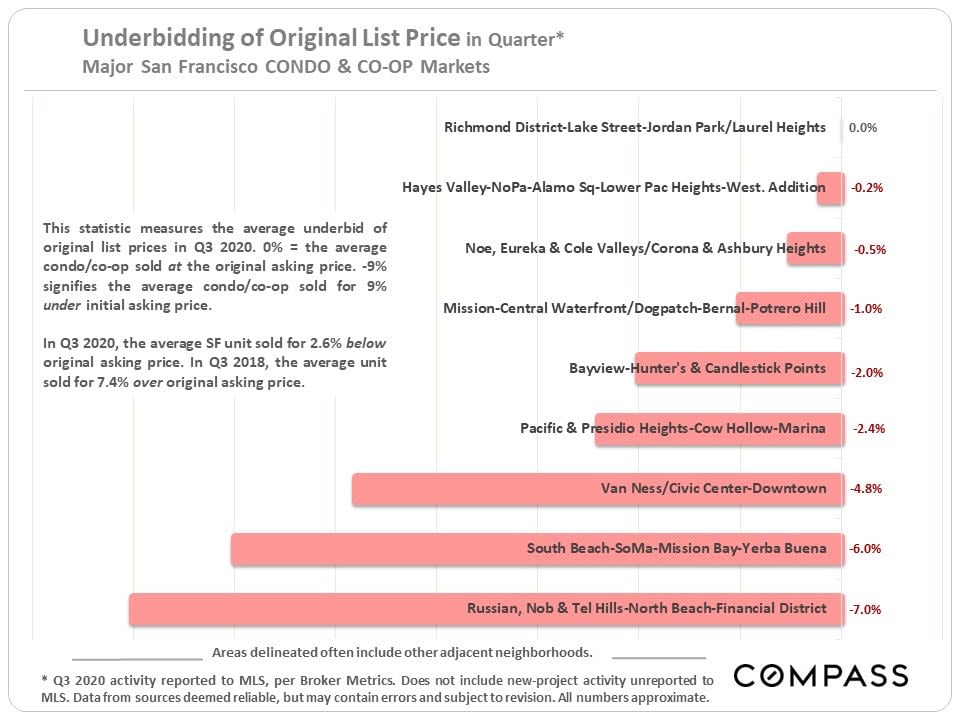
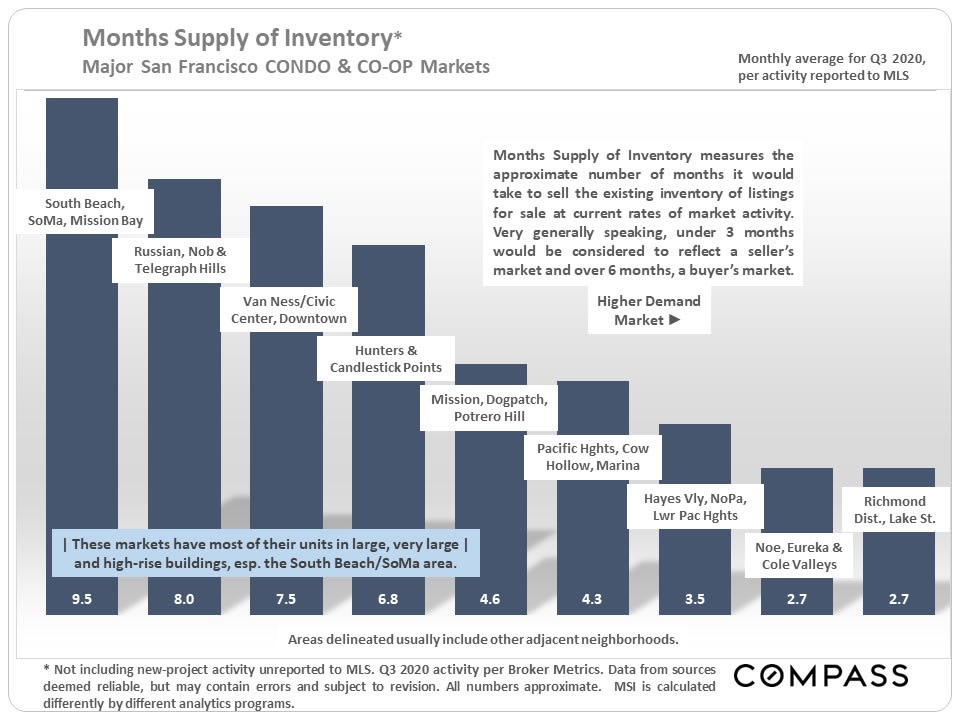
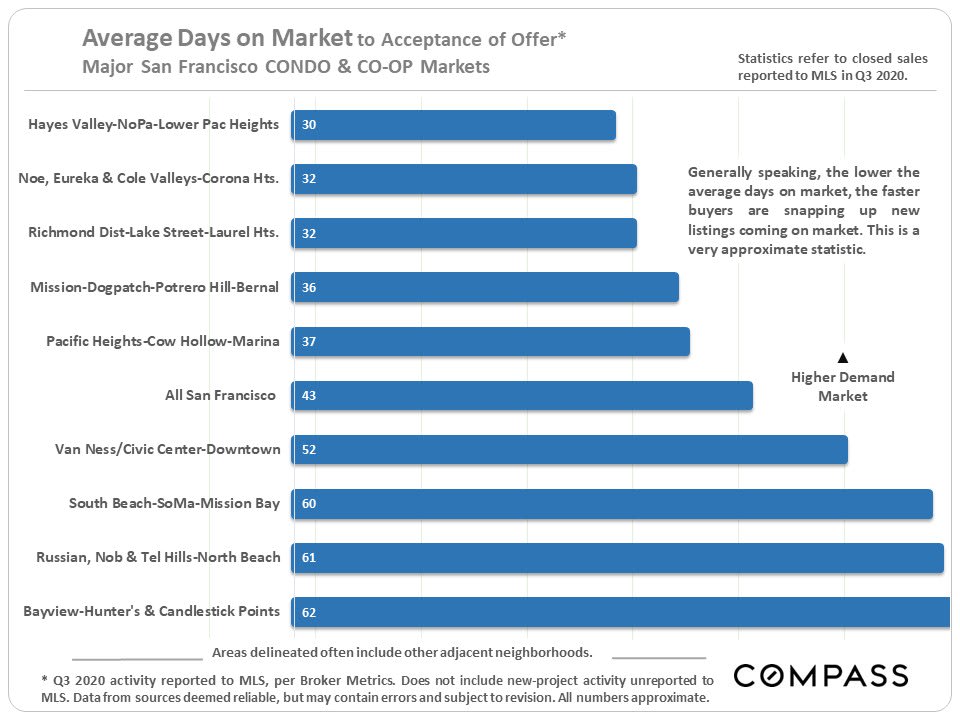
Chart compares San Francisco condo, co-op and TIC listings with house listings from April to October 2020.San Francisco 2020 price-reduction chart, showing a sharper increase for condo, co-op and TIC listings than houses.Line chart of San Francisco house and condo prices from 2005 to 2020, with house prices rising to about $1.7 million.San Francisco housing market chart comparing 2020 and 2019 prices for condos and houses.San Francisco luxury home sales chart comparing six-month rolling totals by price segment through October 2020.Chart comparing San Francisco neighborhood listing acceptance rates, led by Sunset-Parkside–Golden Gate Heights at 68%.Chart comparing Q3 2020 overbidding and underbidding across San Francisco neighborhoods; Sunset-Parkside leads at 9%.Bar chart of Q3 2020 San Francisco housing inventory, ranging from 5.5 months in Pacific Heights to 1.7 in Sunset.Chart comparing San Francisco luxury home sales by price segment and district.Chart of Q3 2020 San Francisco condo and co-op offer-acceptance rates by neighborhood, ranging from 18% to 47%.Chart of San Francisco neighborhood underbidding rates, from 0.0% in Richmond to -7.0% downtown.San Francisco condo and co-op inventory chart comparing months of supply across neighborhoods in Q3 2020.Bar chart of average days on market across San Francisco condo and co-op markets, ranging from 30 to 62 days.Chart of San Francisco luxury condo, co-op, and TIC sales by district and price segment, with property and bedroom summaries.

WORK WITH US

We offer the highest level of service and expertise to our clients. Our team has built a reputation for consistently representing the finest real estate in San Francisco and Napa Valley. Results driven and dedicated to your success, whether buying, selling, renting or investing. Contact us today for a private consultation.

Contact Us