





San Francisco Bay Area Home Price Appreciation & Market Cycles 1990

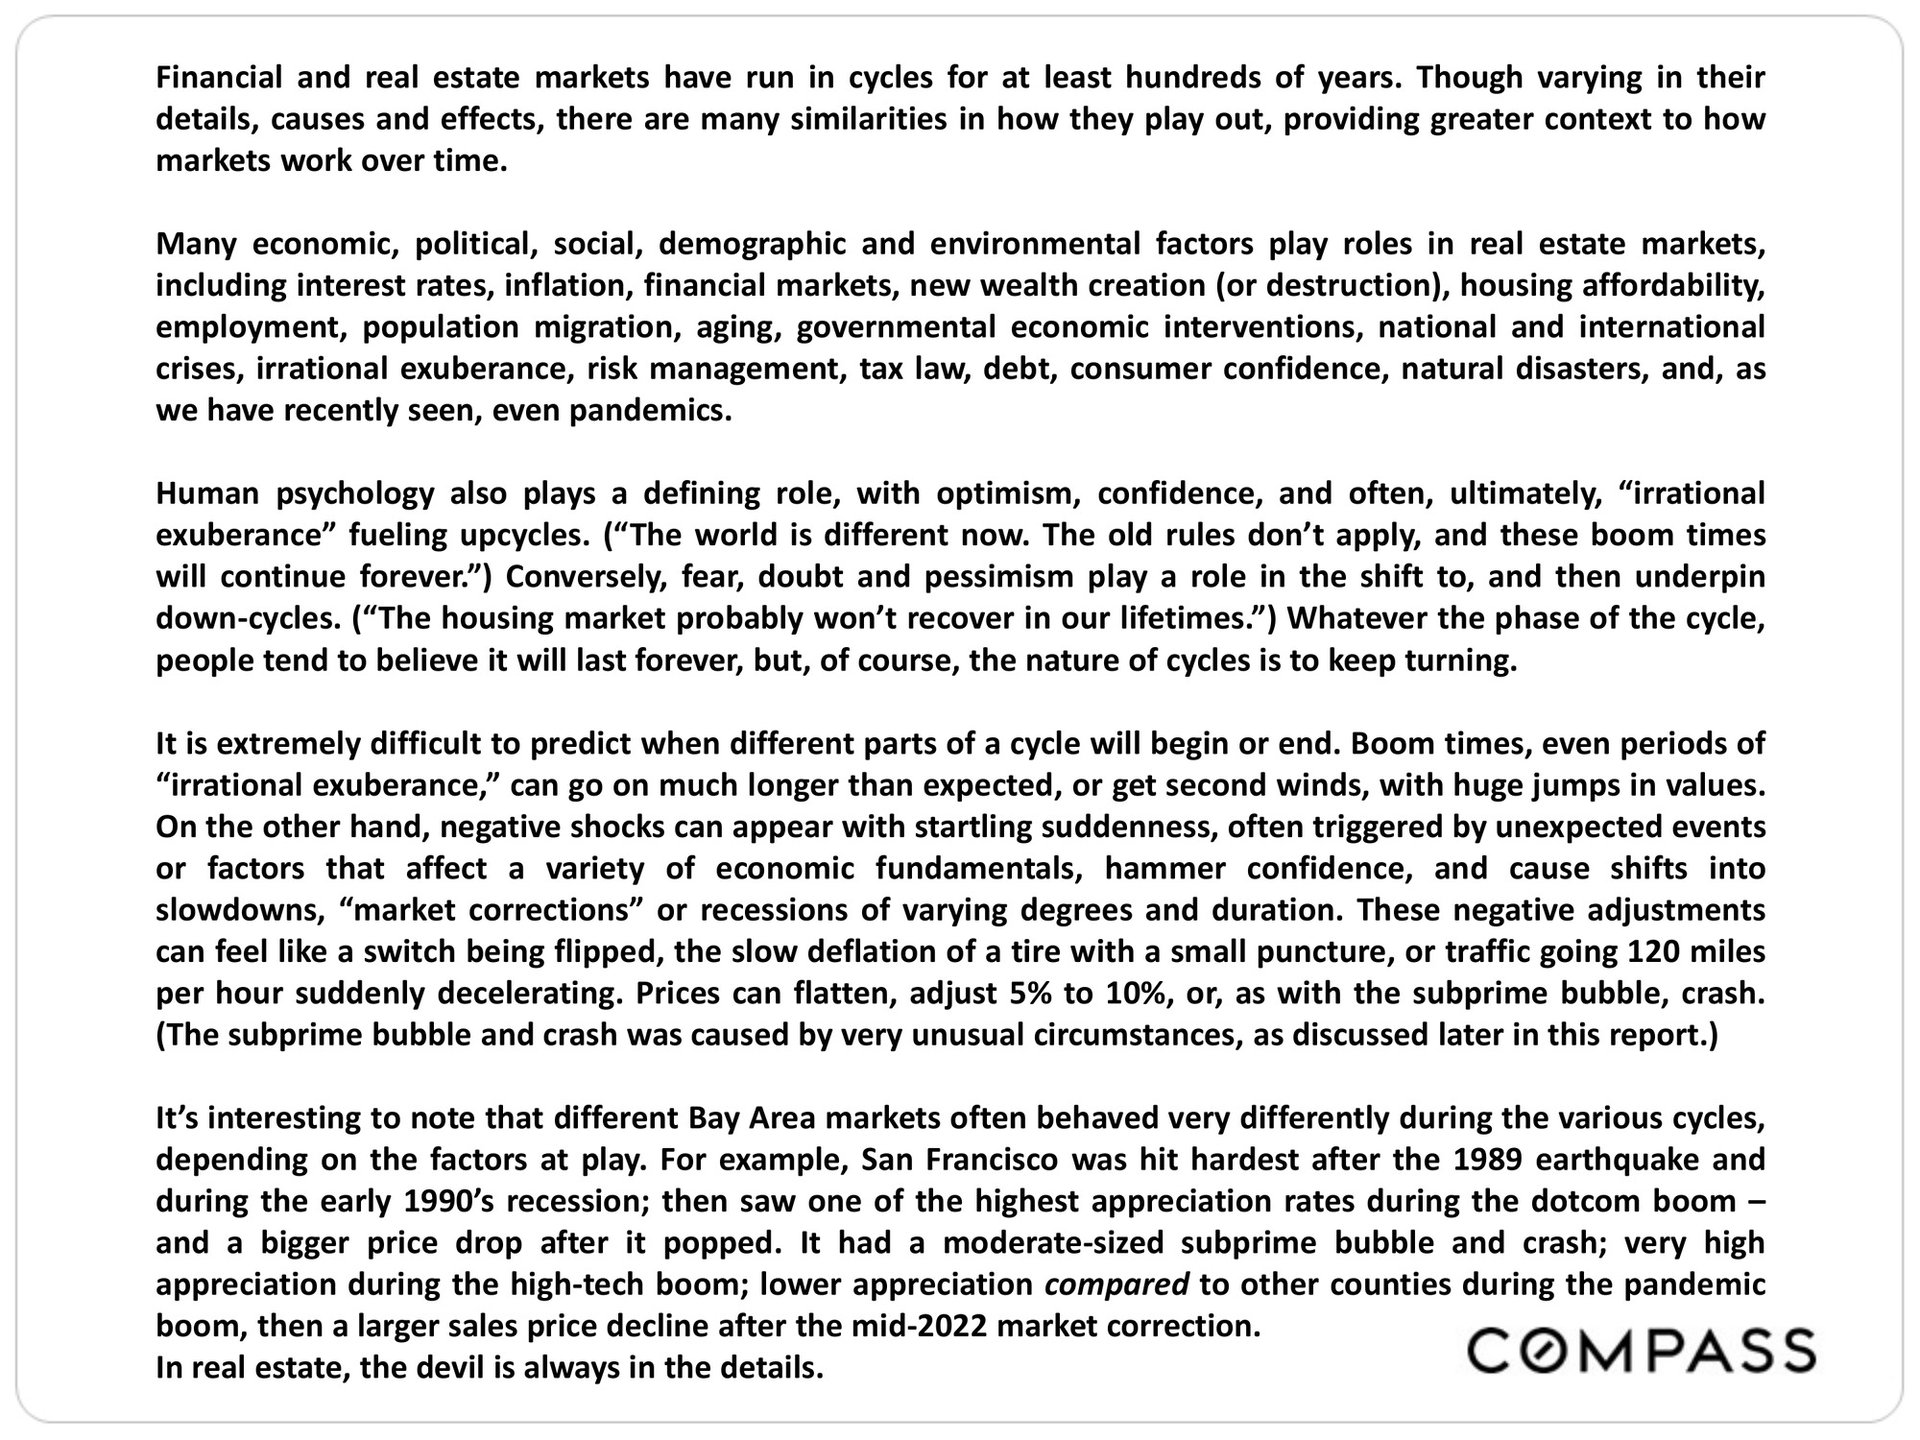
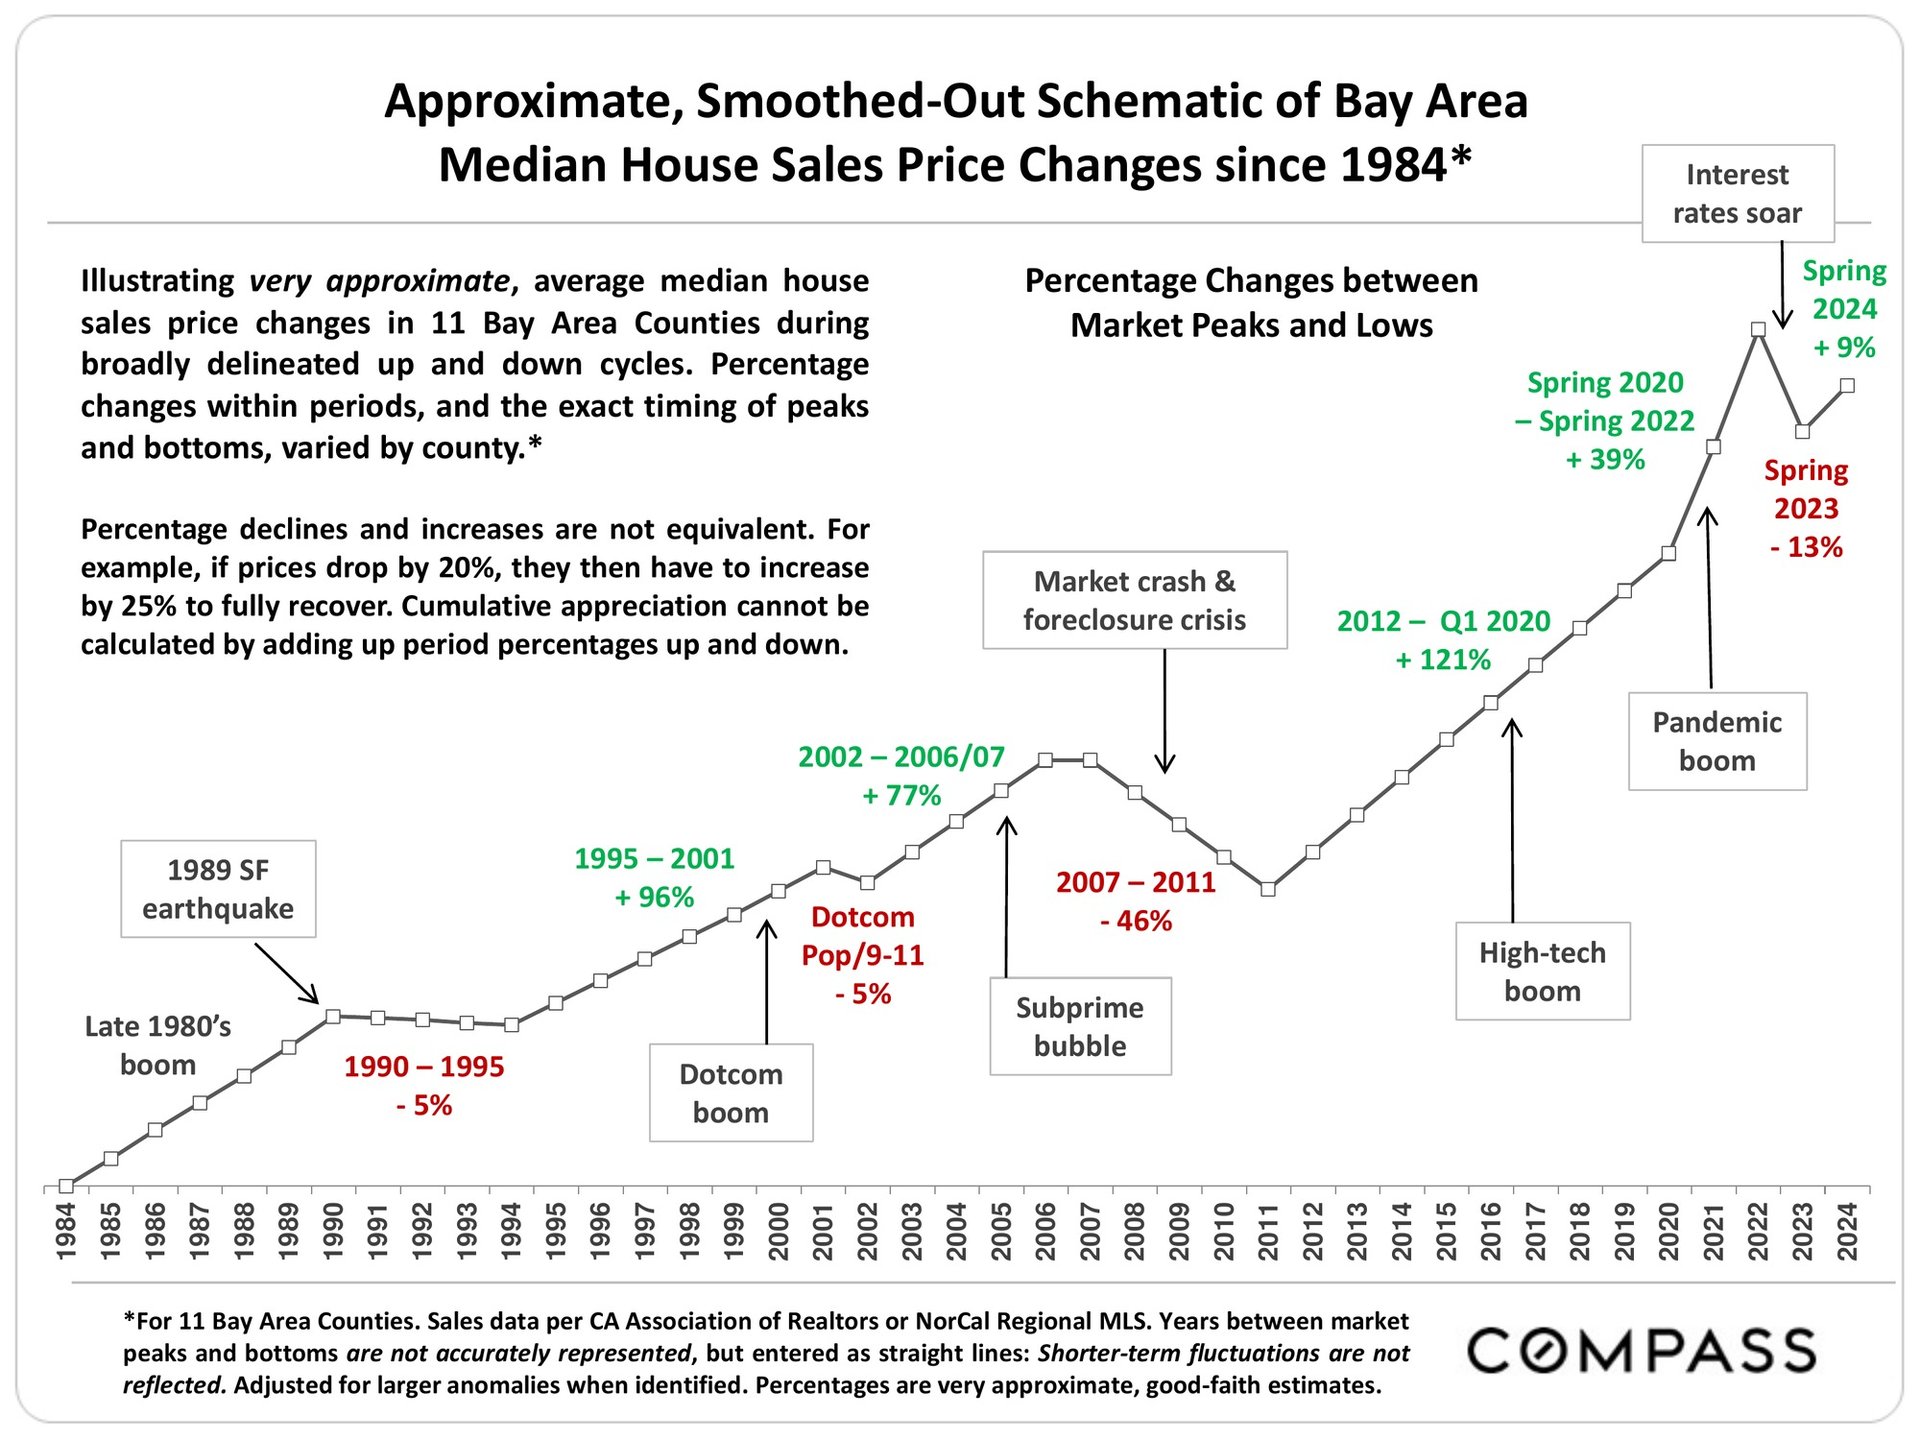
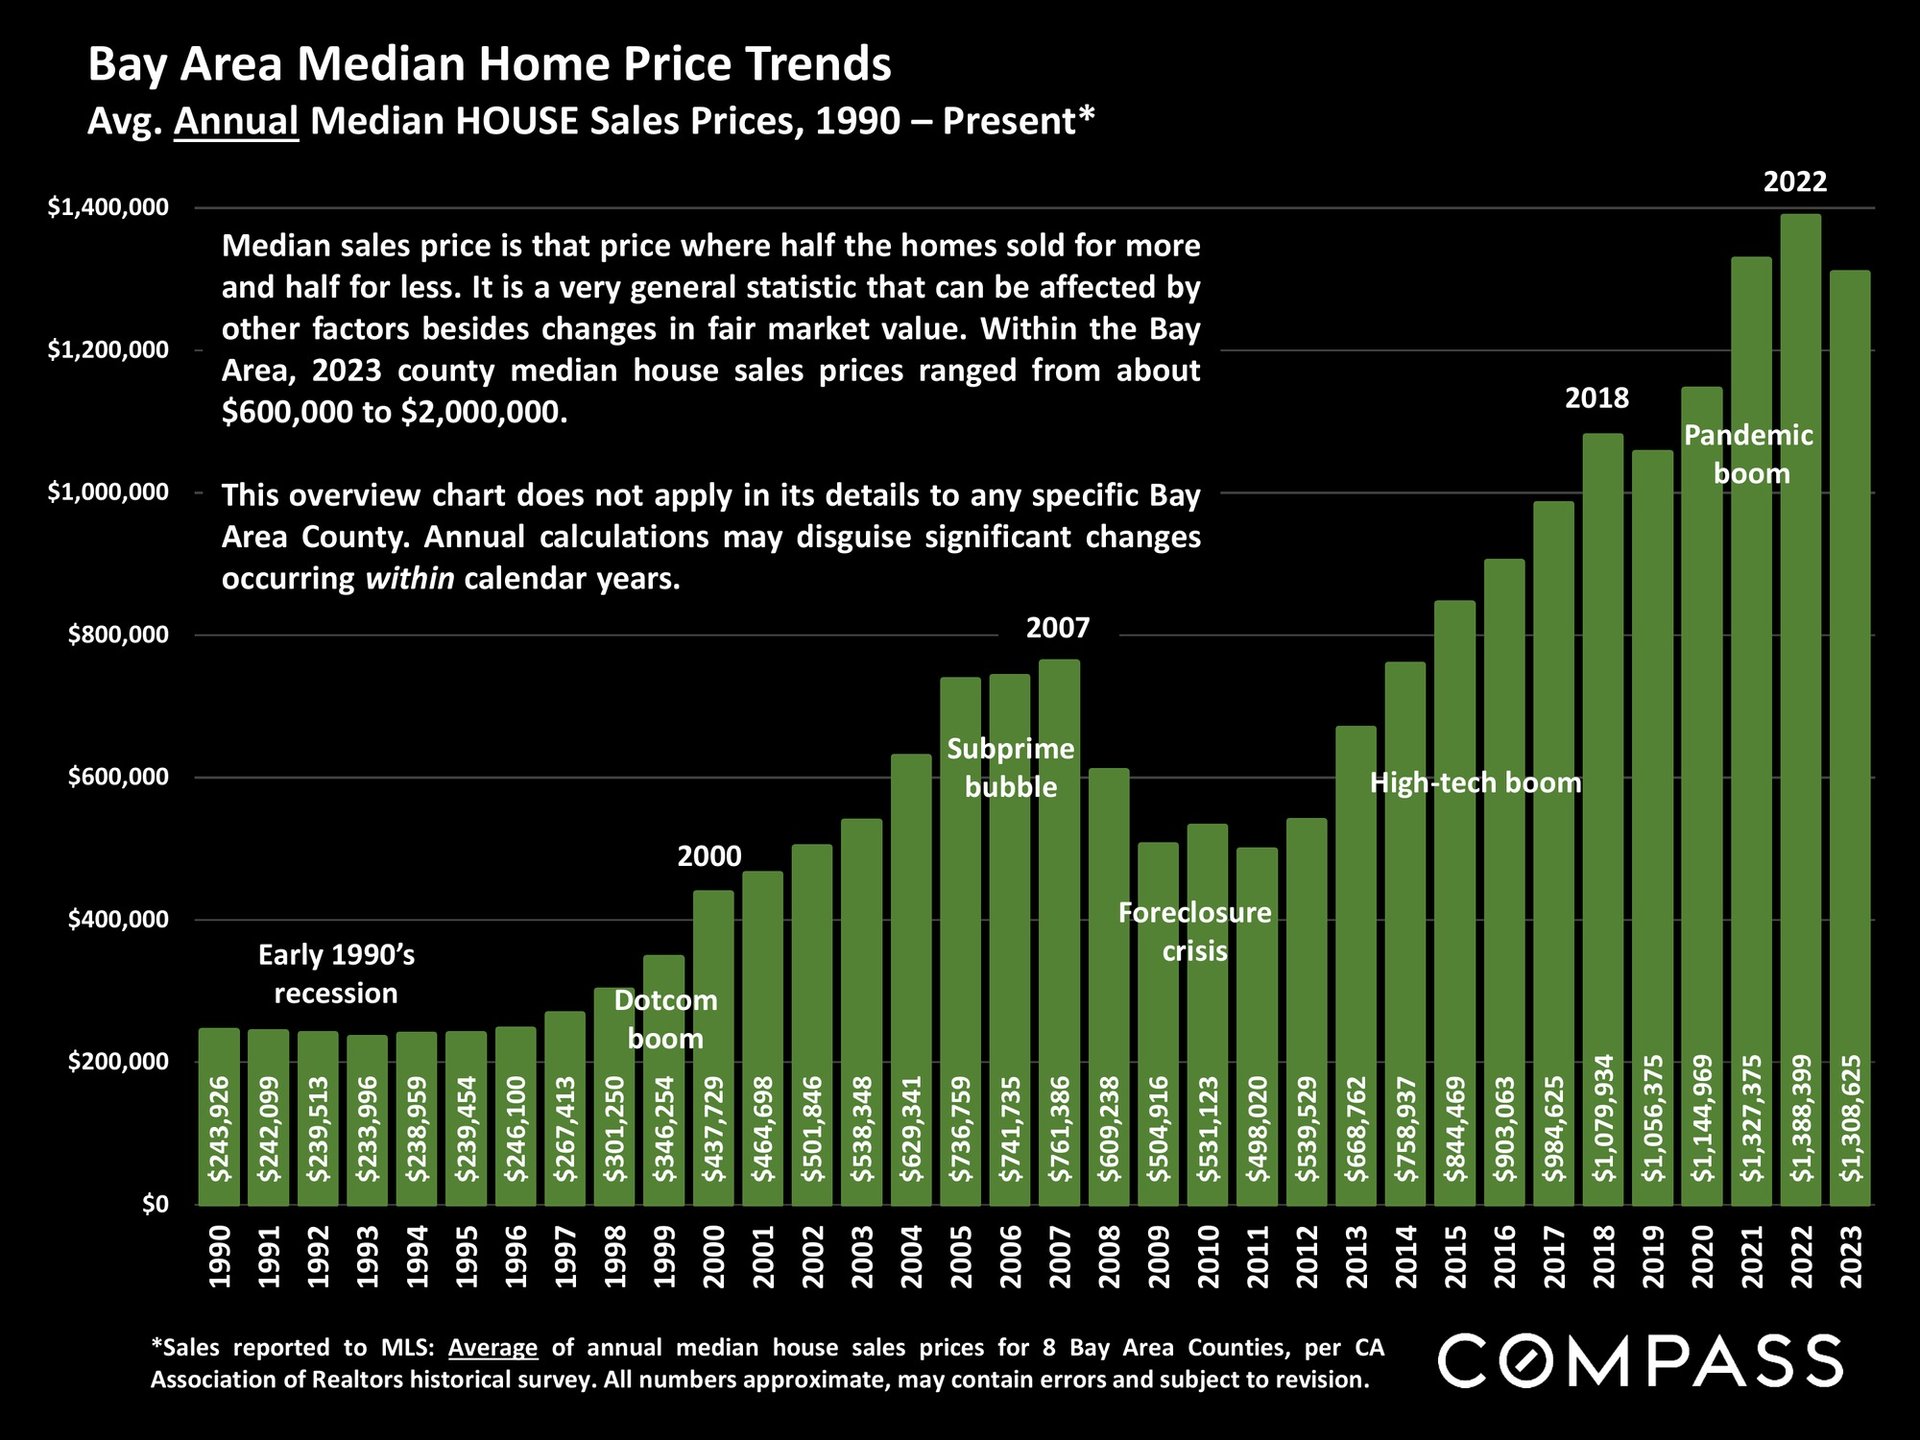
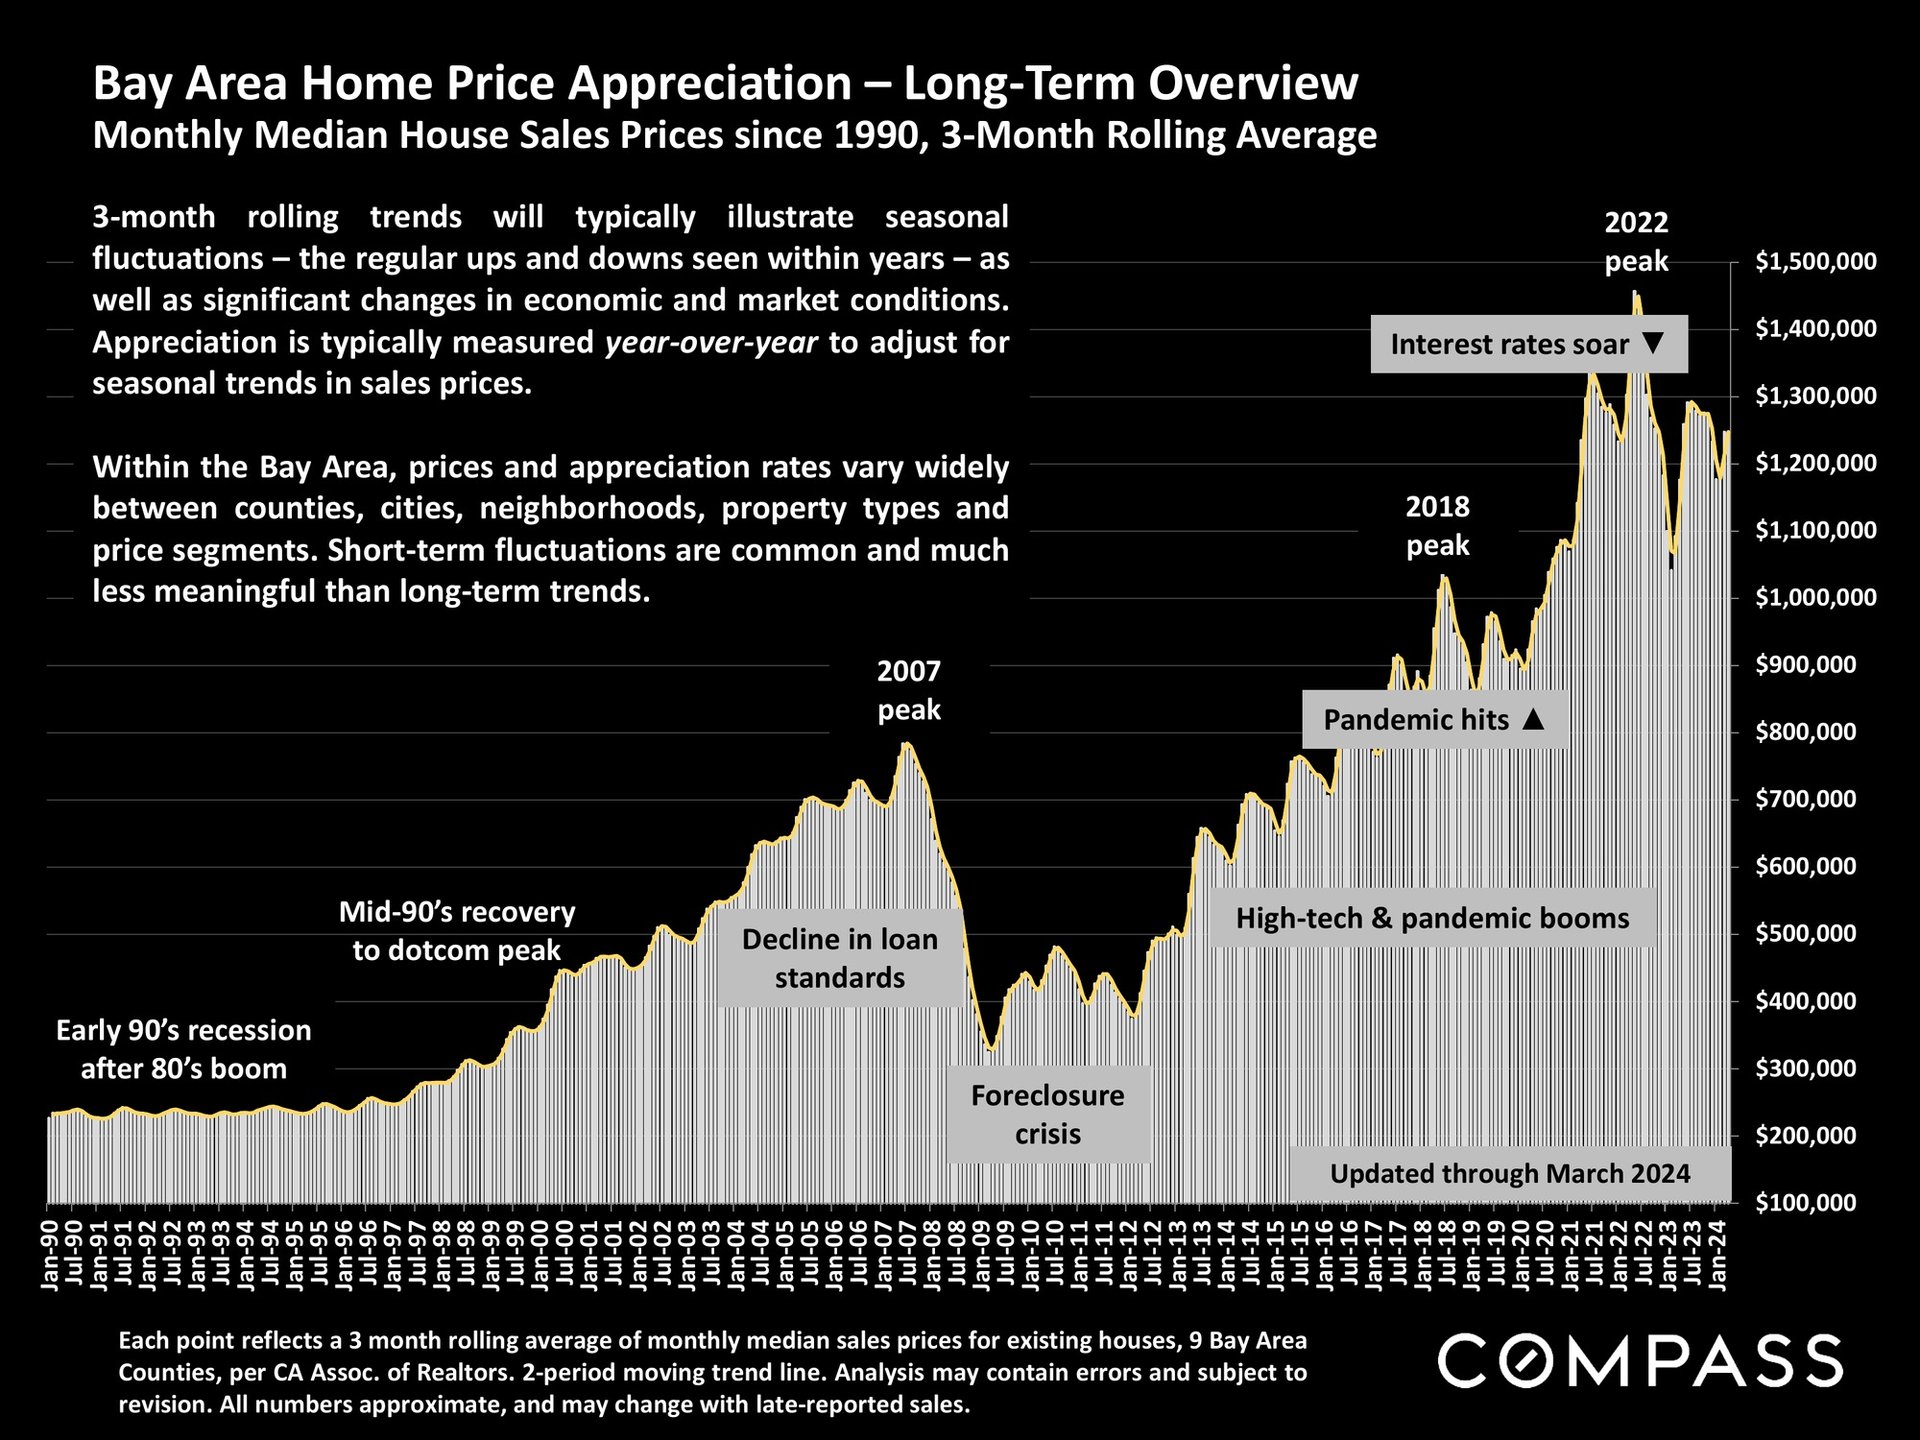
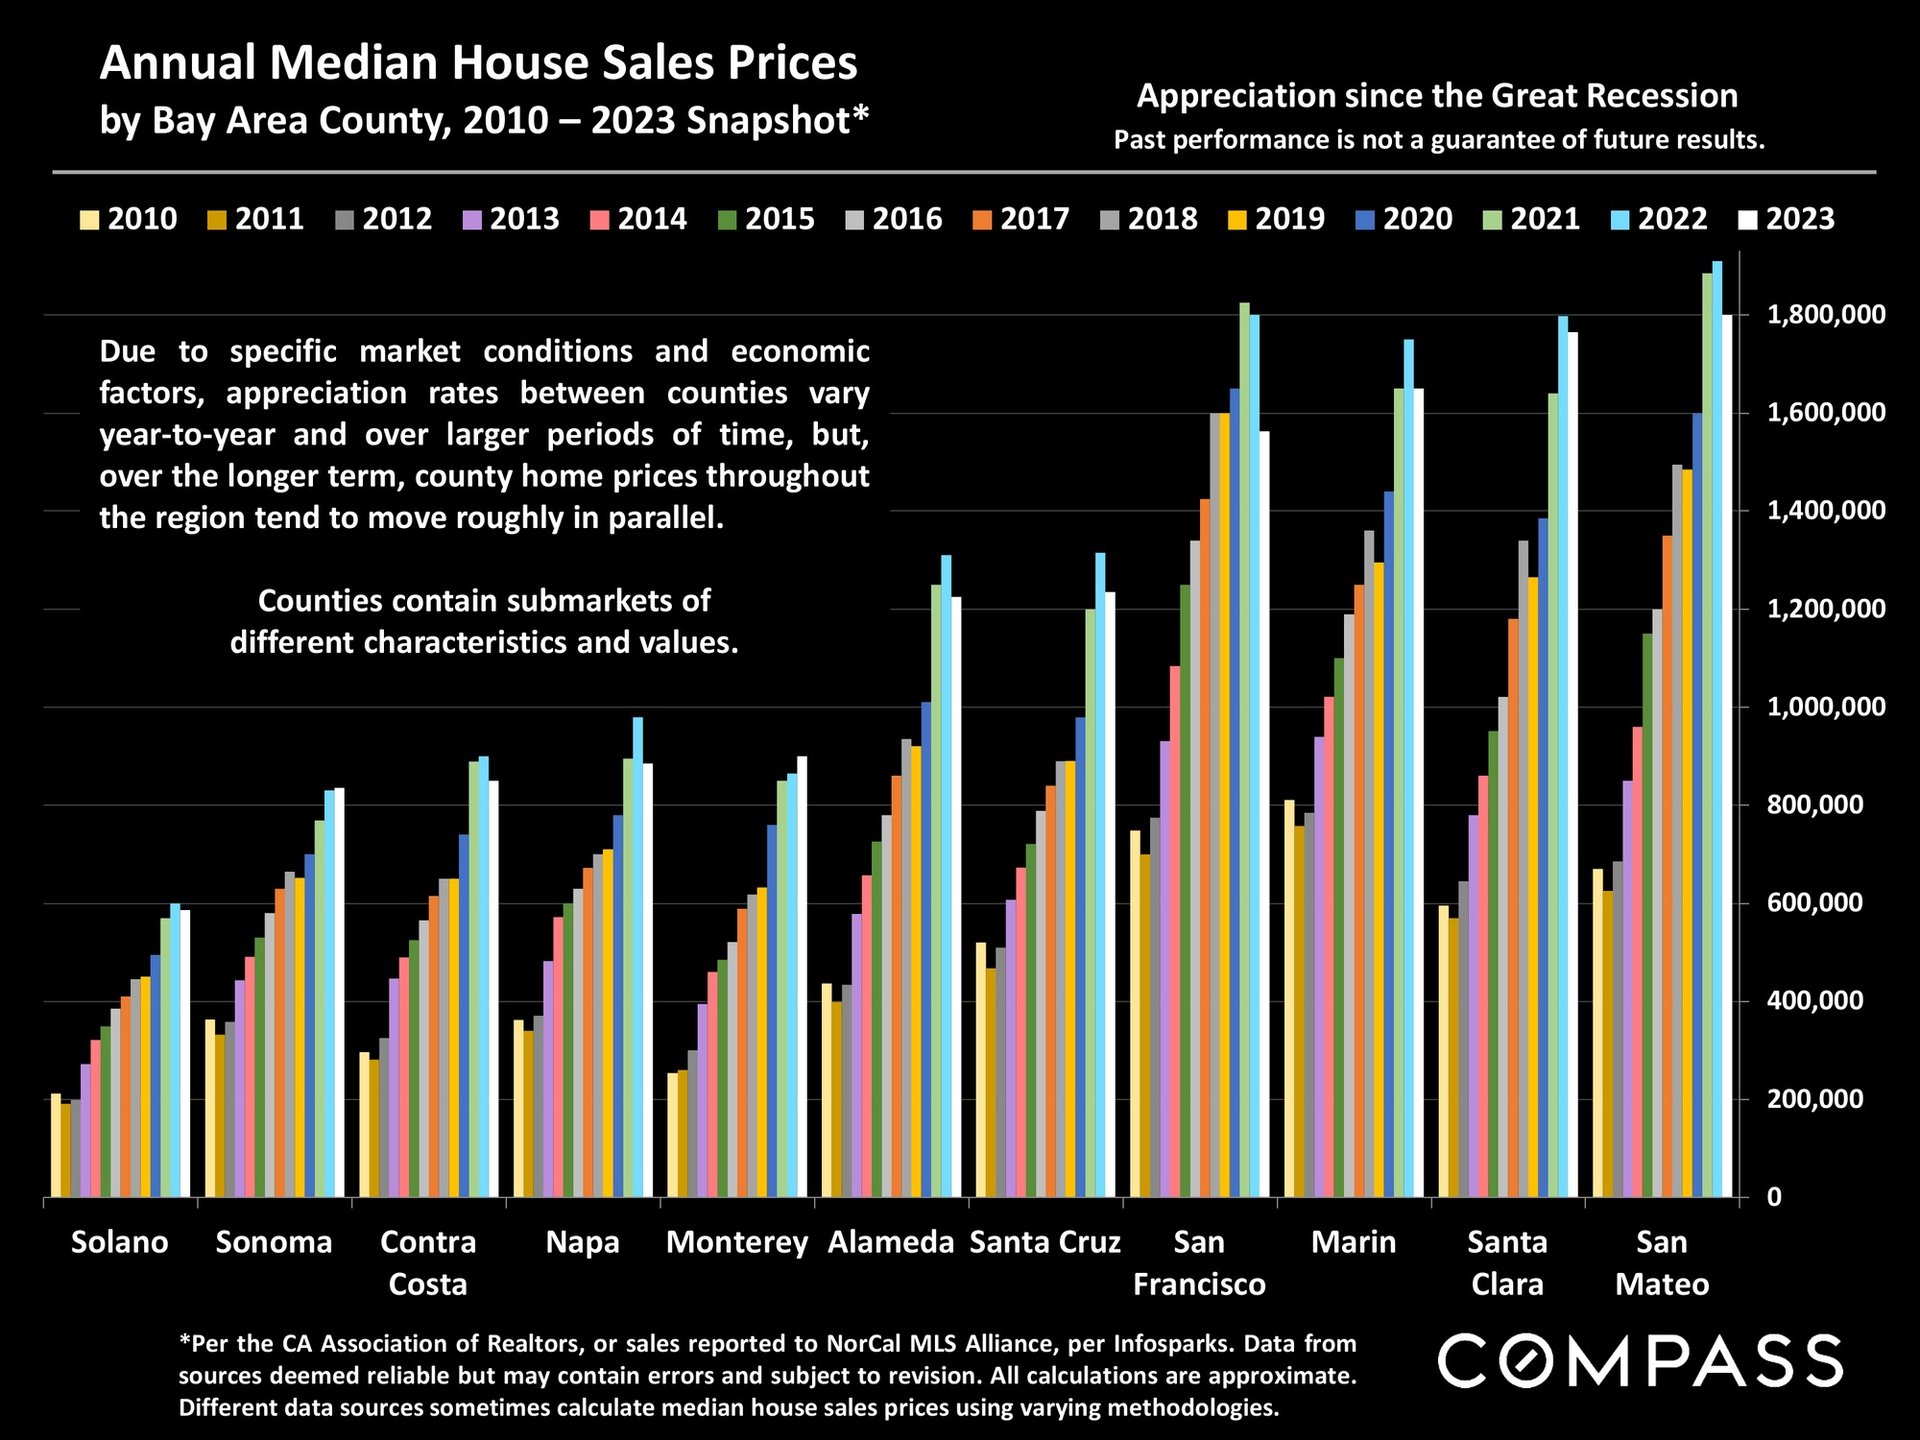
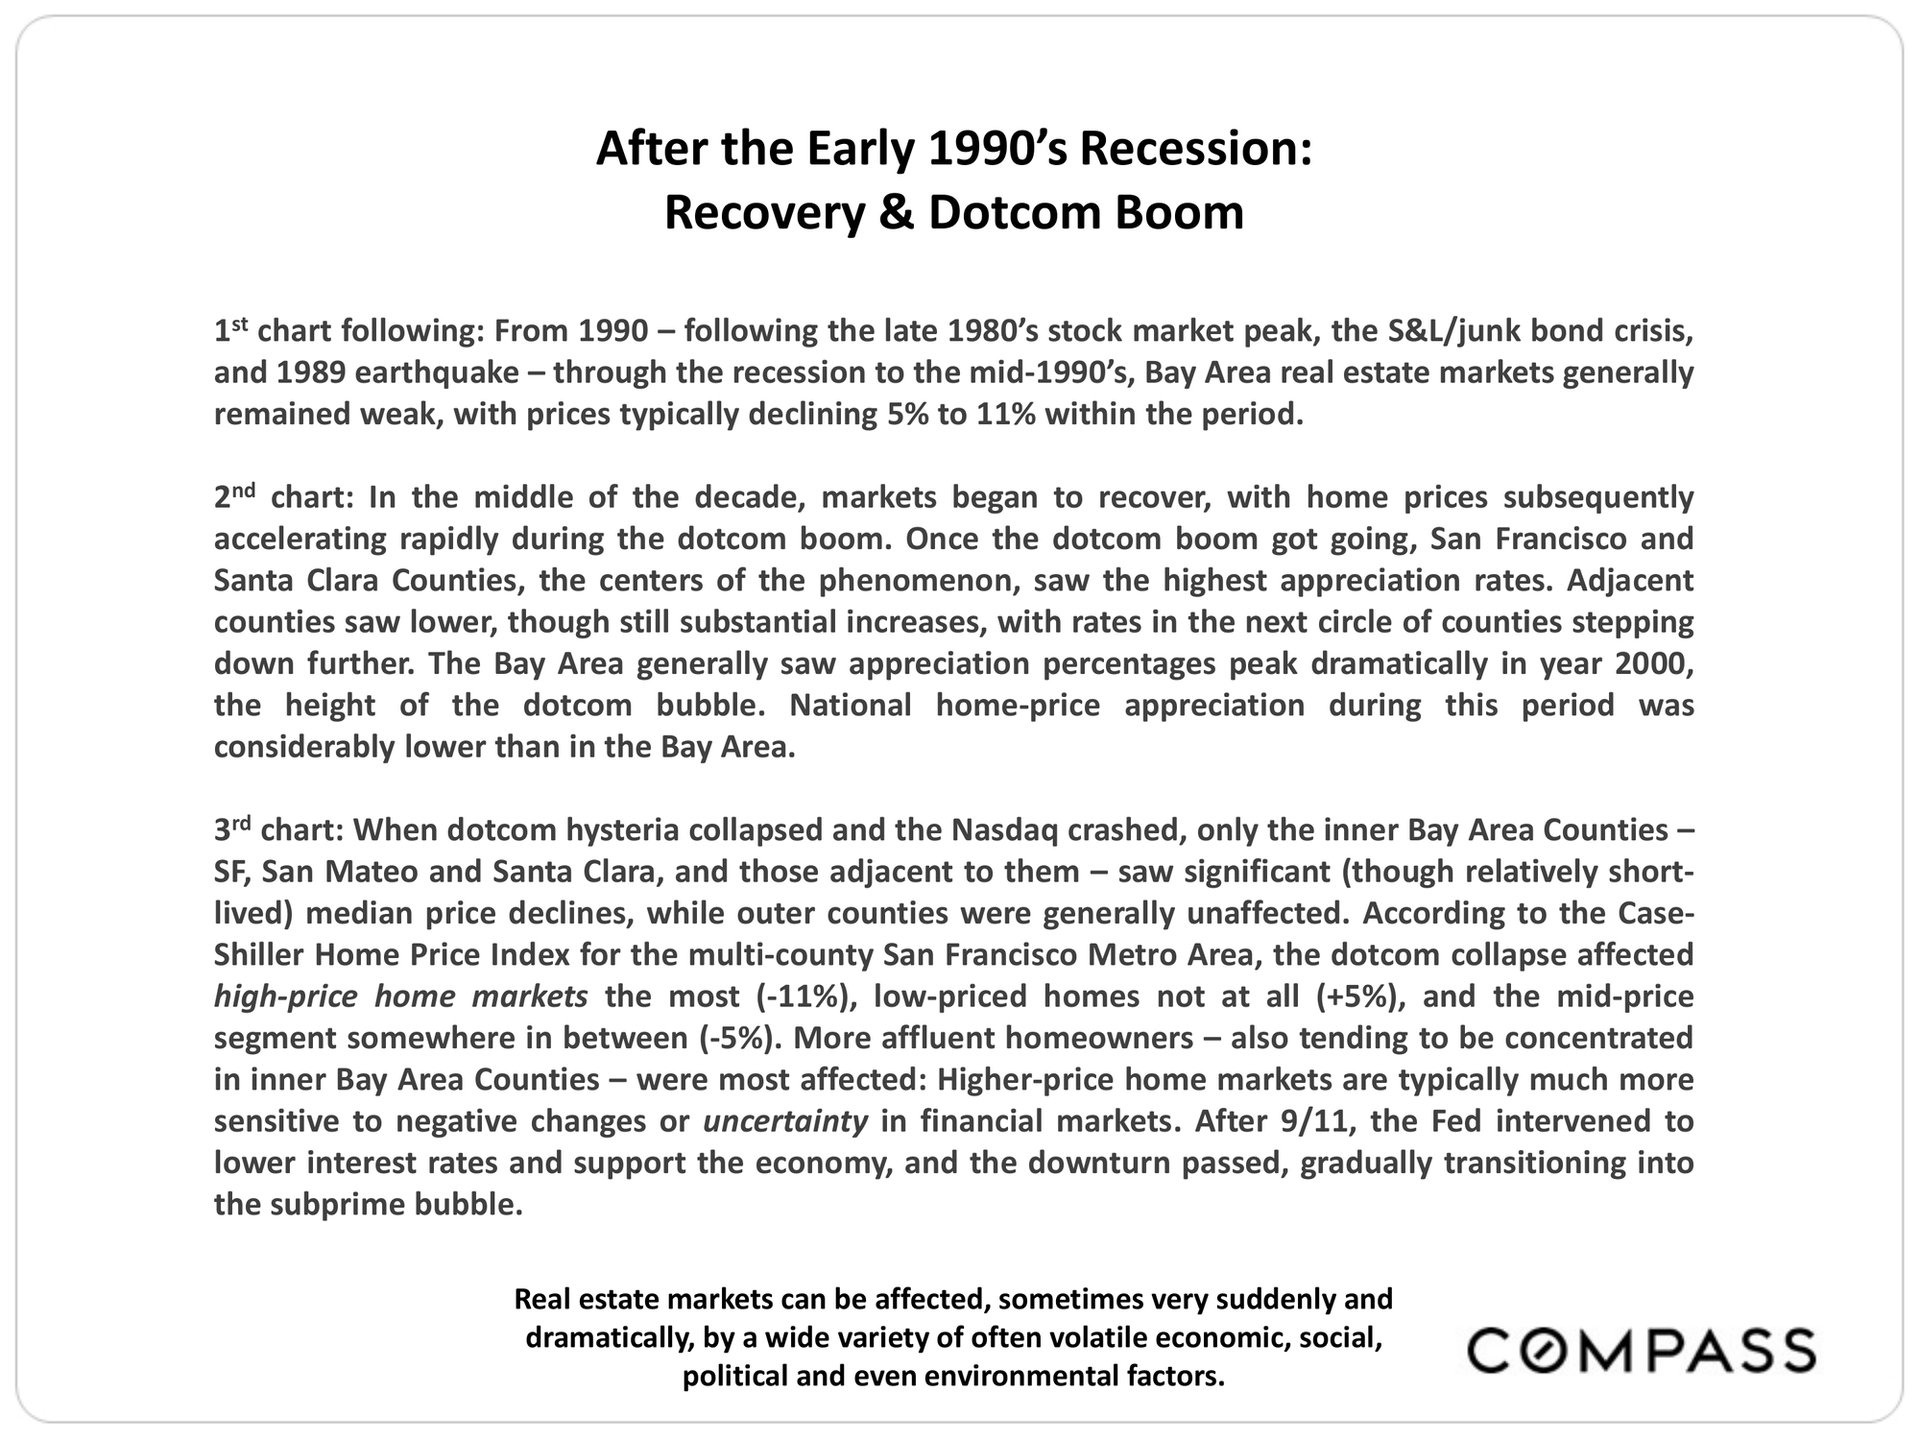
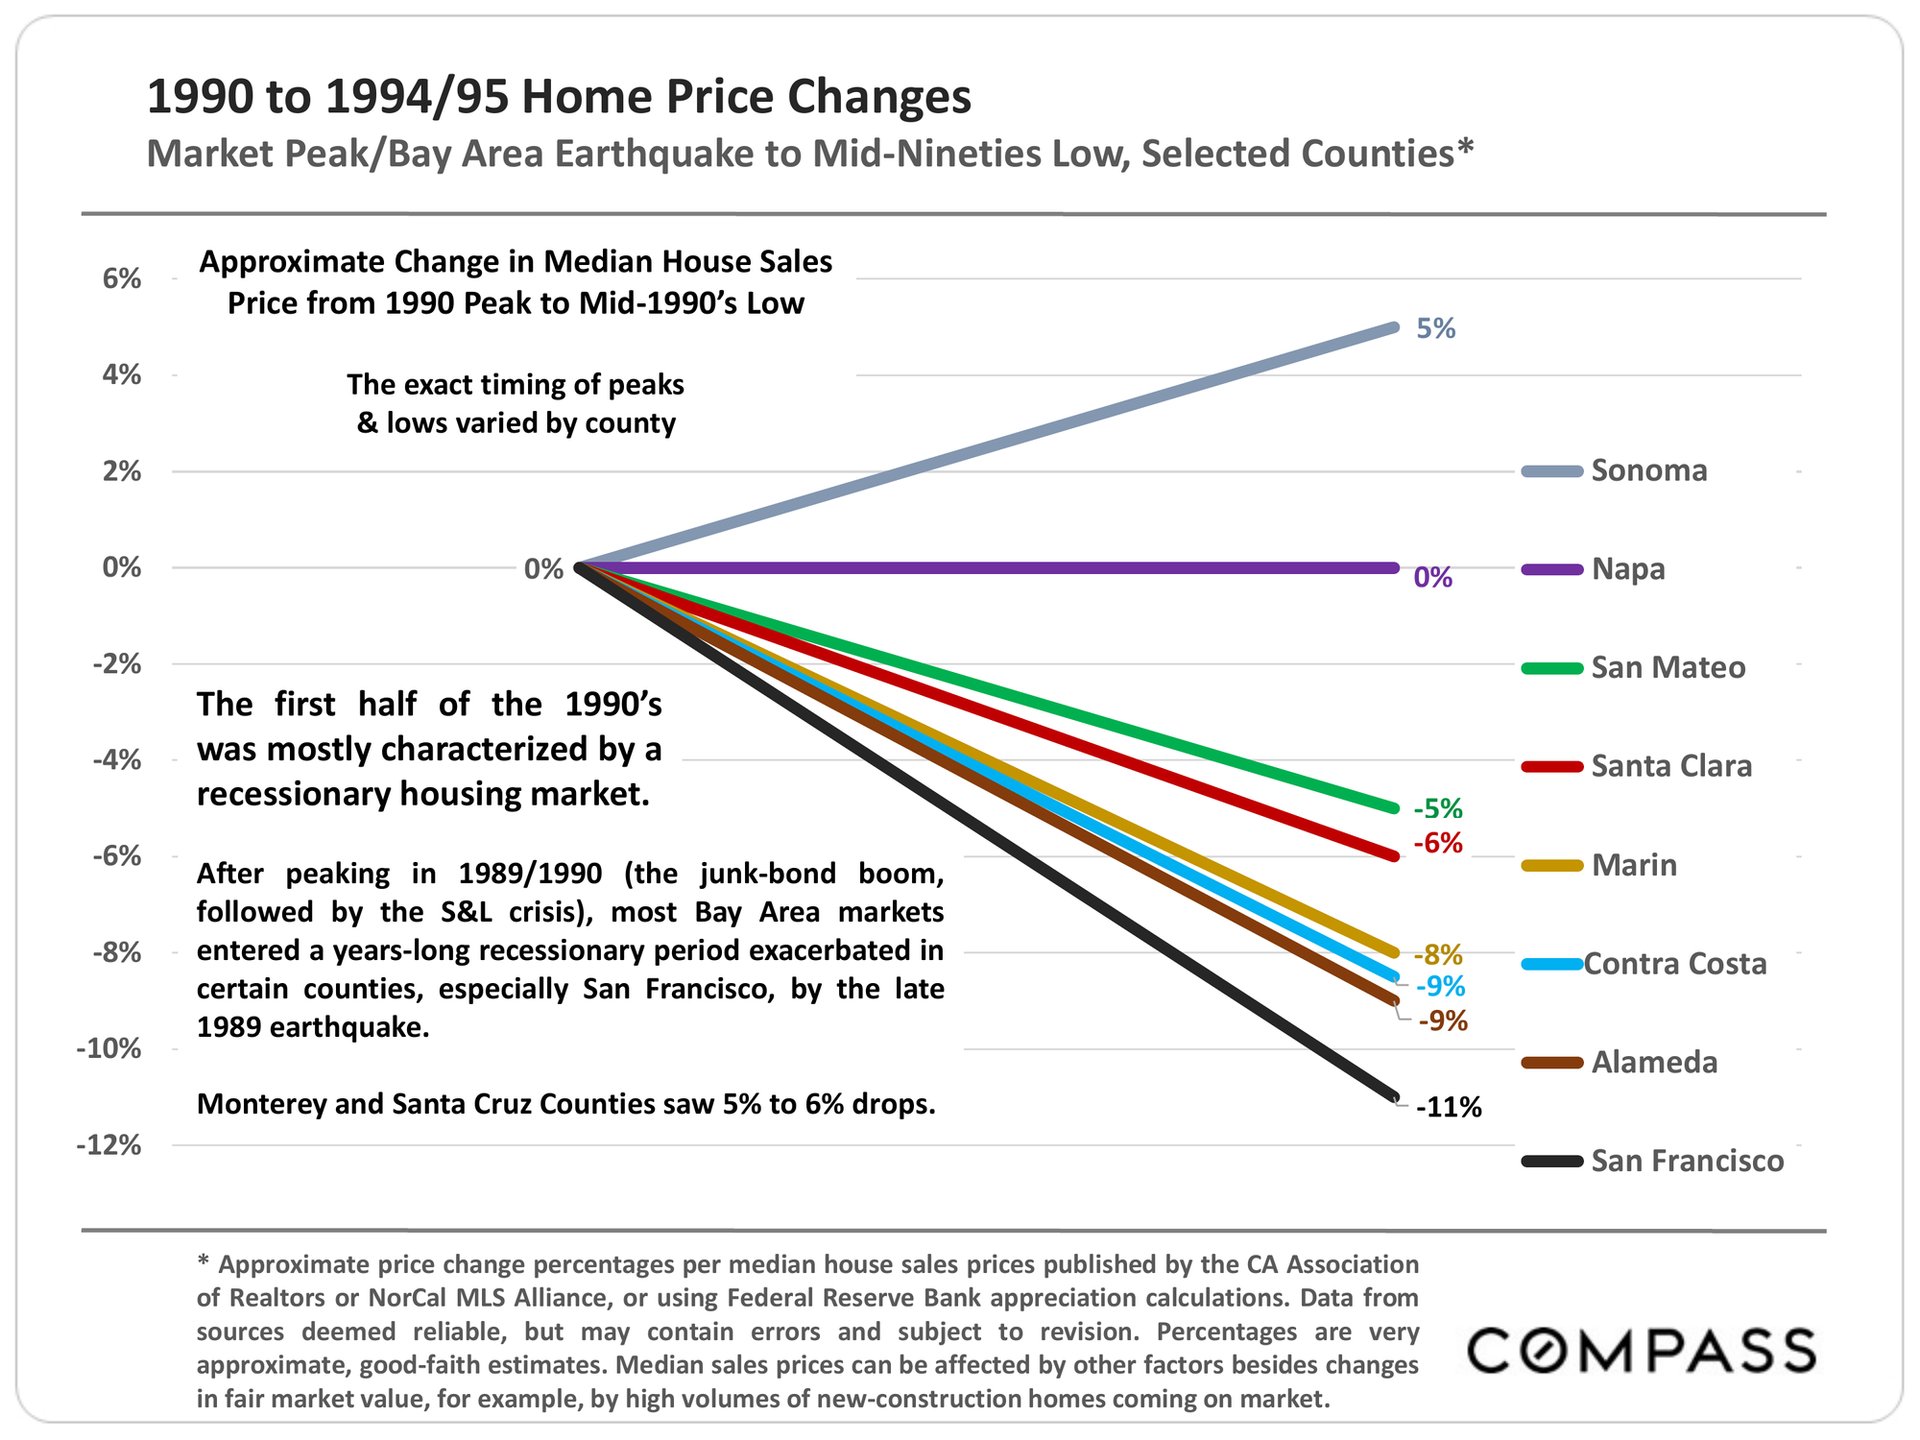
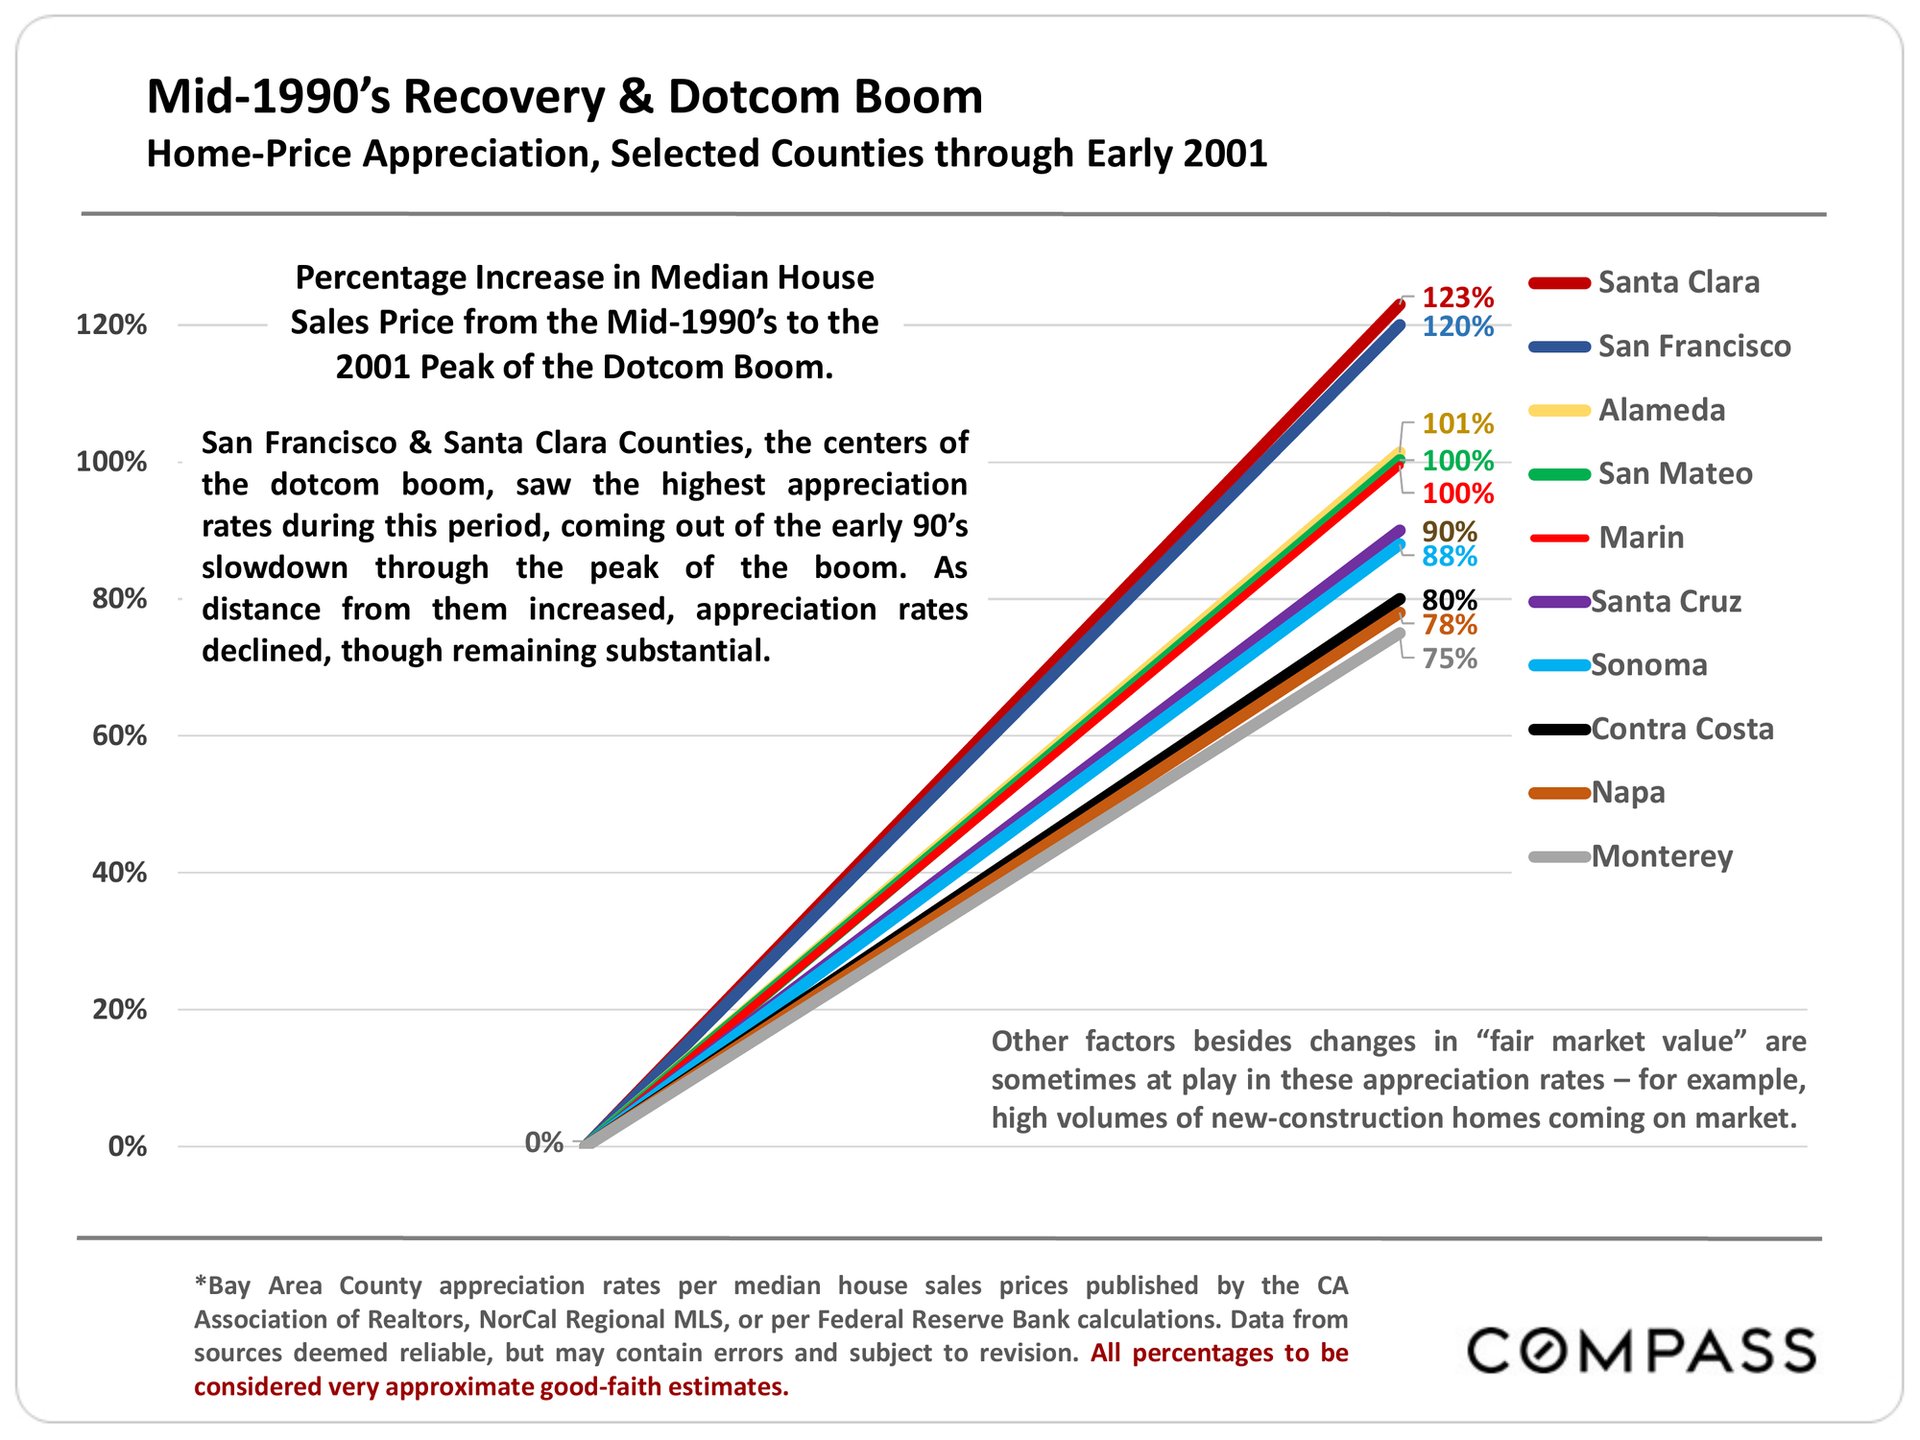
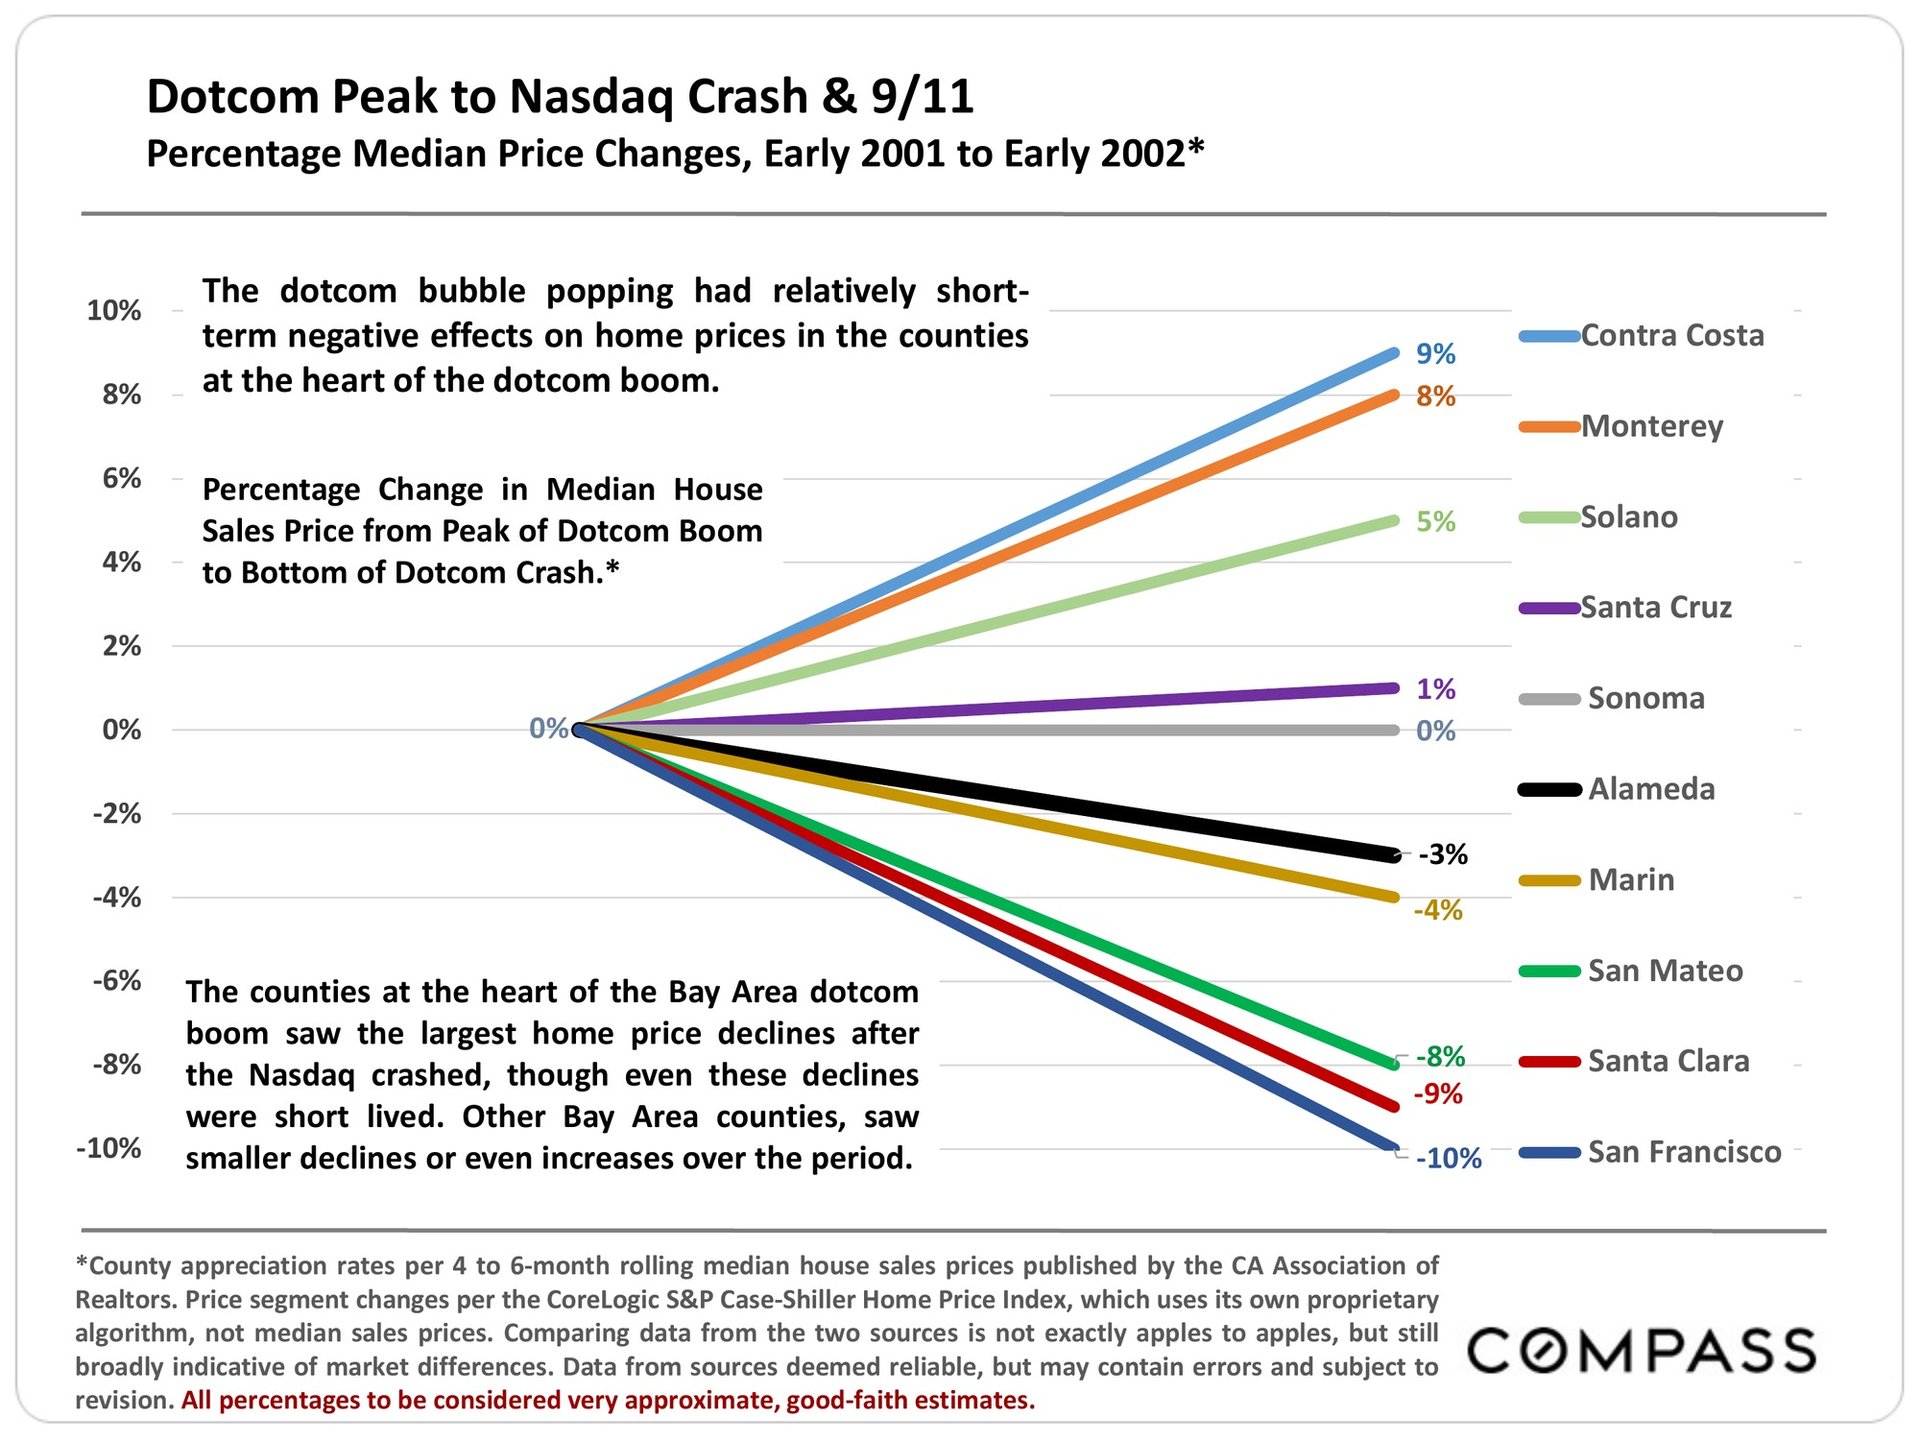
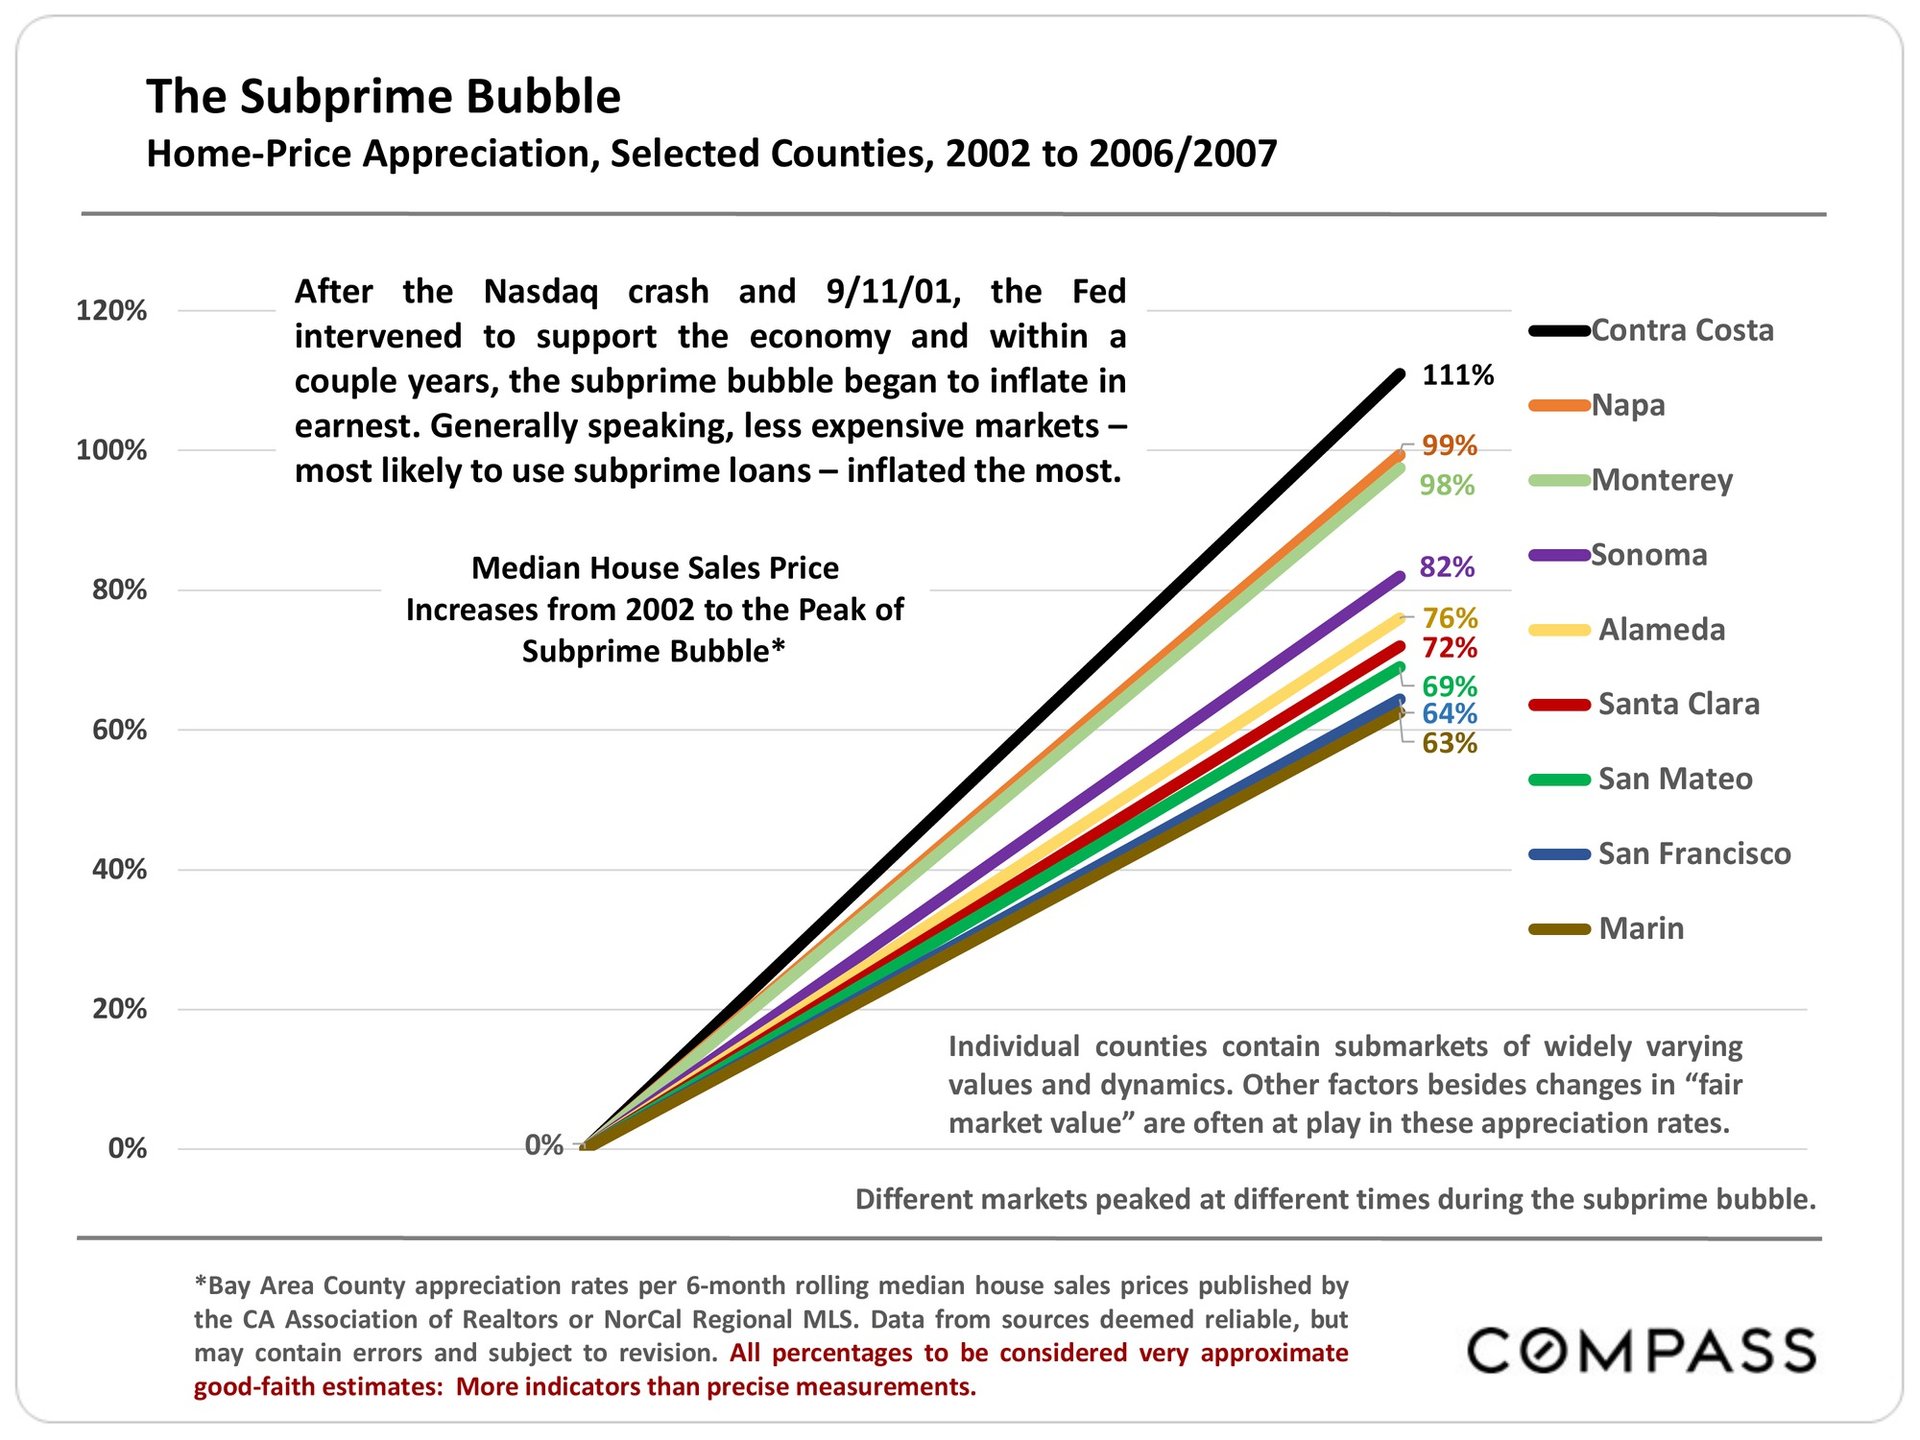
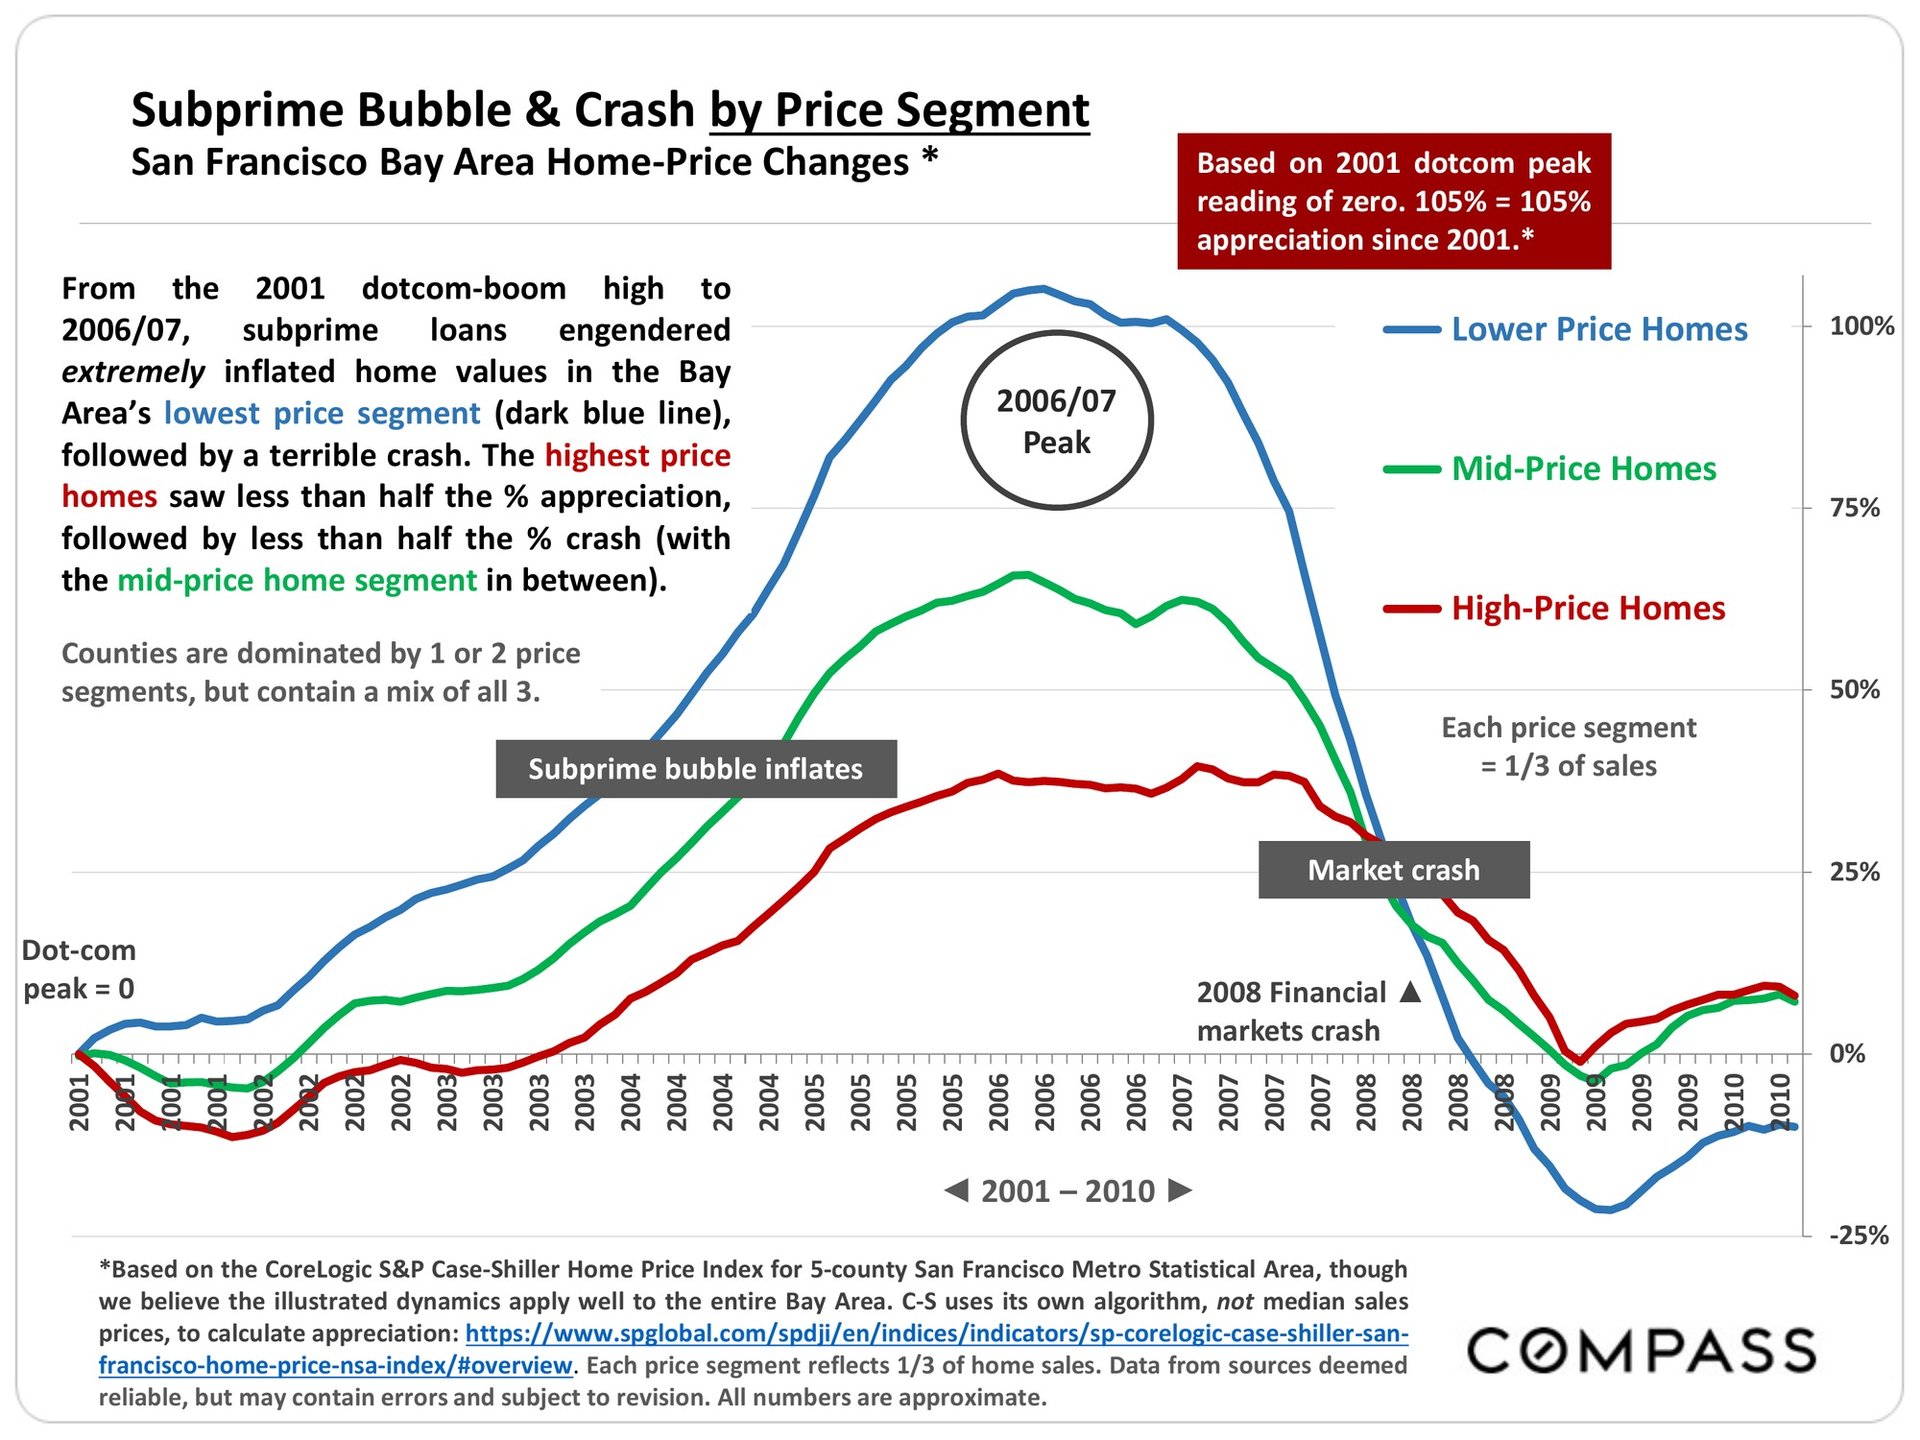
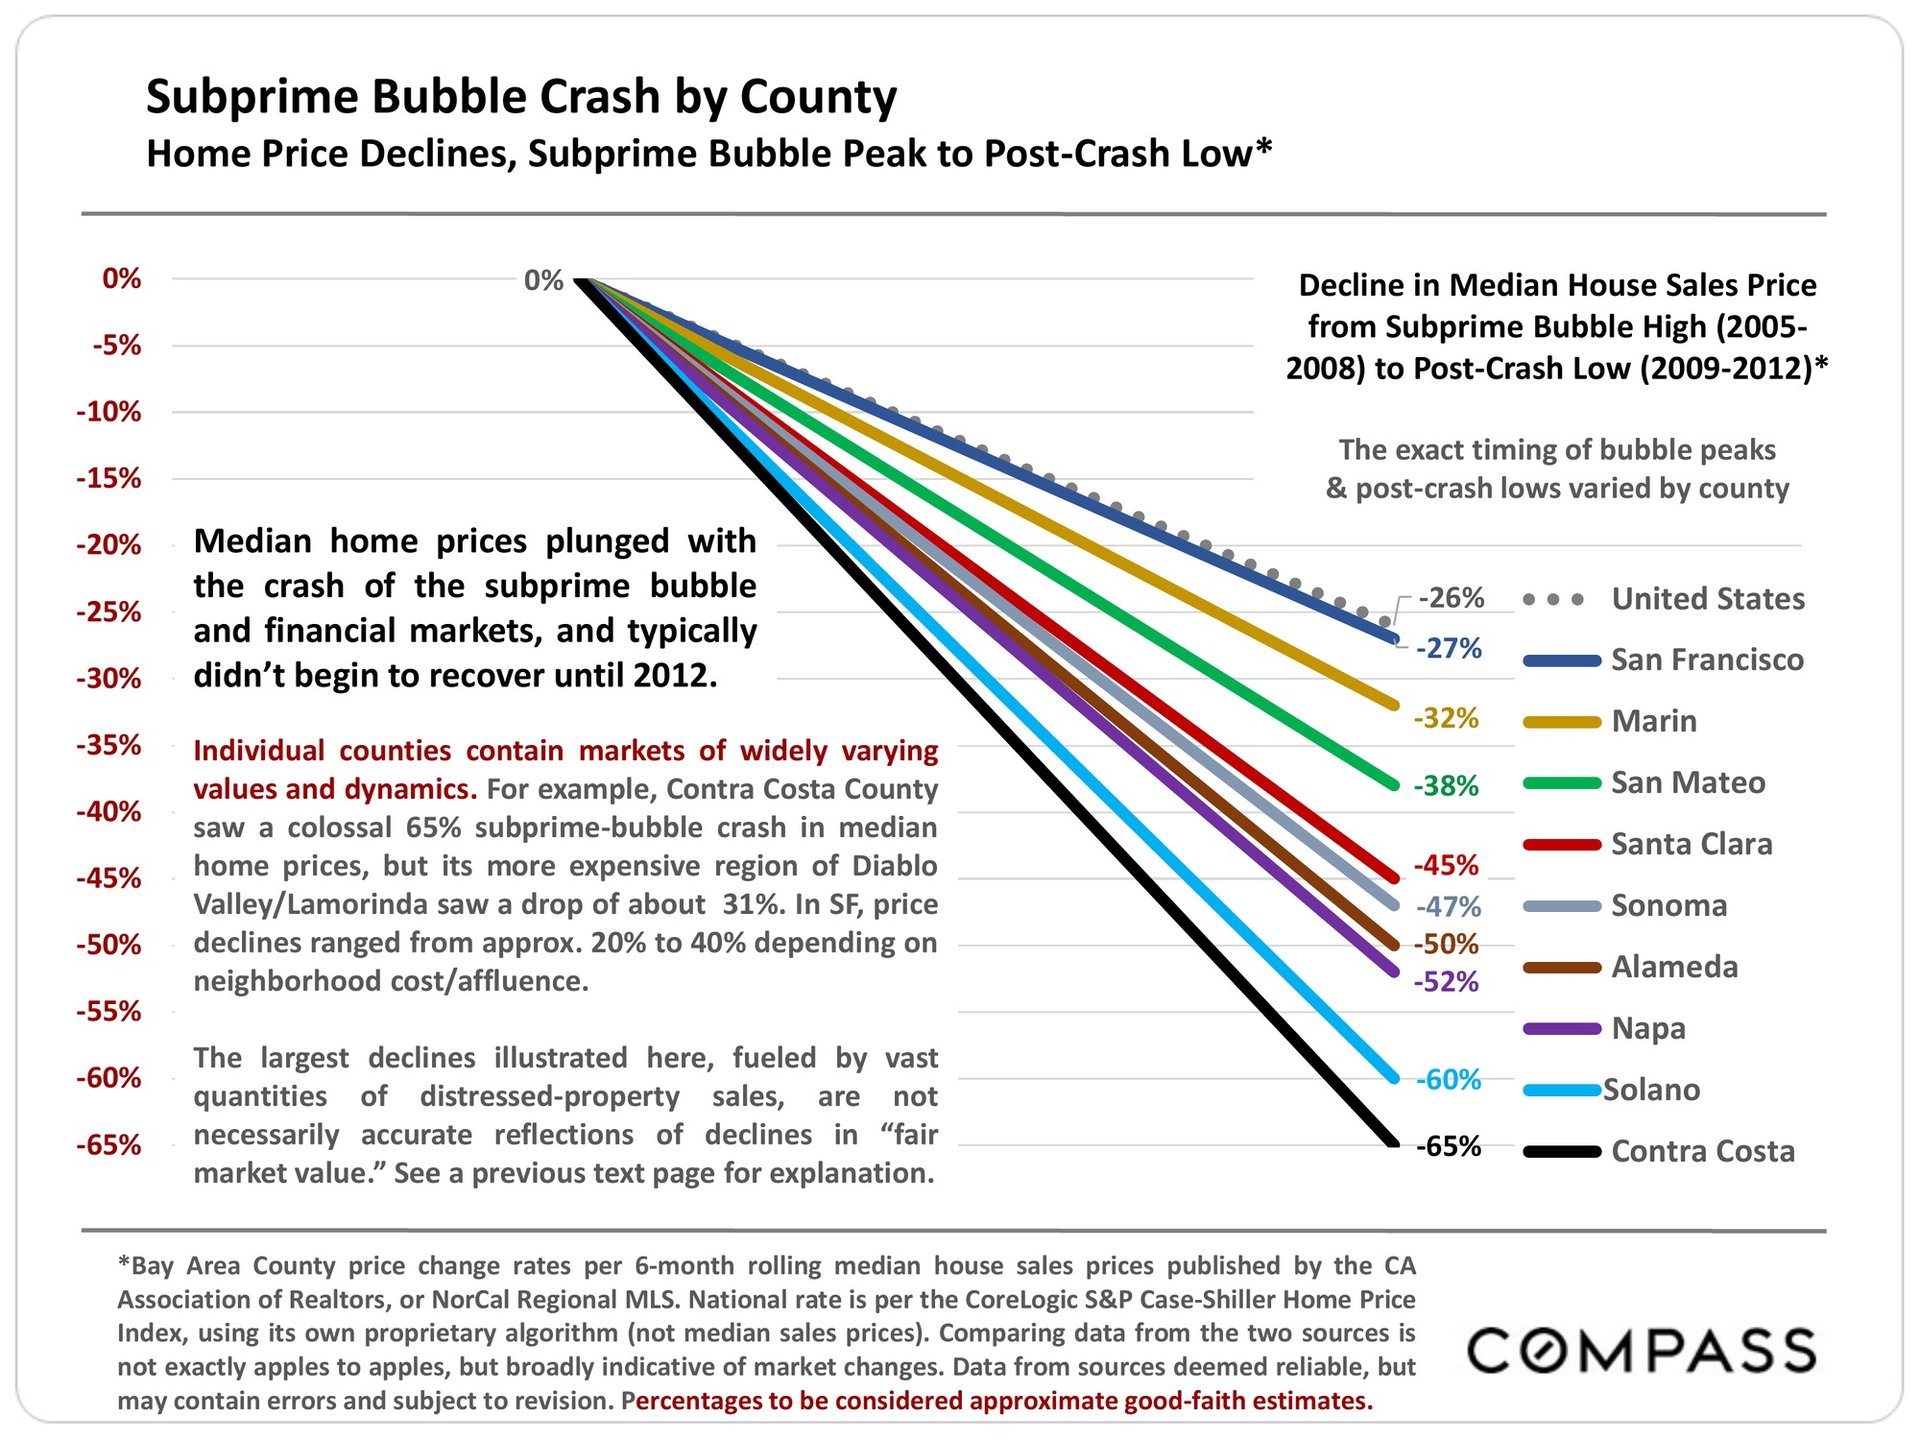
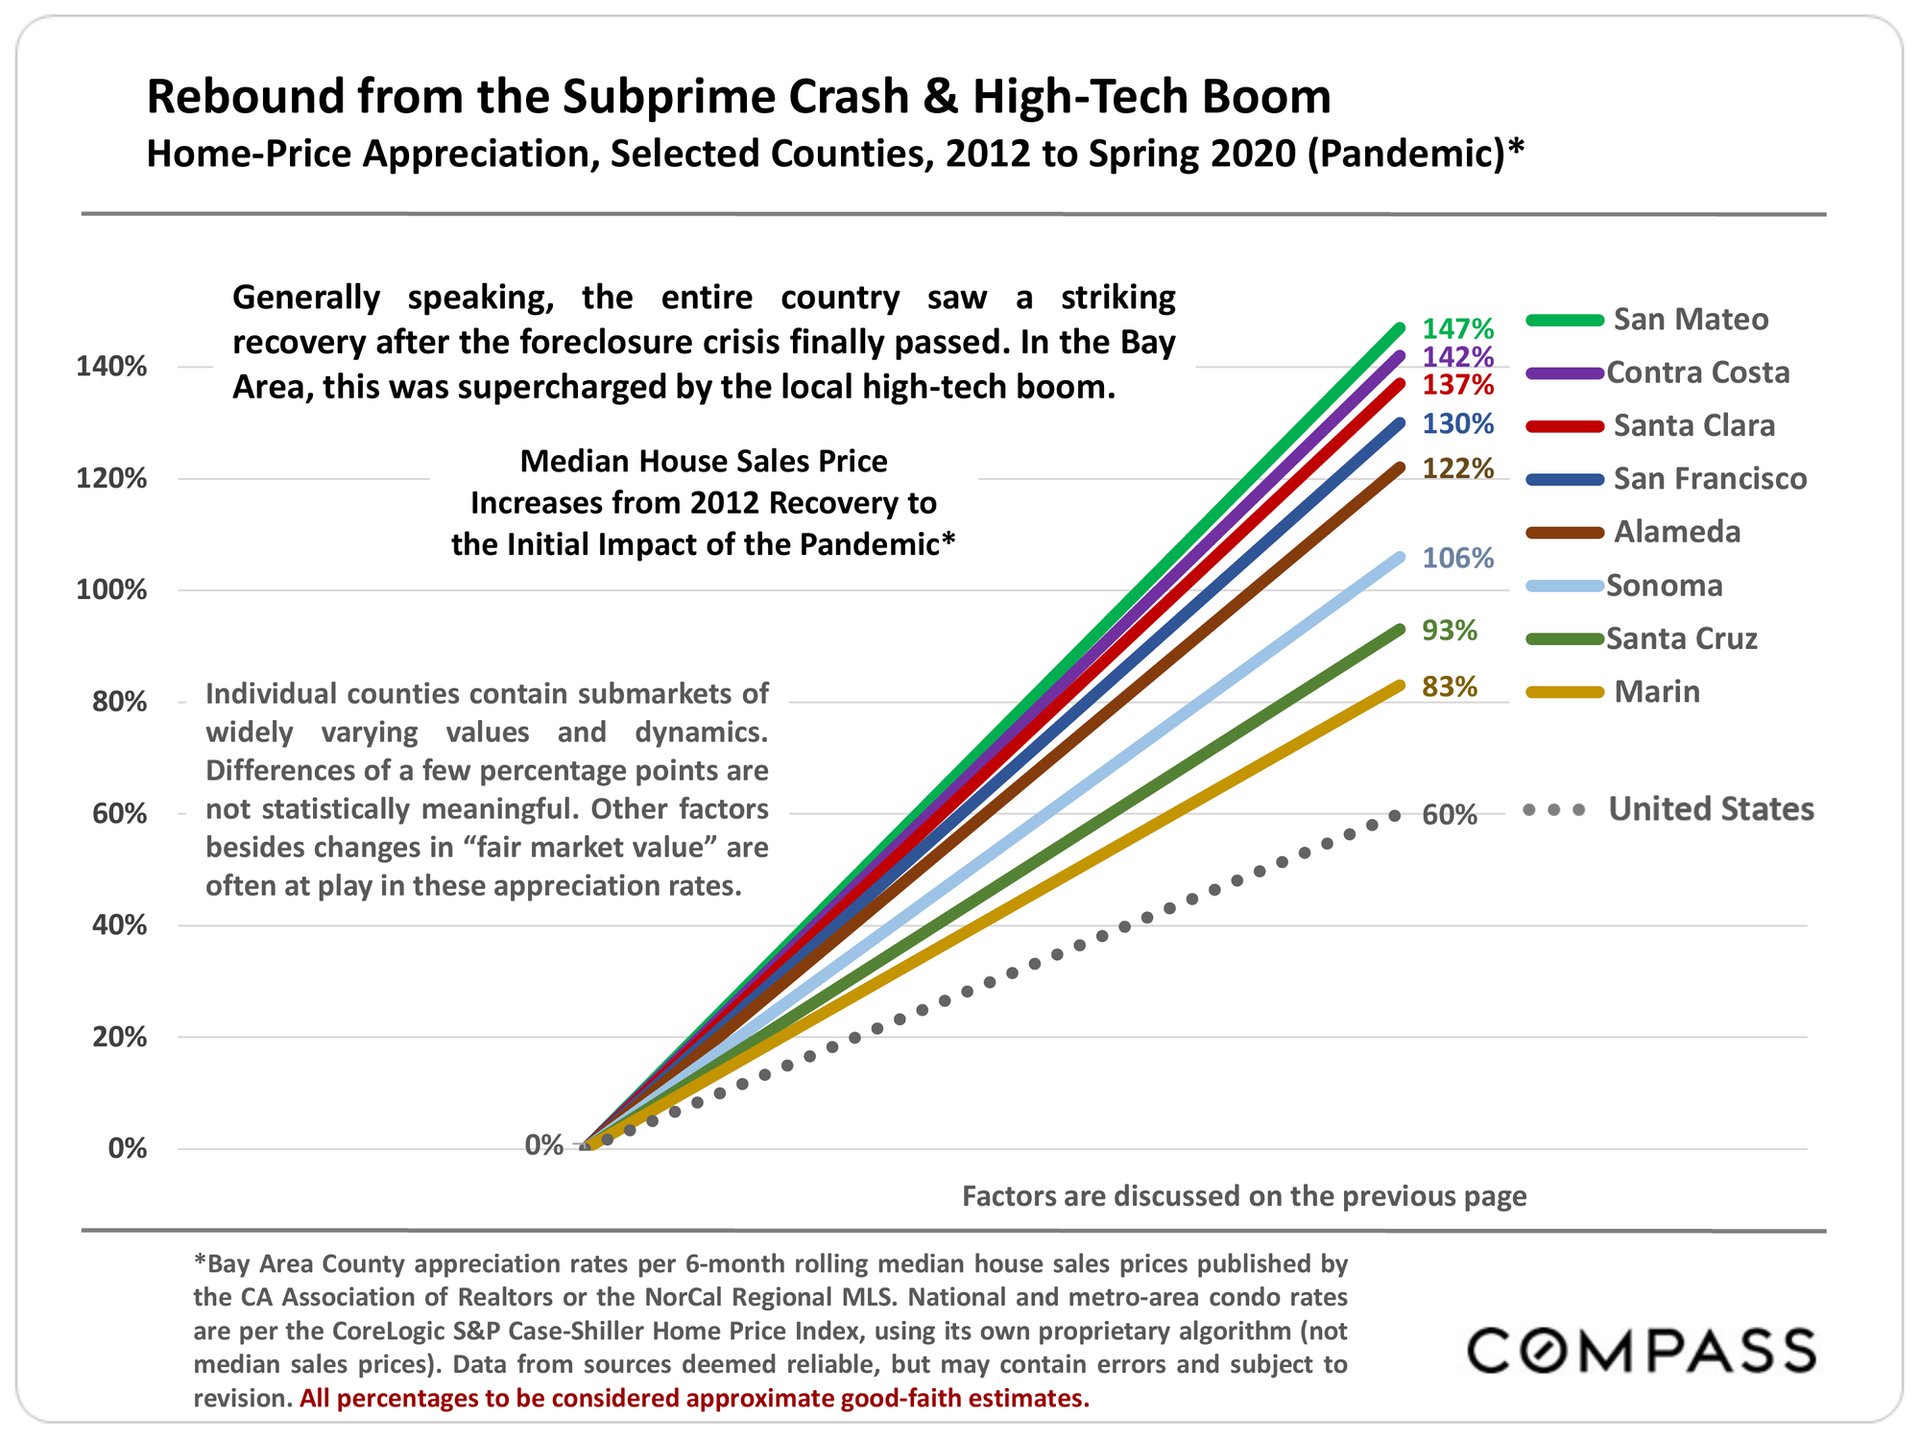
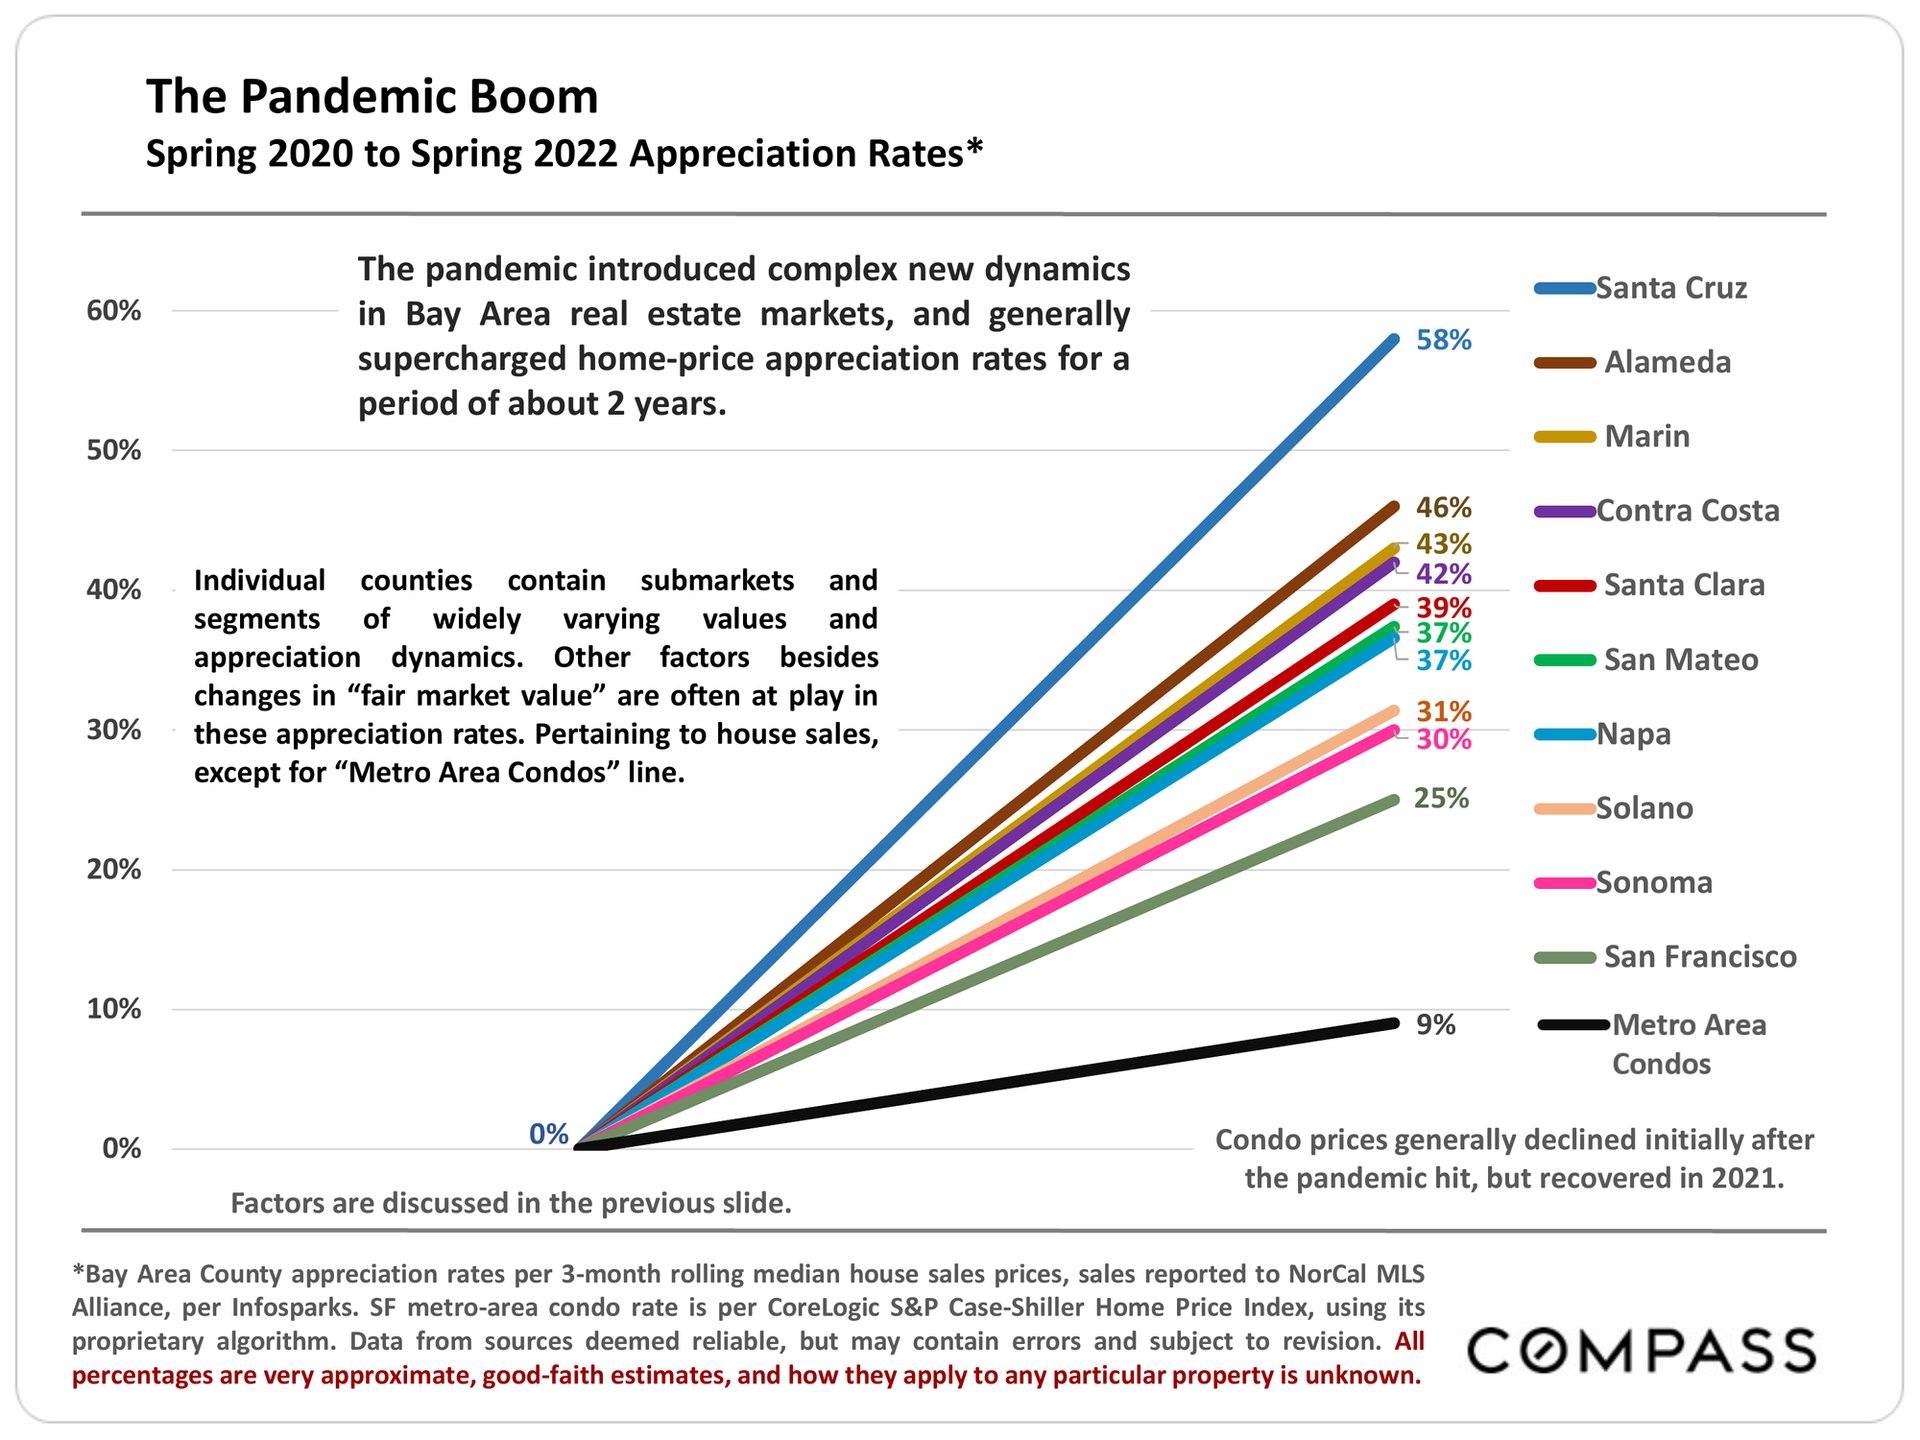
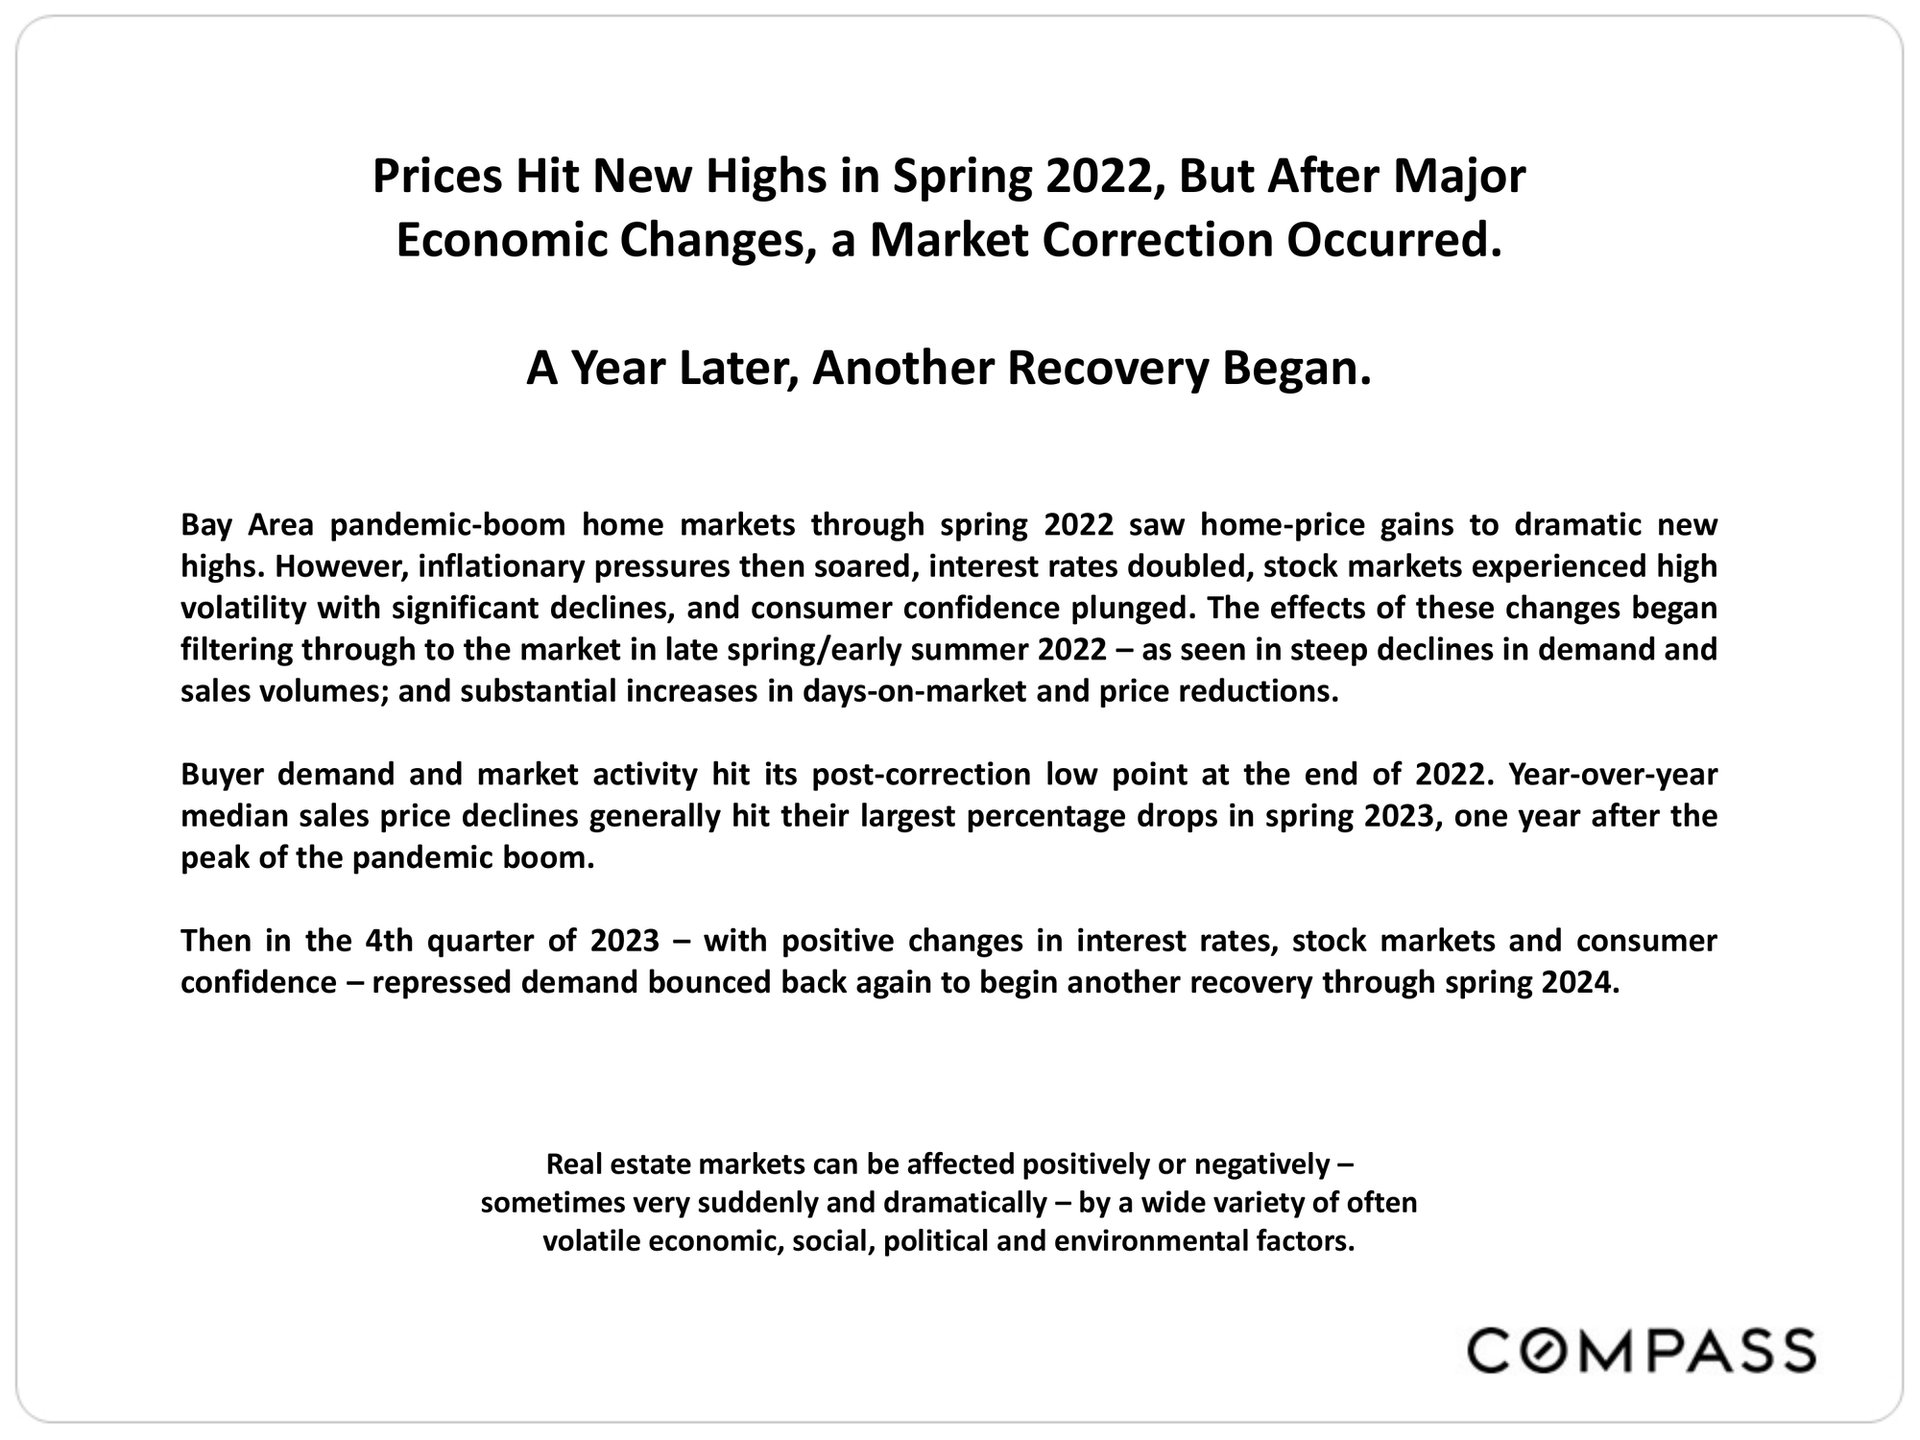
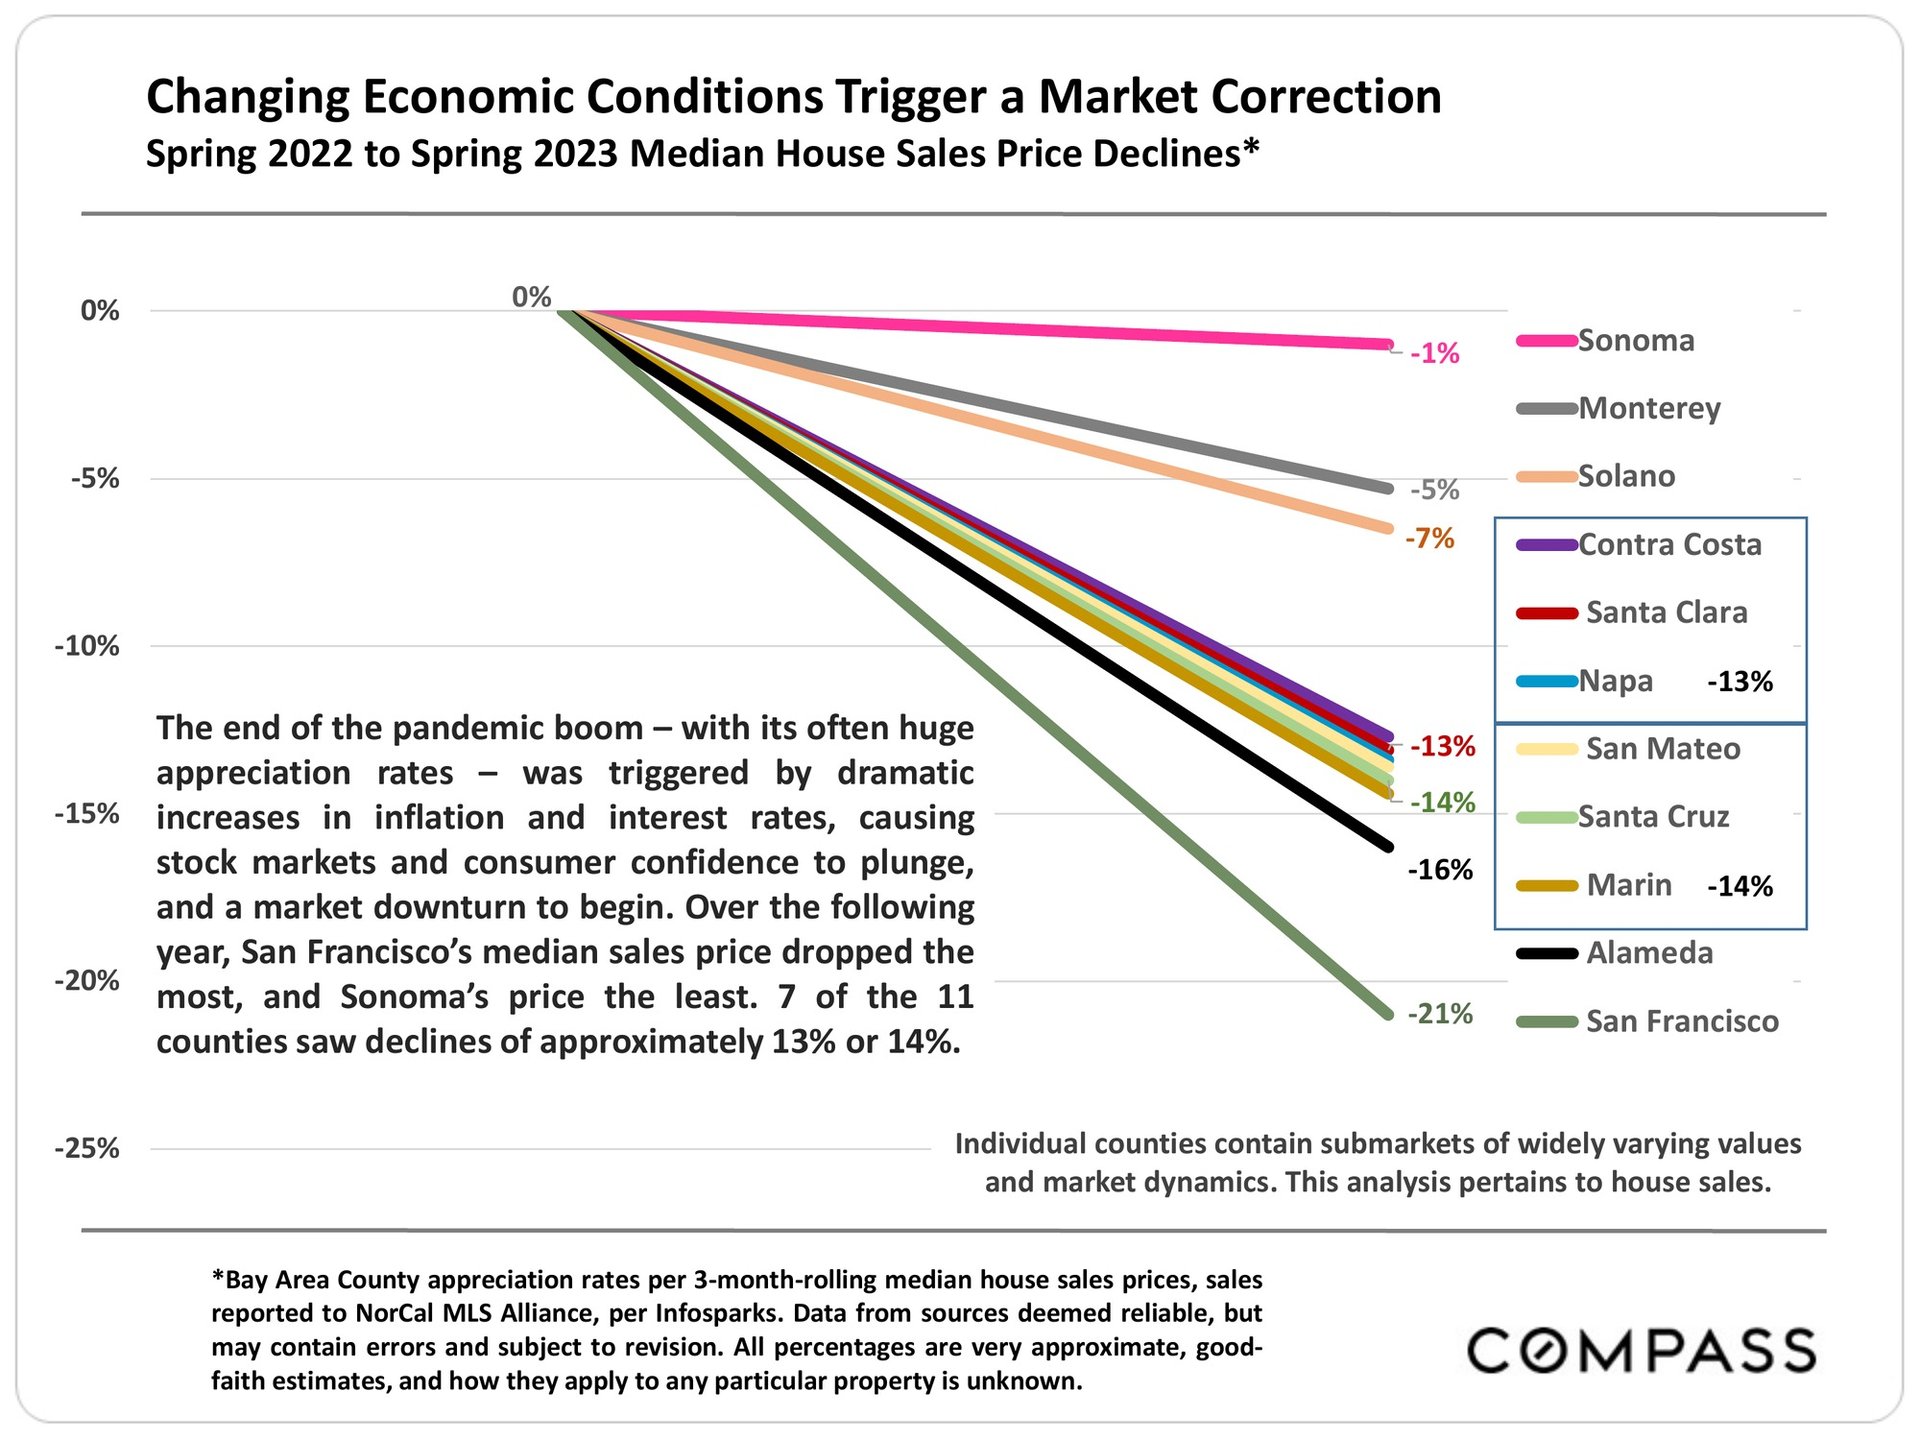
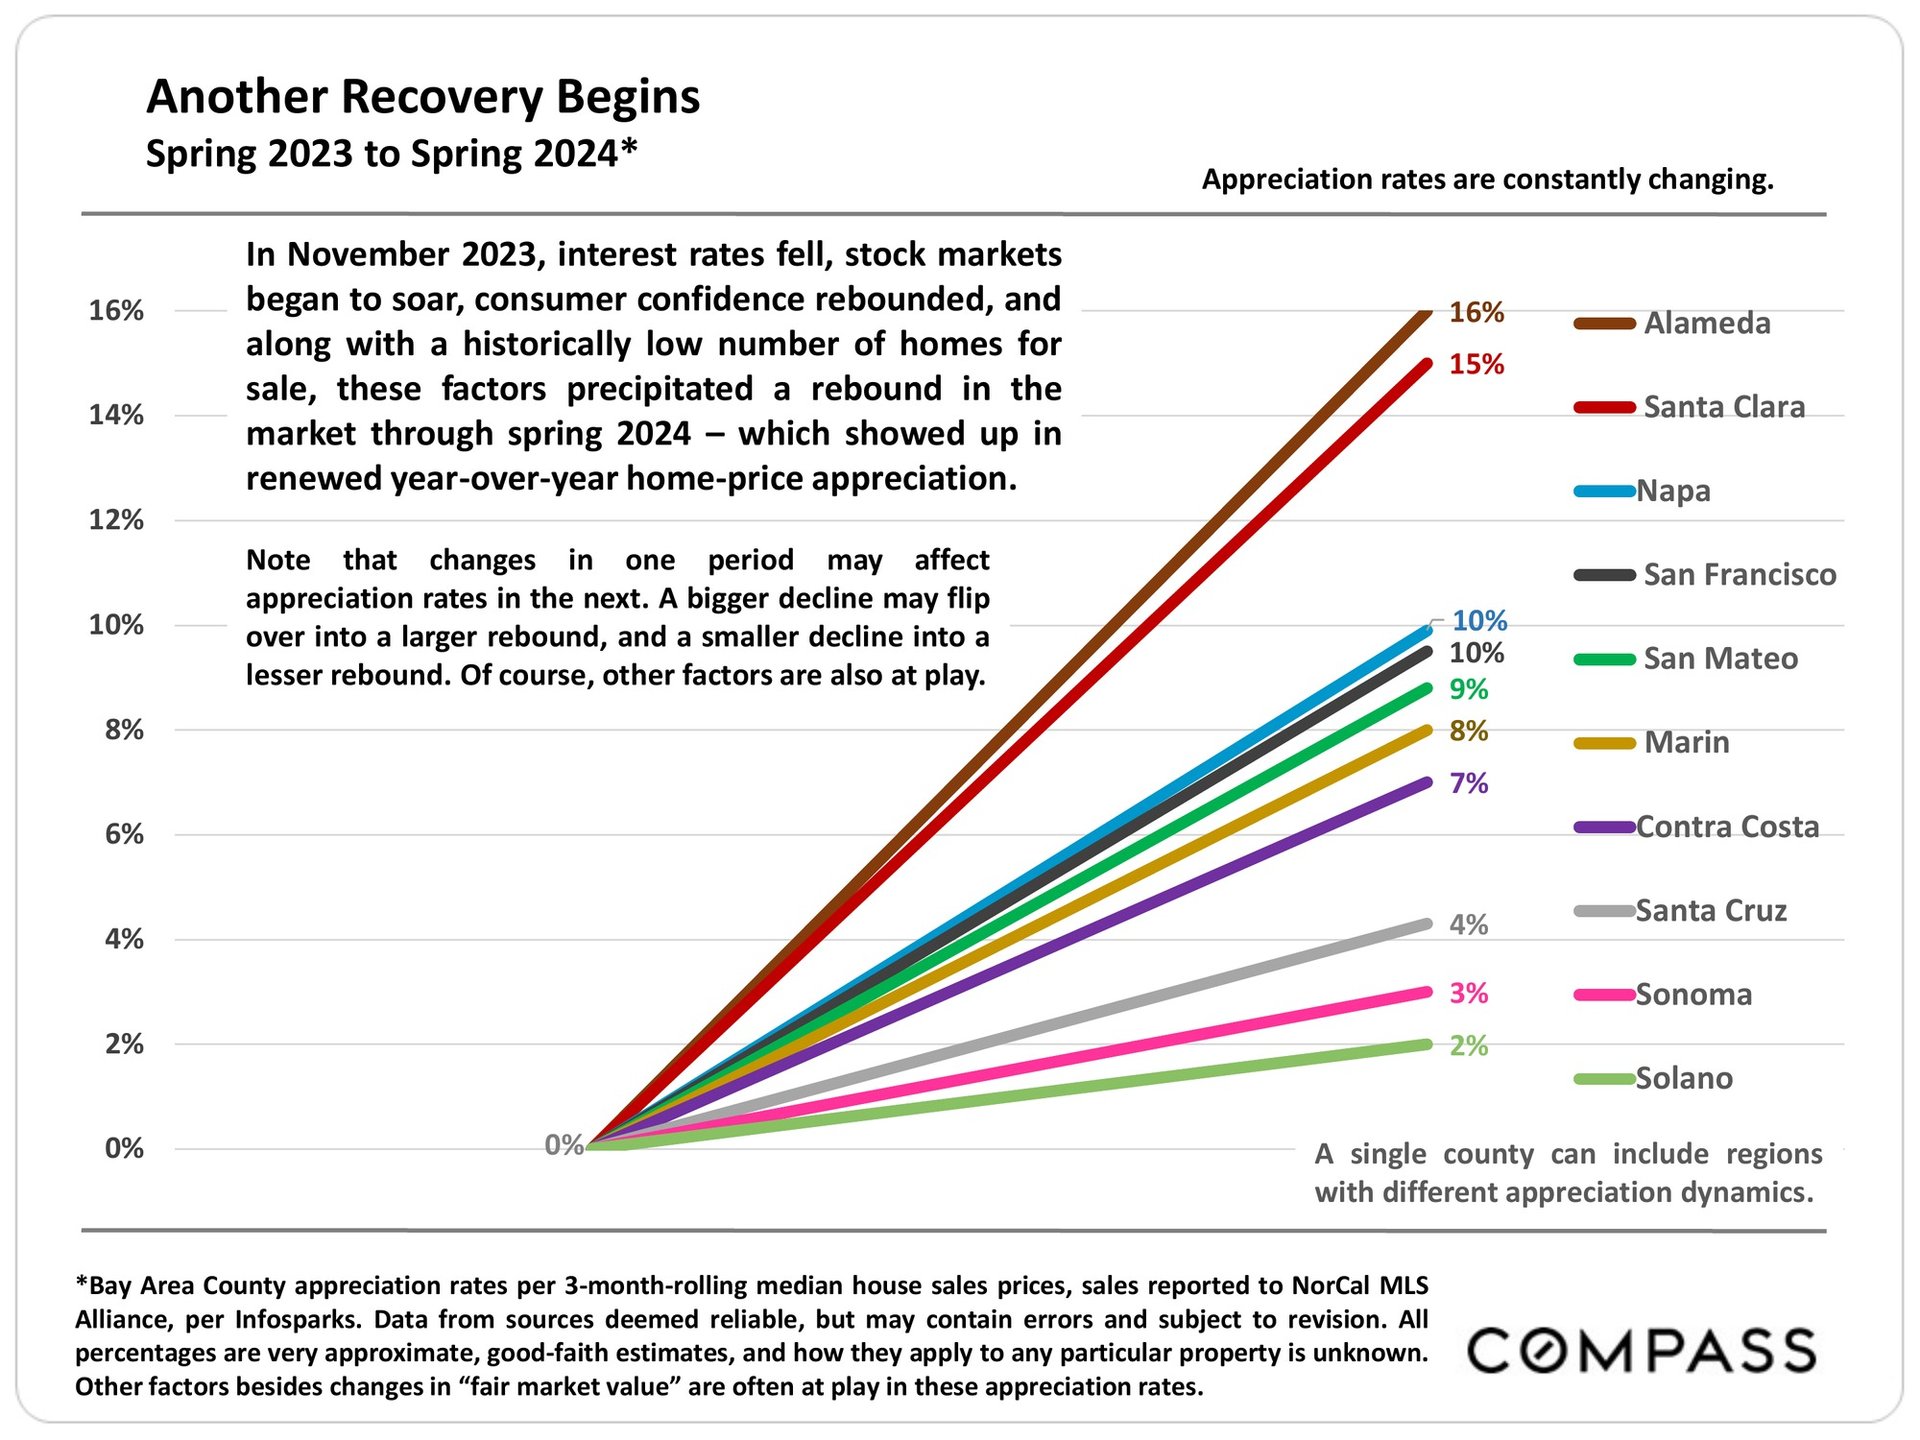
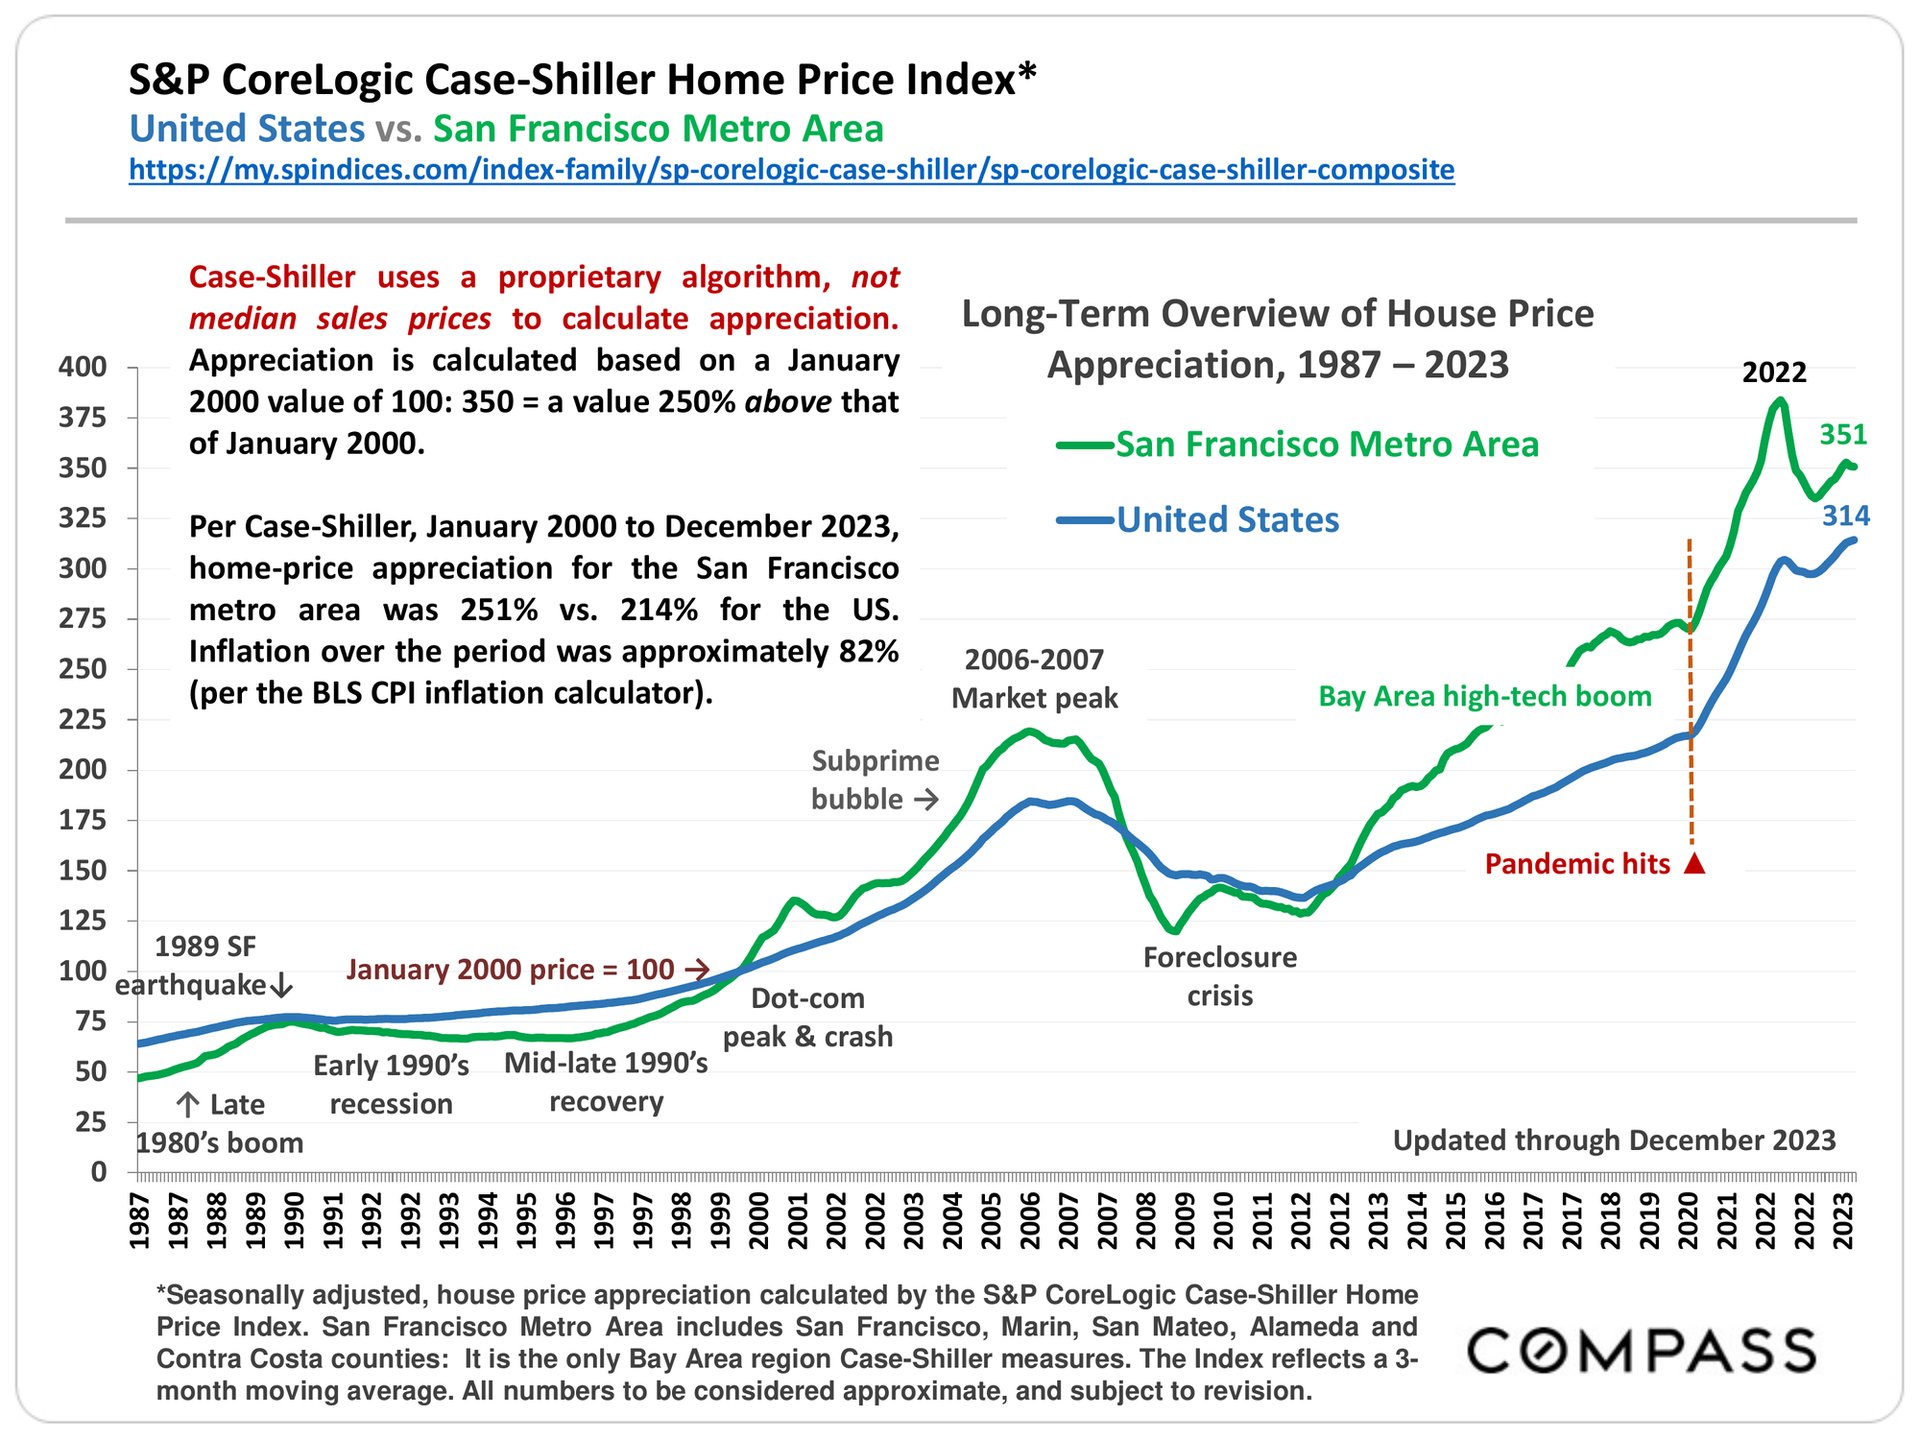
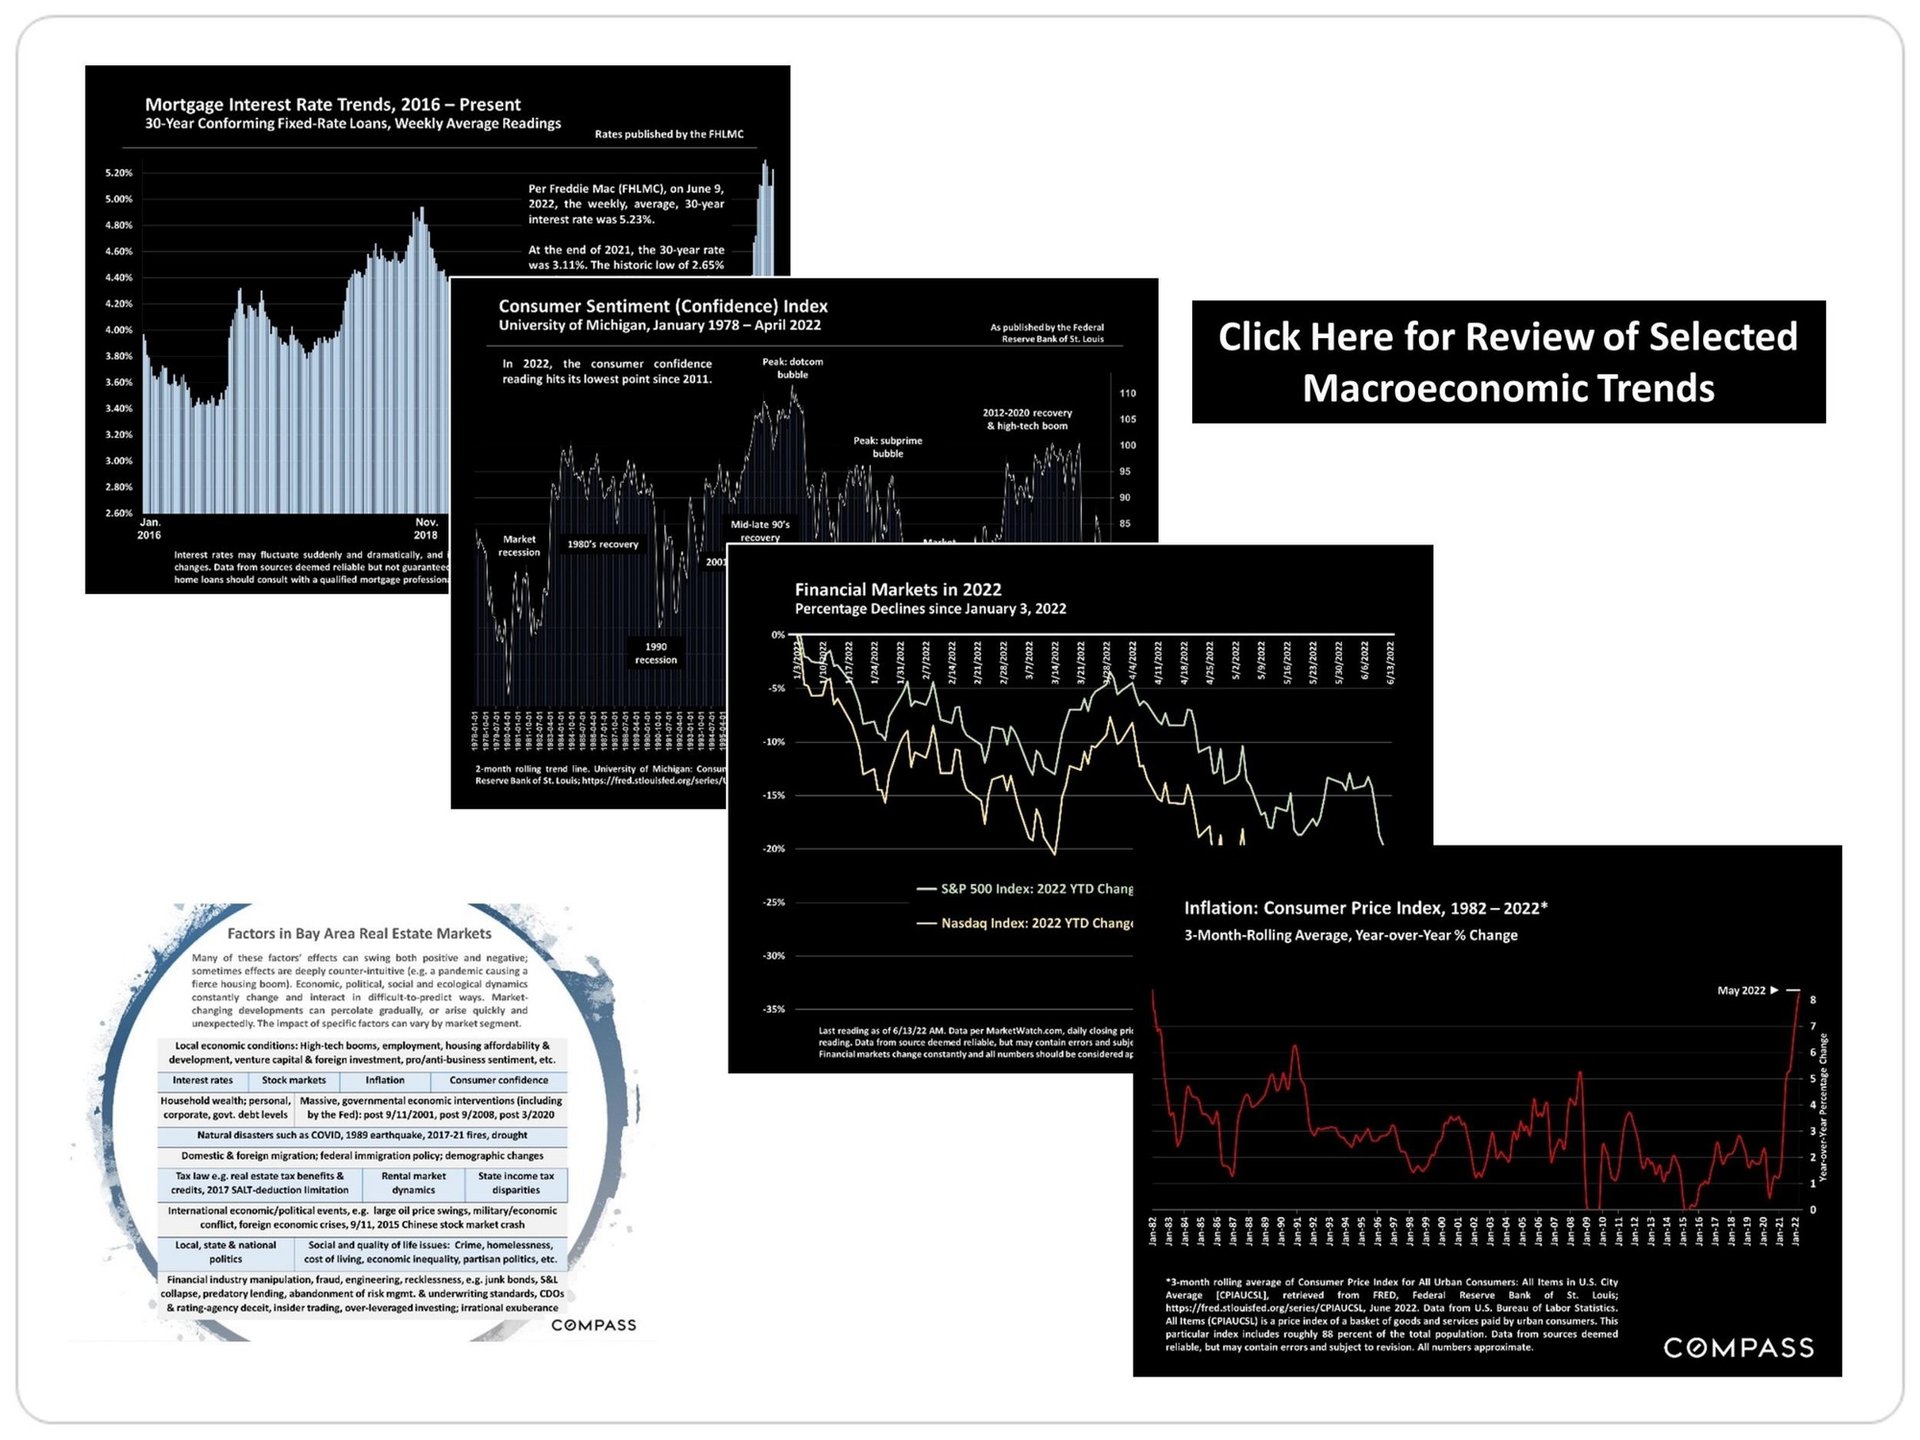
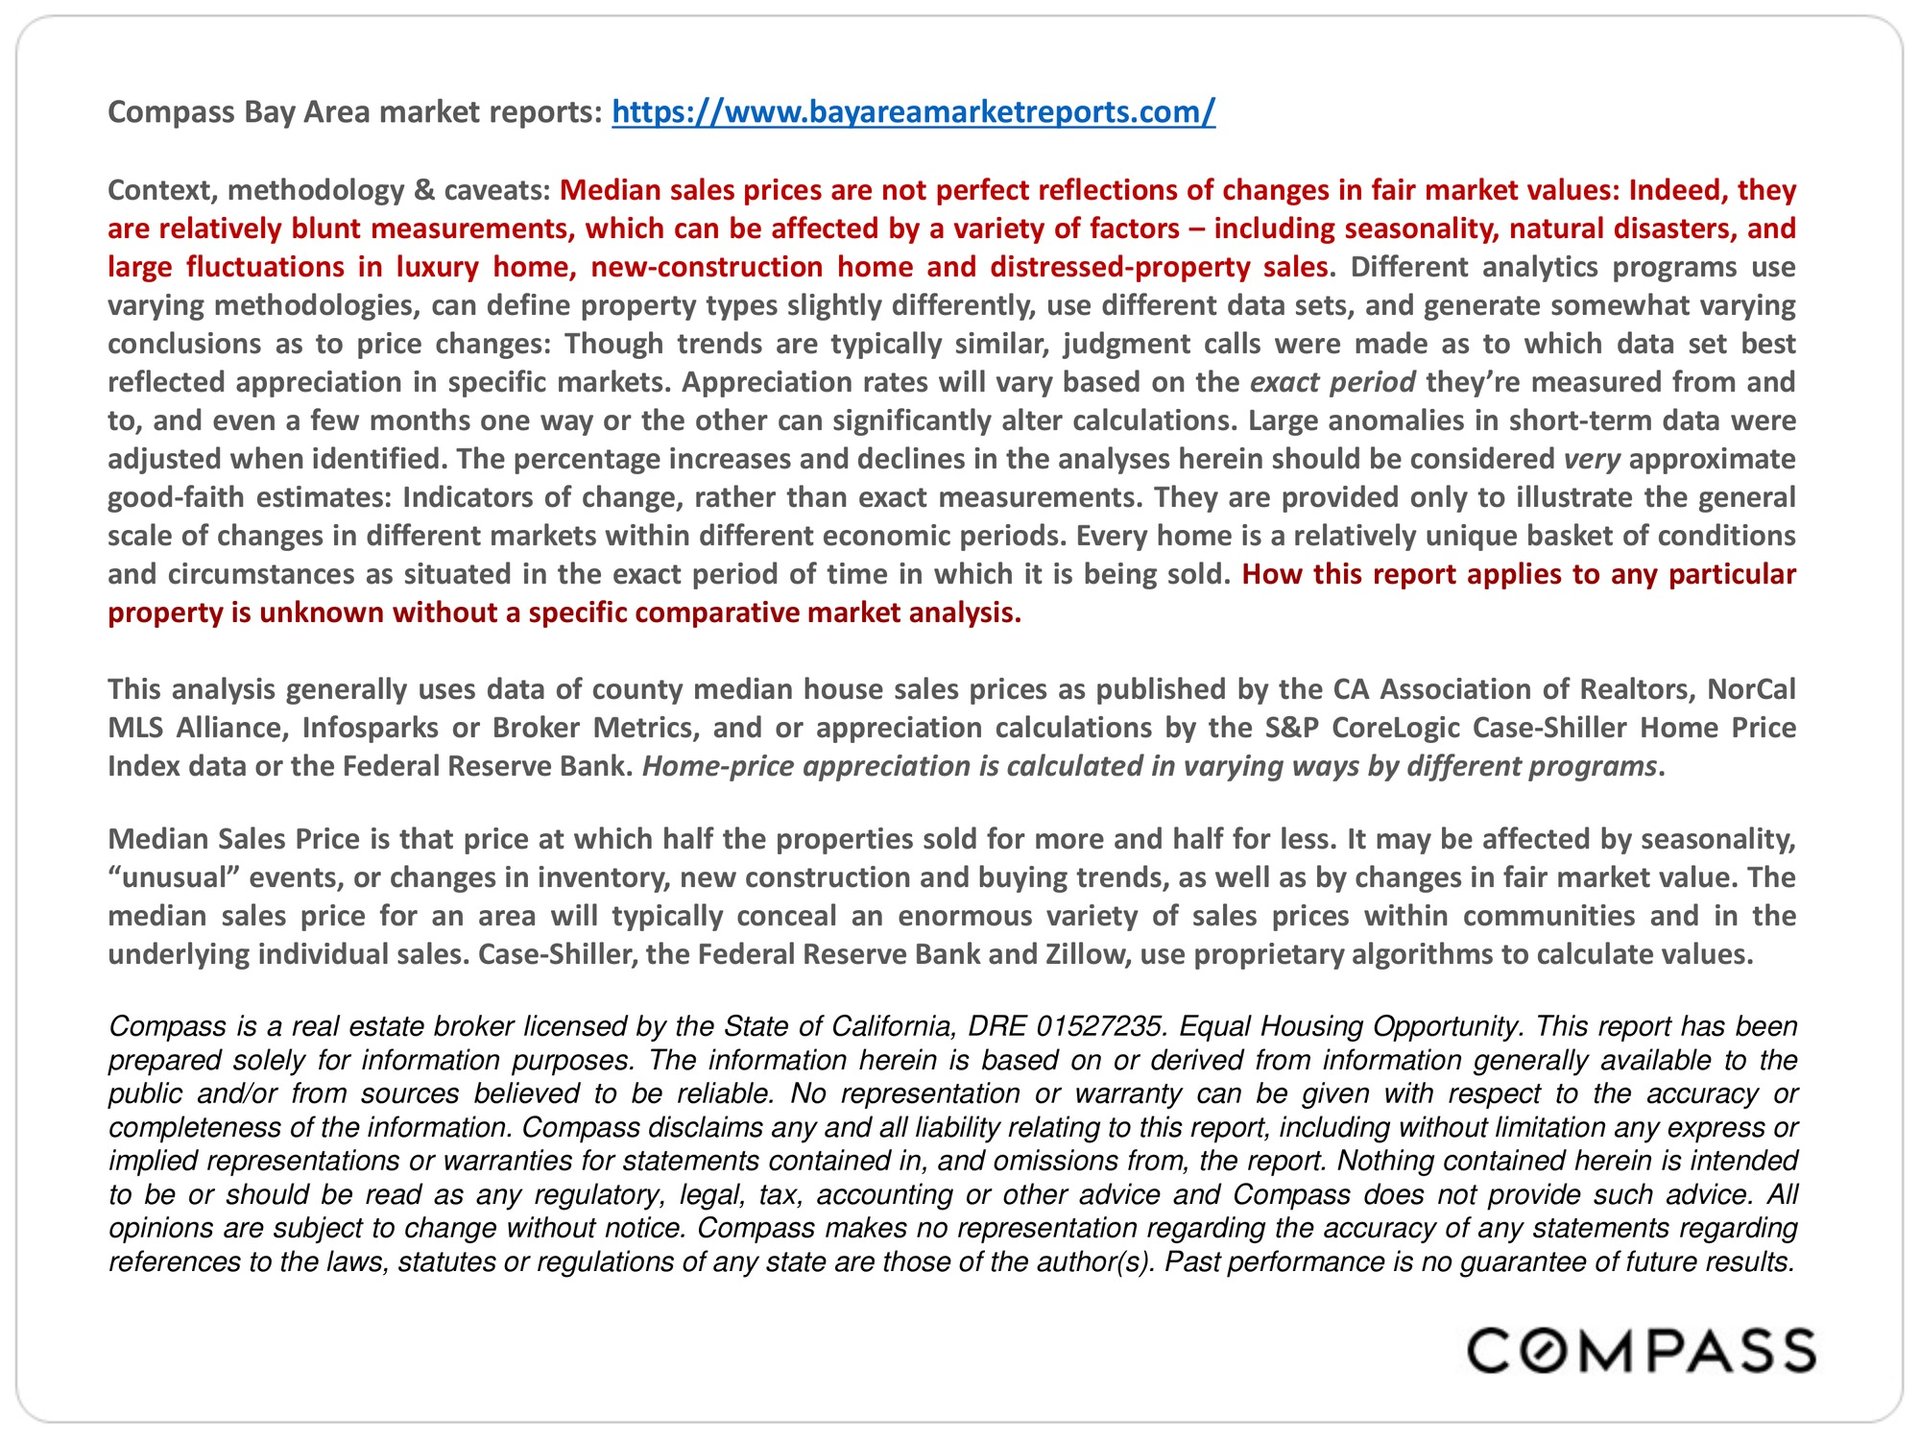
Compass report cover on Bay Area home price appreciation, with a collage of vineyards, the Golden Gate Bridge, hills, and cities.Text graphic explaining real estate market cycles and San Francisco Bay Area price trends, with a Compass wordmark.Infographic chart of Bay Area home price cycles from 1984 to 2024, with annotated booms, downturns, and percentage changes.Bar chart of Bay Area median home prices from 1990 to 2023, labeled with major market cycles.Bar chart of Bay Area median home price appreciation from 1990 to 2023, with market-cycle annotations and annual percentage changes.Chart of Bay Area home prices from 1990 to 2024, with market-cycle labels and a yellow trend line.Chart comparing Bay Area county median house sale prices from 2010 to 2023, showing strong long-term appreciation.Bay Area home-price cycles from the 1990s recession through the dot-com boom and collapse.Chart comparing Bay Area county home-price changes from 1990 to the mid-1990s, ranging from +5% to −11%.Chart of Bay Area county home-price appreciation through early 2001, led by Santa Clara at 123% and San Francisco at 120%.Chart of Bay Area county home price changes during the dotcom crash, ranging from a 9% gain to a 10% decline.Informational graphic explaining the subprime bubble, distressed home sales, and differences in housing price declines.Chart comparing home-price appreciation during the subprime bubble across nine Bay Area counties.Chart comparing Bay Area home-price changes by price segment from 2001 to 2010, including the subprime bubble and crash.Chart comparing subprime-era home price declines across Bay Area counties, from 27% in San Francisco to 65% in Contra Costa County.Report page explaining Bay Area home-price recovery after the financial crash, with county factors and market-cycle notes.Chart comparing Bay Area county home-price appreciation from the 2012 recovery to spring 2020.Text graphic explaining pandemic-era factors affecting Bay Area real estate markets and home-price appreciation.Bay Area pandemic-era home appreciation chart, with Santa Cruz at 58% and metro-area condos at 9%.Infographic summarizes the Bay Area housing market correction after spring 2022 and recovery beginning in late 2023.Chart of Bay Area county home-price declines, spring 2022 to spring 2023; San Francisco fell 21%, Sonoma 1%.Infographic comparing spring 2023–spring 2024 home-price appreciation across ten Bay Area counties.Chart comparing San Francisco metro area and U.S. home price appreciation from 1987 to 2023.Compass Bay Area market reports promoted beside a satellite view of San Francisco Bay.Economic charts on mortgage rates, consumer confidence, financial markets and inflation, alongside Bay Area real estate factors.Aerial view of San Francisco, with downtown, the Bay Bridge, and the surrounding bay.Compass report page explaining Bay Area home-price data, methodology, caveats, and legal disclaimers.


WORK WITH US

We offer the highest level of service and expertise to our clients. Our team has built a reputation for consistently representing the finest real estate in San Francisco and Napa Valley. Results driven and dedicated to your success, whether buying, selling, renting or investing. Contact us today for a private consultation.

Contact Us