
San Francisco Bay Area Home Price Appreciation & Market Cycles since 1990

Report cover on San Francisco Bay Area home price appreciation and market cycles since 1990, with a collage of regional landscapes.
Text explaining real estate market cycles and San Francisco price appreciation, with a Compass logo.
Bay Area home price cycle chart, 1984–2022, with annotated booms and downturns.
Infographic summarizing Bay Area home-price recovery, dotcom-era appreciation, and post-crash declines.
Chart of 1990s Bay Area home price changes: Sonoma +5%, Napa 0%, and San Francisco down 11%.
Chart of home price appreciation through the 2001 dot-com boom, led by Santa Clara and San Francisco counties.
Chart of Bay Area county home price changes after the dotcom peak, ranging from Solano’s 5% gain to San Francisco’s 10% decline.
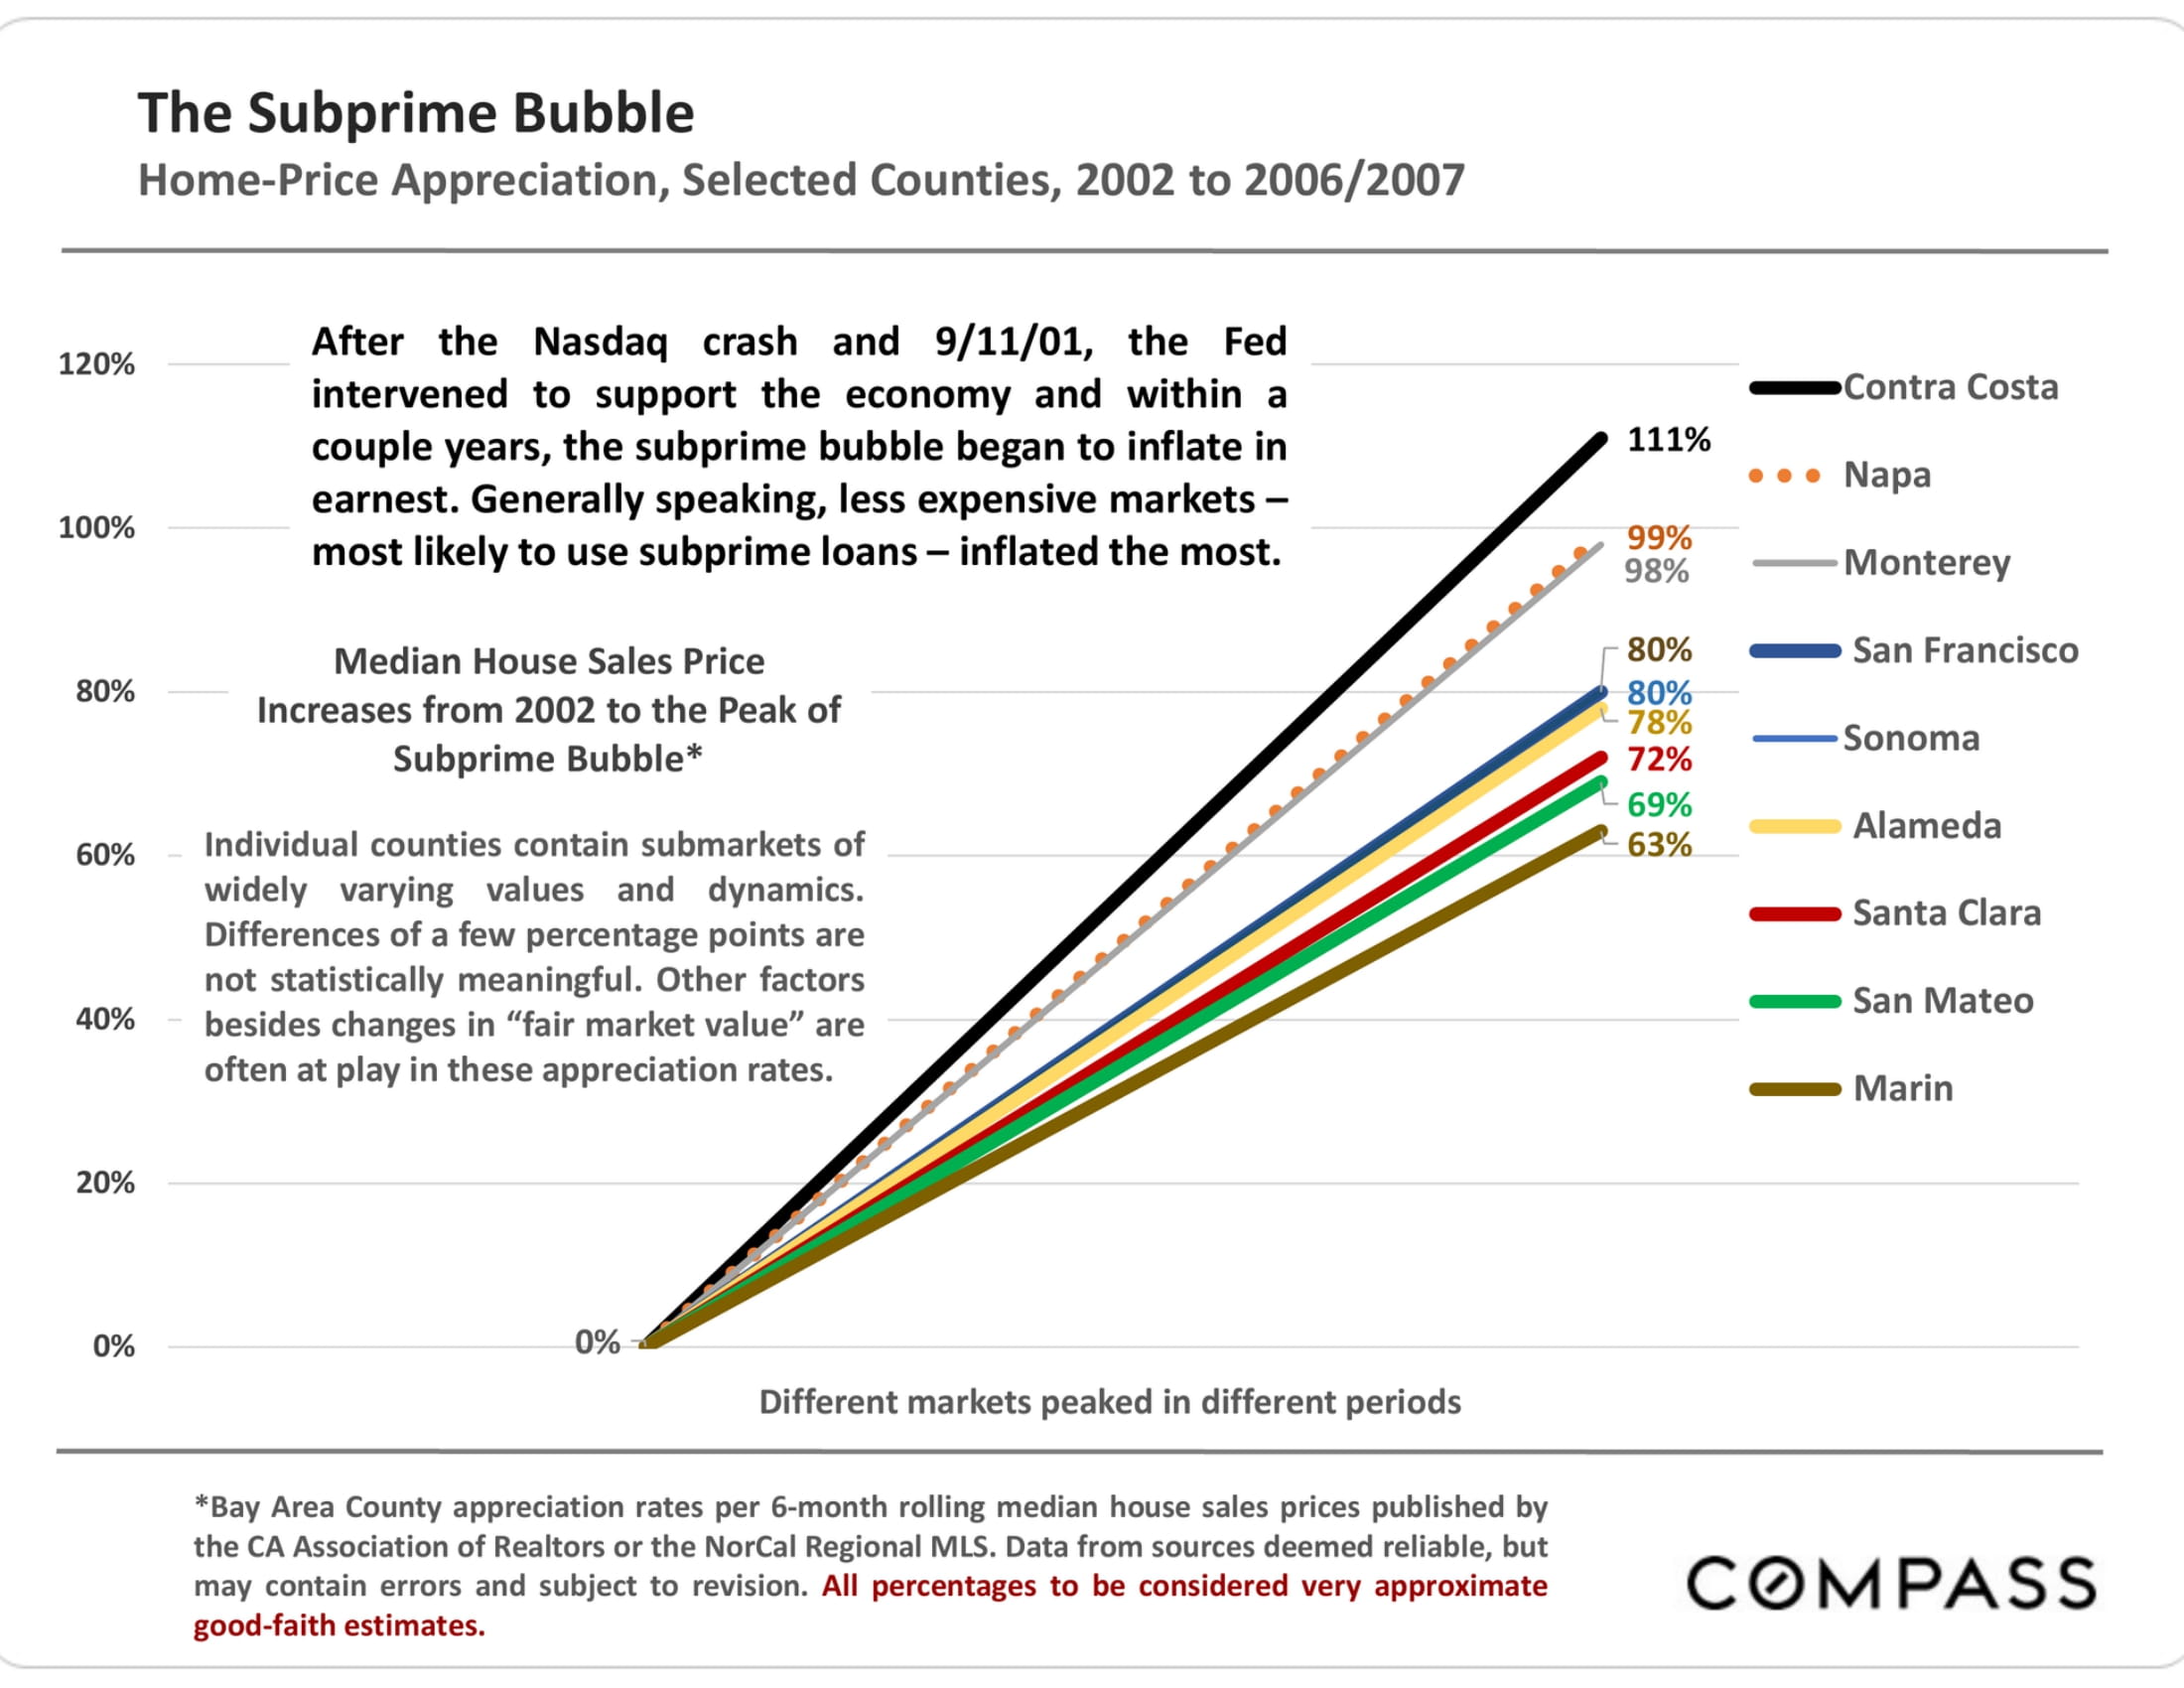
Chart comparing peak subprime-era home-price appreciation across nine Bay Area counties, ranging from 63% to 111%.
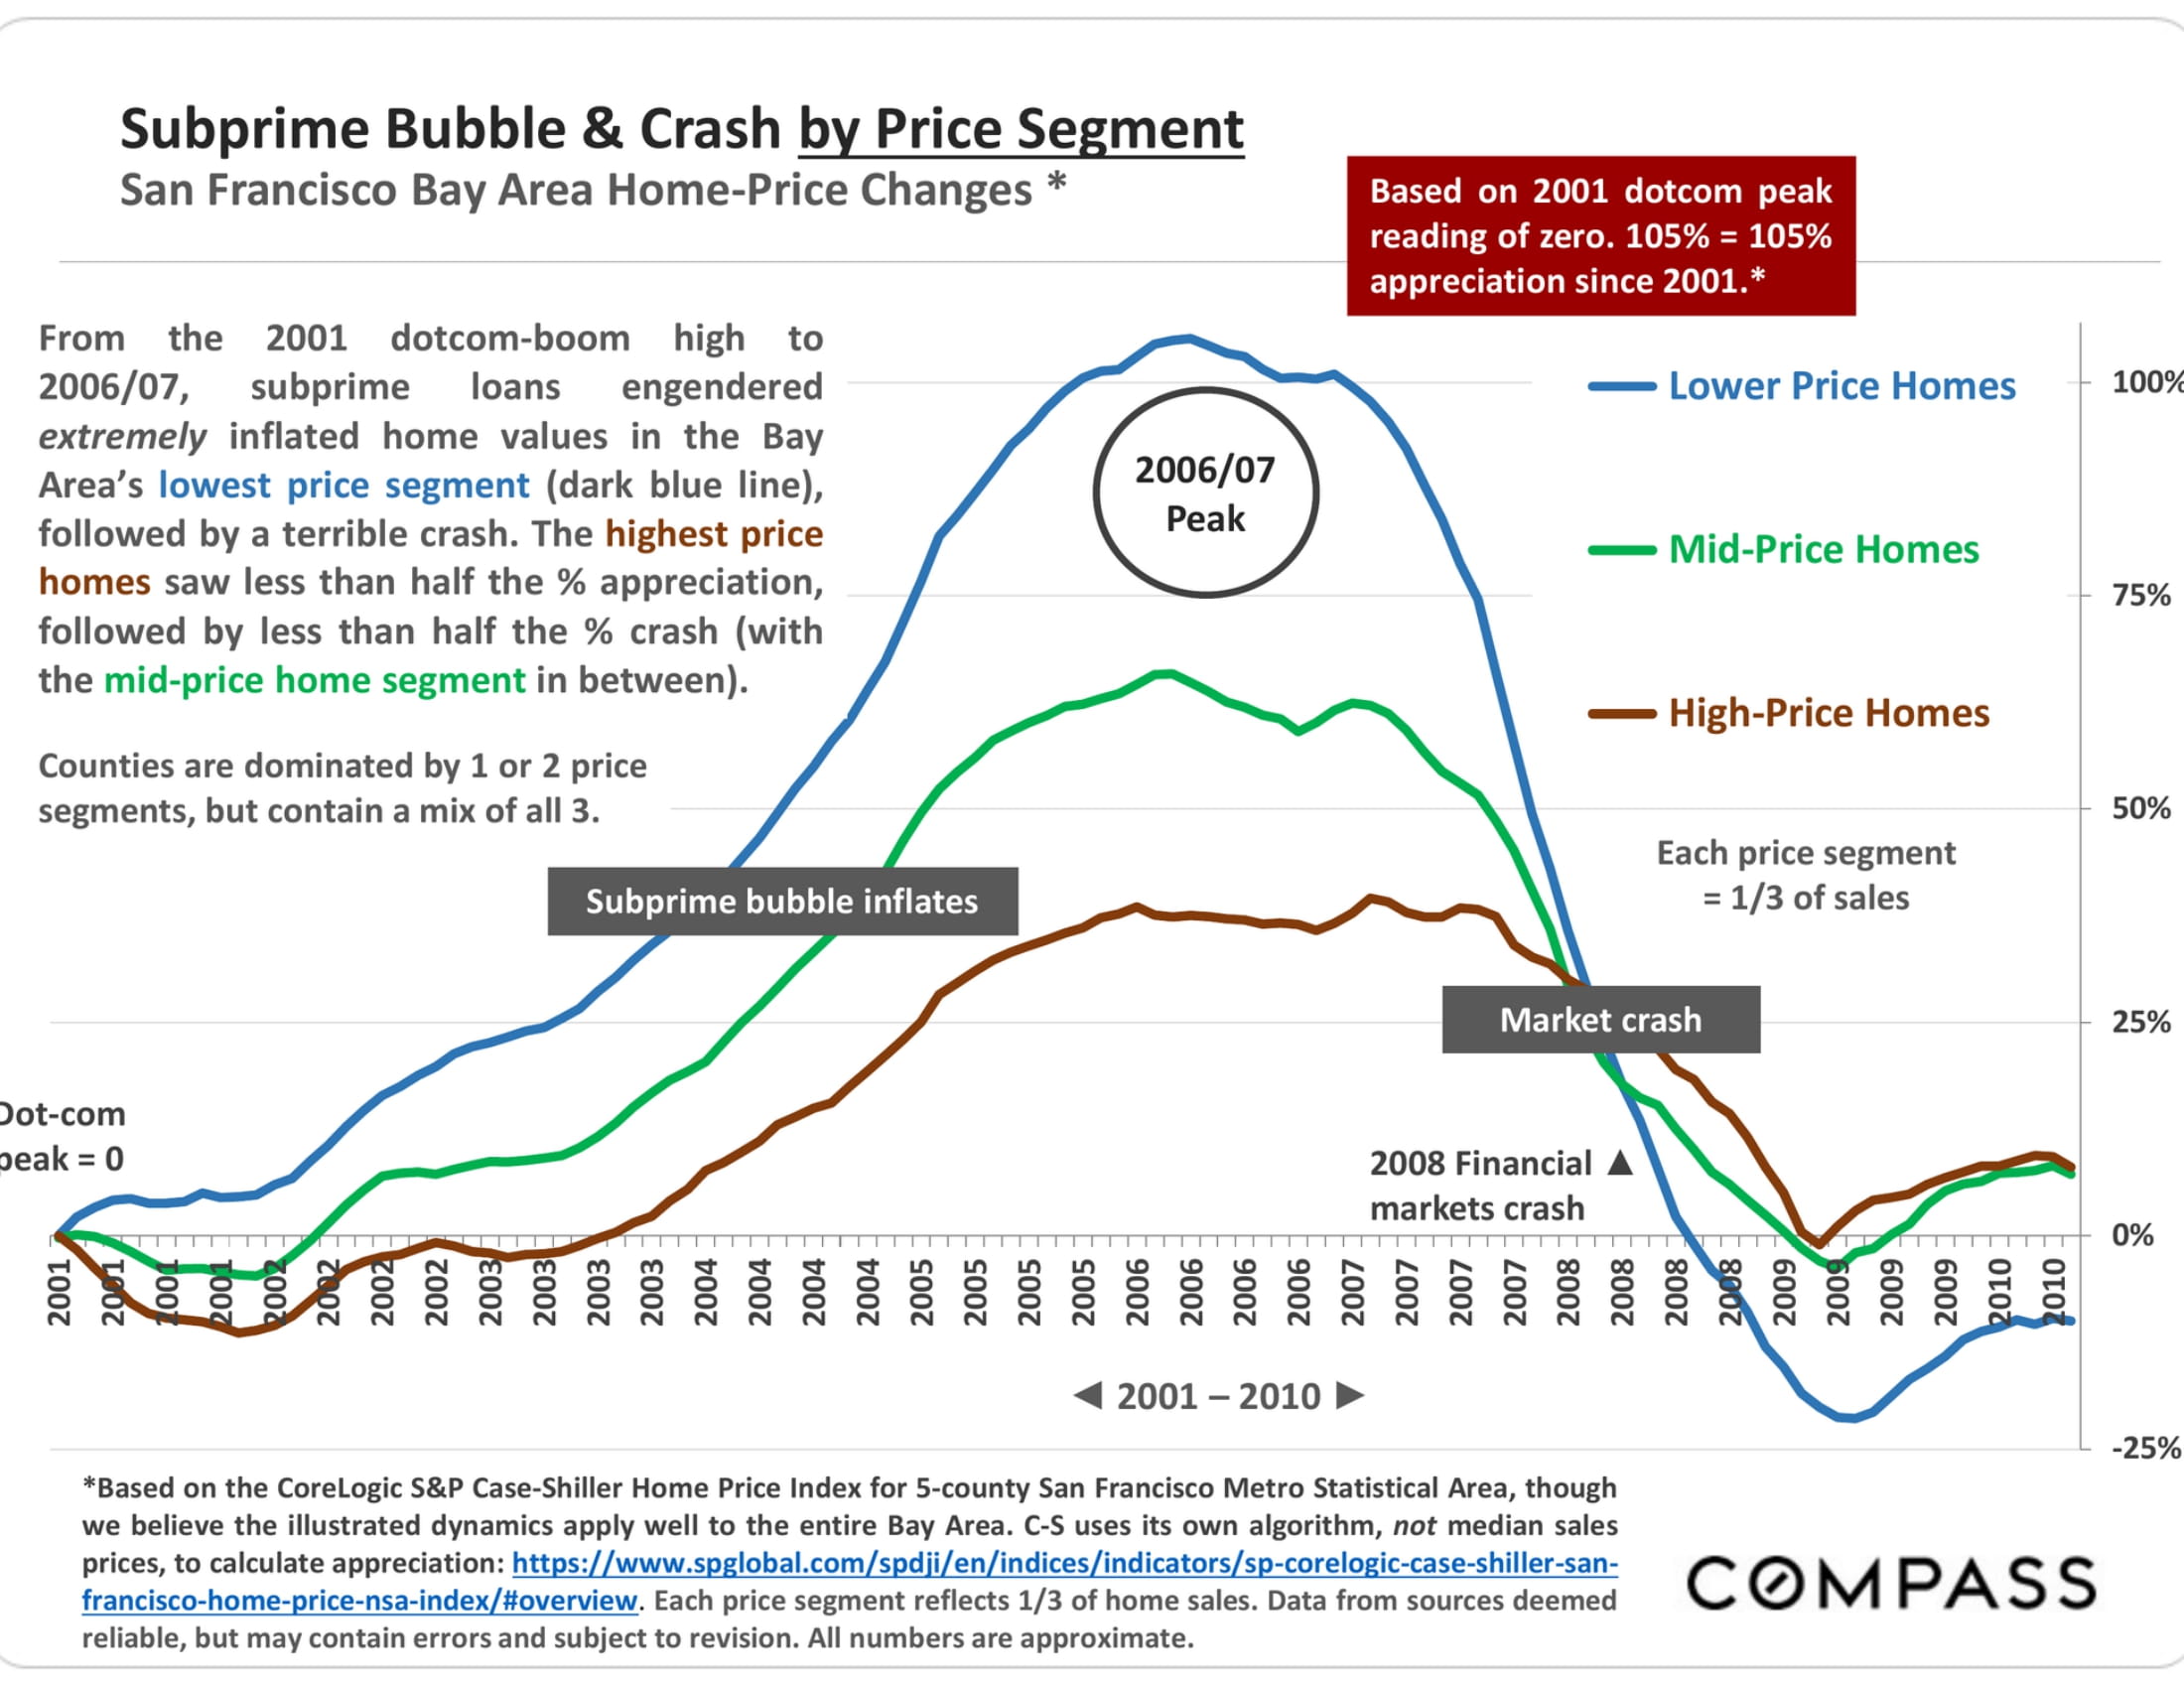
Chart comparing Bay Area home-price changes by price segment from 2001 to 2010.
Chart comparing subprime-era home price declines across Bay Area counties, ranging from 27% in San Francisco to 65% in Contra Costa.
Report page explains Bay Area home-price recovery after 2012 and factors behind appreciation across counties.
Chart comparing 2012–2020 home-price appreciation across Bay Area counties and the United States.
Pandemic Market graphic discussing Bay Area housing trends, migration, and home-price appreciation from 2020 to 2022.
Chart of Bay Area home price appreciation from spring 2020 to spring 2022, led by Santa Cruz at 58%.
Bay Area housing market report page discussing spring 2022 prices and economic pressures.
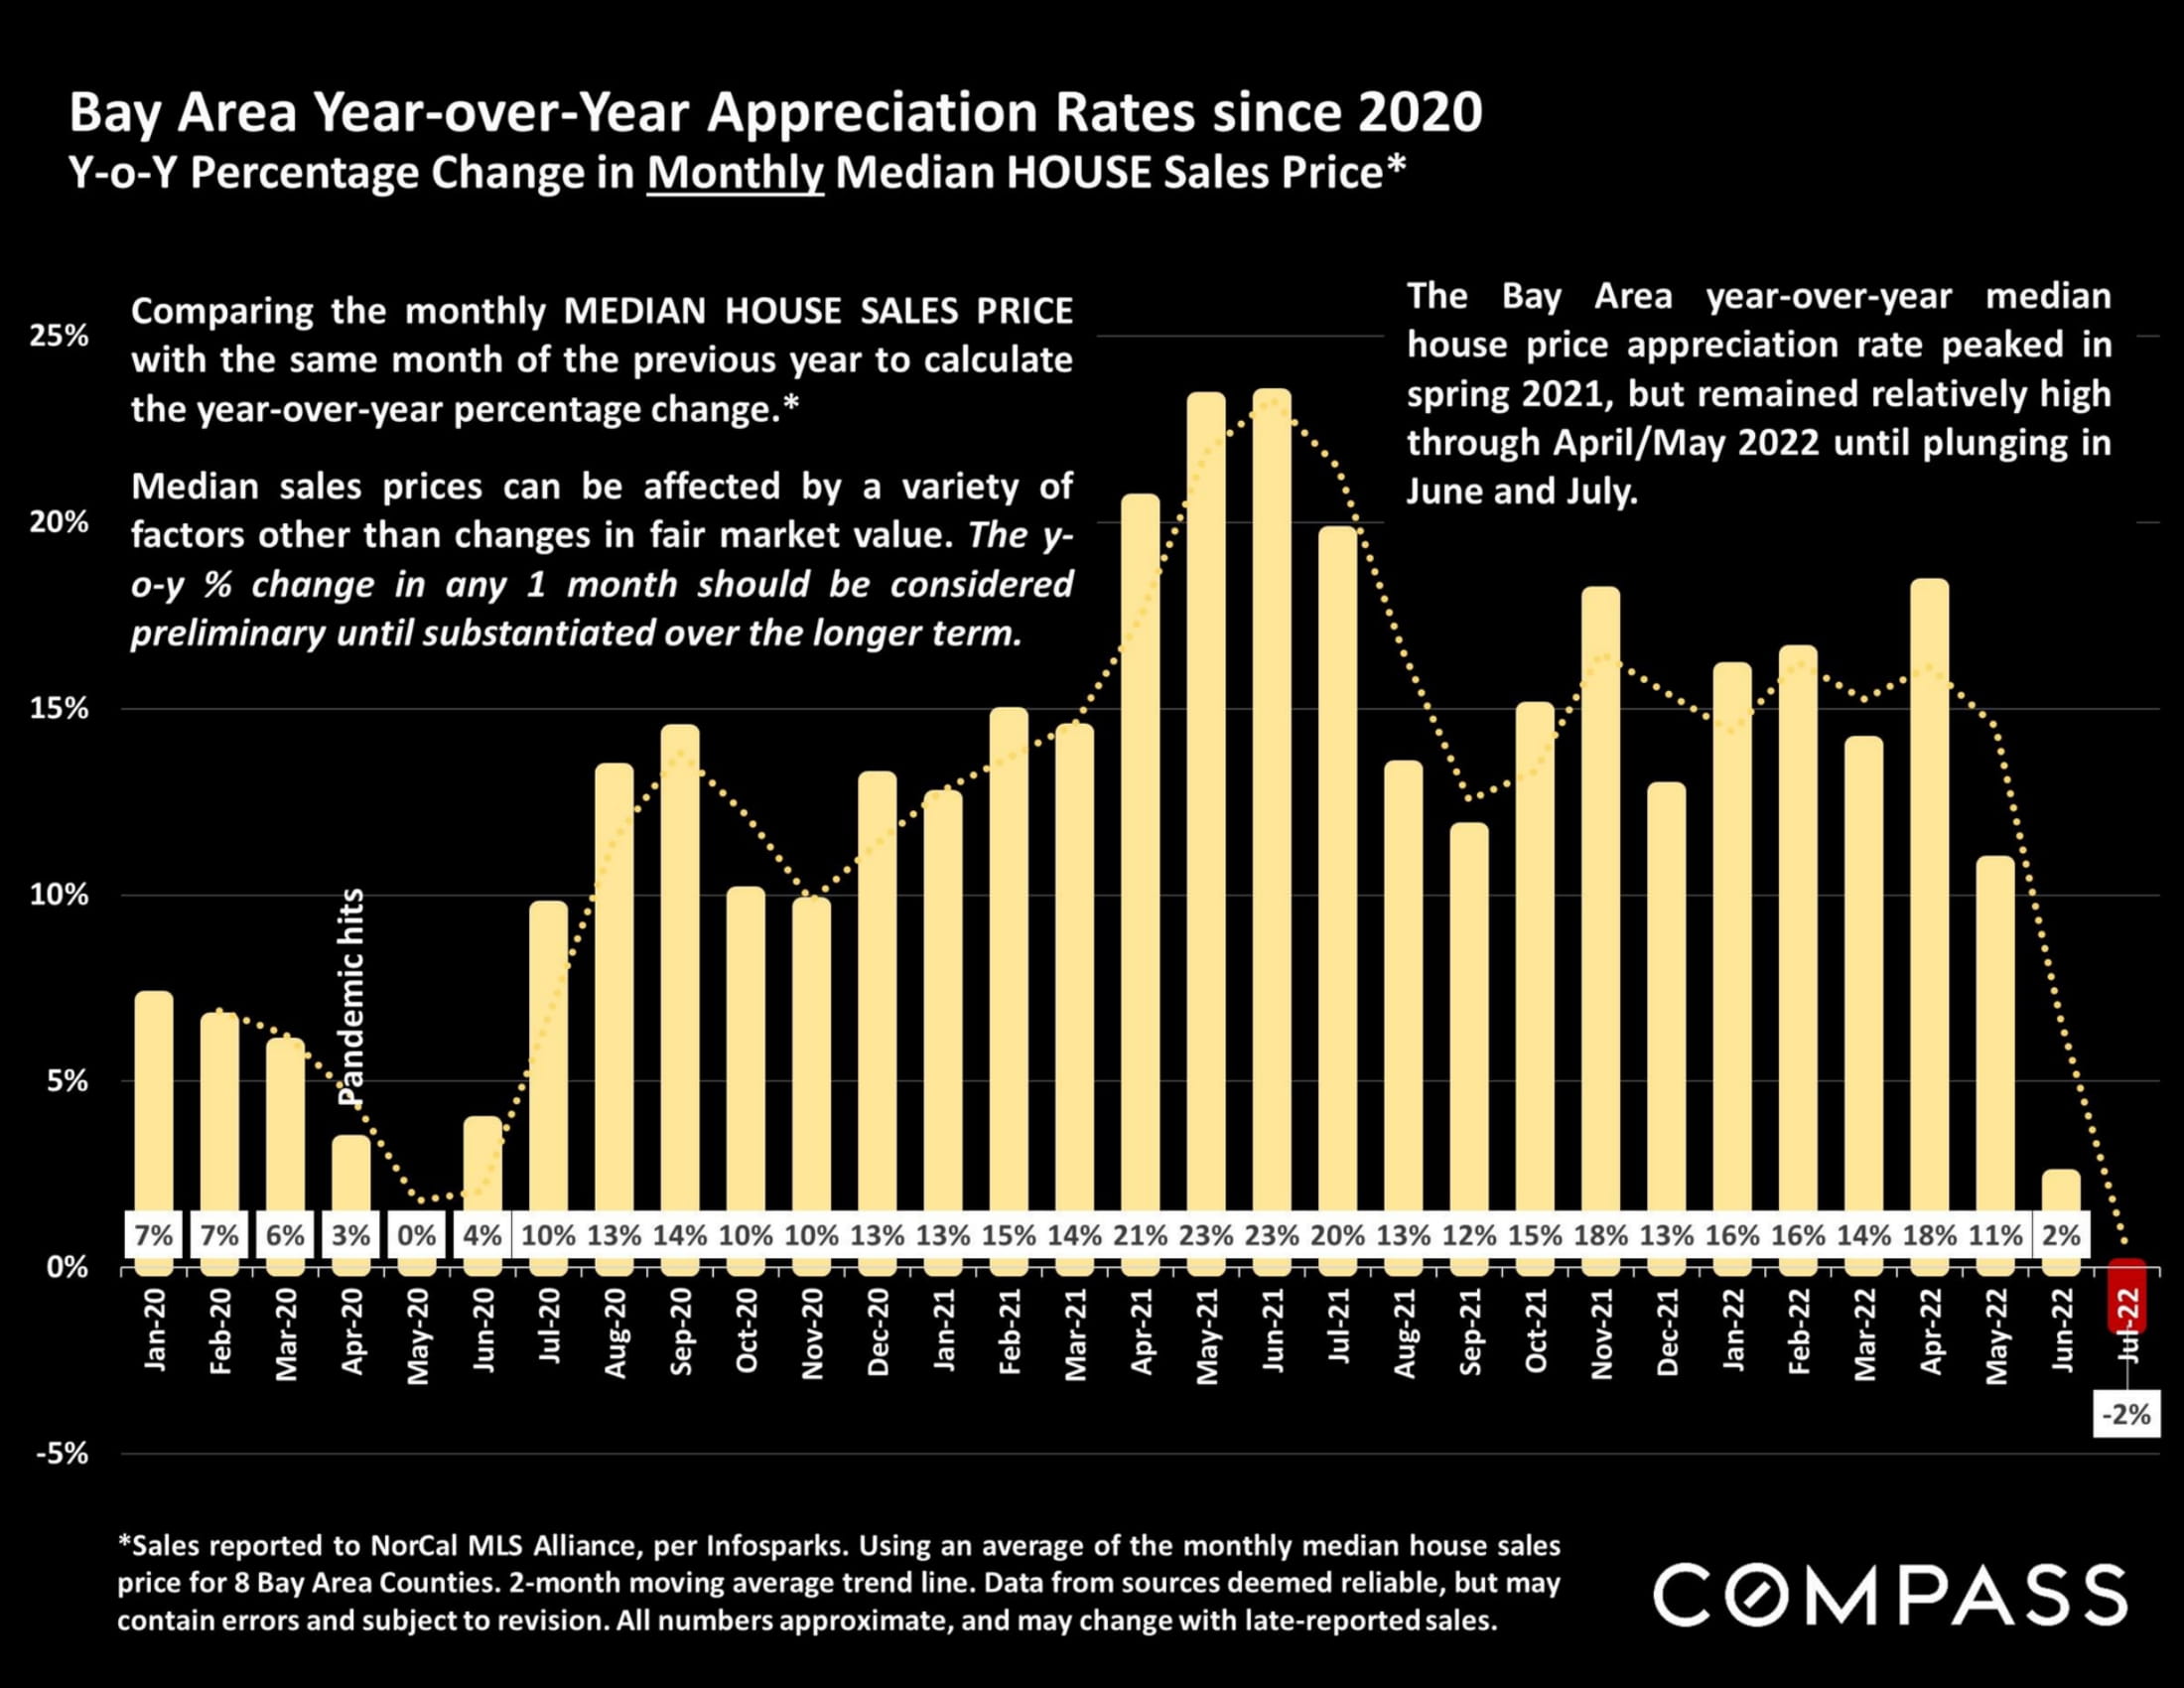
Bay Area home price appreciation chart from 2020 to 2022, showing a July 2022 decline to -2%.
Bar chart comparing Q2 2022 median home sale prices across 11 Bay Area counties, from San Mateo to Solano.
Aerial view of San Francisco’s skyline, bay, surrounding neighborhoods, and distant hills.
Chart comparing Bay Area county home price appreciation since 1990, with San Francisco, San Mateo and Santa Clara reaching 616%.
Chart comparing San Francisco and U.S. home price appreciation from 1987 to April 2022, with market-cycle annotations.
Chart of Bay Area median home prices from 1990 to 2022, with market-cycle annotations and yearly values.
Chart of Bay Area home price appreciation since 1990, showing market cycles and annual percentage changes.
Economic charts on mortgage rates, consumer sentiment, 2022 market declines, inflation, and factors in Bay Area real estate markets.
San Francisco Bay Area real estate survey graphic with the Golden Gate Bridge and a link to the full report.
Bay Area home price report methodology, data sources, caveats, and Compass disclaimer.


WORK WITH US

We offer the highest level of service and expertise to our clients. Our team has built a reputation for consistently representing the finest real estate in San Francisco and Napa Valley. Results driven and dedicated to your success, whether buying, selling, renting or investing. Contact us today for a private consultation.

Contact Us