
San Francisco Bay Real Estate Market Survey

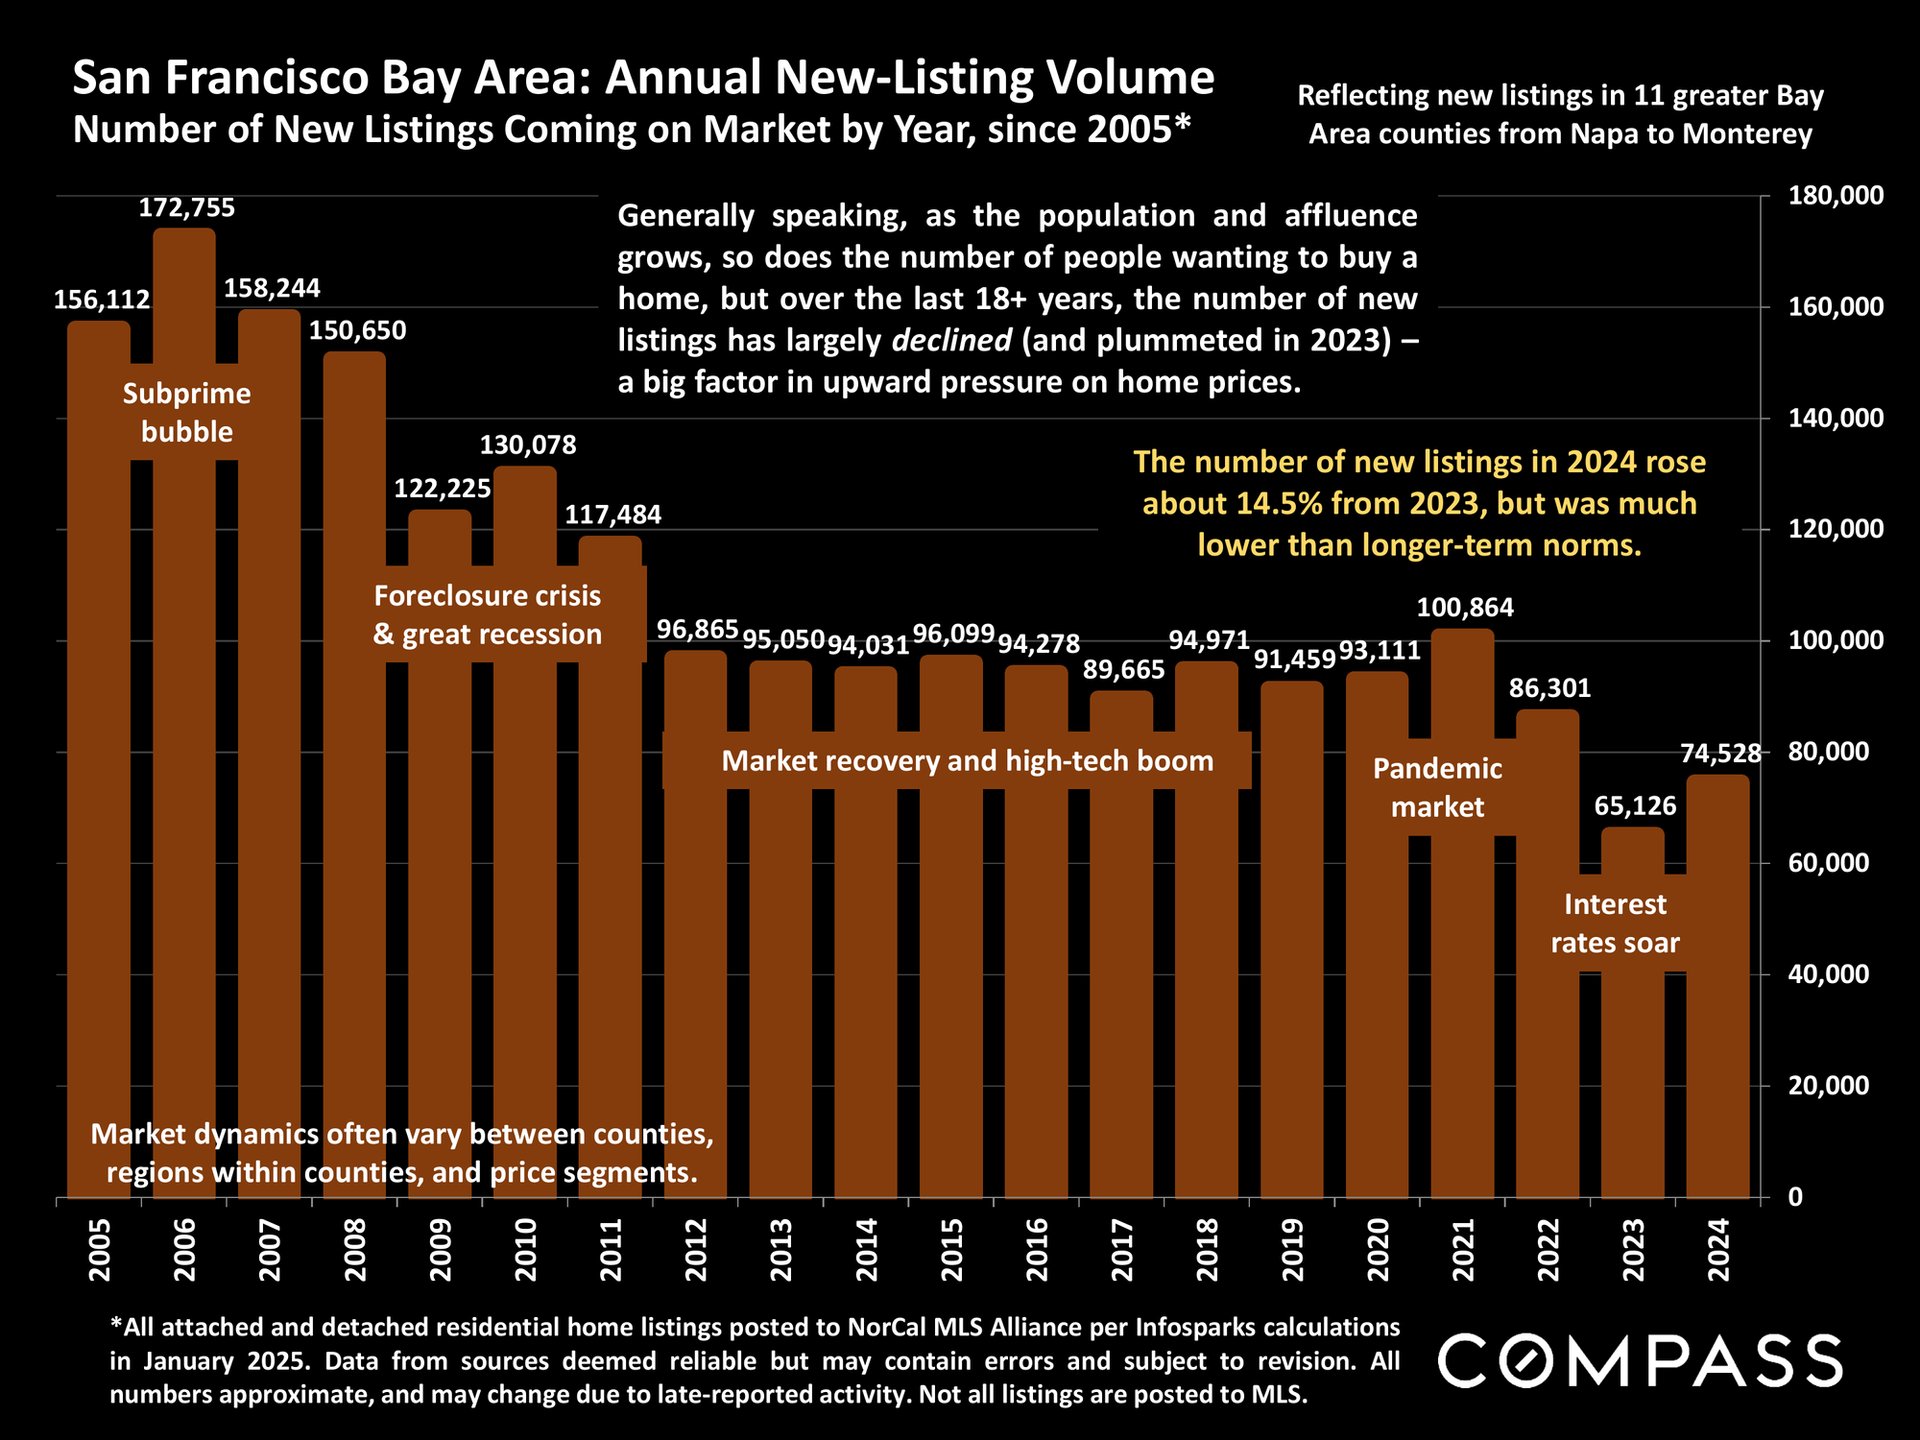
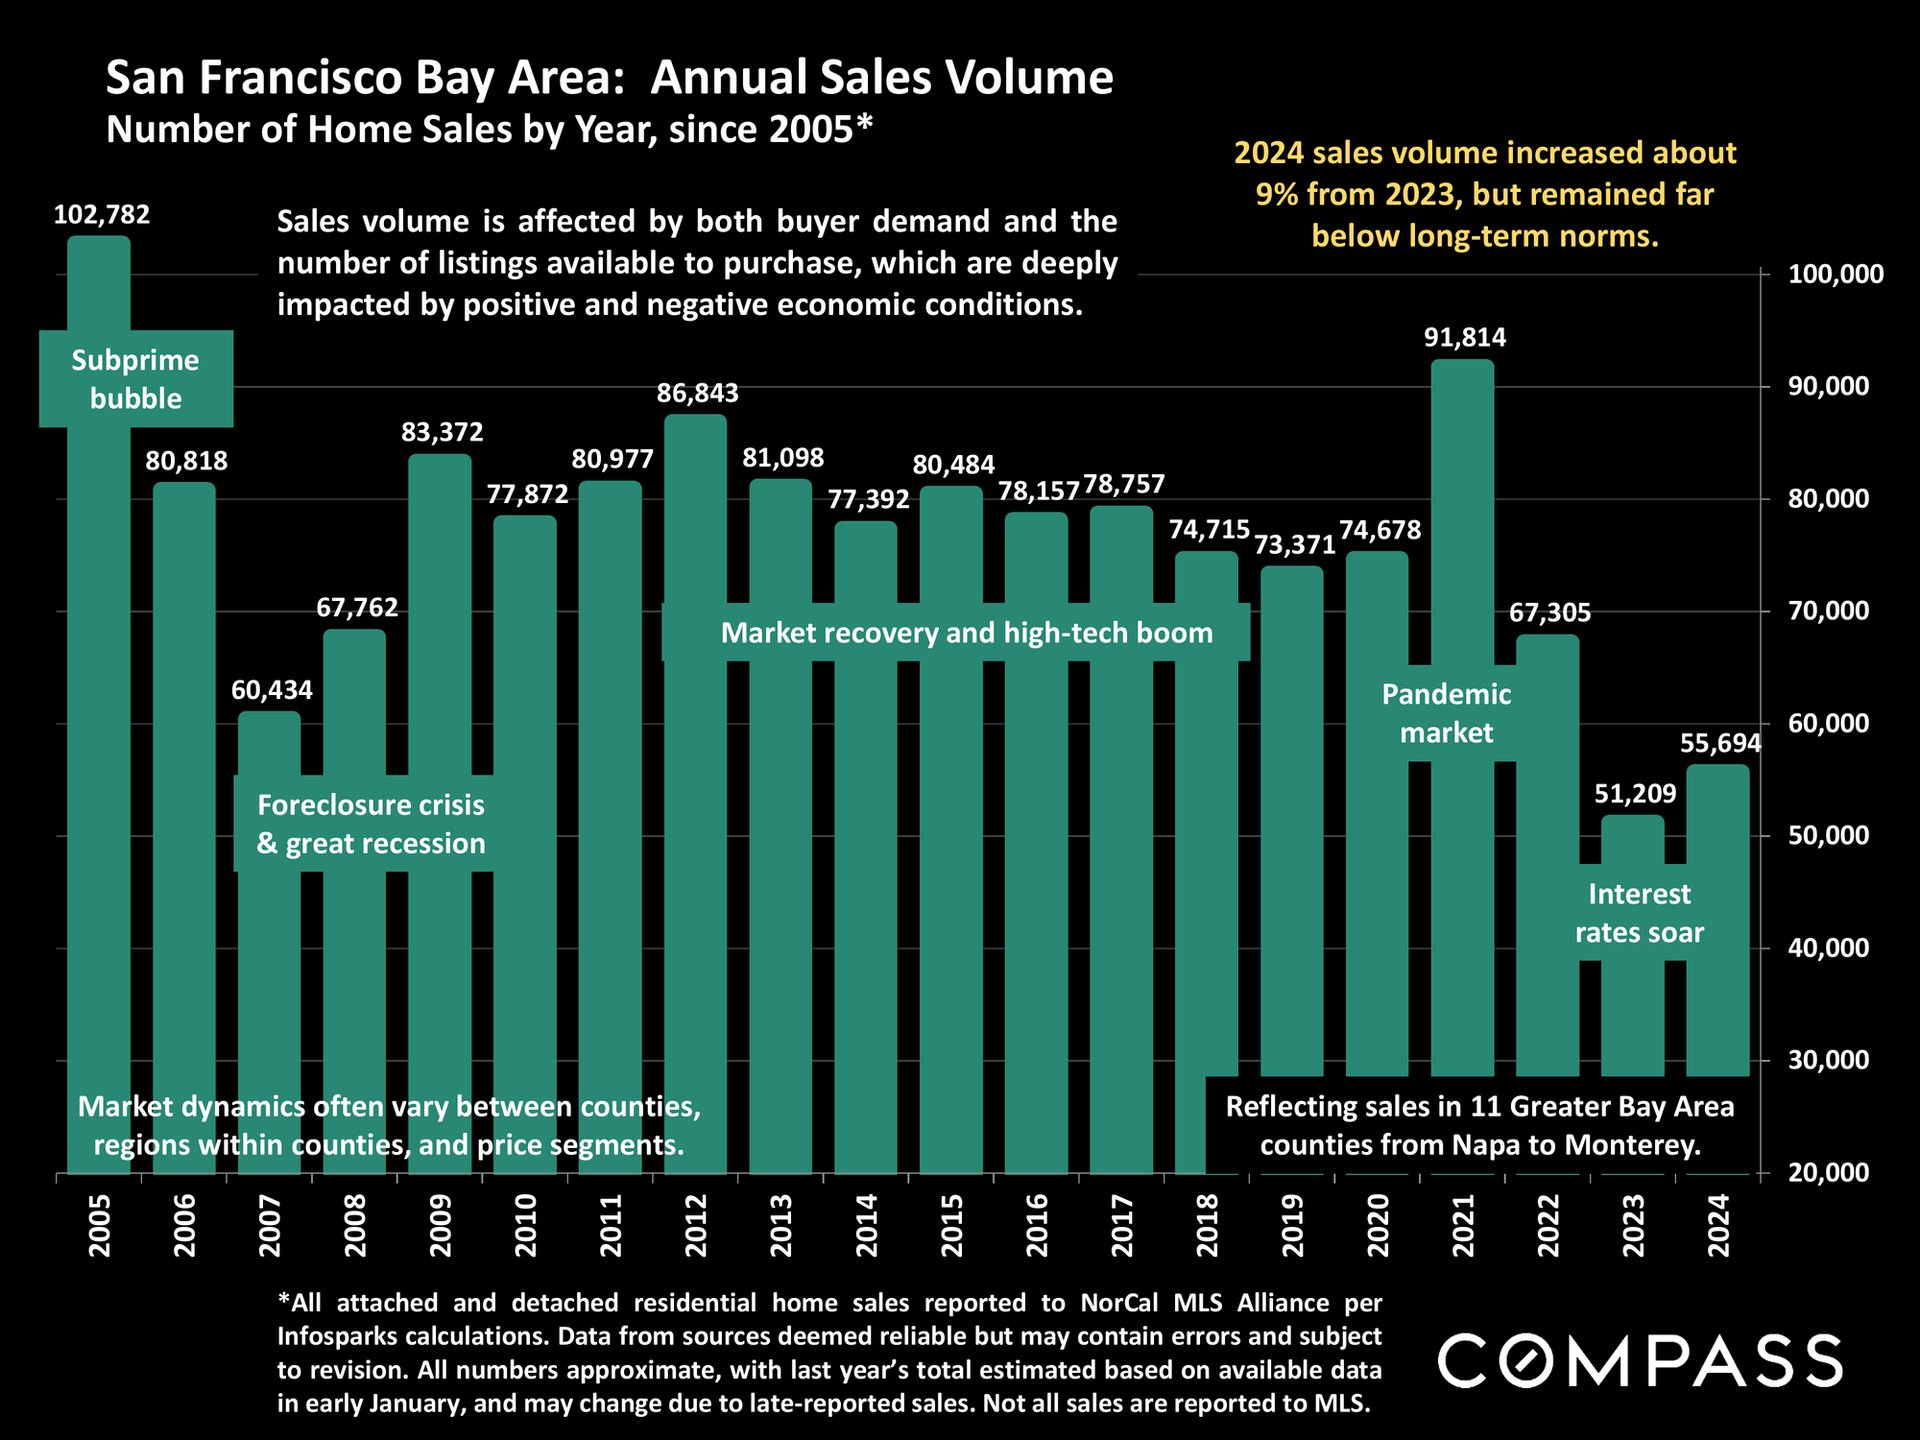
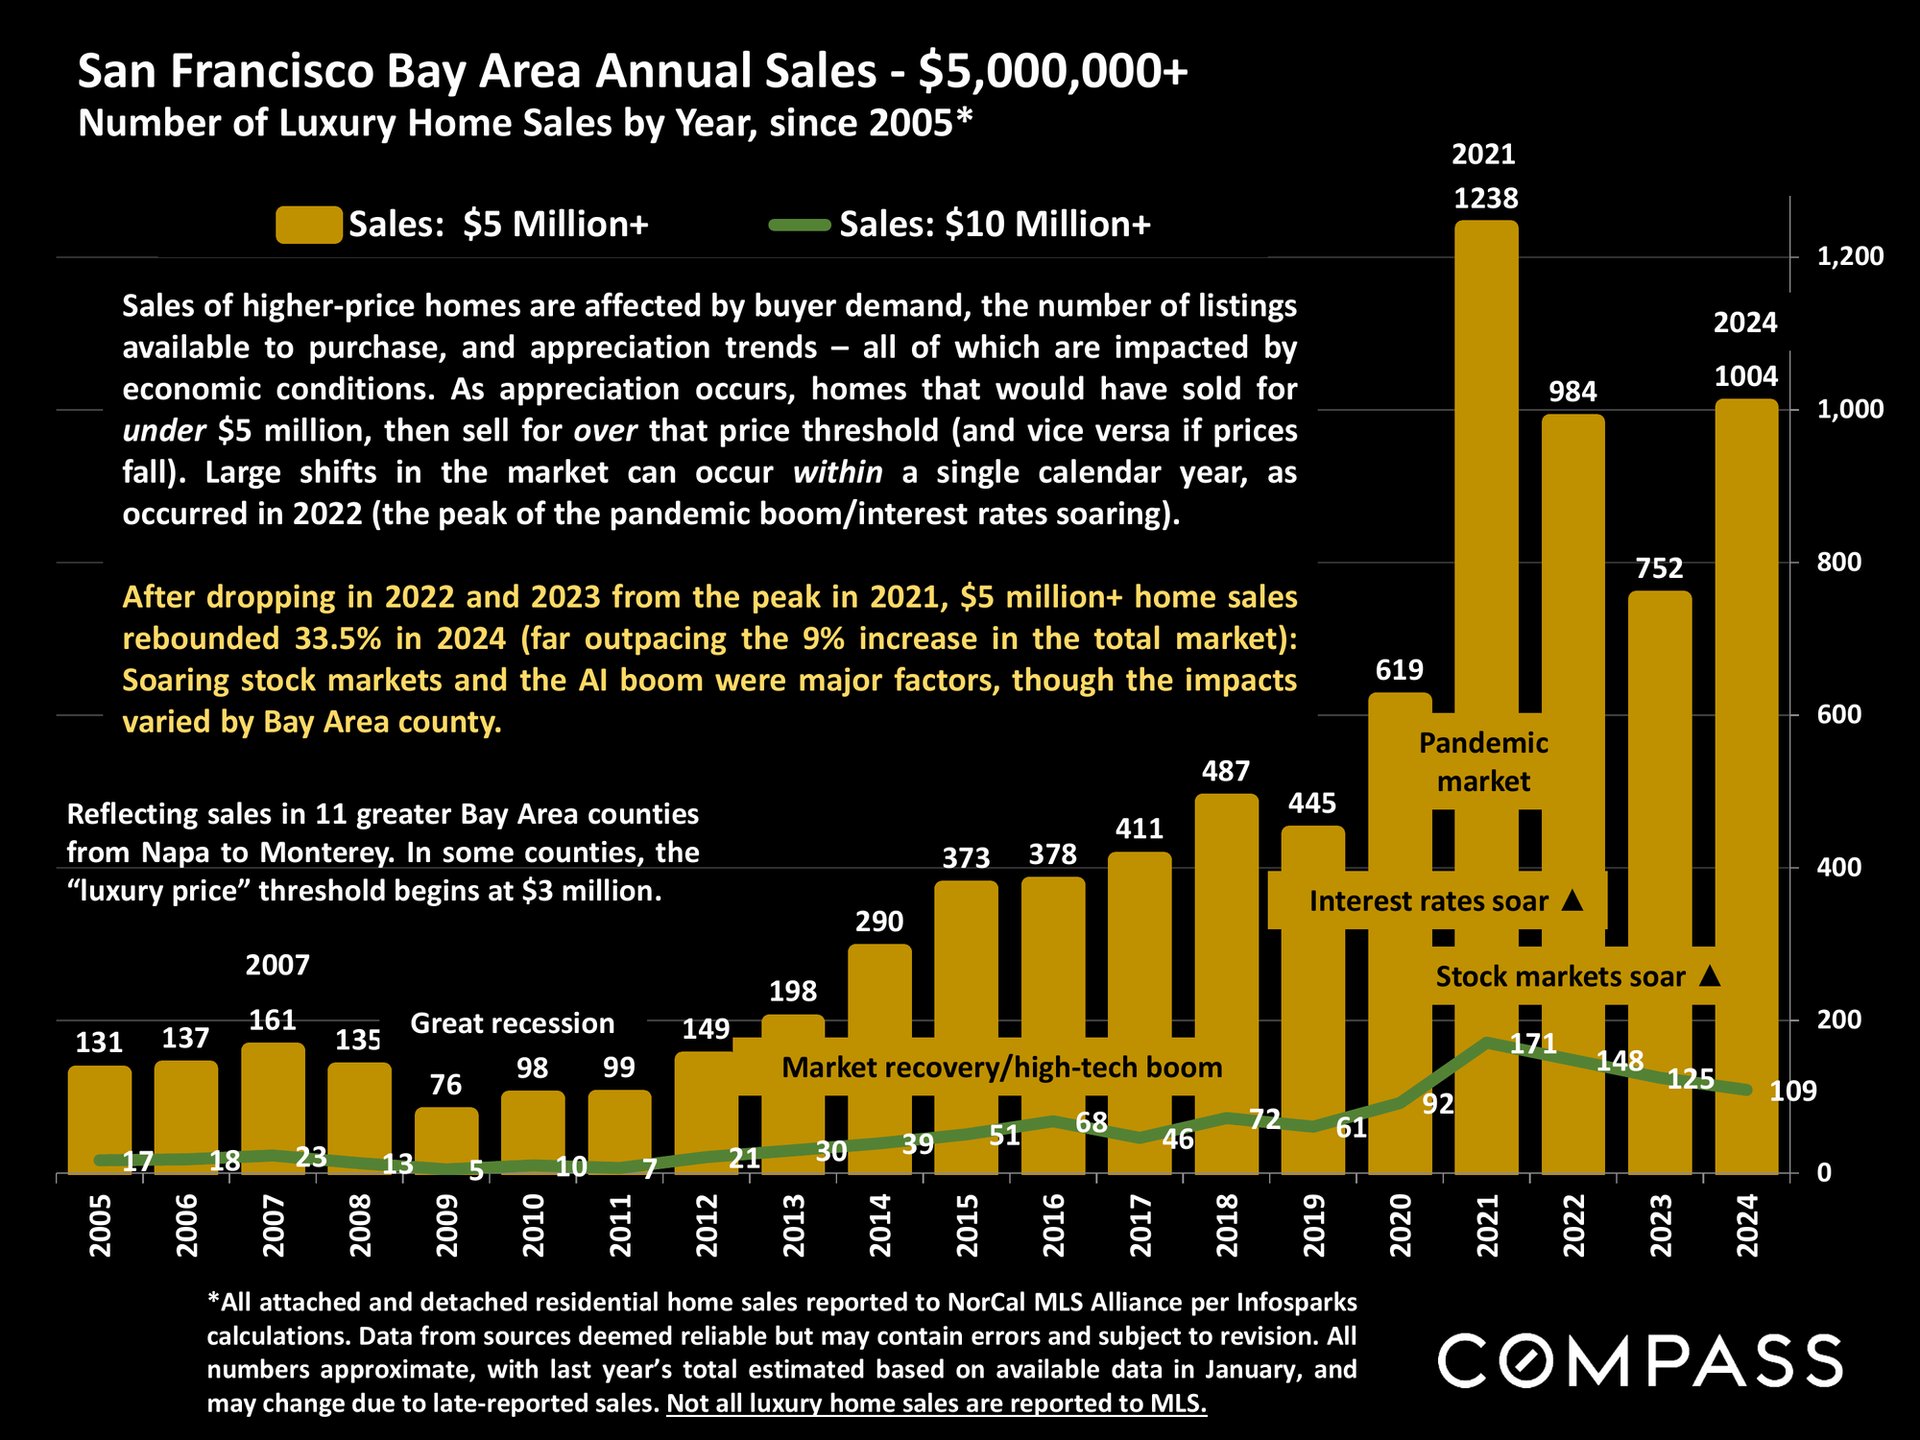
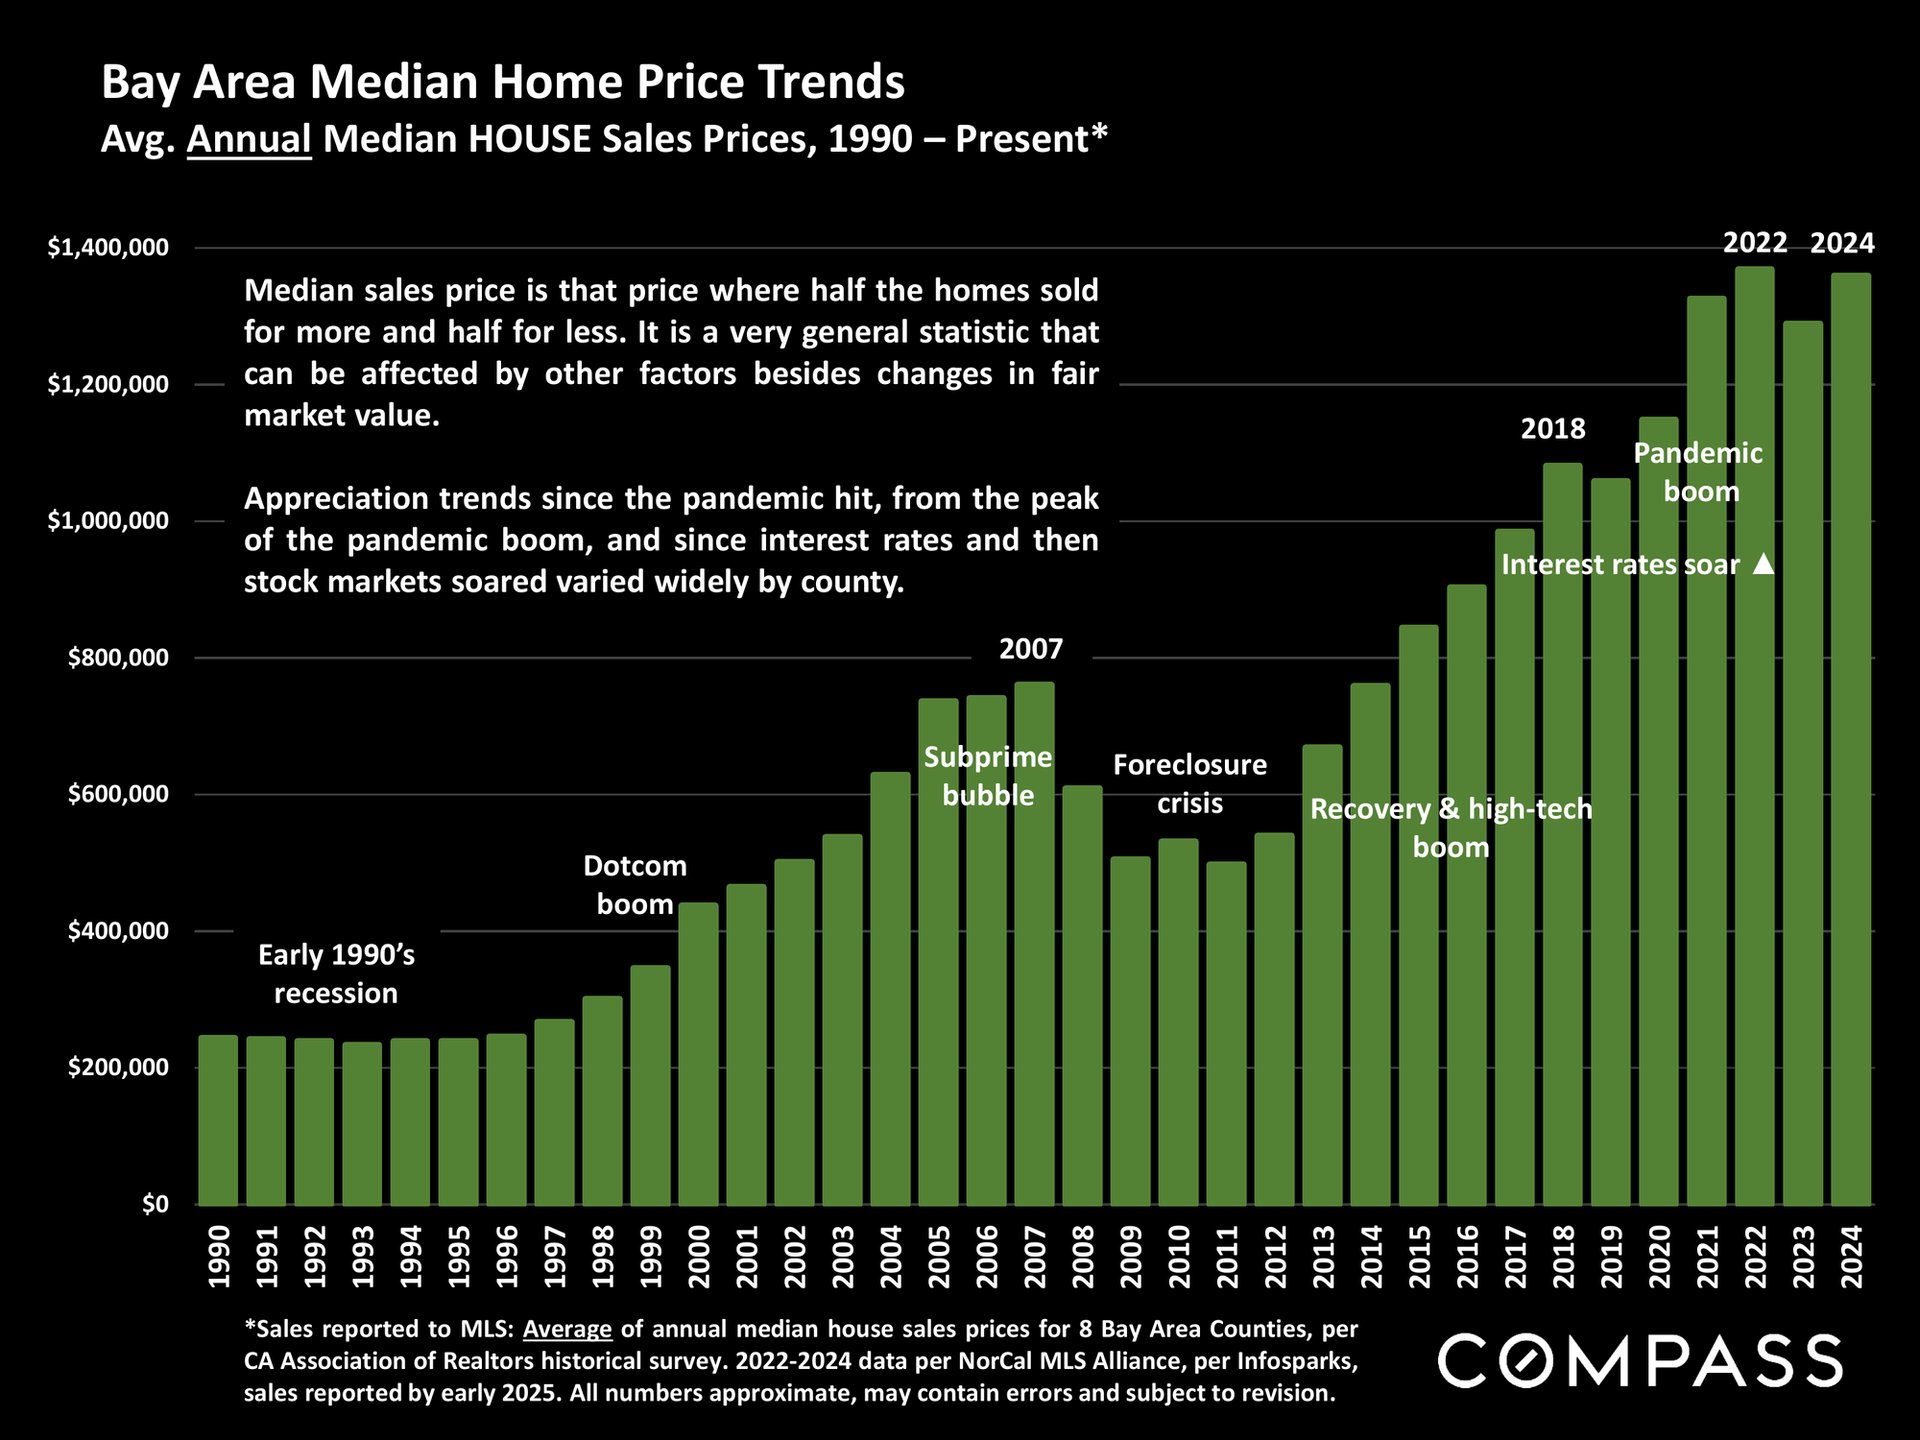
San Francisco Bay Area Real Estate Market Survey cover with a satellite view of the region.Chart of San Francisco Bay Area new listings from 2005 to 2024, with historical market annotations.Bar chart of San Francisco Bay Area home sales from 2005 to 2024, with annotations for major market periods.Chart of Bay Area luxury home sales from 2005 to 2024, showing a 2021 peak and 2024 rebound.Chart of Bay Area median home prices, 1990–2024, showing long-term growth and the 2022 peak.
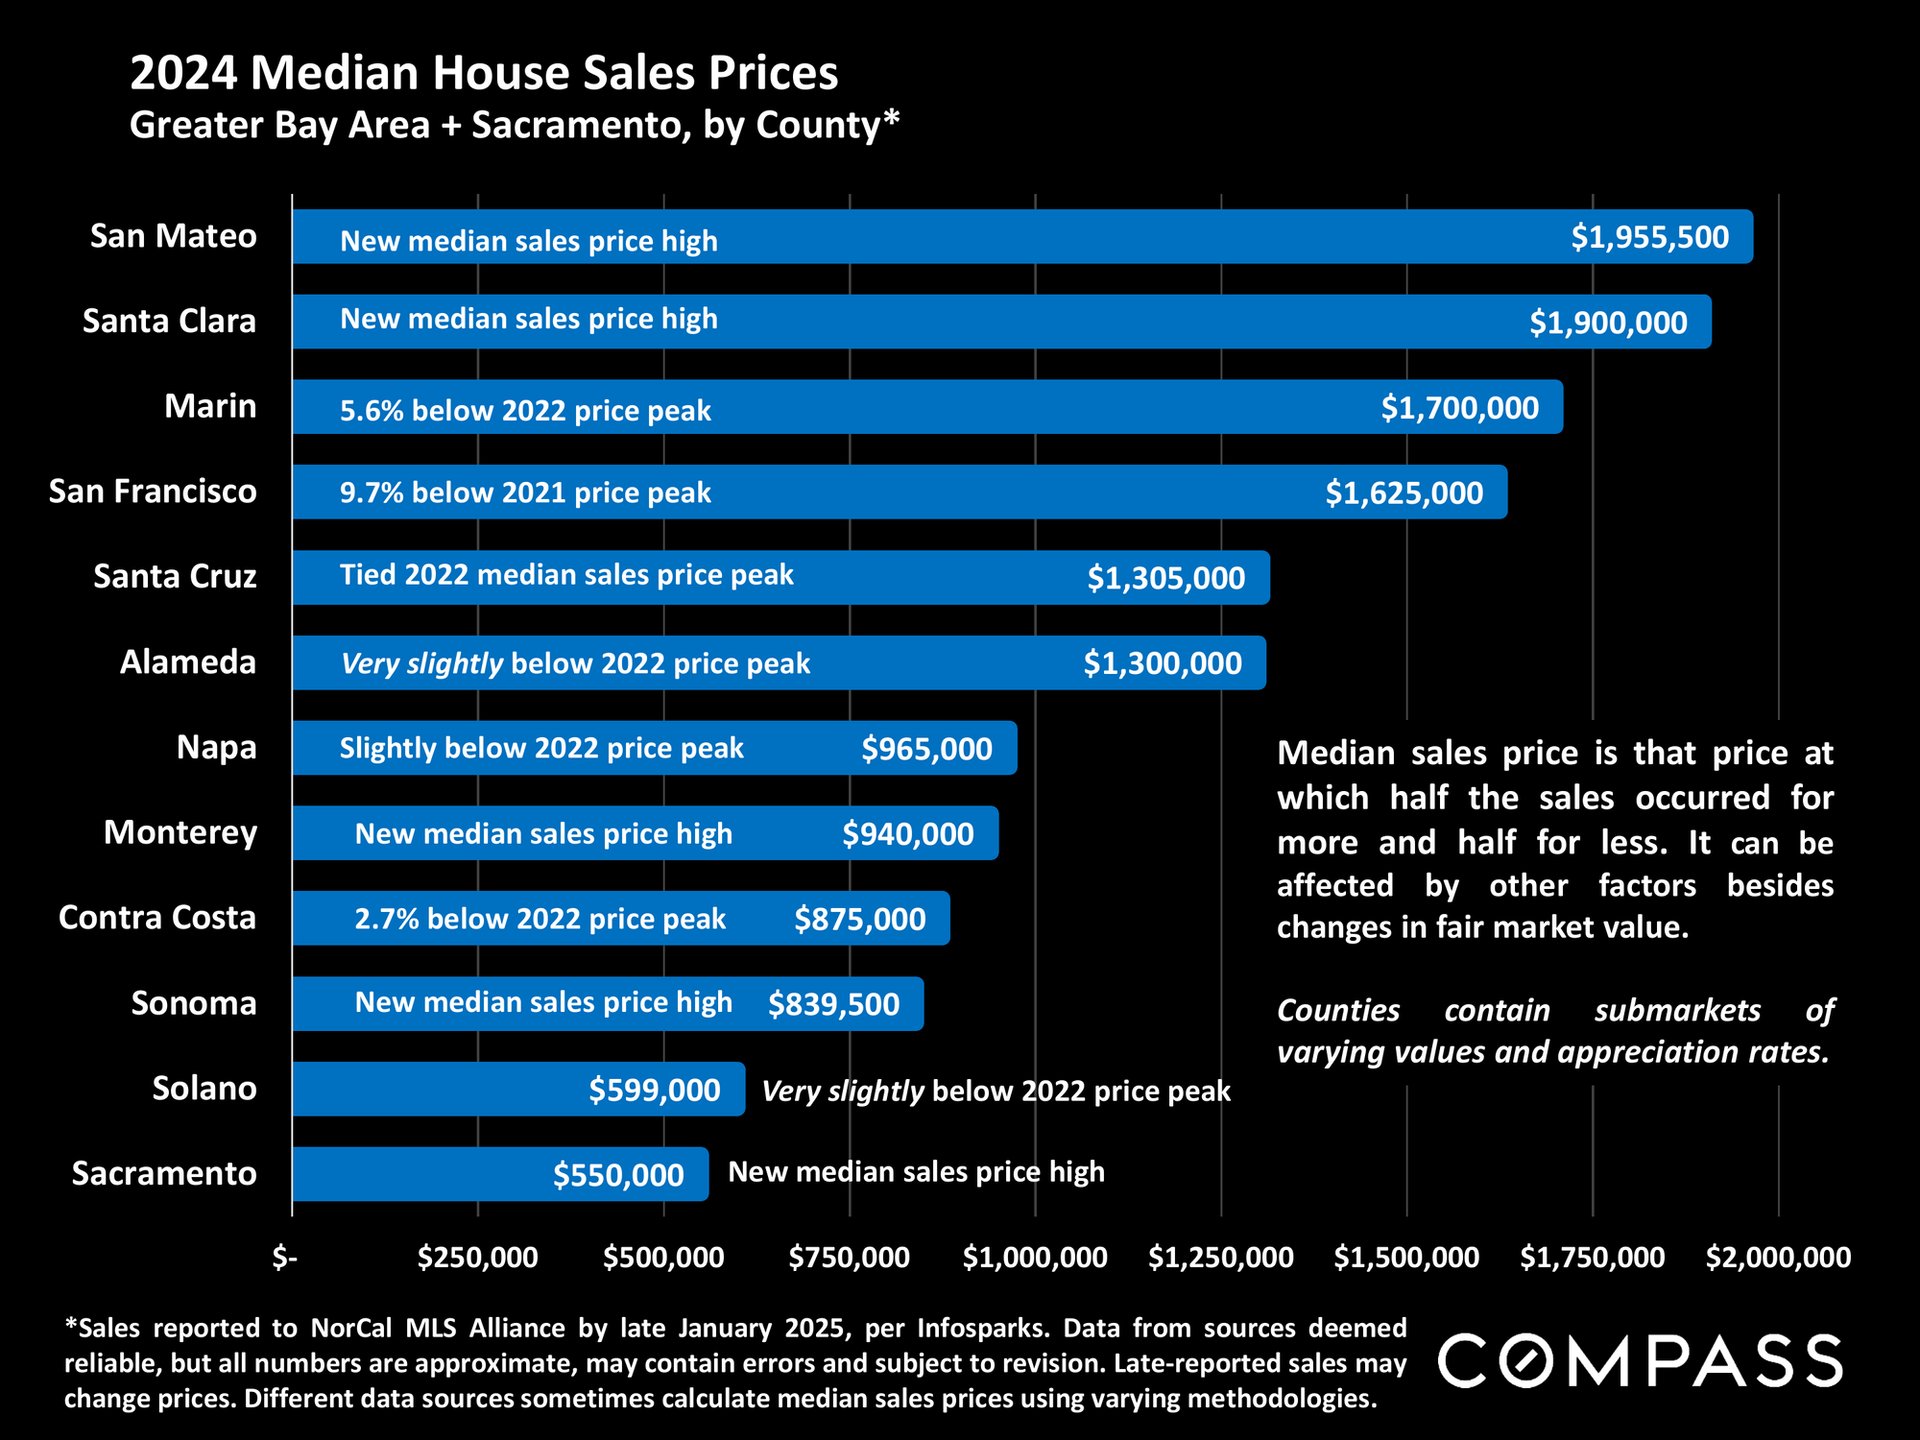
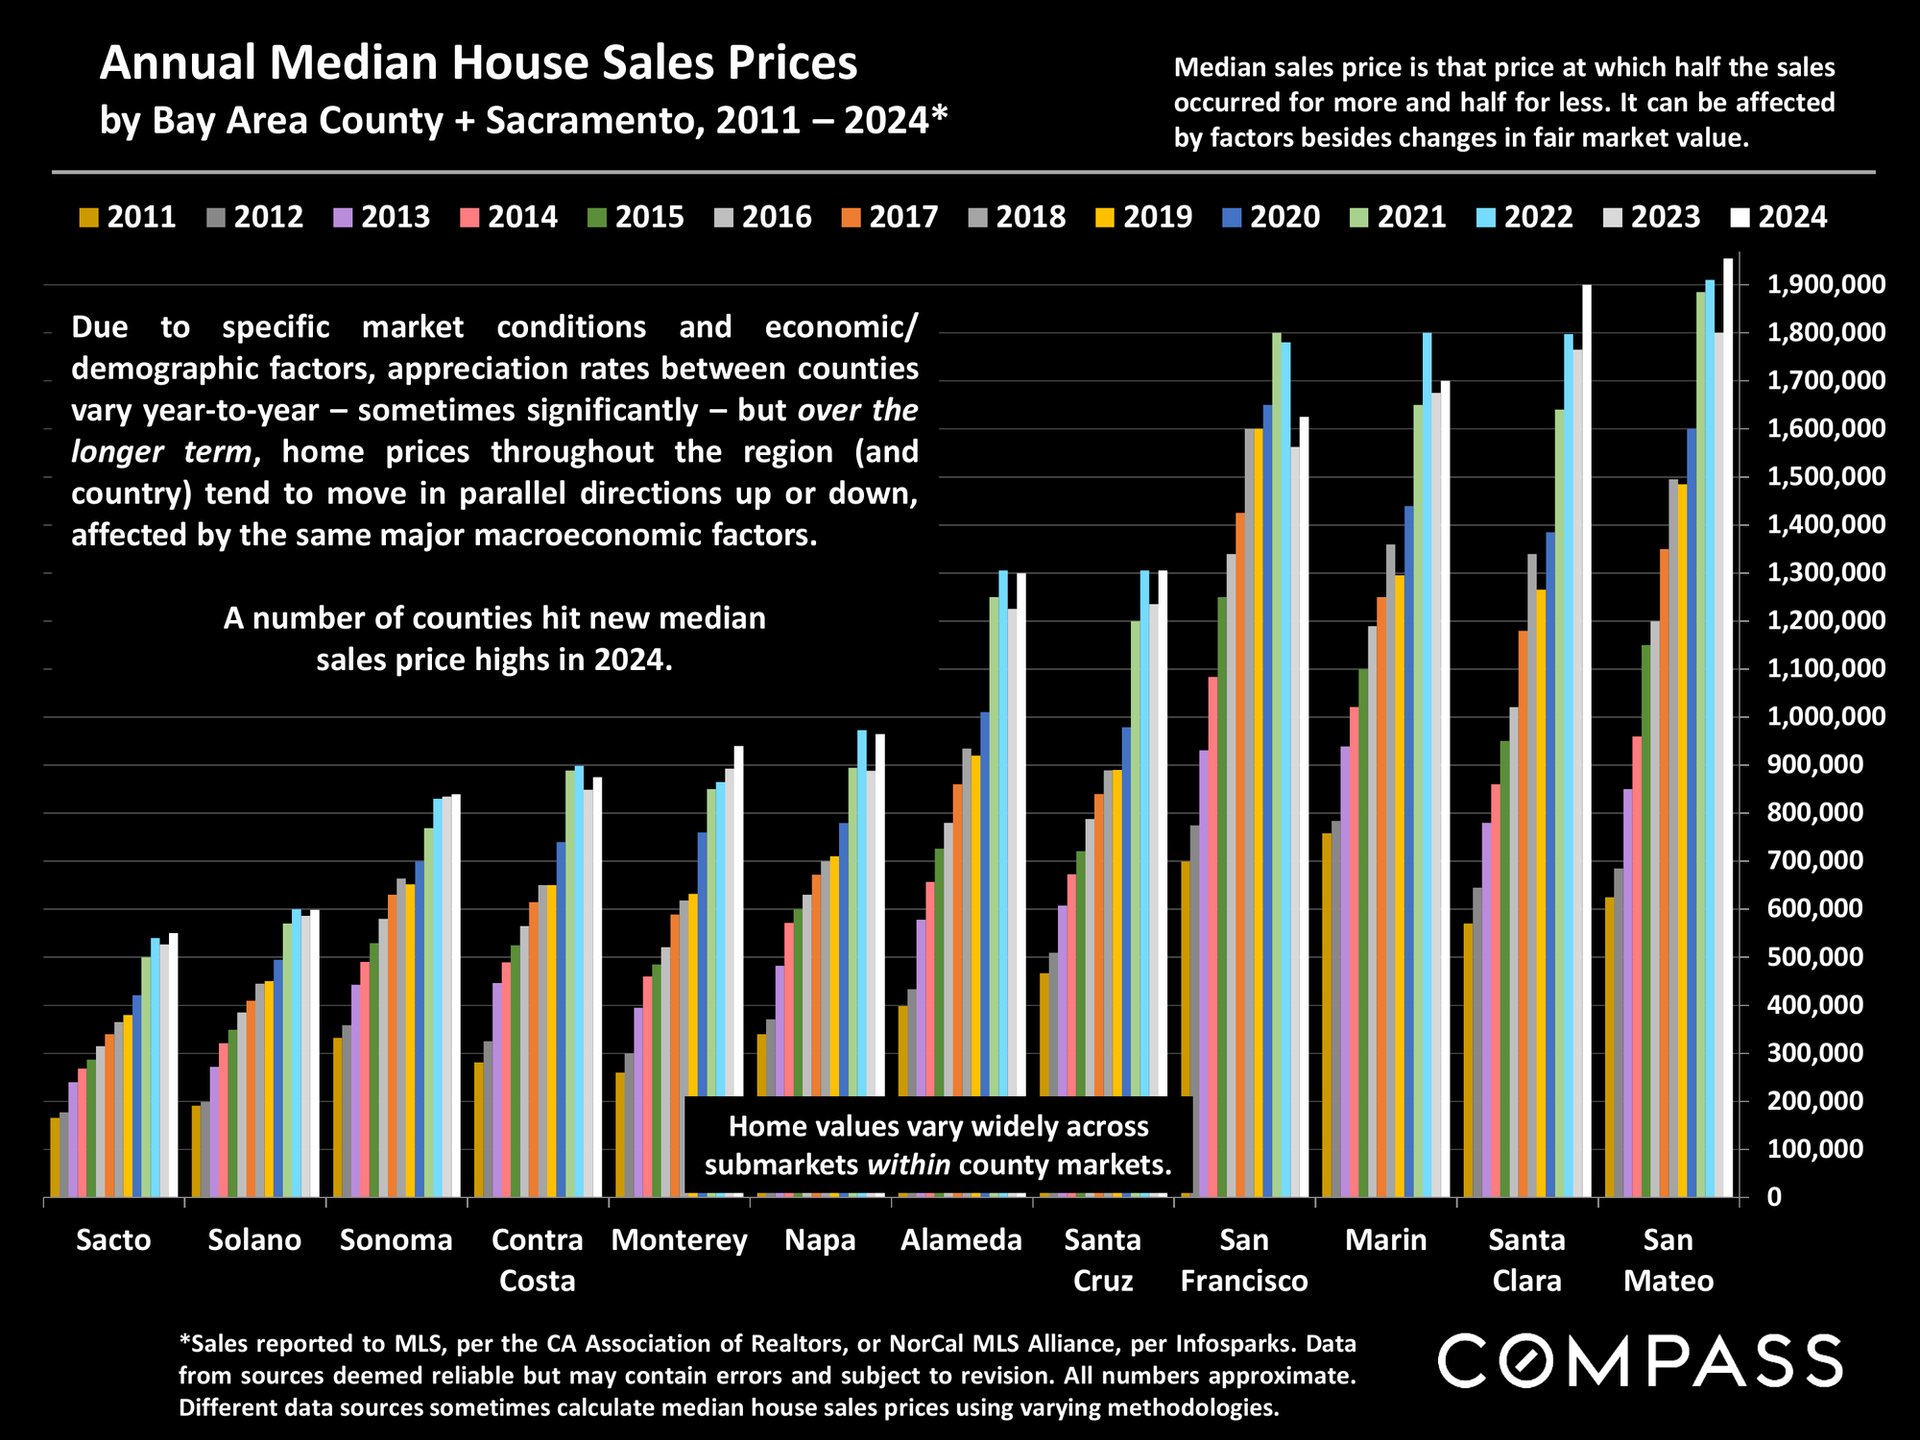
Chart of 2024 median home sale prices by county, led by San Mateo at $1,955,500 and Santa Clara at $1,900,000.Bar chart comparing annual median house sale prices across Bay Area counties and Sacramento from 2011 to 2024.
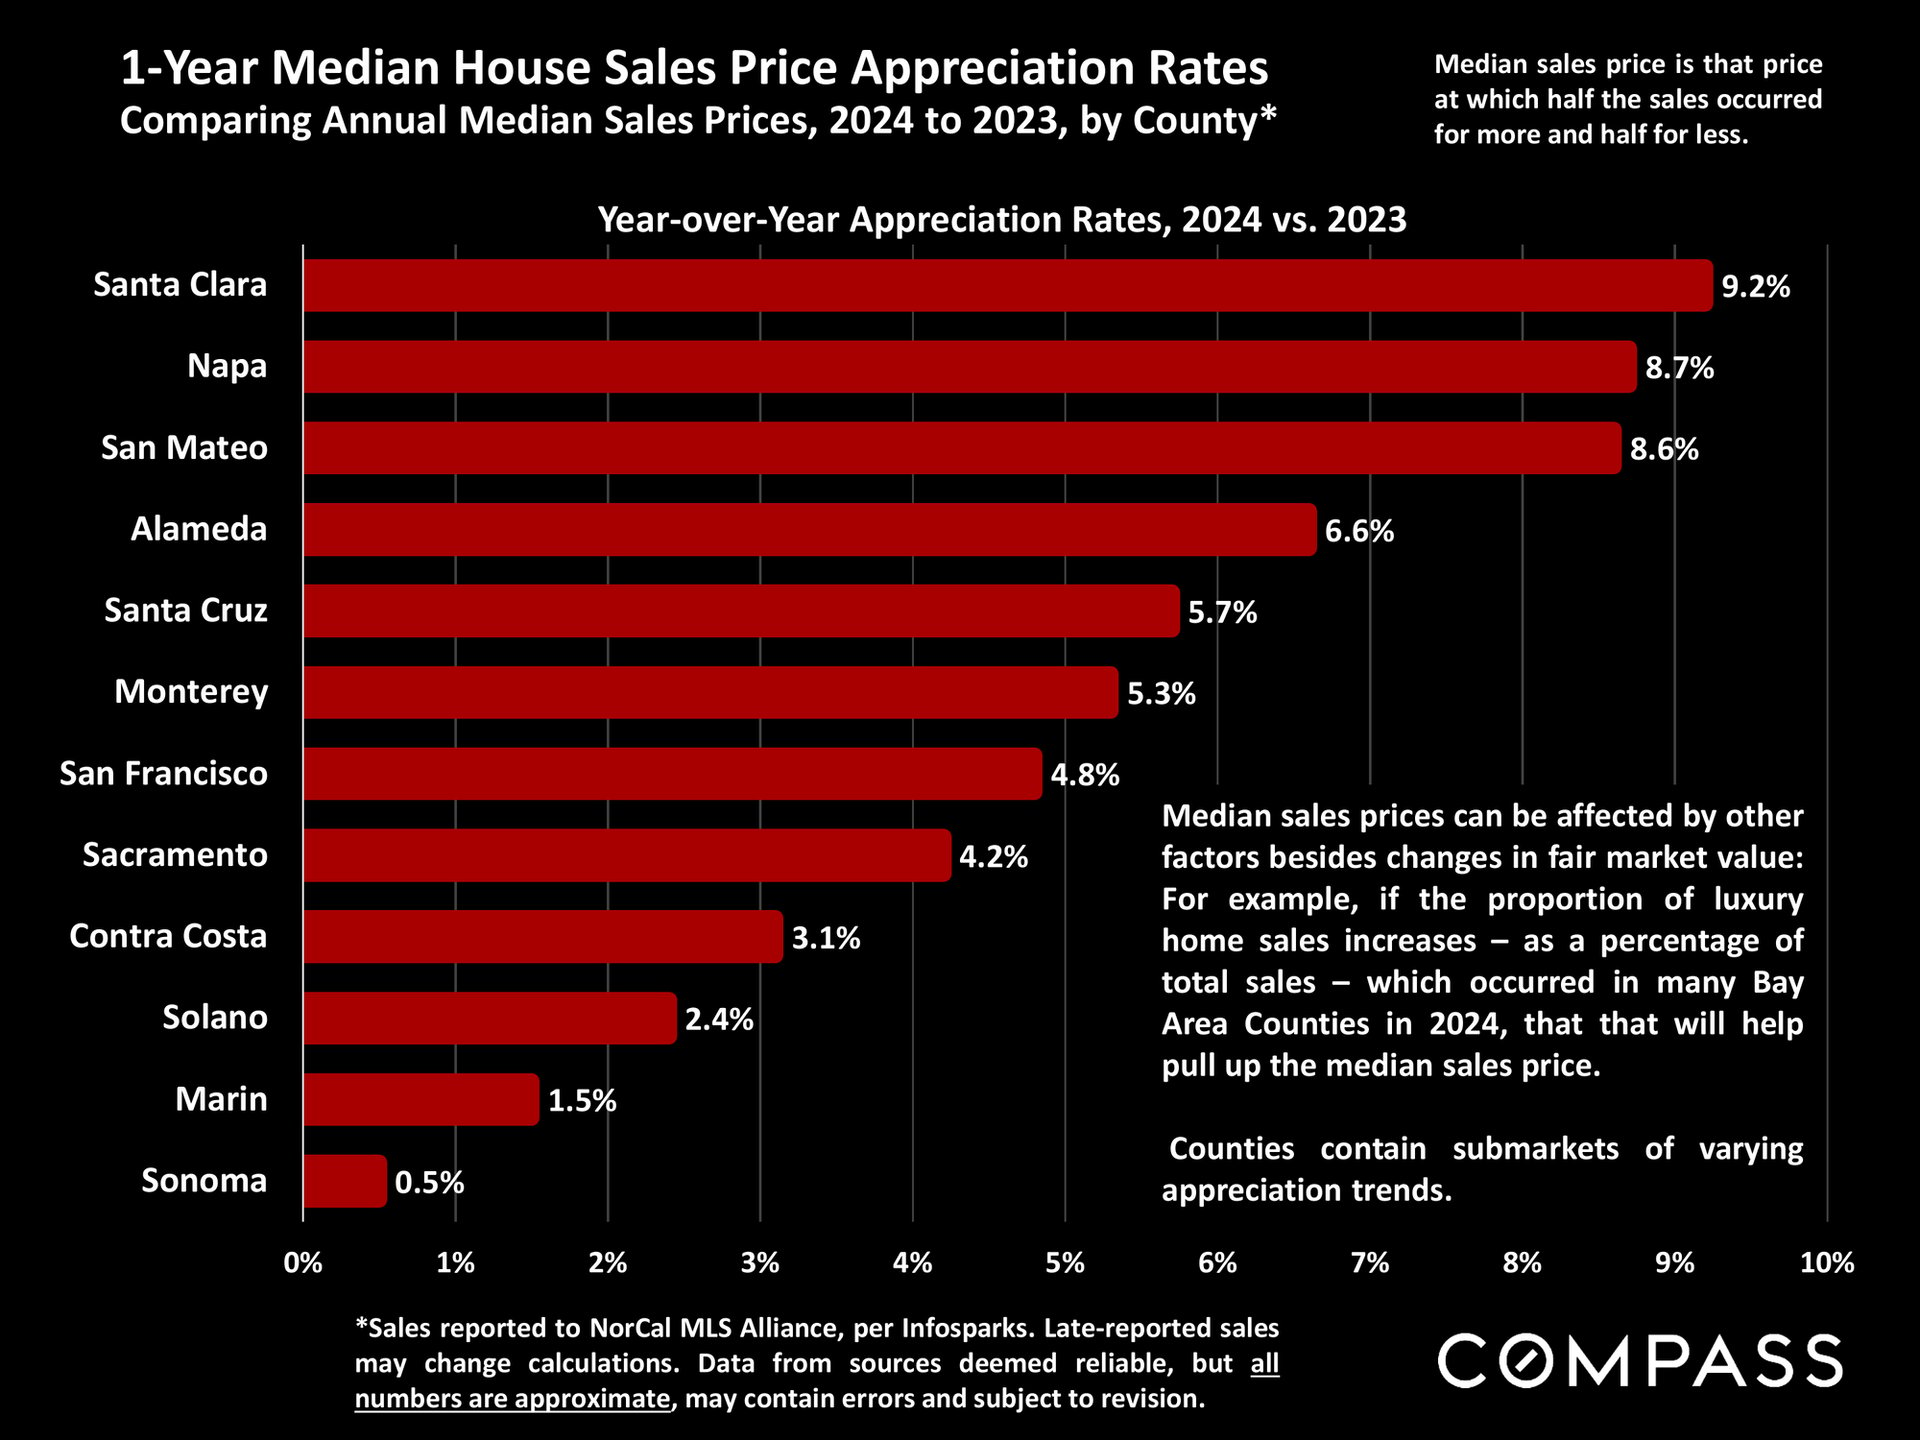
Bar chart of 2024 median house price appreciation by county, led by Santa Clara at 9.2% and Sonoma at 0.5%.
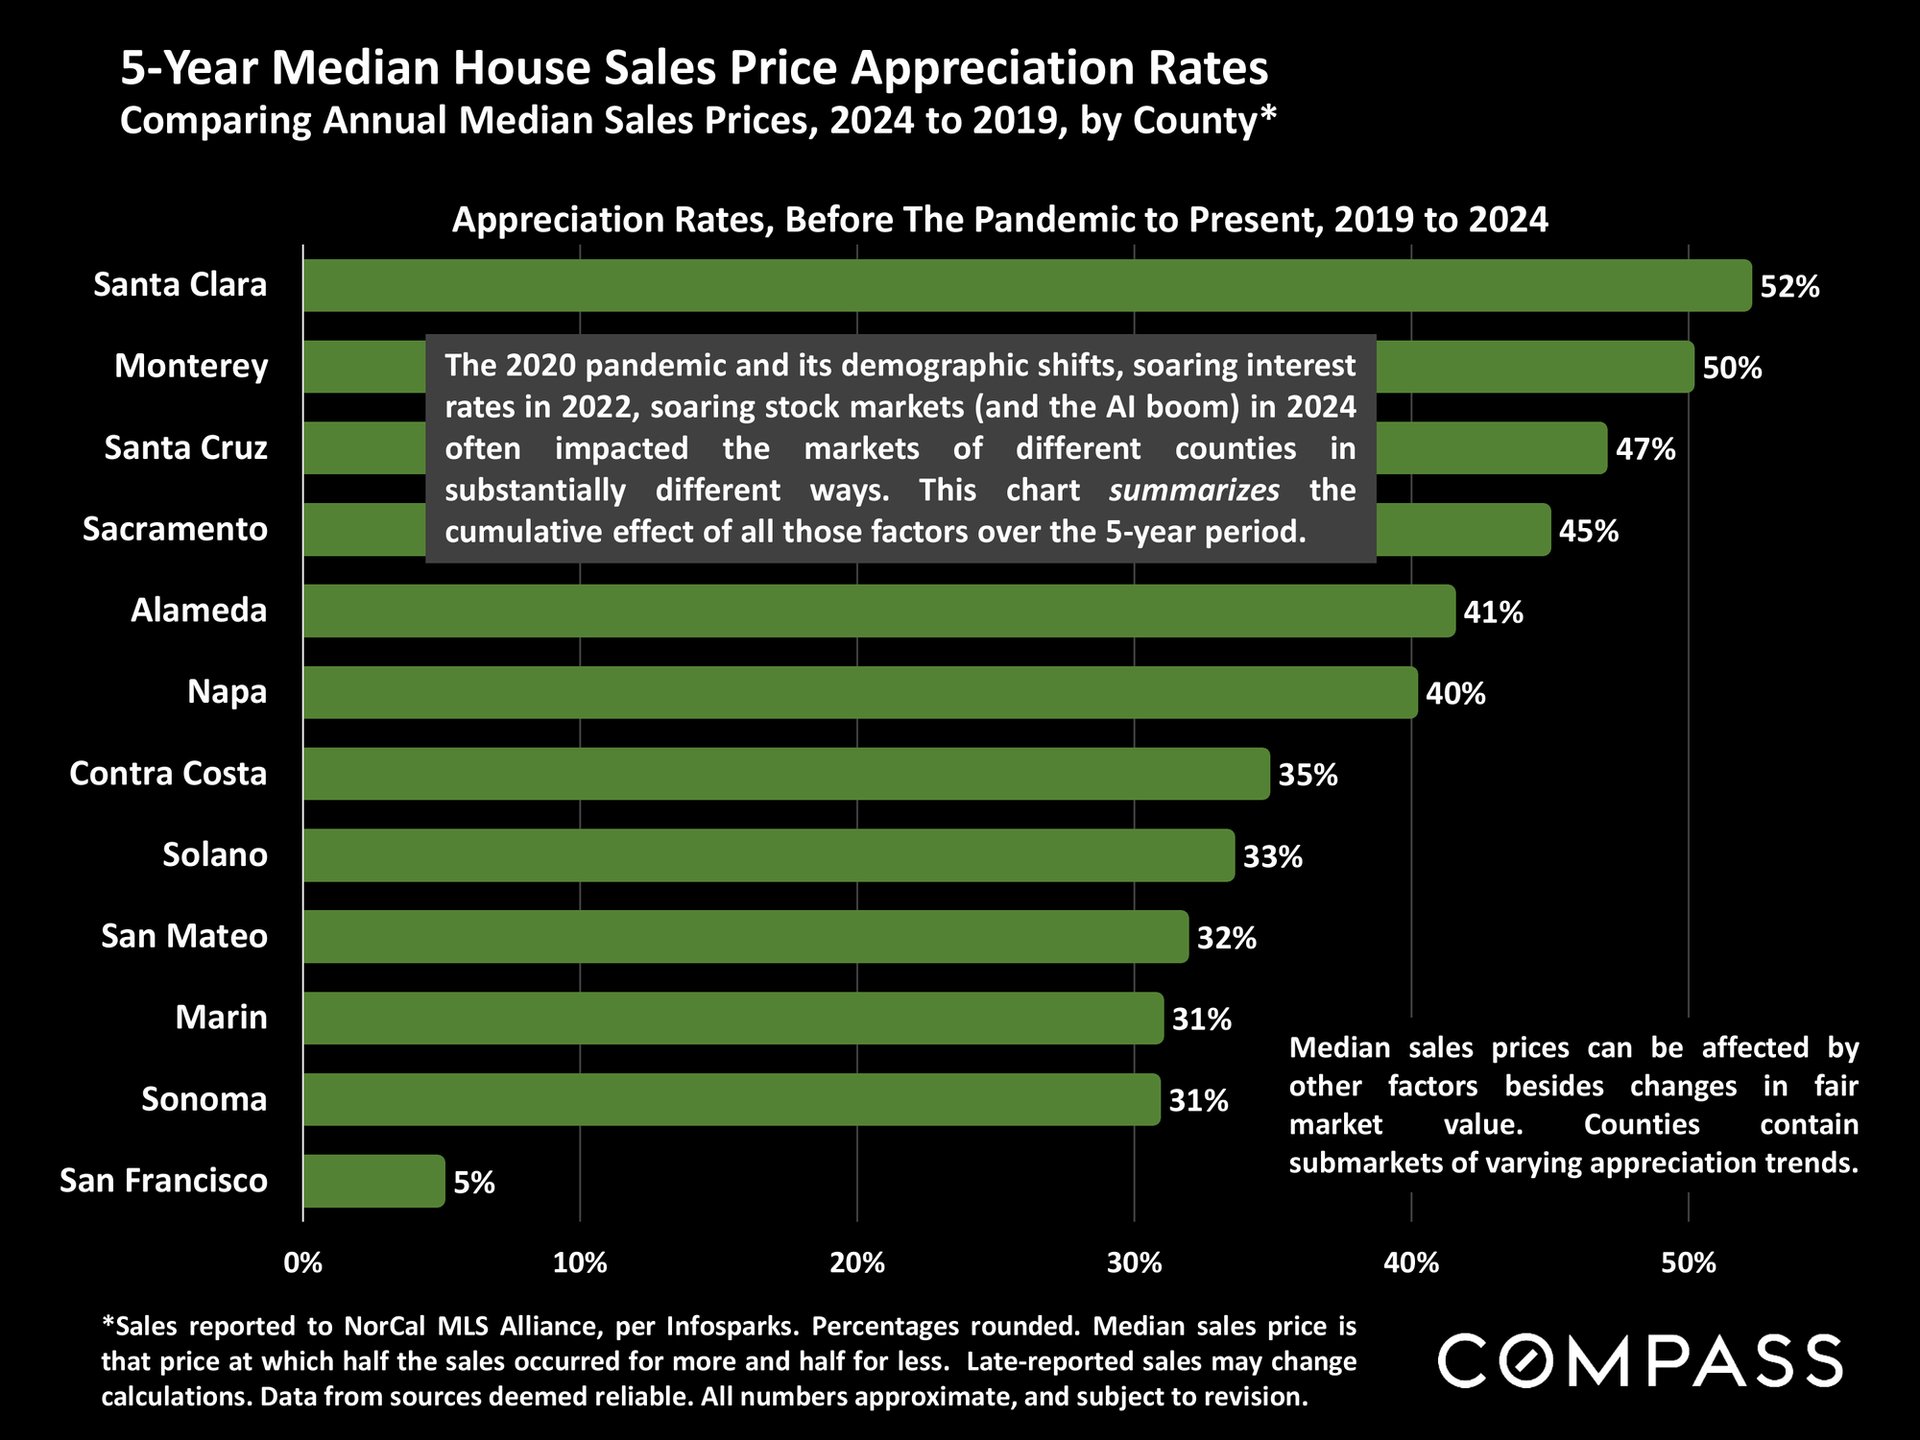
Chart comparing 2019–2024 median home price appreciation by county; Santa Clara leads at 52%, San Francisco at 5%.
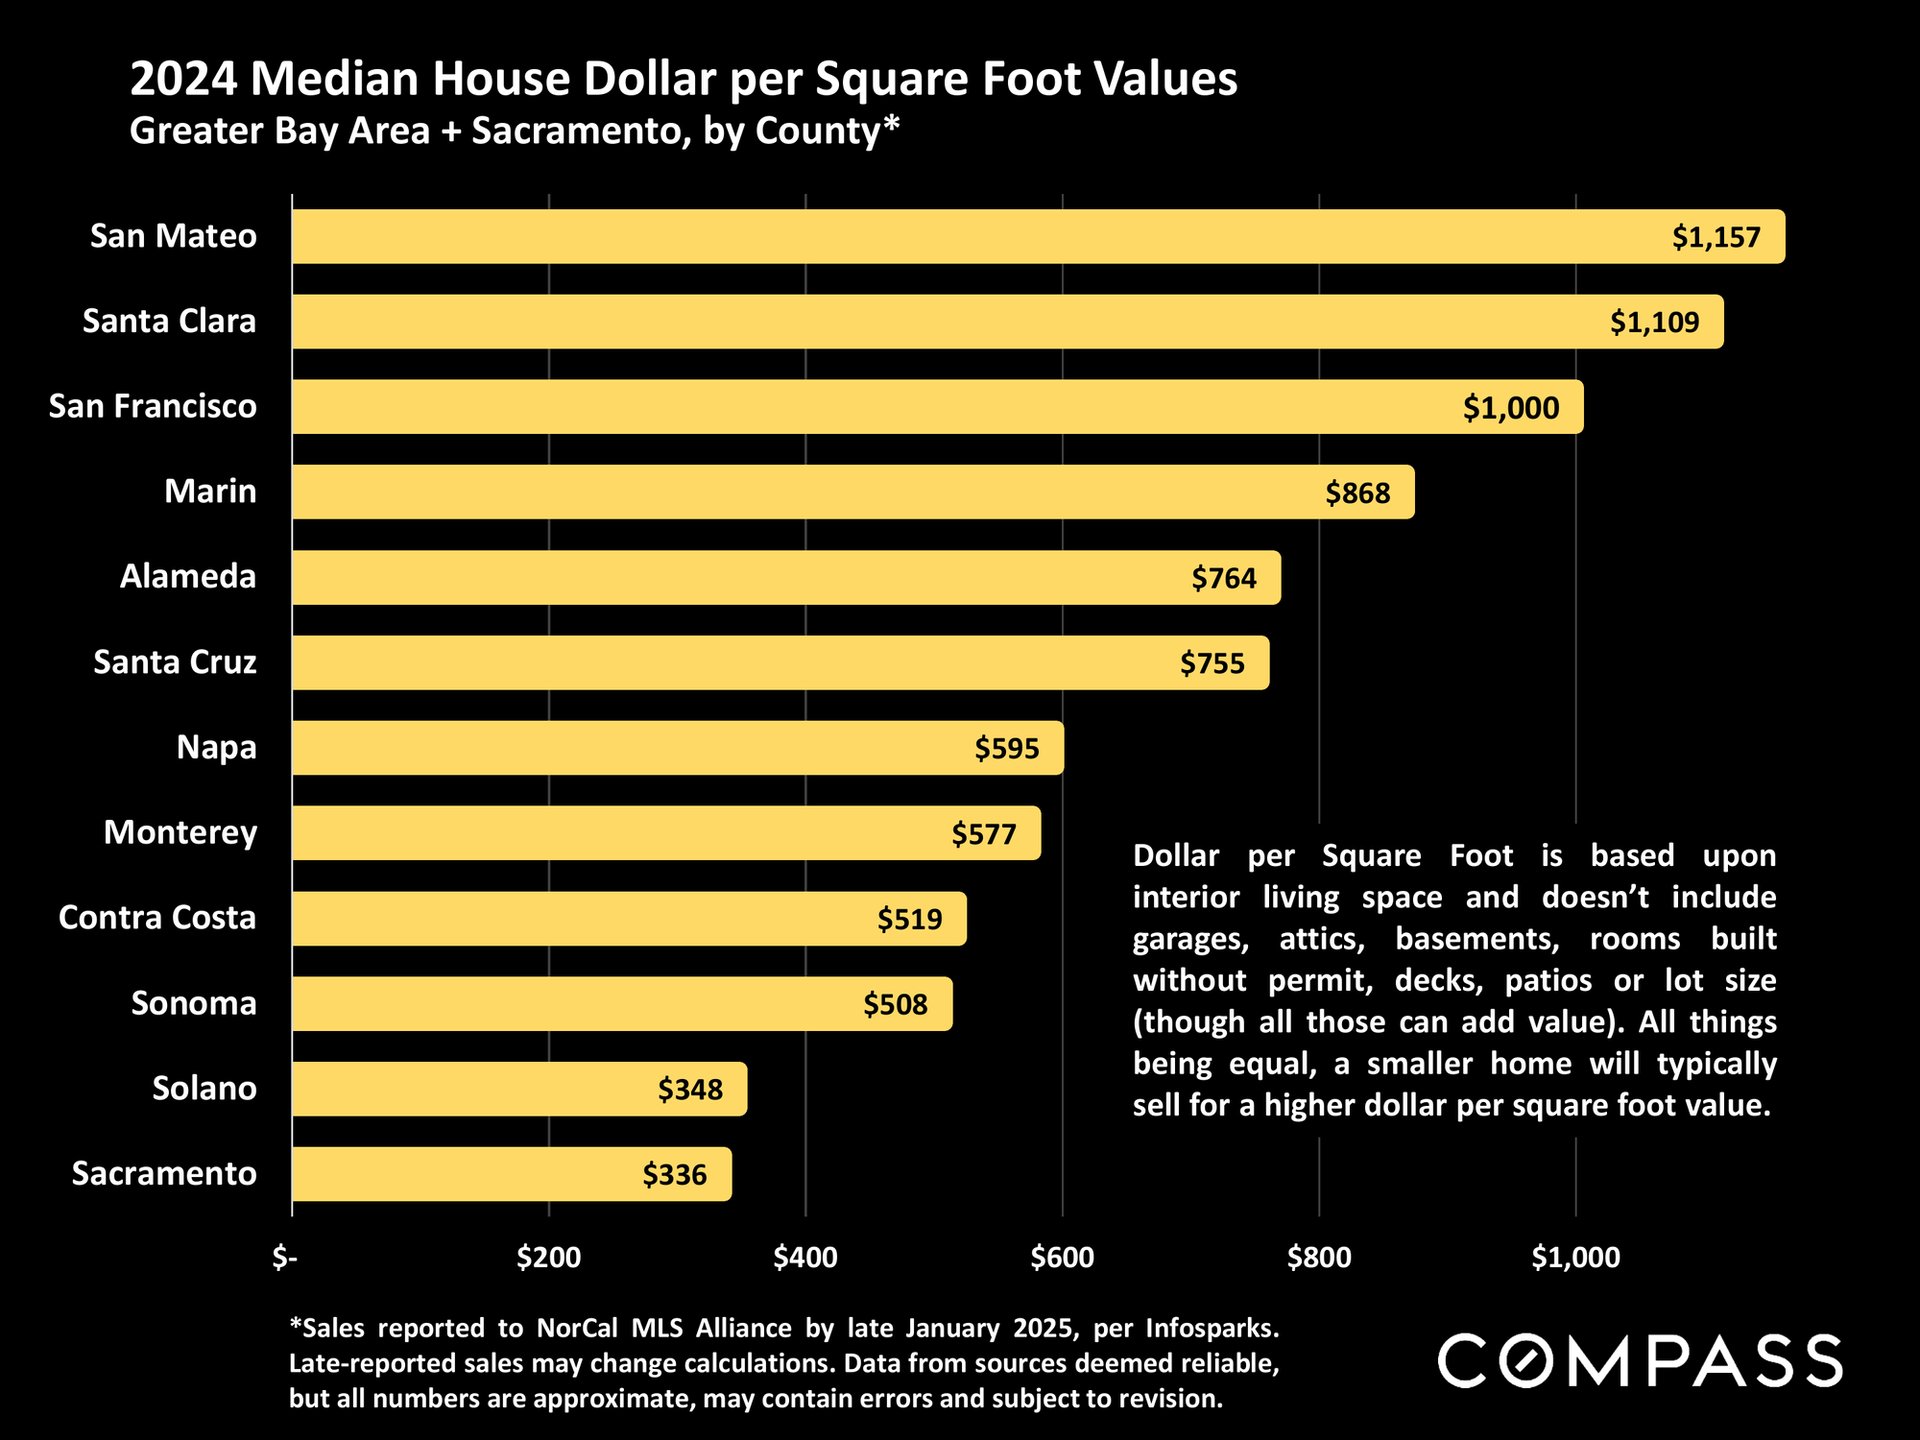
Bar chart of 2024 median house price per square foot by county; San Mateo leads at $1,157, Sacramento is lowest at $336.
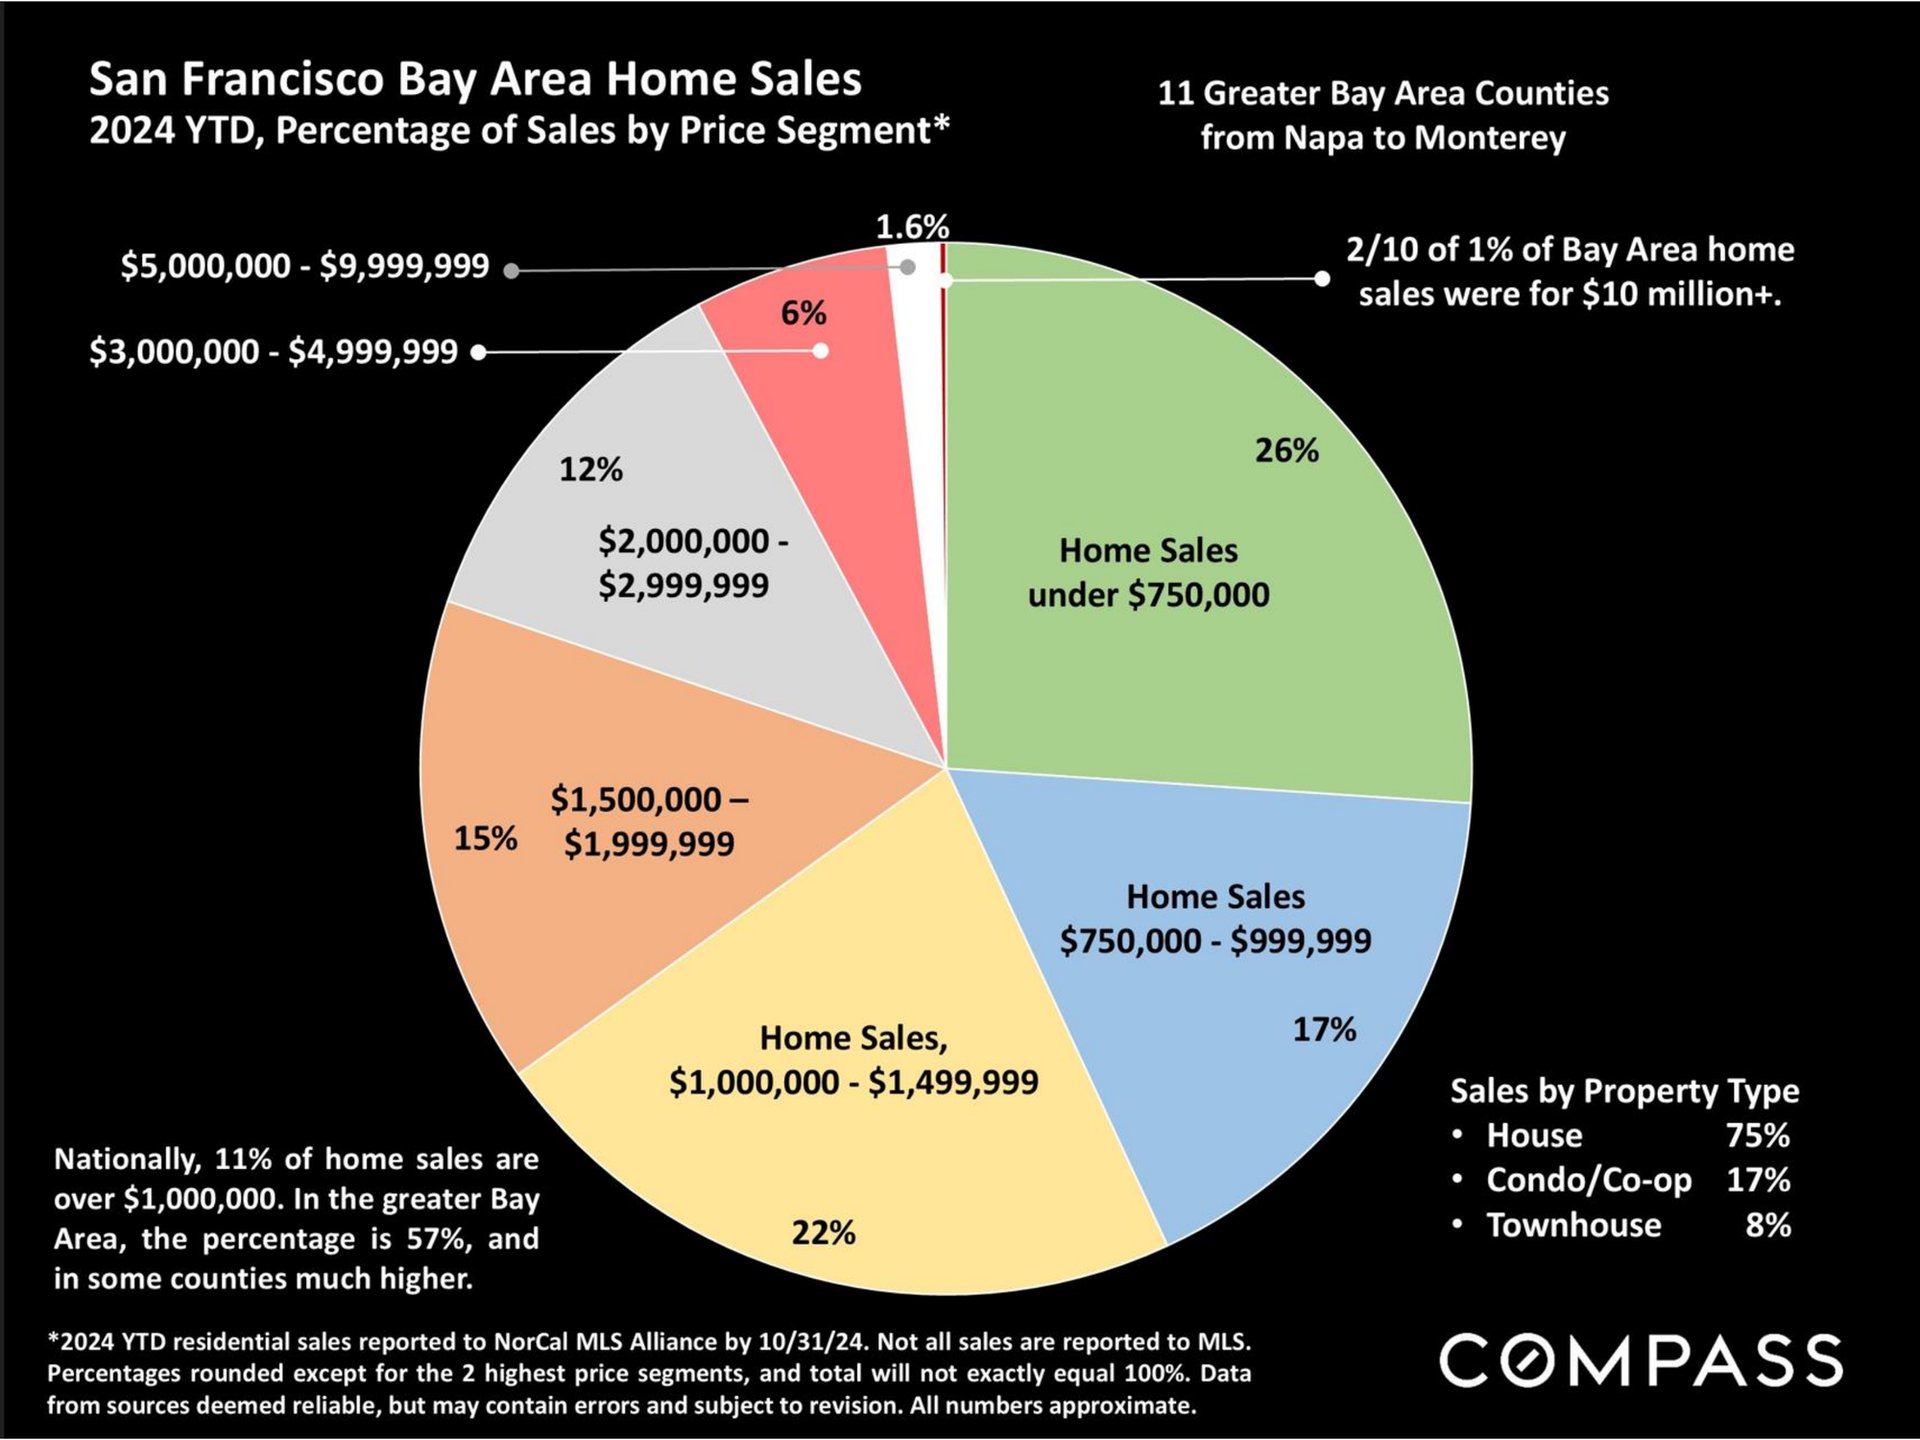
San Francisco Bay Area home sales pie chart showing 2024 year-to-date percentages by price segment.
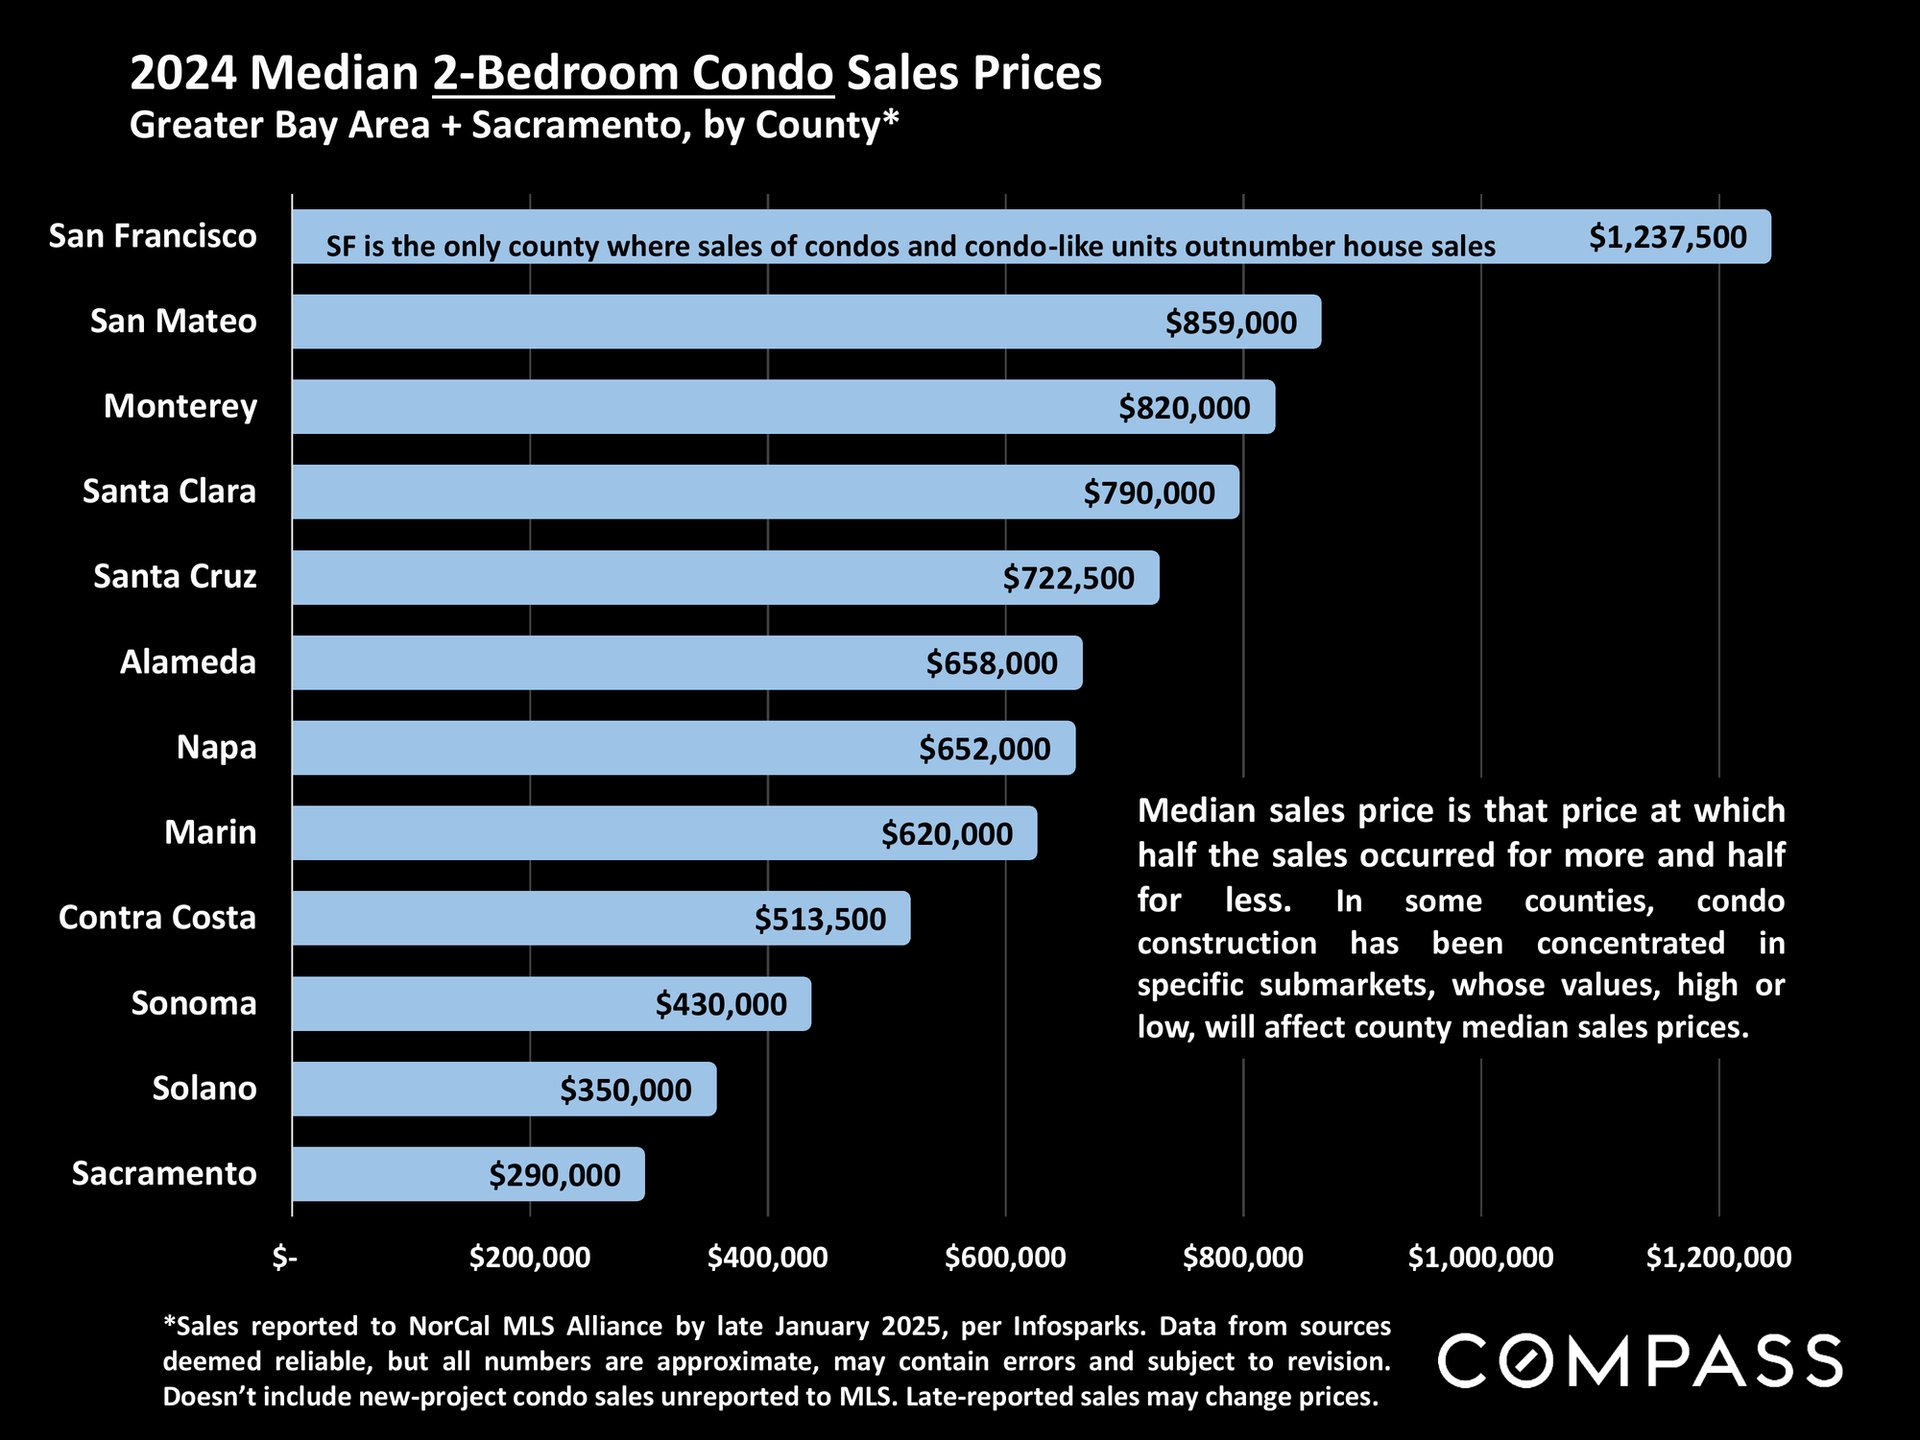
Chart of 2024 median two-bedroom condo prices by county, from $1,237,500 in San Francisco to $290,000 in Sacramento.
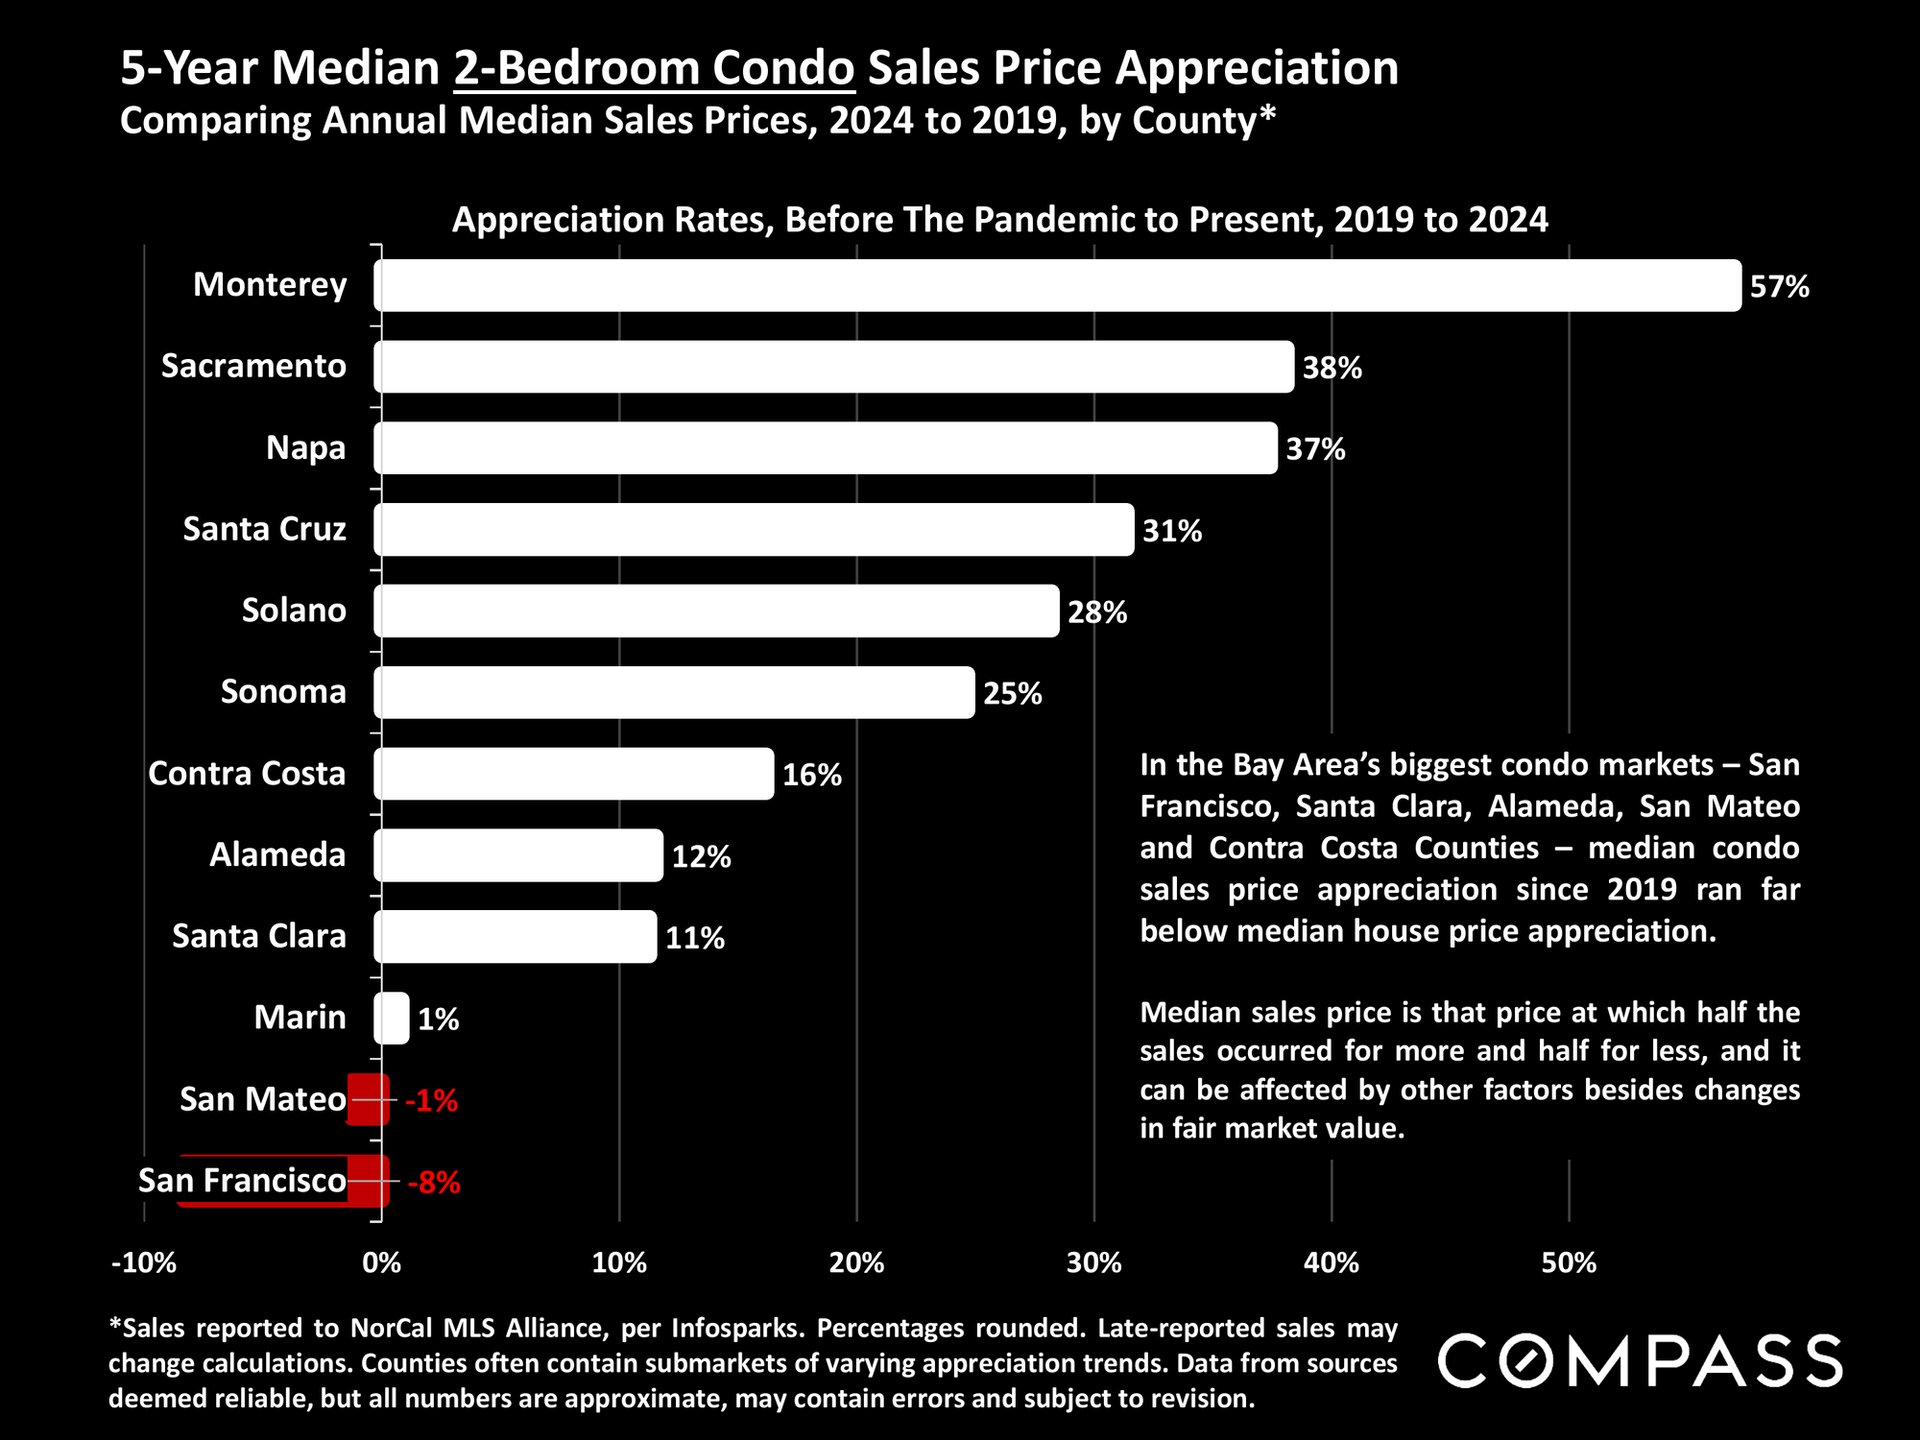
Chart of five-year two-bedroom condo price appreciation by county, led by Monterey at 57%; San Francisco declined 8%.
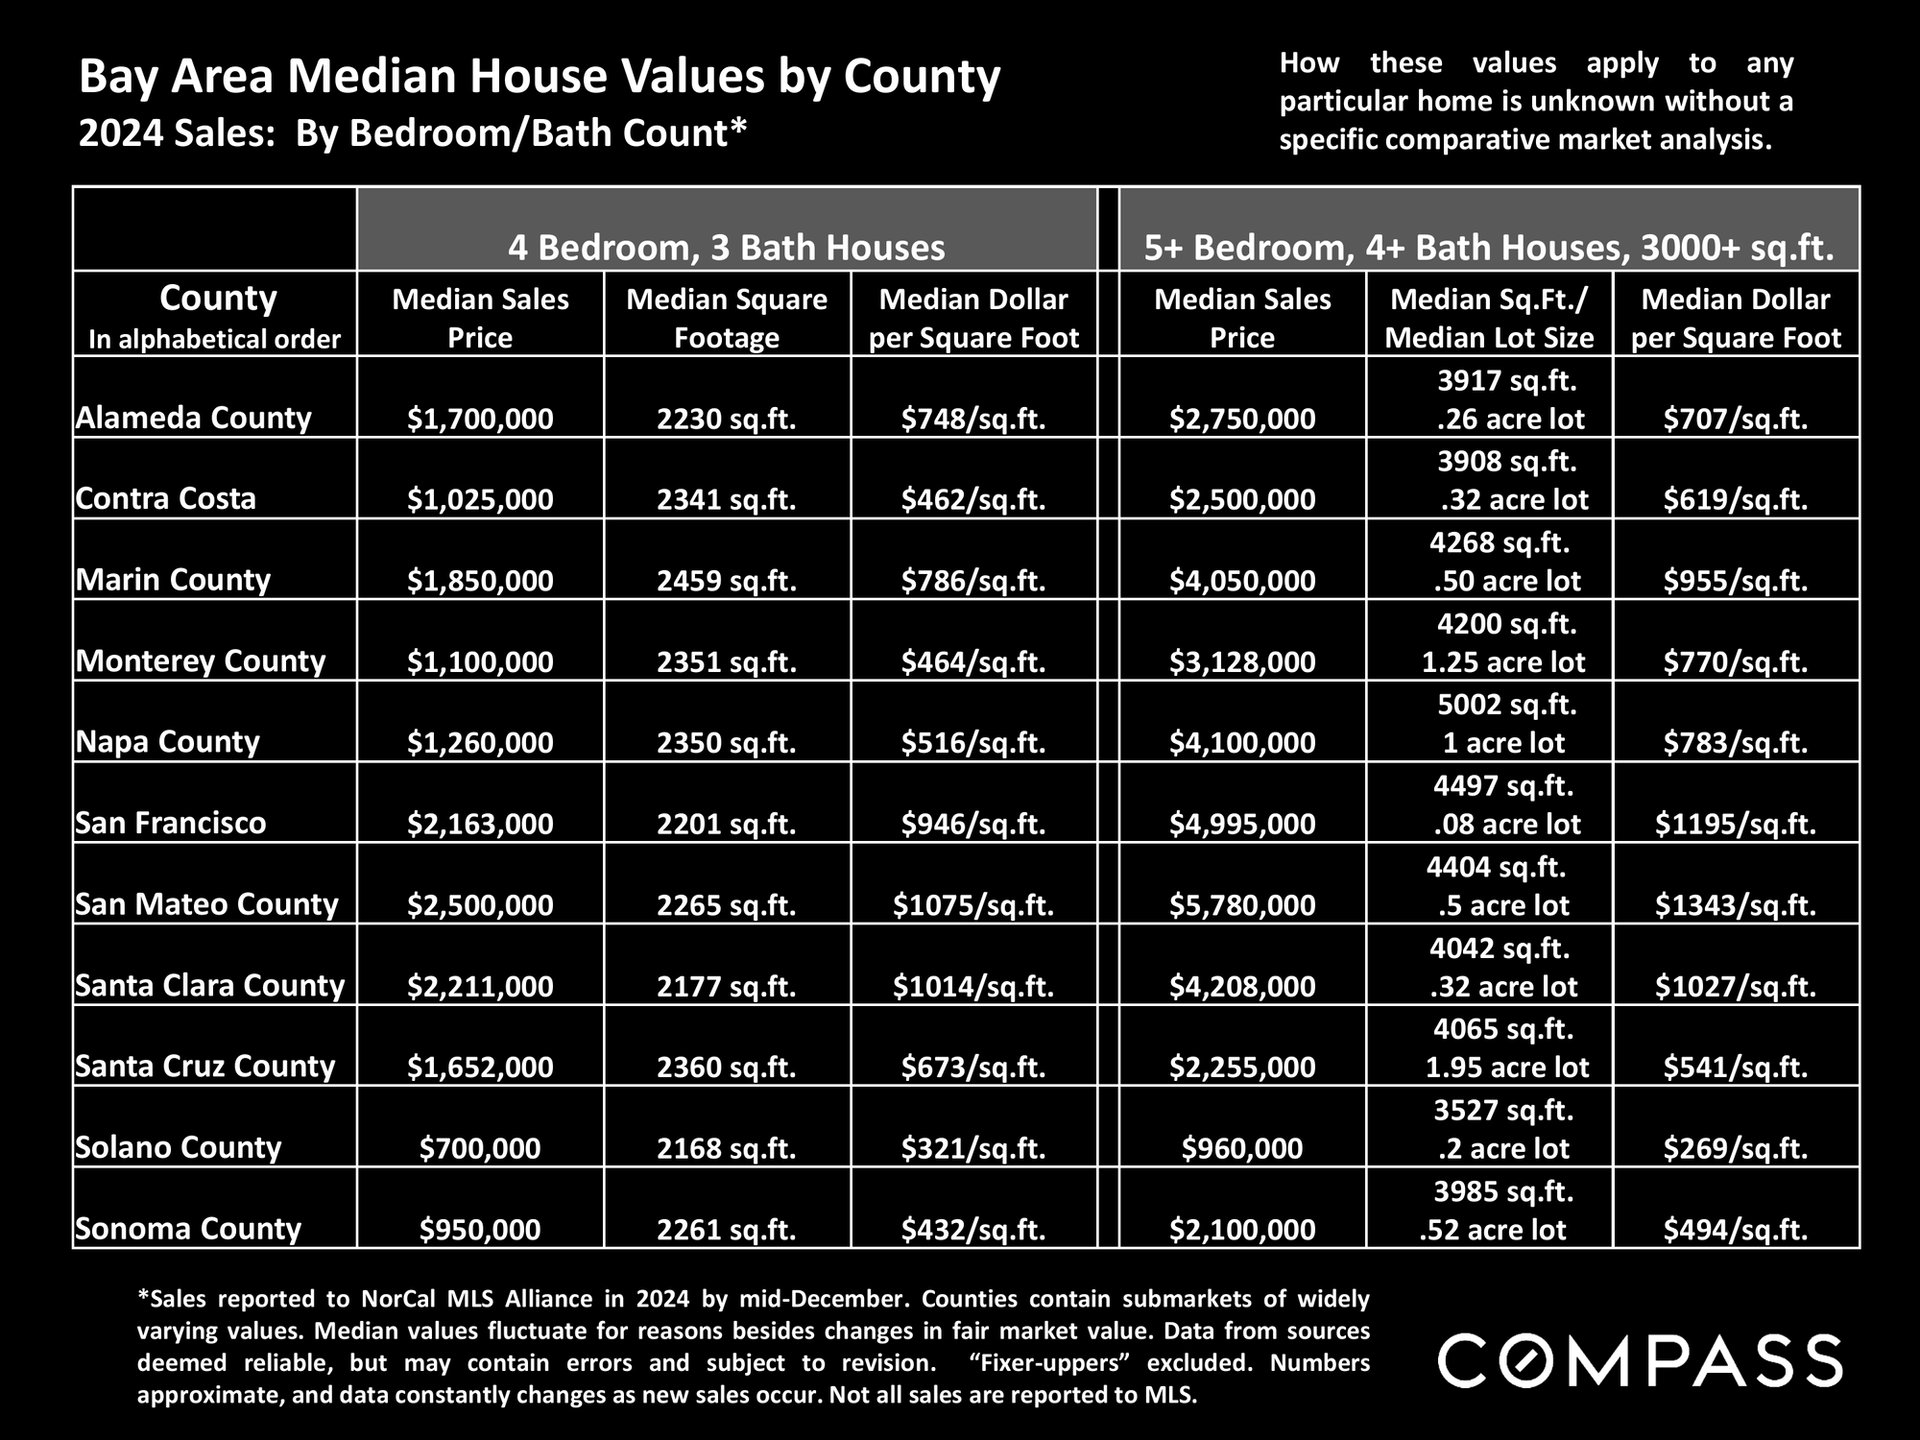
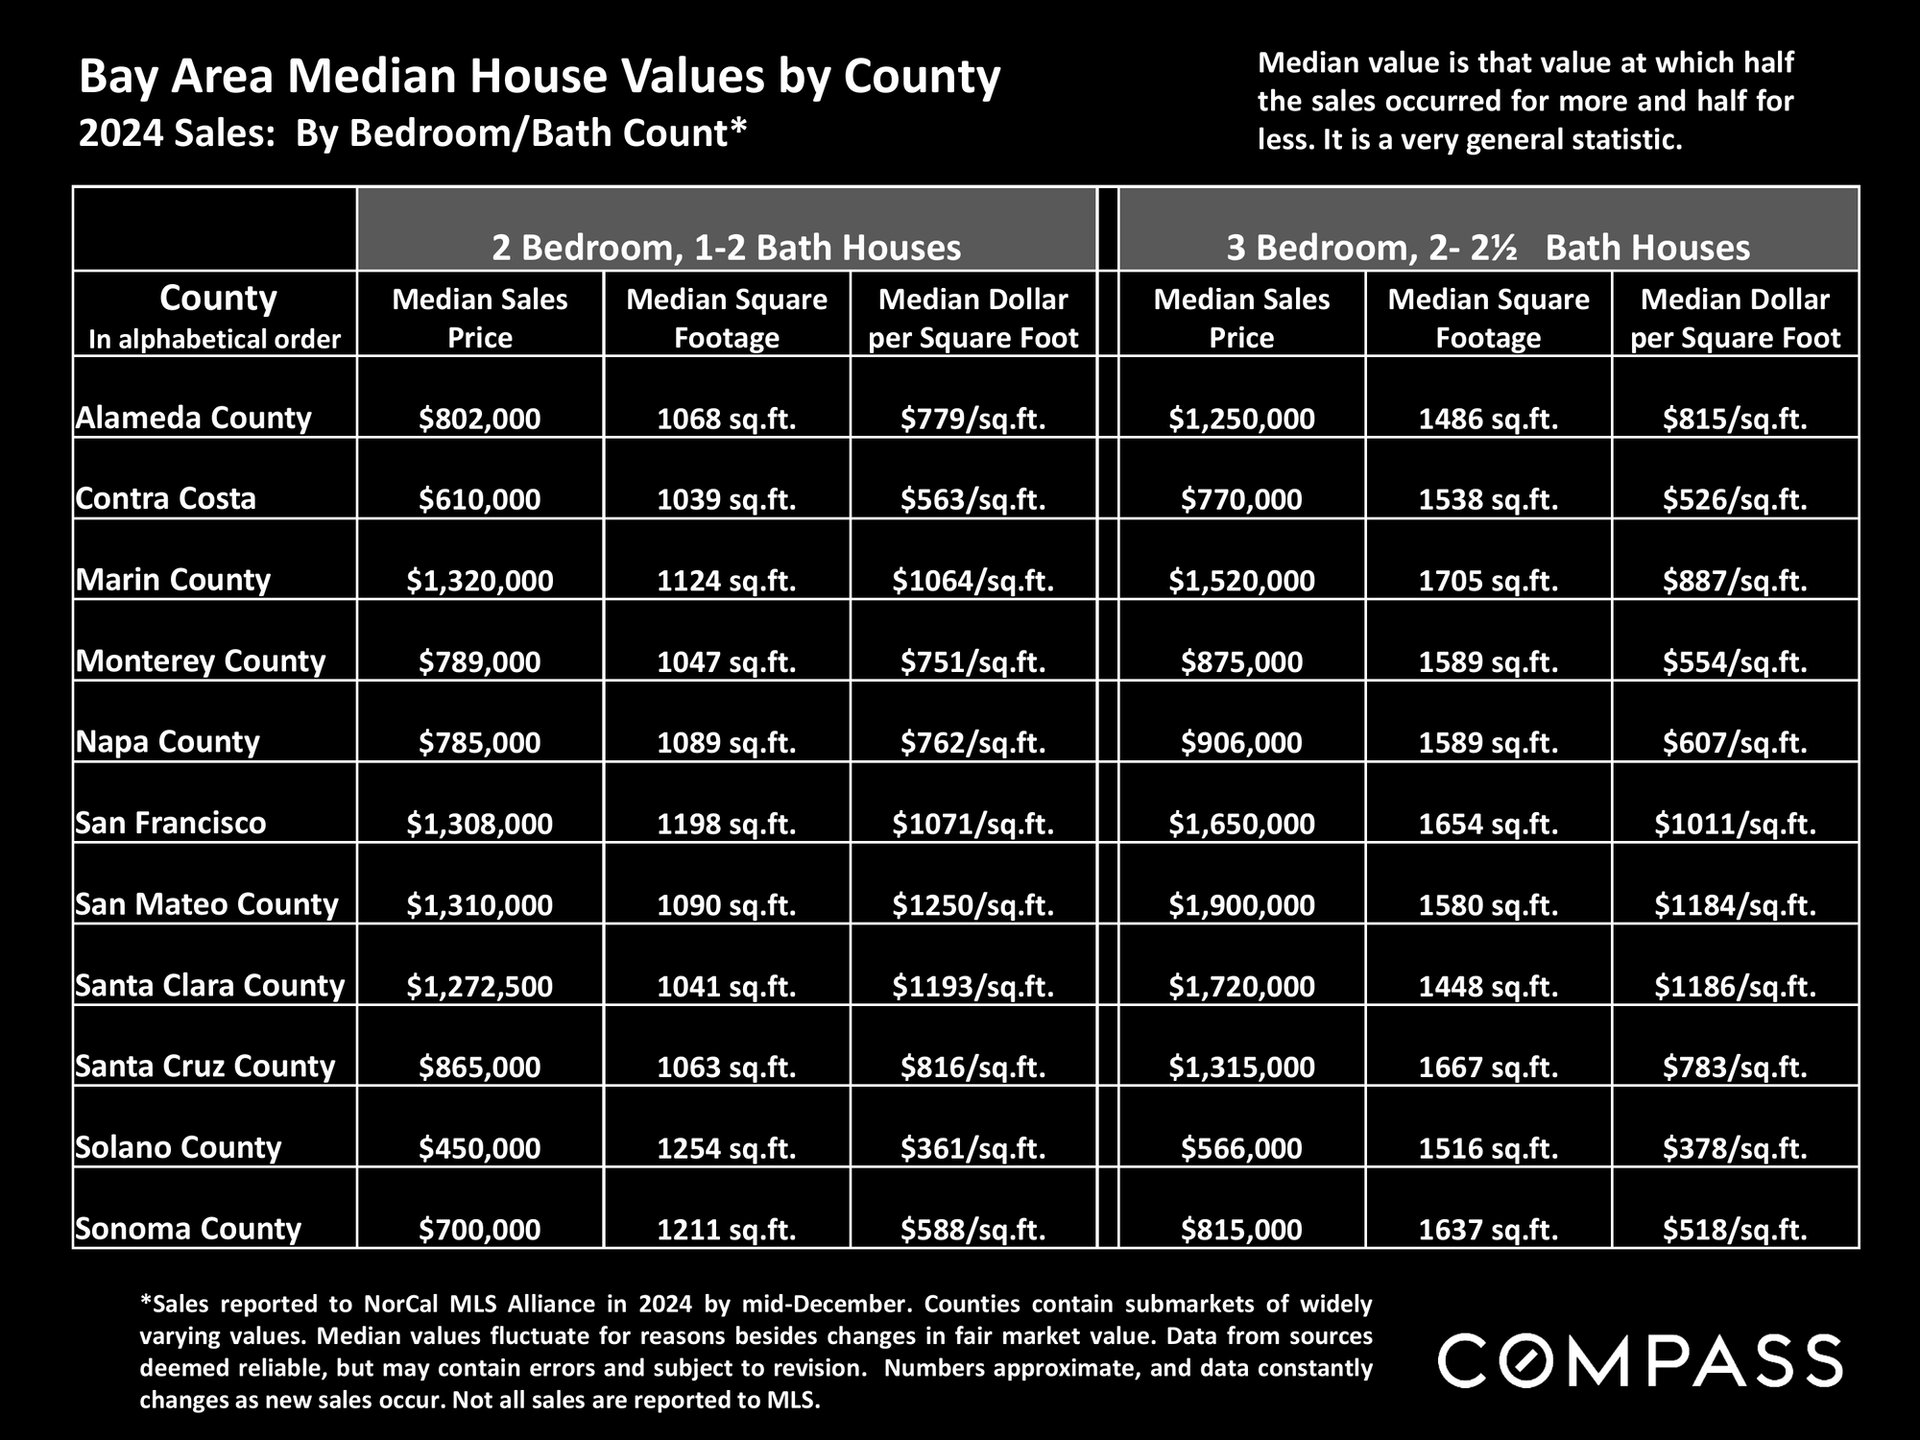
Table comparing 2024 median home sale prices, sizes, and price per square foot across 11 Bay Area counties.Table compares 2024 median home prices, square footage, and price per square foot across 11 Bay Area counties.
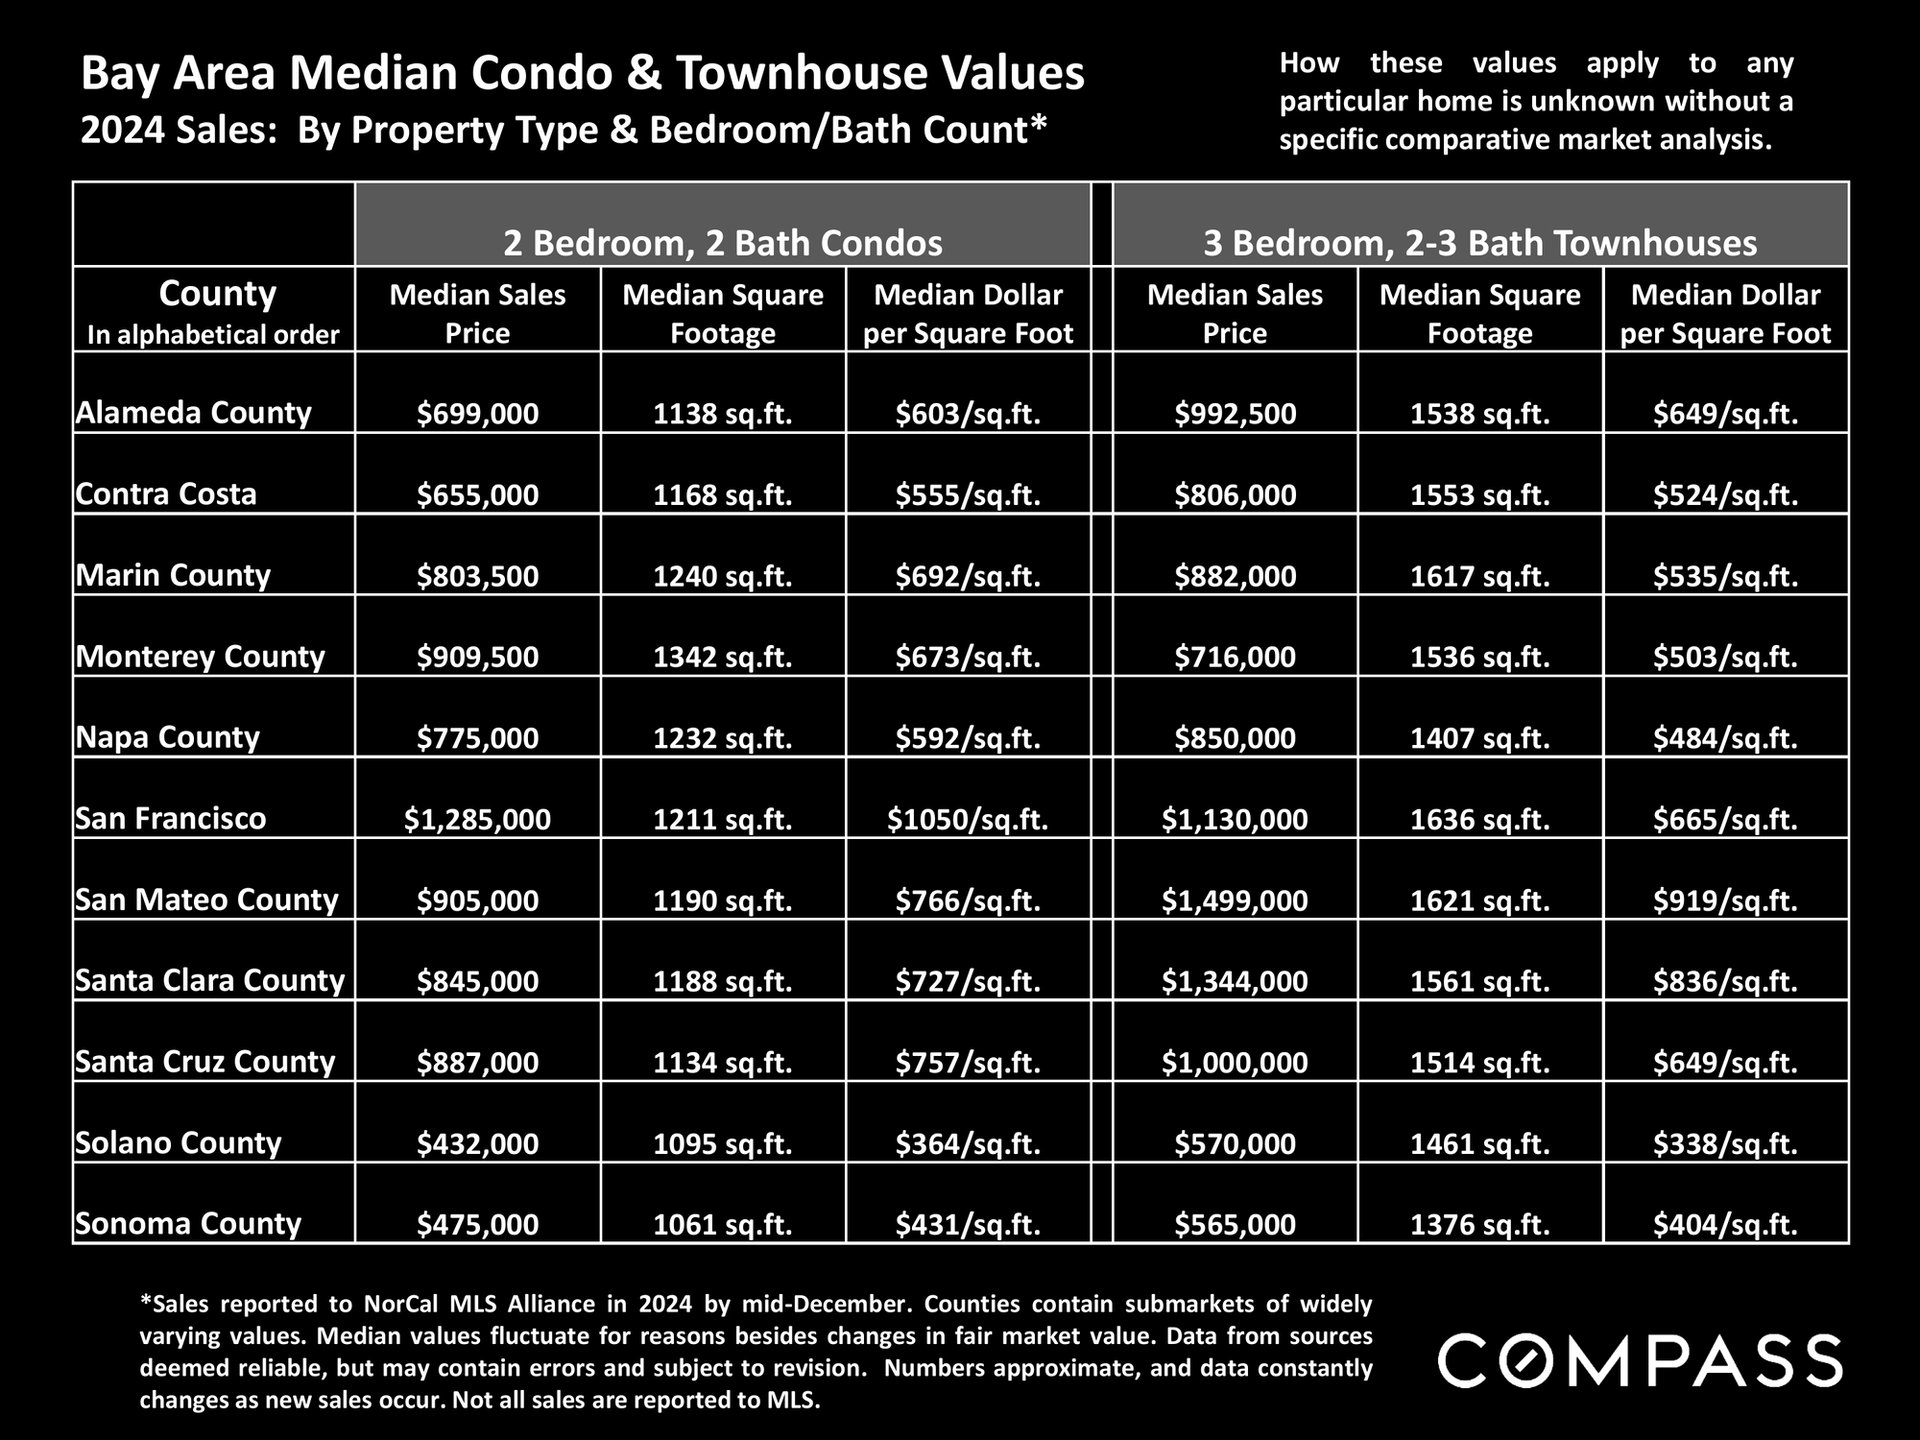
Chart compares 2024 median condo and townhouse prices, sizes, and prices per square foot across 11 Bay Area counties.
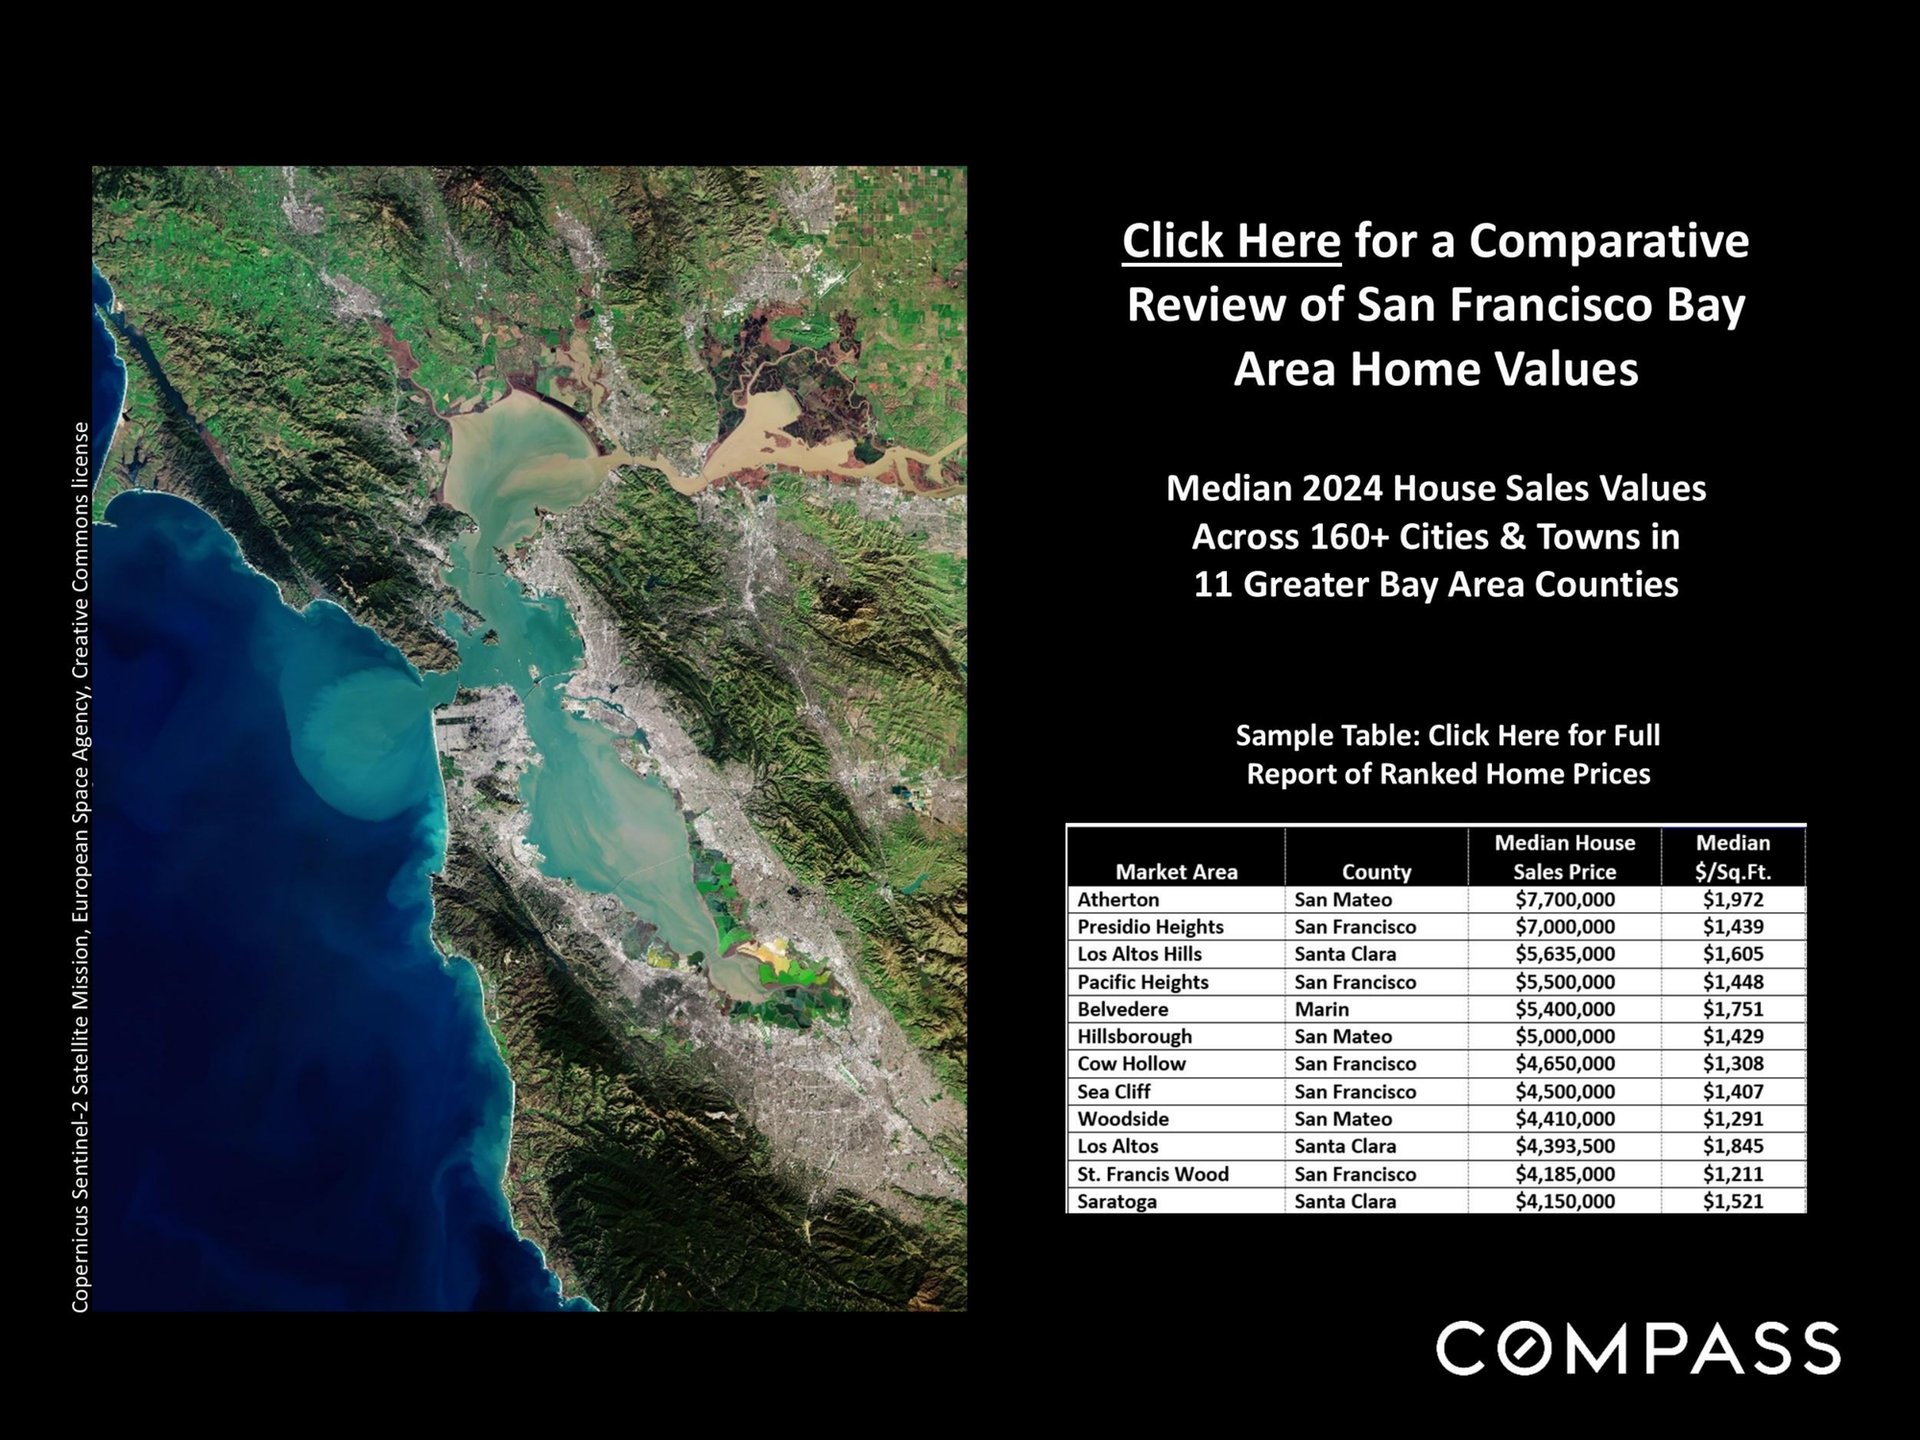
San Francisco Bay Area home values survey, with a satellite map and sample table of 2024 sale prices.
San Francisco Bay Area real estate market seasonality title card, updated through Fall 2024.
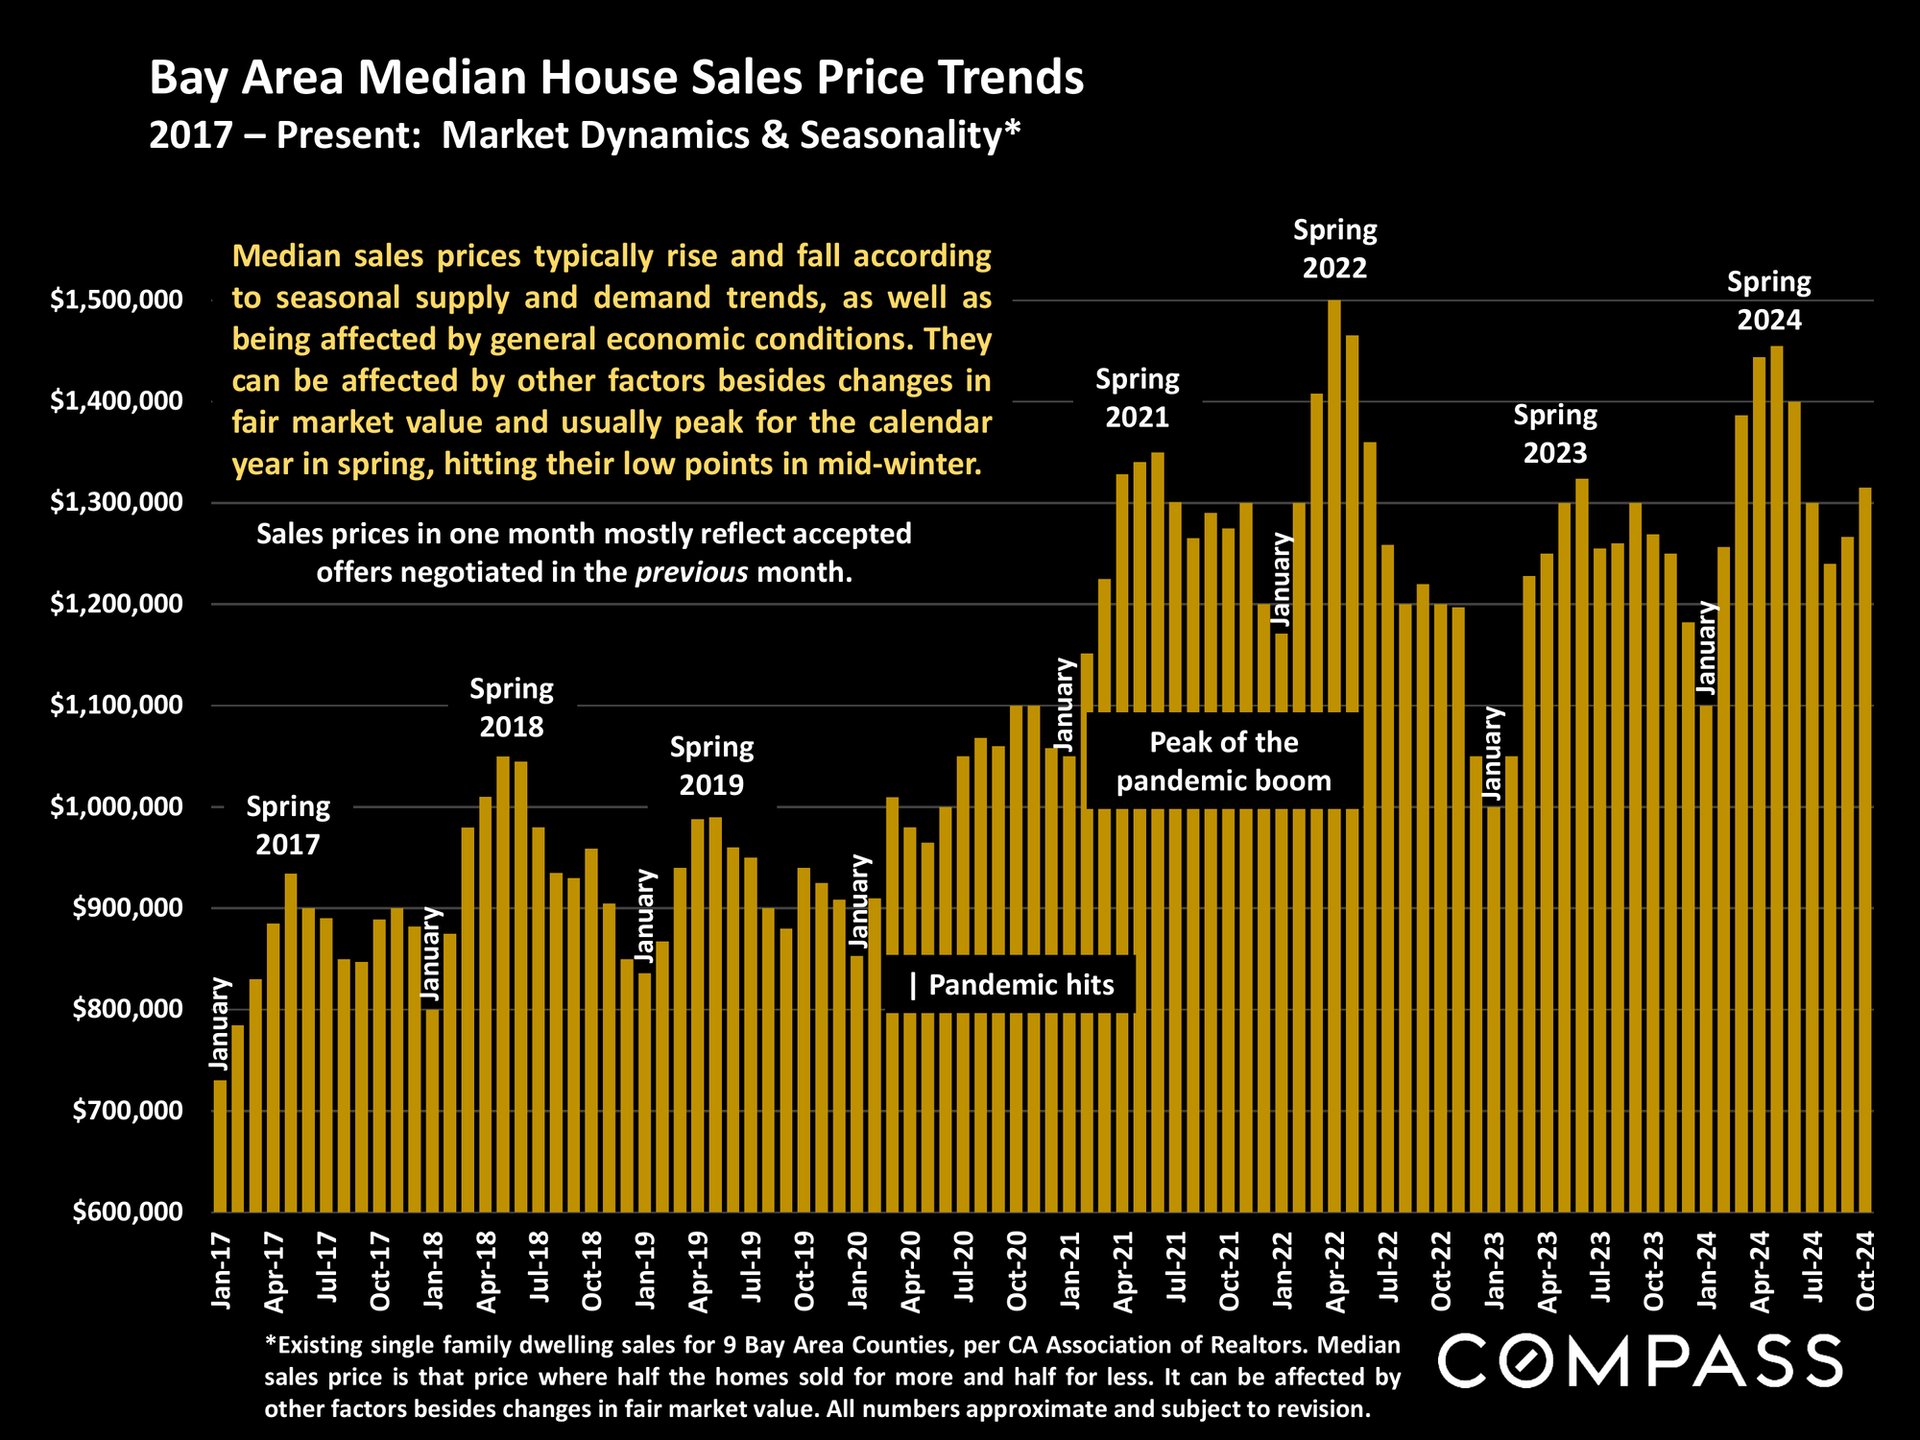
Bar chart of Bay Area median home sale prices, 2017–2024, with seasonal peaks and pandemic-era highs.
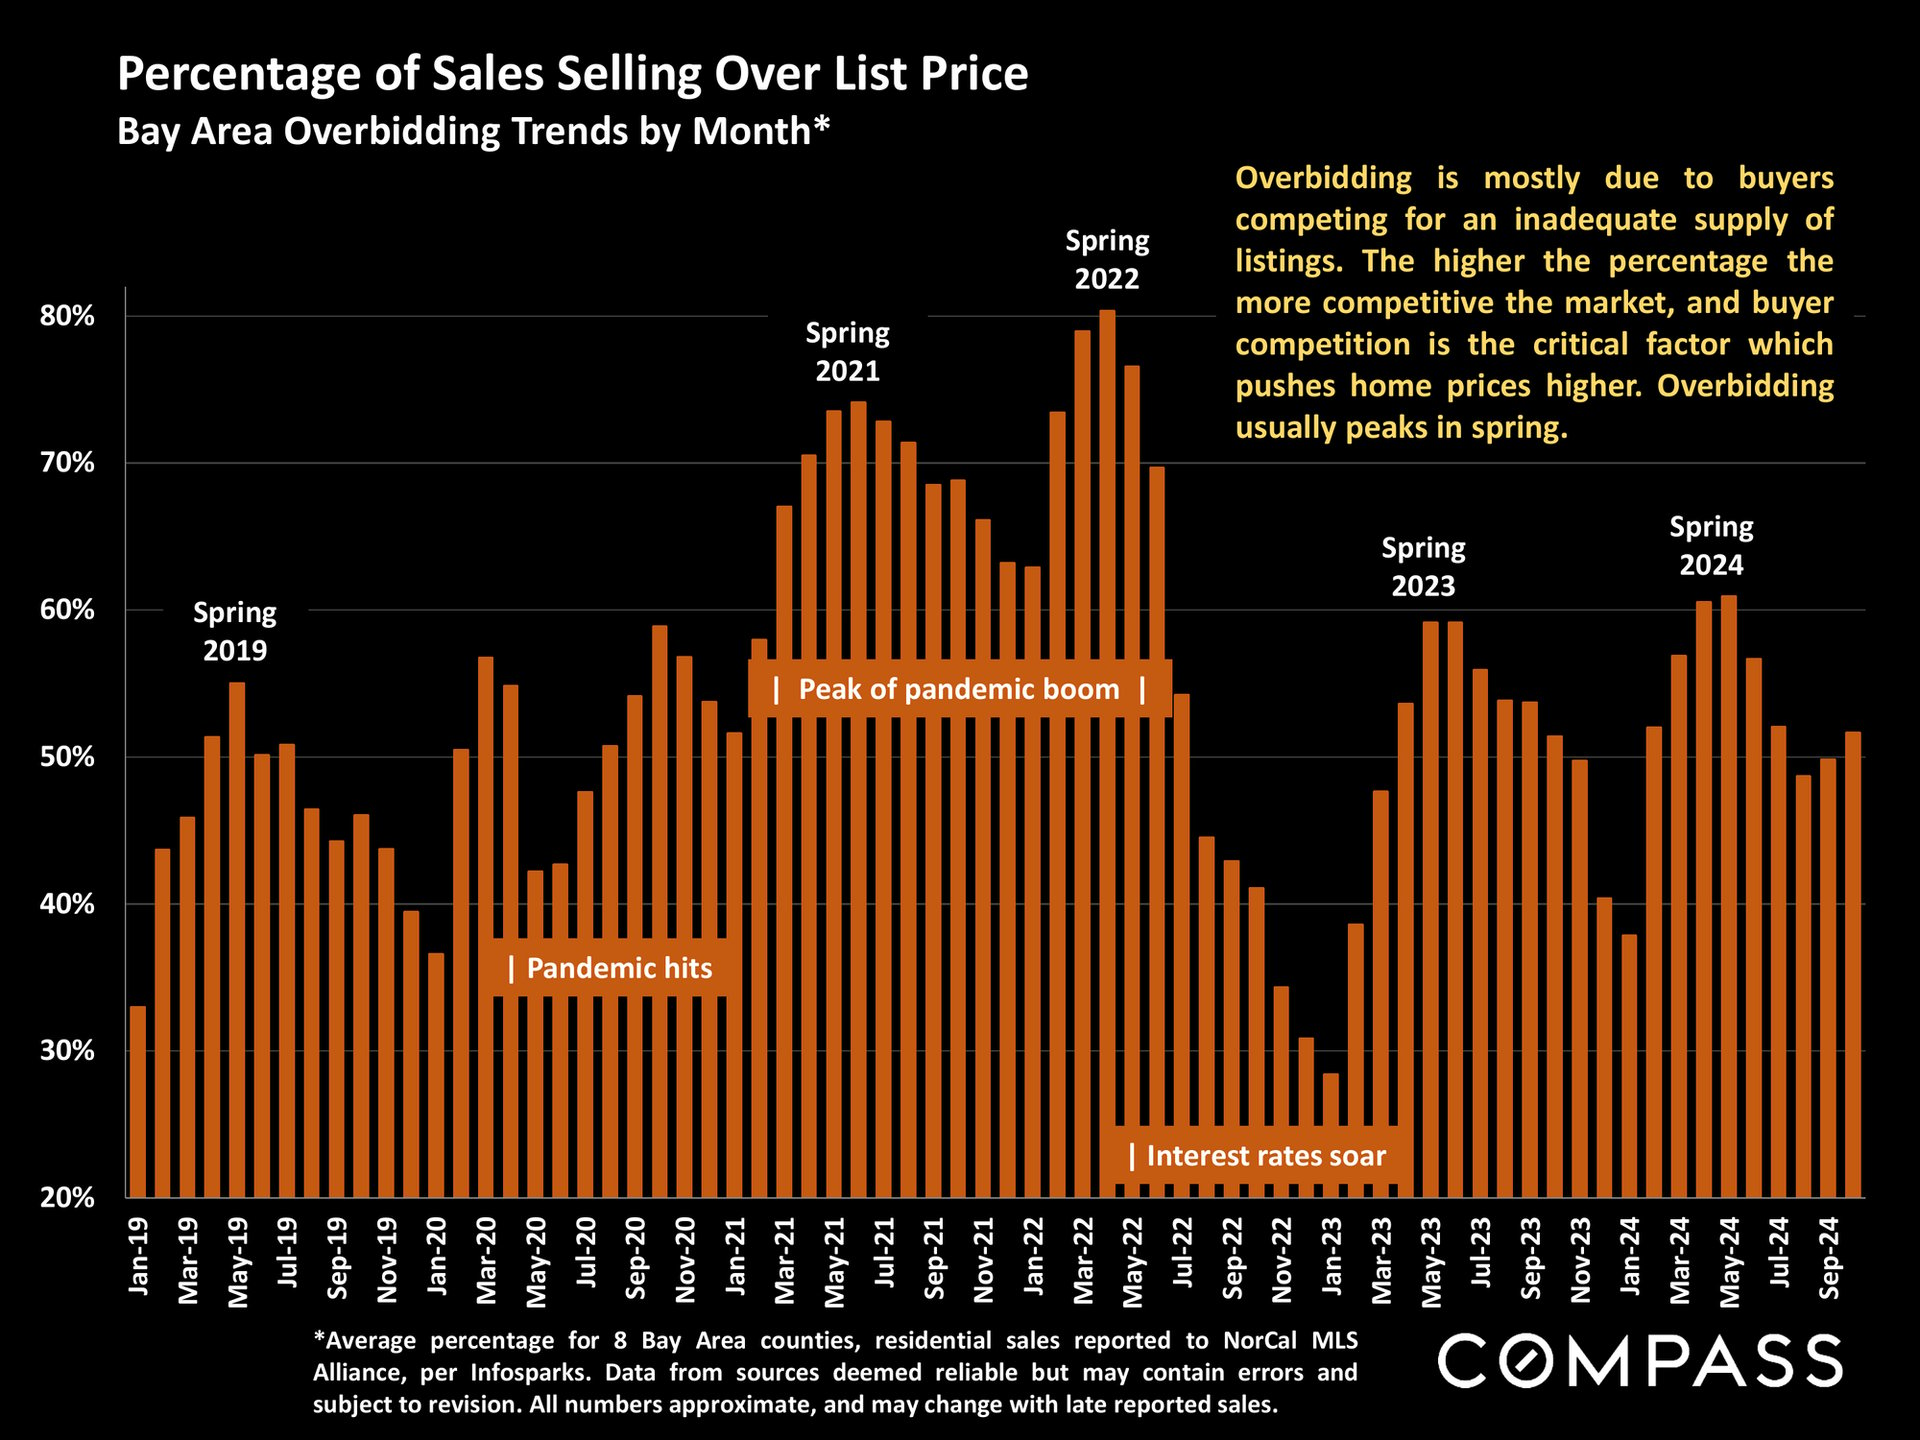
Chart of Bay Area home sales over list price, highlighting pandemic-era peaks and spring overbidding trends.
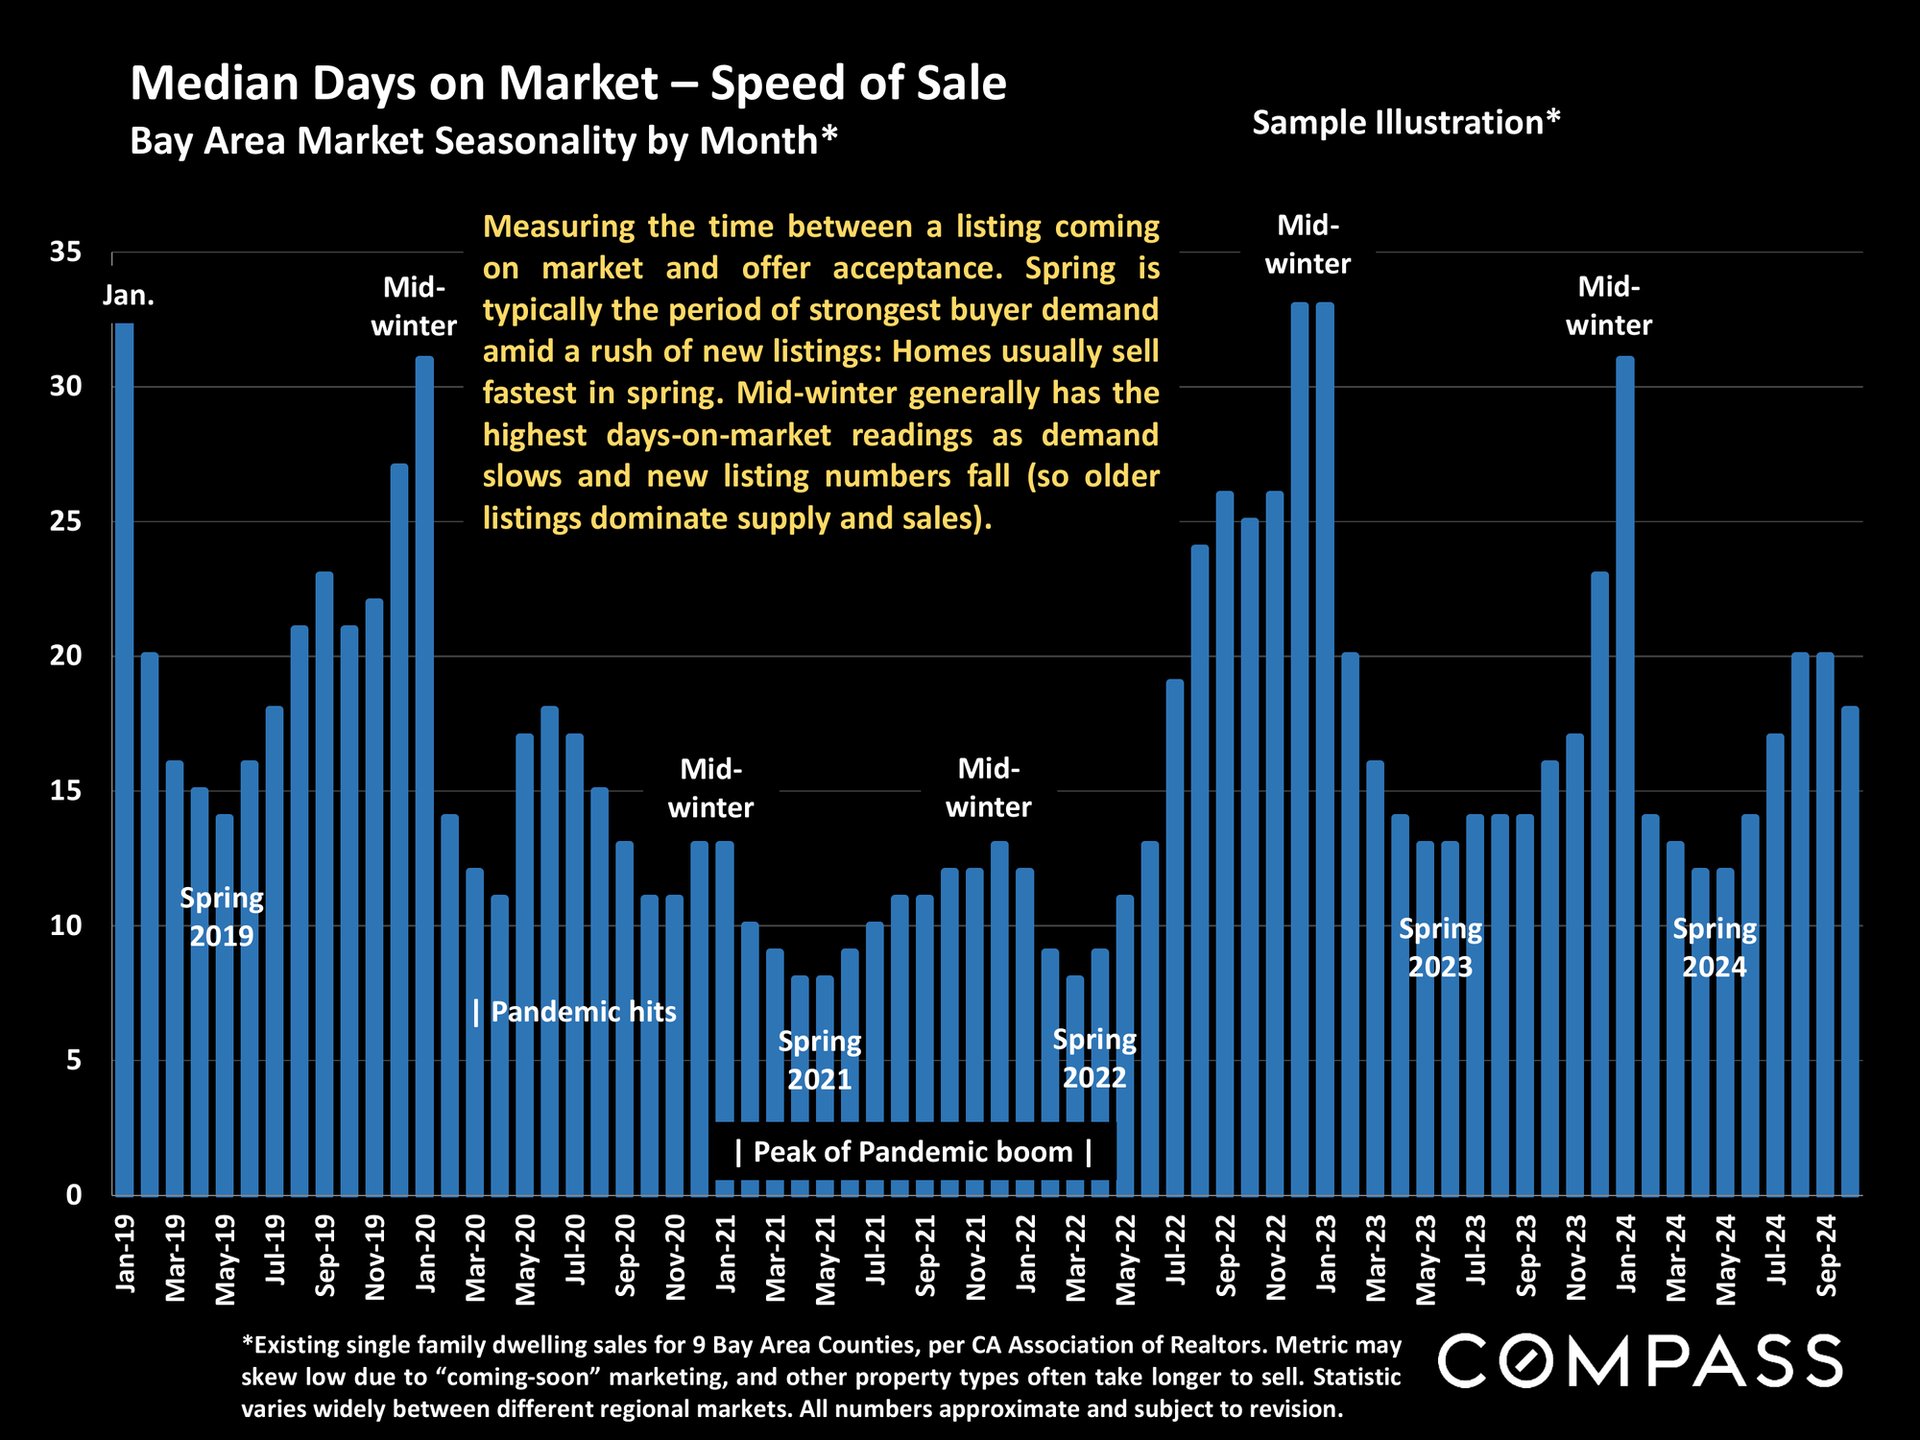
Chart of Bay Area median days on market, with monthly bars from 2019 to 2024 and seasonal annotations.
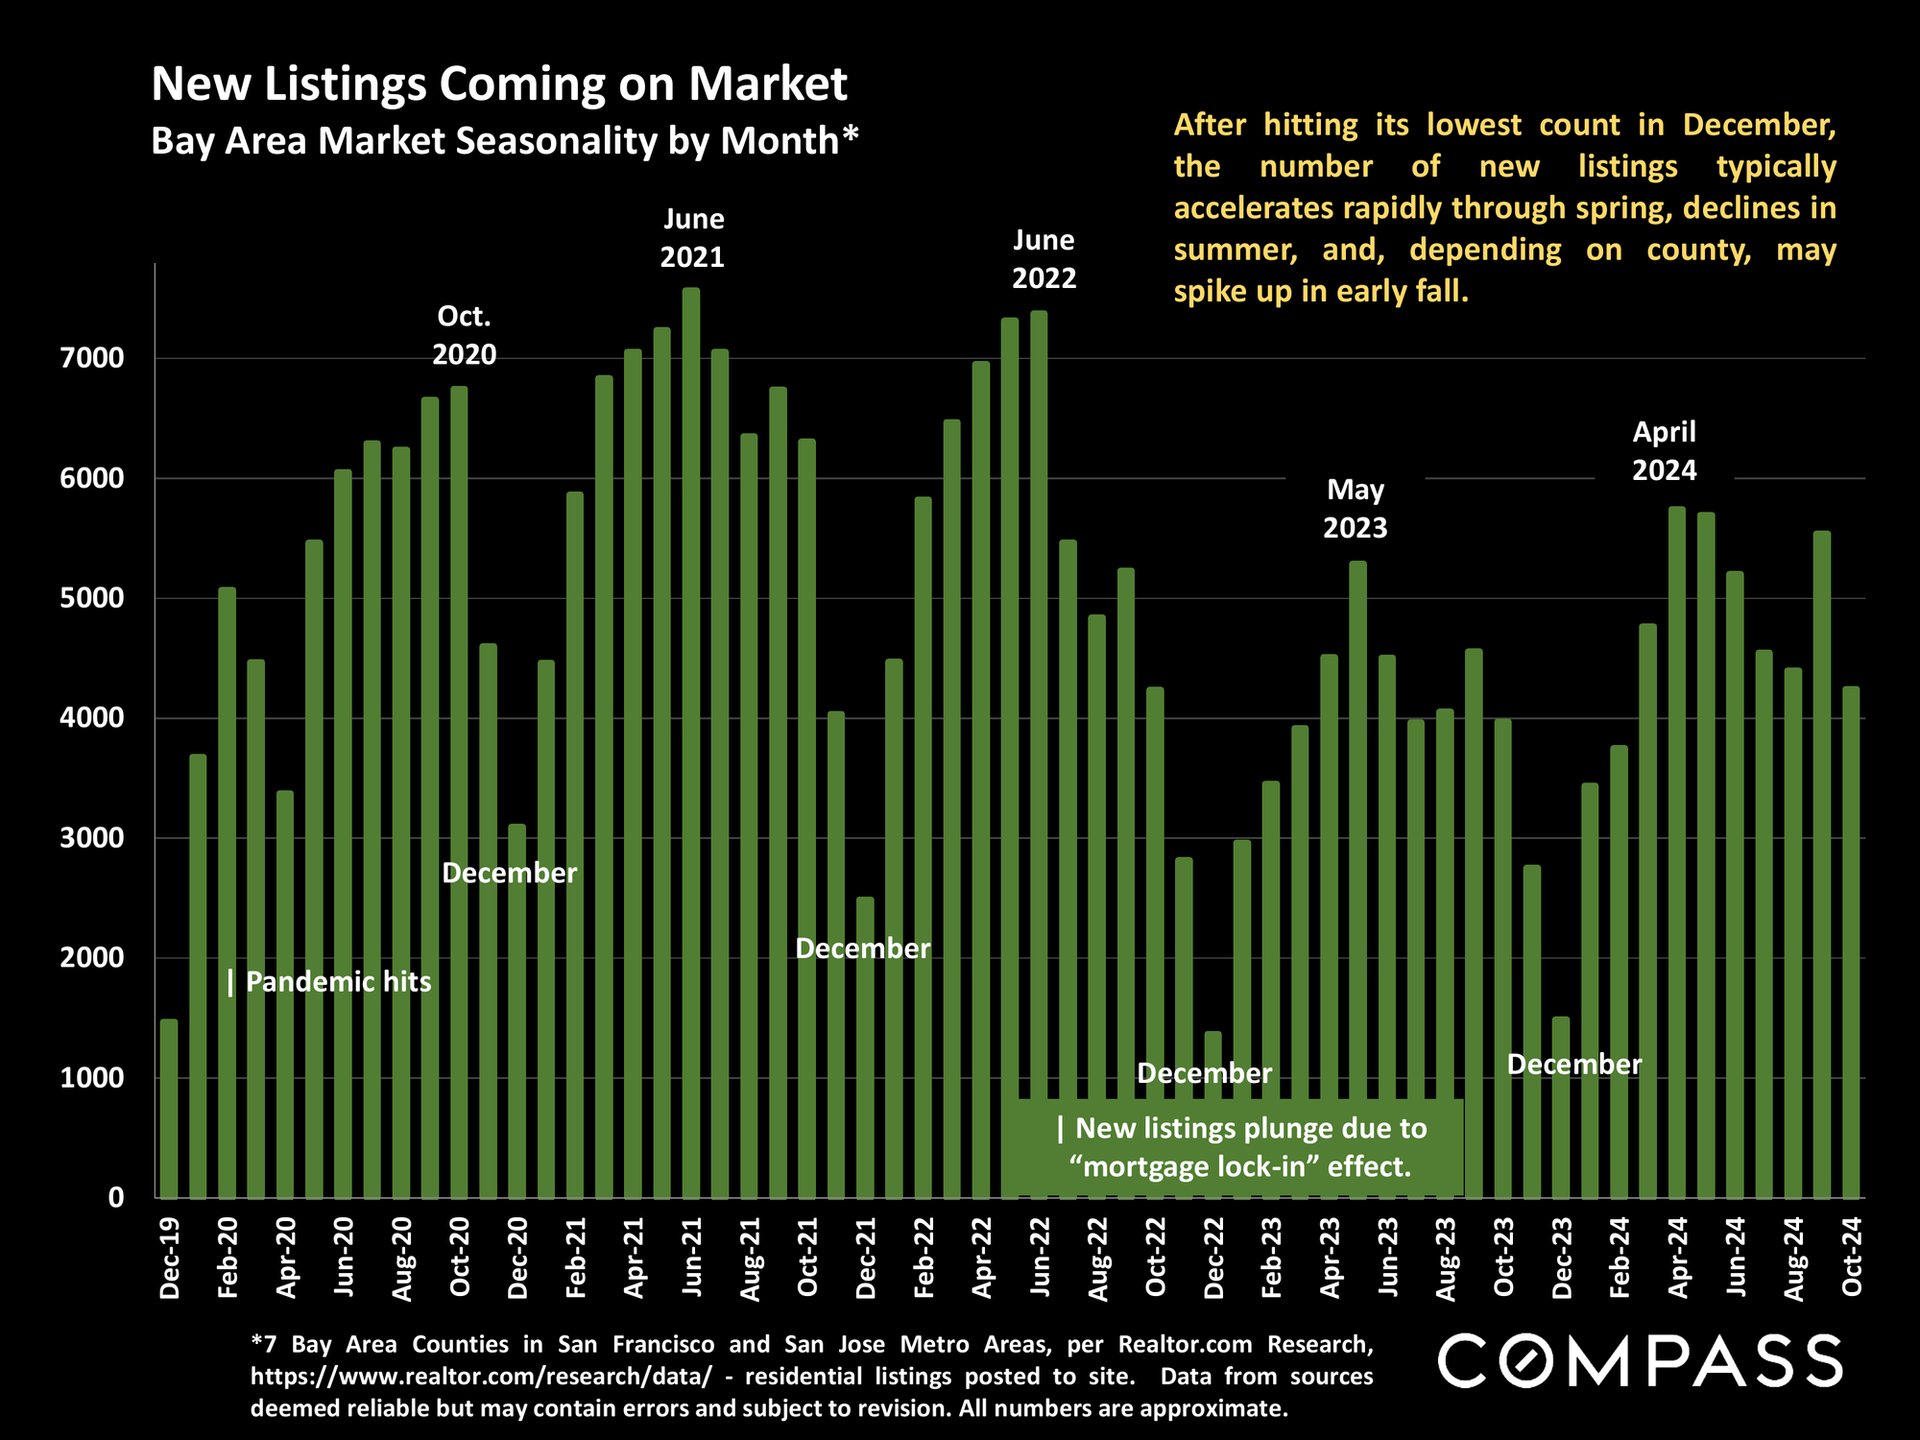
Bar chart of Bay Area monthly new listings, showing seasonal peaks and December lows from 2019 to 2024.
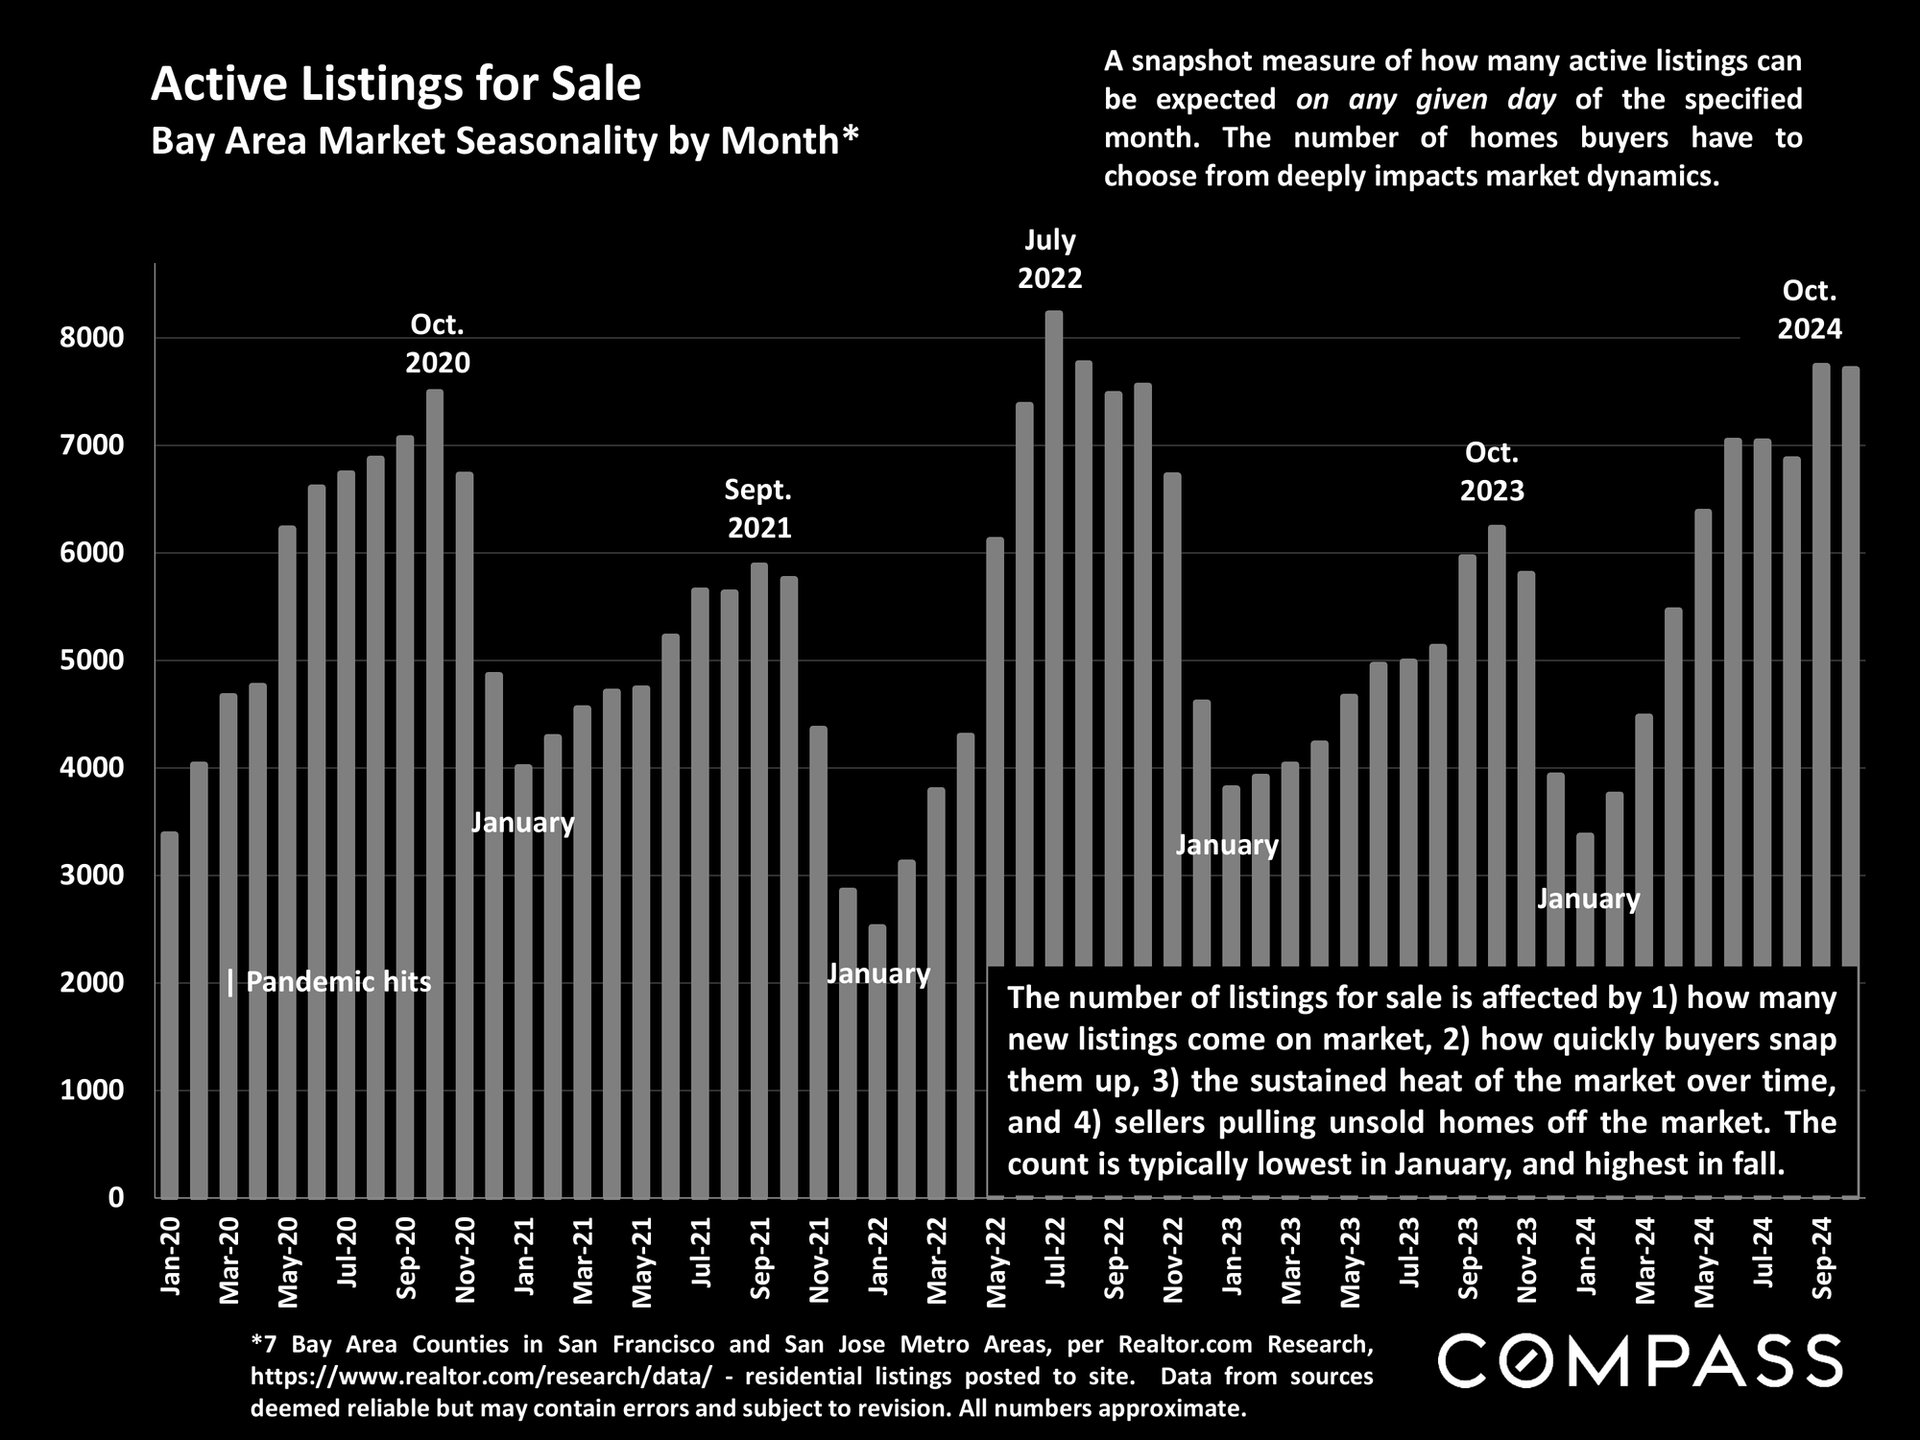
Bar chart of Bay Area active home listings from 2020 to 2024, with seasonal peaks in fall and lows in January.
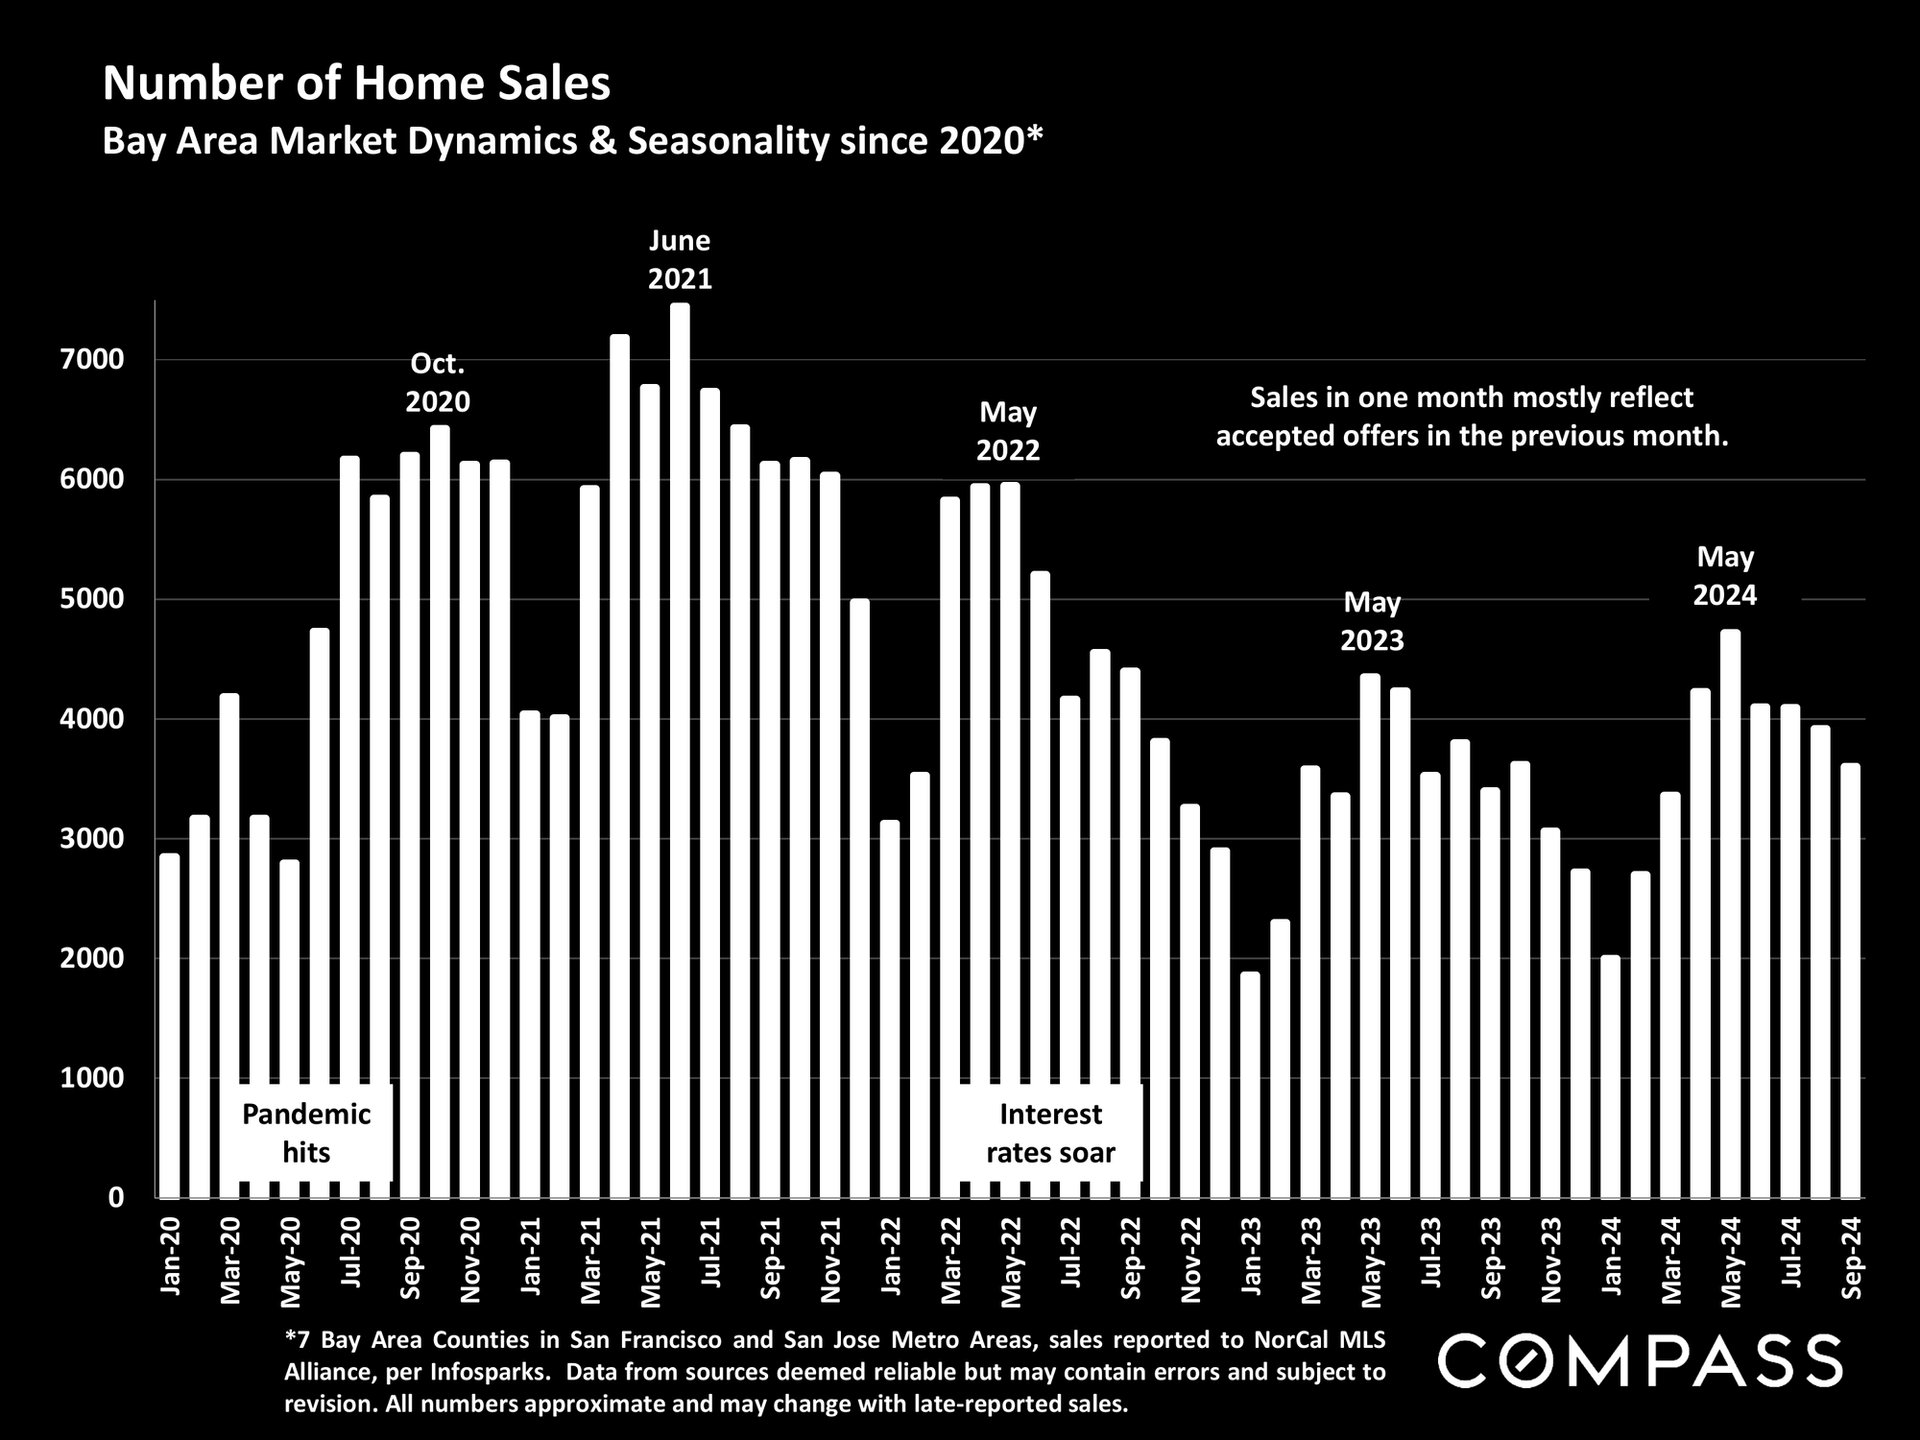
Bar chart of monthly Bay Area home sales from 2020 to 2024, peaking above 7,000 in June 2021.
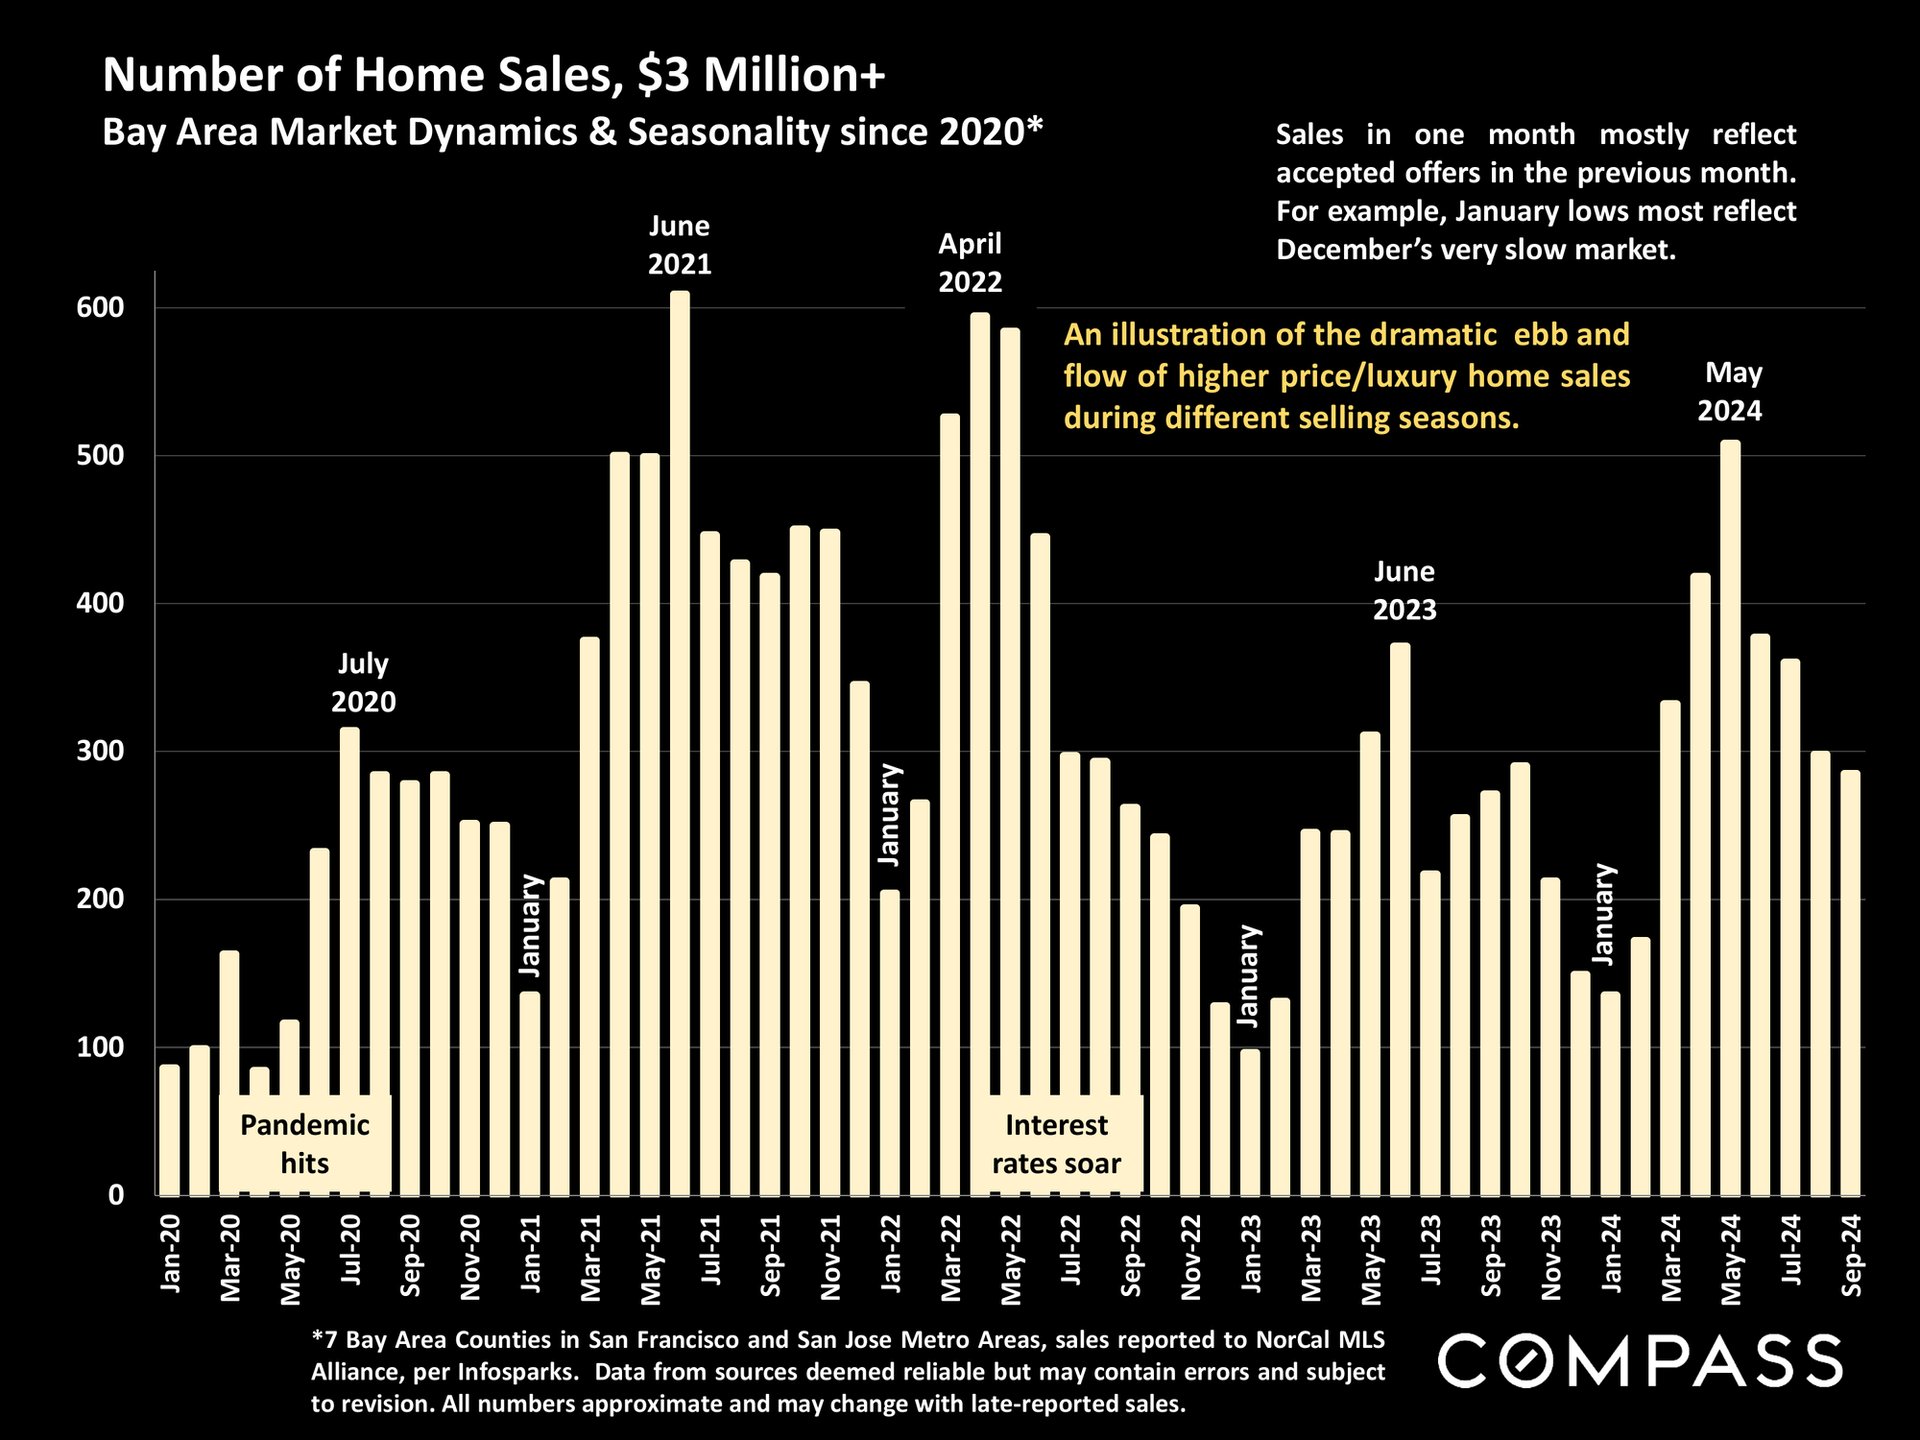
Chart of Bay Area home sales over $3 million, showing seasonal peaks from 2020 to 2024.
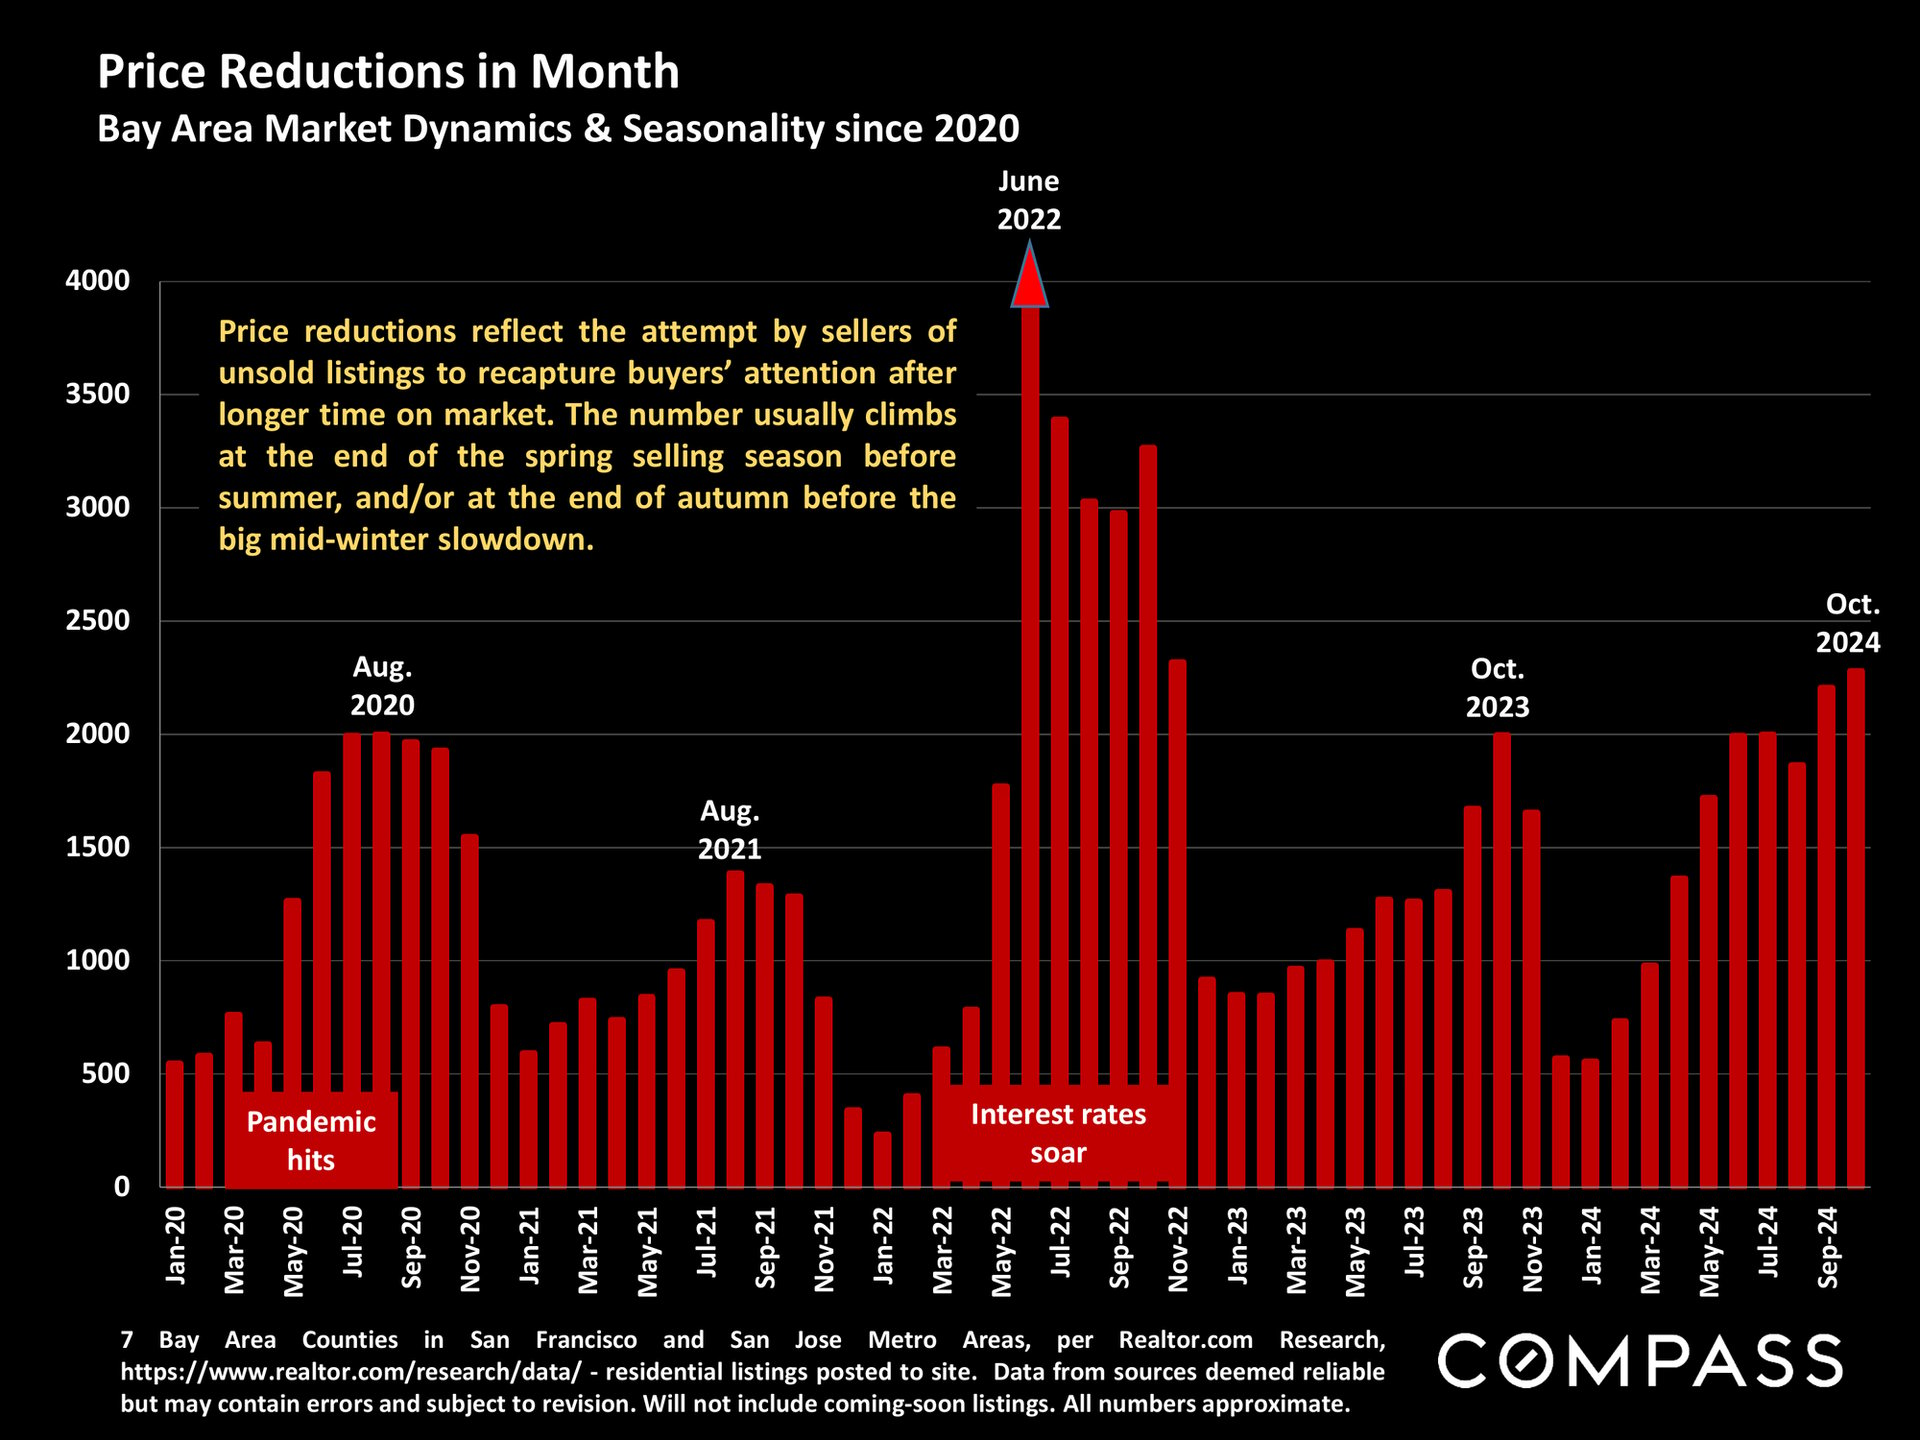
Bar chart of Bay Area monthly price reductions, peaking in June 2022 and rising again through October 2024.
San Francisco Bay Area Counties: Selected Demographics & Data Points
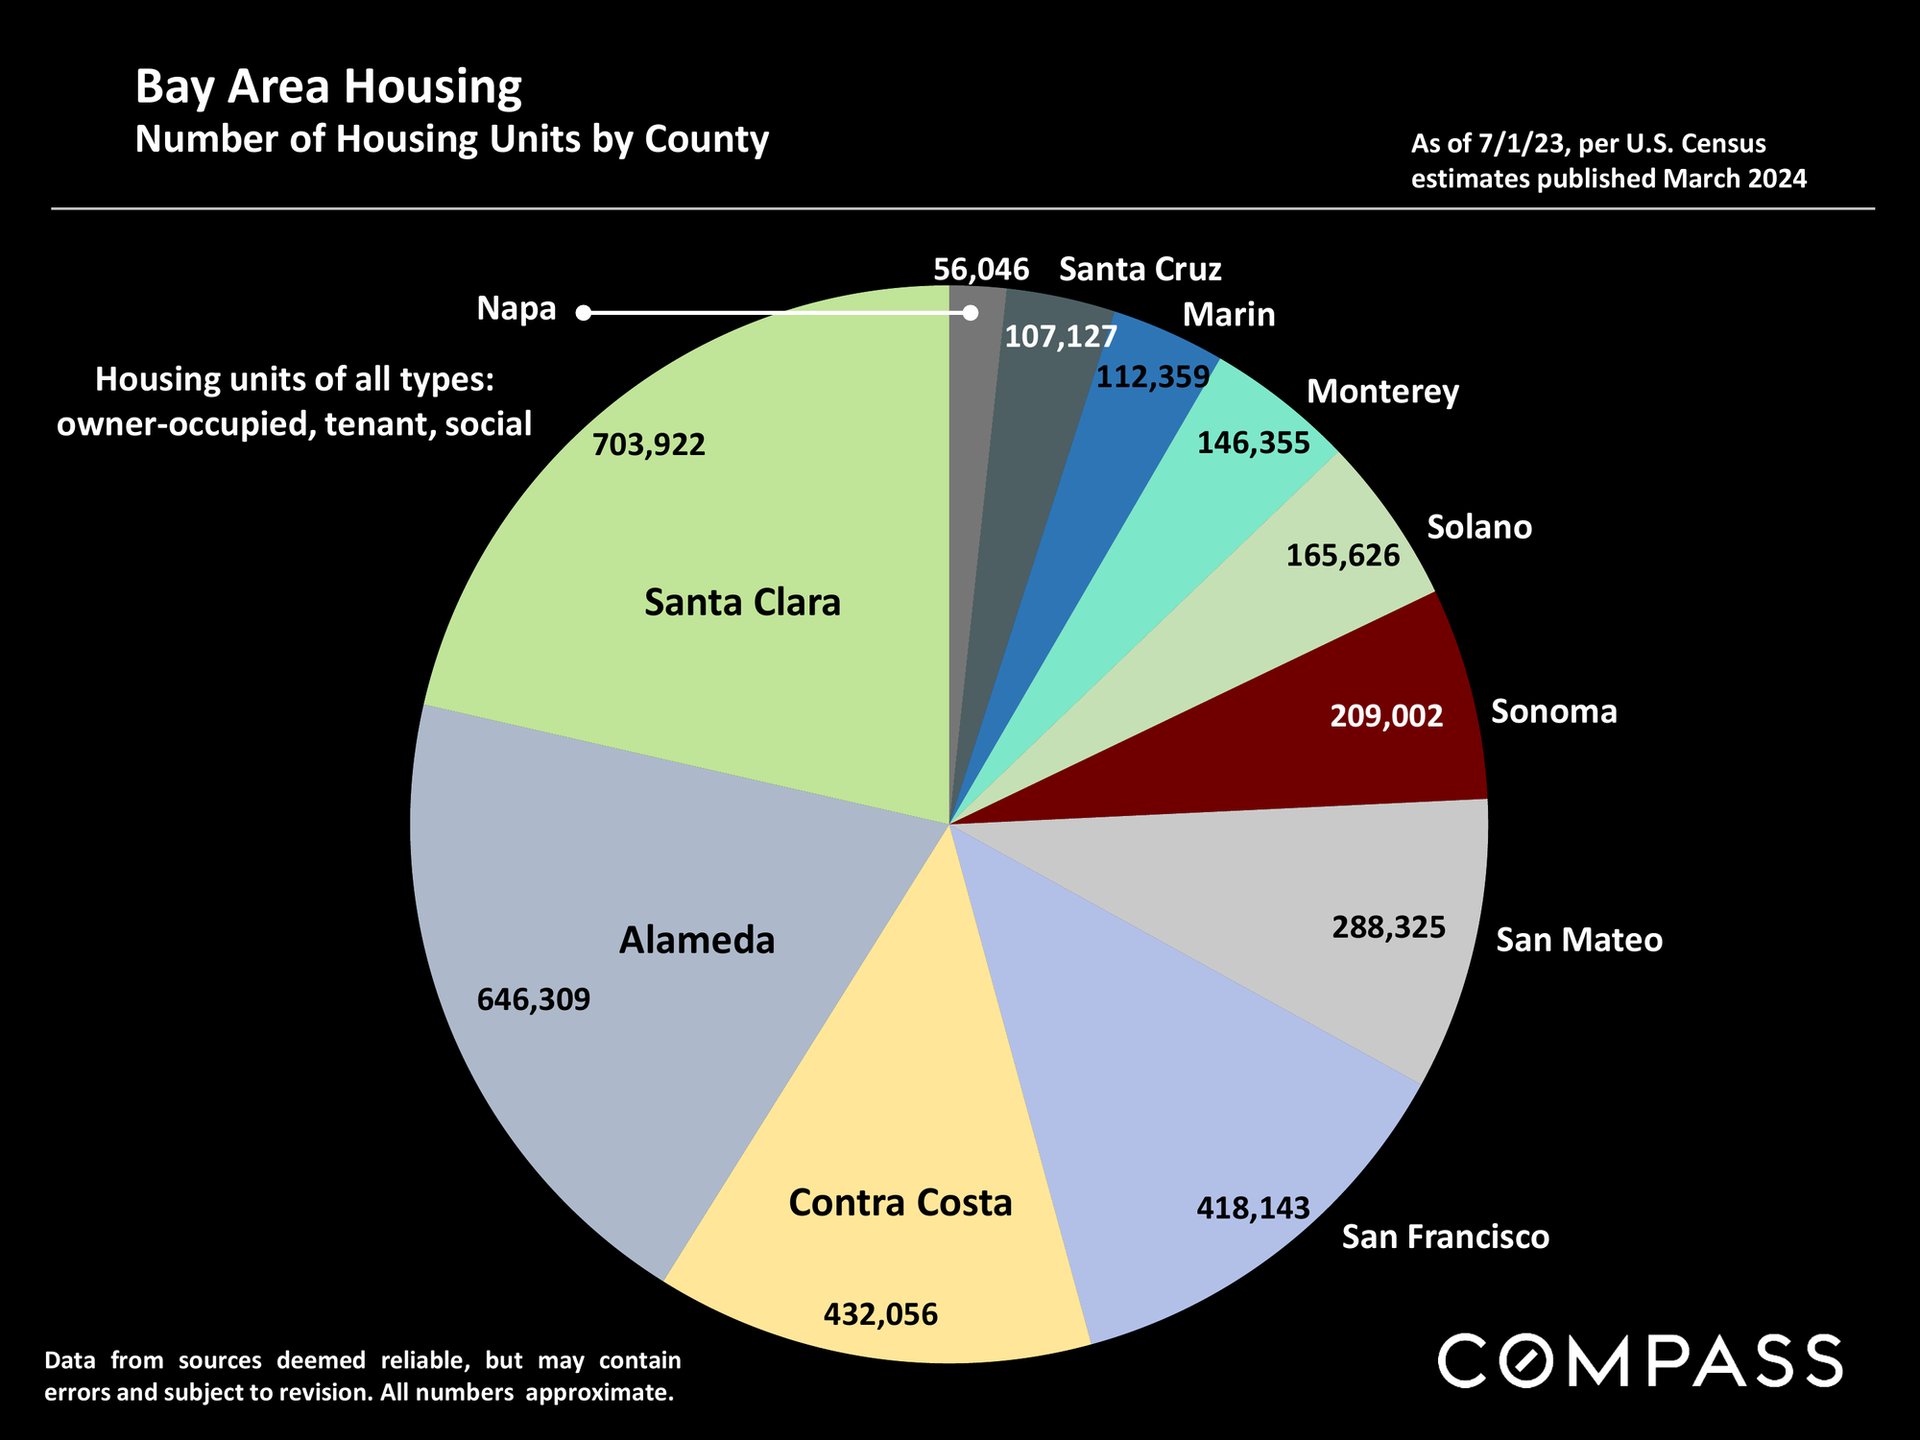
Pie chart compares housing-unit totals across 11 Bay Area counties; Santa Clara has the most, at 703,922.
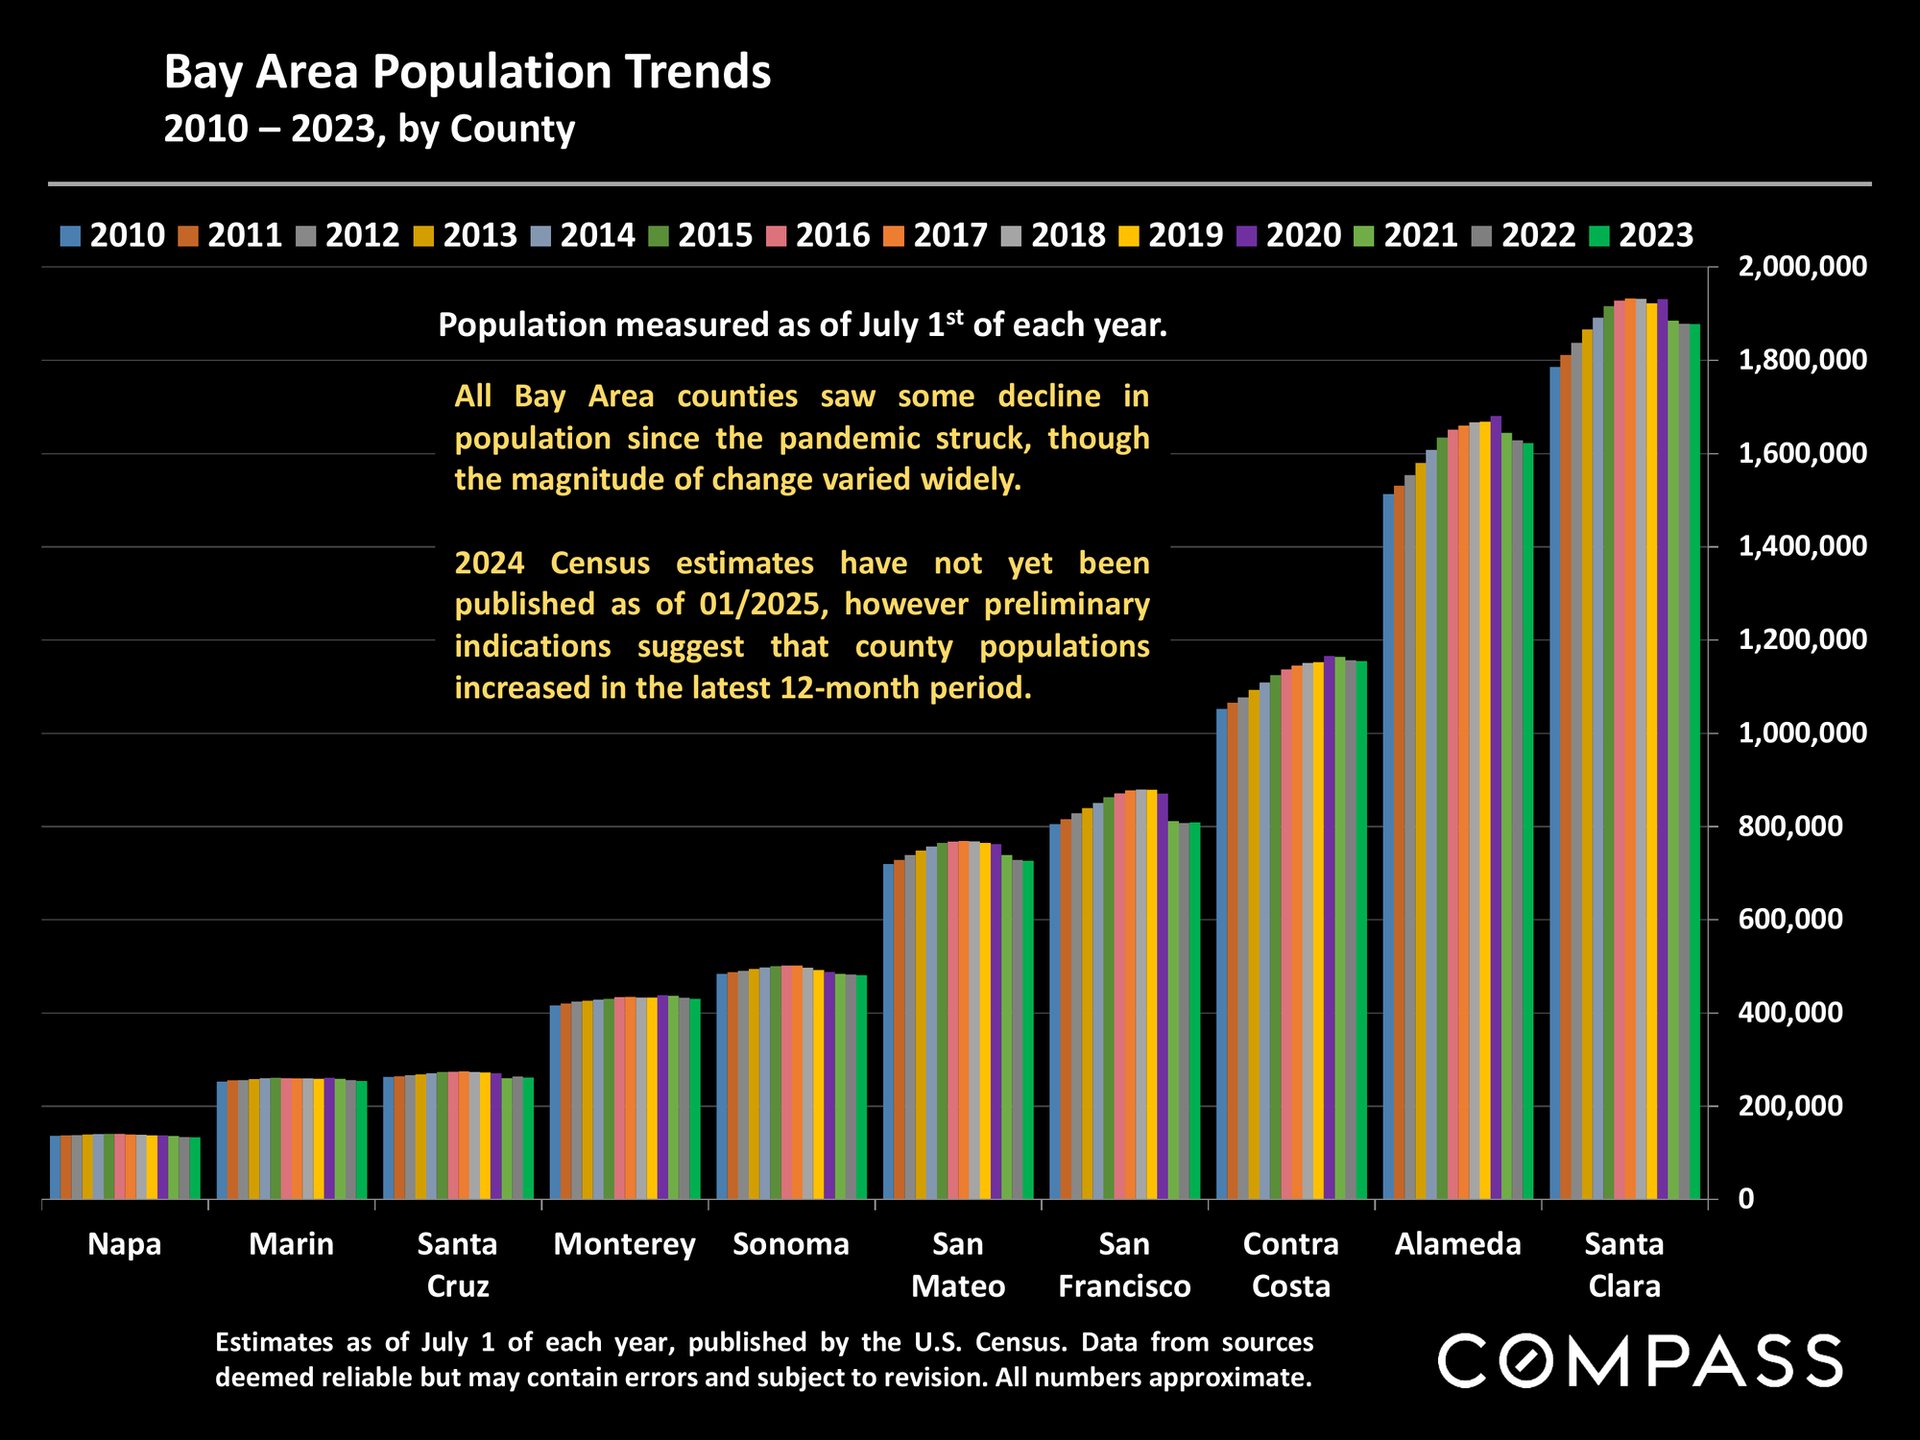
Bar chart comparing 2010–2023 population trends across 10 Bay Area counties, with notes on recent declines and increases.
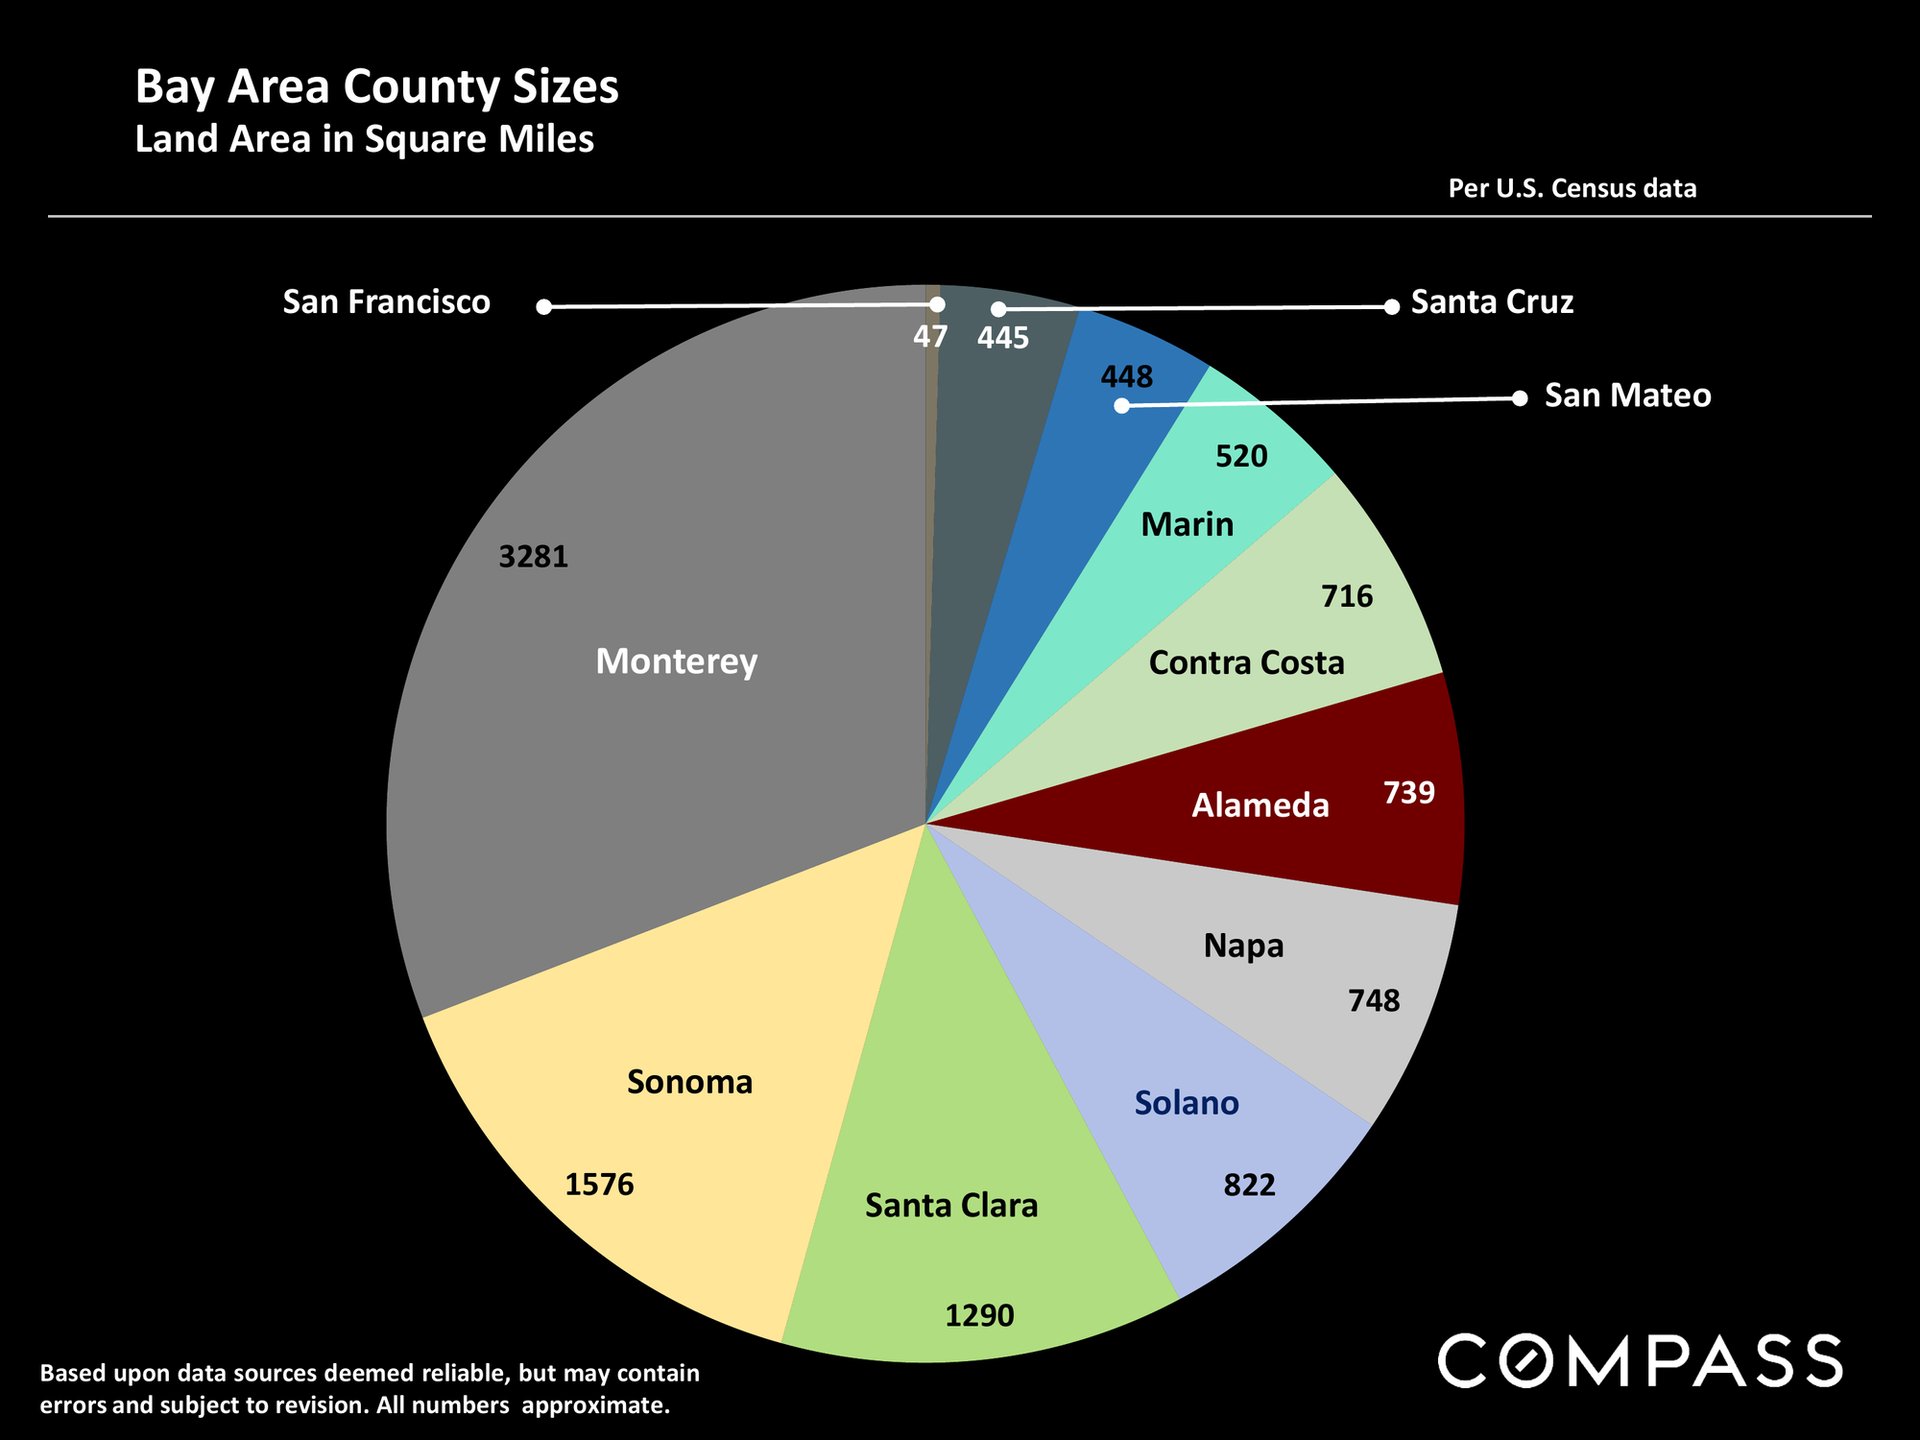
Pie chart comparing land areas of Bay Area counties, with Monterey largest at 3,281 square miles.
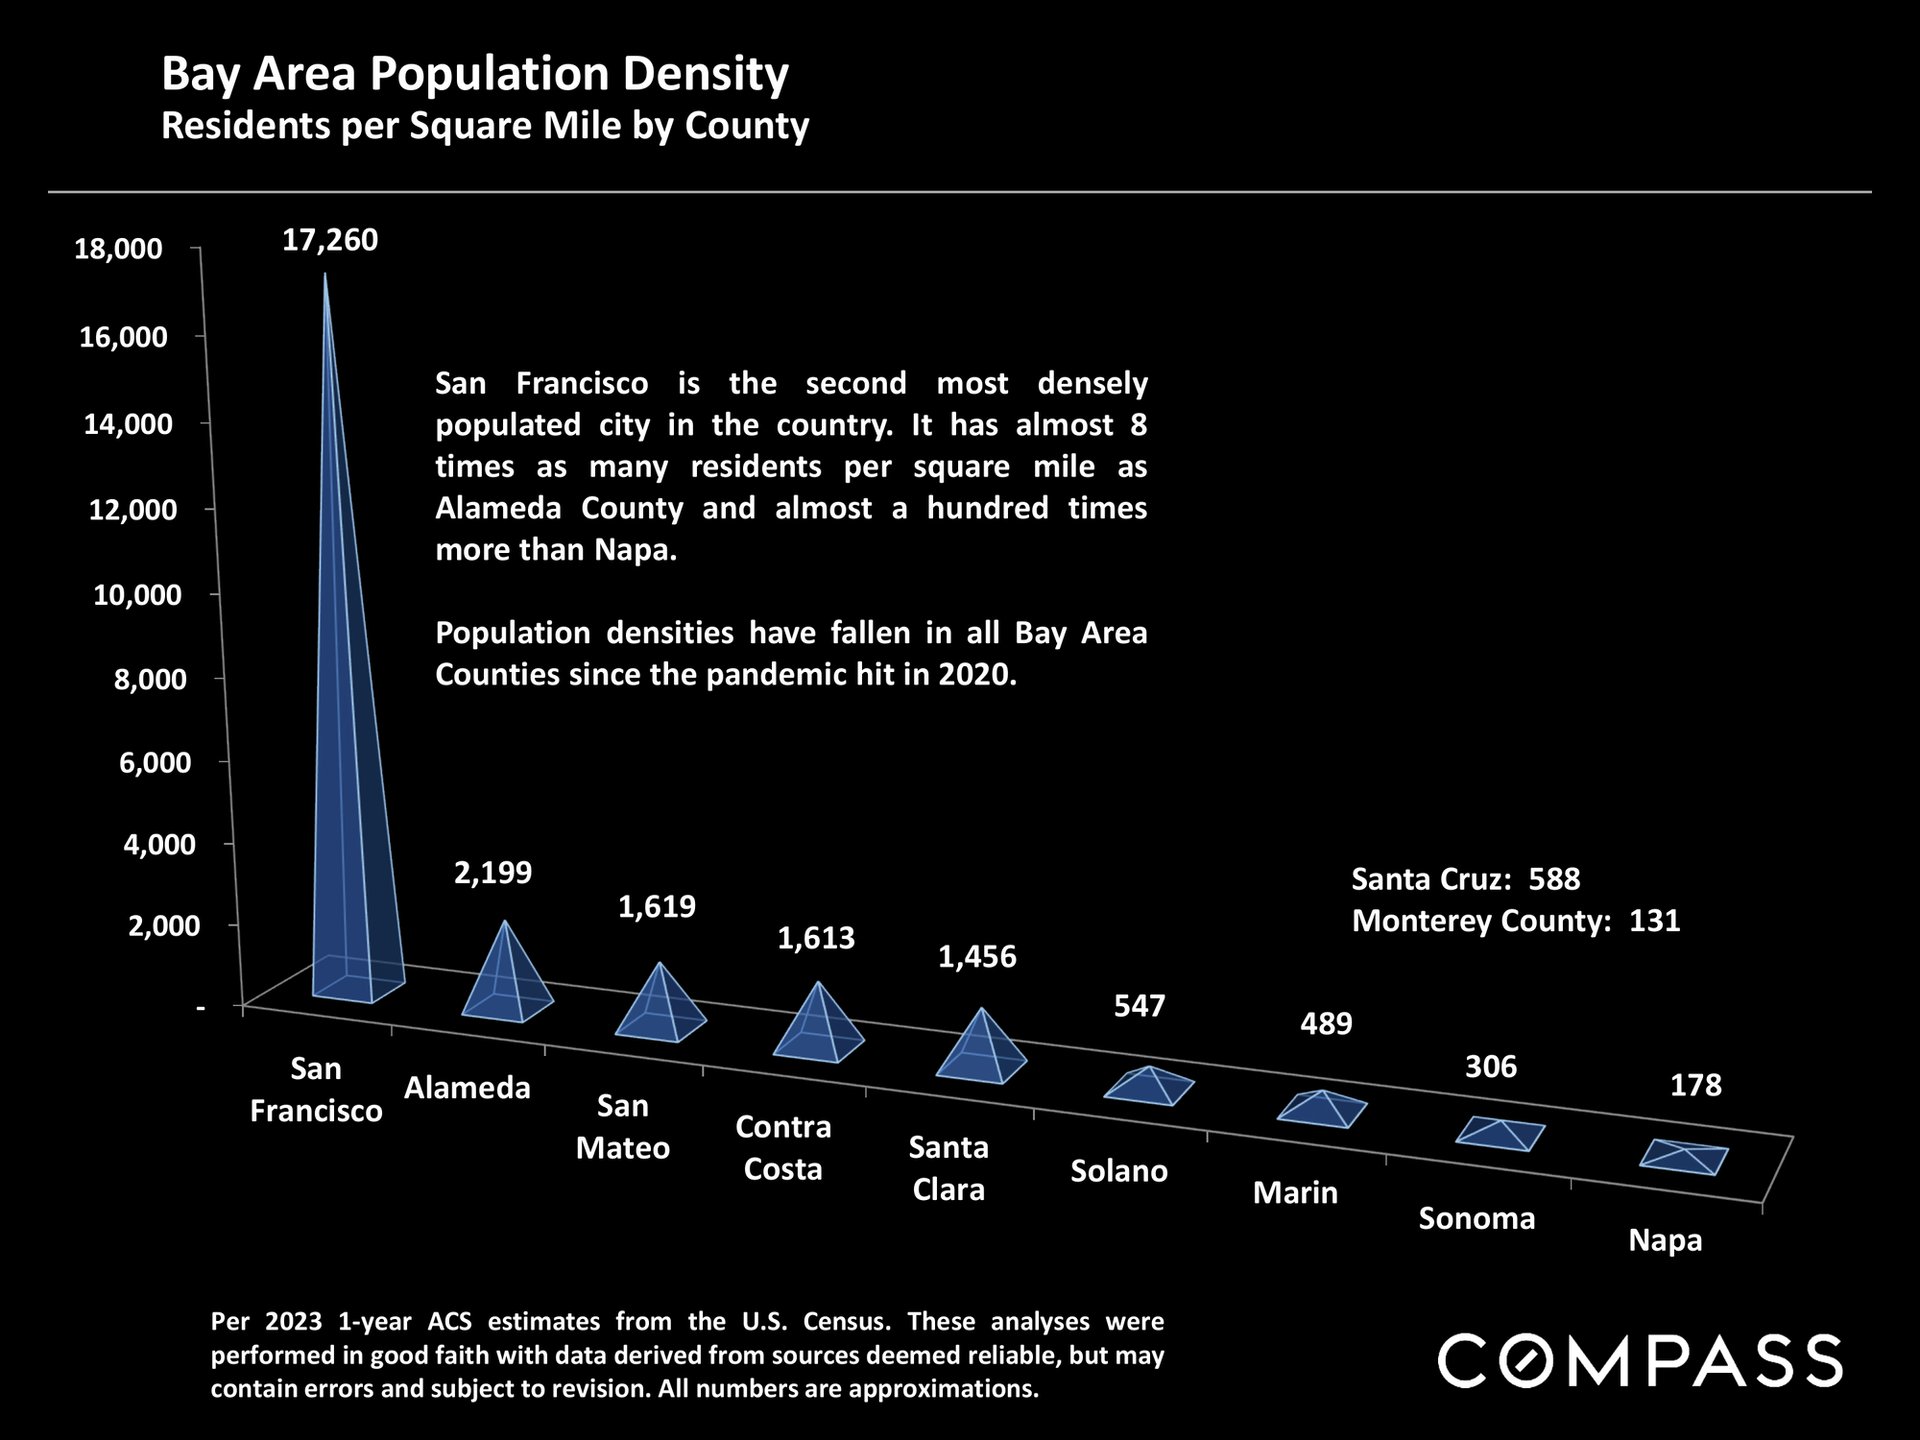
Chart compares population density across Bay Area counties, with San Francisco far denser than the others.
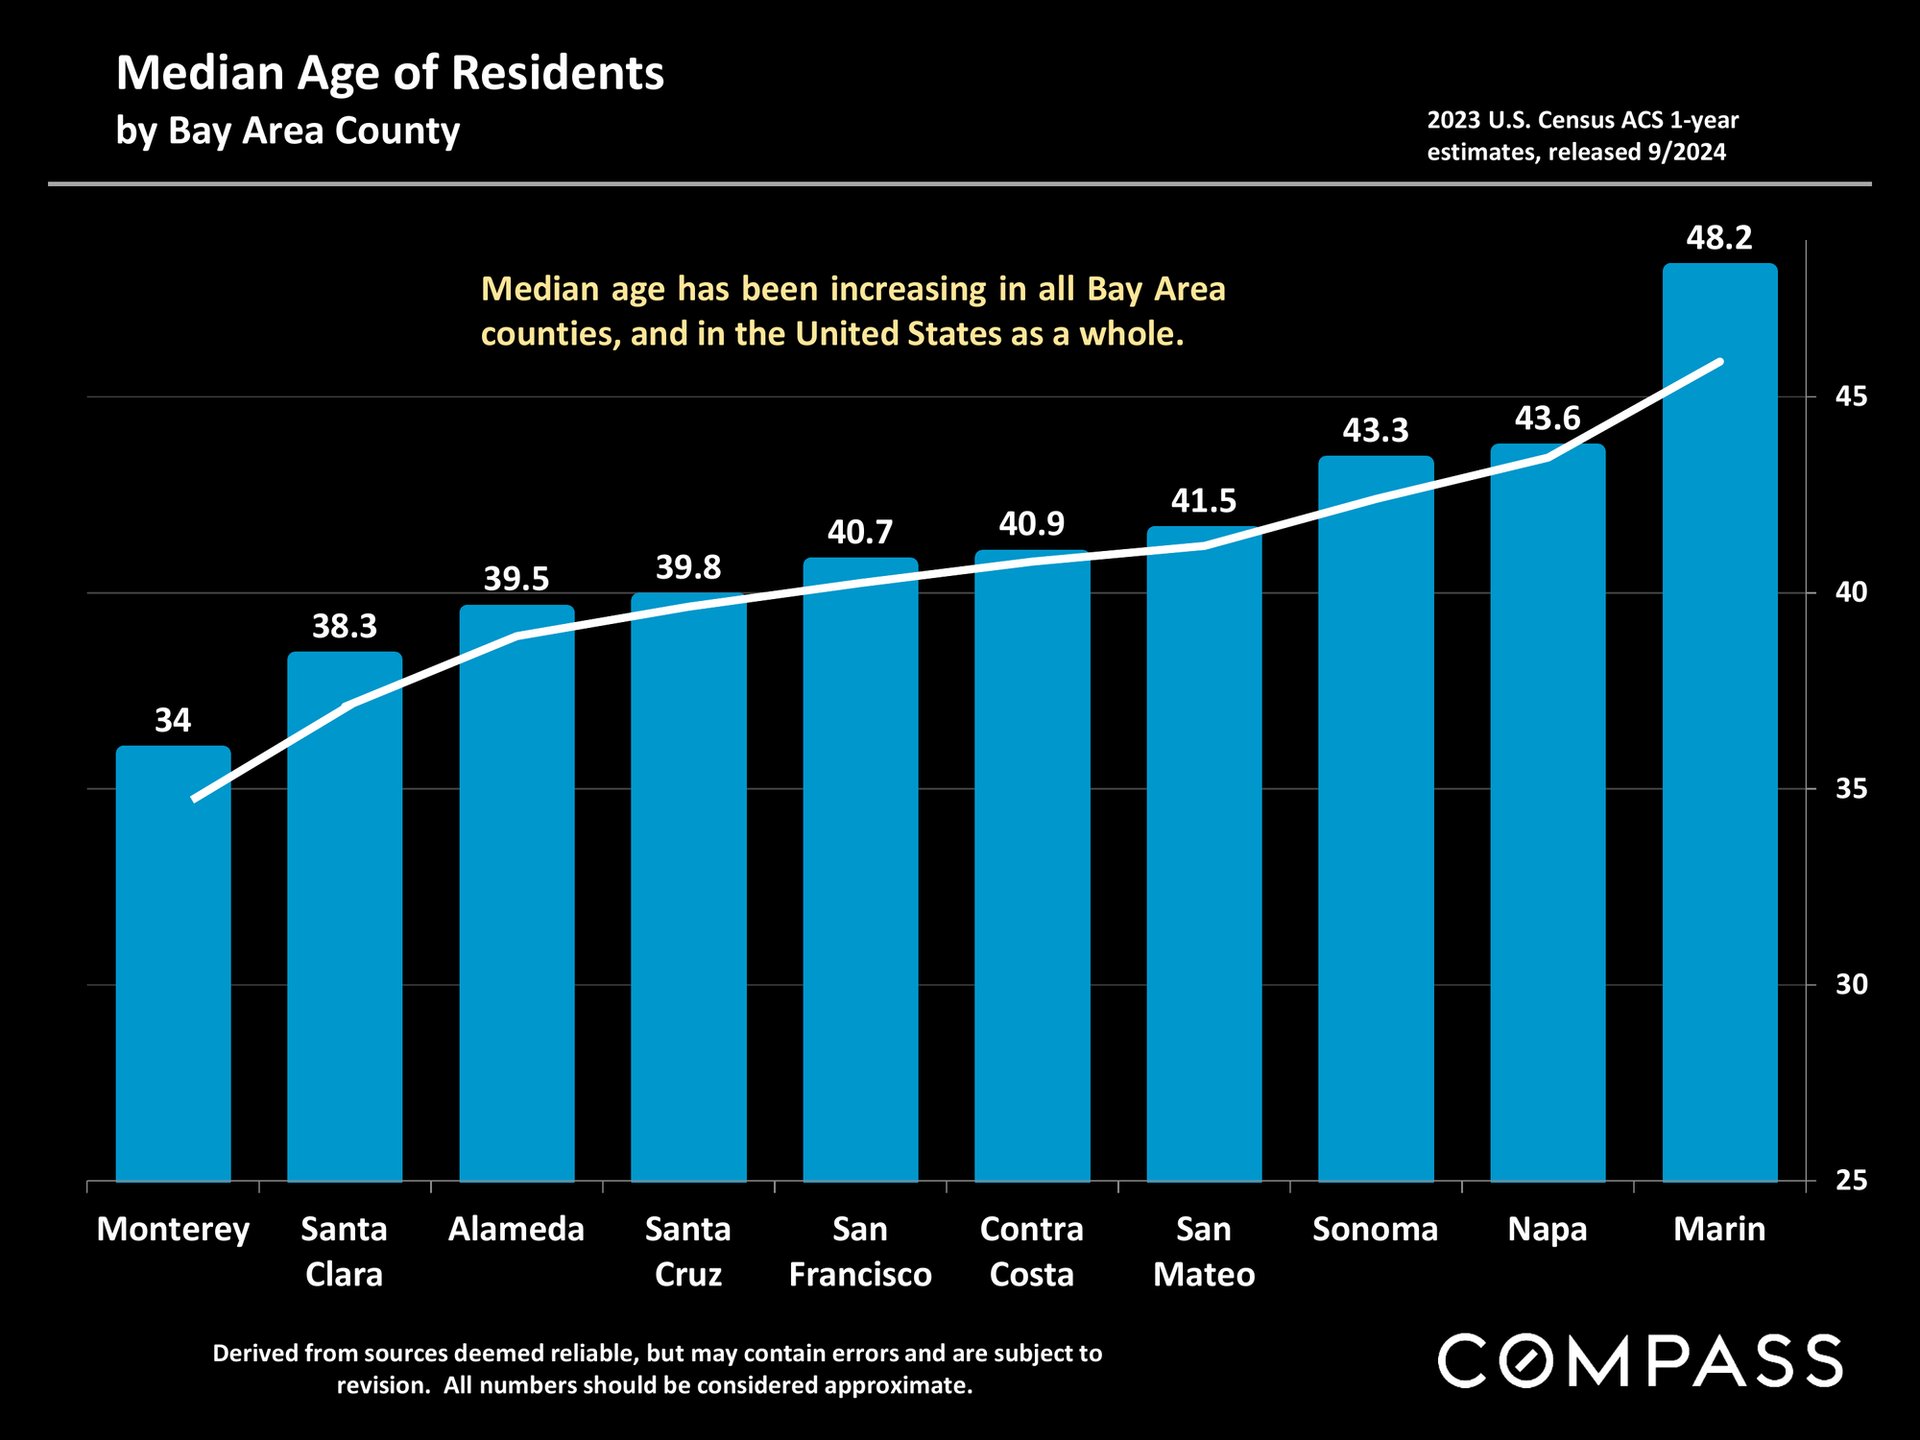
Chart of median age by Bay Area county, from 34 in Monterey to 48.2 in Marin.
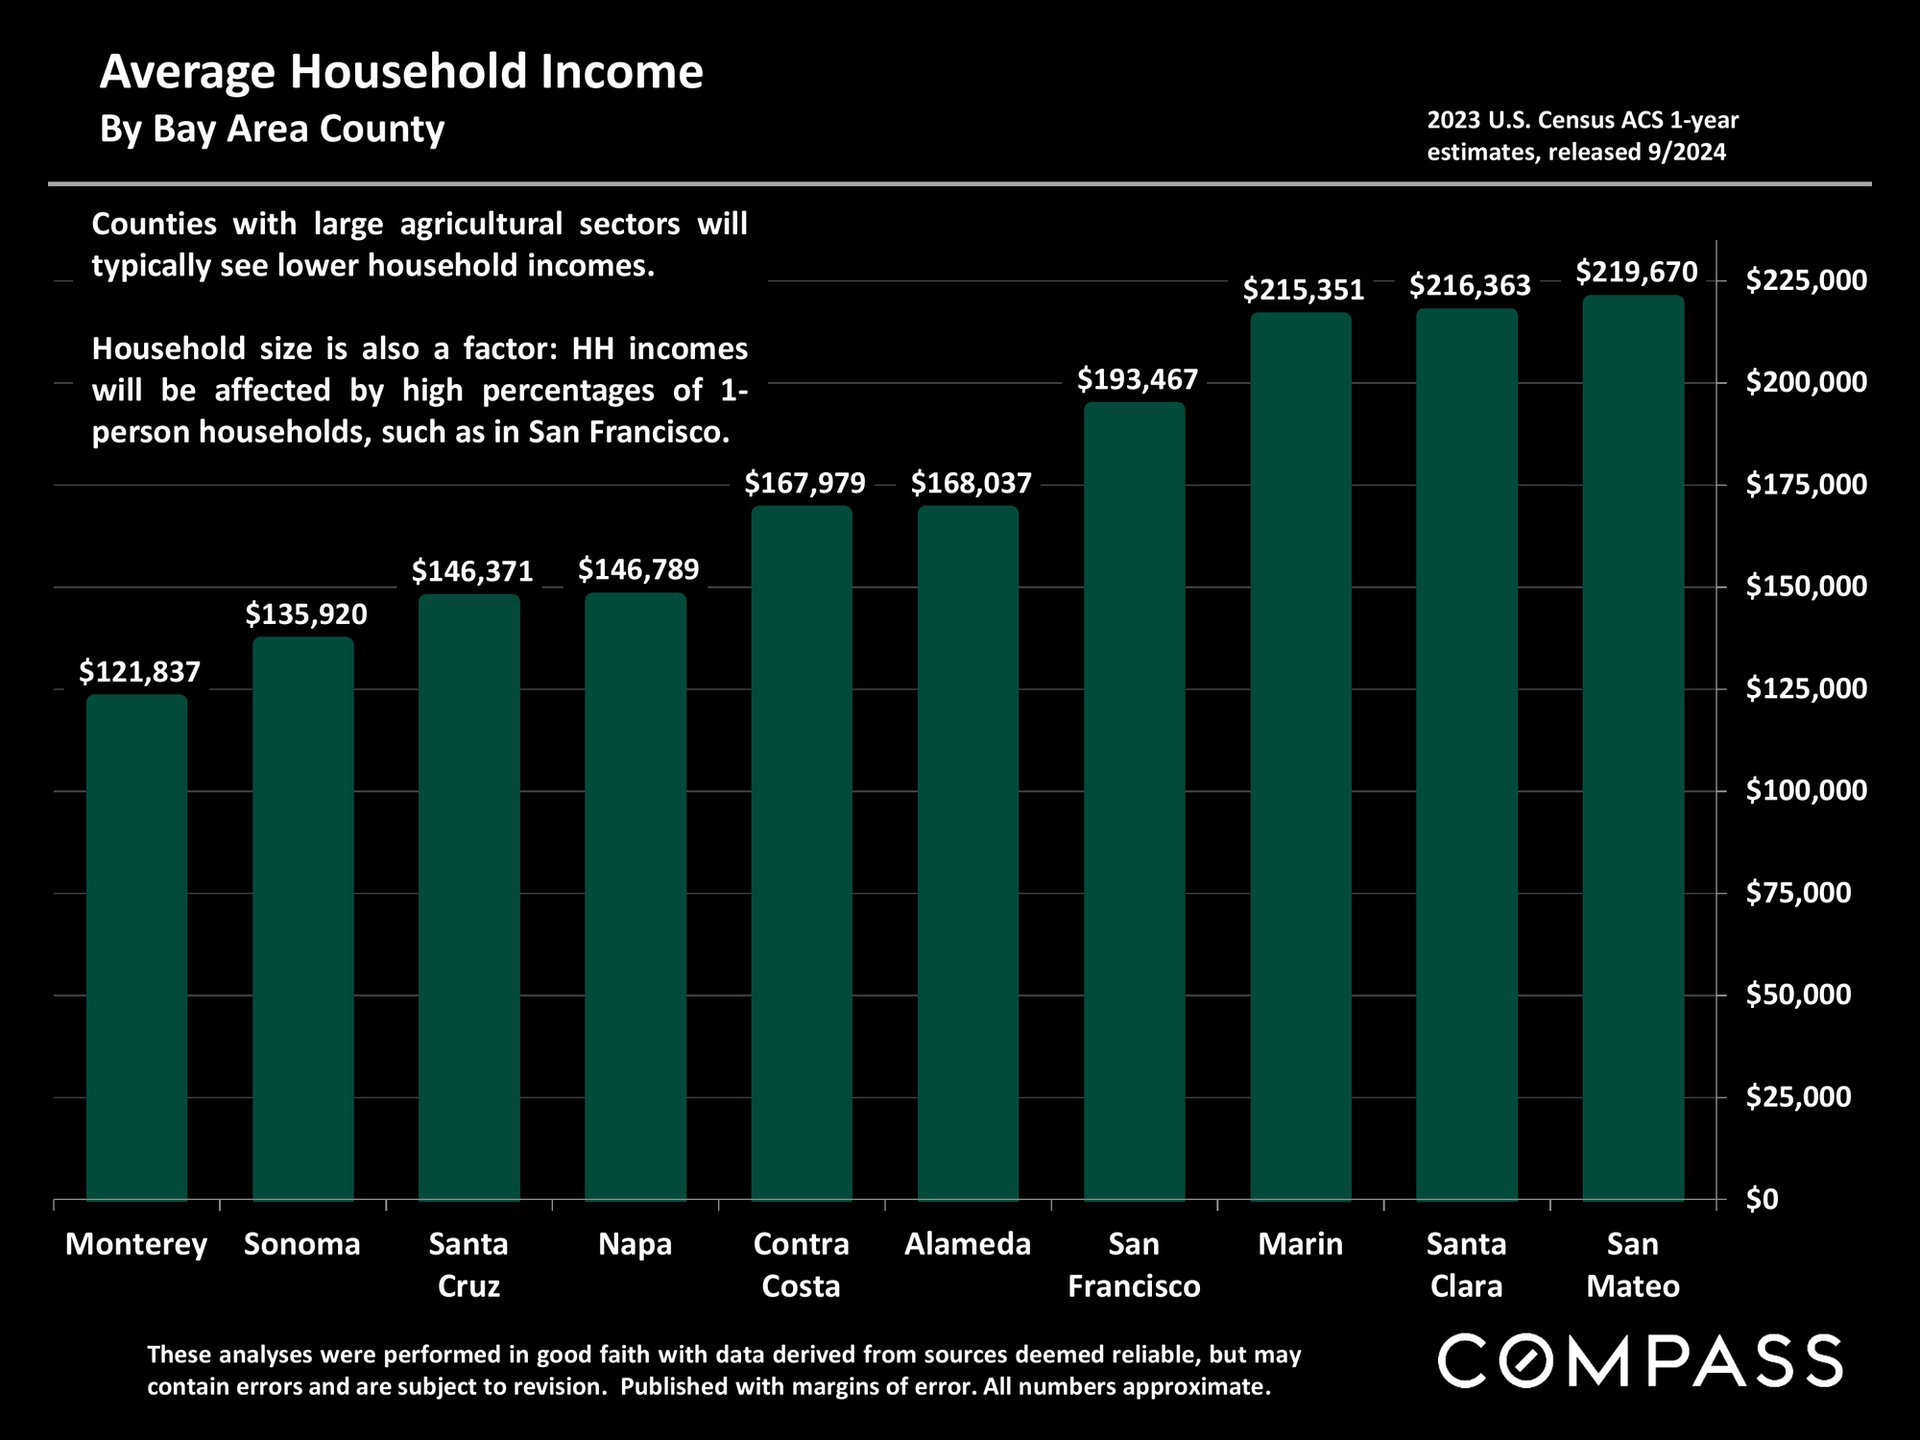
Bar chart comparing average household income across ten Bay Area counties, from Monterey to San Mateo.
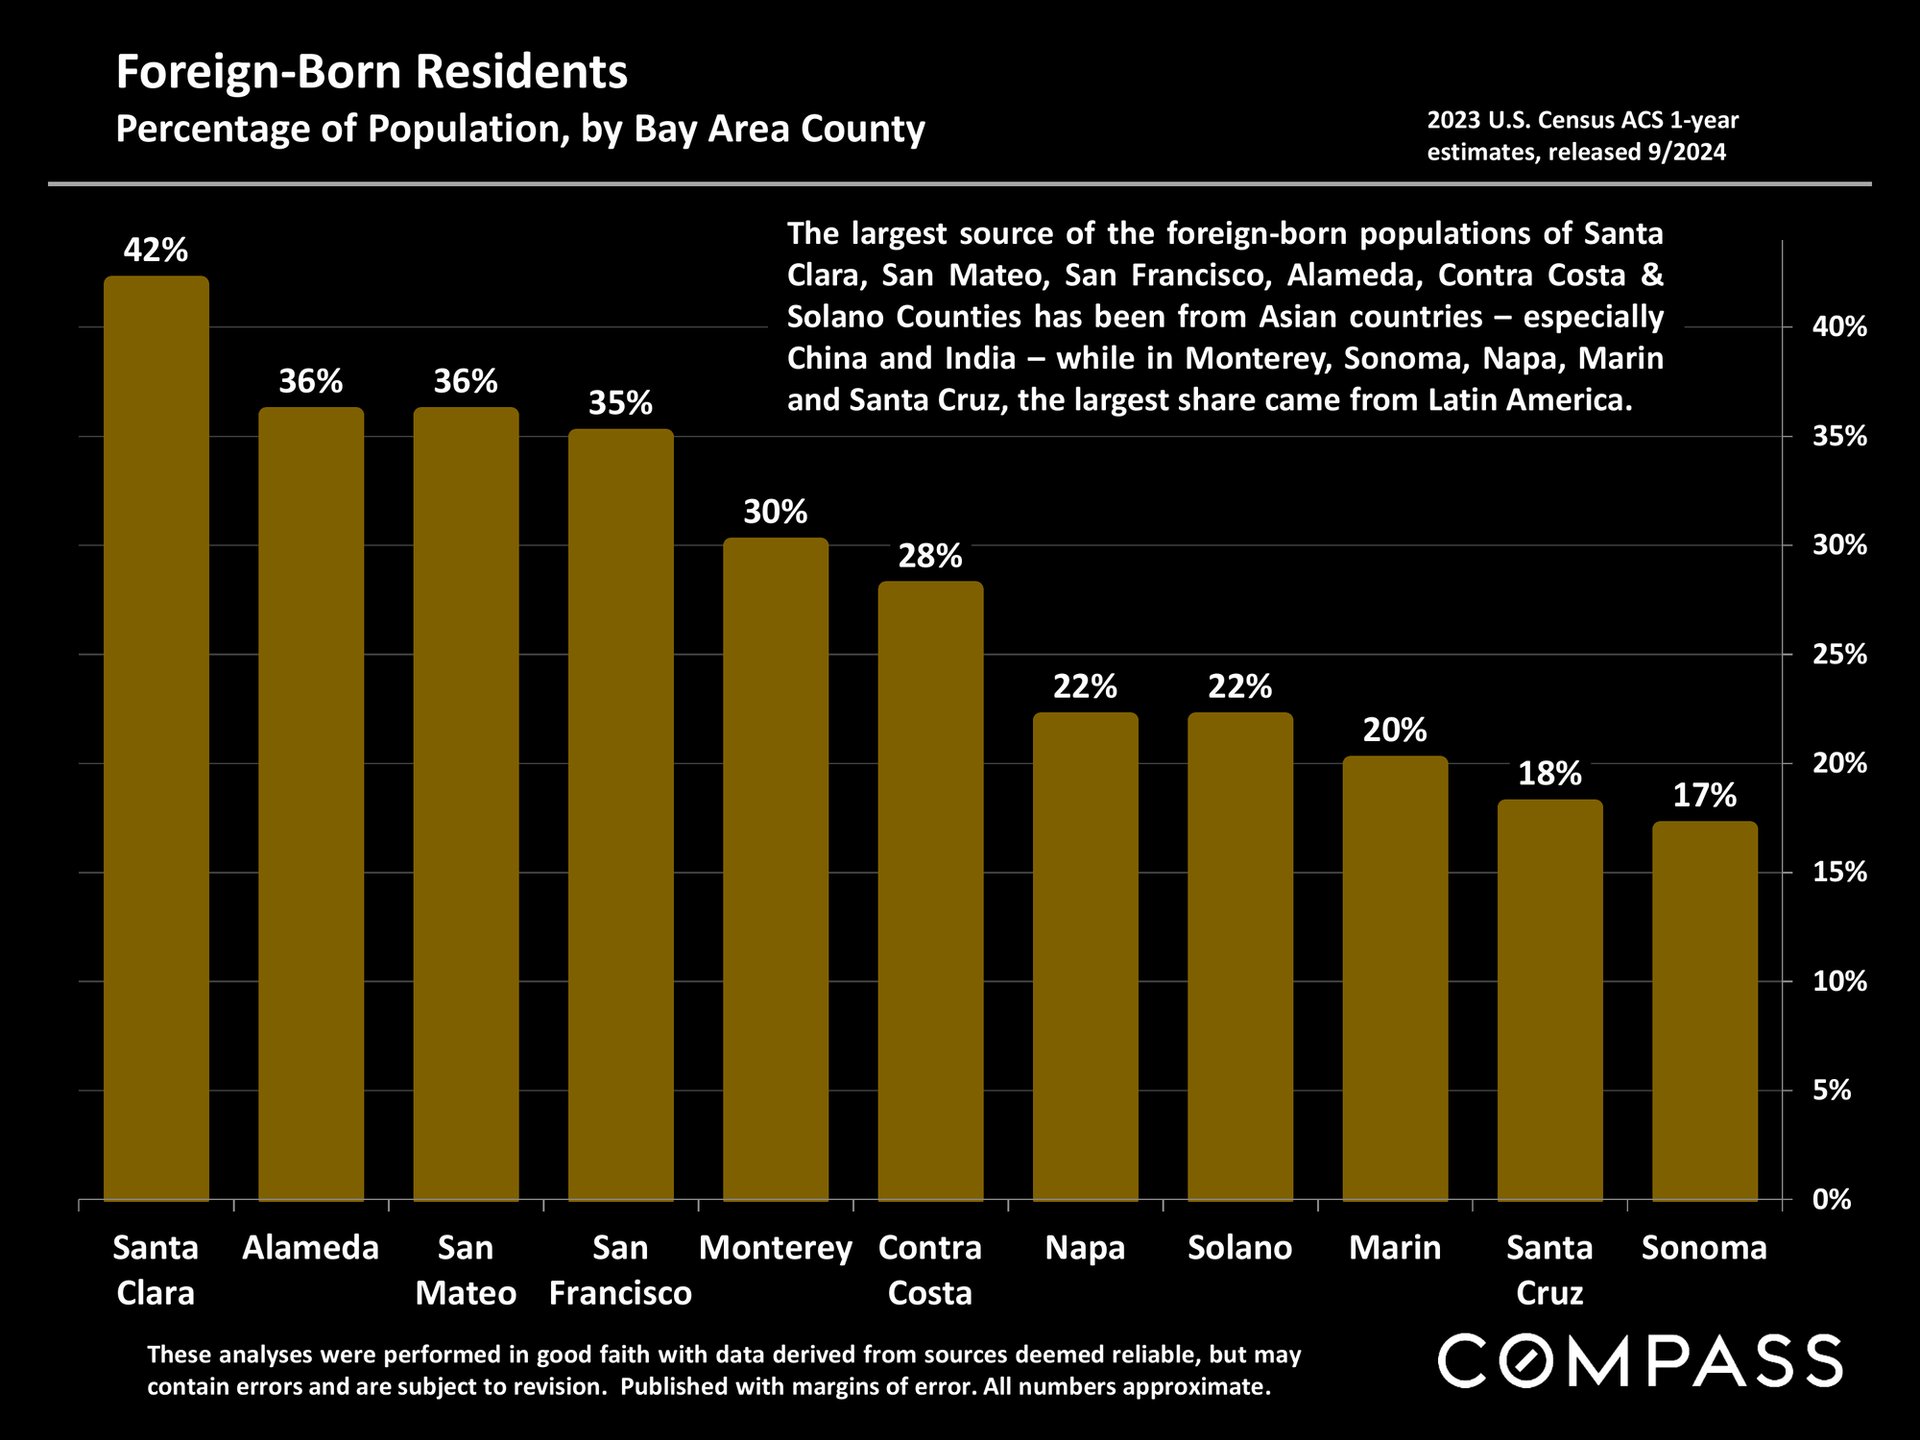
Bar chart of foreign-born residents across 11 Bay Area counties; Santa Clara leads at 42%, Sonoma is lowest at 17%.
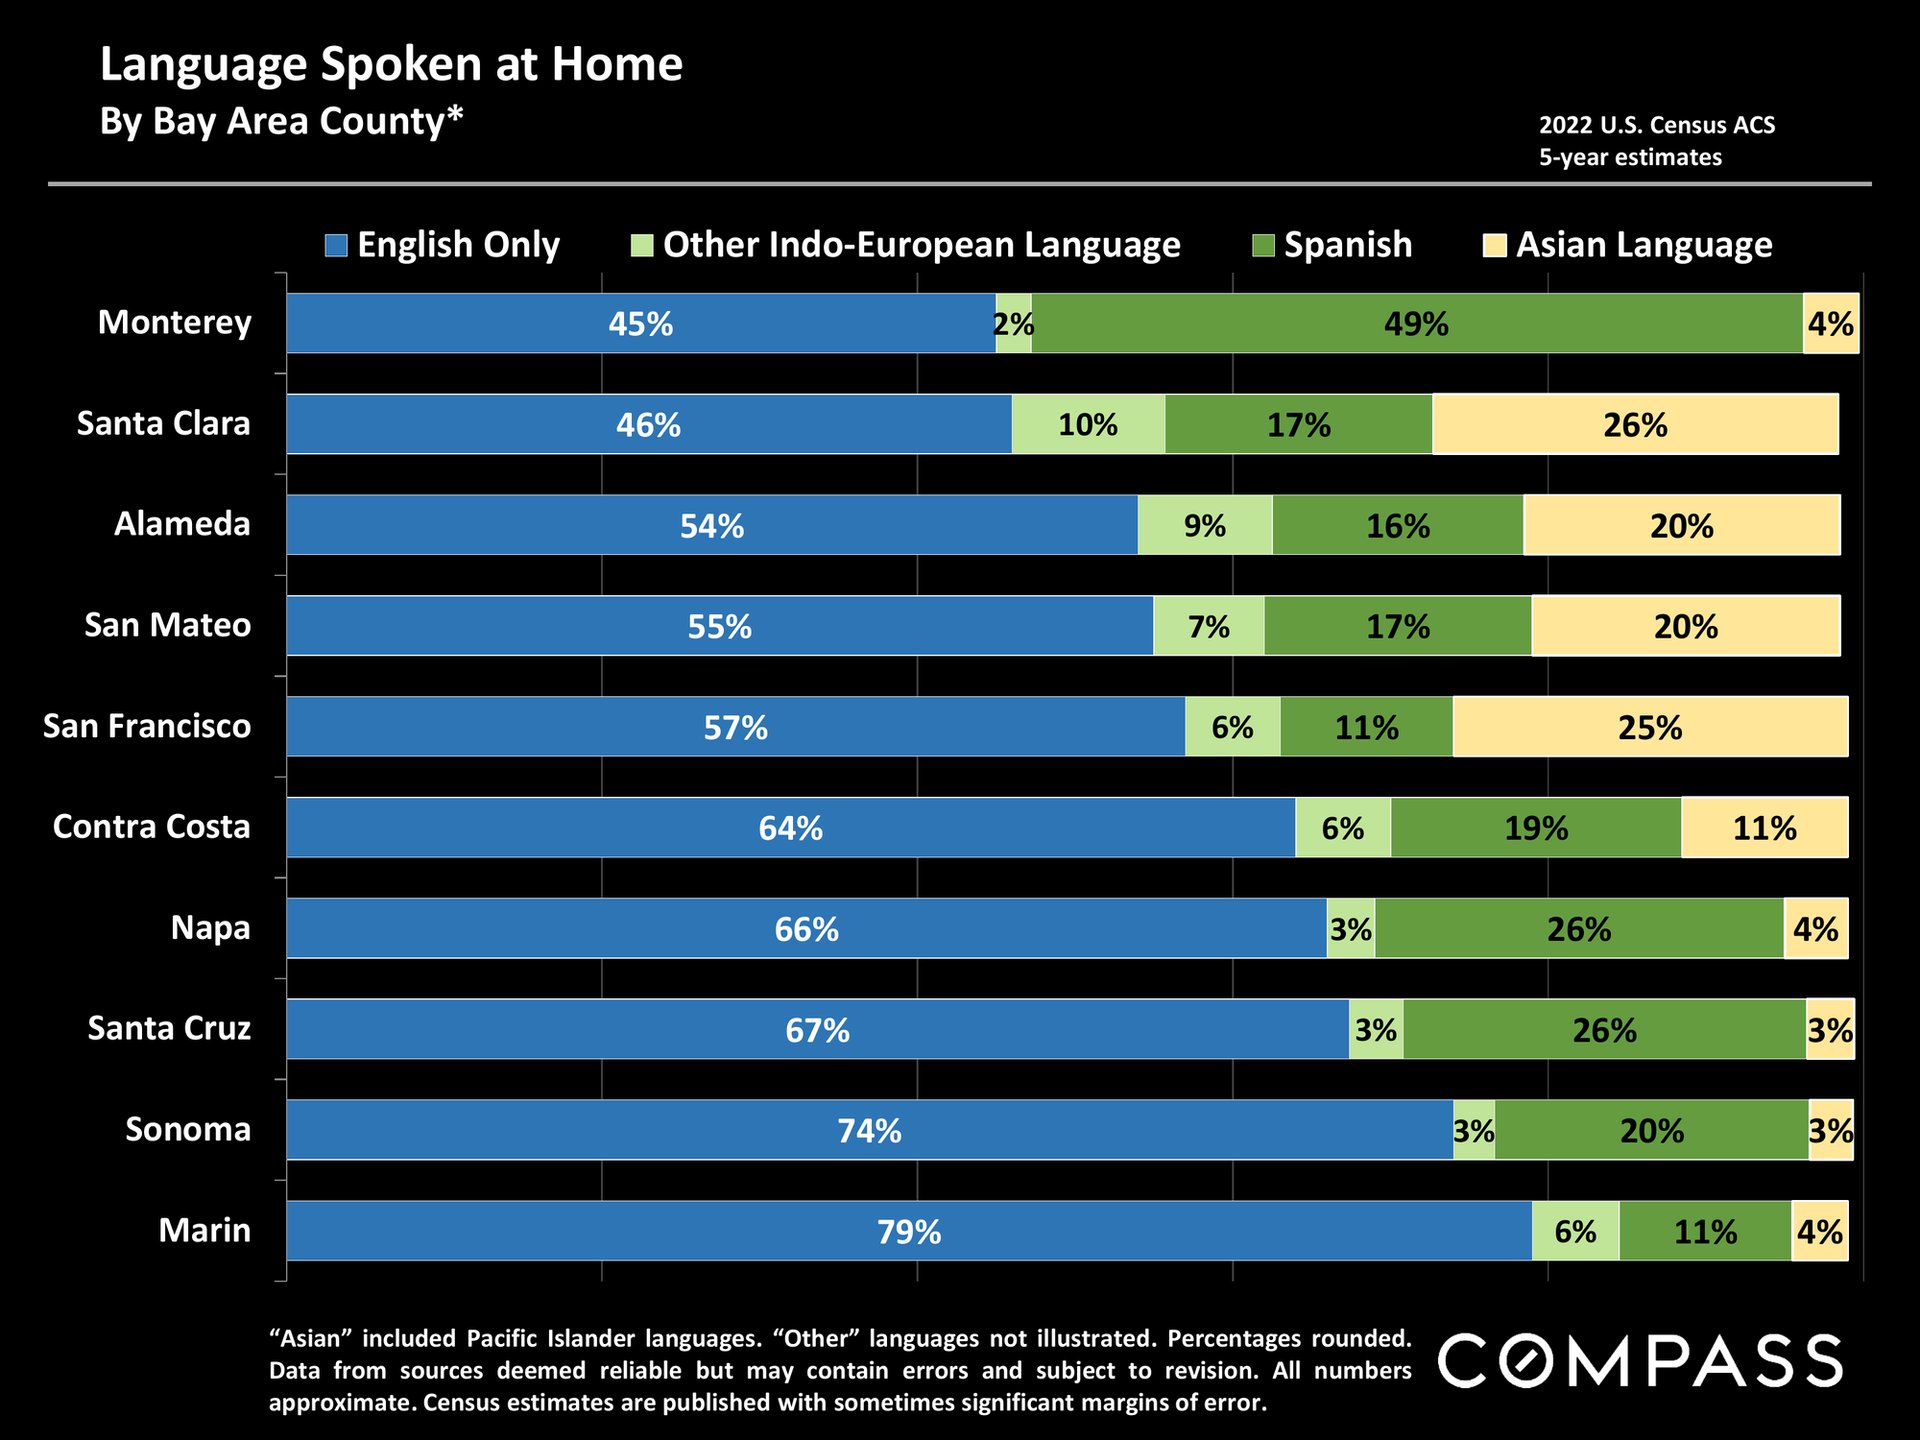
Chart comparing languages spoken at home across ten Bay Area counties, with percentages from 2022 Census estimates.
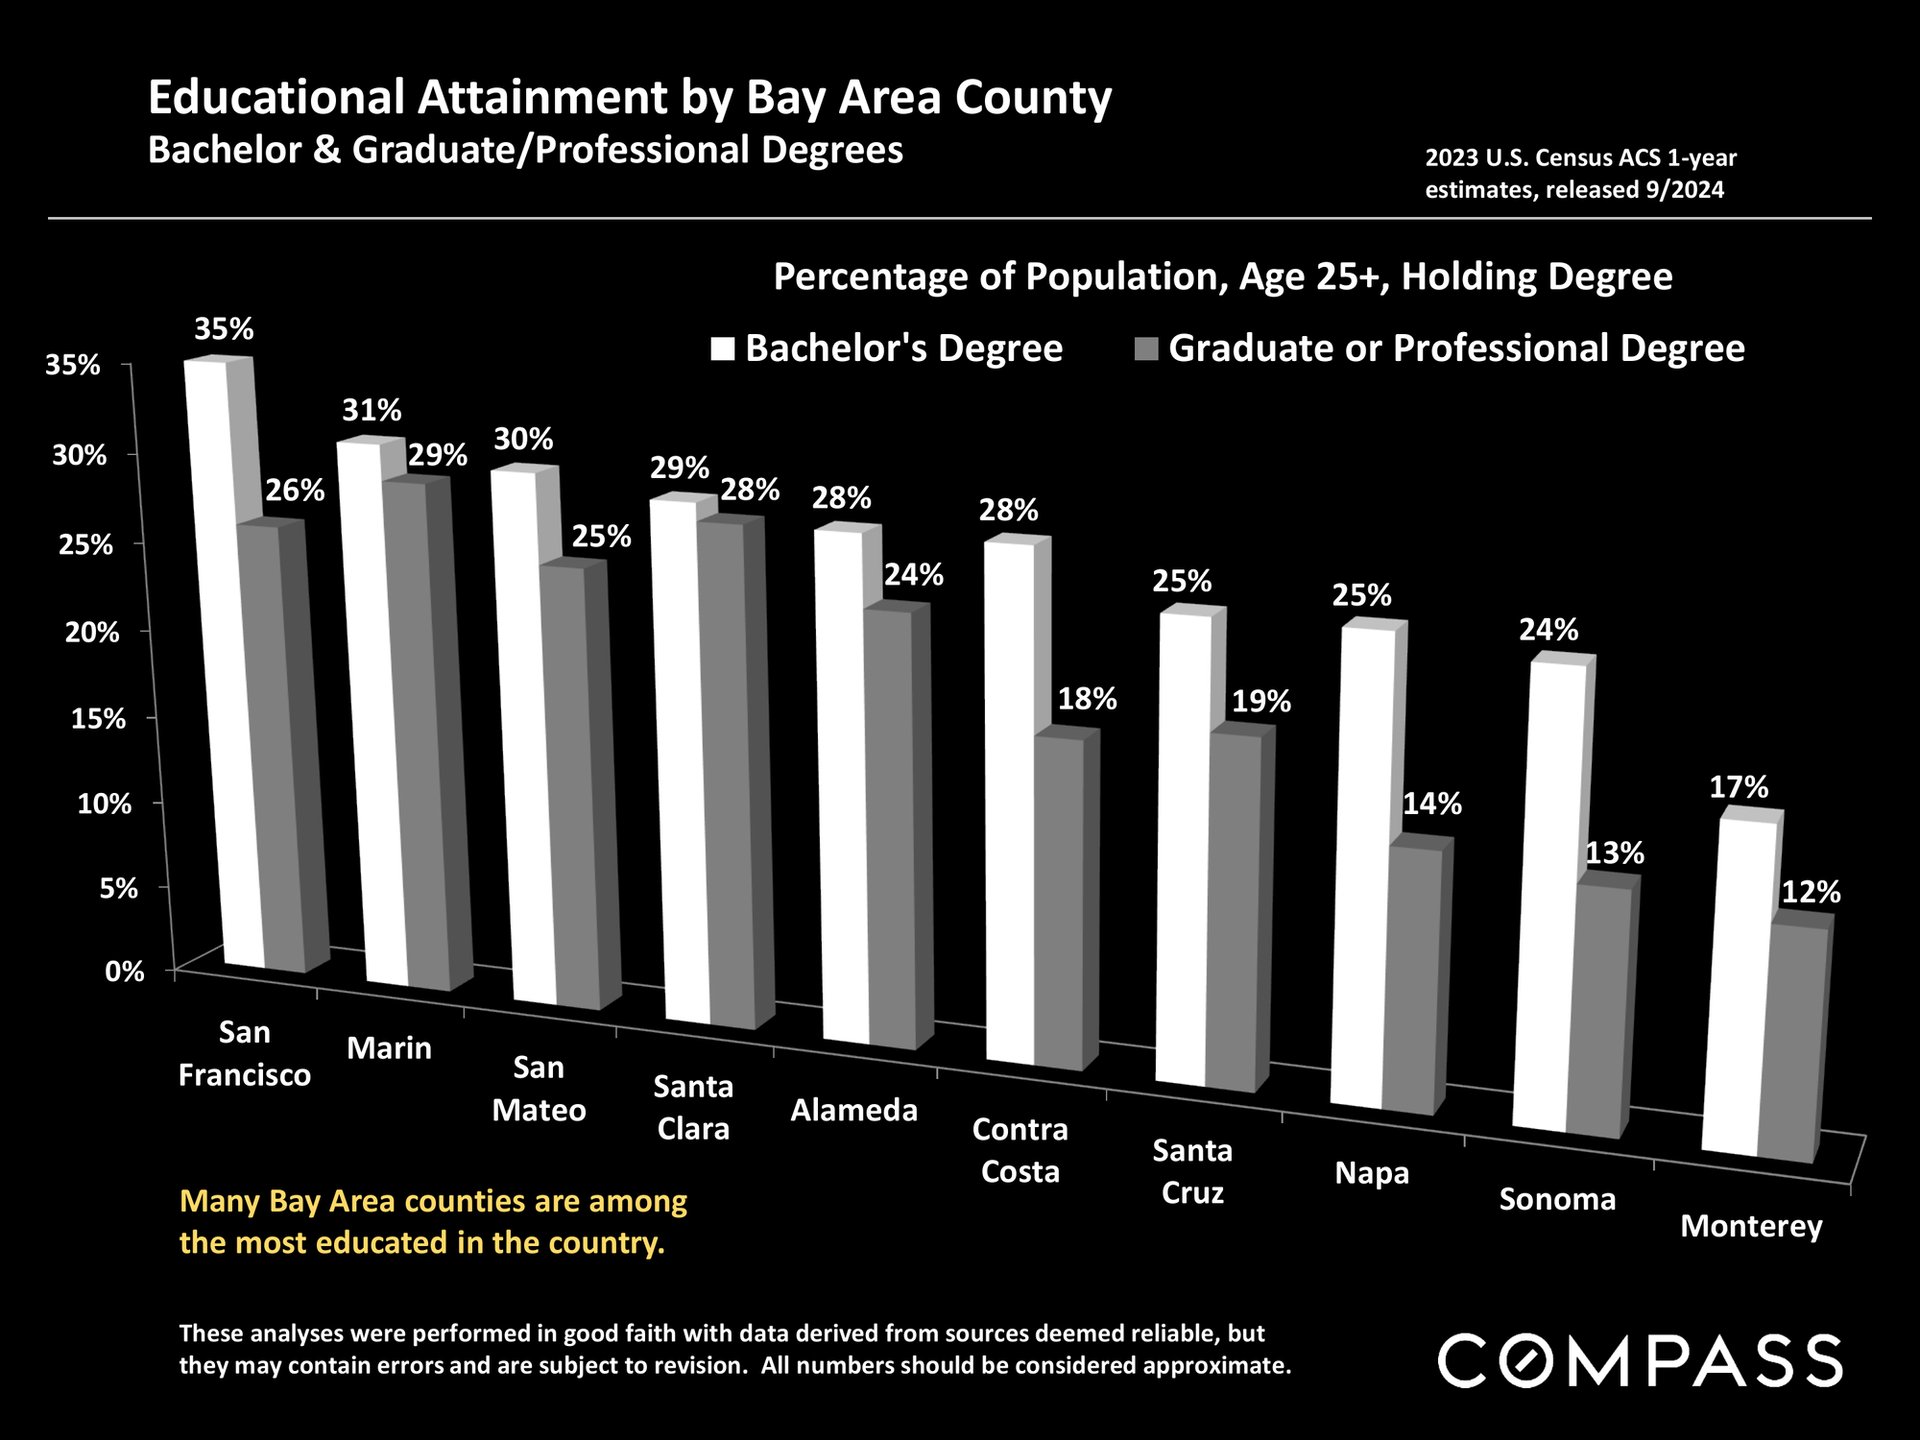
Chart comparing bachelor’s and graduate-degree attainment across ten Bay Area counties, with San Francisco and Marin highest.
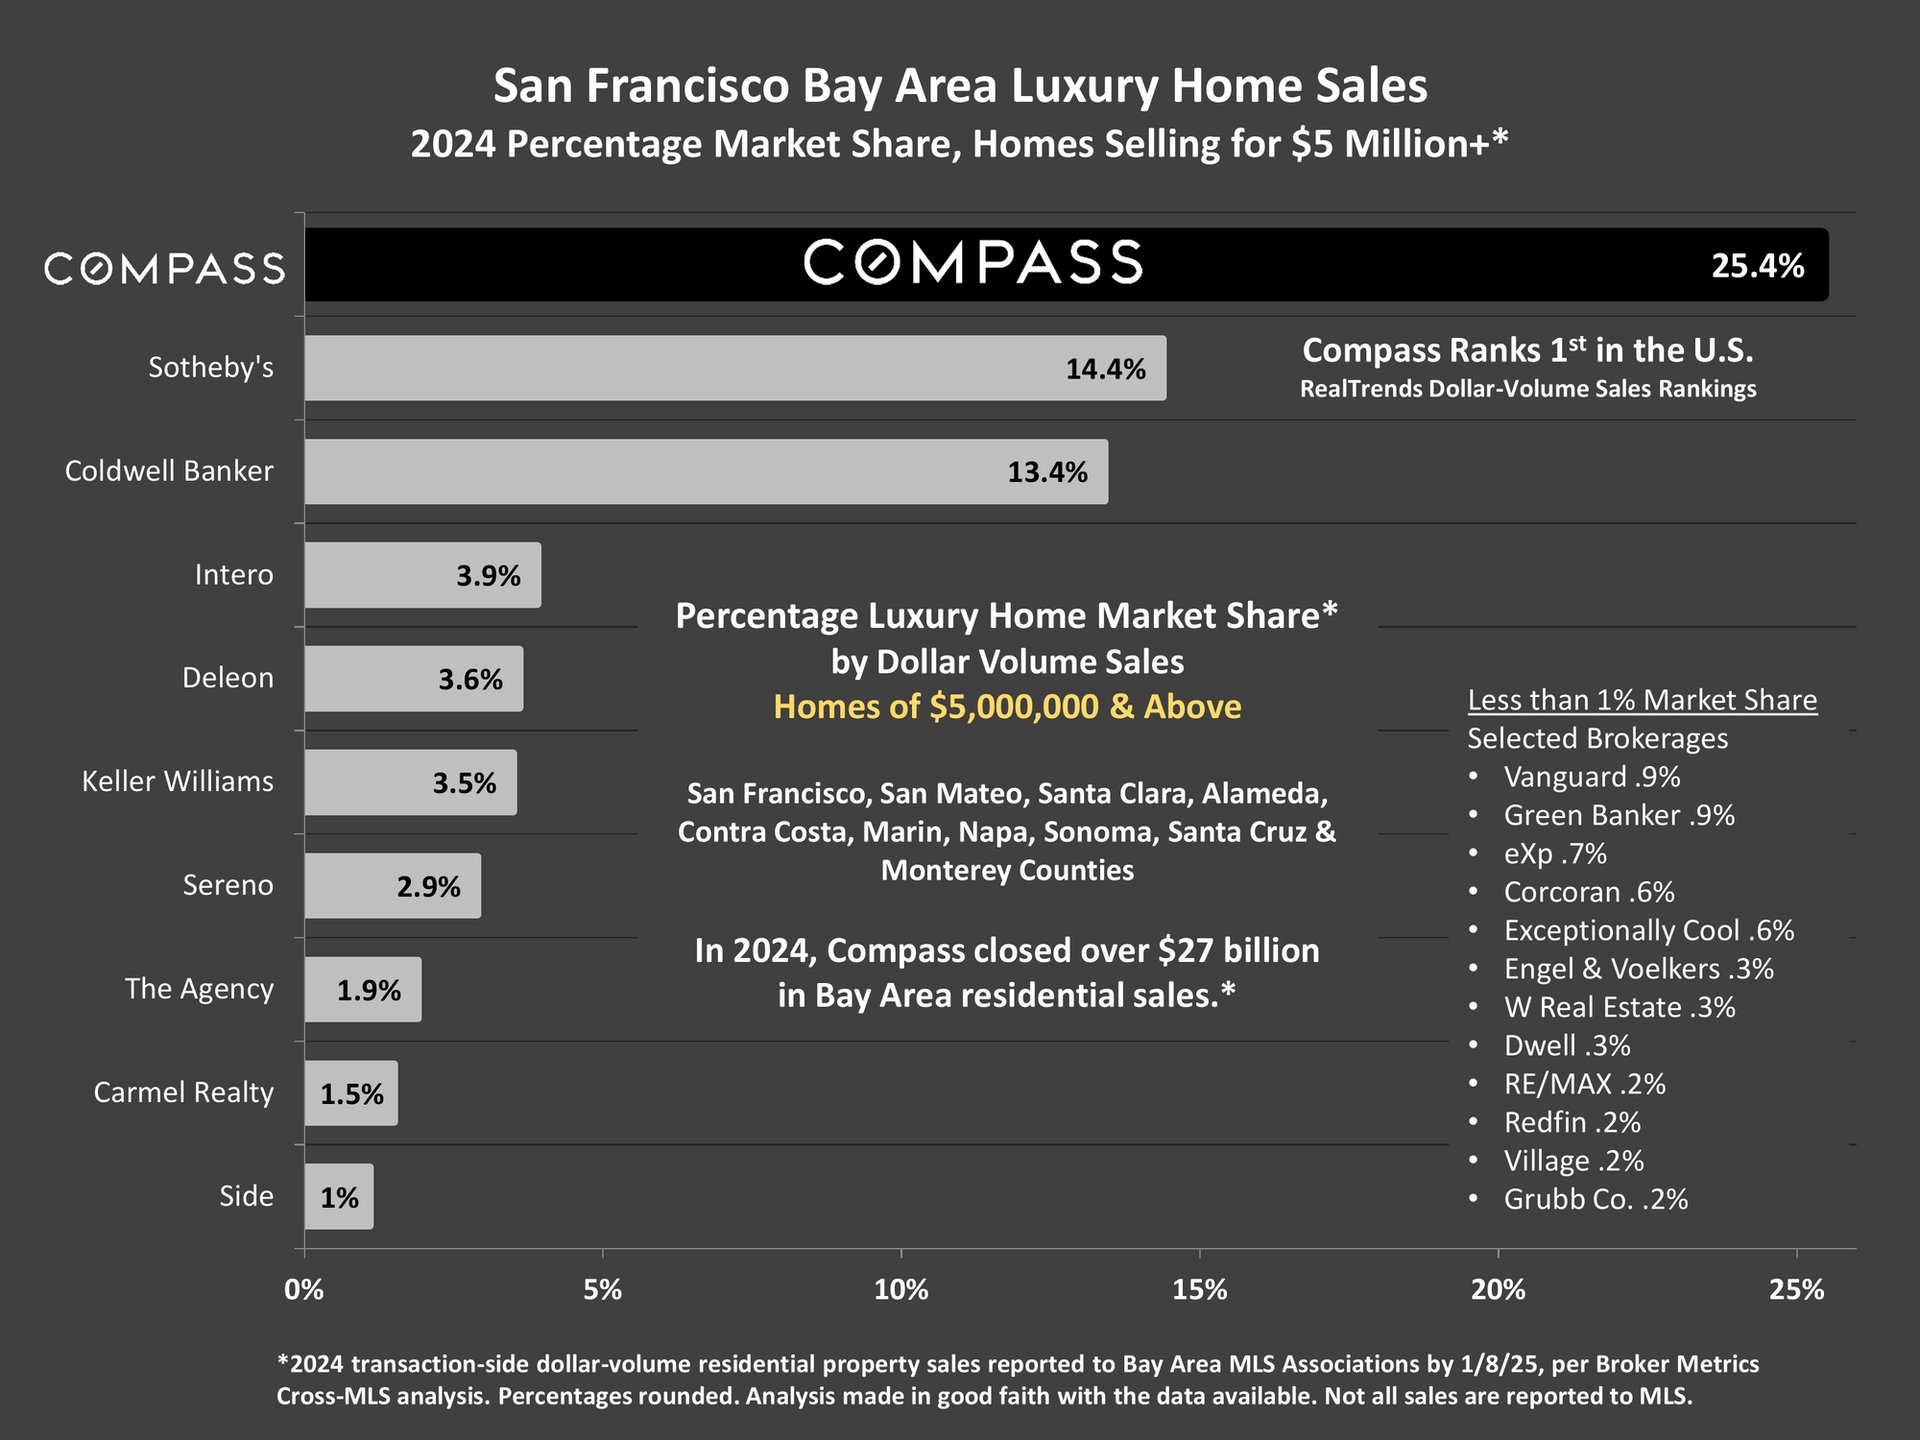
Chart of 2024 Bay Area luxury home market share, with Compass leading at 25.4%.Chart of 2024 Bay Area luxury-home sales market share, with Compass leading at 25.4%.Bay Area market reports webpage with Compass banner and regional report cards.

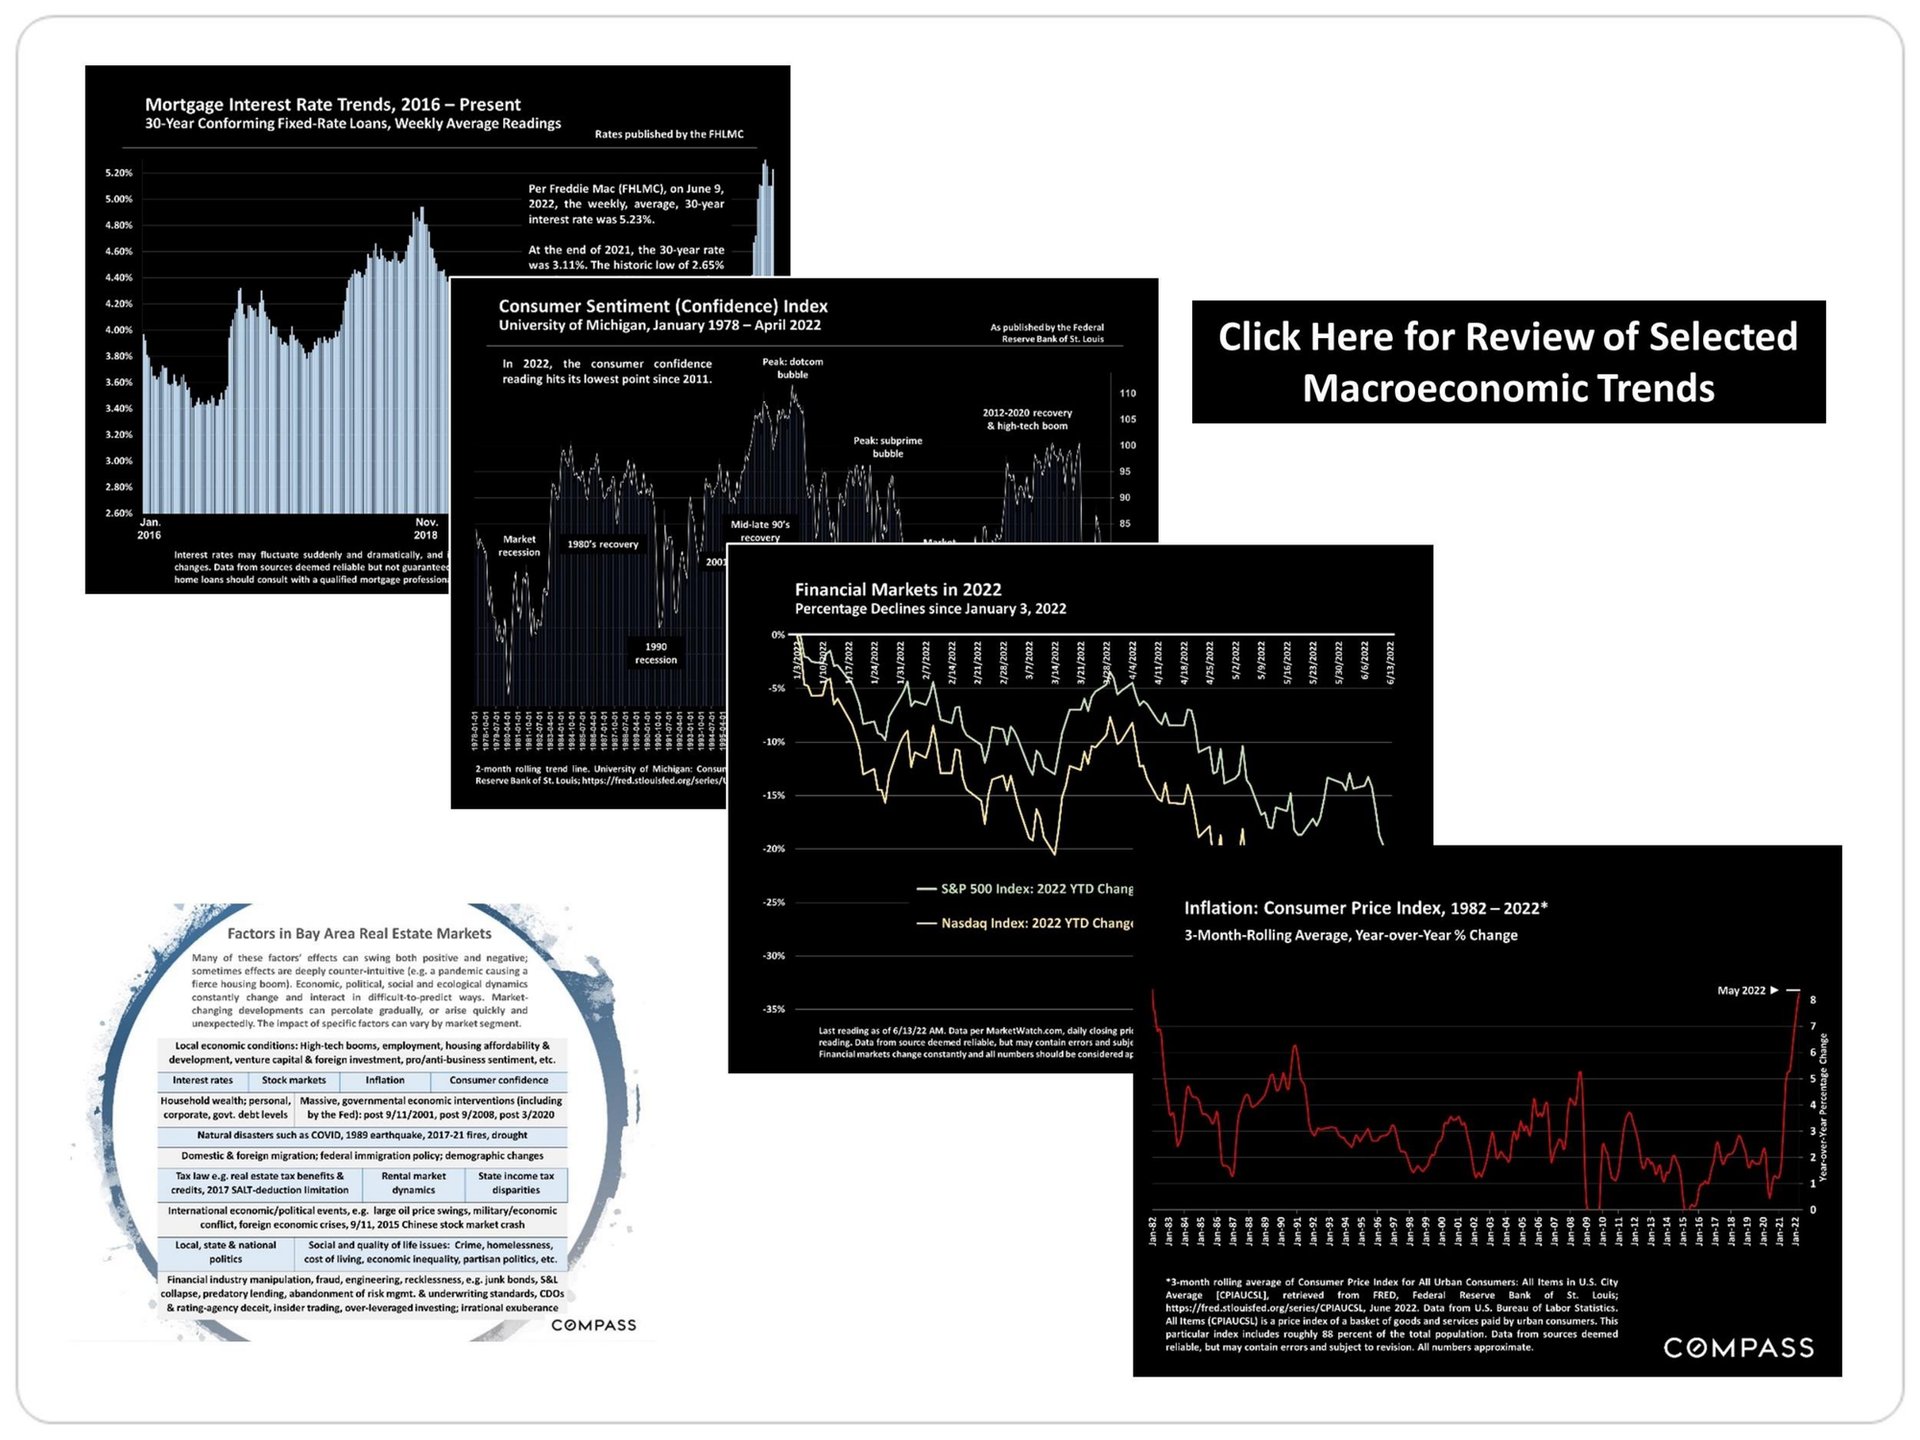
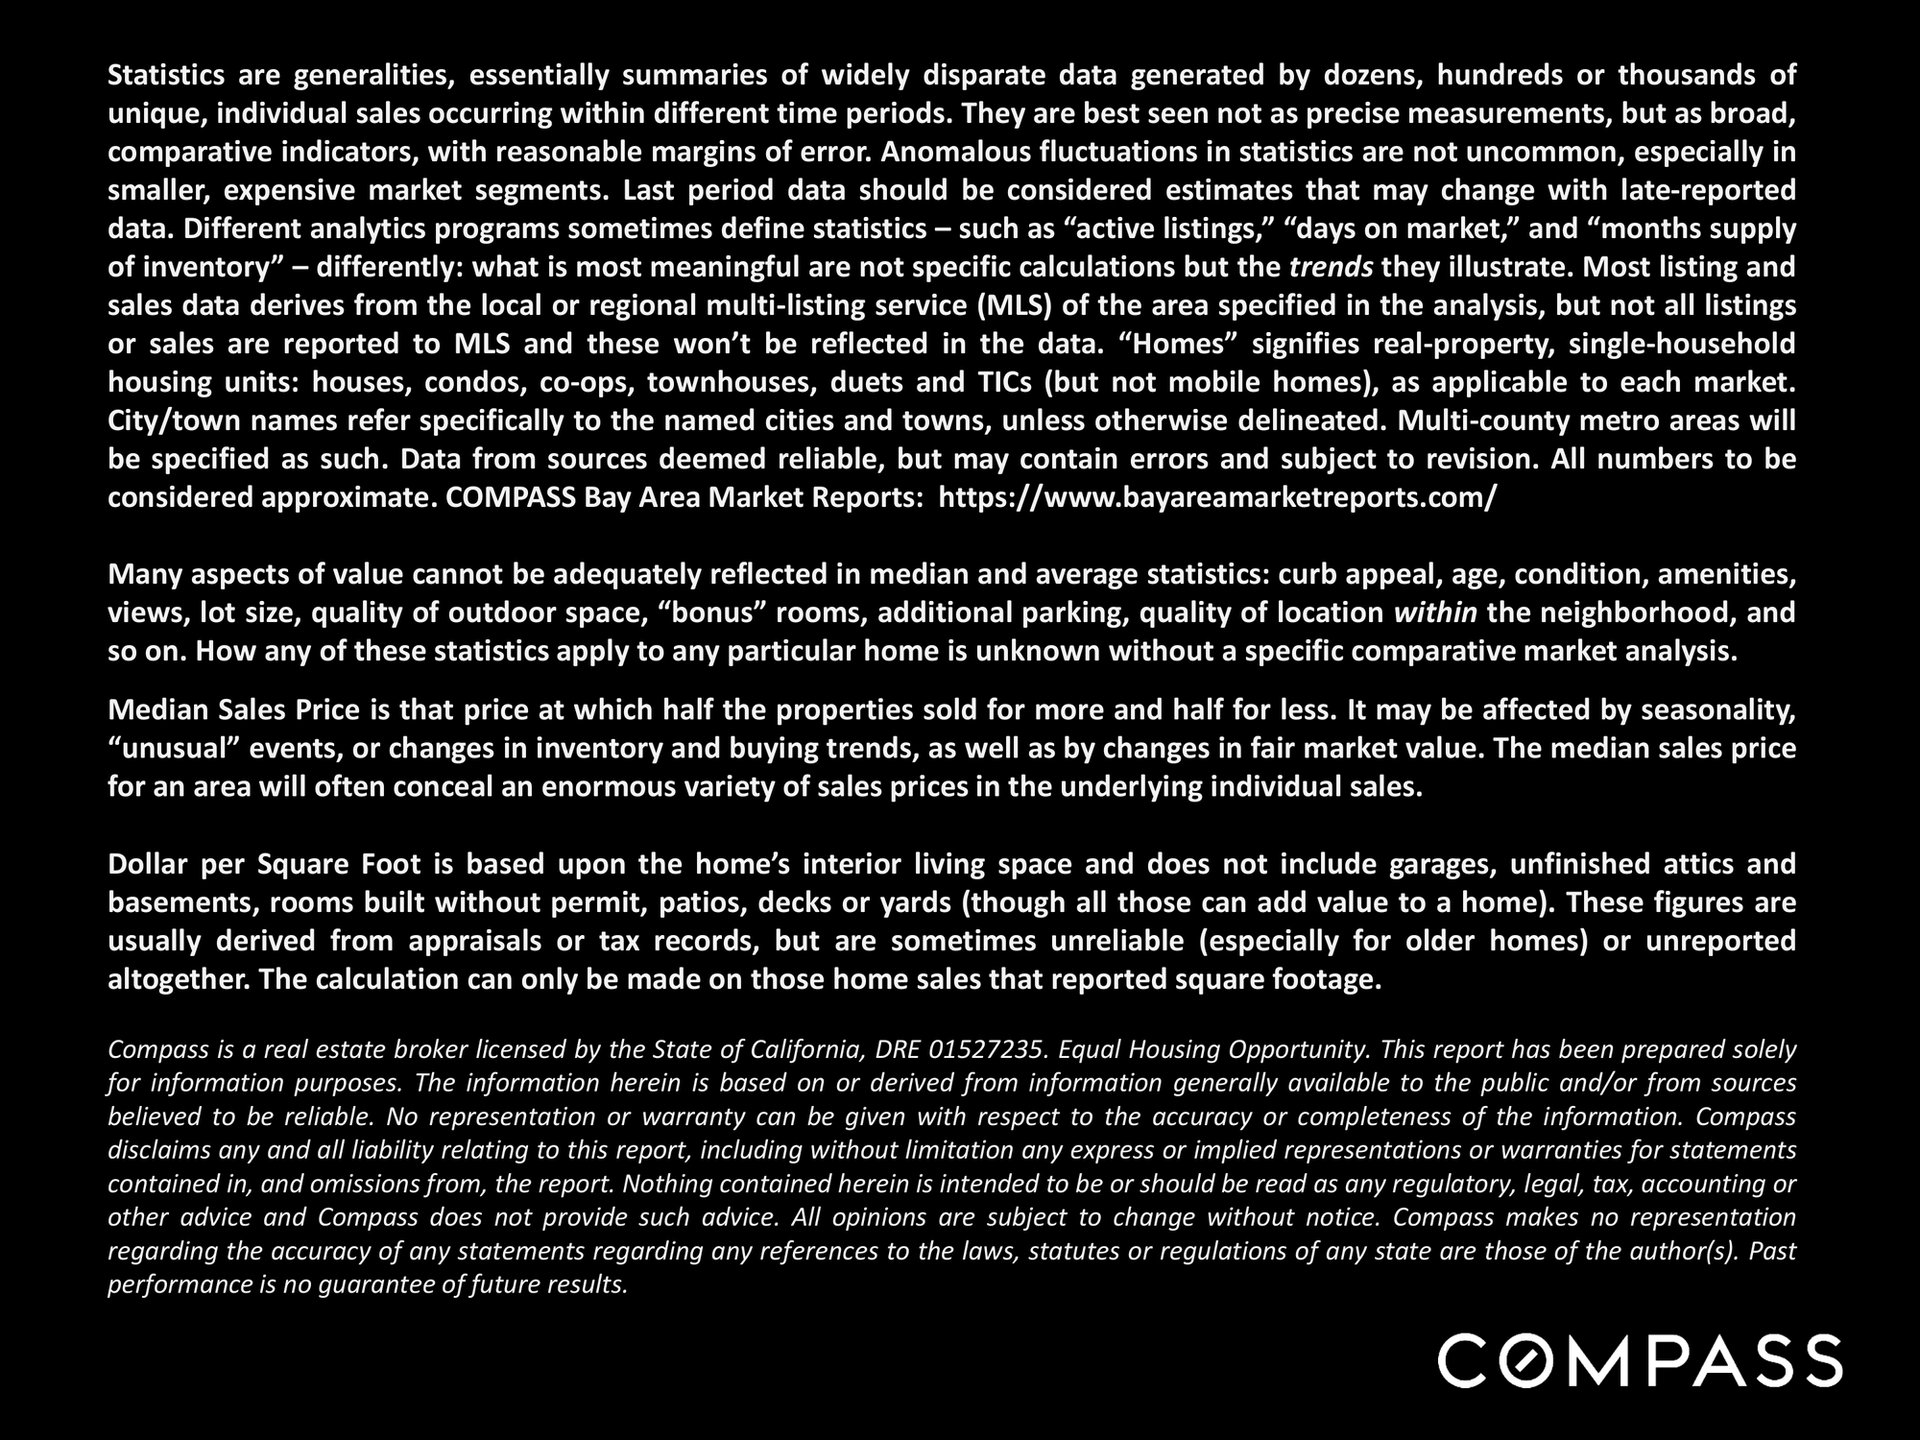
Charts of mortgage rates, consumer confidence, financial markets, inflation, and factors affecting Bay Area real estate.San Francisco Bay market survey notes on statistics, home values, price per square foot, and Compass’s legal disclaimer.


WORK WITH US

We offer the highest level of service and expertise to our clients. Our team has built a reputation for consistently representing the finest real estate in San Francisco and Napa Valley. Results driven and dedicated to your success, whether buying, selling, renting or investing. Contact us today for a private consultation.

Contact Us