
San Francisco County - December 2023

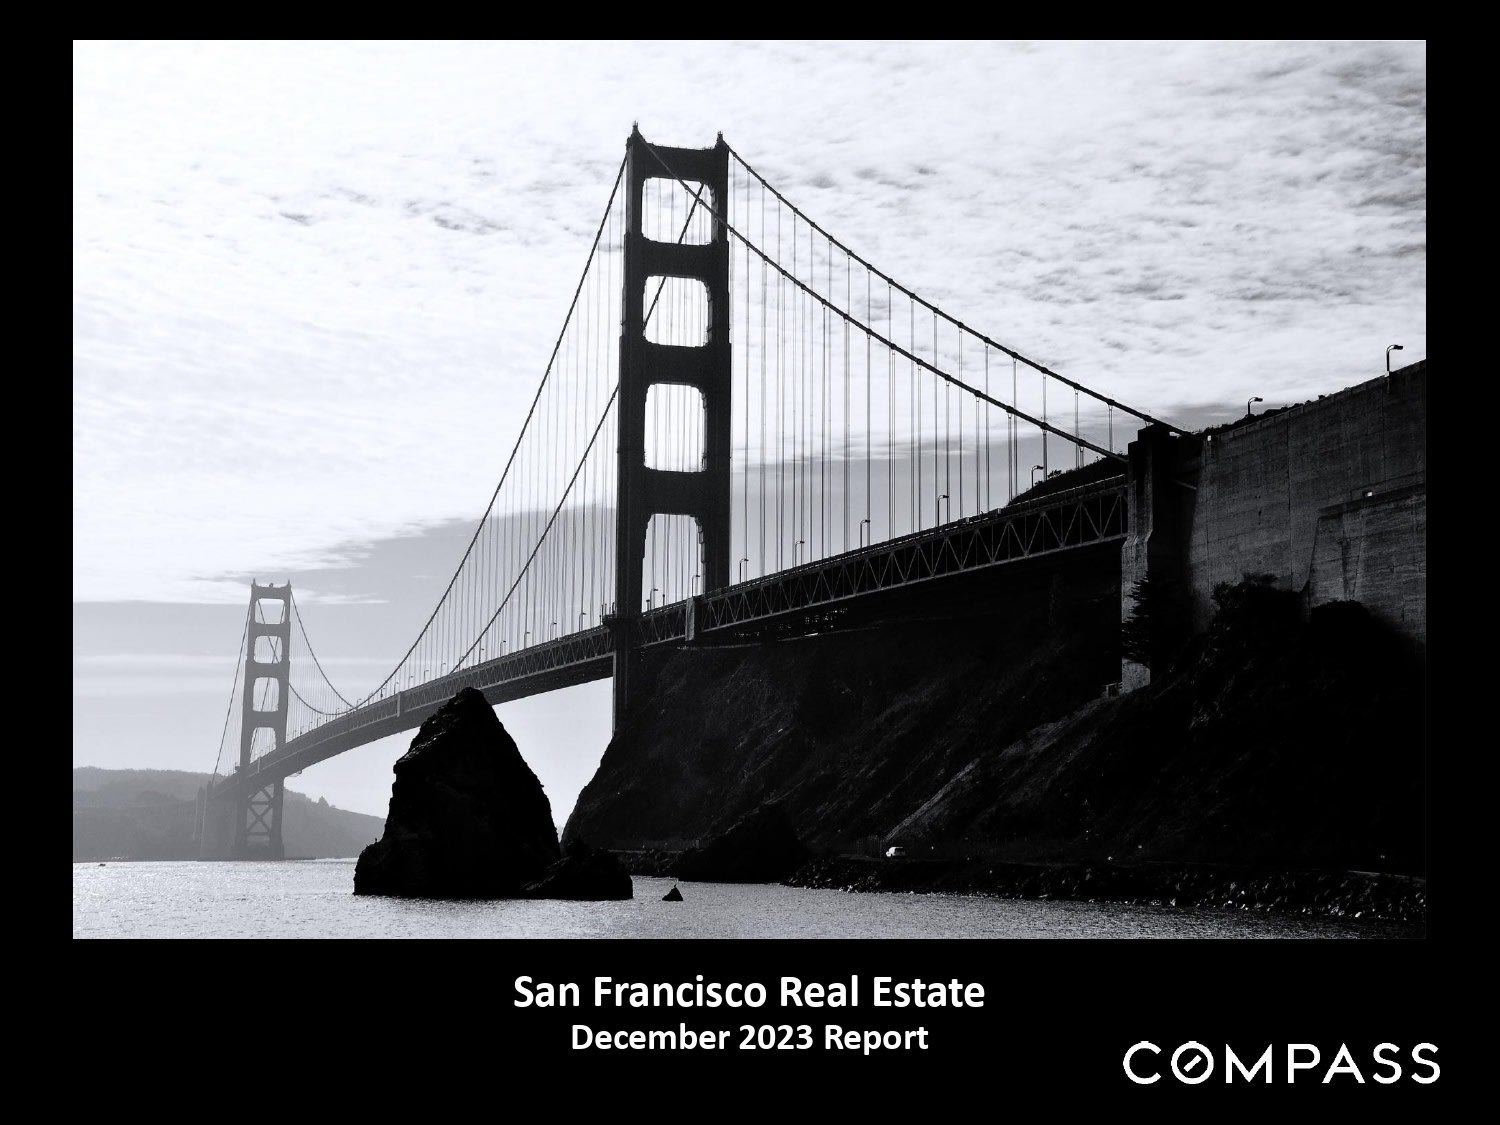
San Francisco Real Estate December 2023 Report, featuring the Golden Gate Bridge.

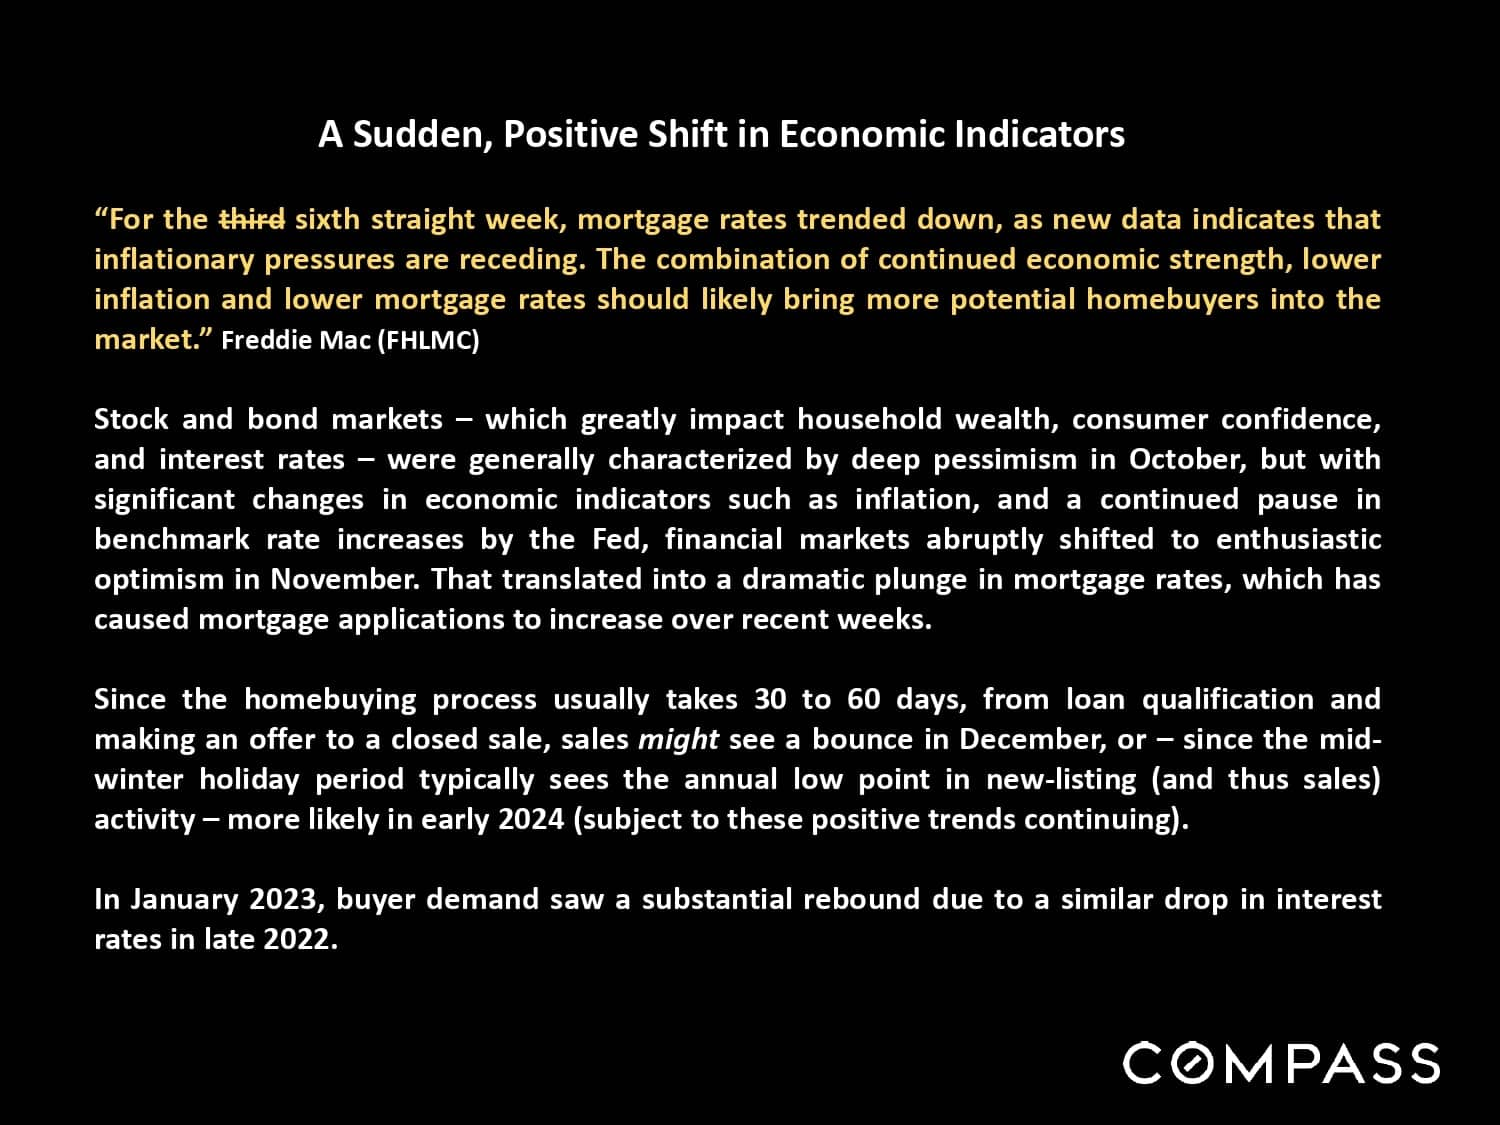
Market update on falling mortgage rates and improving economic indicators, with a Compass logo.

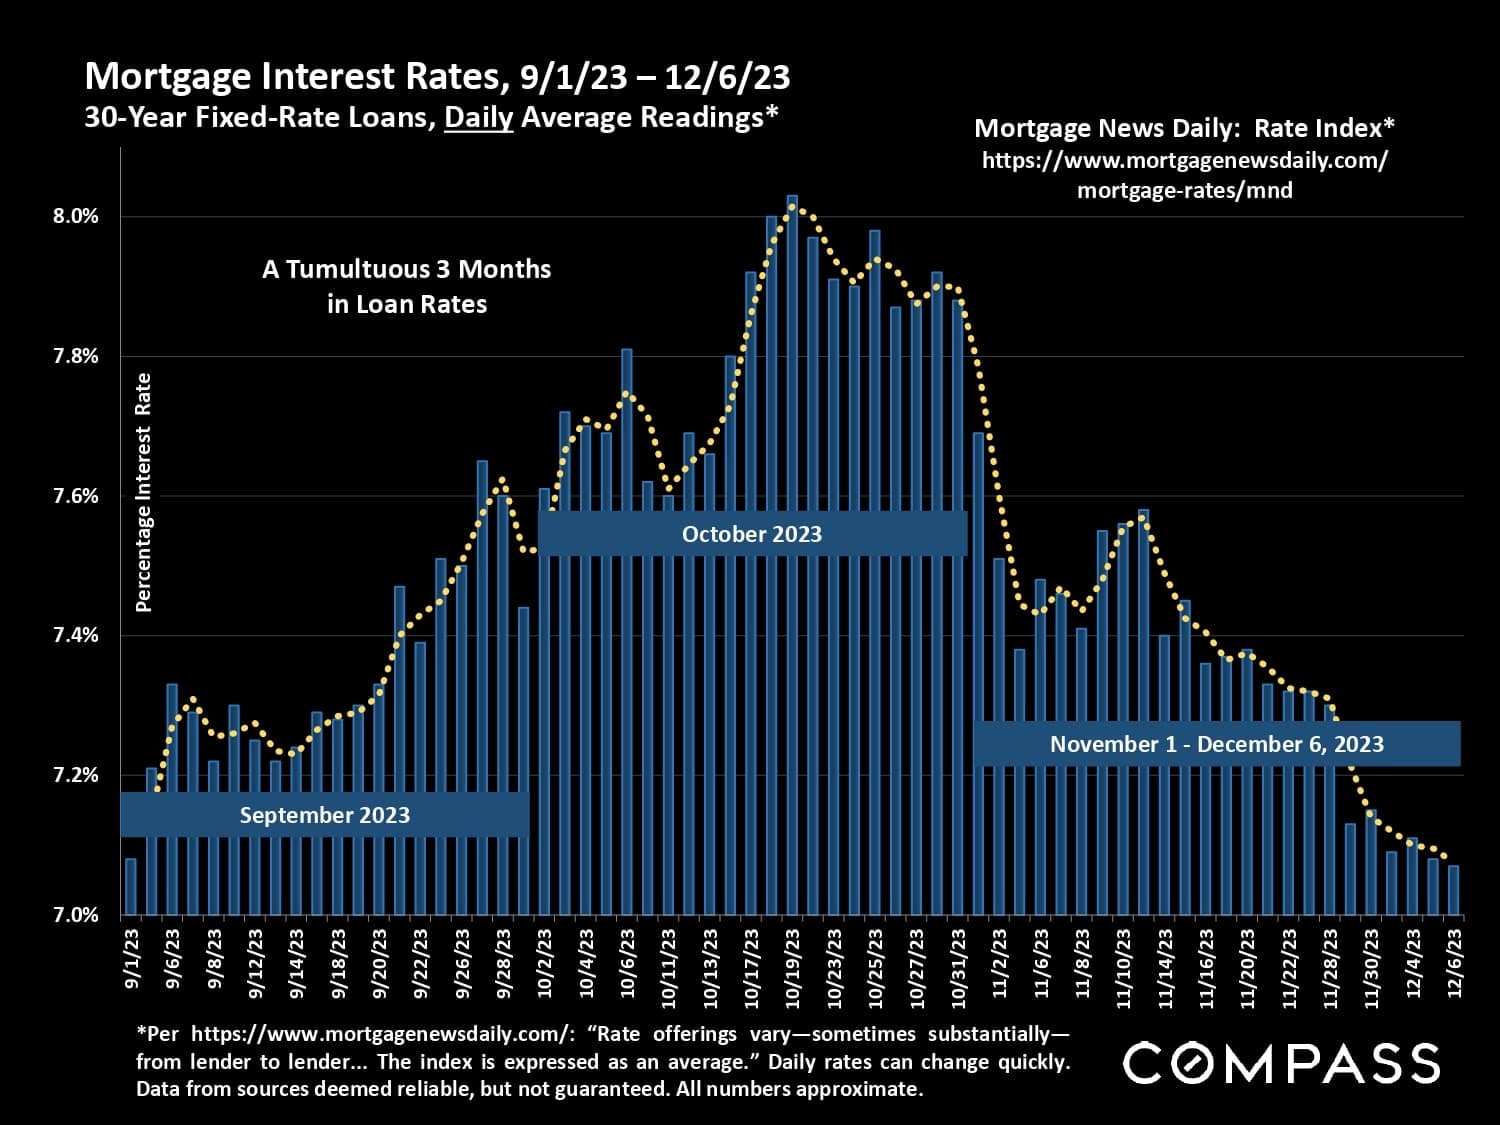
Chart of 30-year mortgage rates from September to December 2023, peaking above 8% in October before falling.

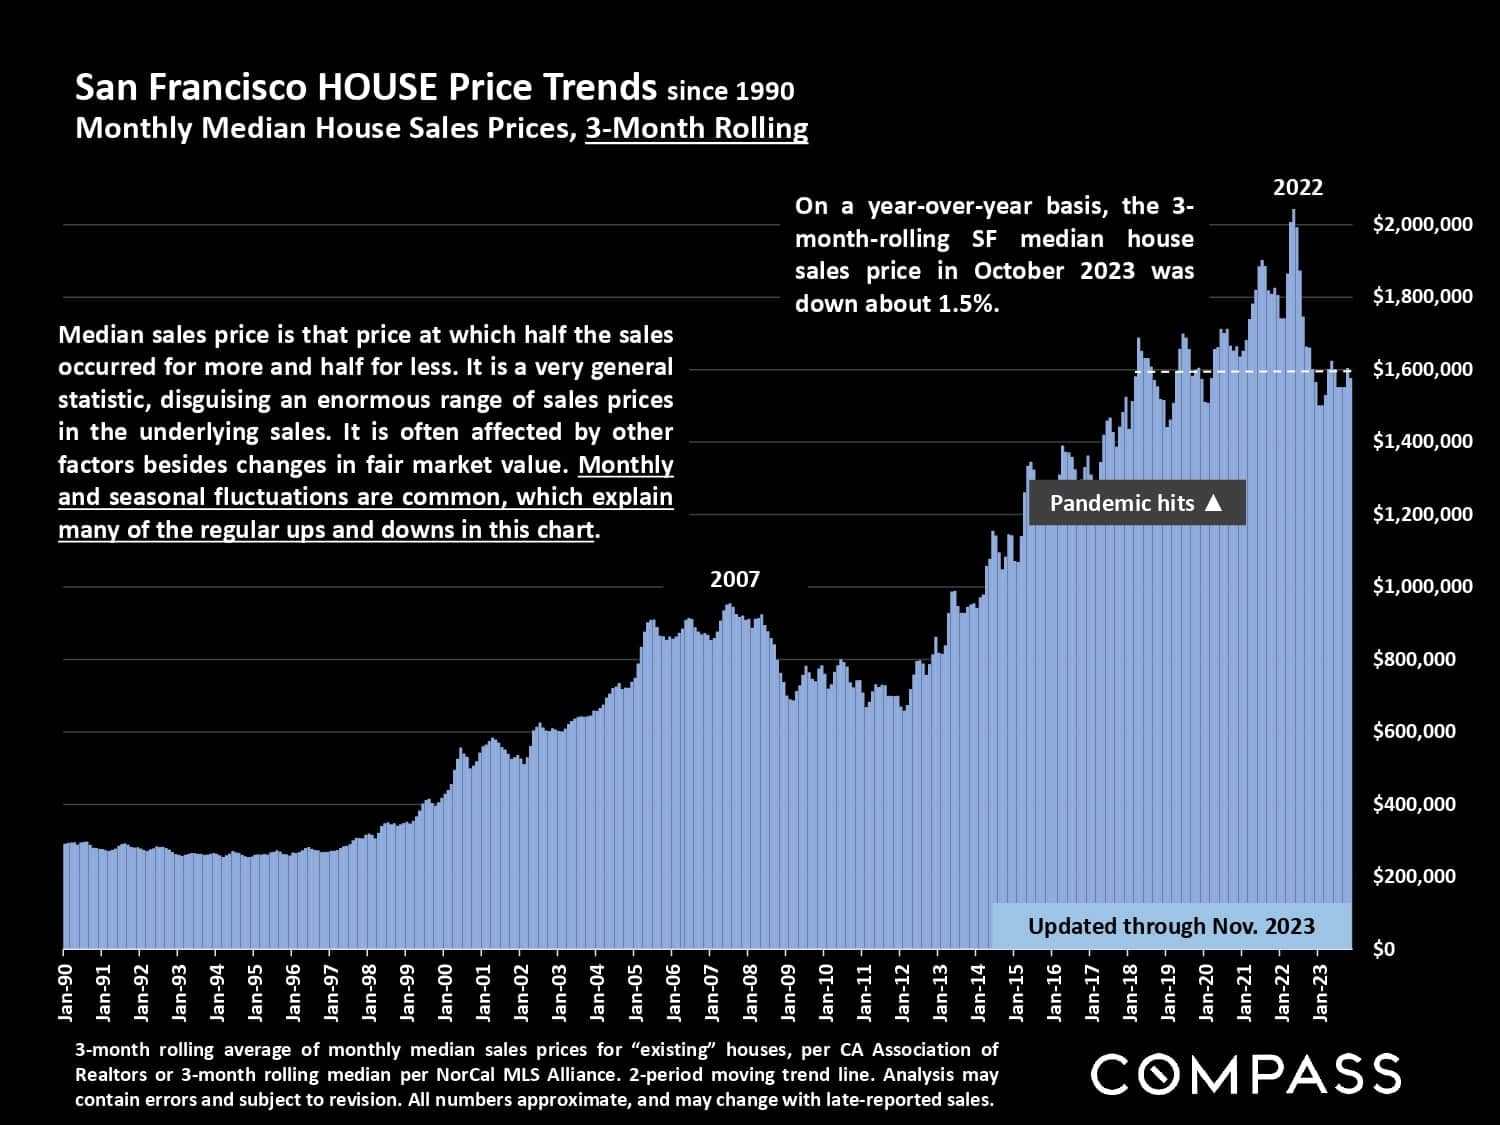
Chart of San Francisco median house prices since 1990, with a 2022 peak and prices updated through November 2023.

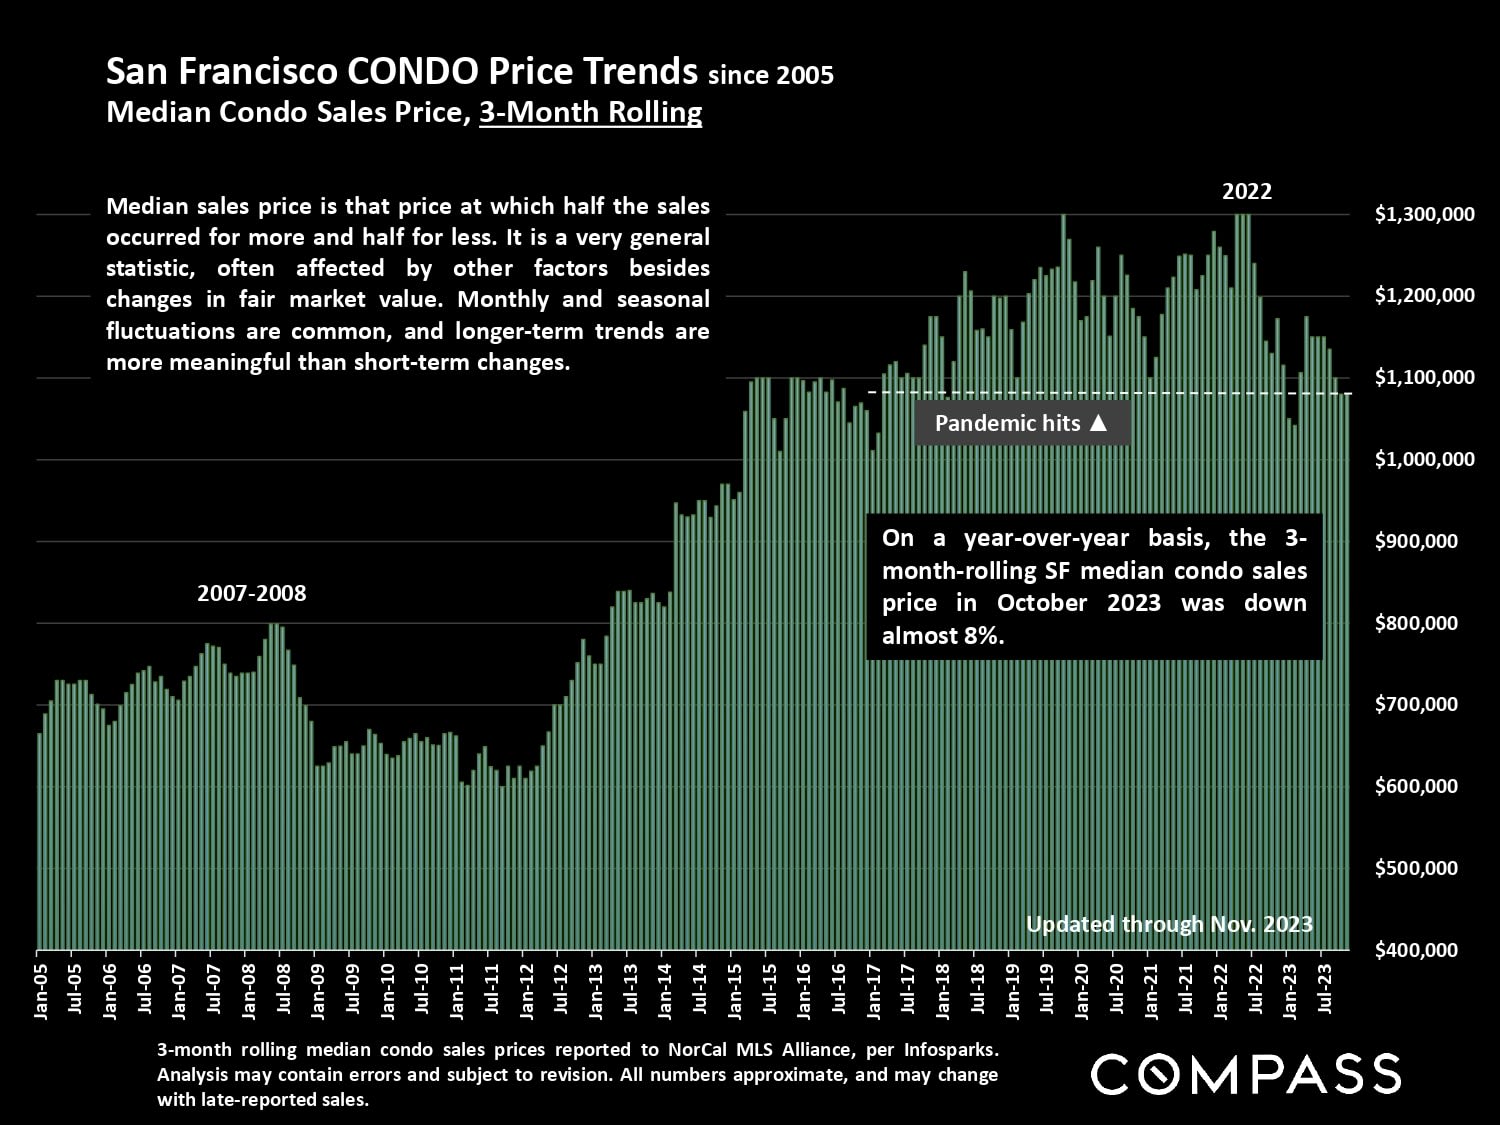
Chart of San Francisco condo prices, showing a 2022 peak near $1.3 million and an almost 8% annual decline in October 2023.

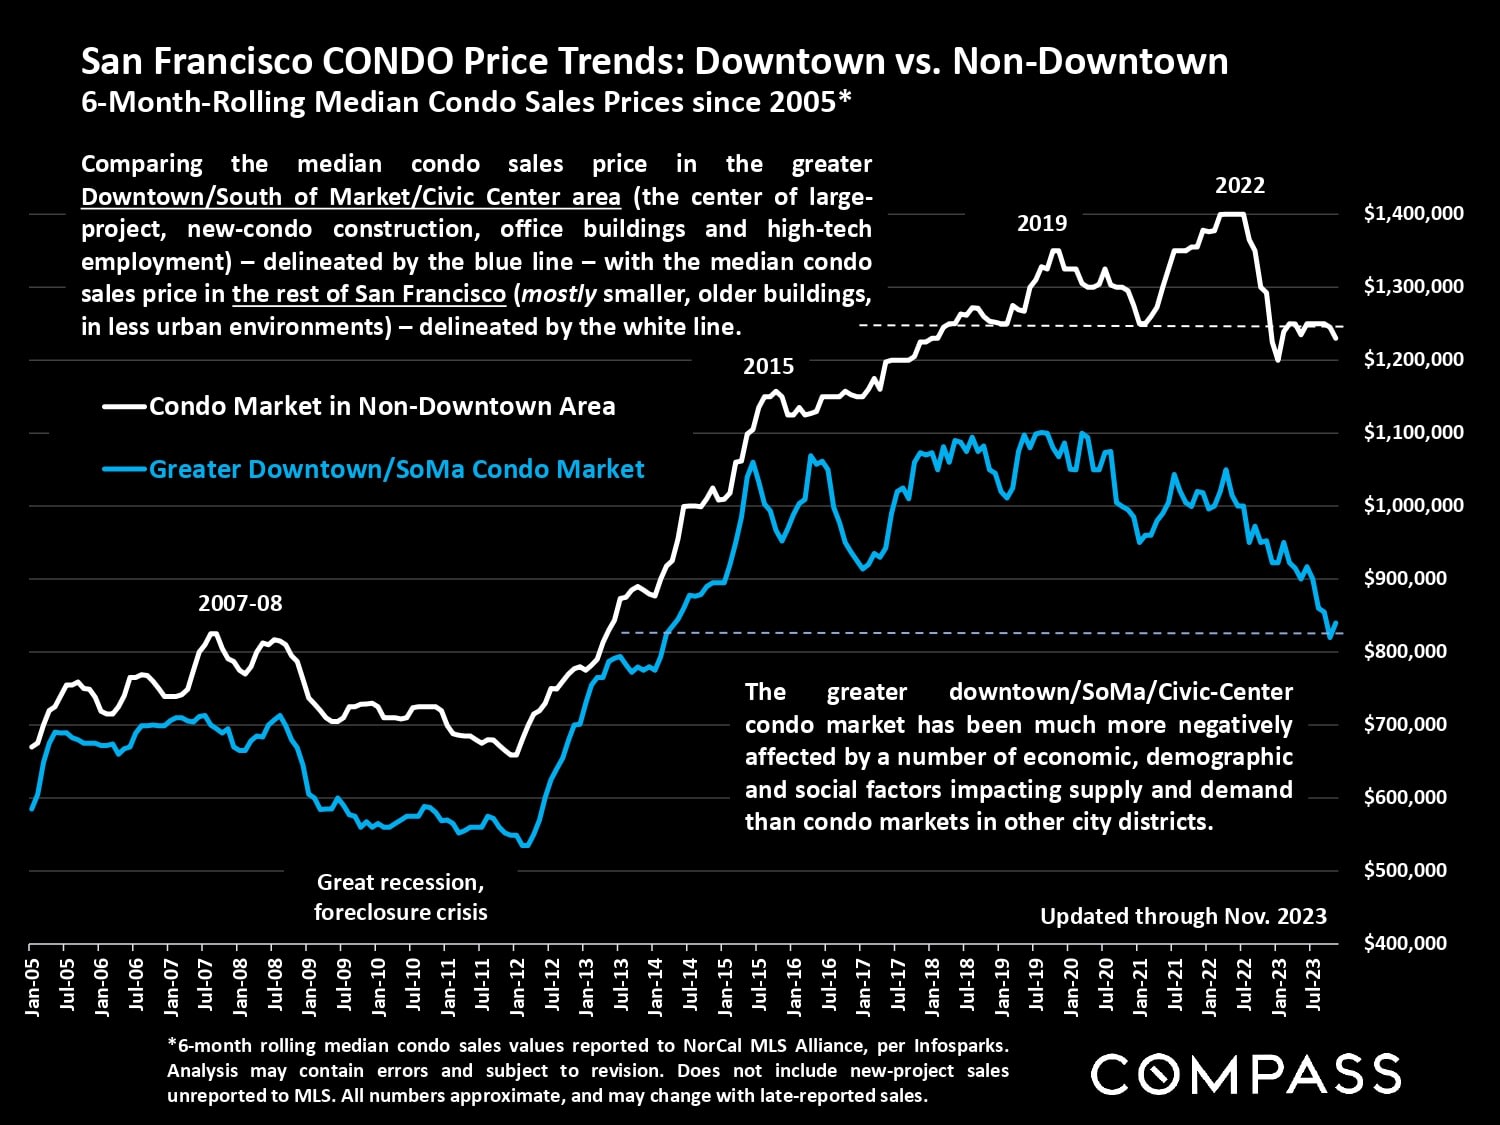
Chart comparing San Francisco Downtown/SoMa and non-Downtown median condo prices from 2005 to 2023.

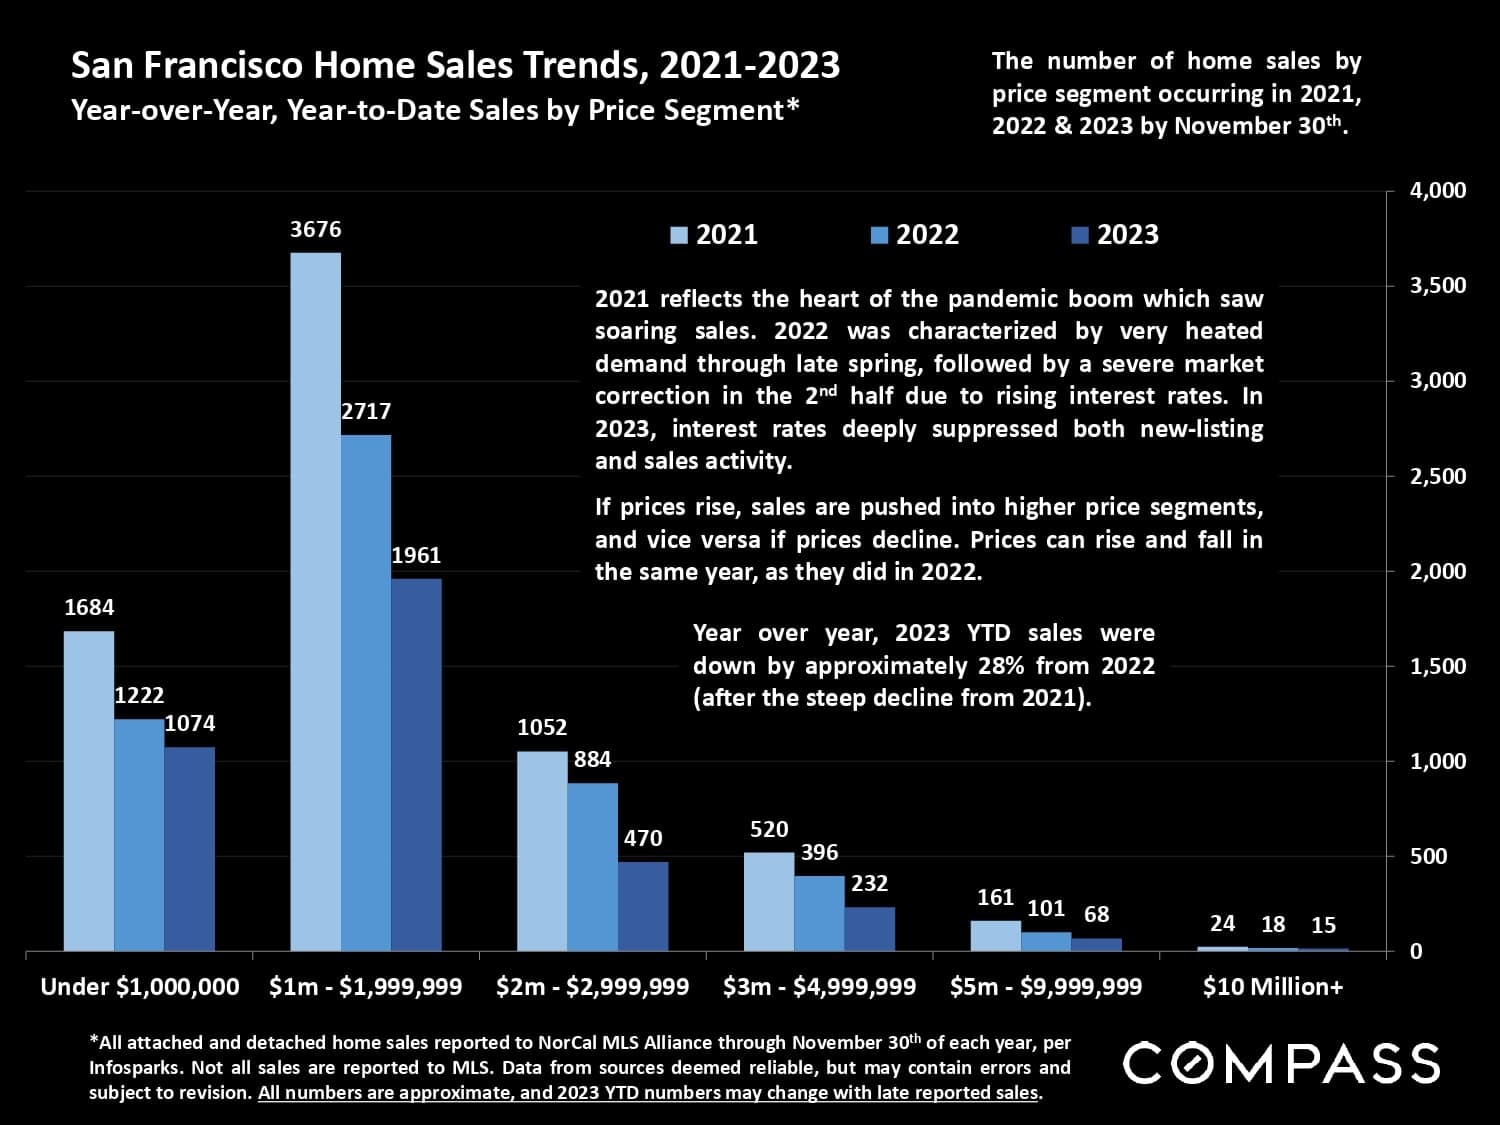
Chart of San Francisco home sales by price segment, showing year-to-date totals declining from 2021 to 2023.

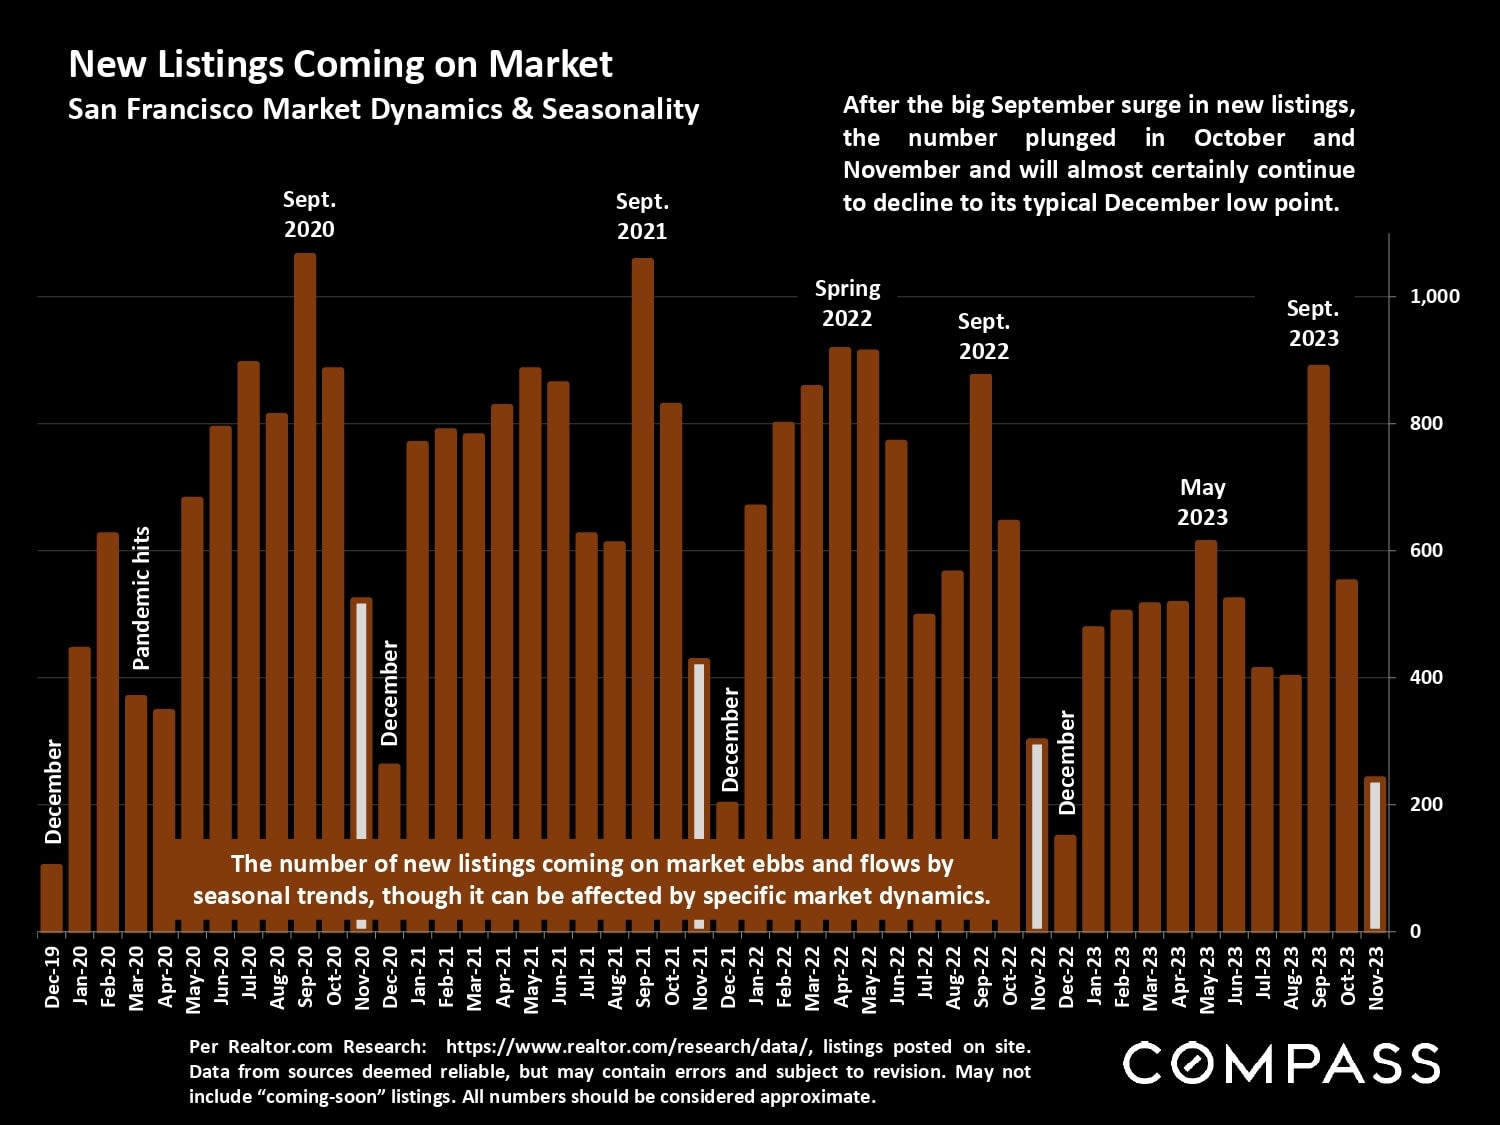
Bar chart of San Francisco new listings, showing September peaks and typically low December counts from 2019 to 2023.

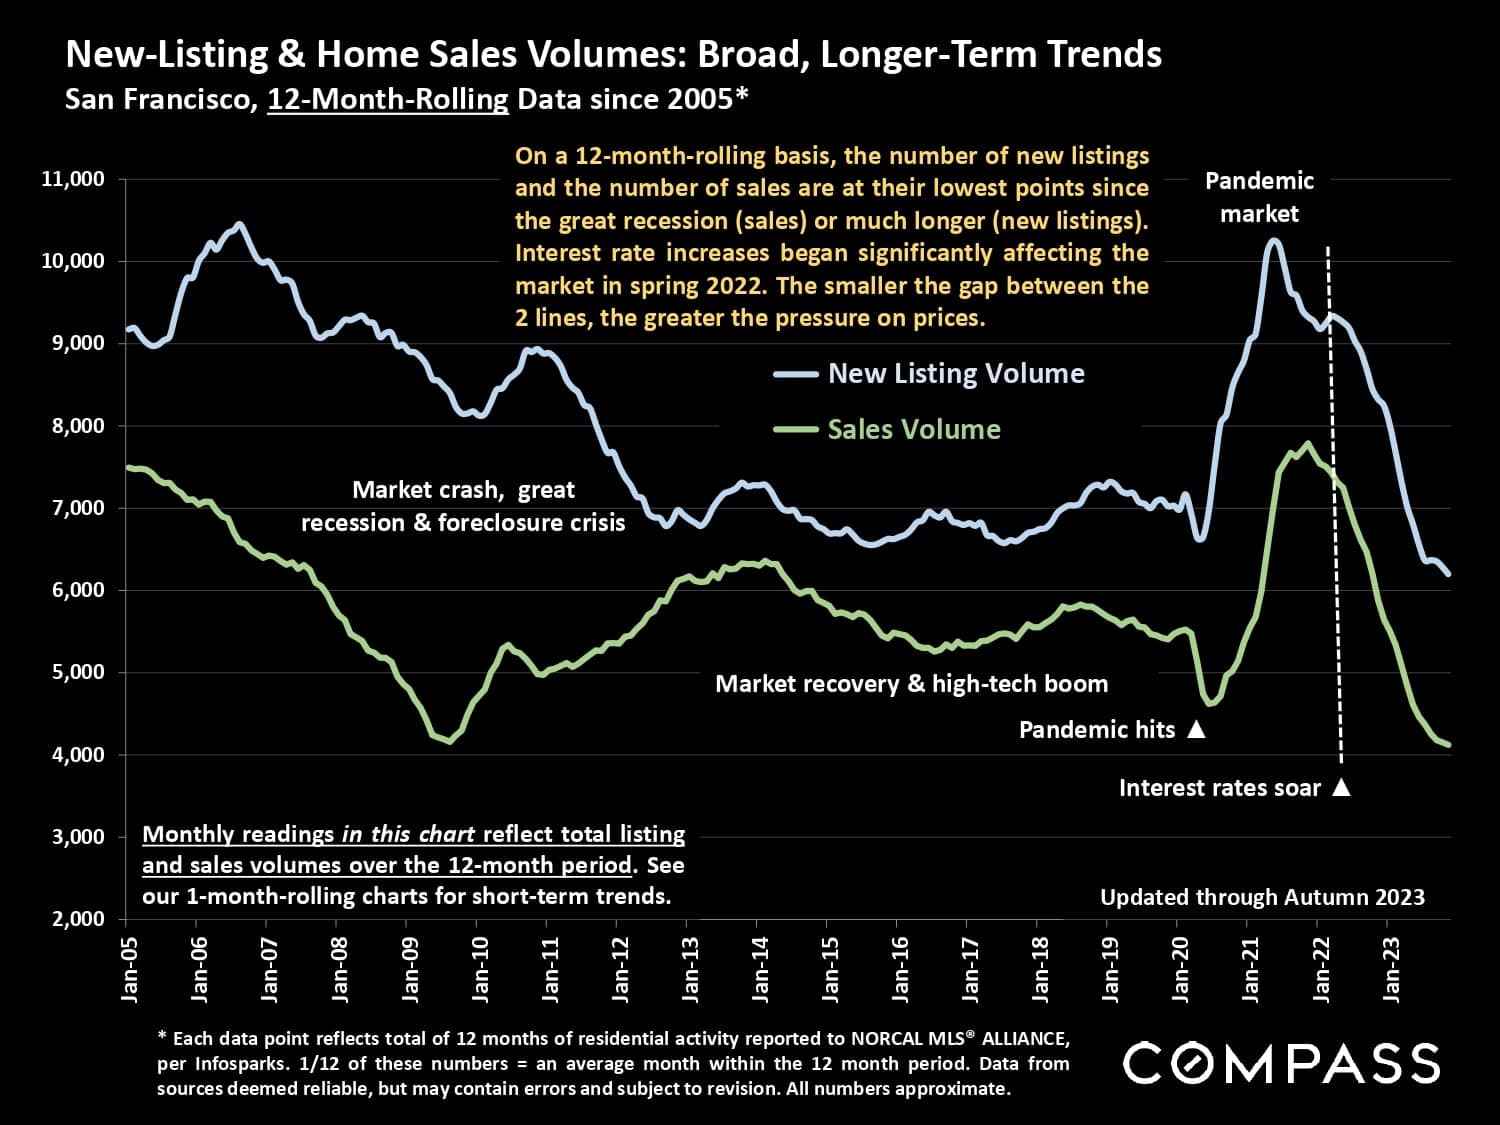
San Francisco chart comparing 12-month rolling new listings and home sales, with recession, pandemic, and interest-rate annotations.

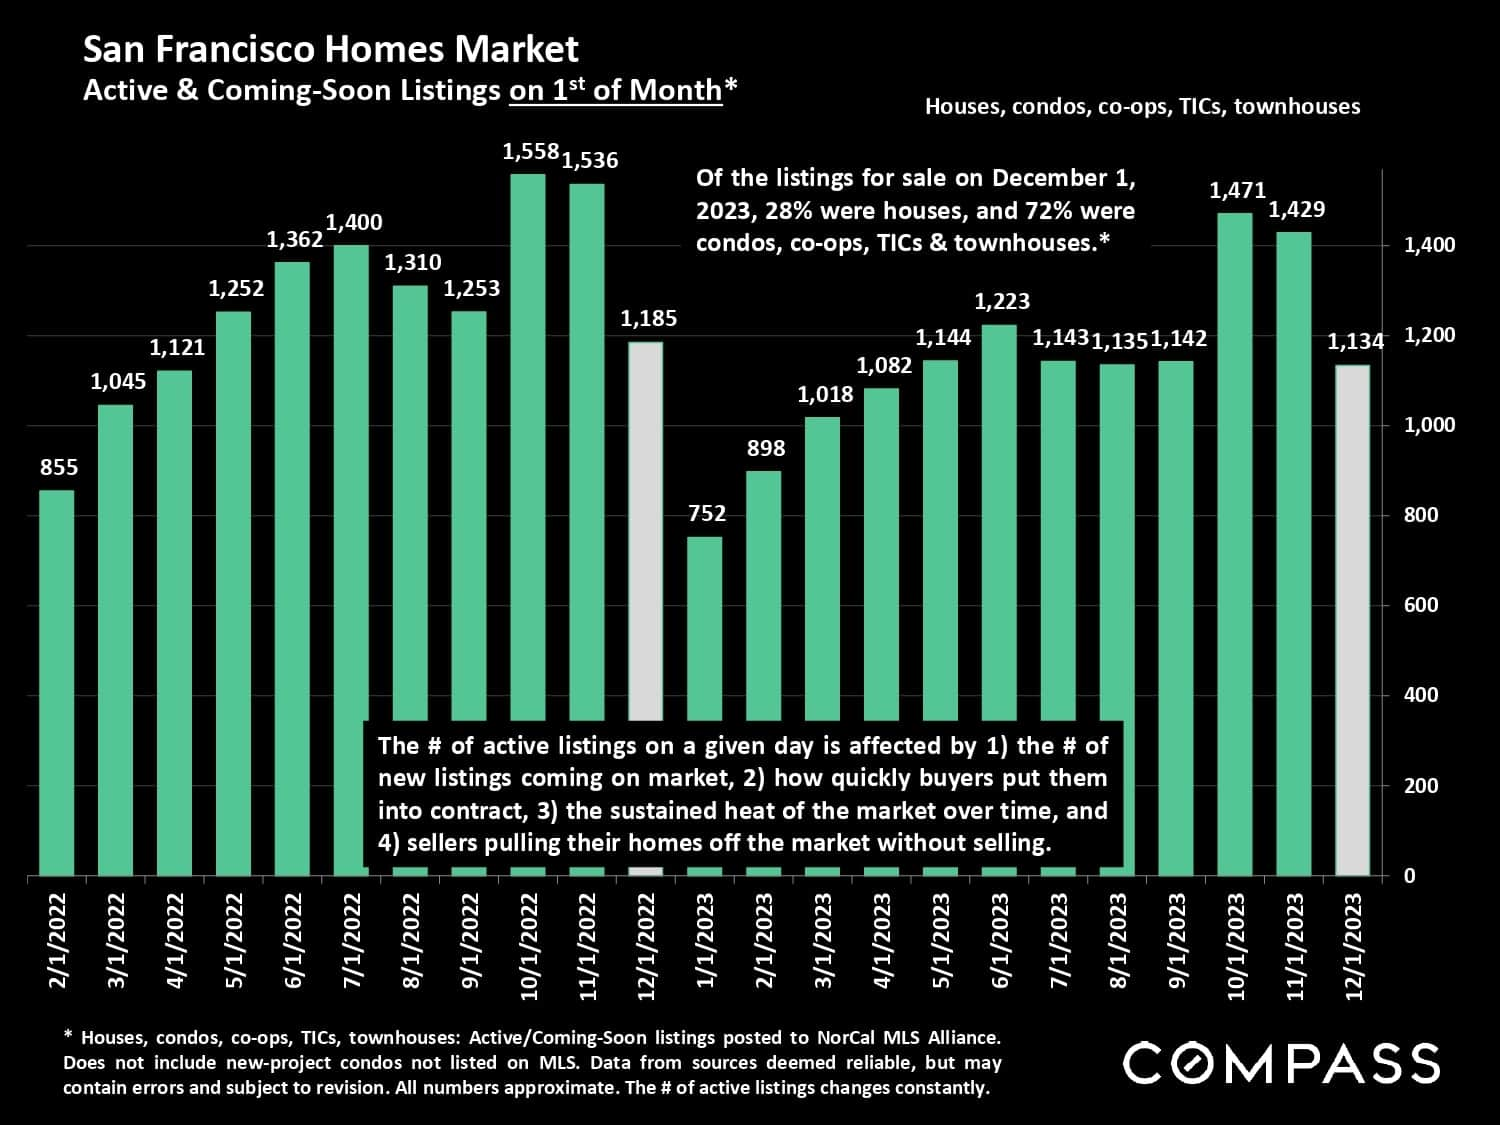
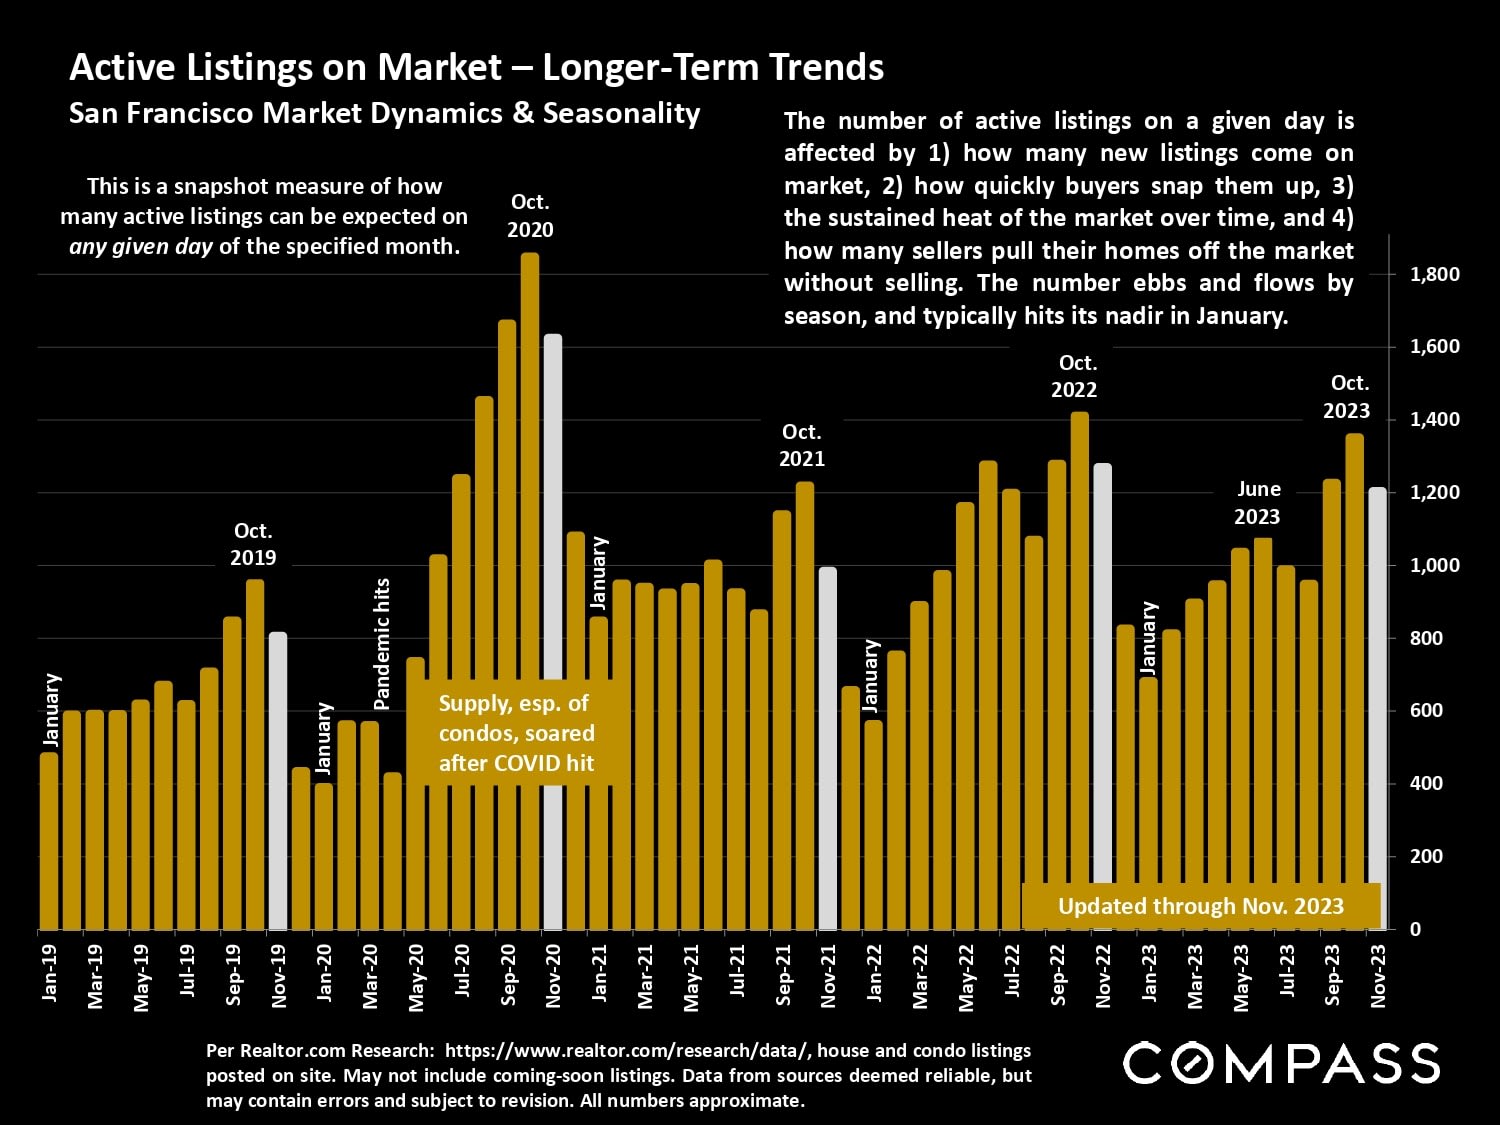
Chart of San Francisco active and coming-soon home listings, with monthly counts from February 2022 to December 2023.\Chart of San Francisco active listings from 2019 to 2023, with October snapshots and a post-COVID supply surge.

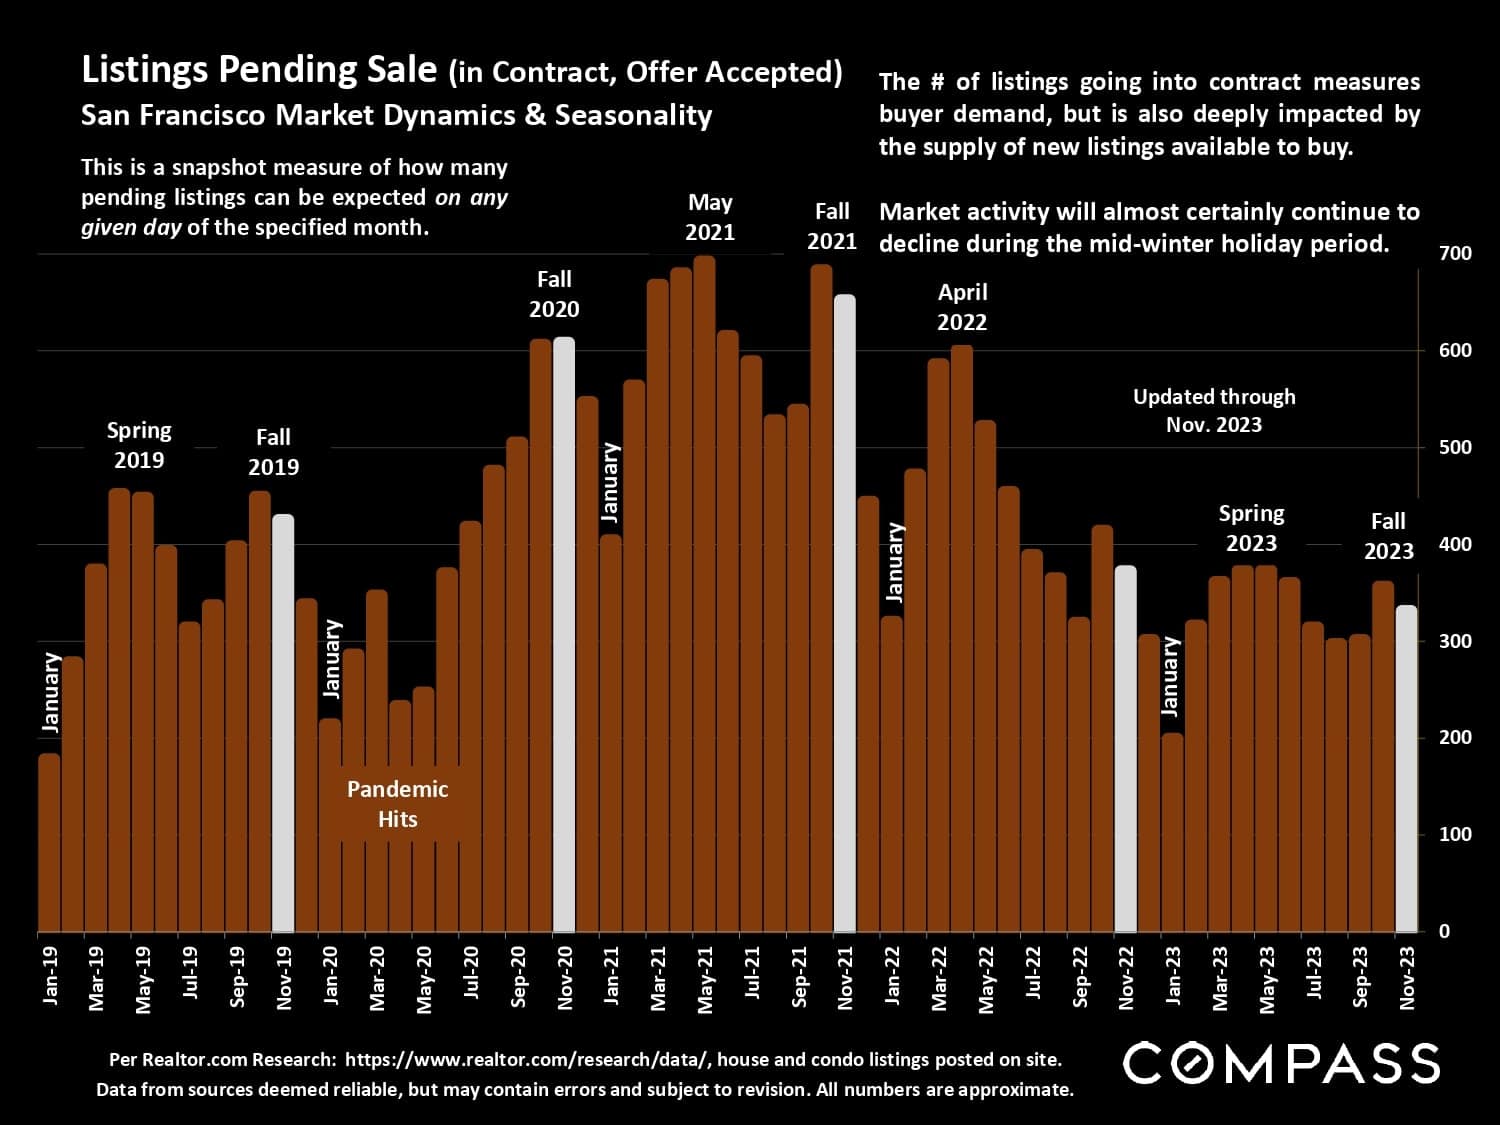
Chart of San Francisco pending listings by month, January 2019–November 2023, peaking in 2021 and easing afterward.

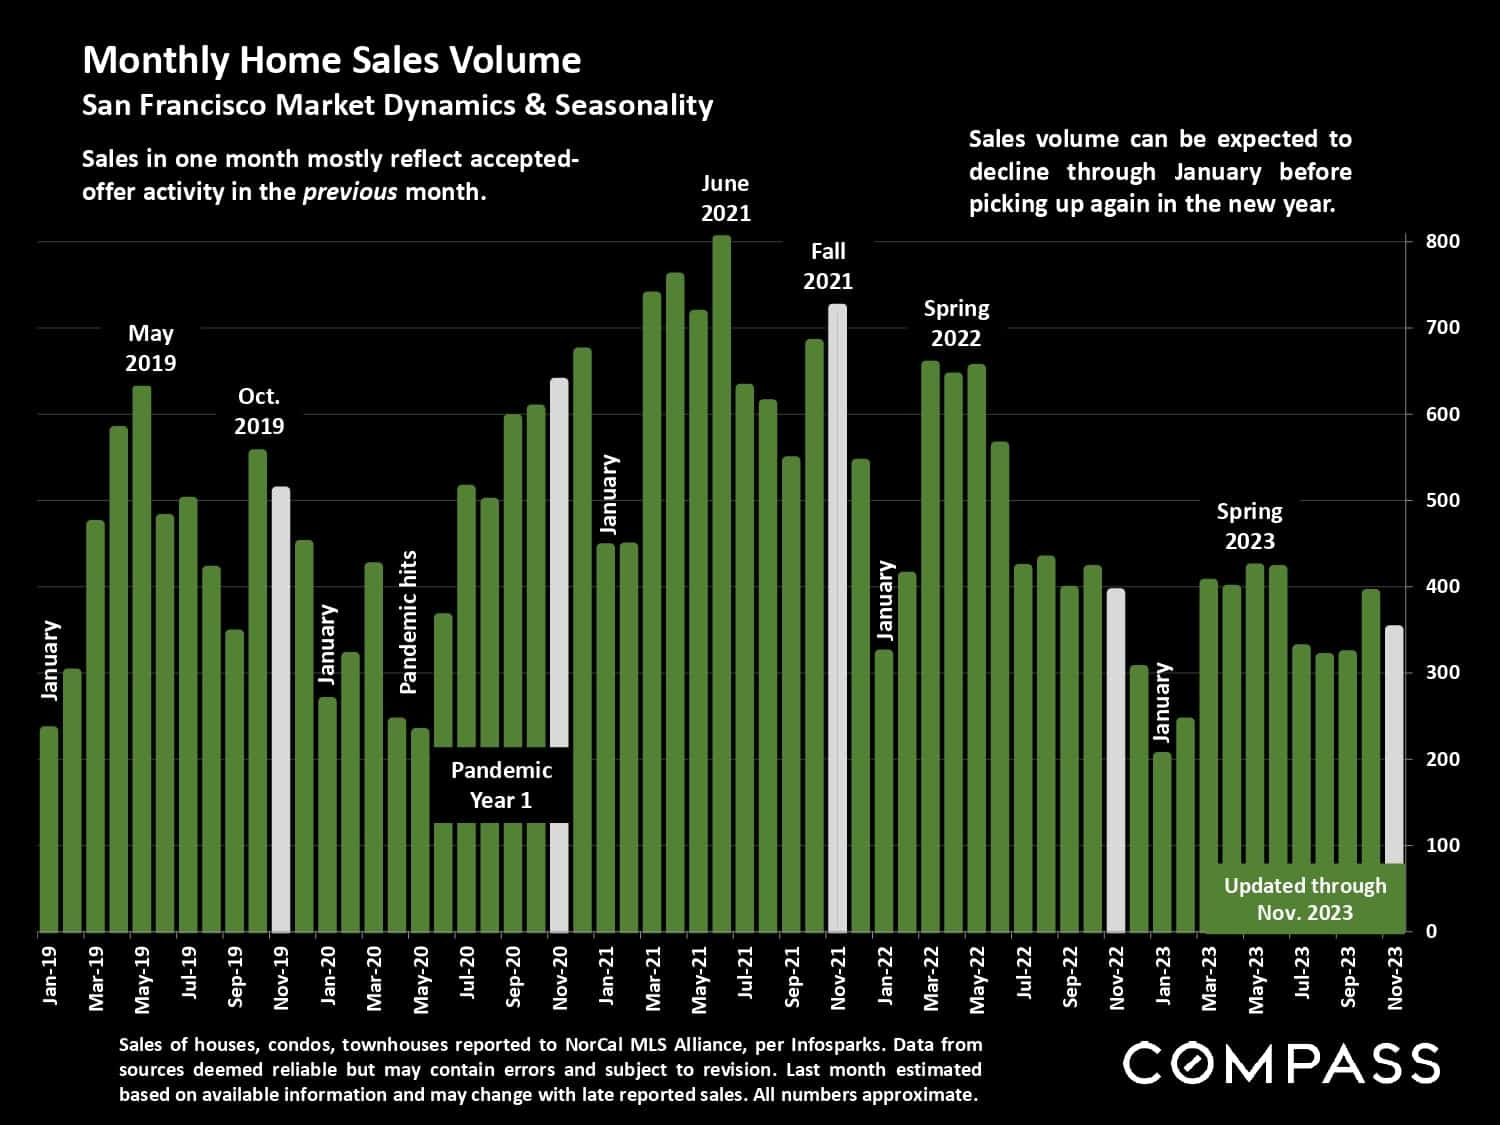
Chart of San Francisco monthly home sales, January 2019–November 2023, with seasonal and pandemic annotations.

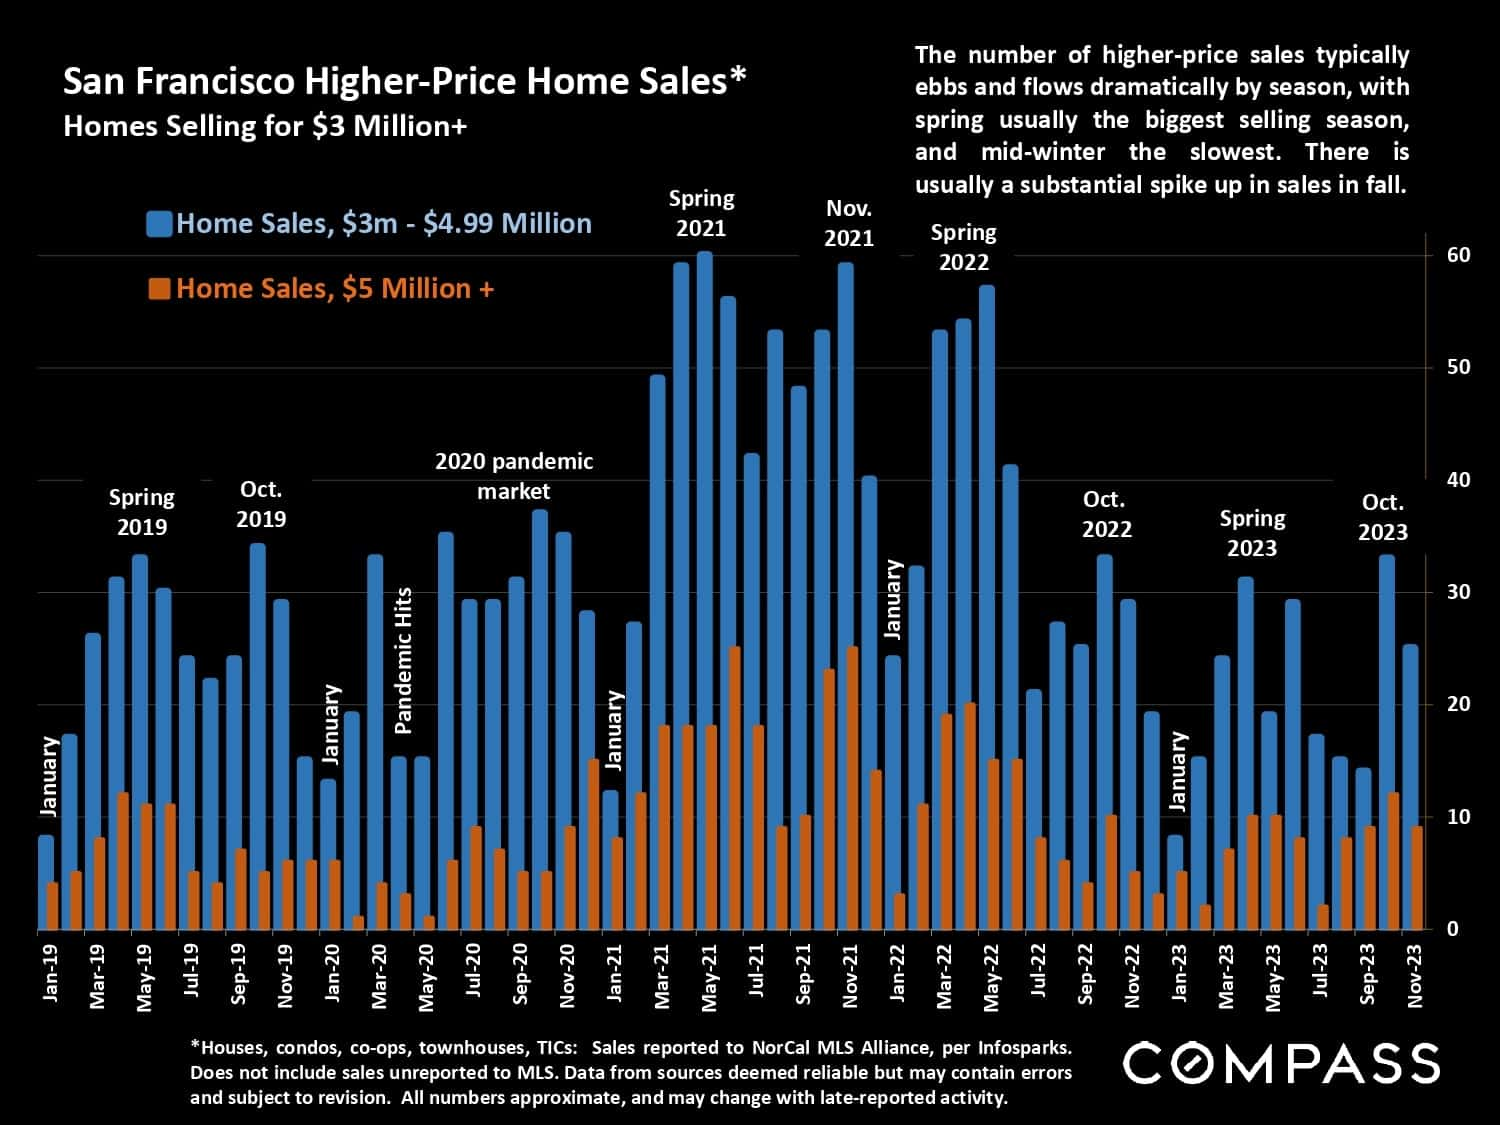
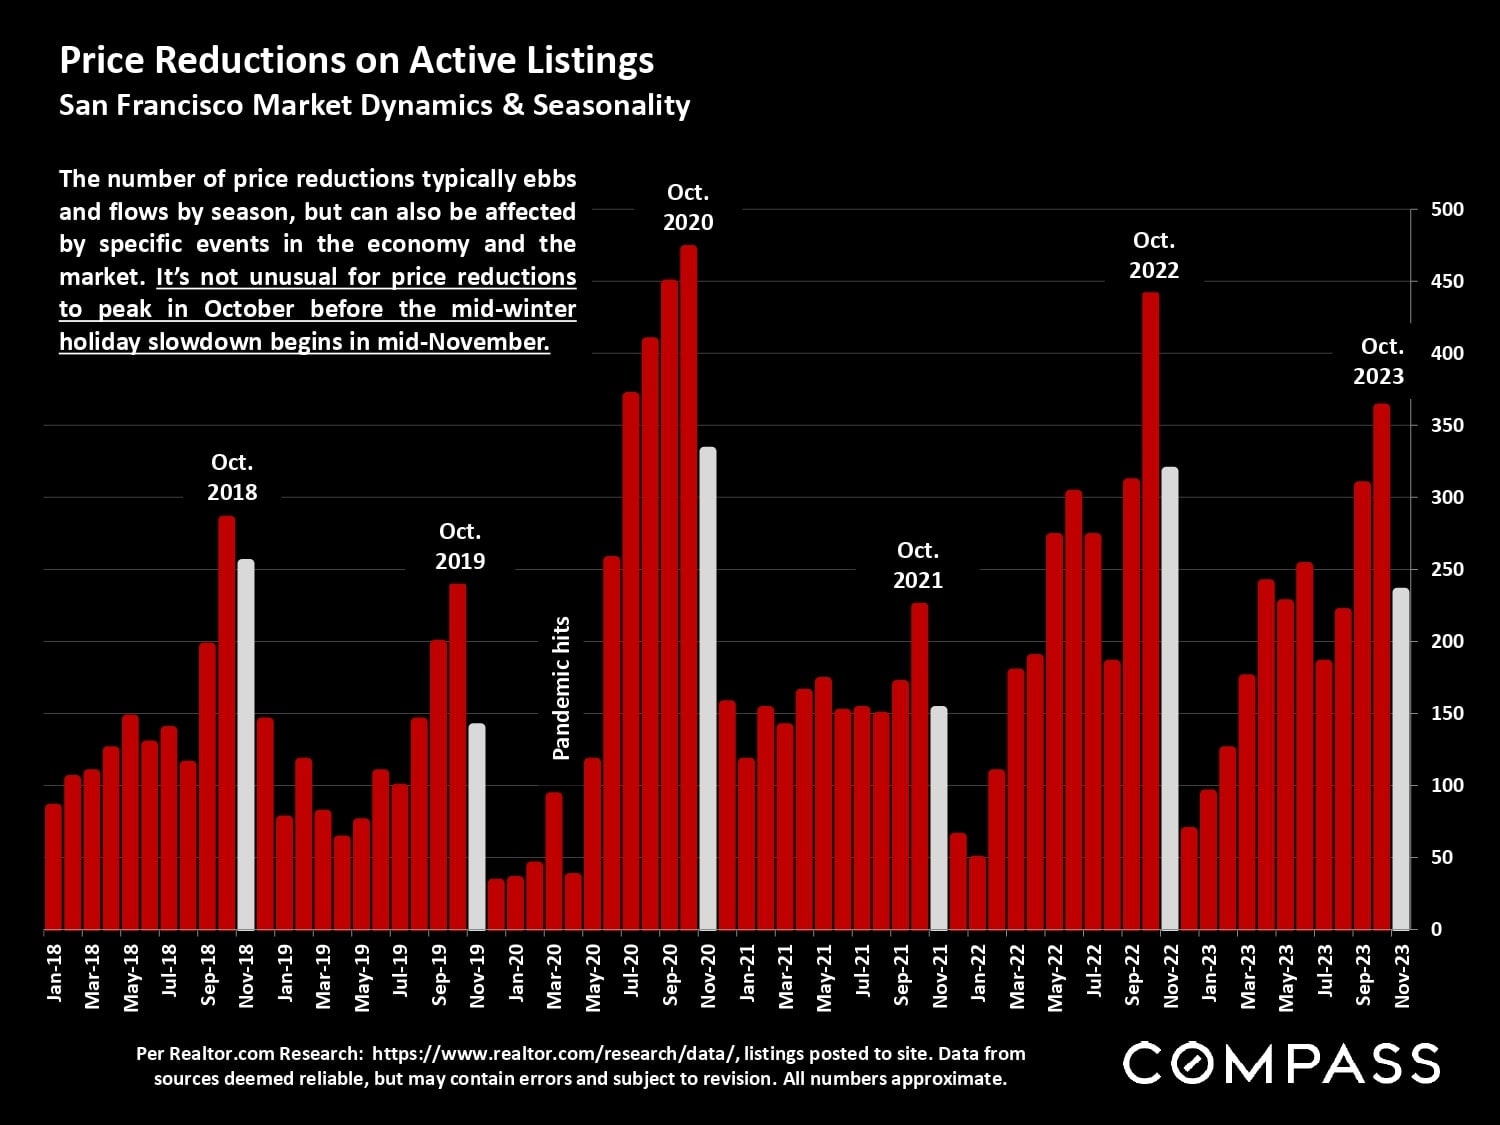
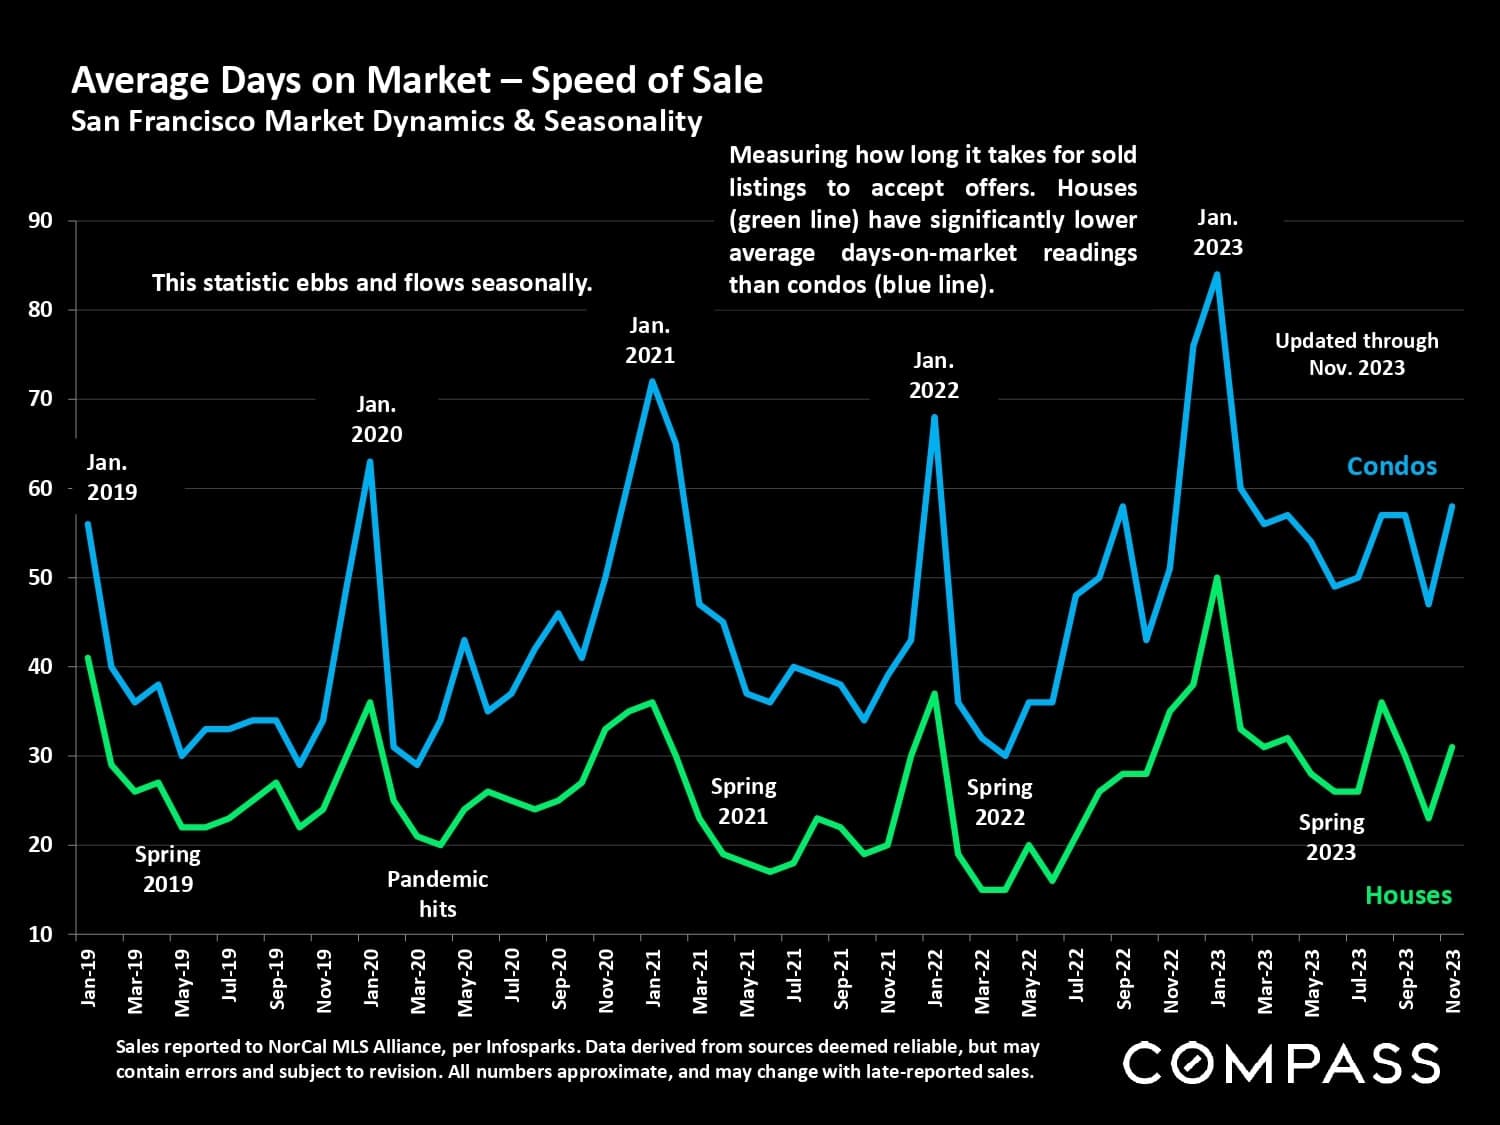
Bar chart of San Francisco home sales over $3 million, with monthly counts from 2019 to 2023.\Chart of San Francisco listing price reductions, with monthly bars from 2018 to 2023 and October peaks highlighted.\Chart comparing average days on market for San Francisco houses and condos from 2019 through November 2023.

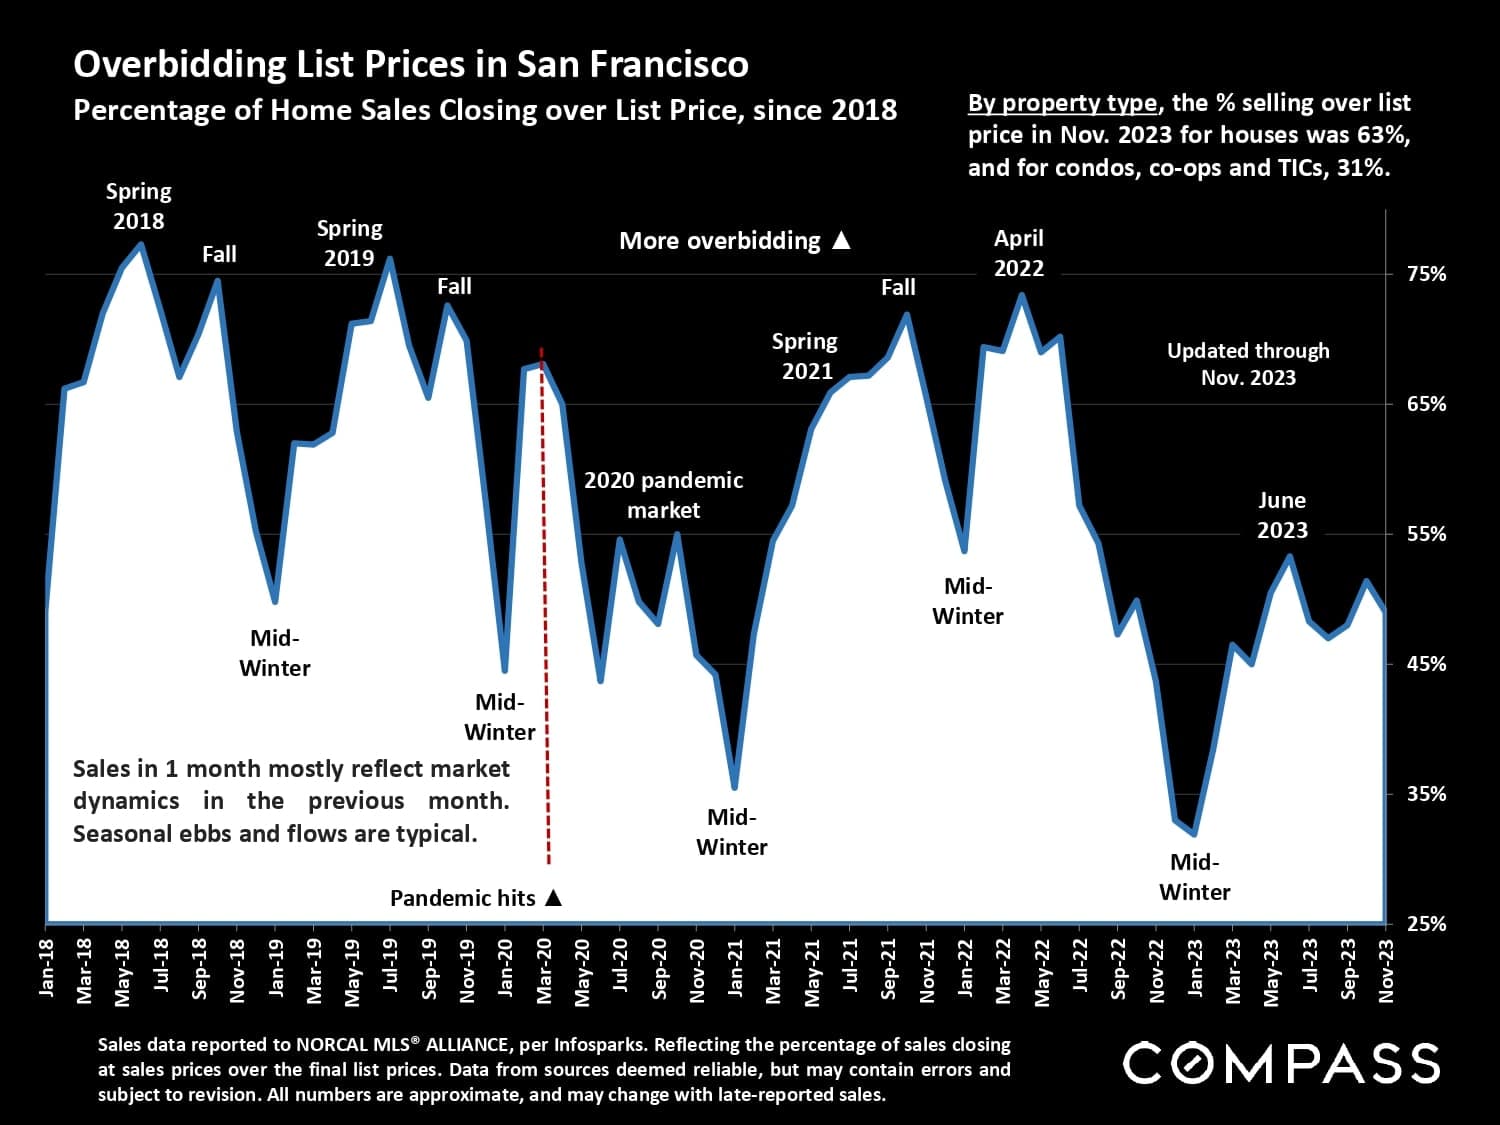
Chart of San Francisco home sales over list price, showing monthly rates from 2018 through November 2023.

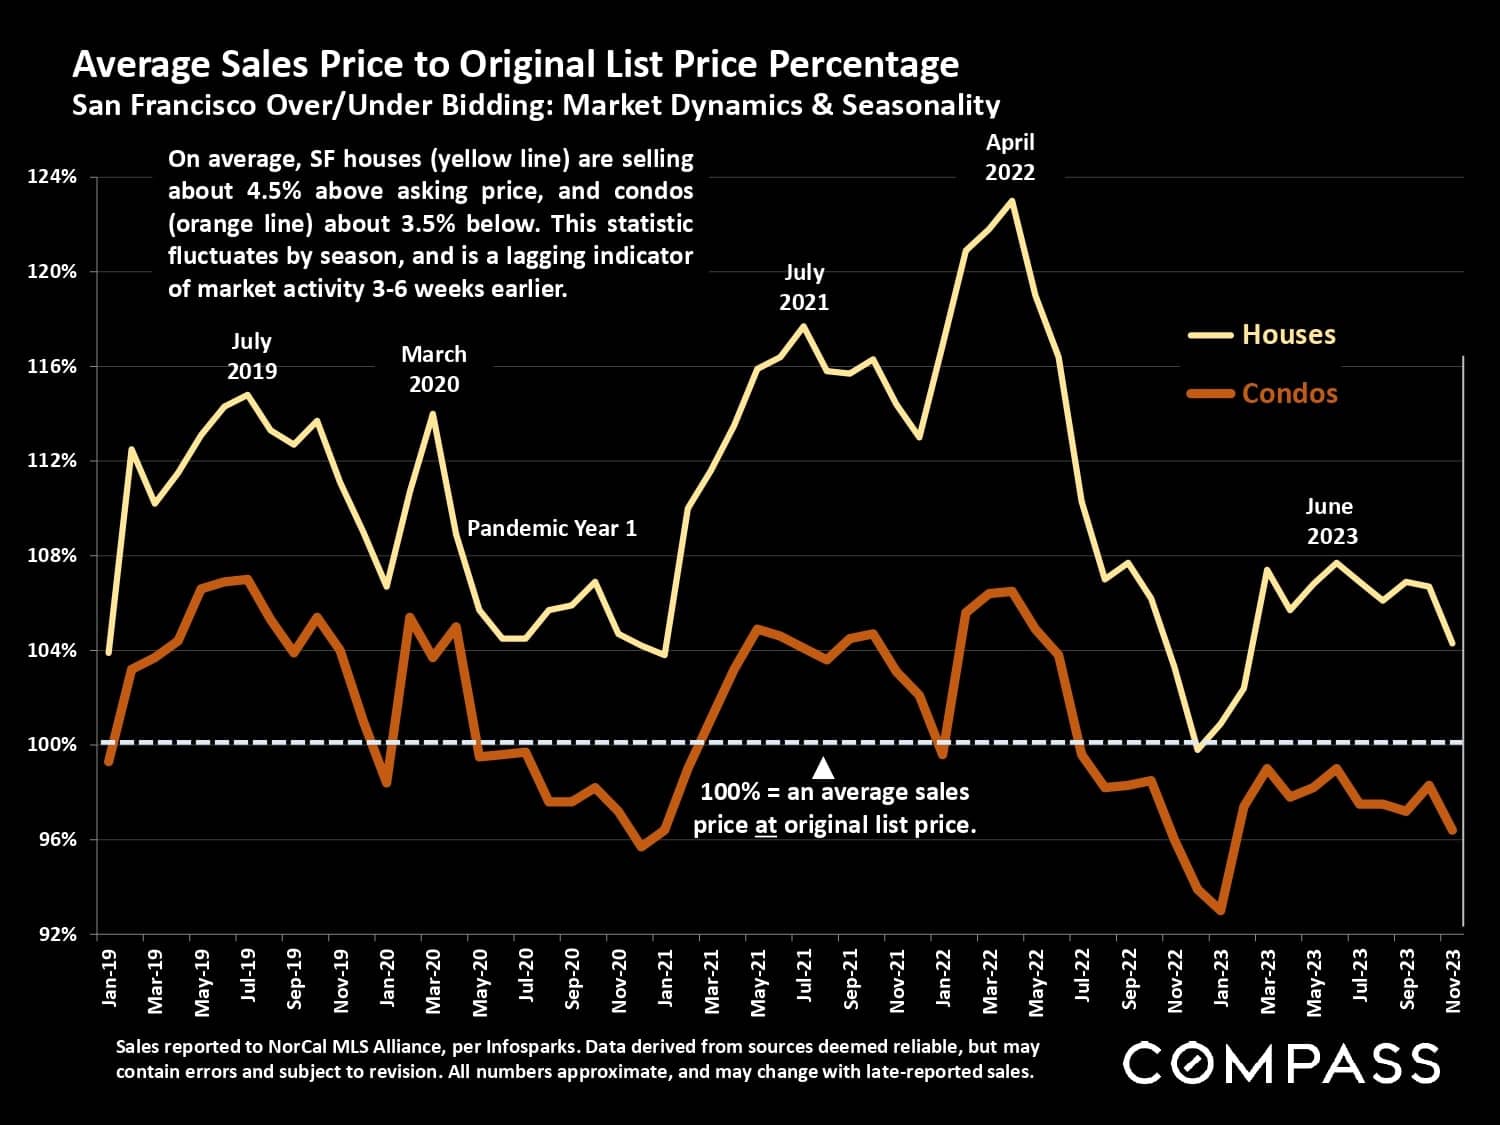
Chart comparing San Francisco house and condo sale prices with original list prices from 2019 to 2023.

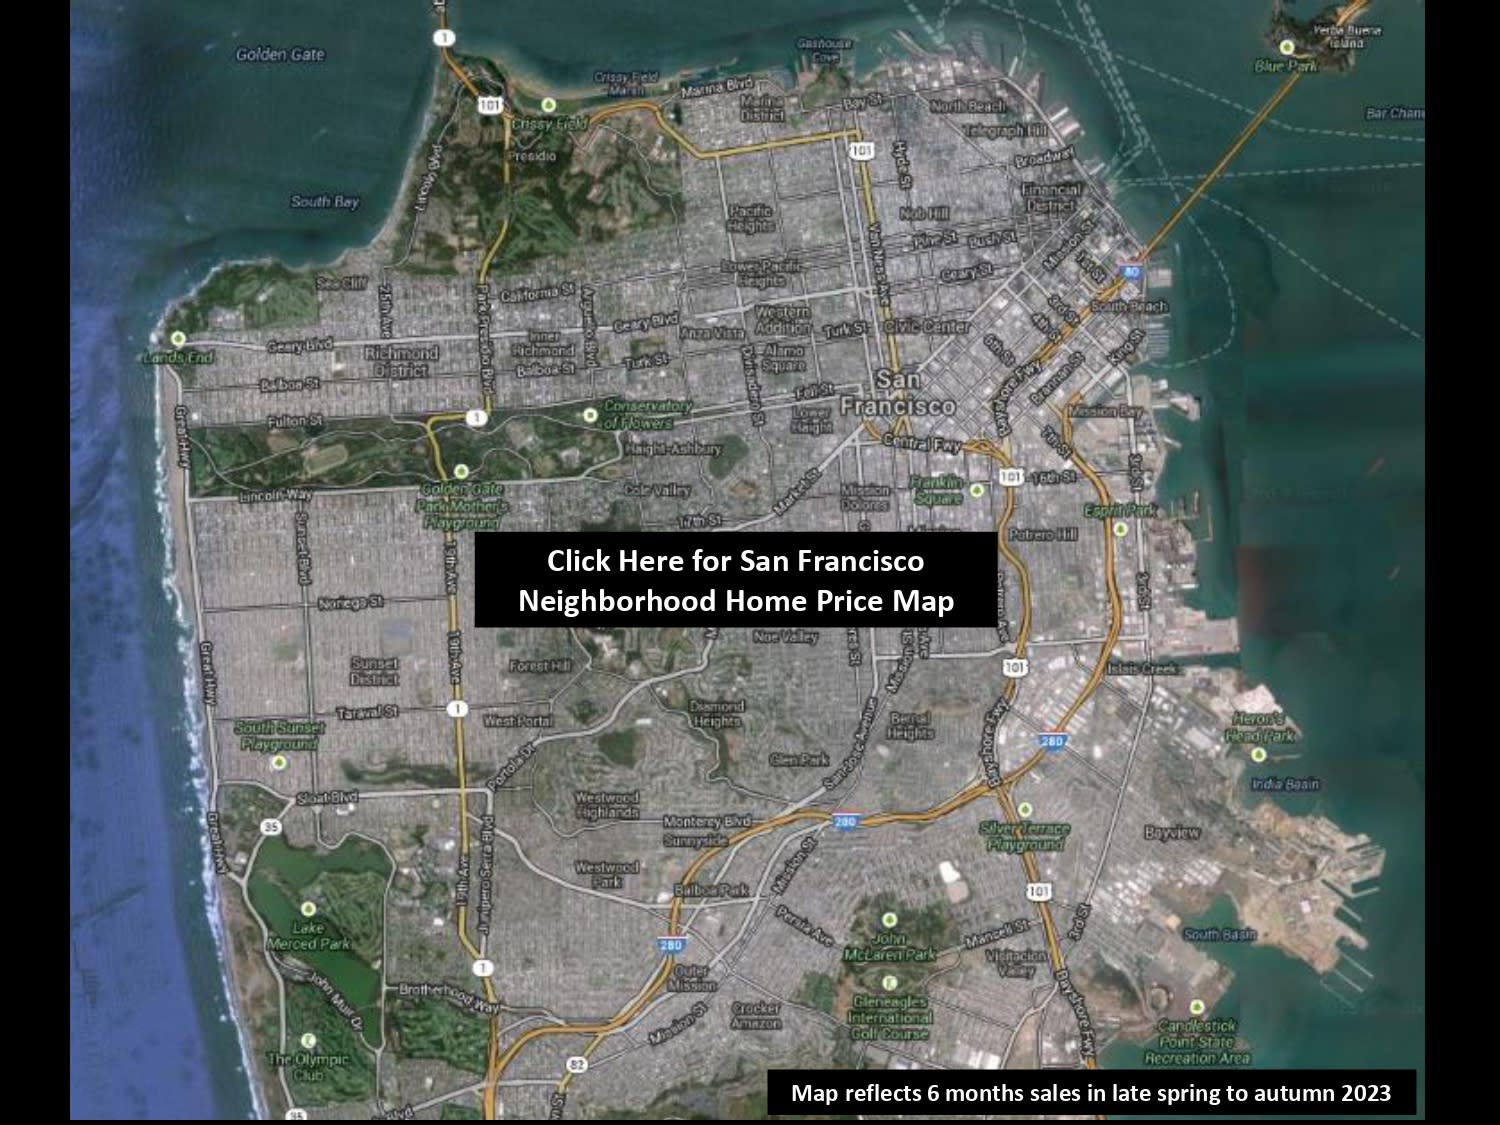
Map of San Francisco neighborhoods with a home price map link and a note about 2023 sales.

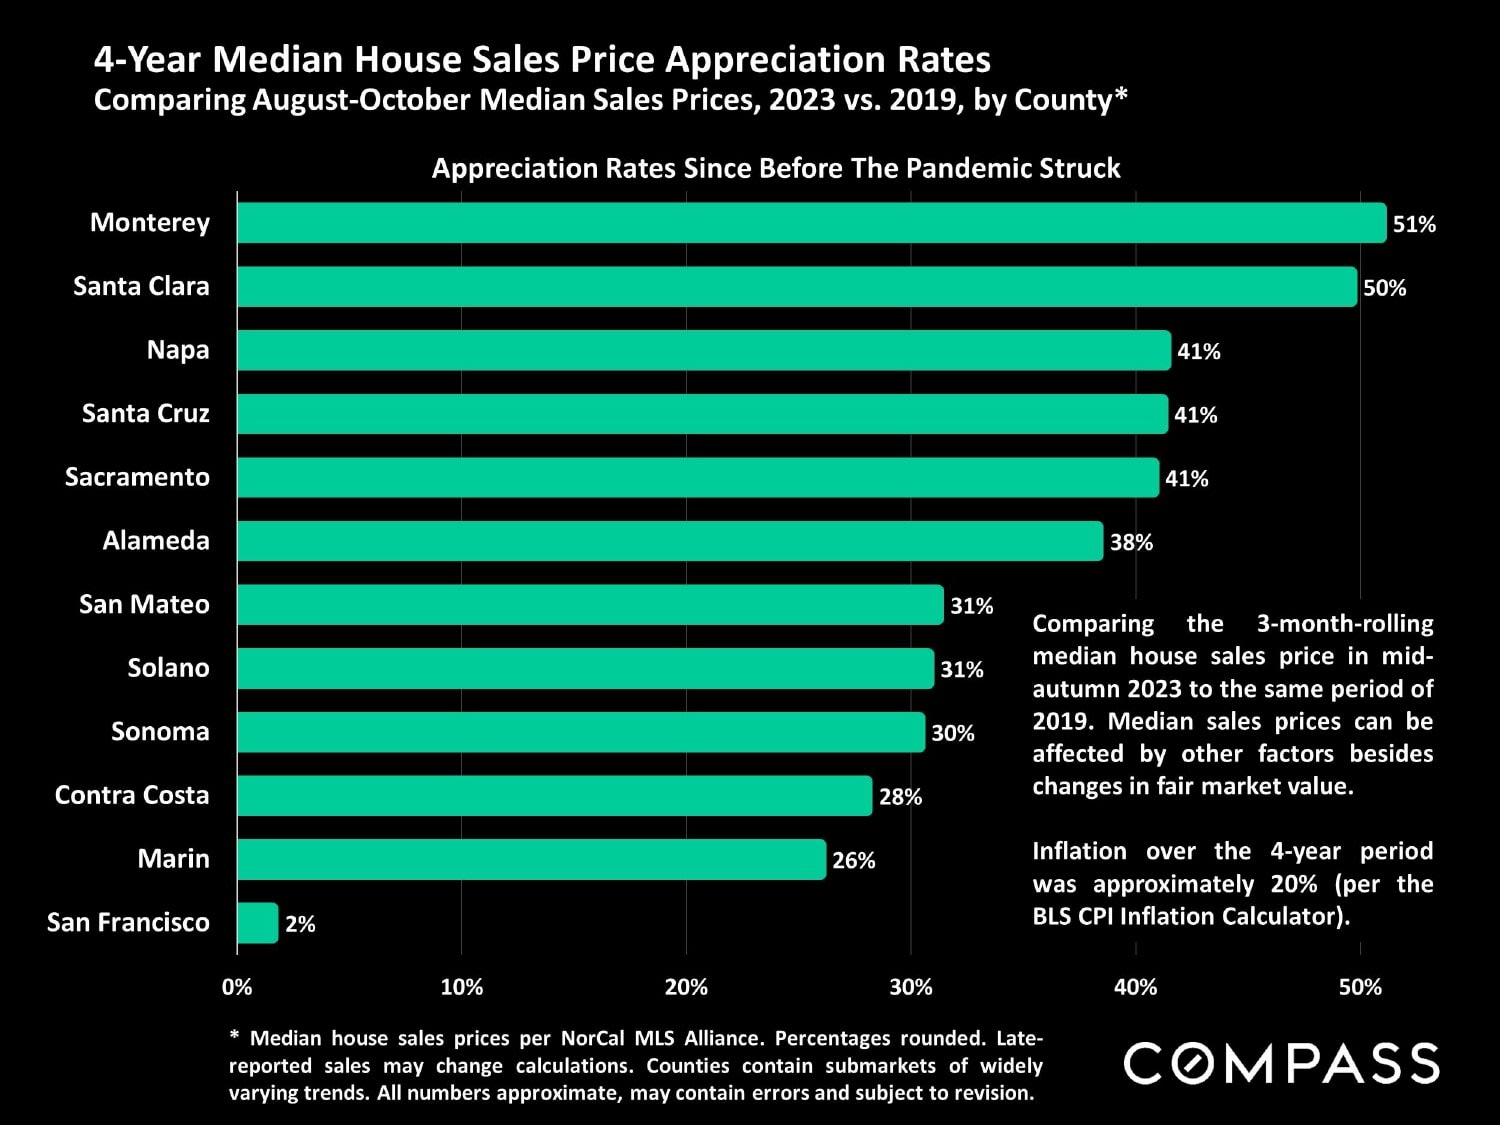
Bar chart of four-year house price appreciation by Northern California county; San Francisco shows 2%, the lowest rate.

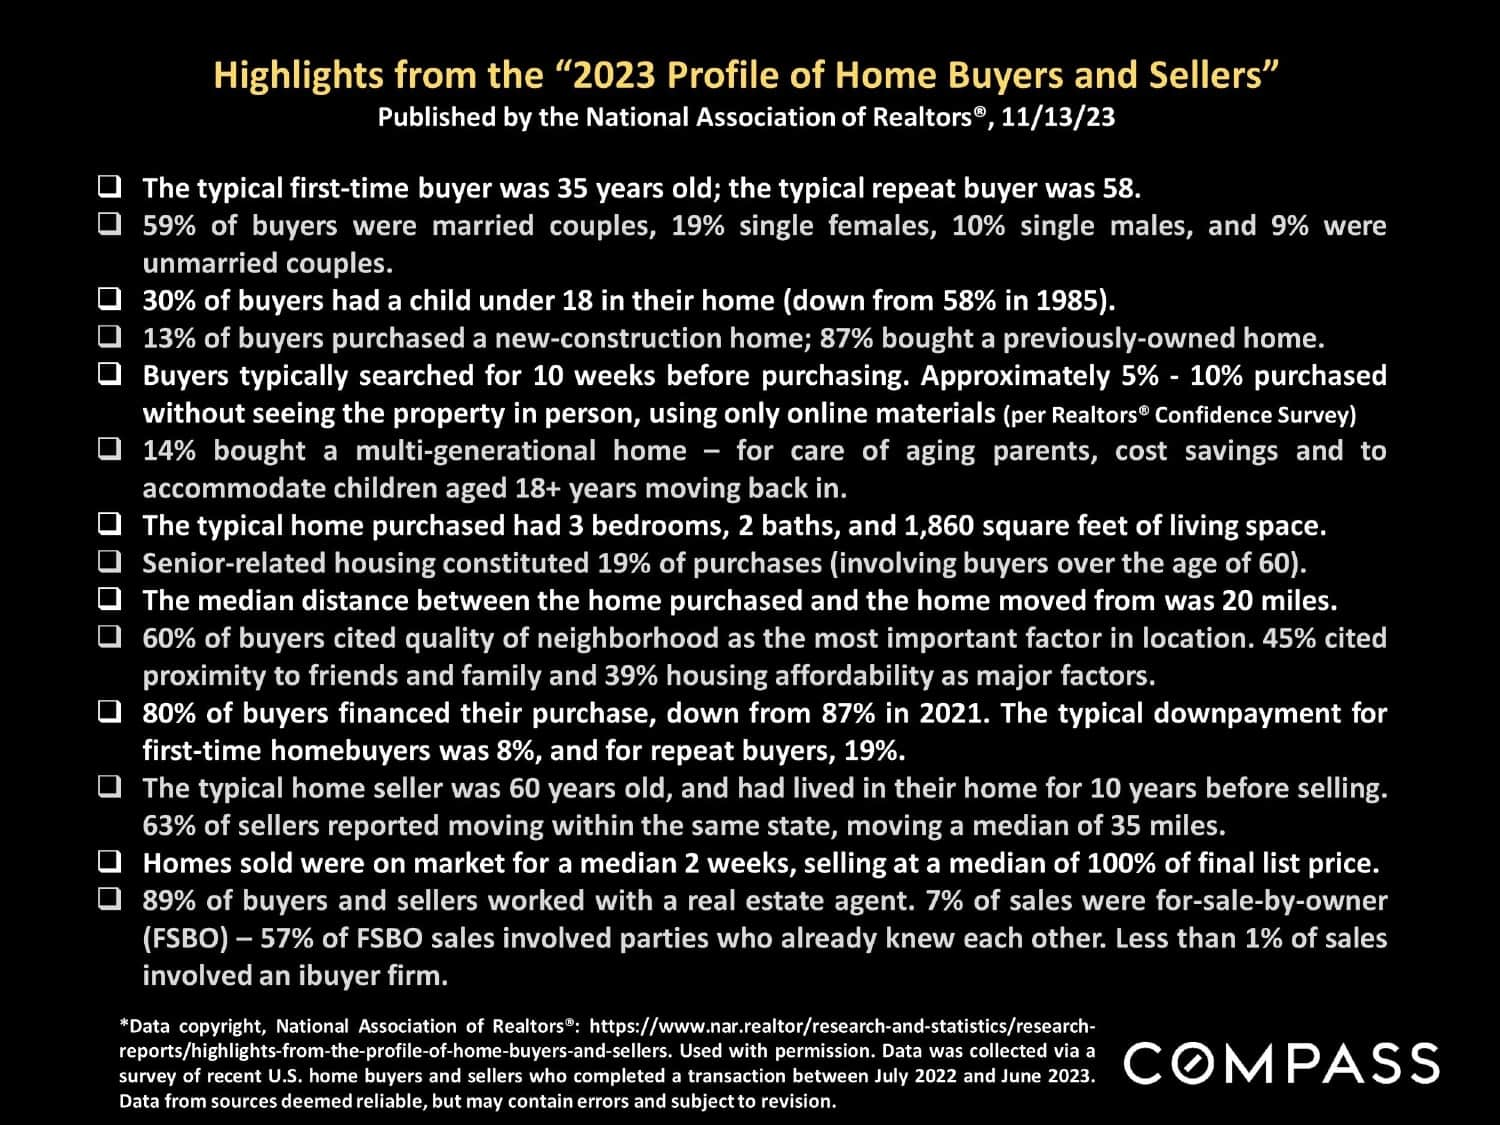
Infographic summarizing 2023 National Association of Realtors home buyer and seller statistics, with Compass branding.

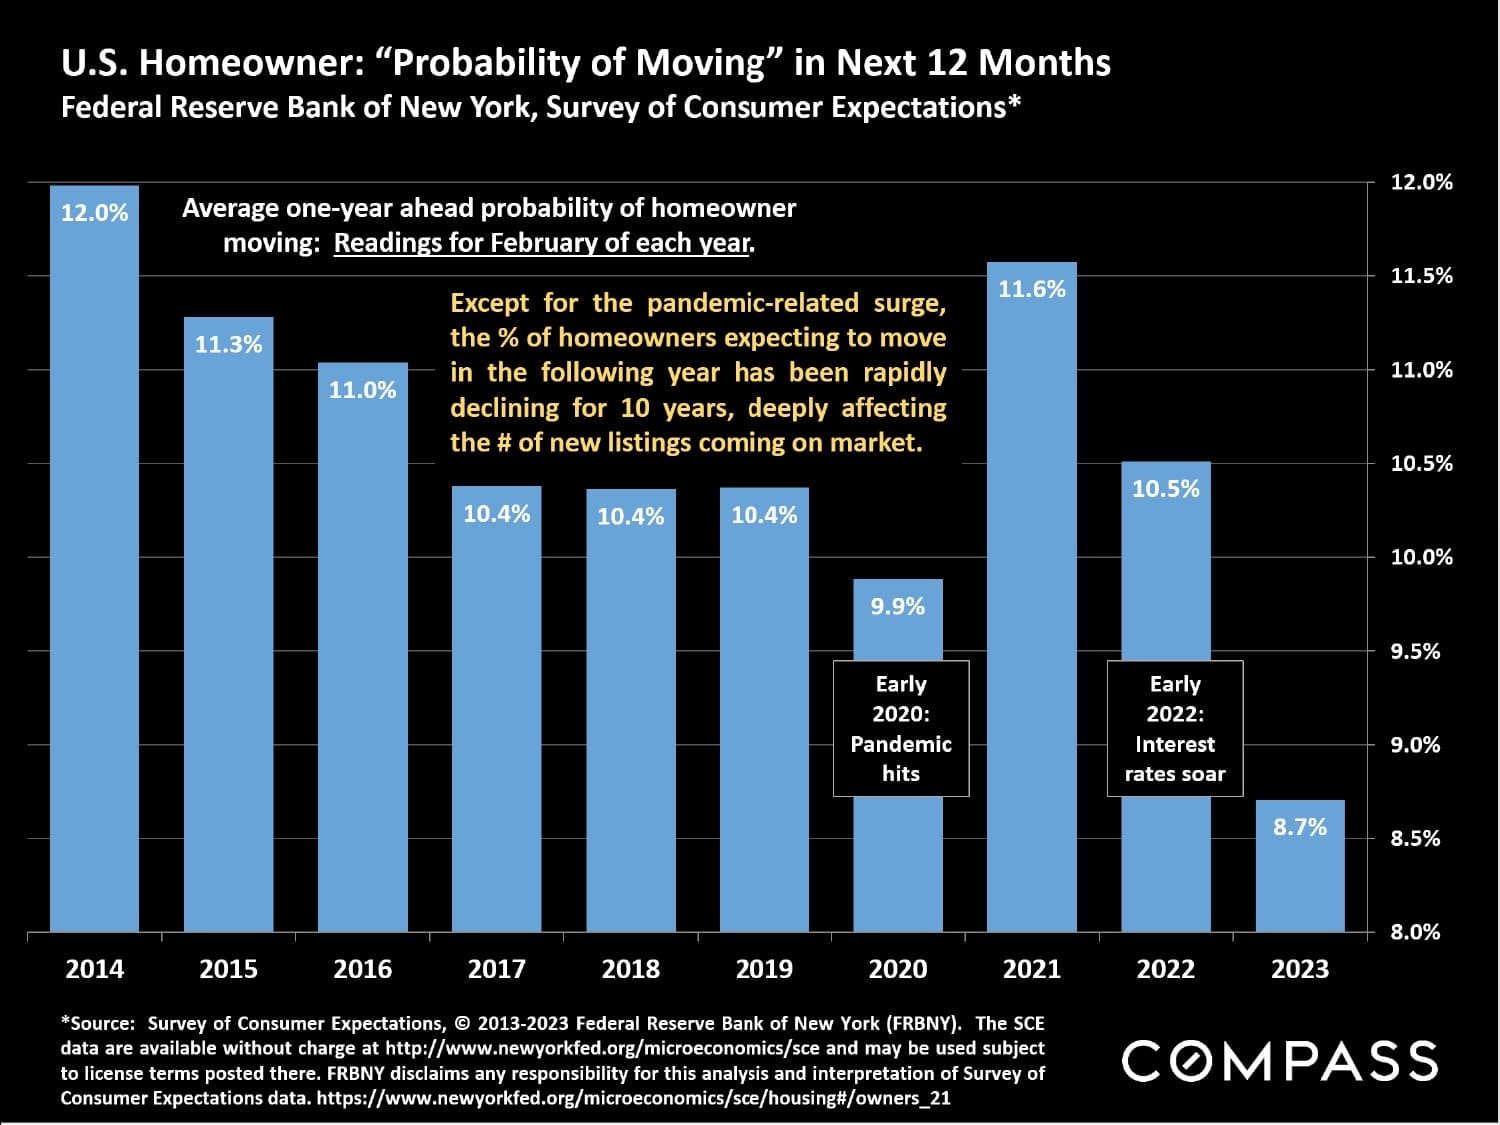
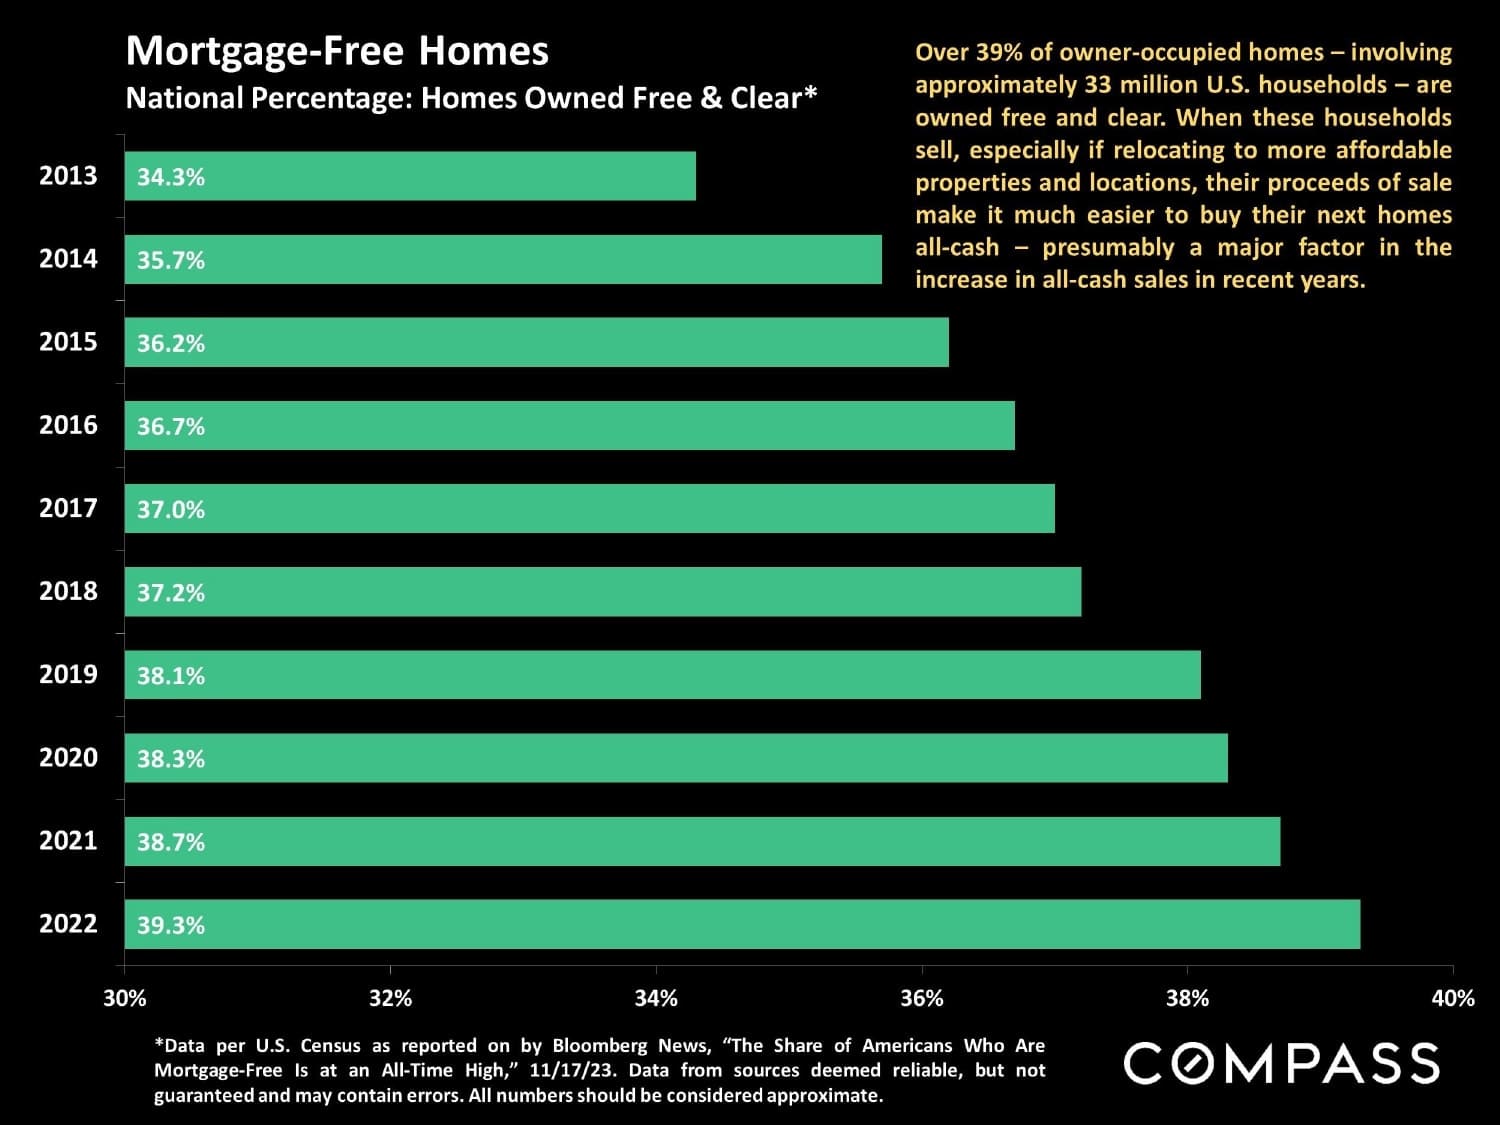
Bar chart of U.S. homeowners’ moving expectations from 2014 to 2023, including a pandemic-era surge.\Chart of U.S. mortgage-free home ownership rates rising from 34.3% in 2013 to 39.3% in 2022.

Compass National Real Estate Insights graphic promoting the new national market report, dated November 2023.\San Francisco Bay Area home values report for summer–fall 2023, featuring a satellite map and COMPASS branding.

Real estate market report notes on statistics, pricing measures, photo licensing, and Compass disclaimers.

WORK WITH US

We offer the highest level of service and expertise to our clients. Our team has built a reputation for consistently representing the finest real estate in San Francisco and Napa Valley. Results driven and dedicated to your success, whether buying, selling, renting or investing. Contact us today for a private consultation.

Contact Us