

San Francisco county: September 2022

San Francisco Real Estate, September 2022 Report
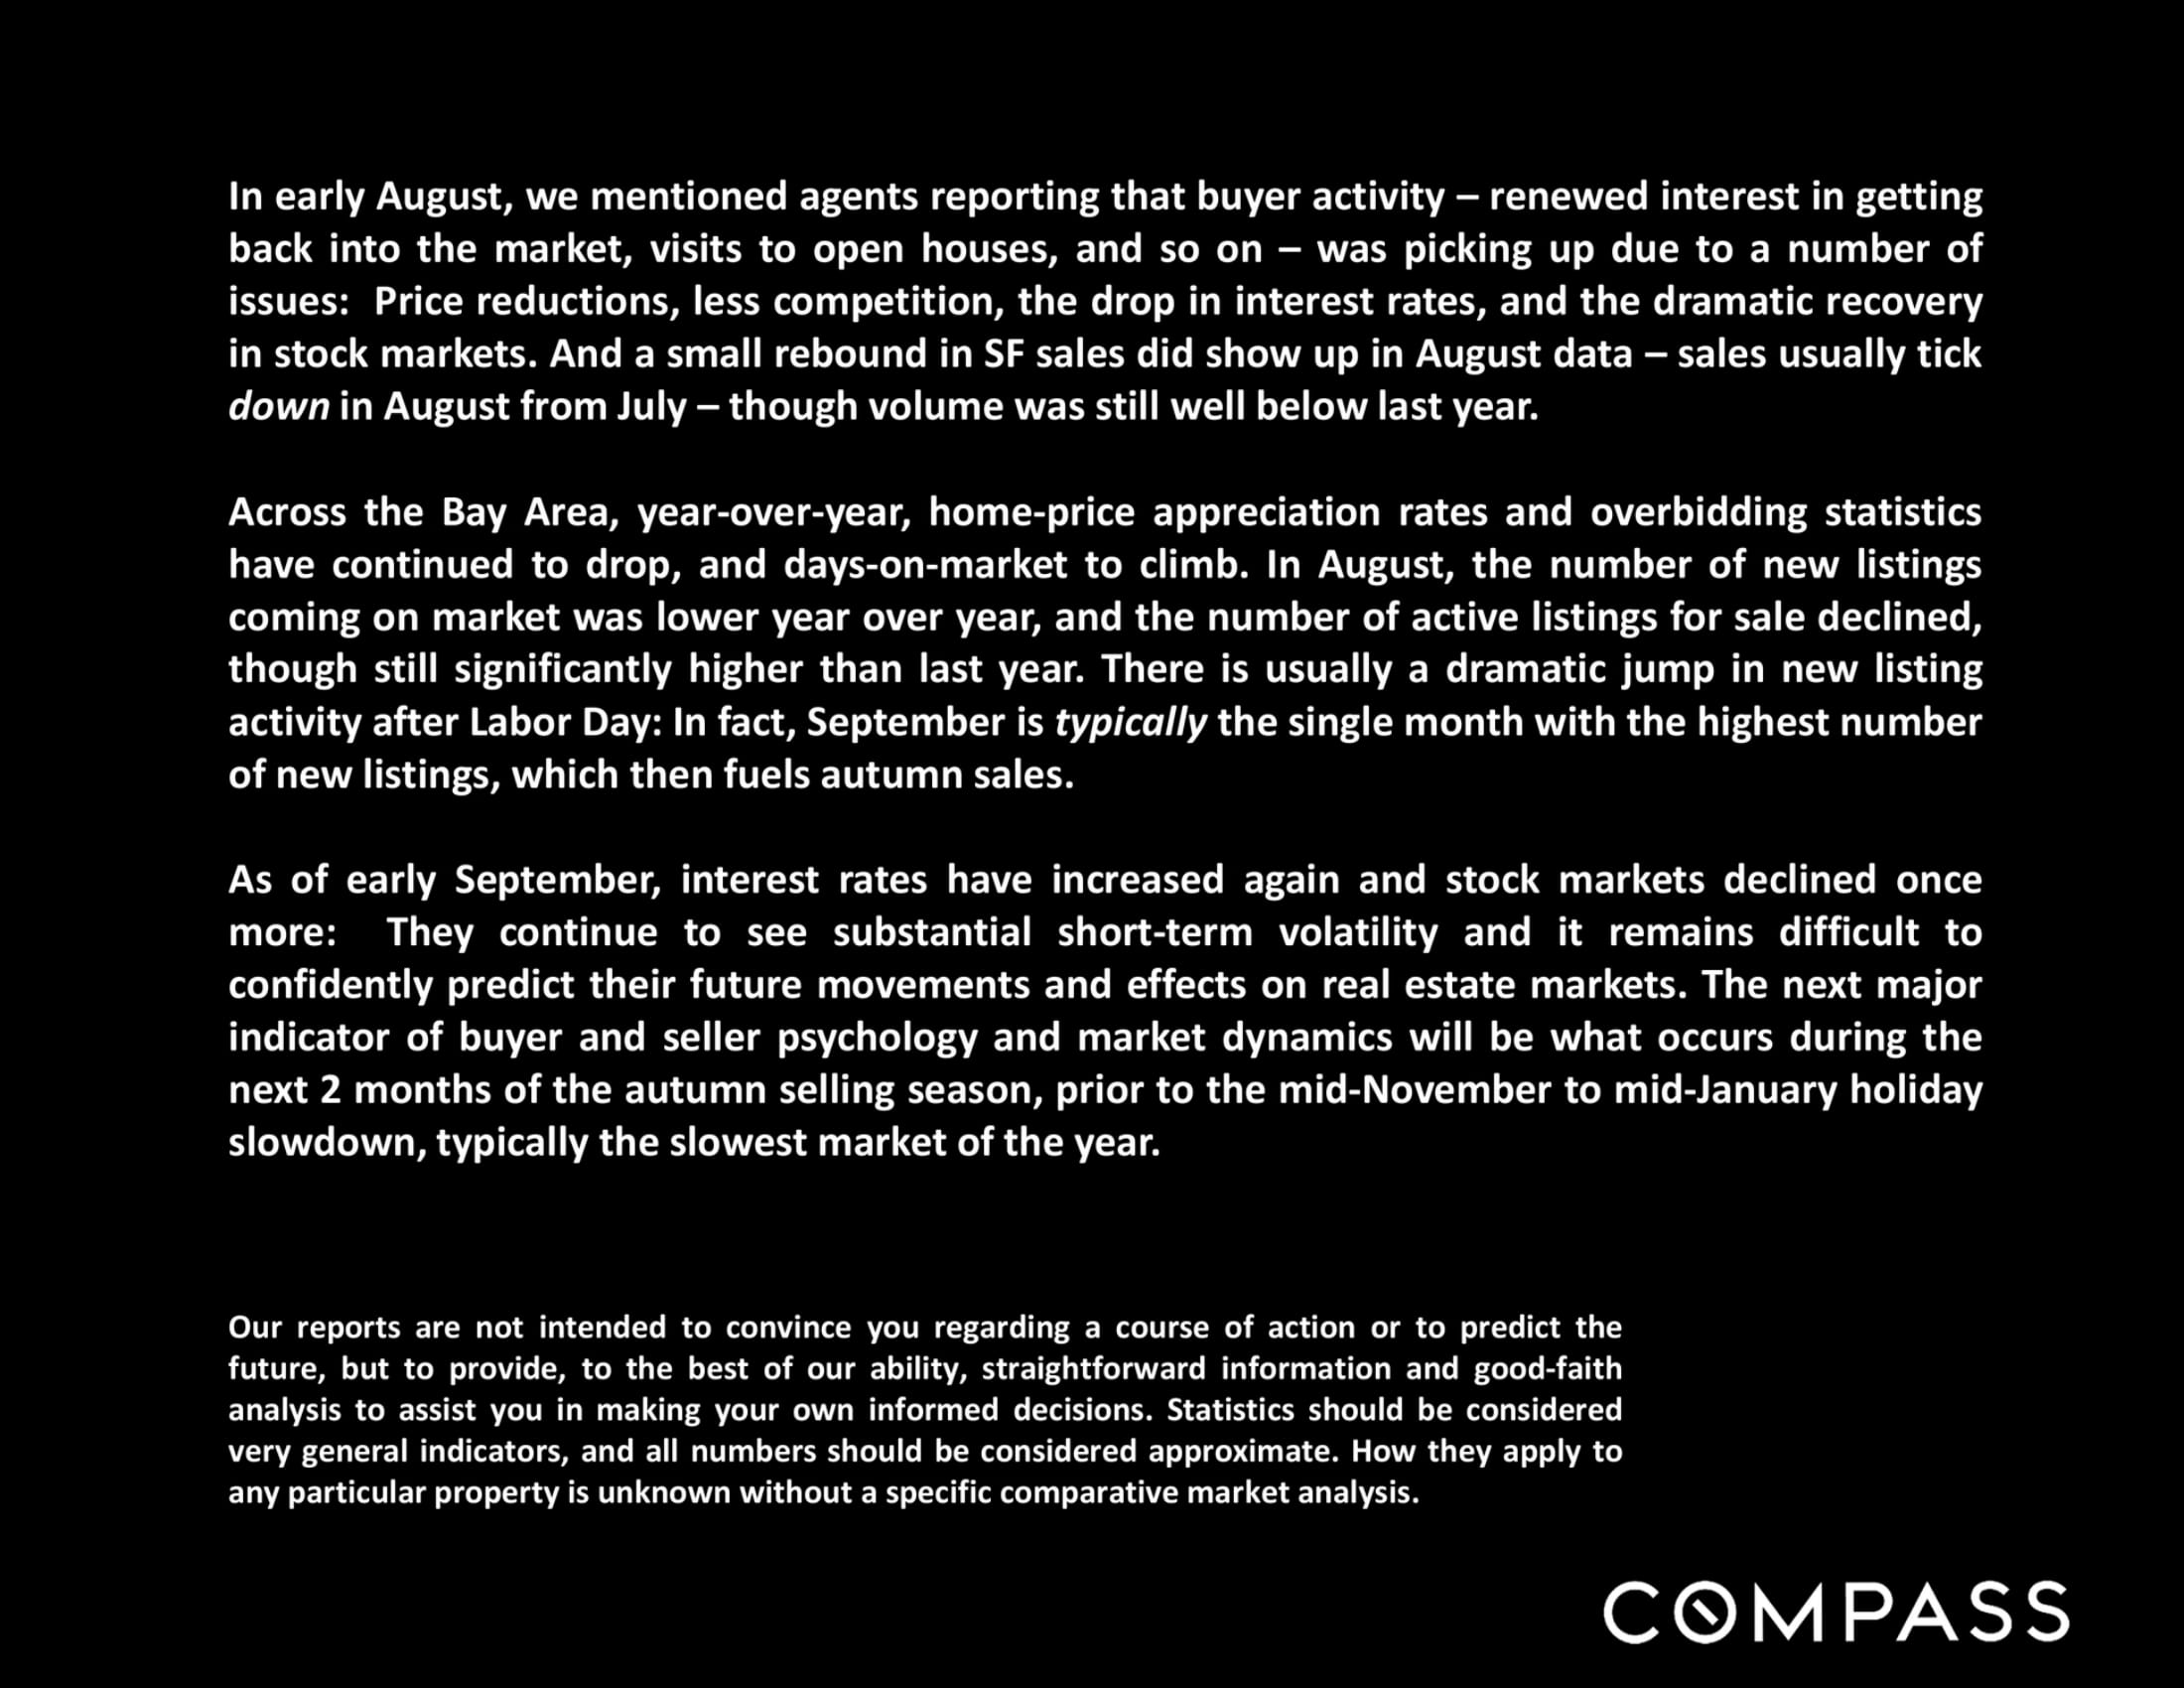
San Francisco real estate market update discussing August sales, September listings, interest rates, and autumn trends.
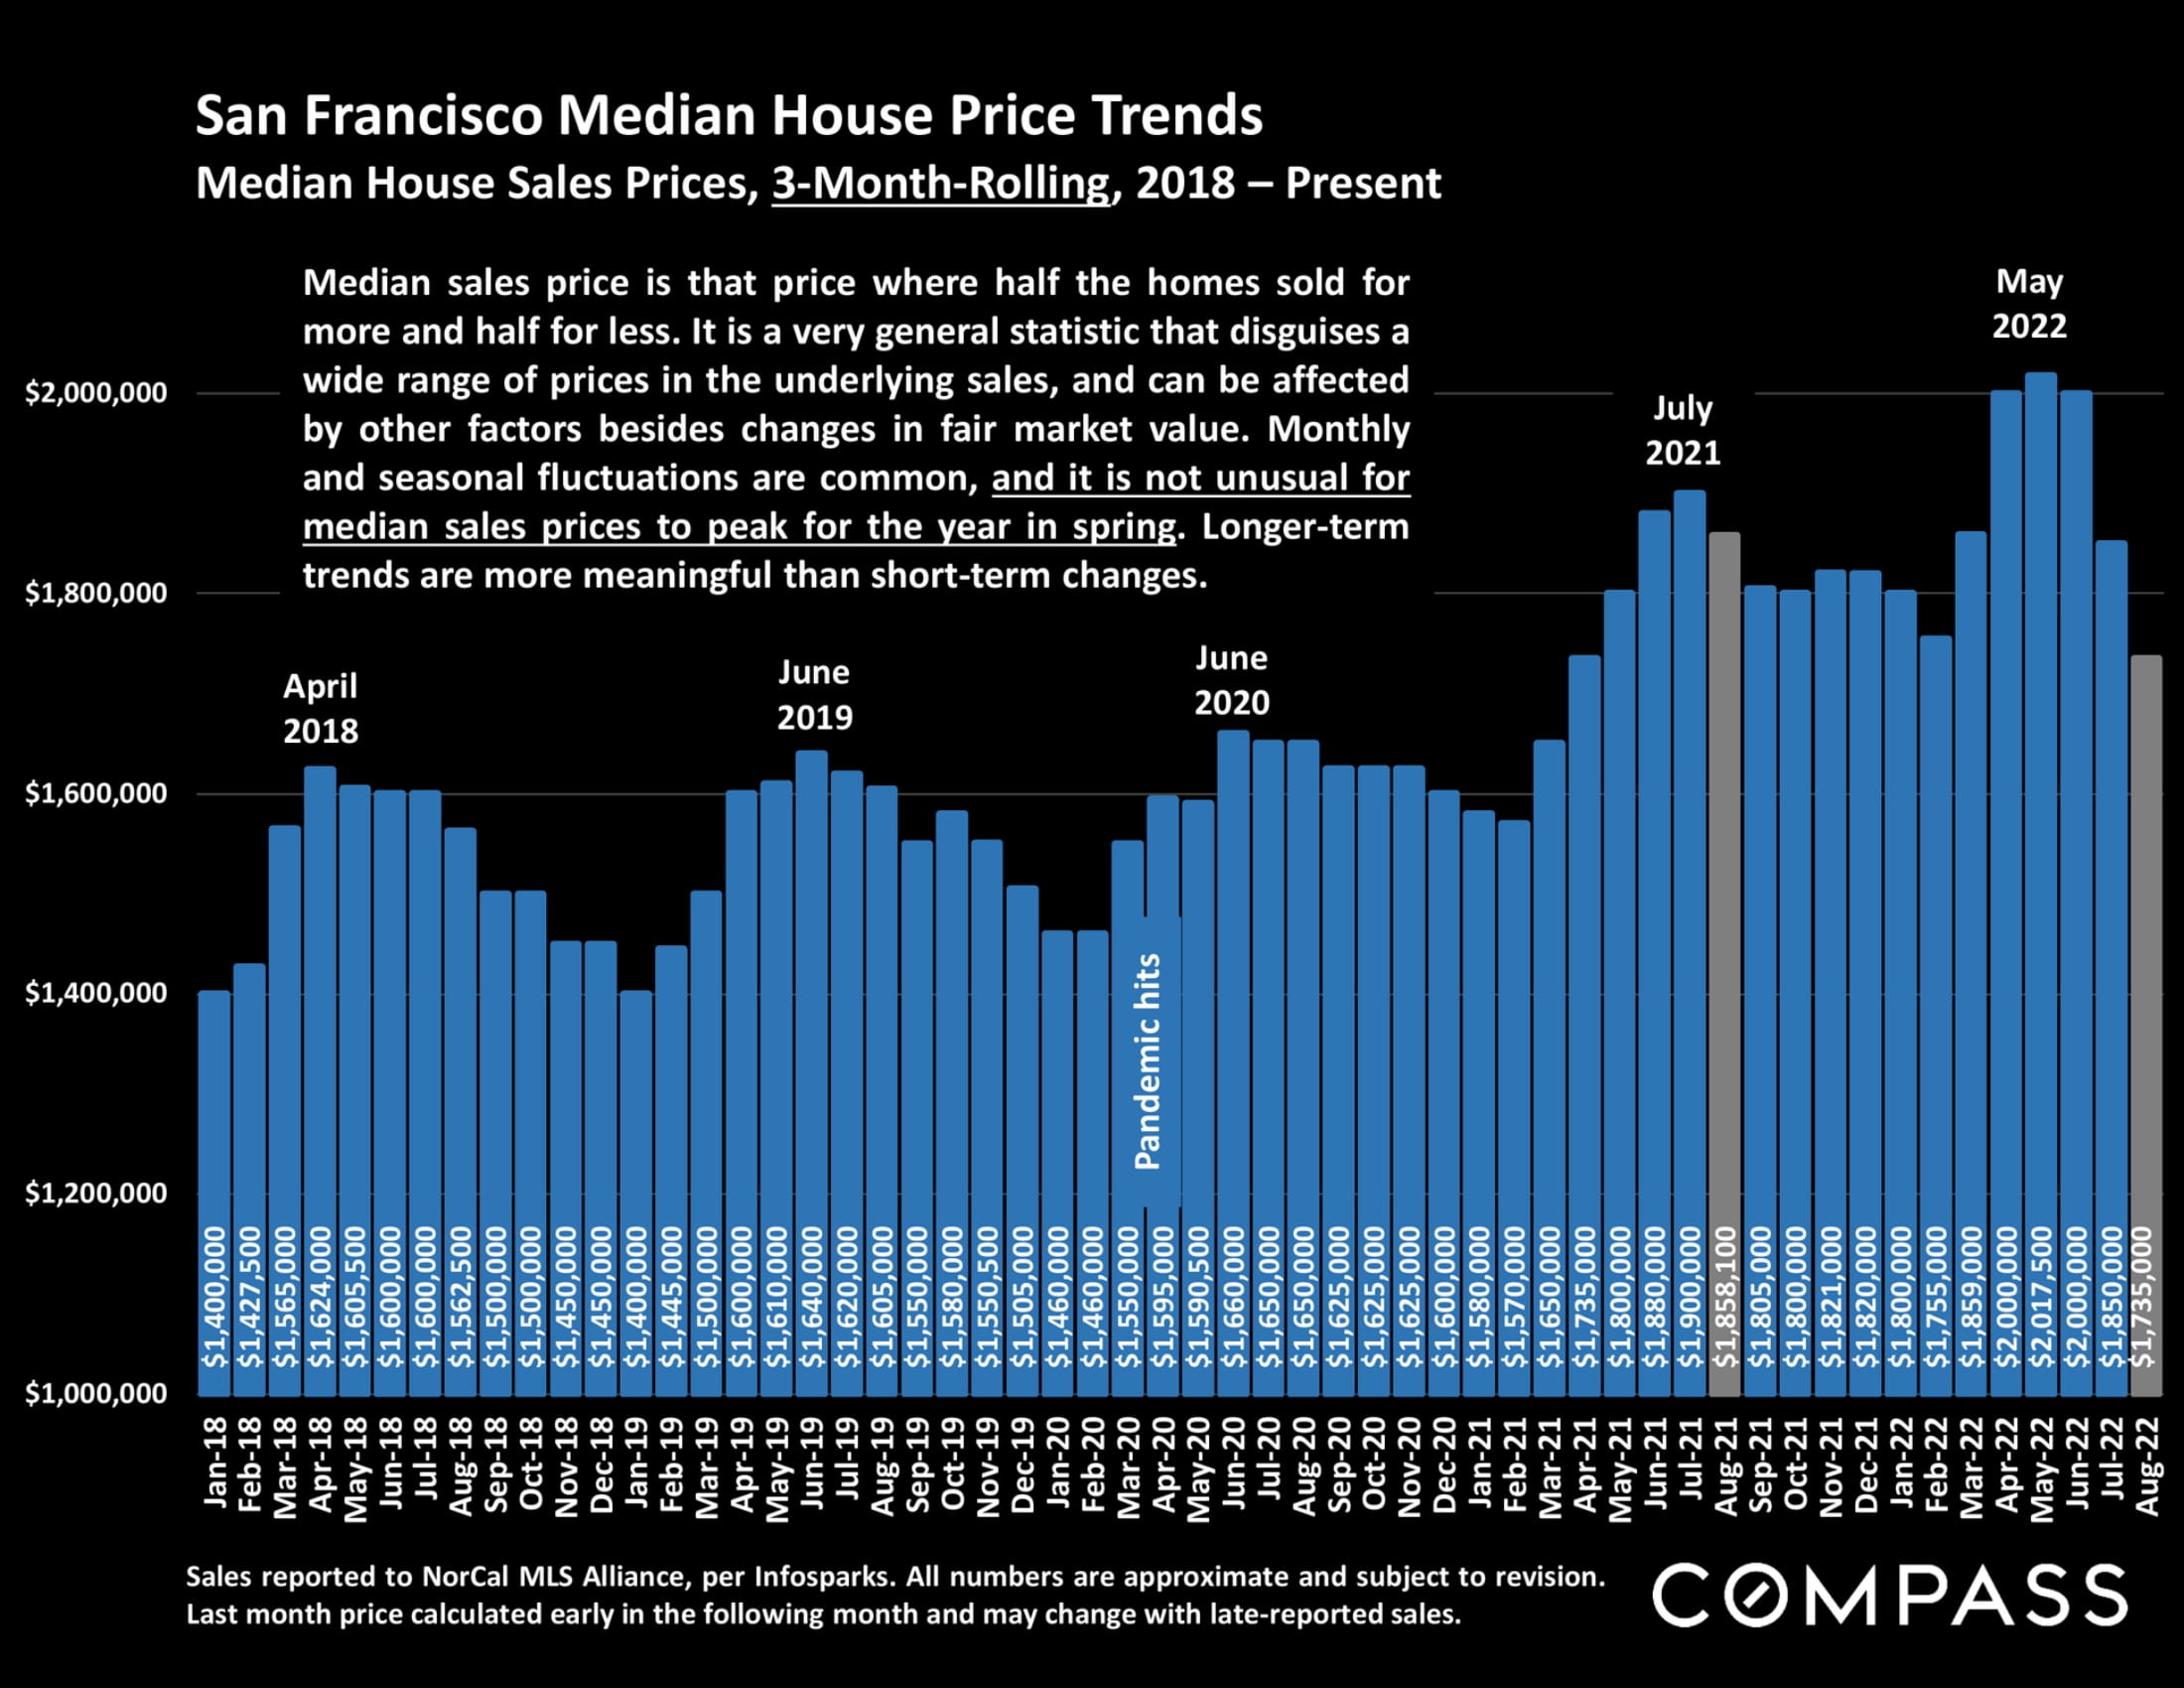
Chart of San Francisco median house prices, rising from about $1.4 million in 2018 to peaks above $2 million in 2022.
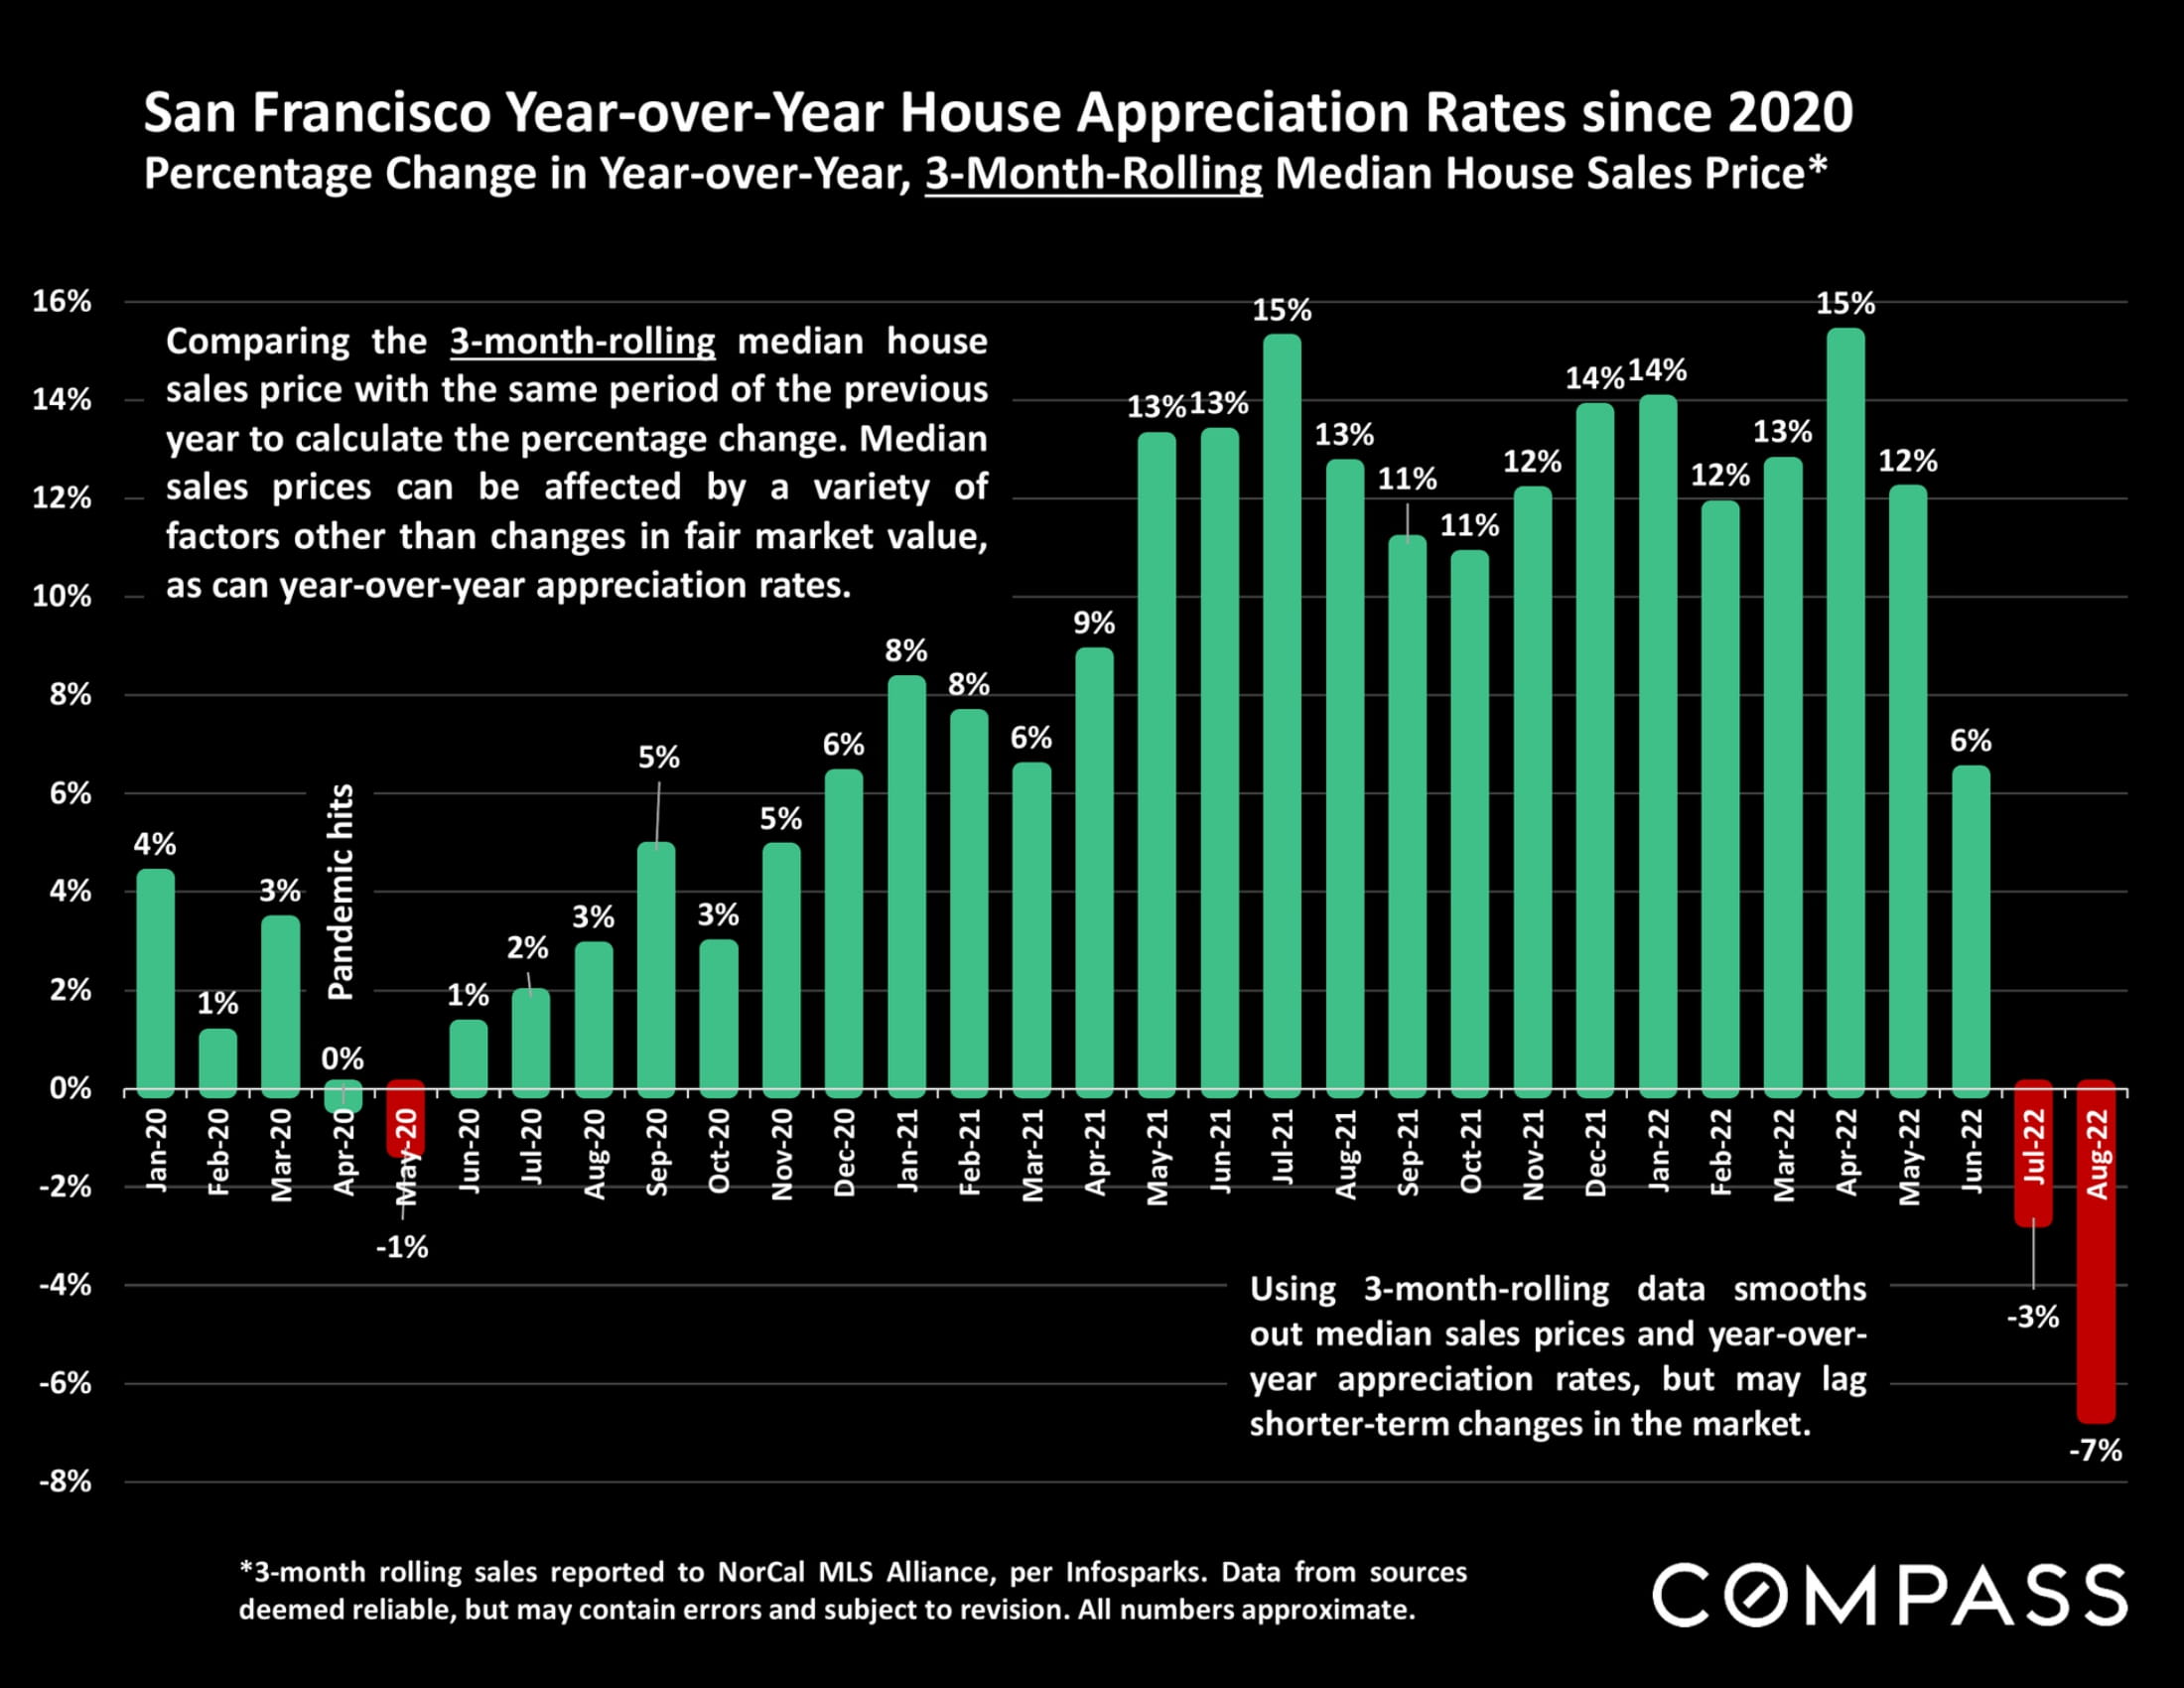
Bar chart of San Francisco house appreciation, with year-over-year prices falling to -7% in August 2022.
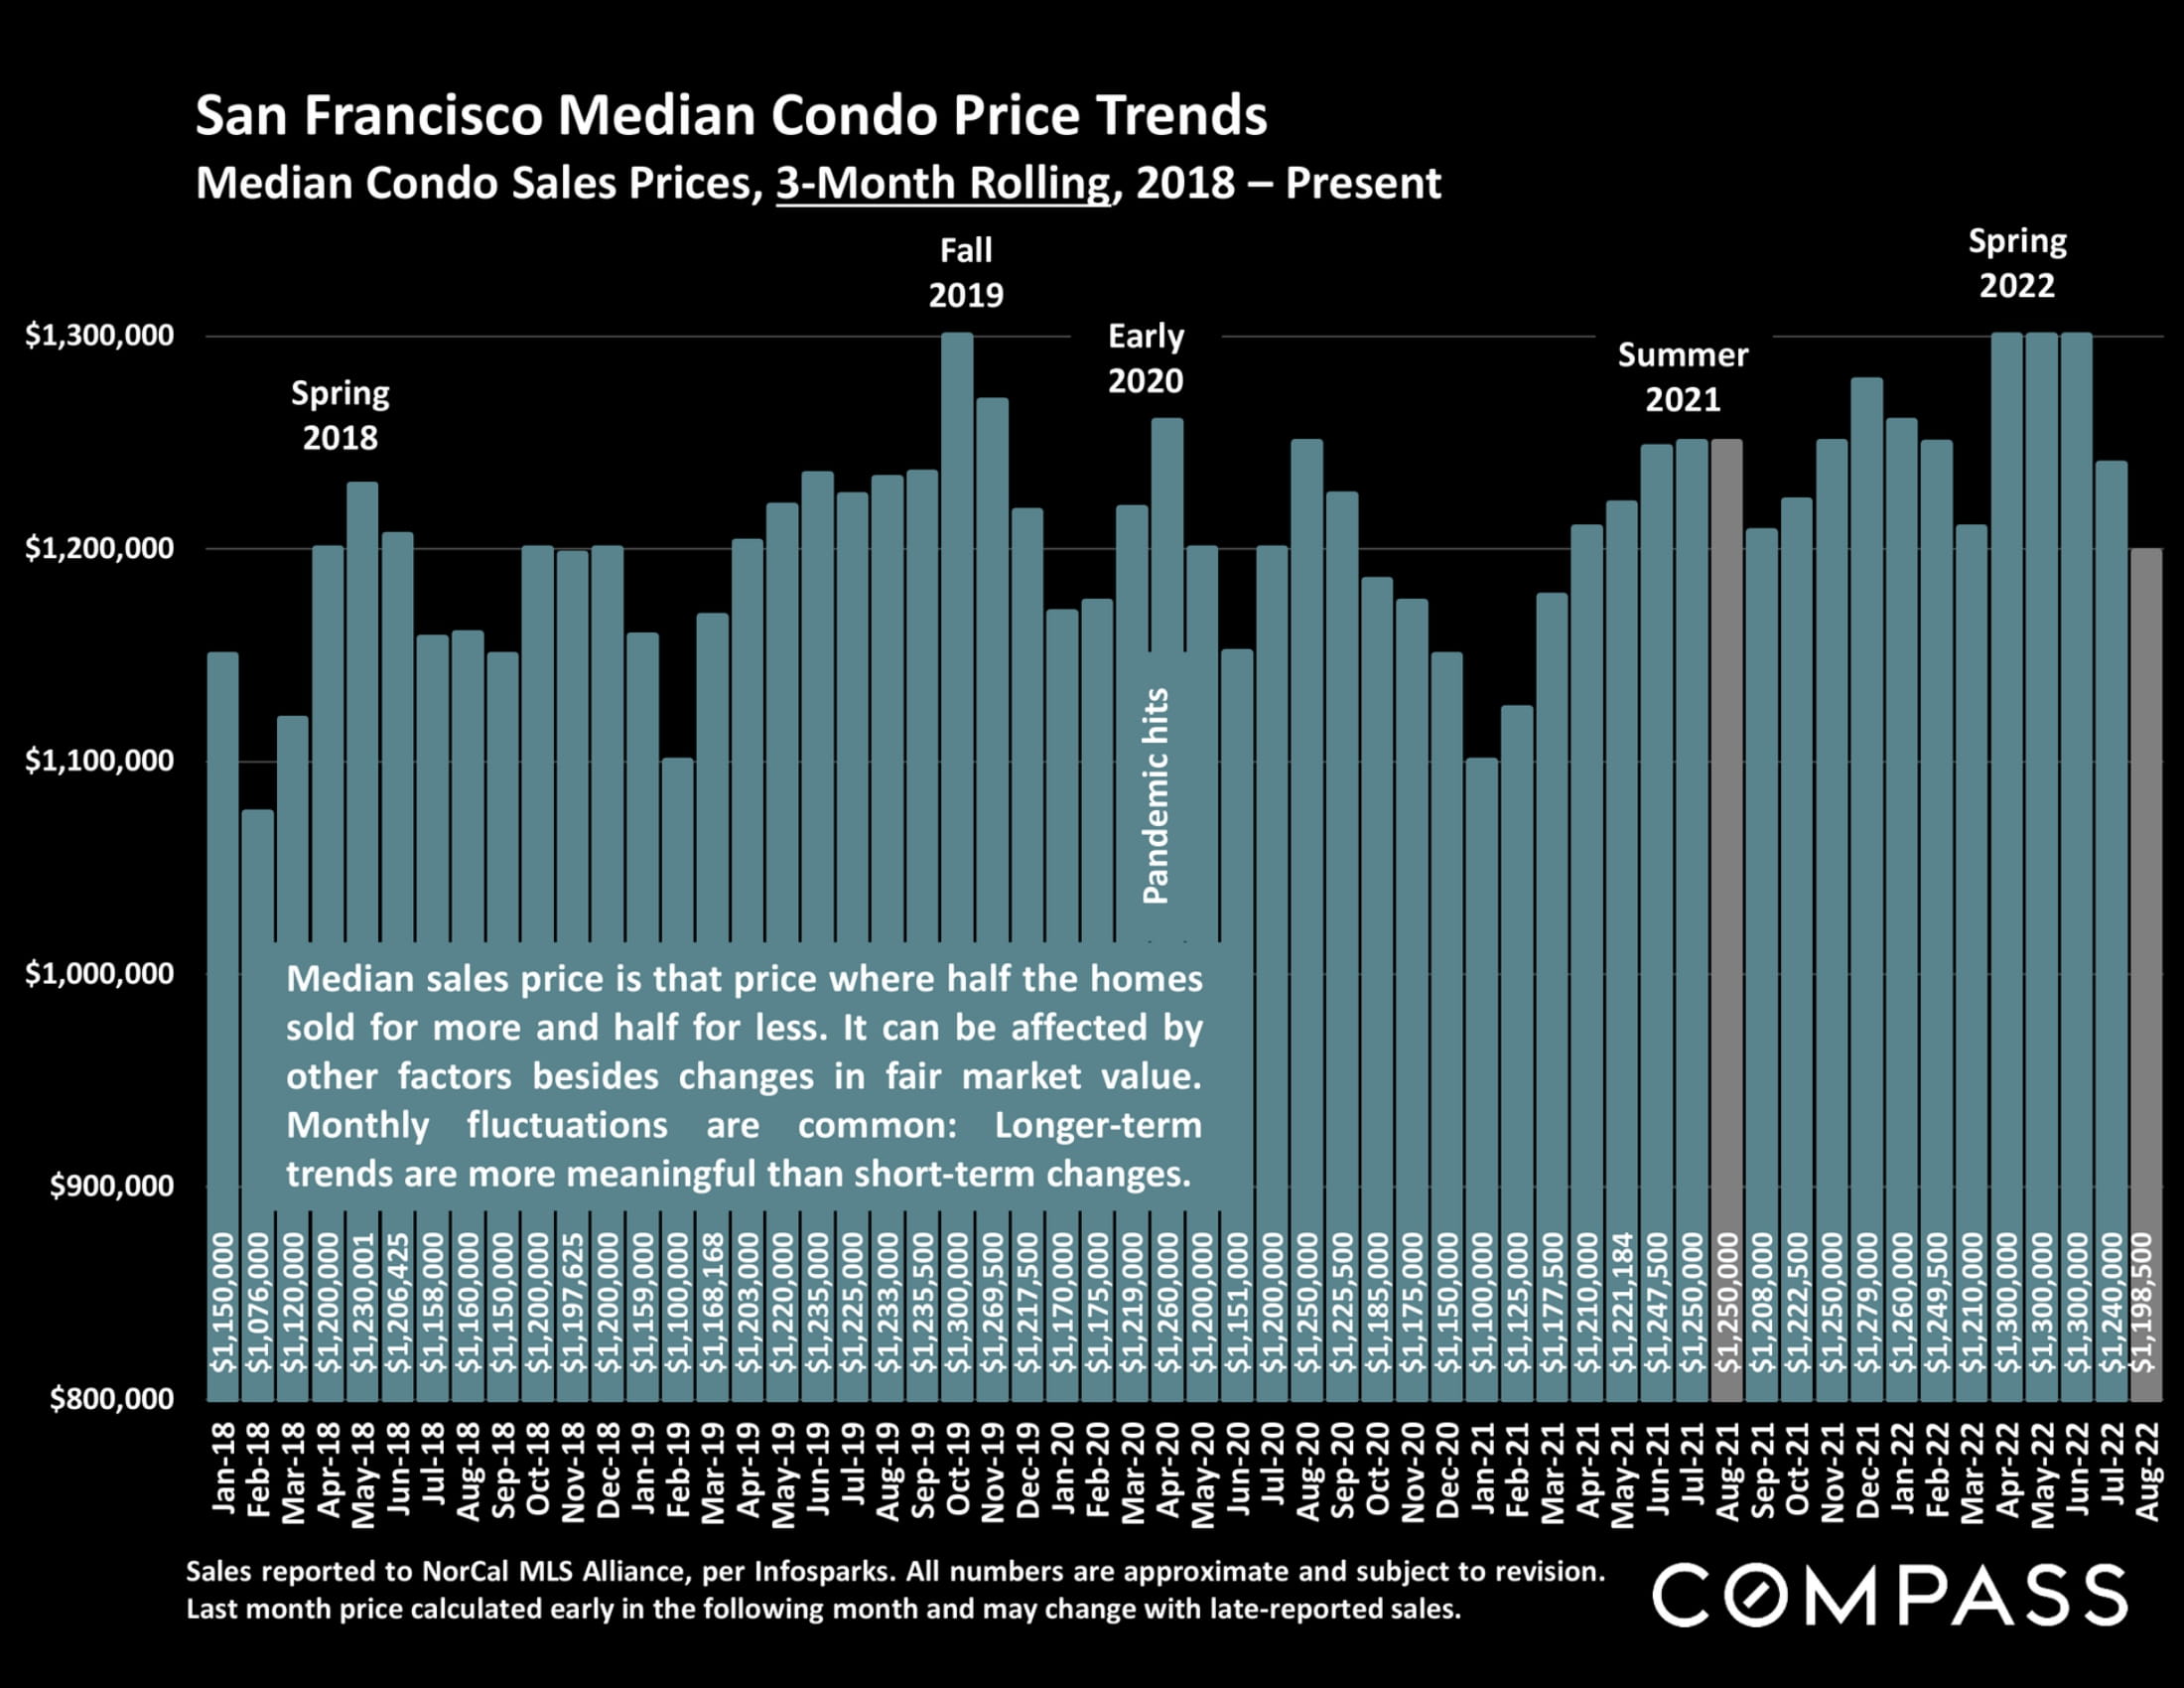
Chart of San Francisco median condo prices from 2018 to August 2022, with monthly bars and seasonal trend callouts.
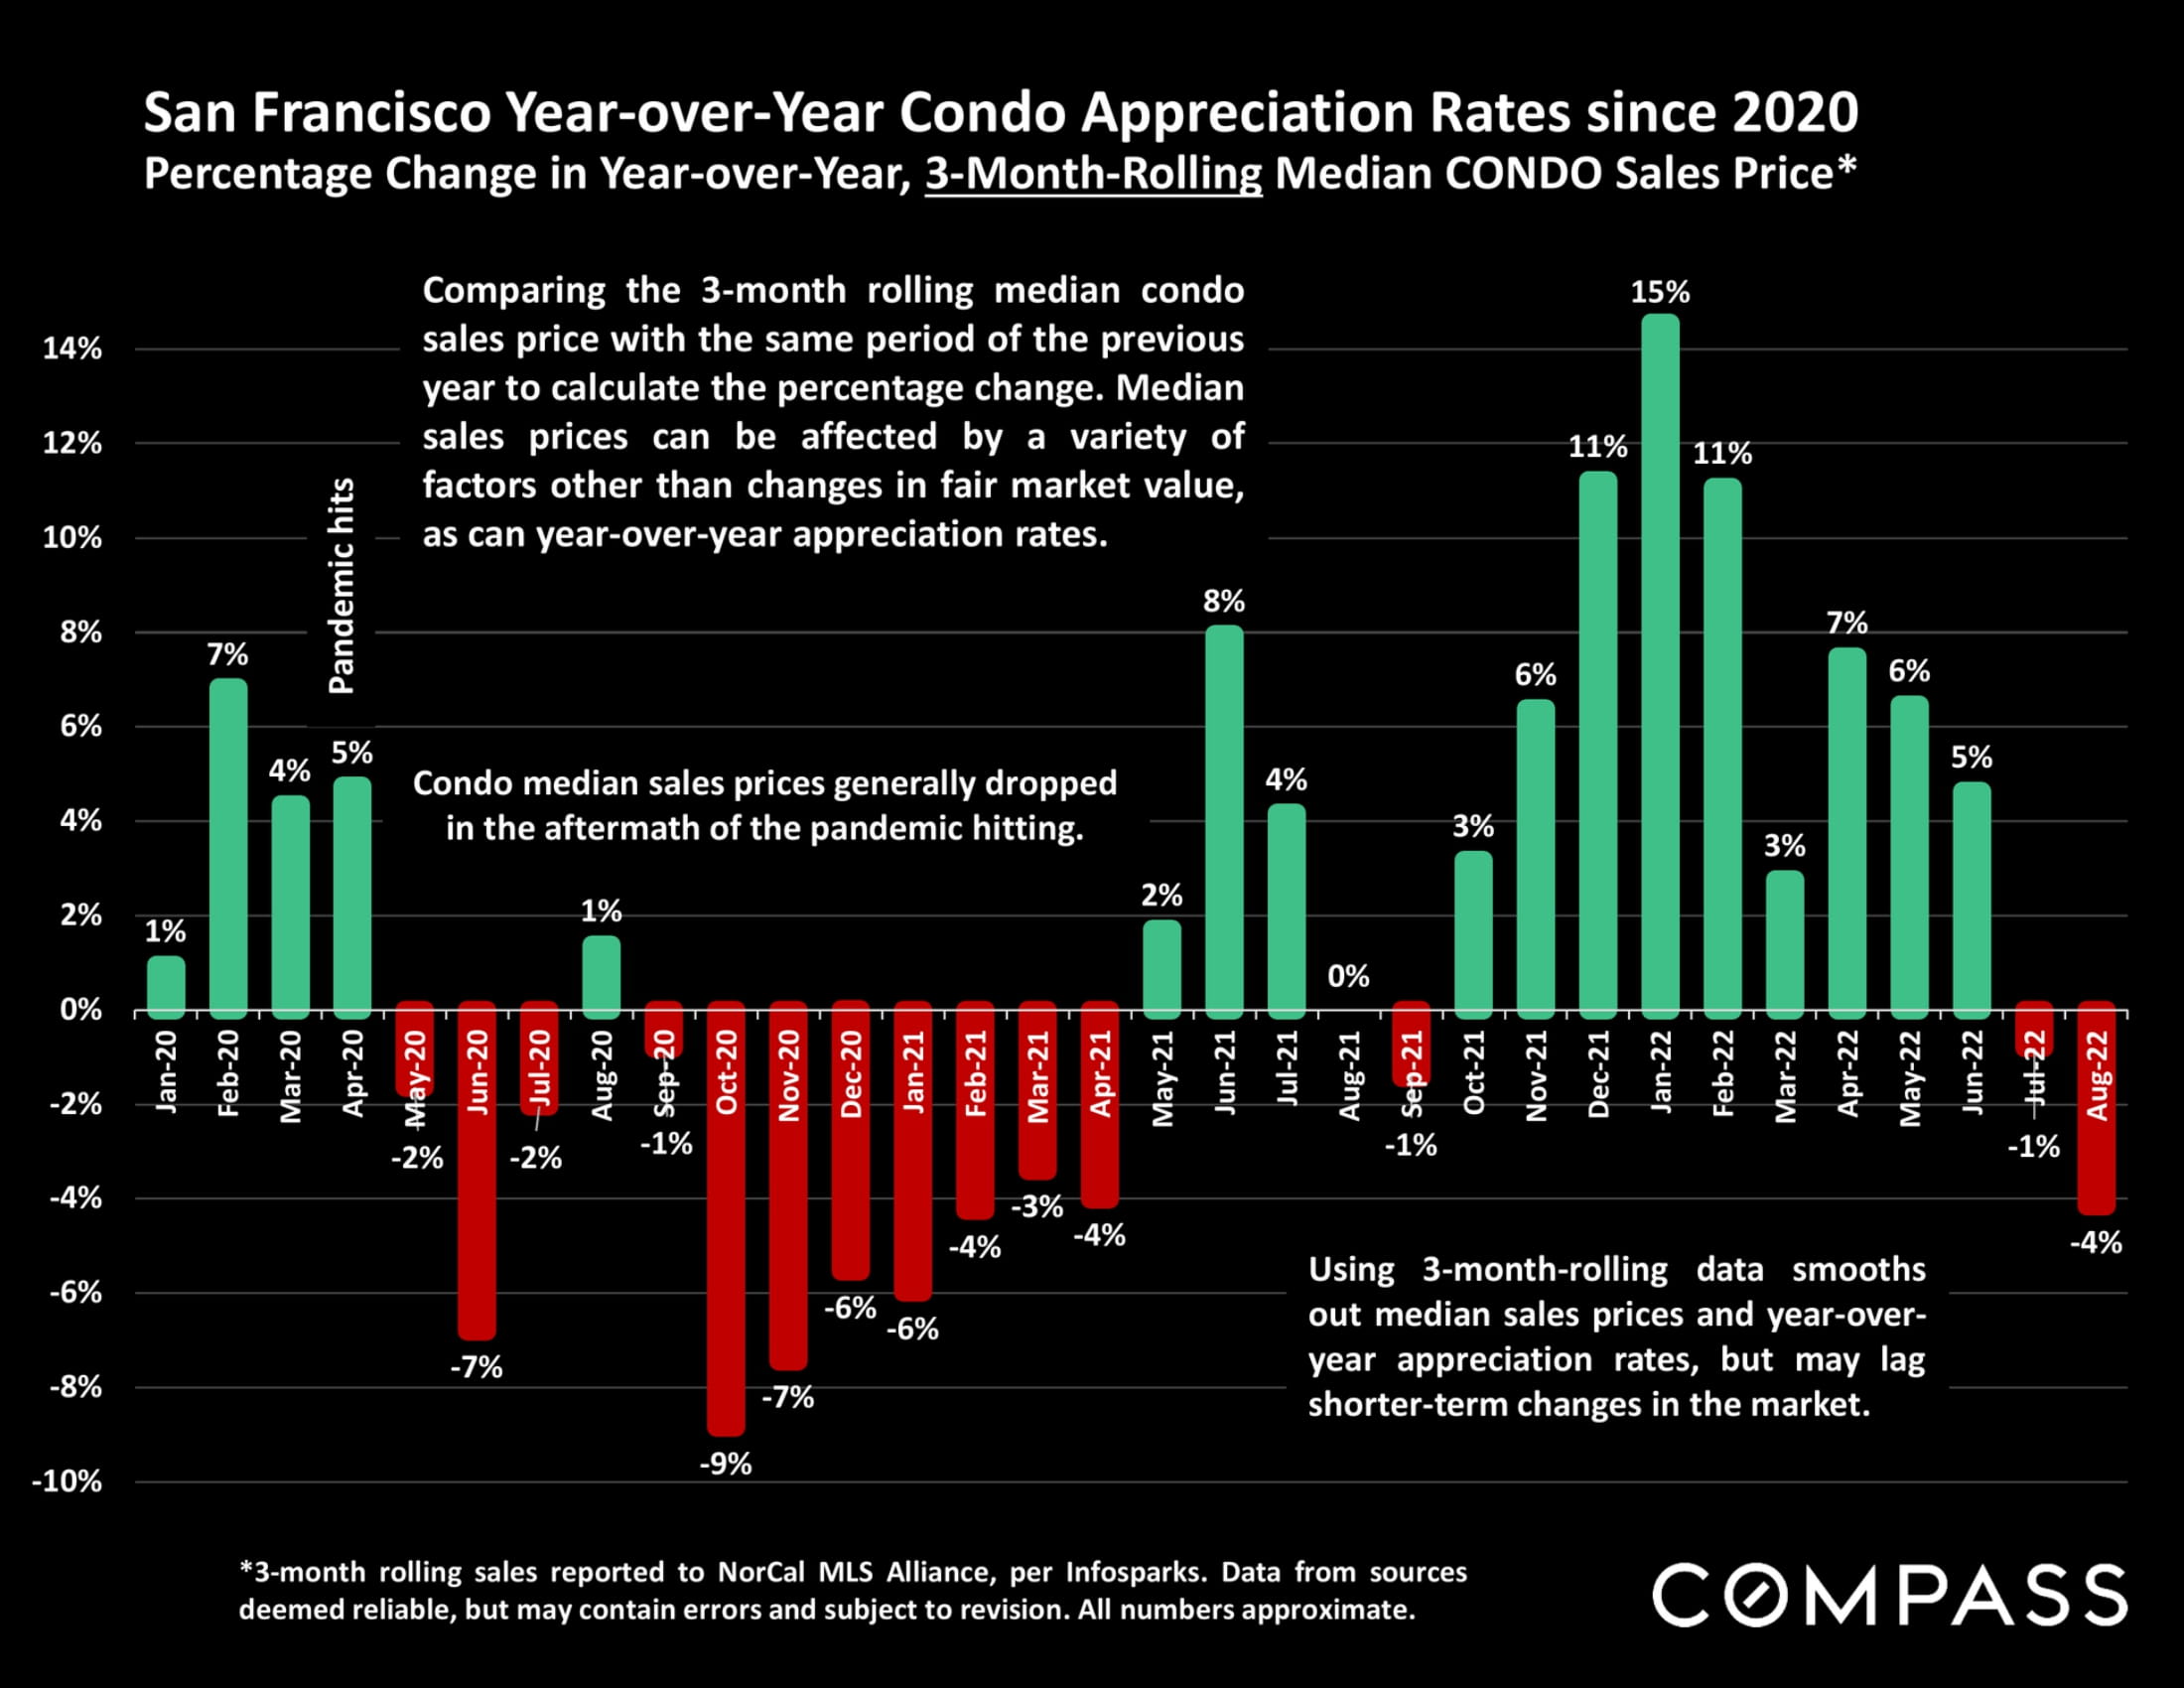
Chart of San Francisco condo price changes, showing a 15% peak in January 2022 and a decline to -4% by August.
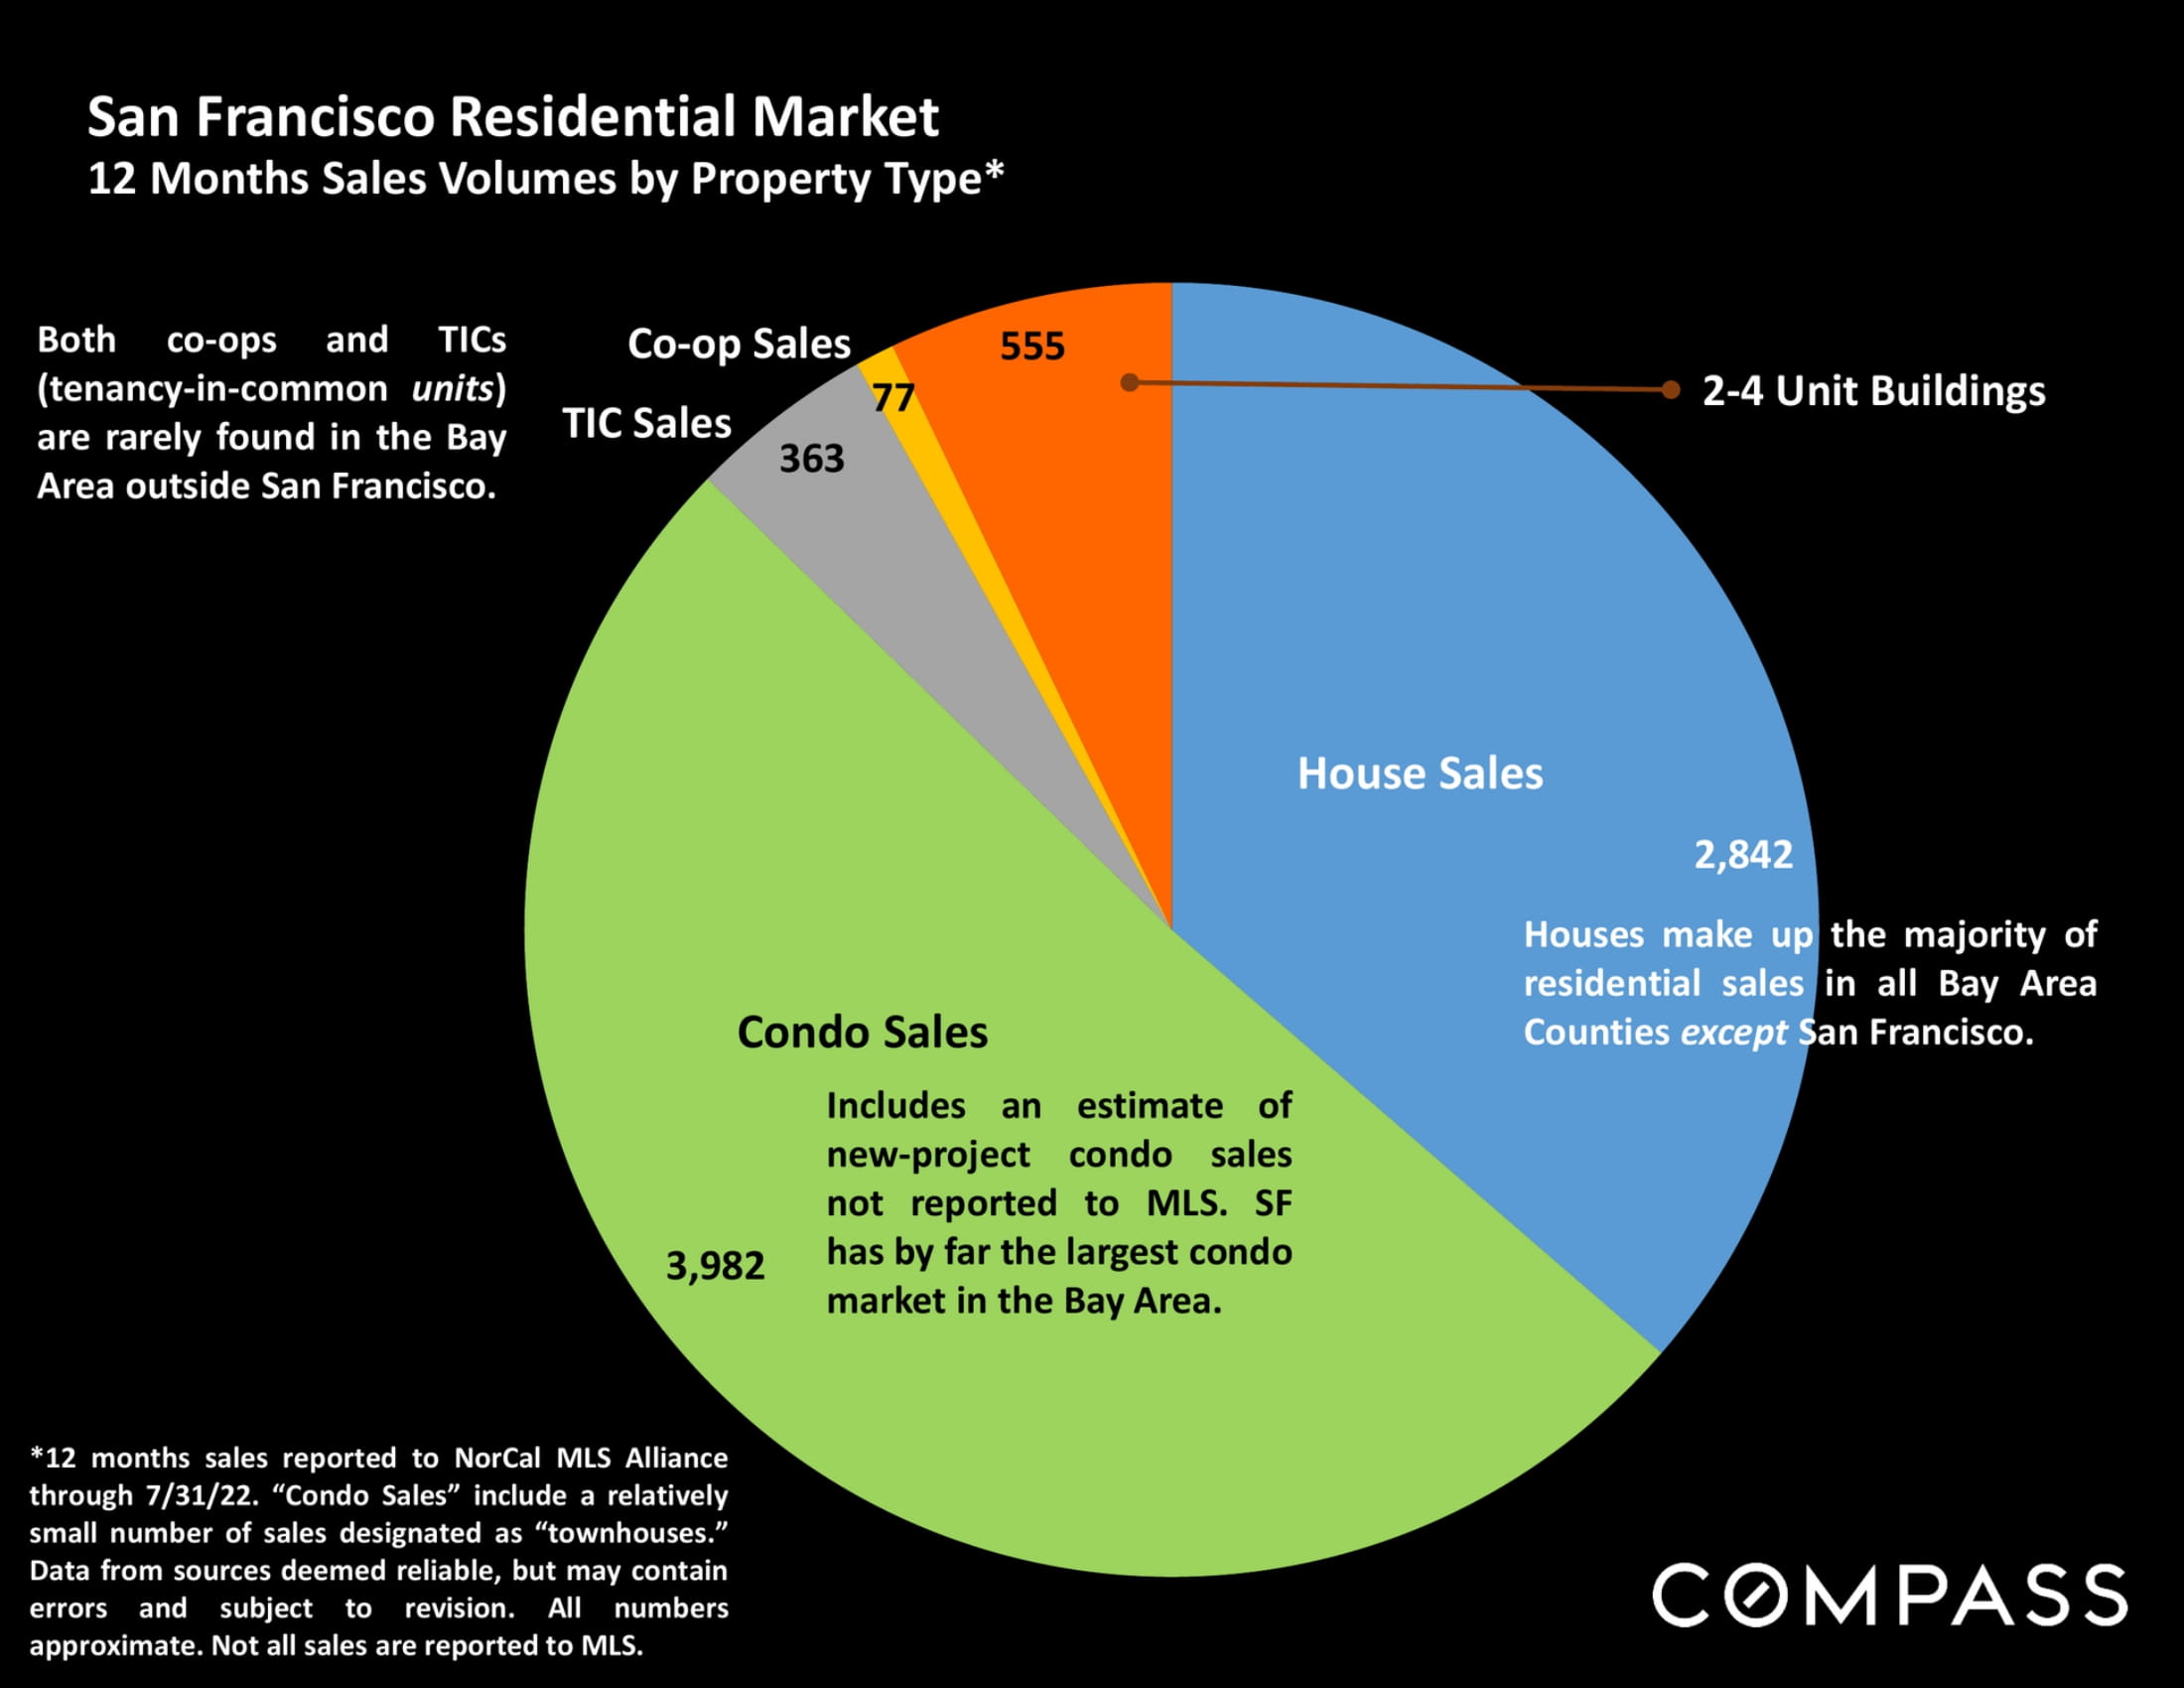
San Francisco residential sales pie chart: 3,982 condos, 2,842 houses, 555 two- to four-unit buildings, 363 TICs, and 77 co-ops.
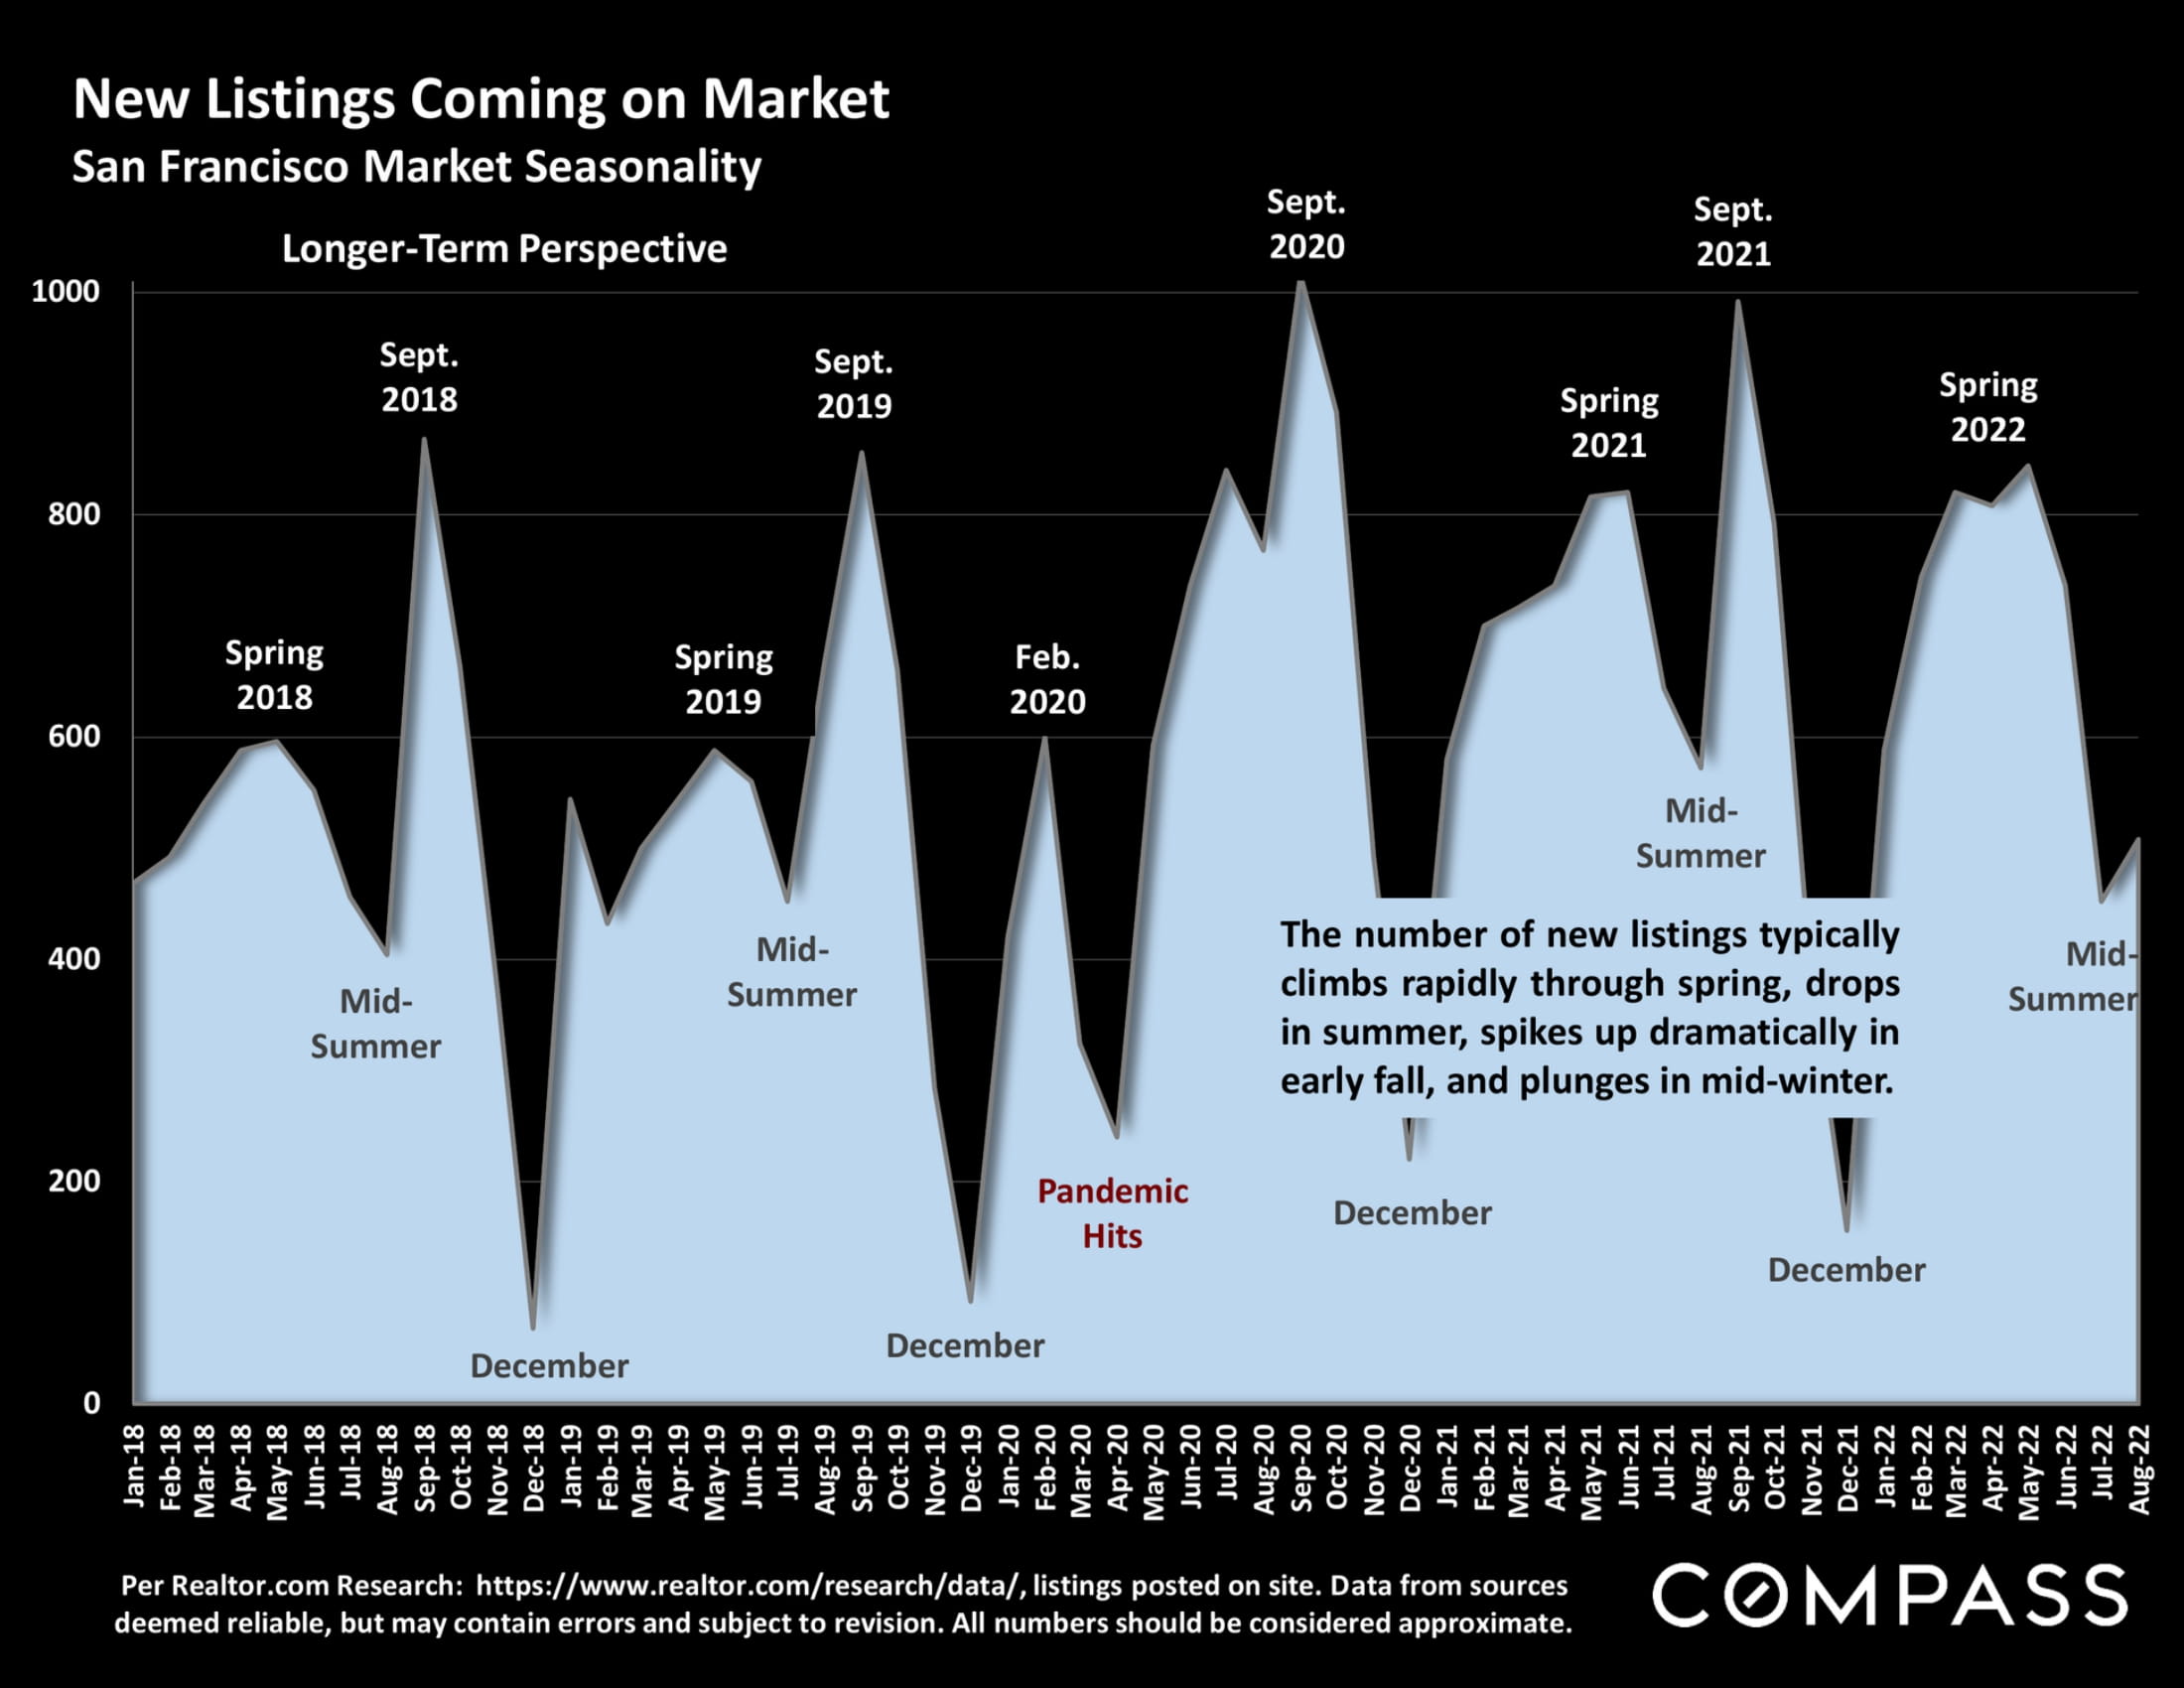
Chart of San Francisco new listings from 2018 to 2022, showing seasonal peaks in spring and early fall and winter lows.
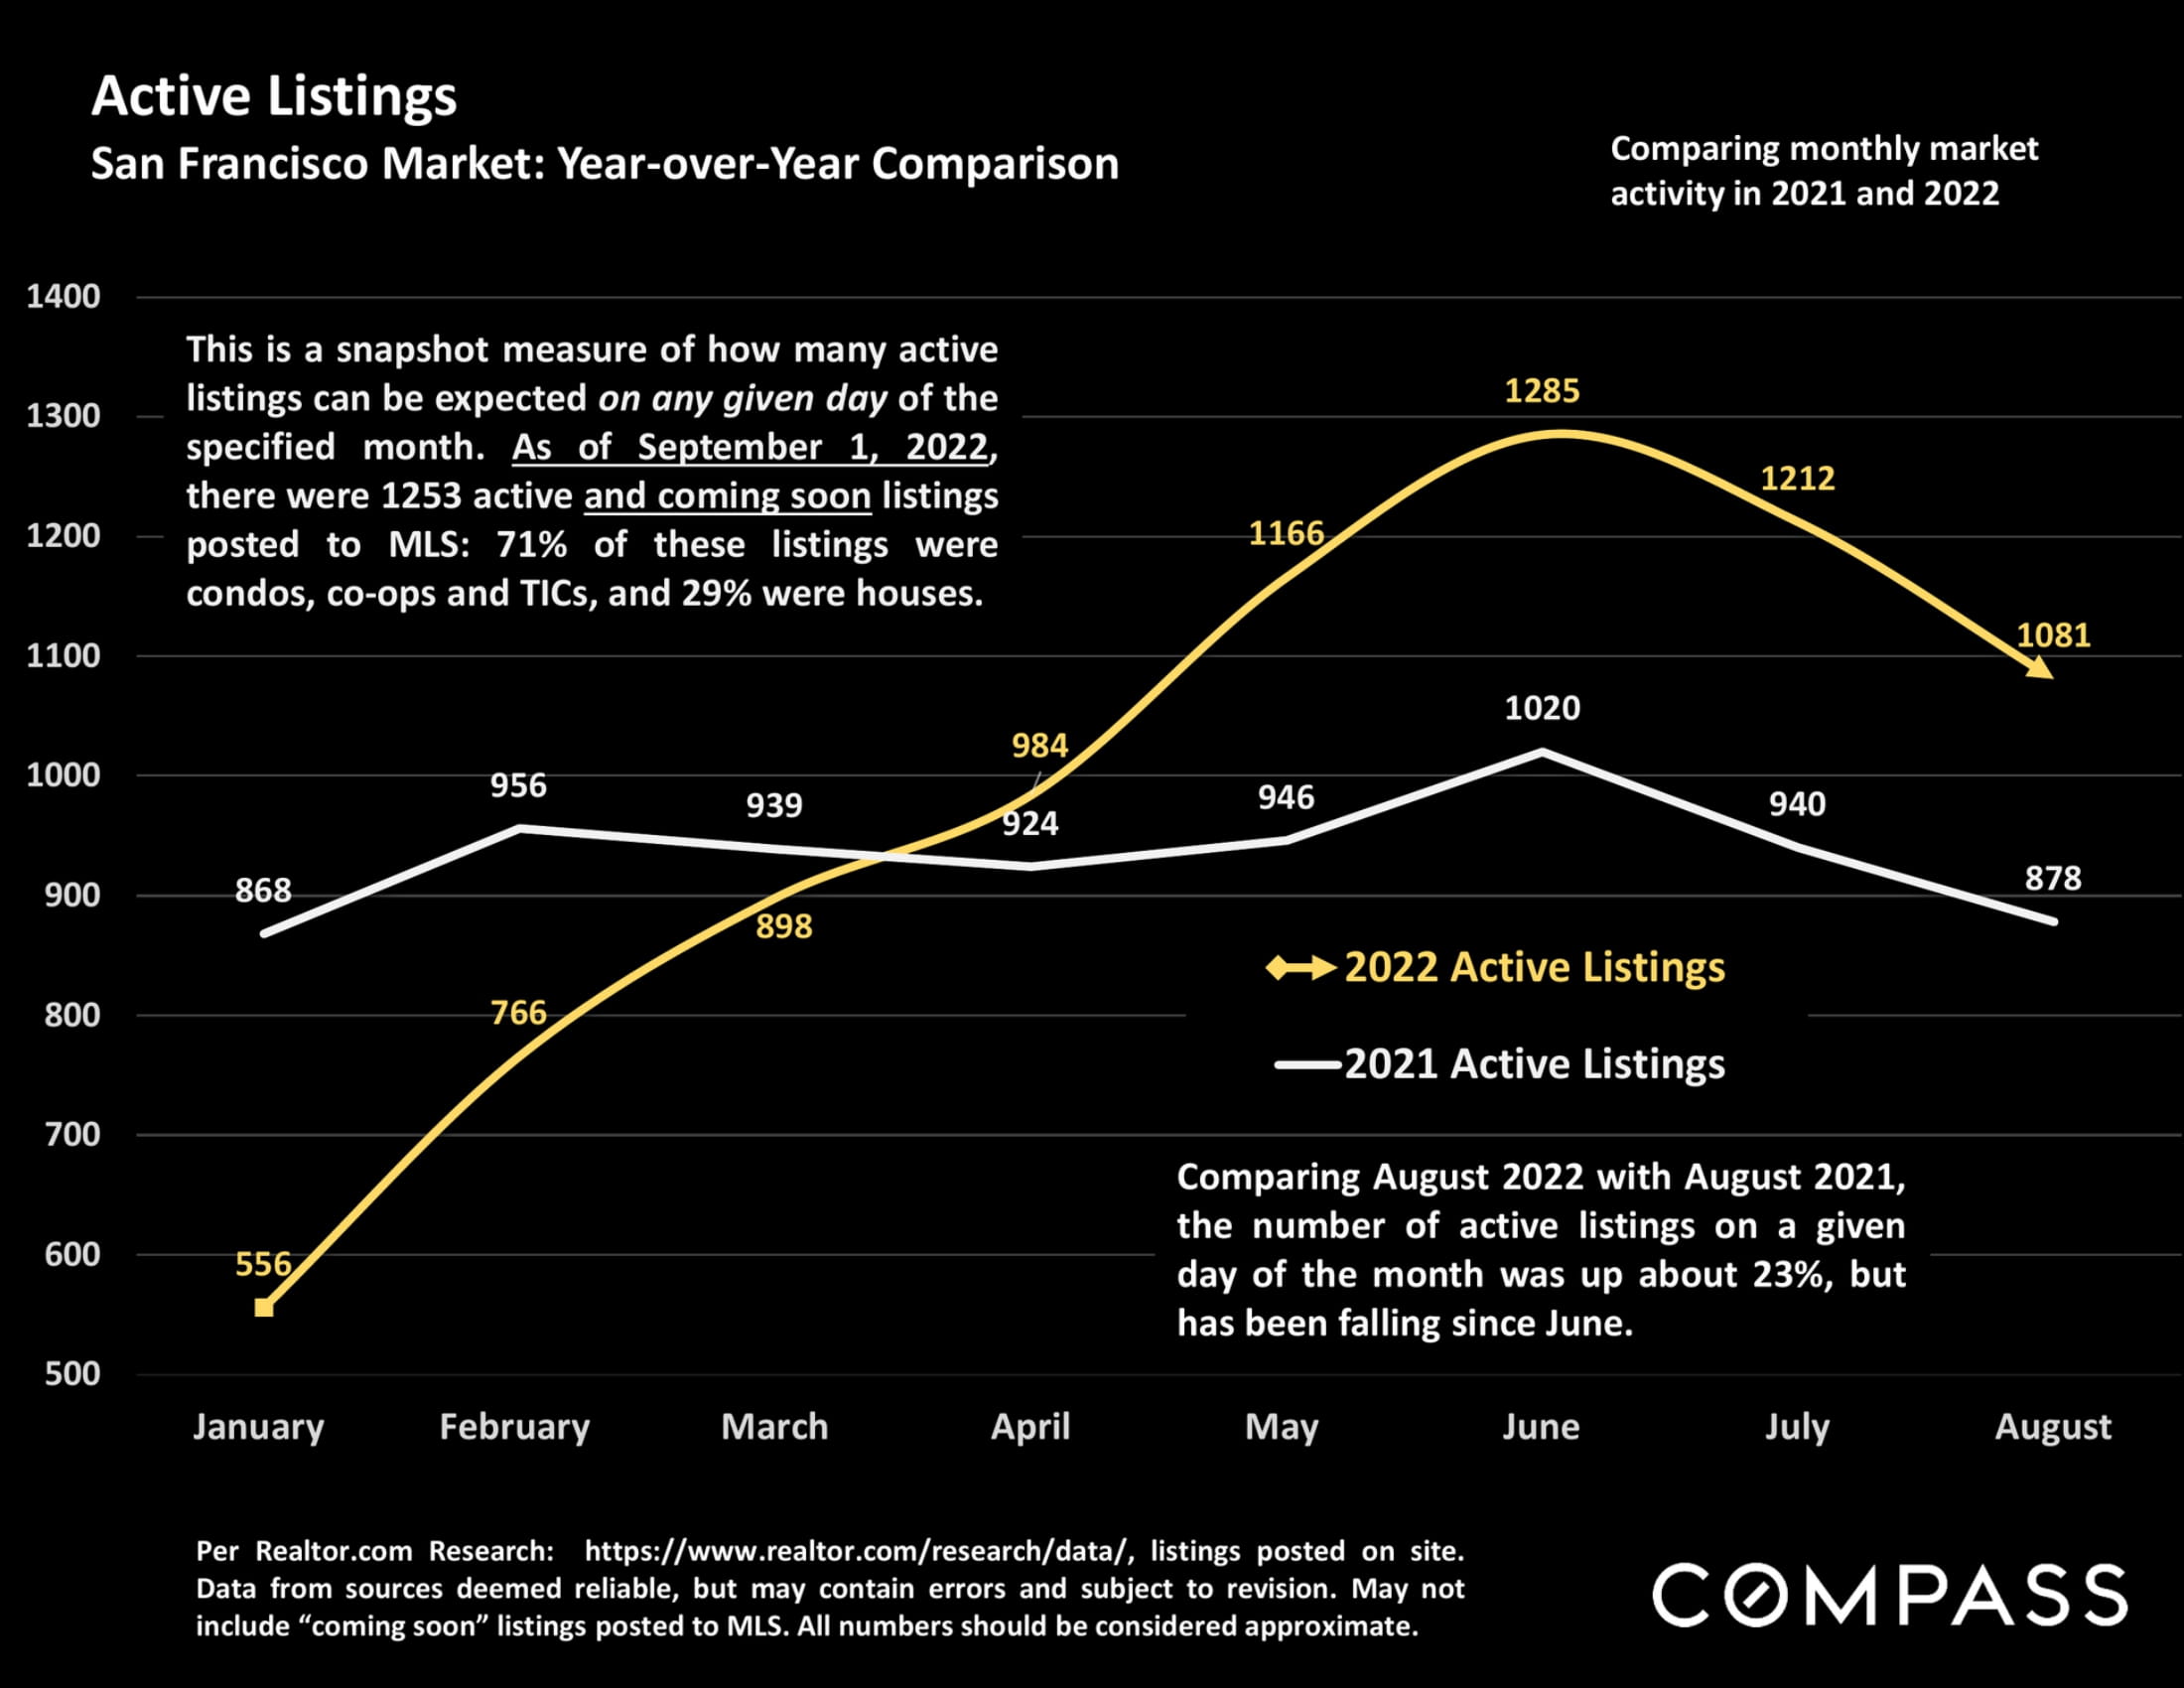
Chart comparing San Francisco active listings in 2021 and 2022, with 2022 peaking in June before declining.
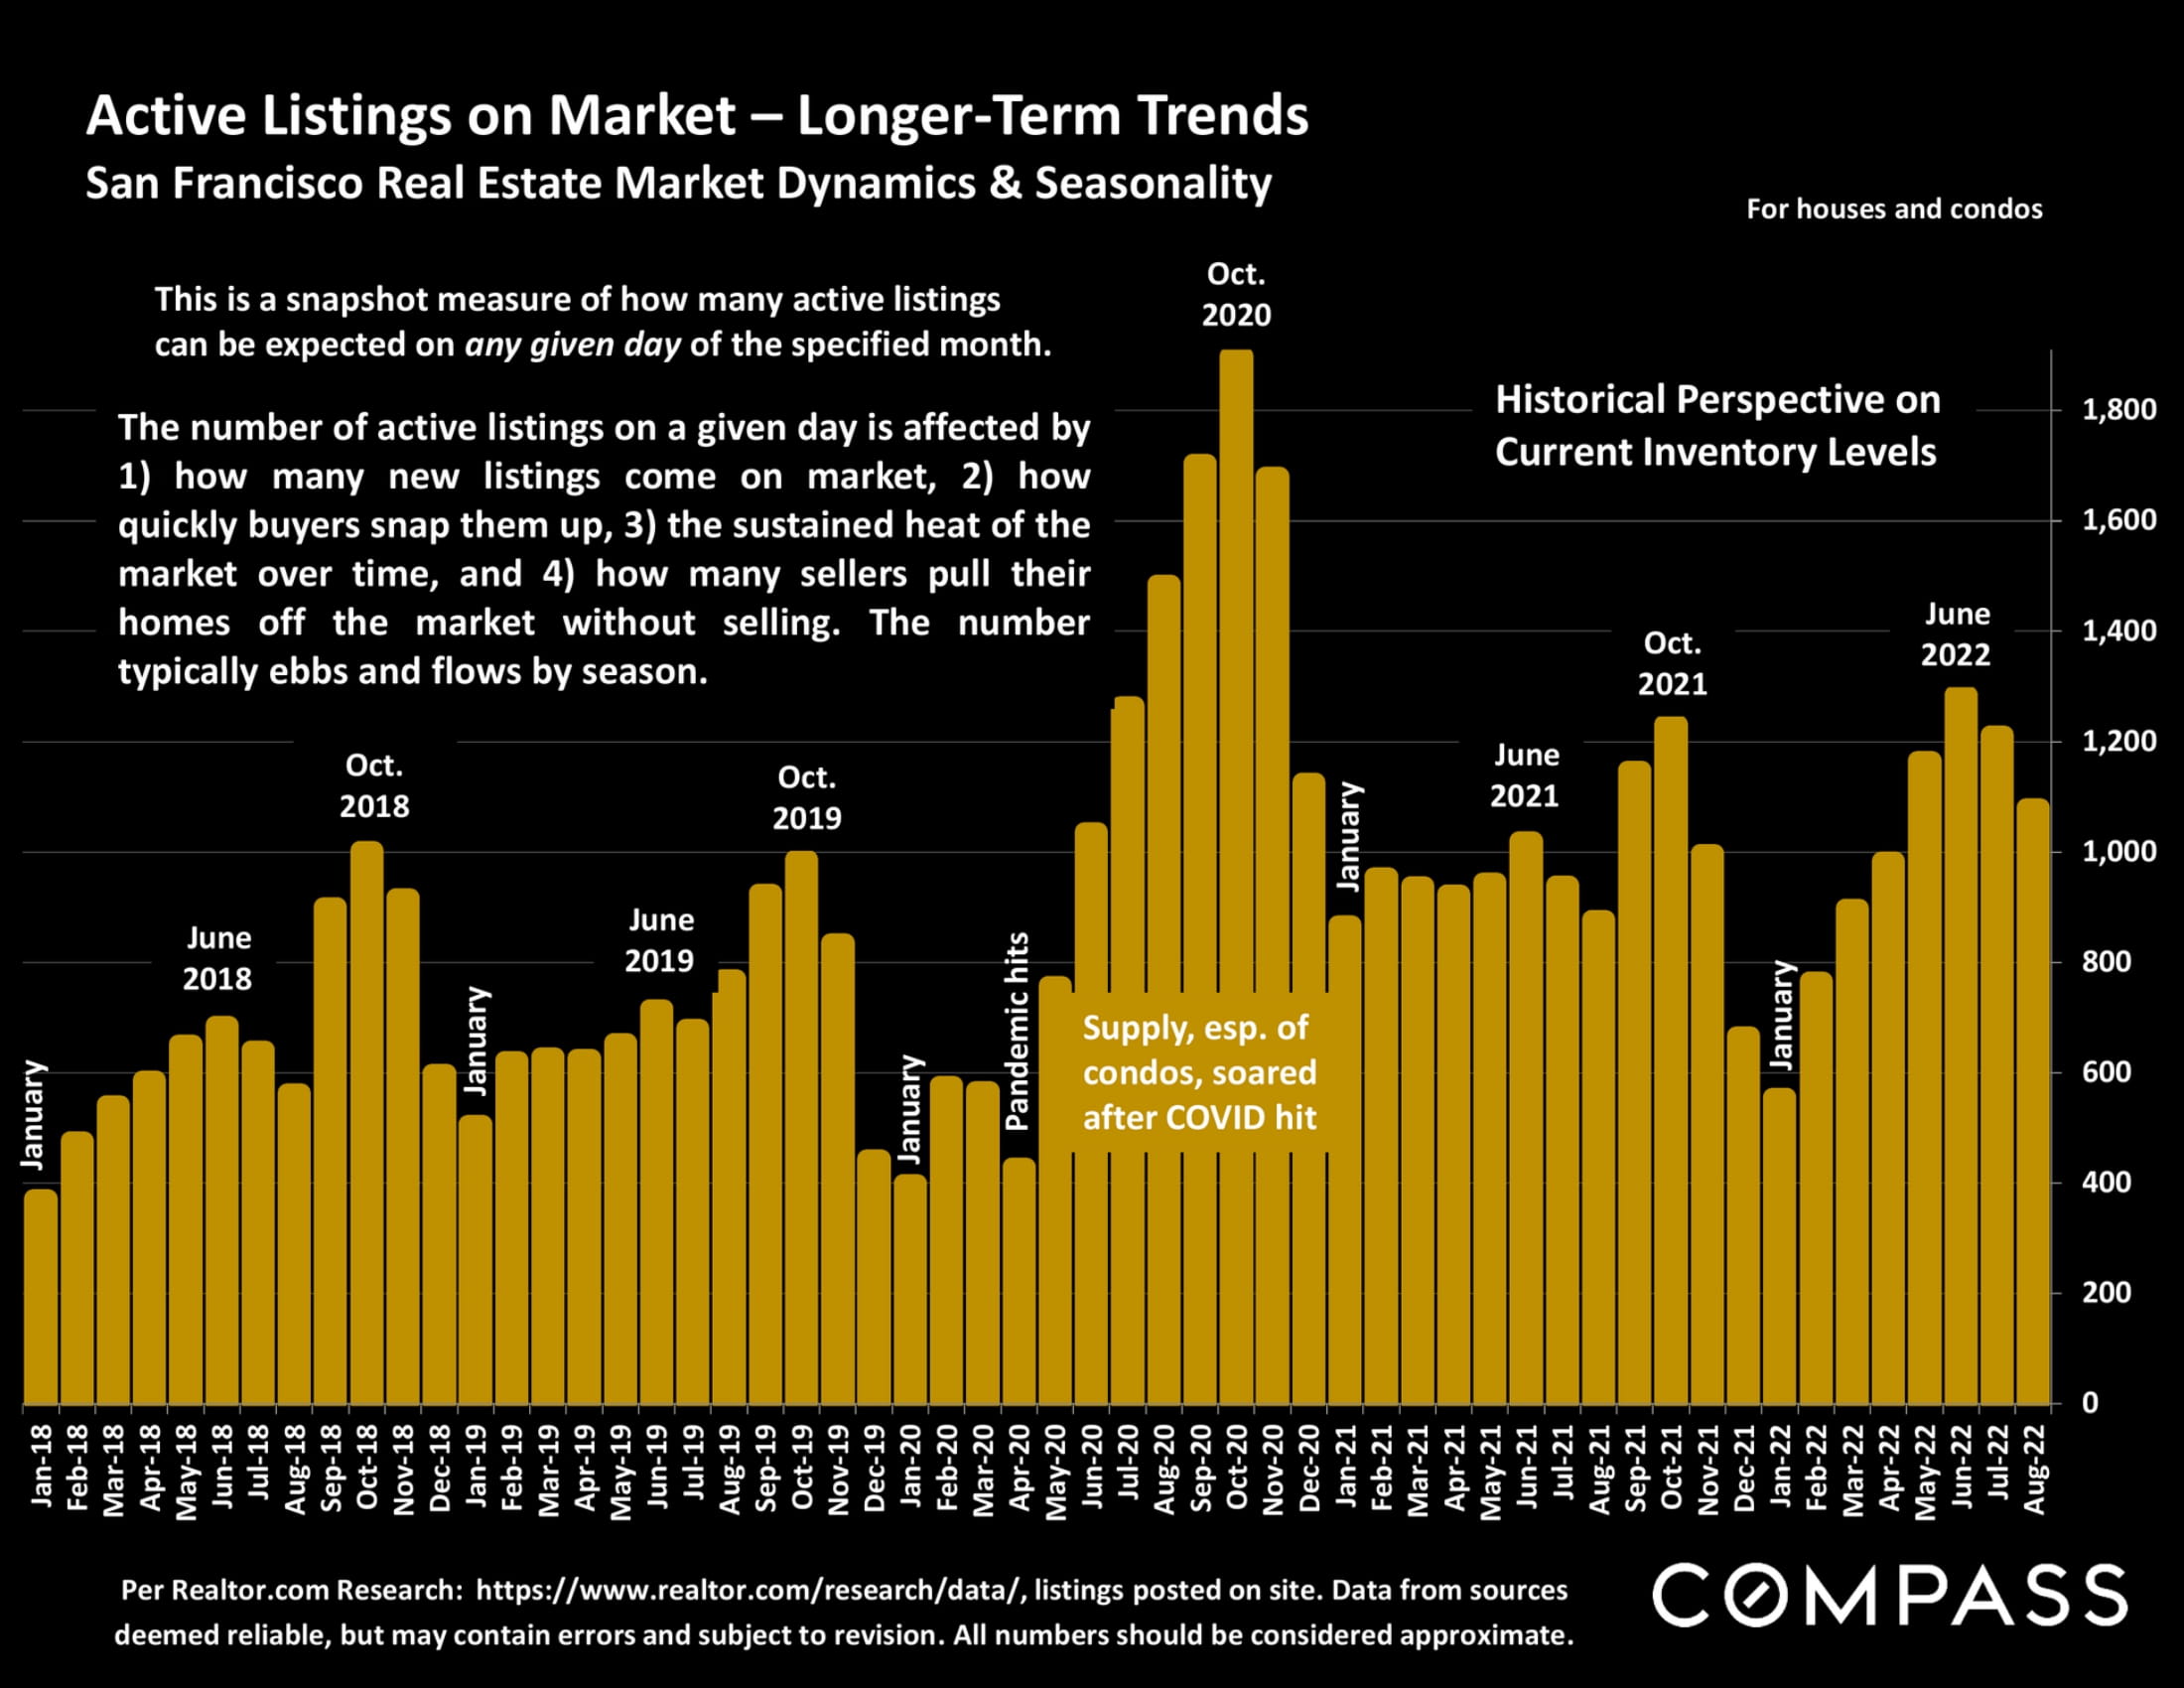
Infographic charting San Francisco active home listings from 2018 to 2022, with a pandemic-era inventory spike.
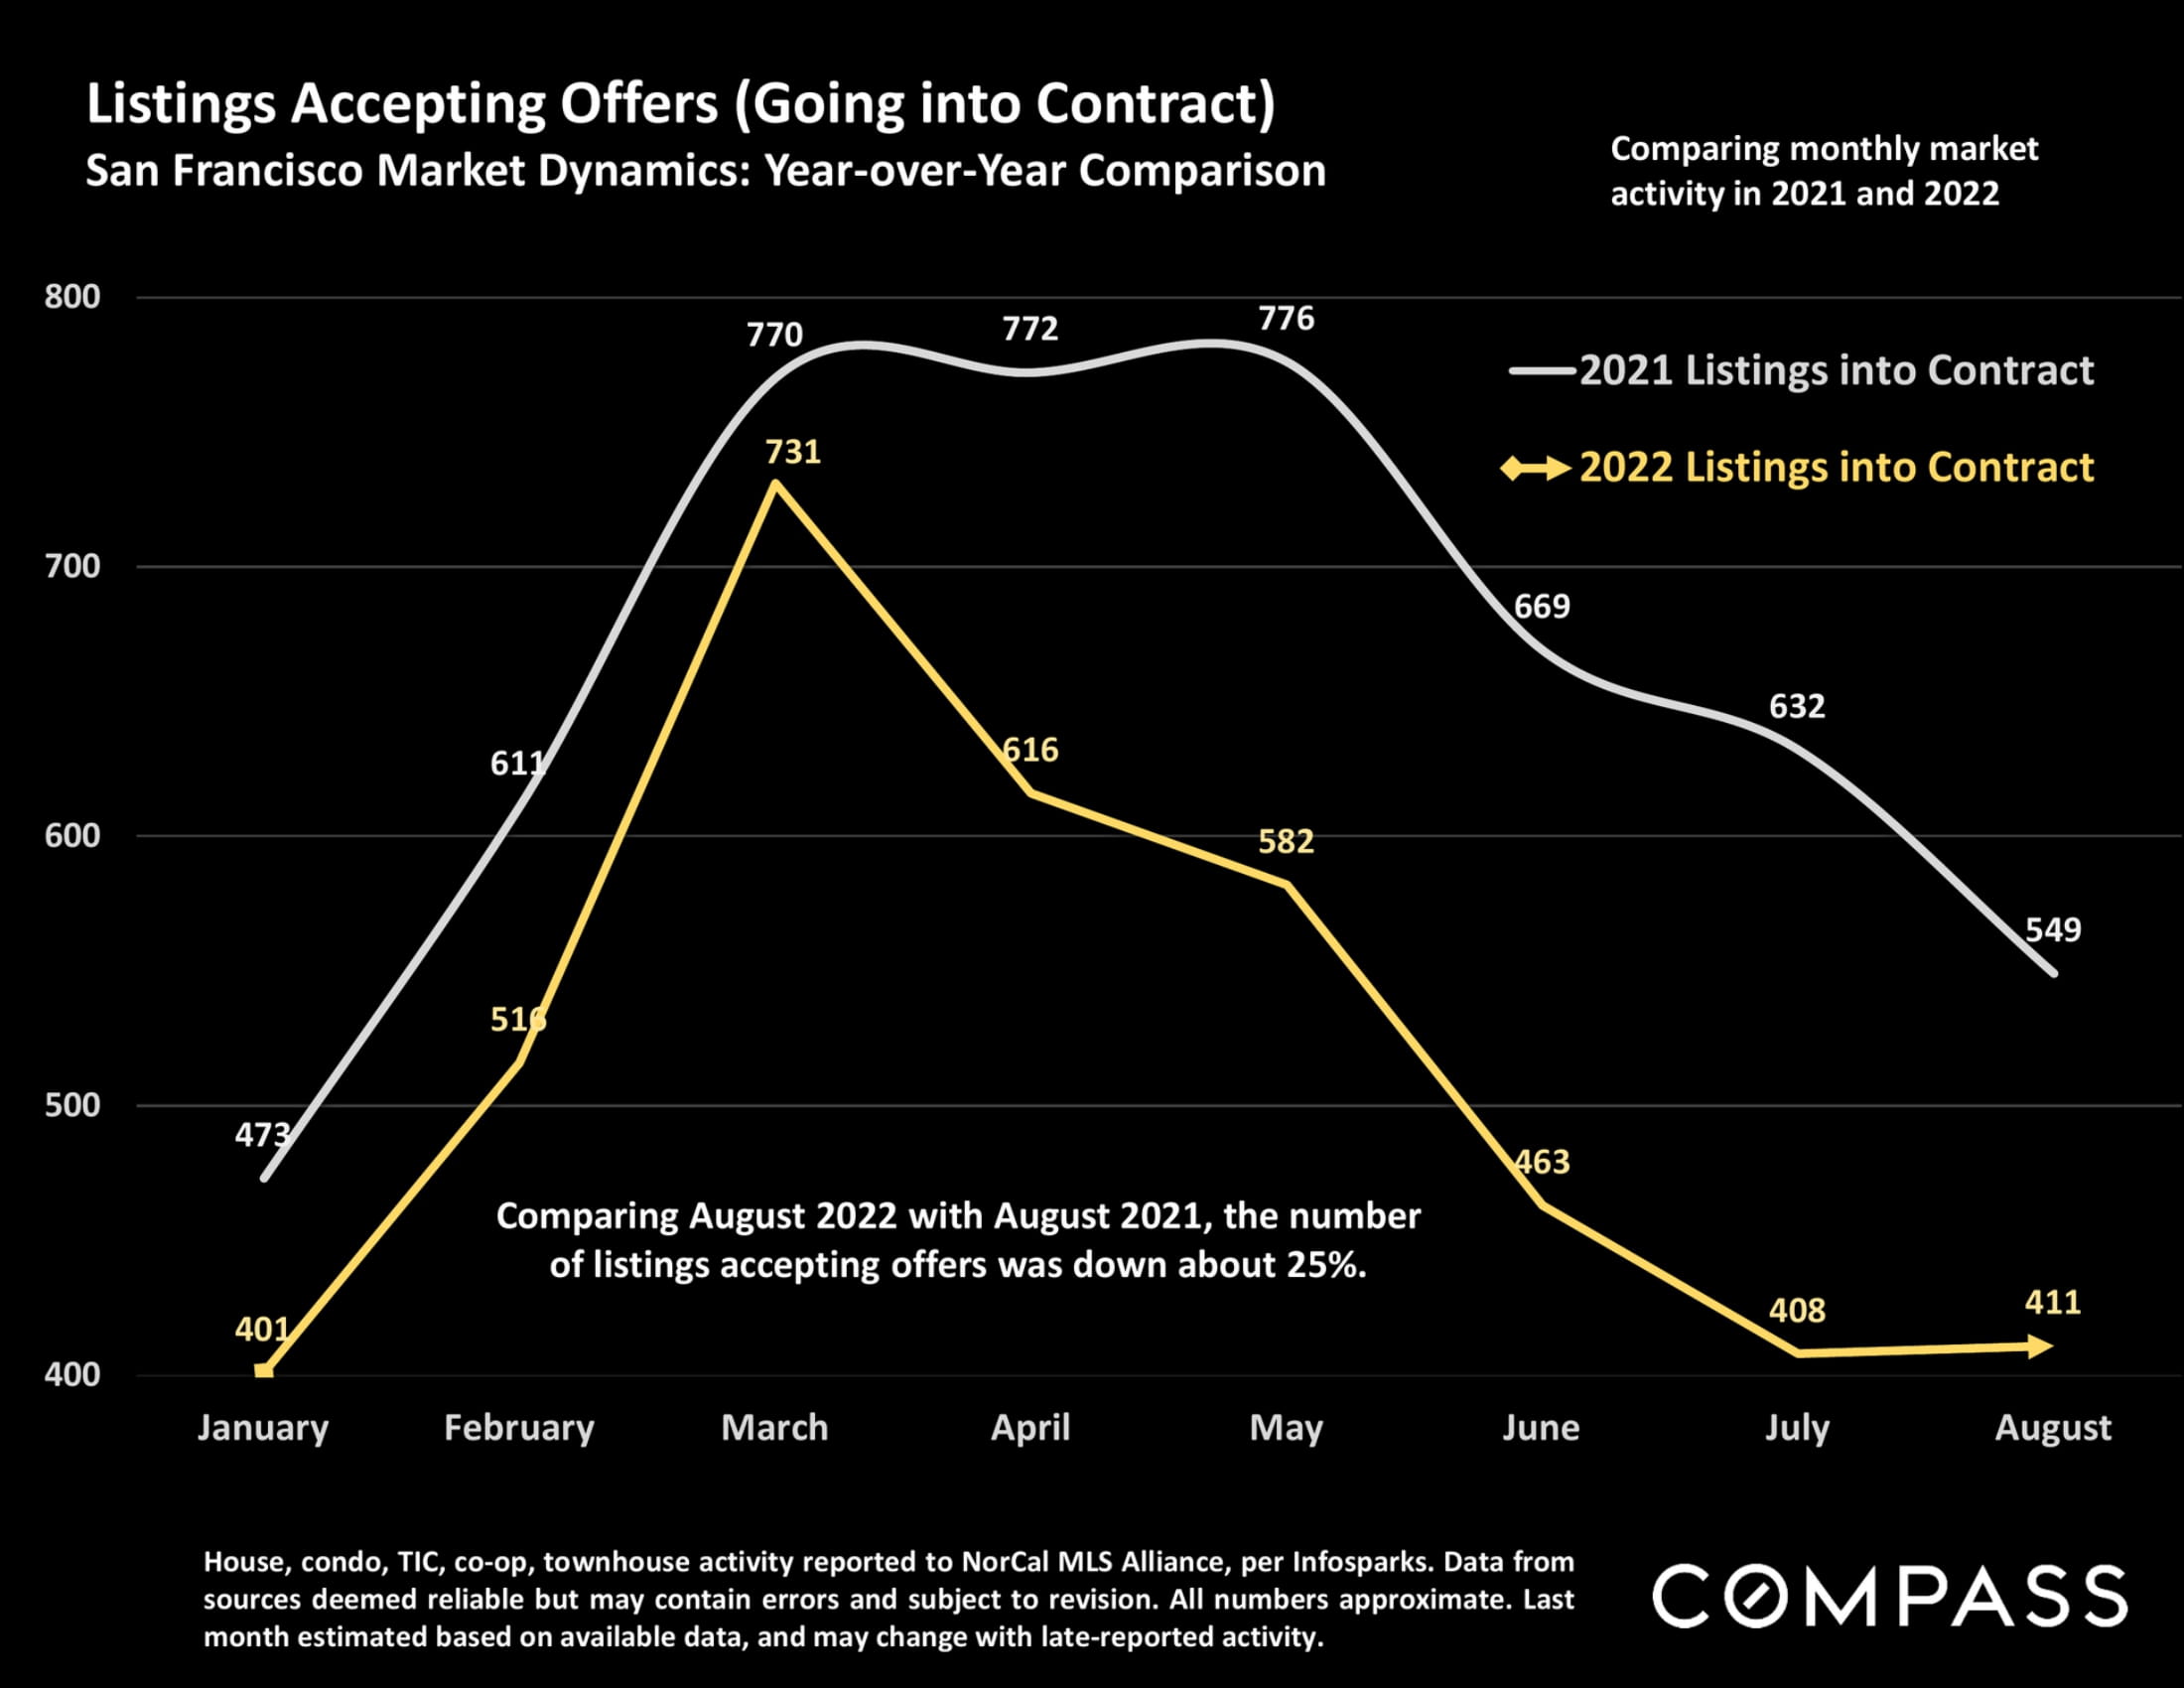
Line chart compares San Francisco listings accepting offers in 2021 and 2022, showing a 25% August decline.
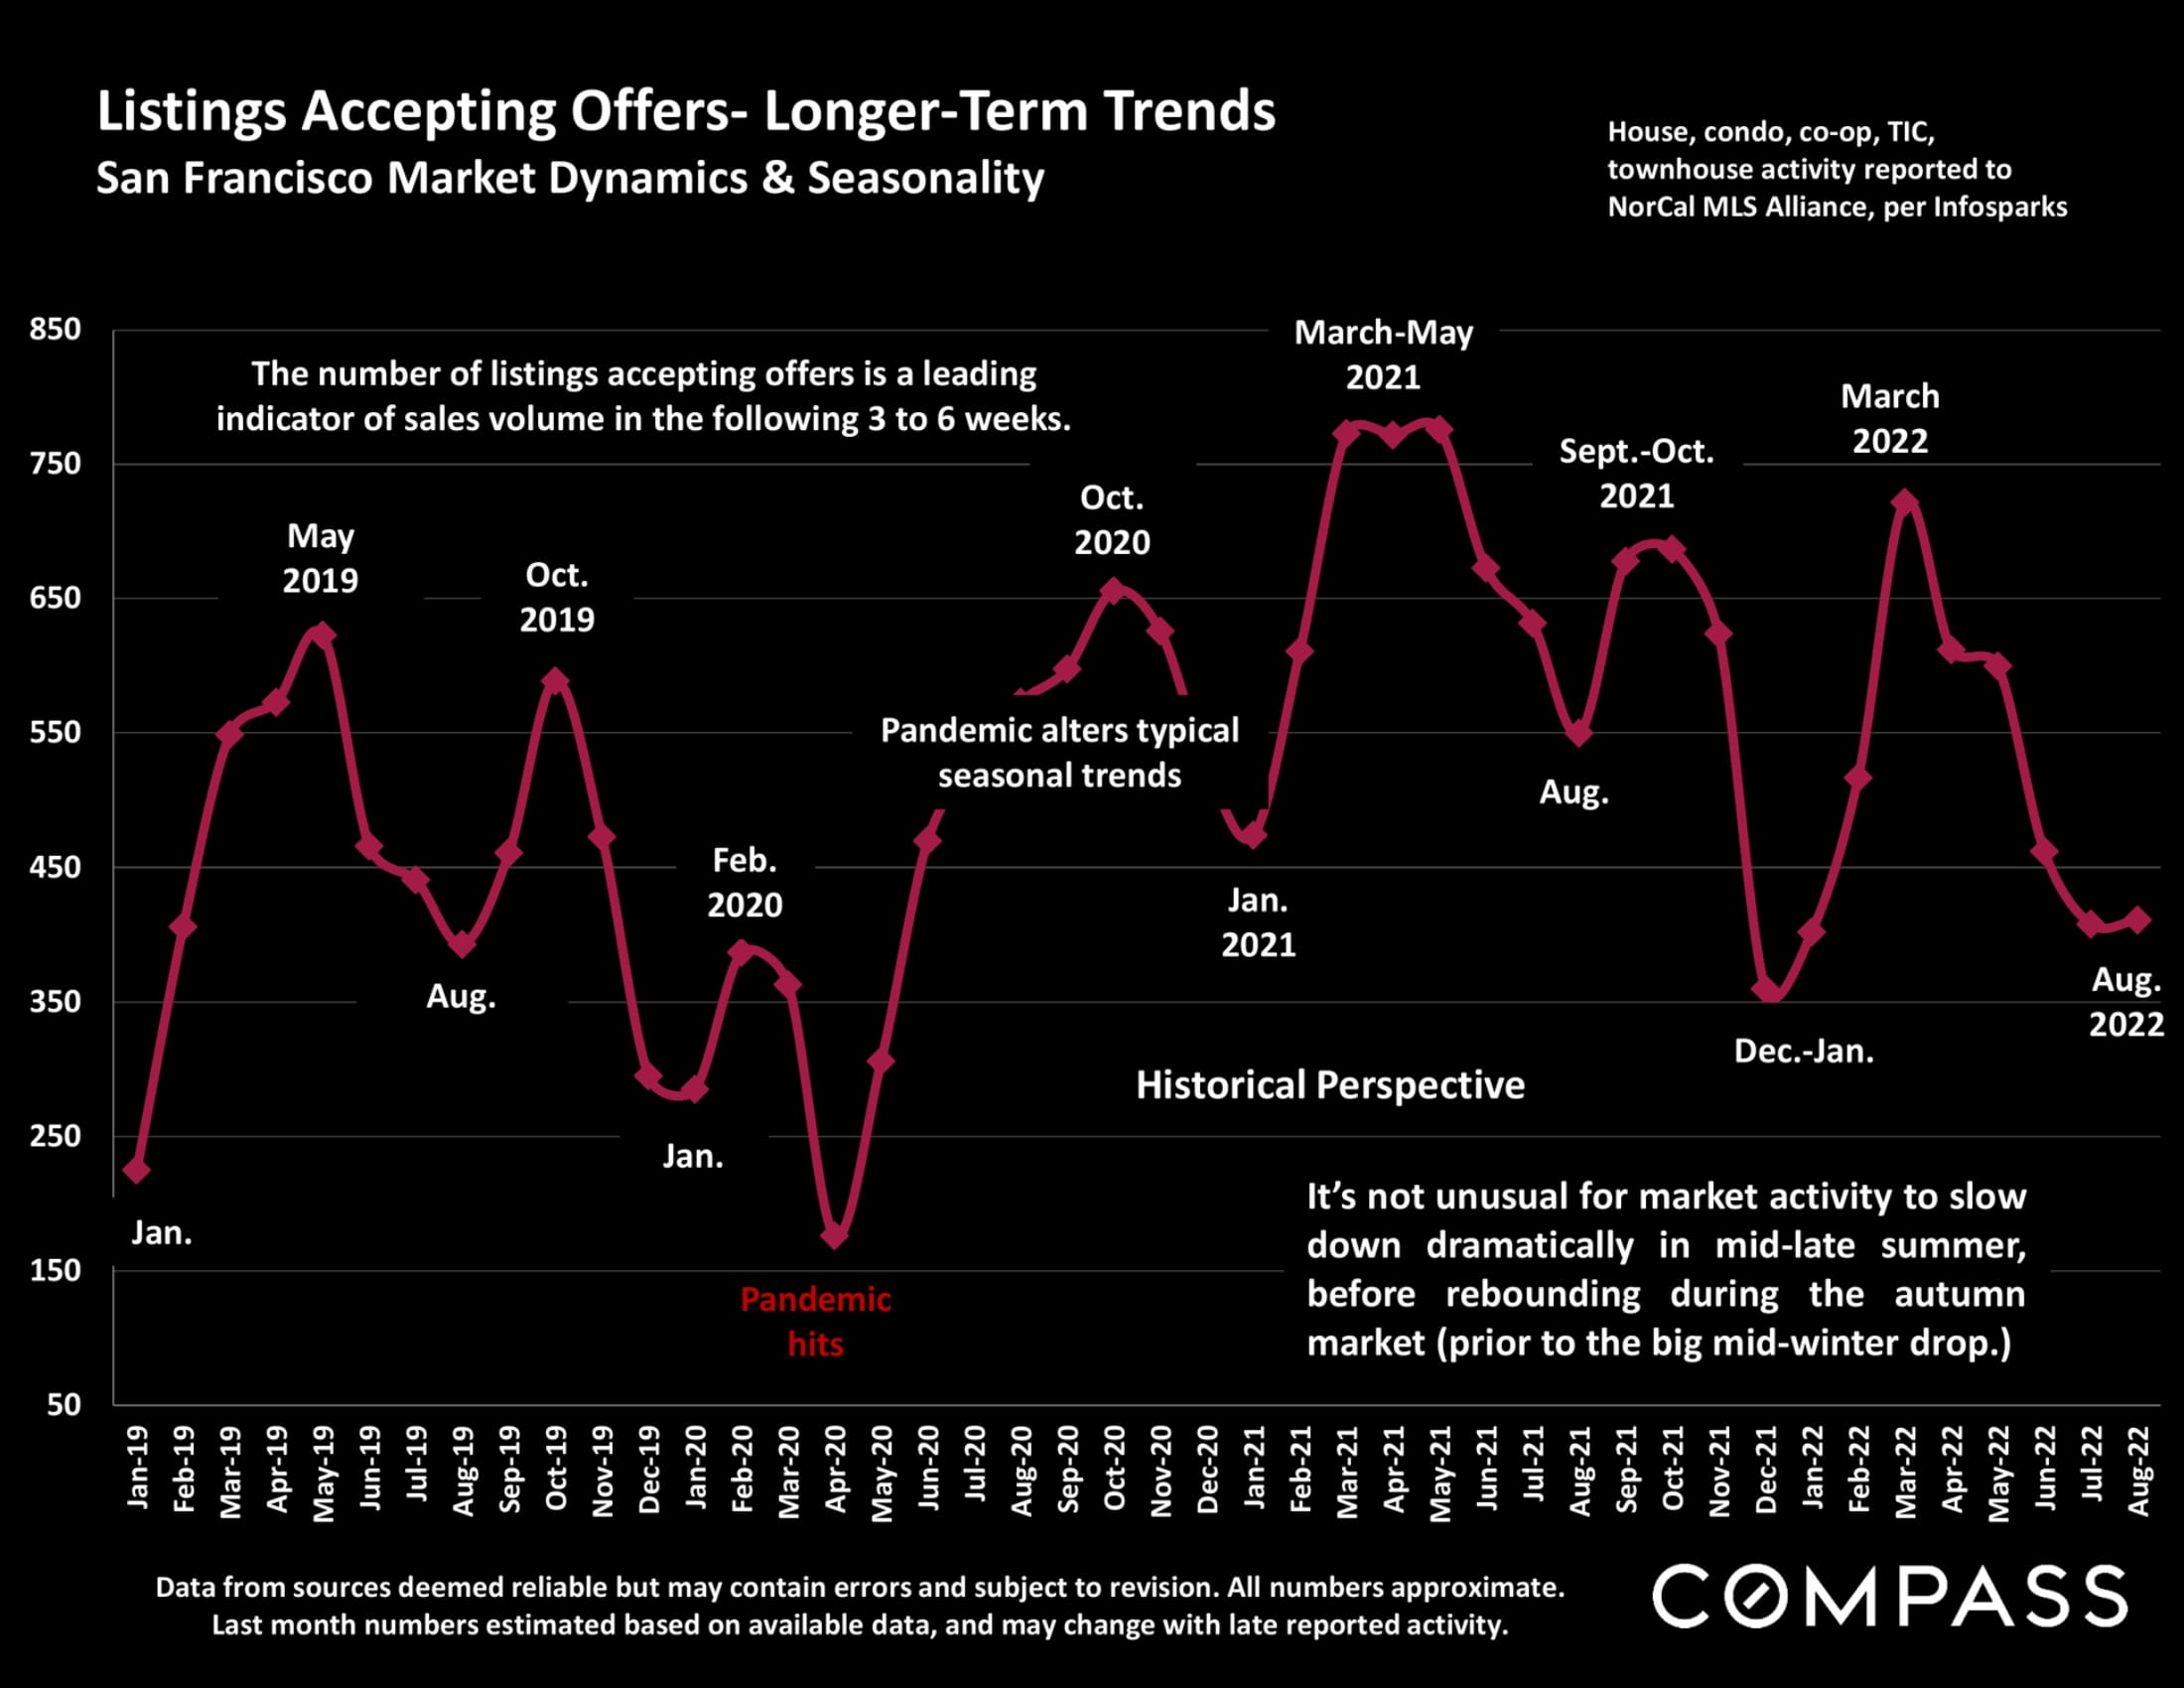
Chart of San Francisco listings accepting offers, showing monthly trends from January 2019 through August 2022.
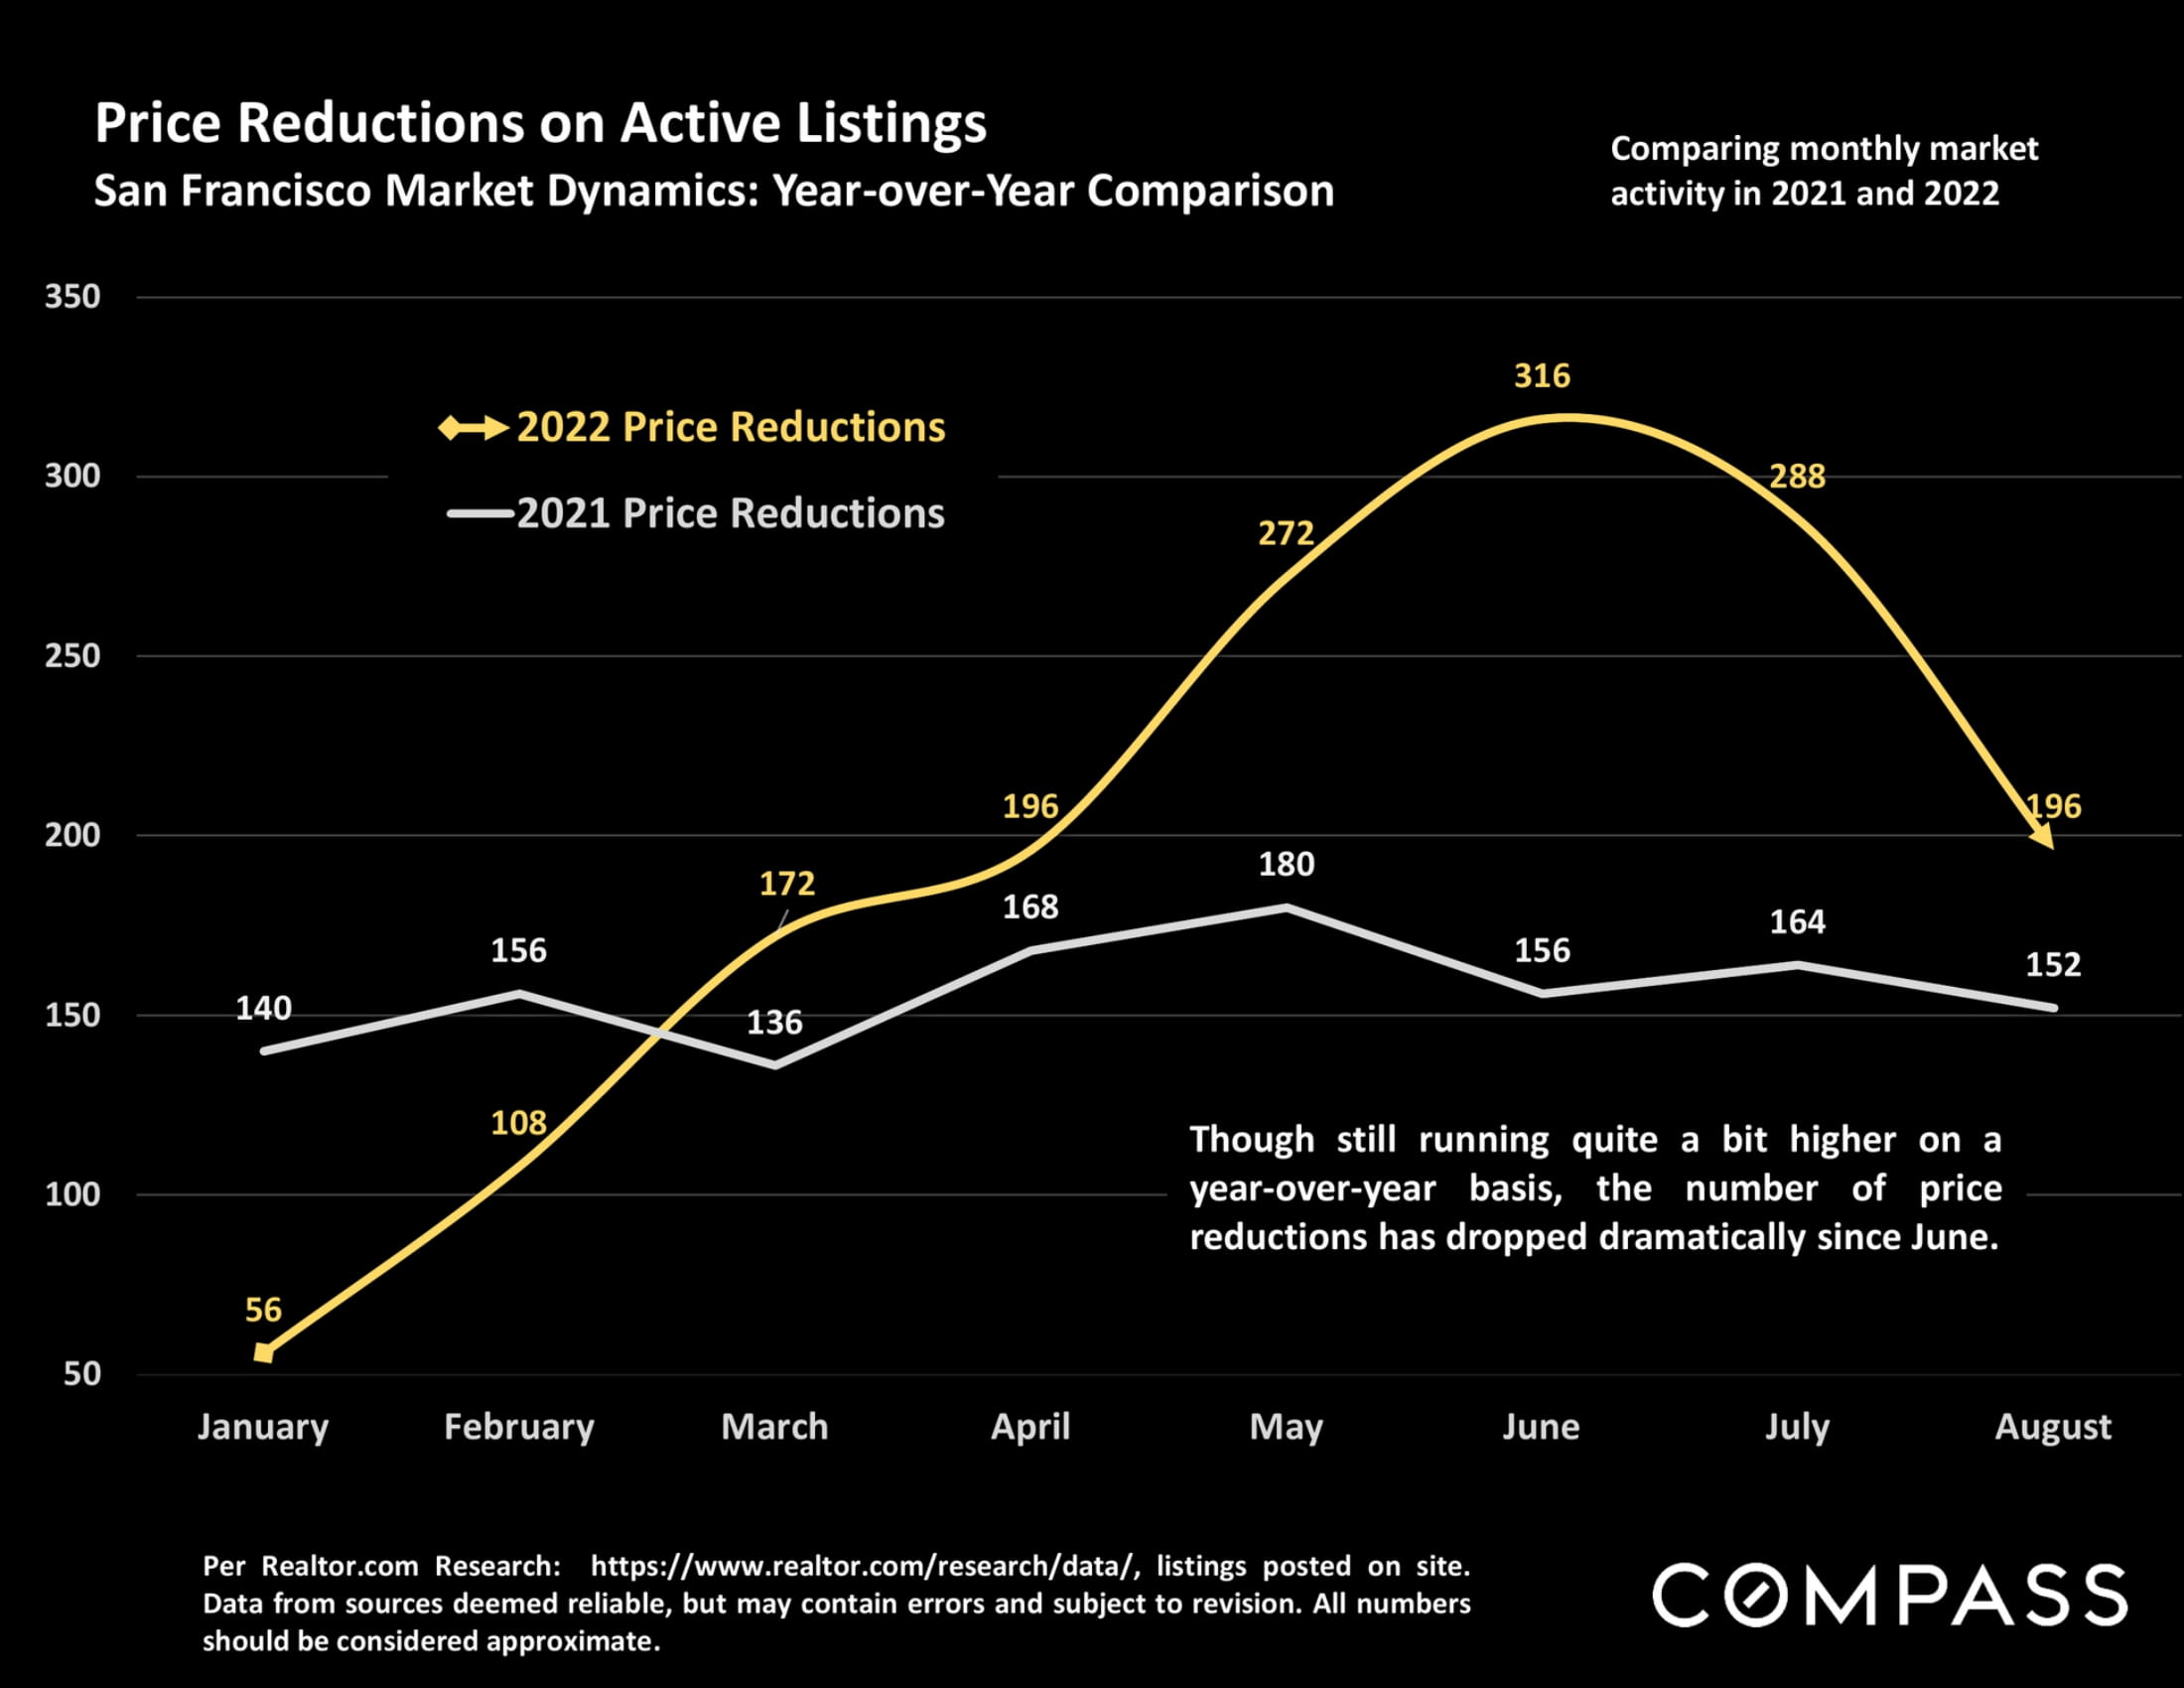
Line chart comparing monthly San Francisco listing price reductions in 2021 and 2022, with 2022 peaking in June.
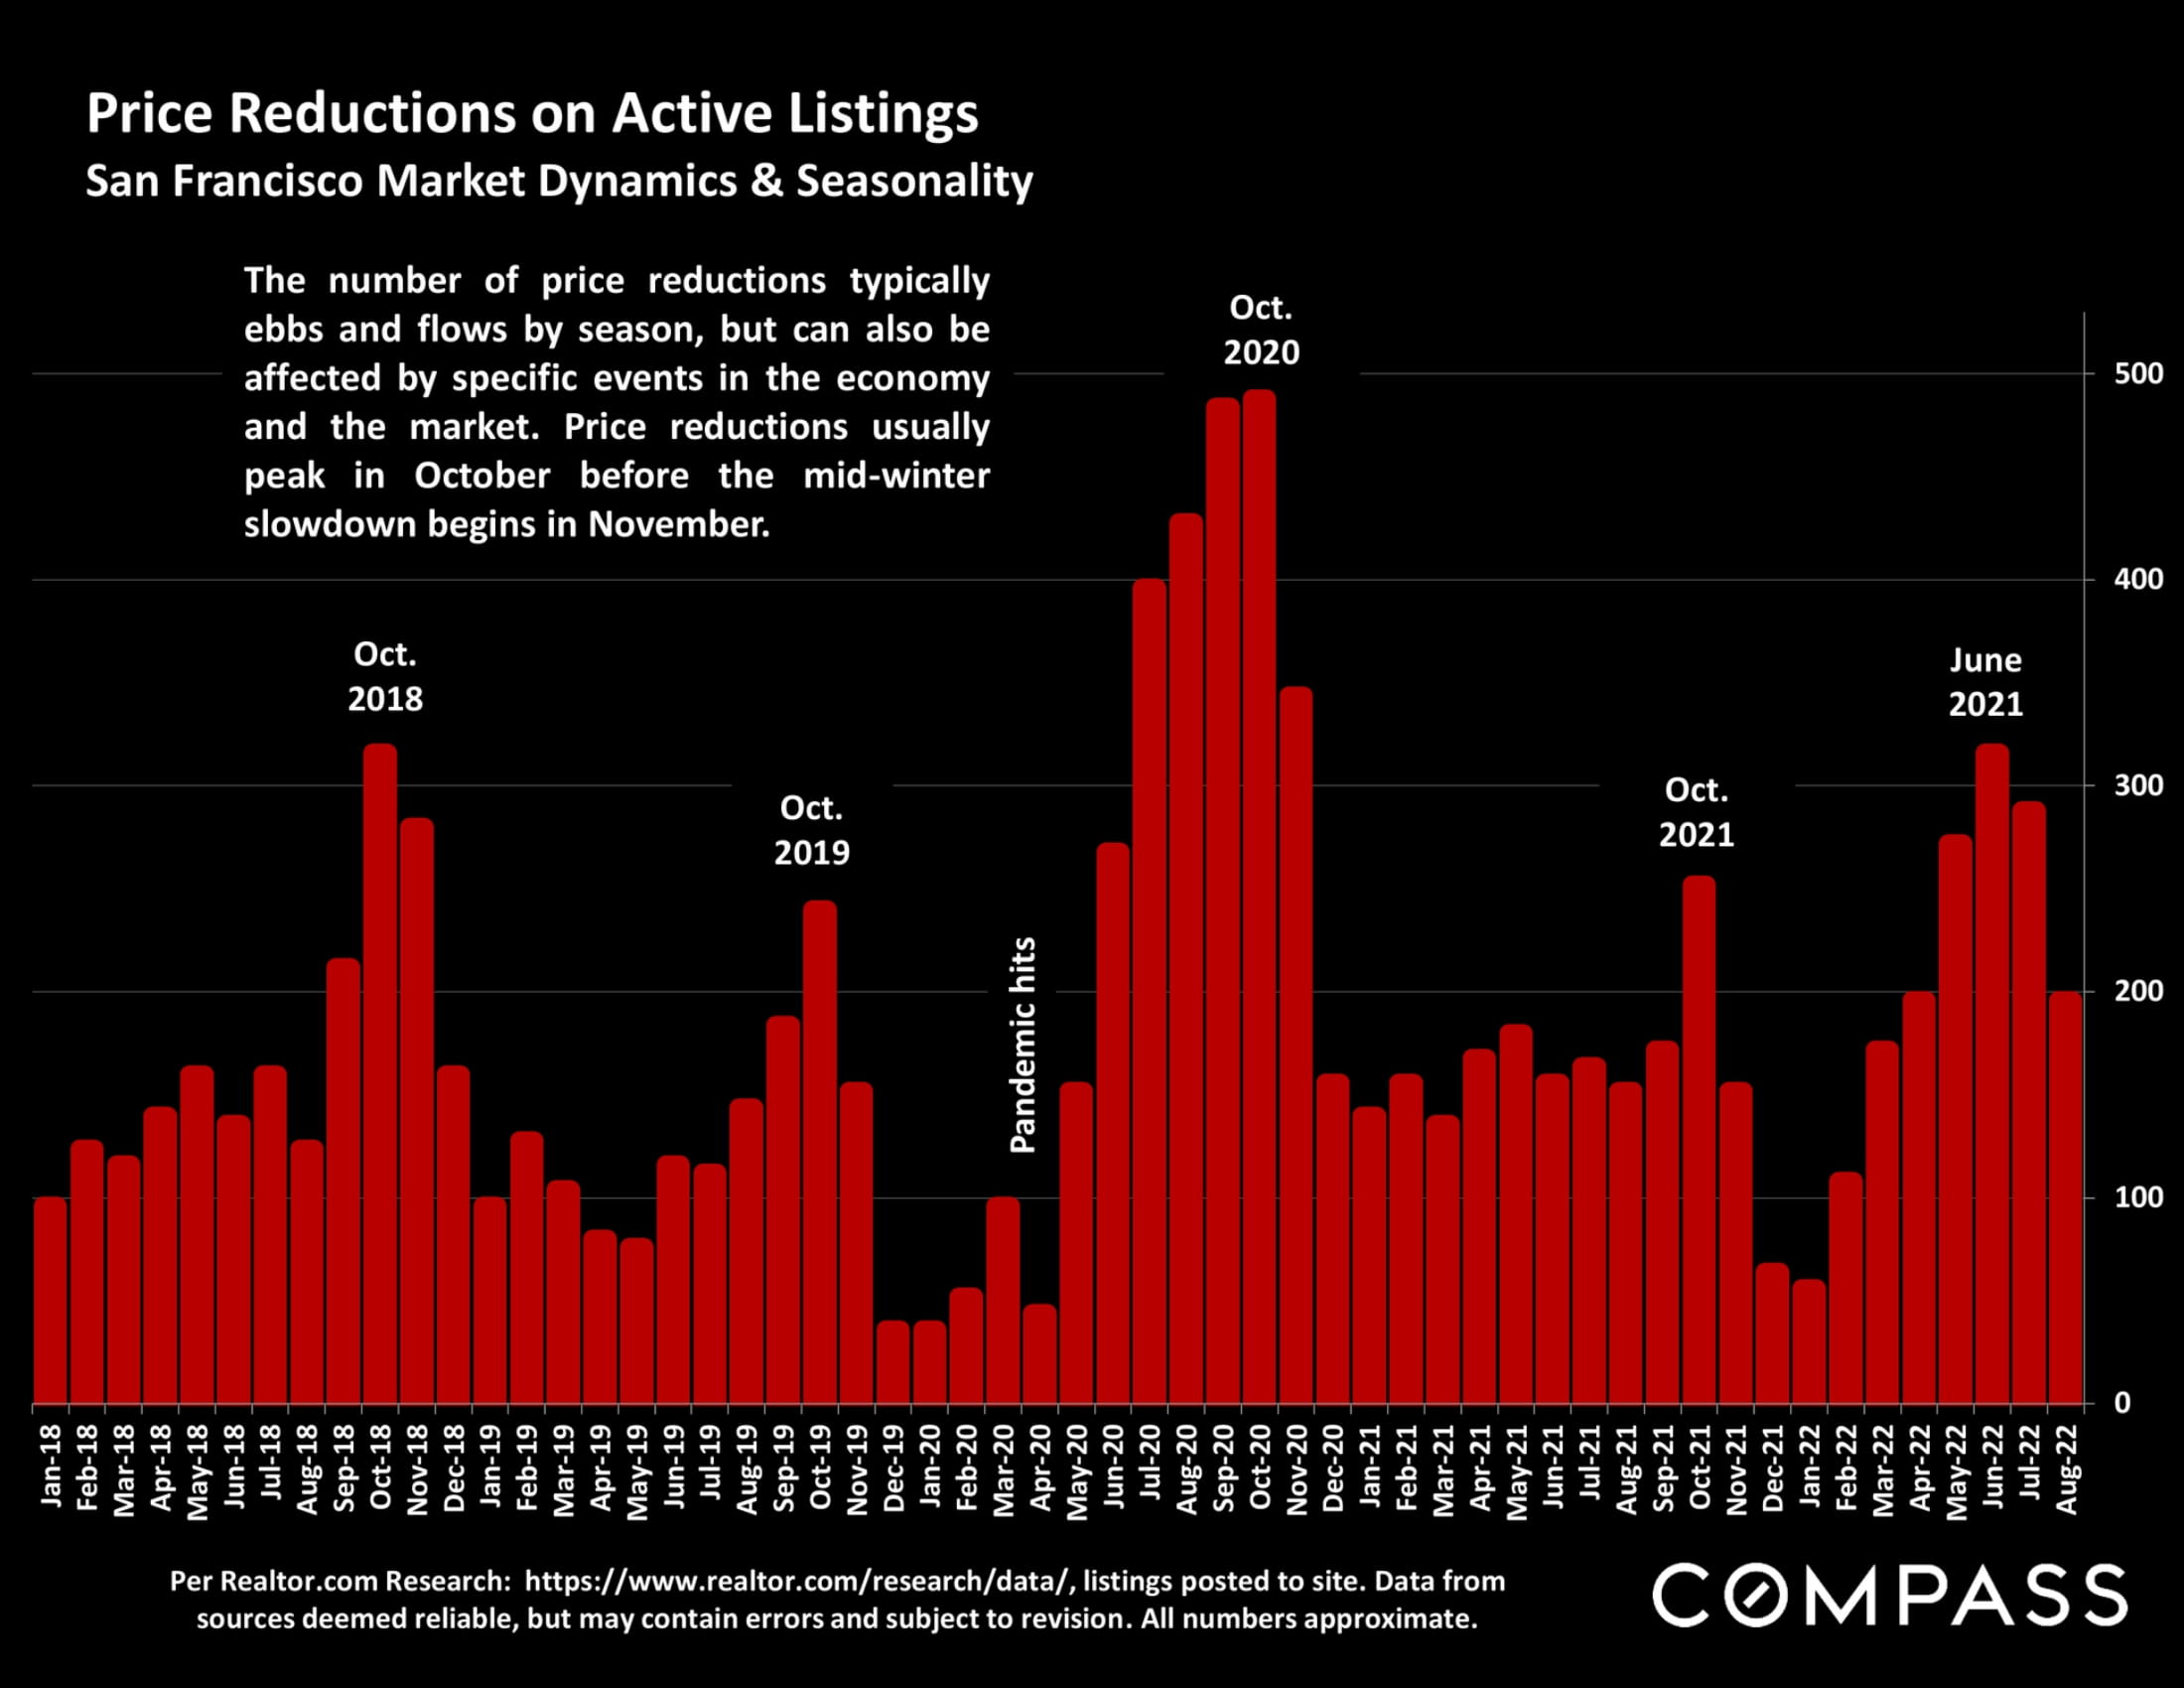
Chart of monthly San Francisco listing price reductions from 2018 to 2022, with a prominent October 2020 peak.
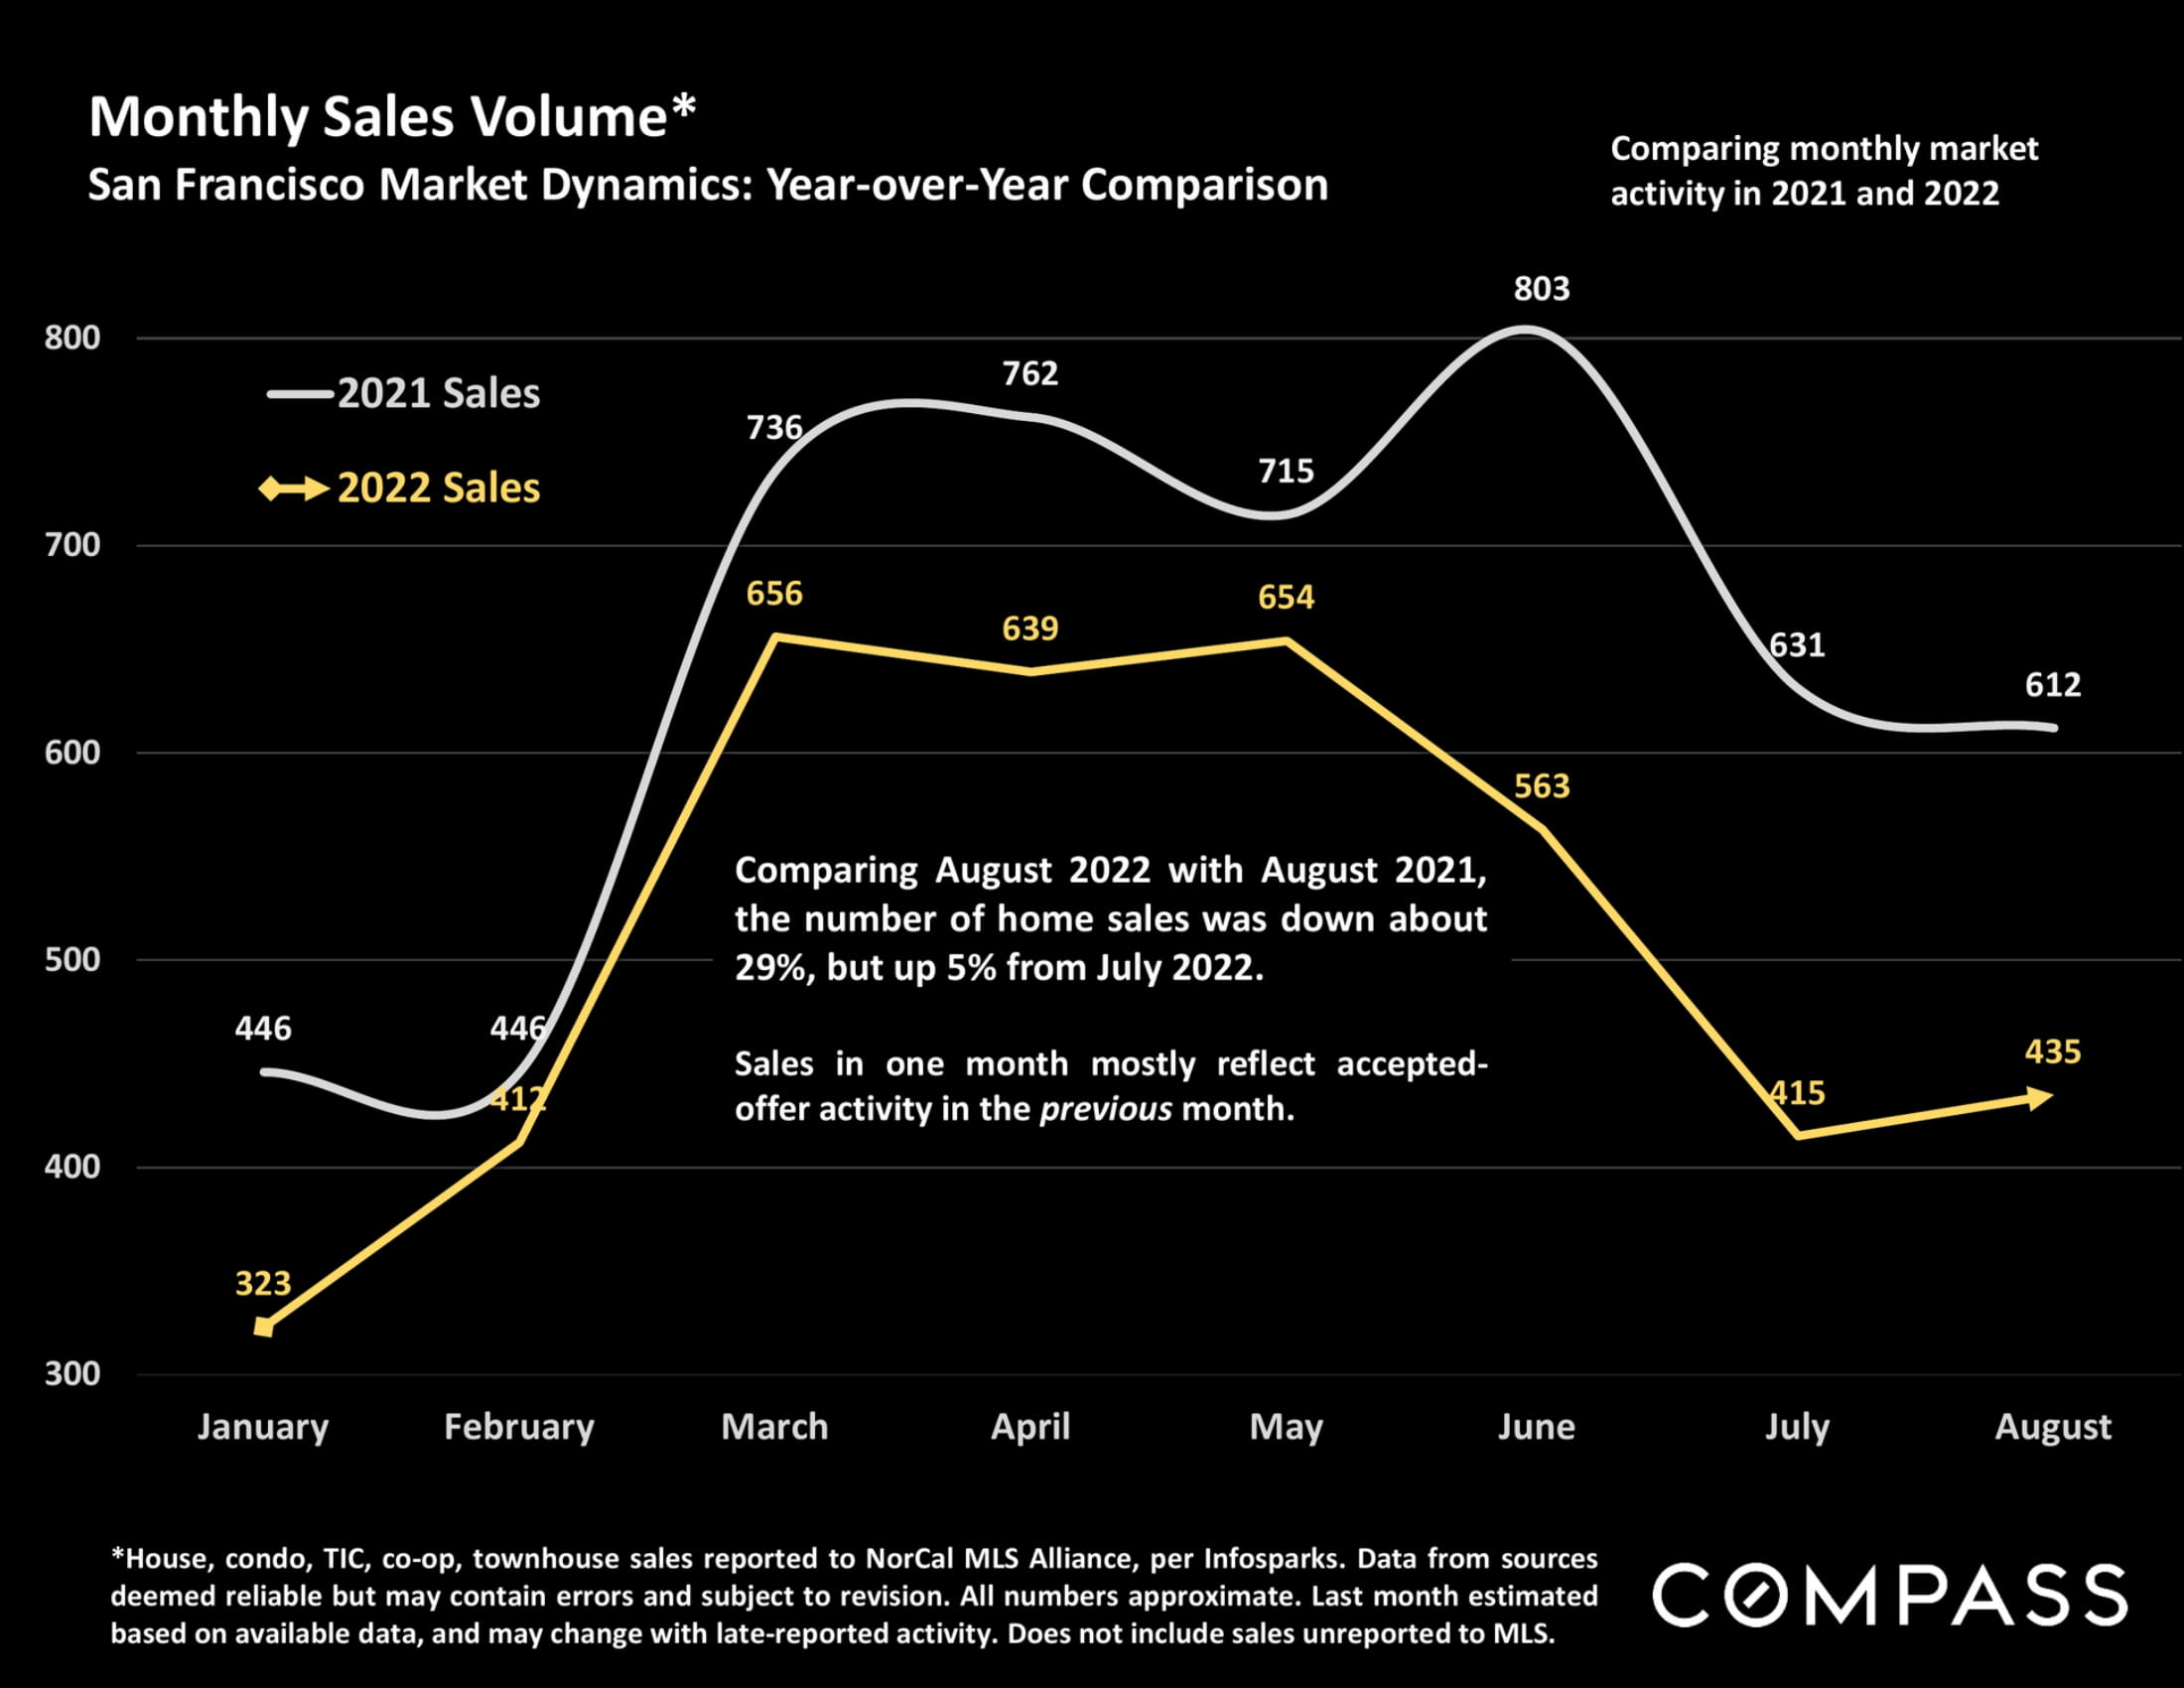
Chart compares San Francisco monthly home sales in 2021 and 2022; August sales were 612 and 435, respectively.
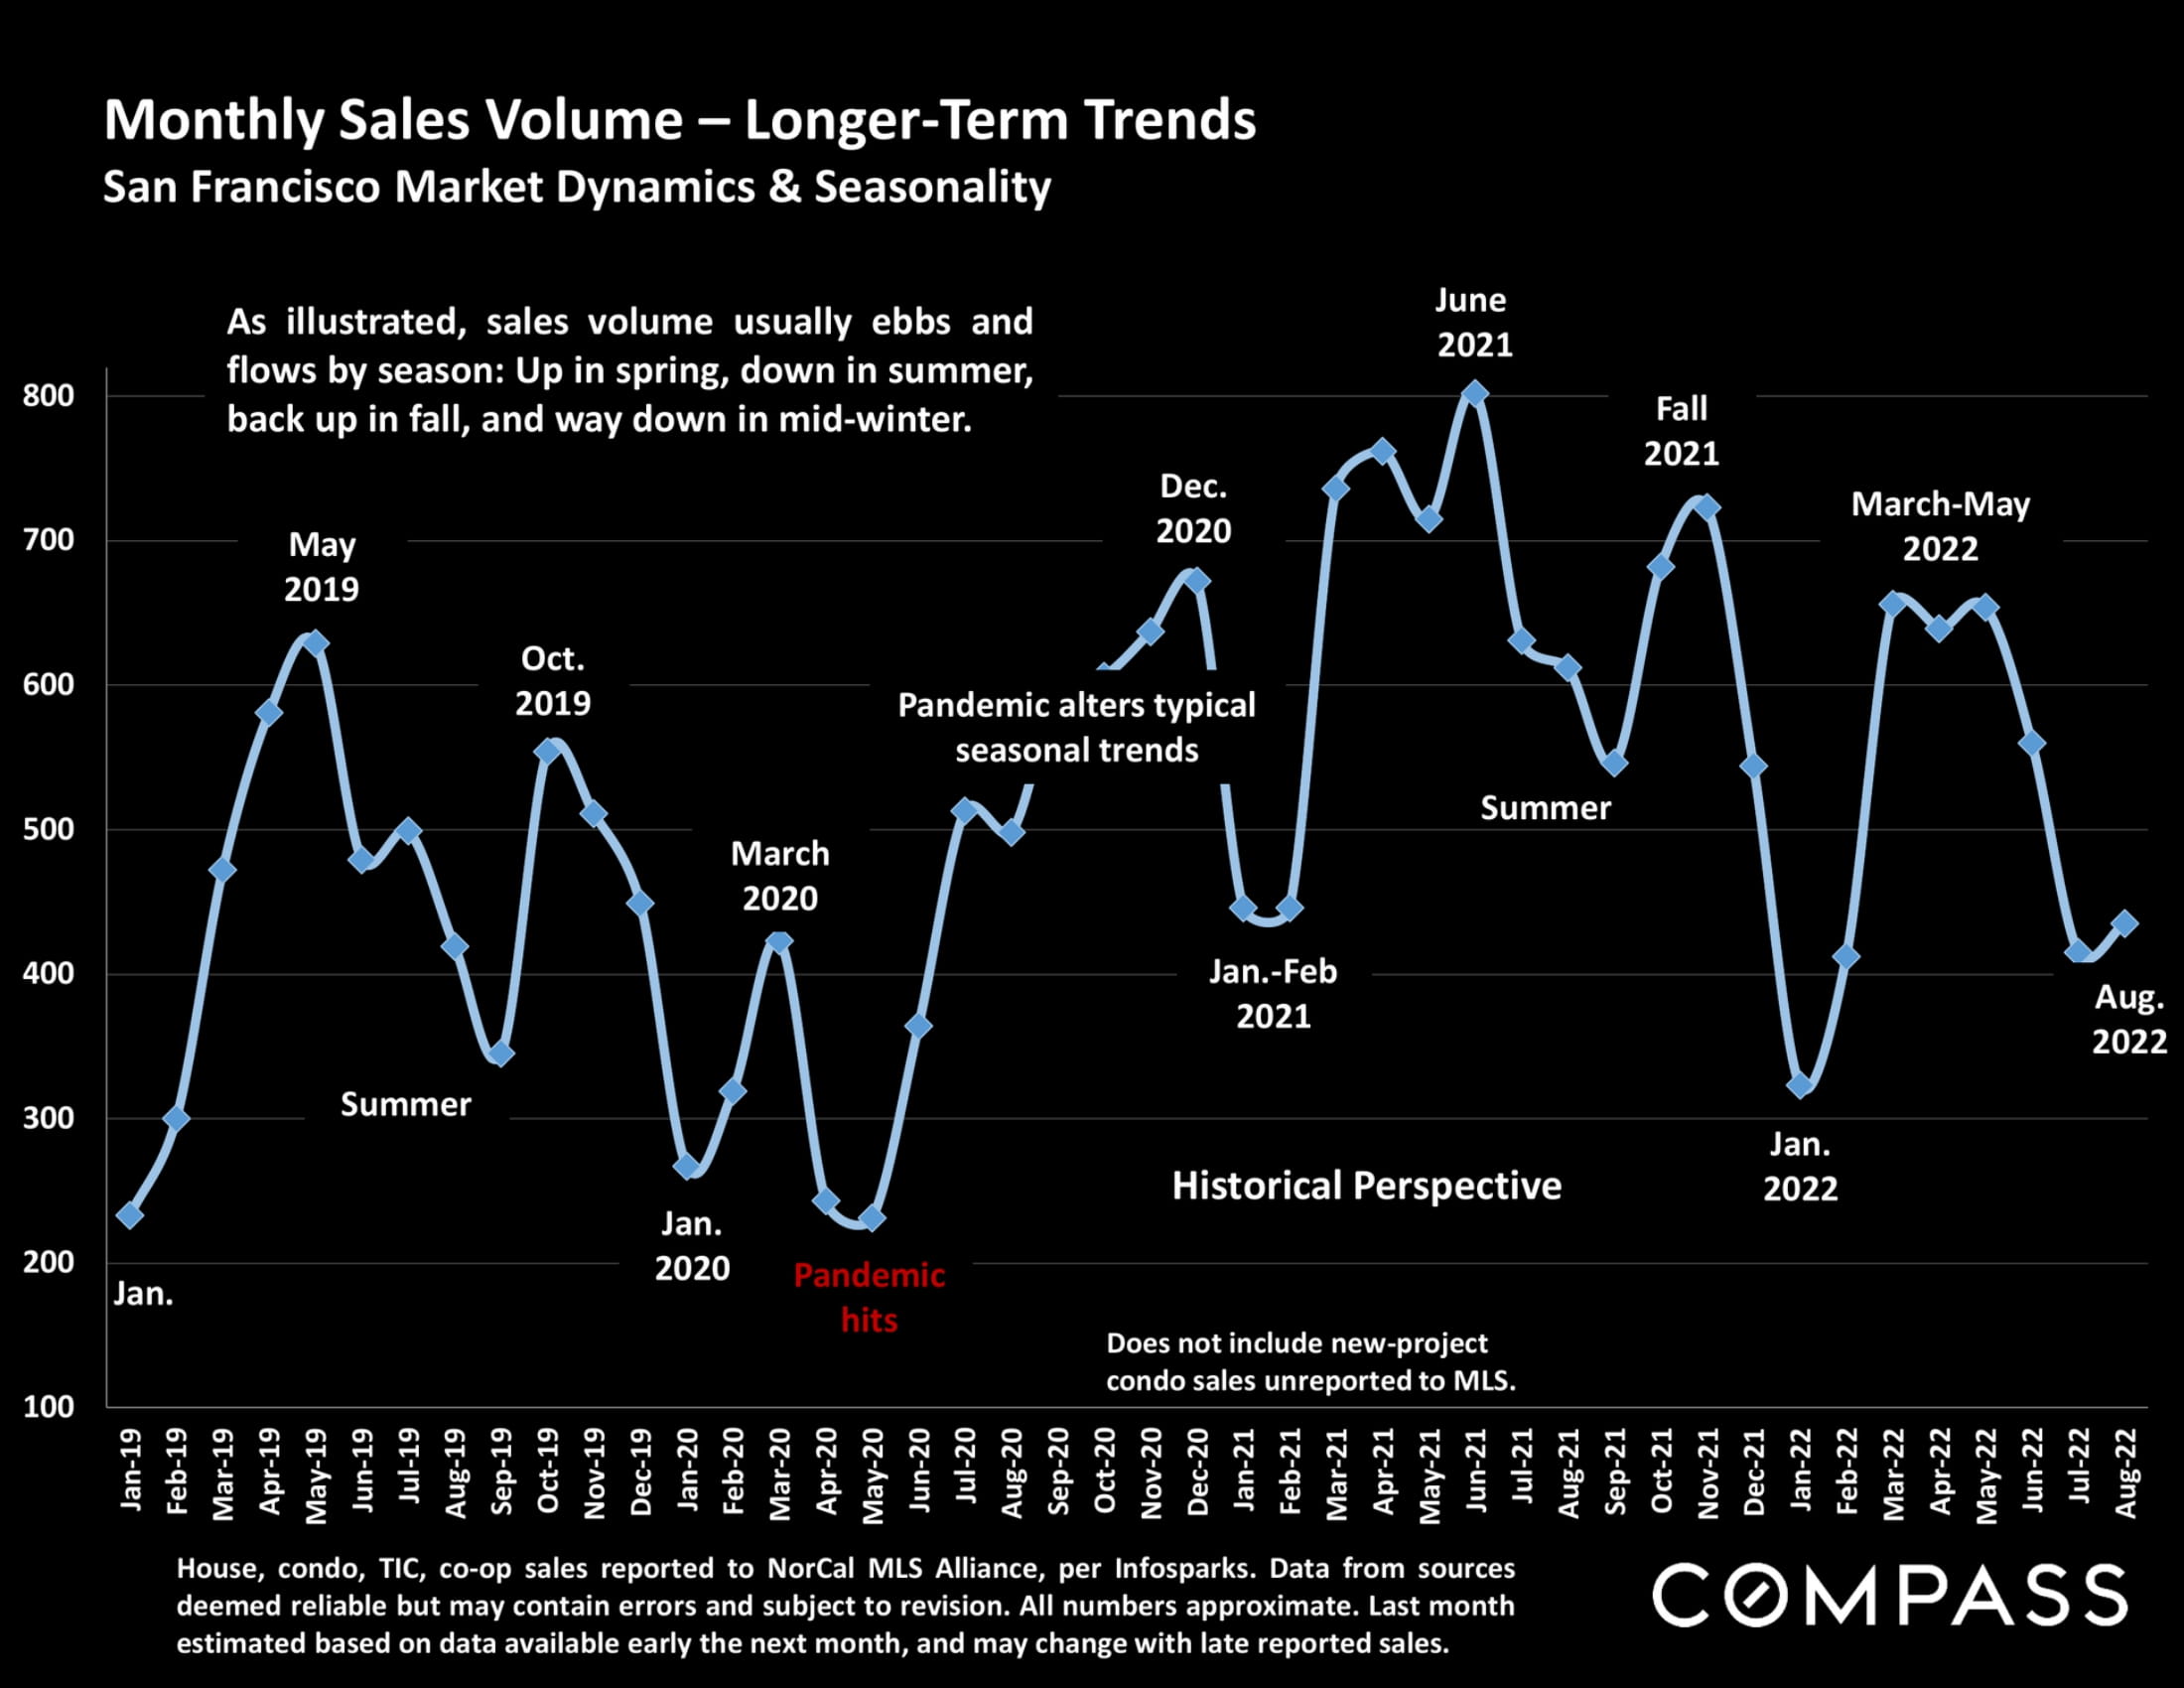
Chart of San Francisco monthly home sales volume, January 2019 to August 2022, with seasonal and pandemic annotations.
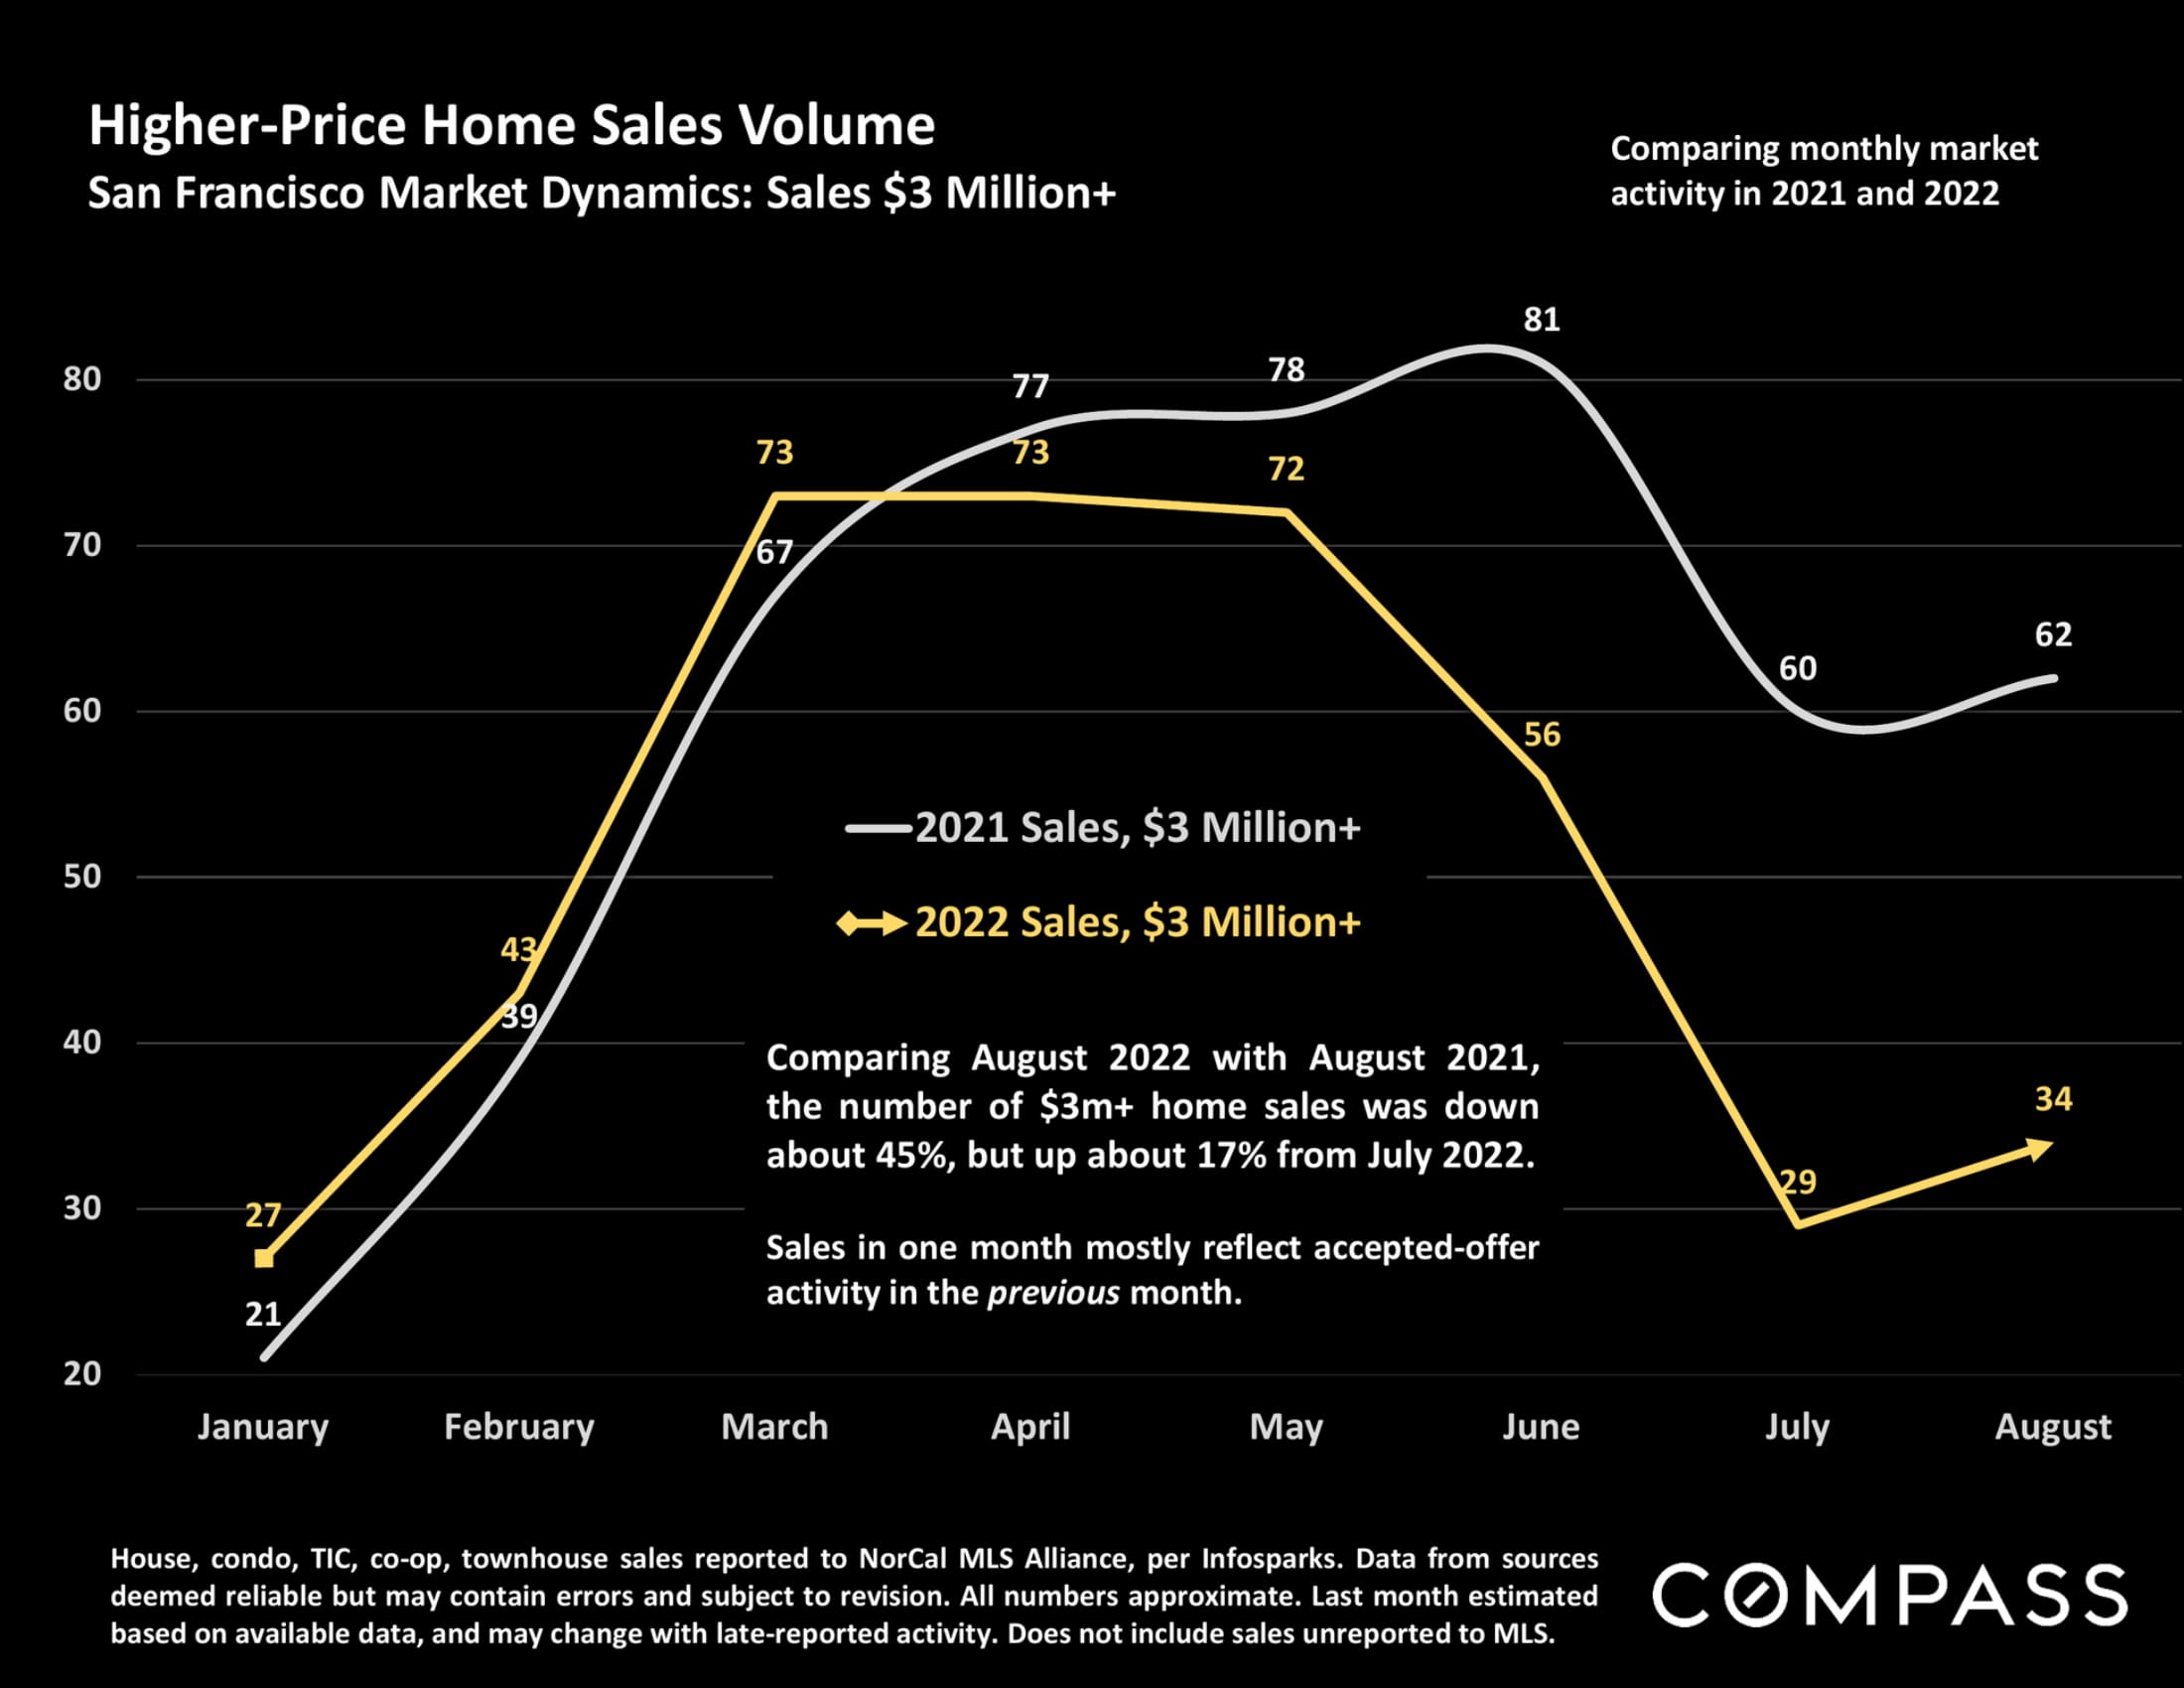
Chart comparing monthly San Francisco sales of homes priced at $3 million or more in 2021 and 2022.
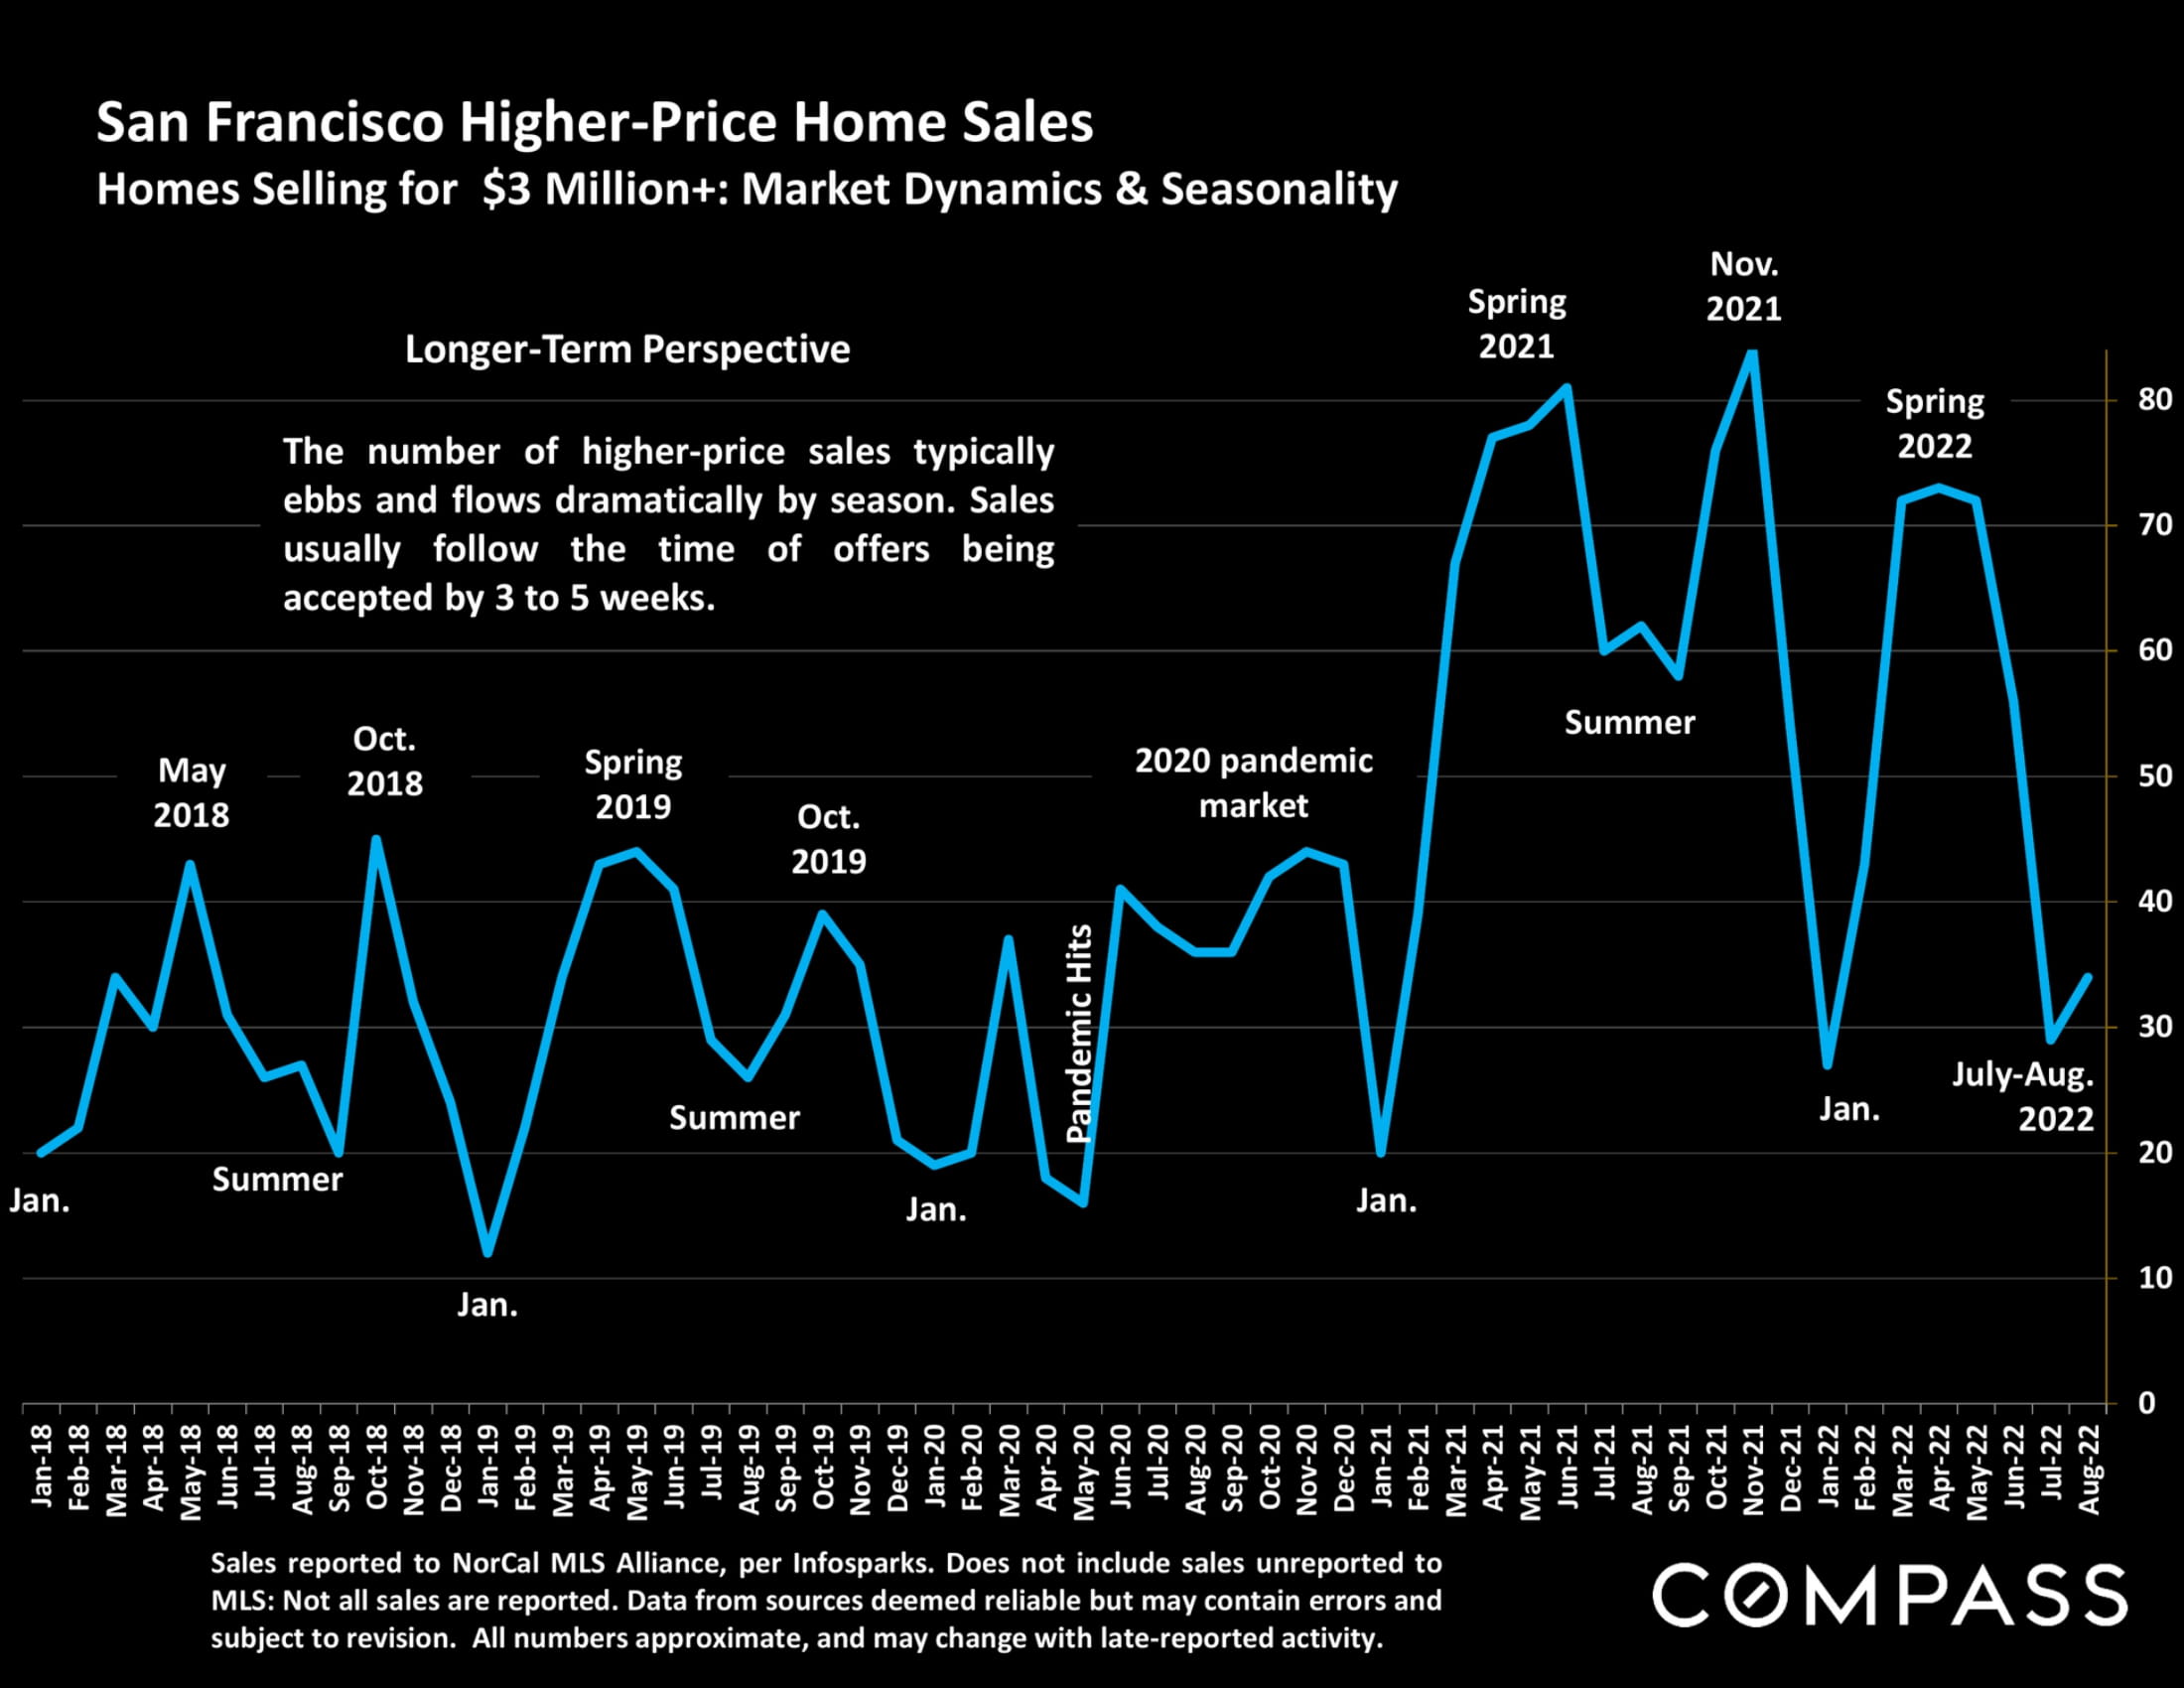
Chart of San Francisco sales over $3 million, with monthly totals from 2018 to 2022 and seasonal fluctuations.
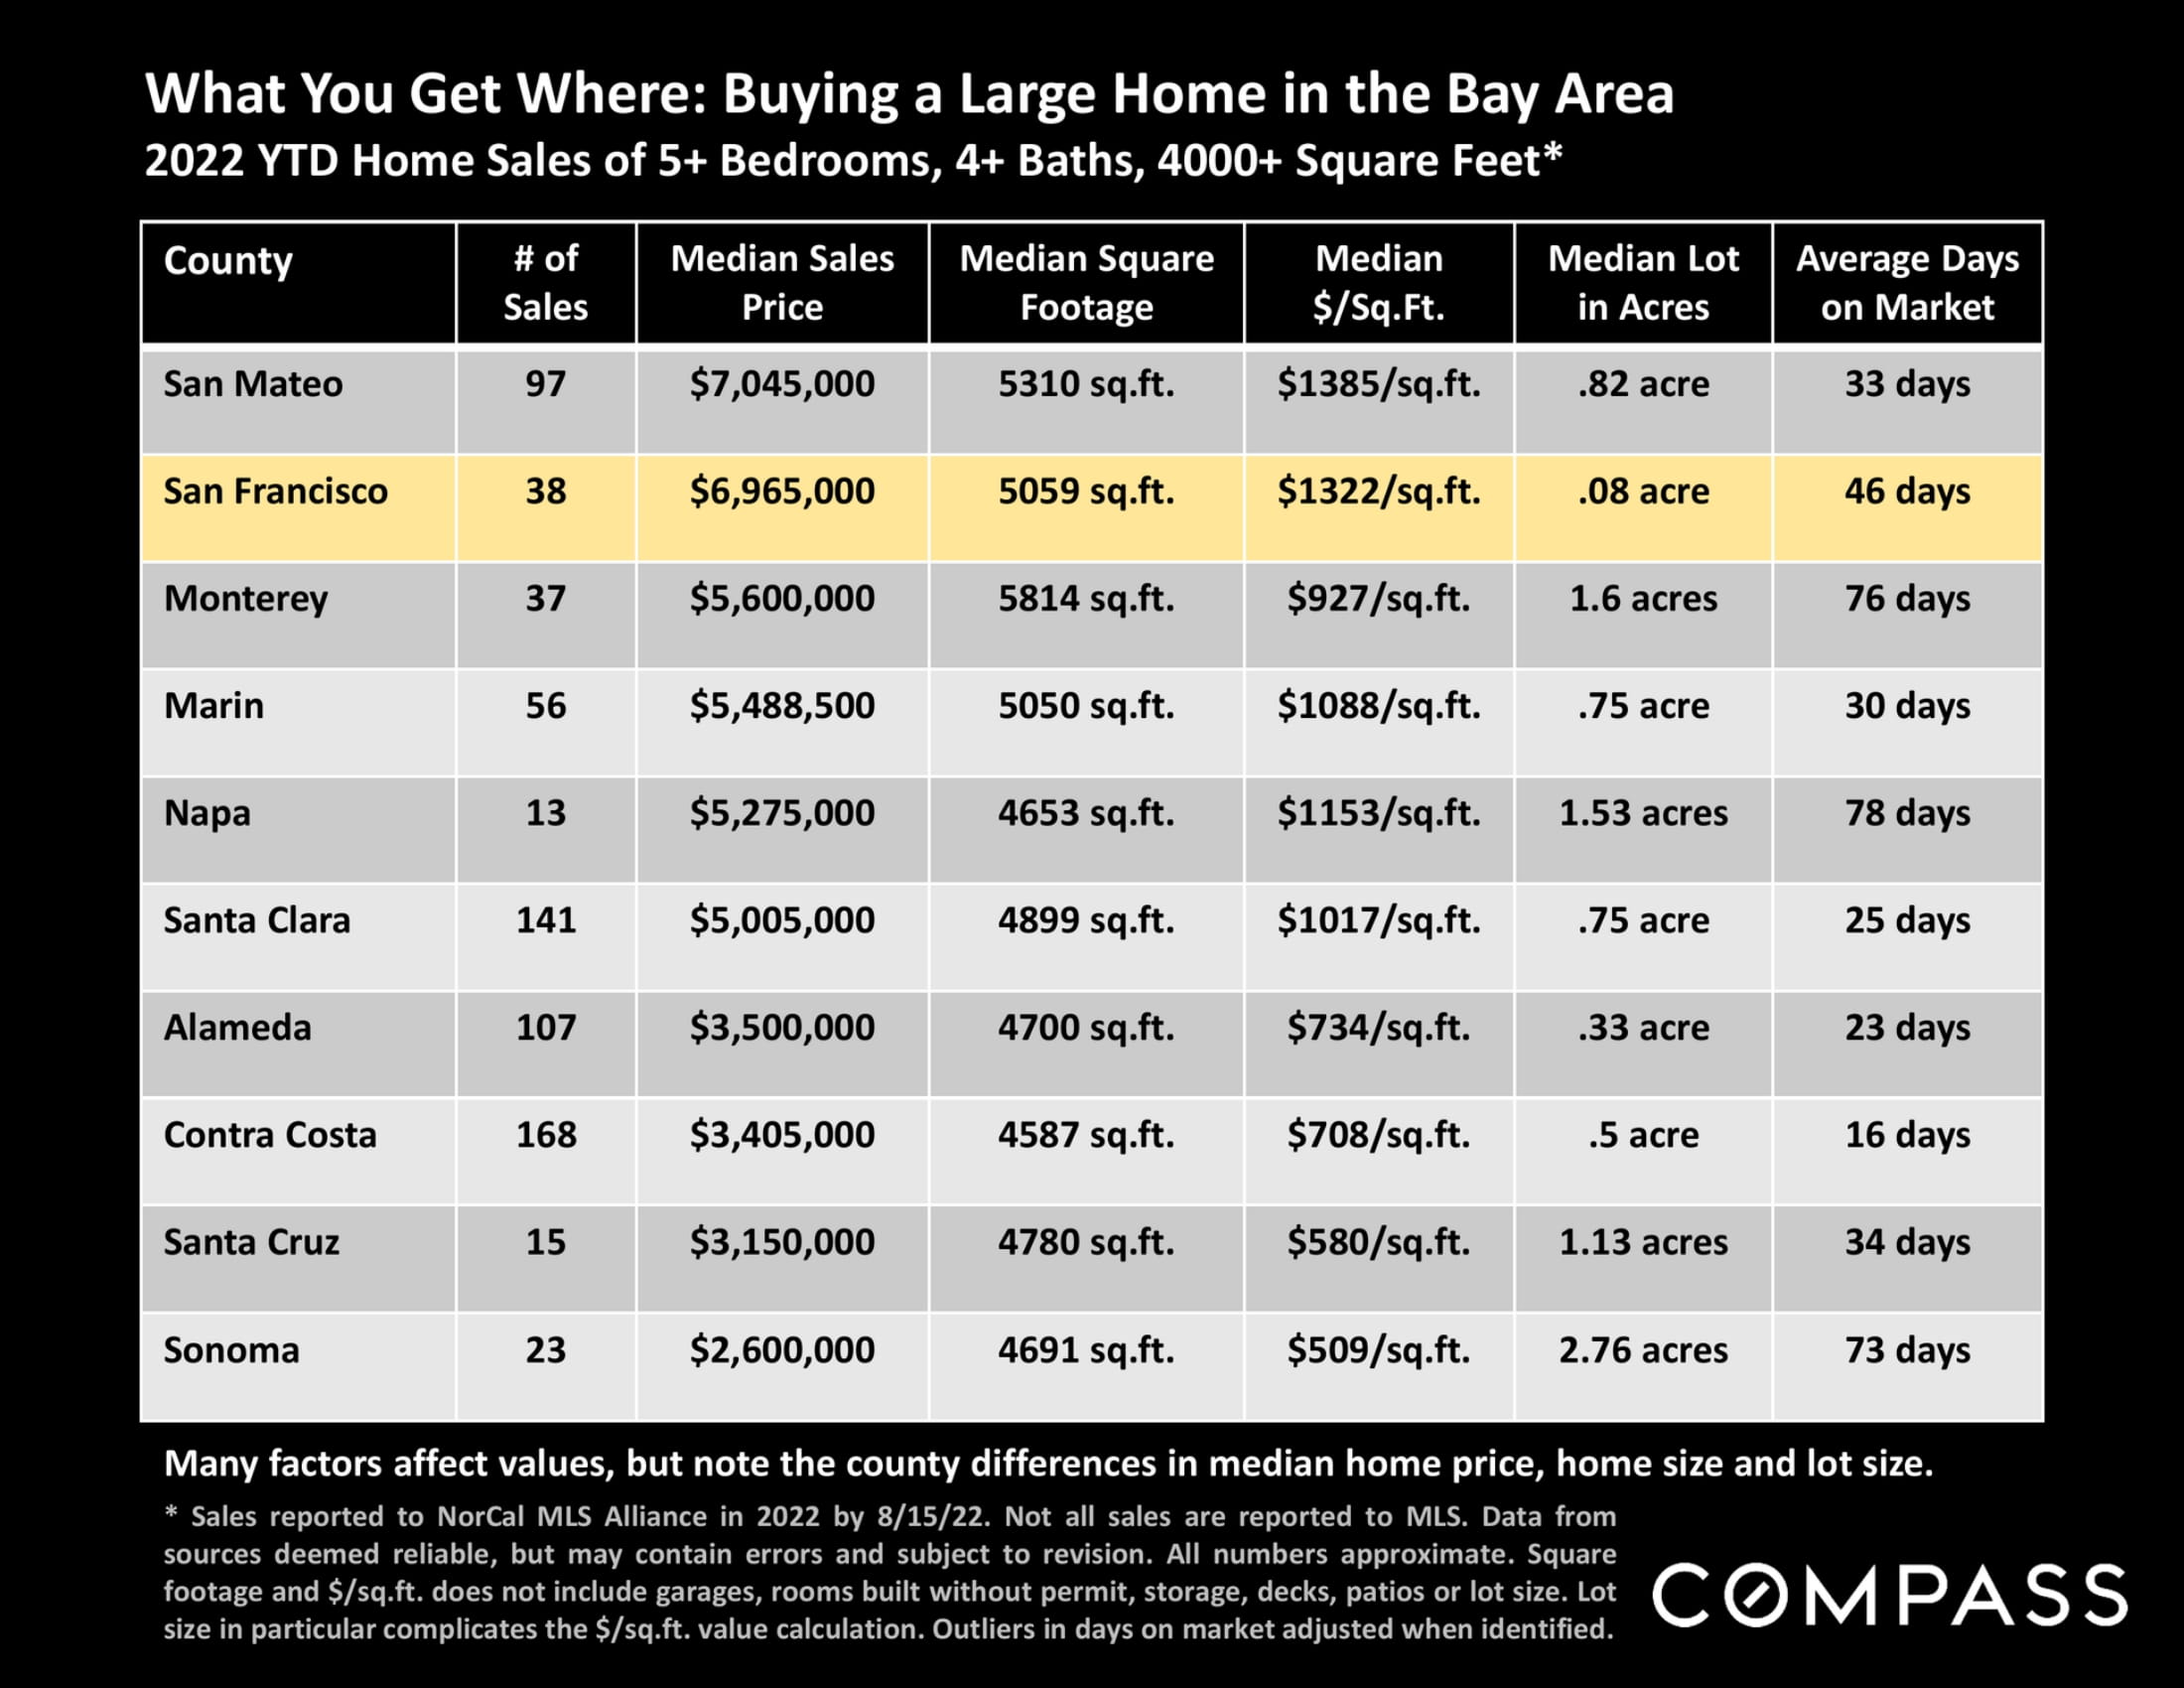
Bay Area large-home sales comparison by county, with San Francisco highlighted in yellow.
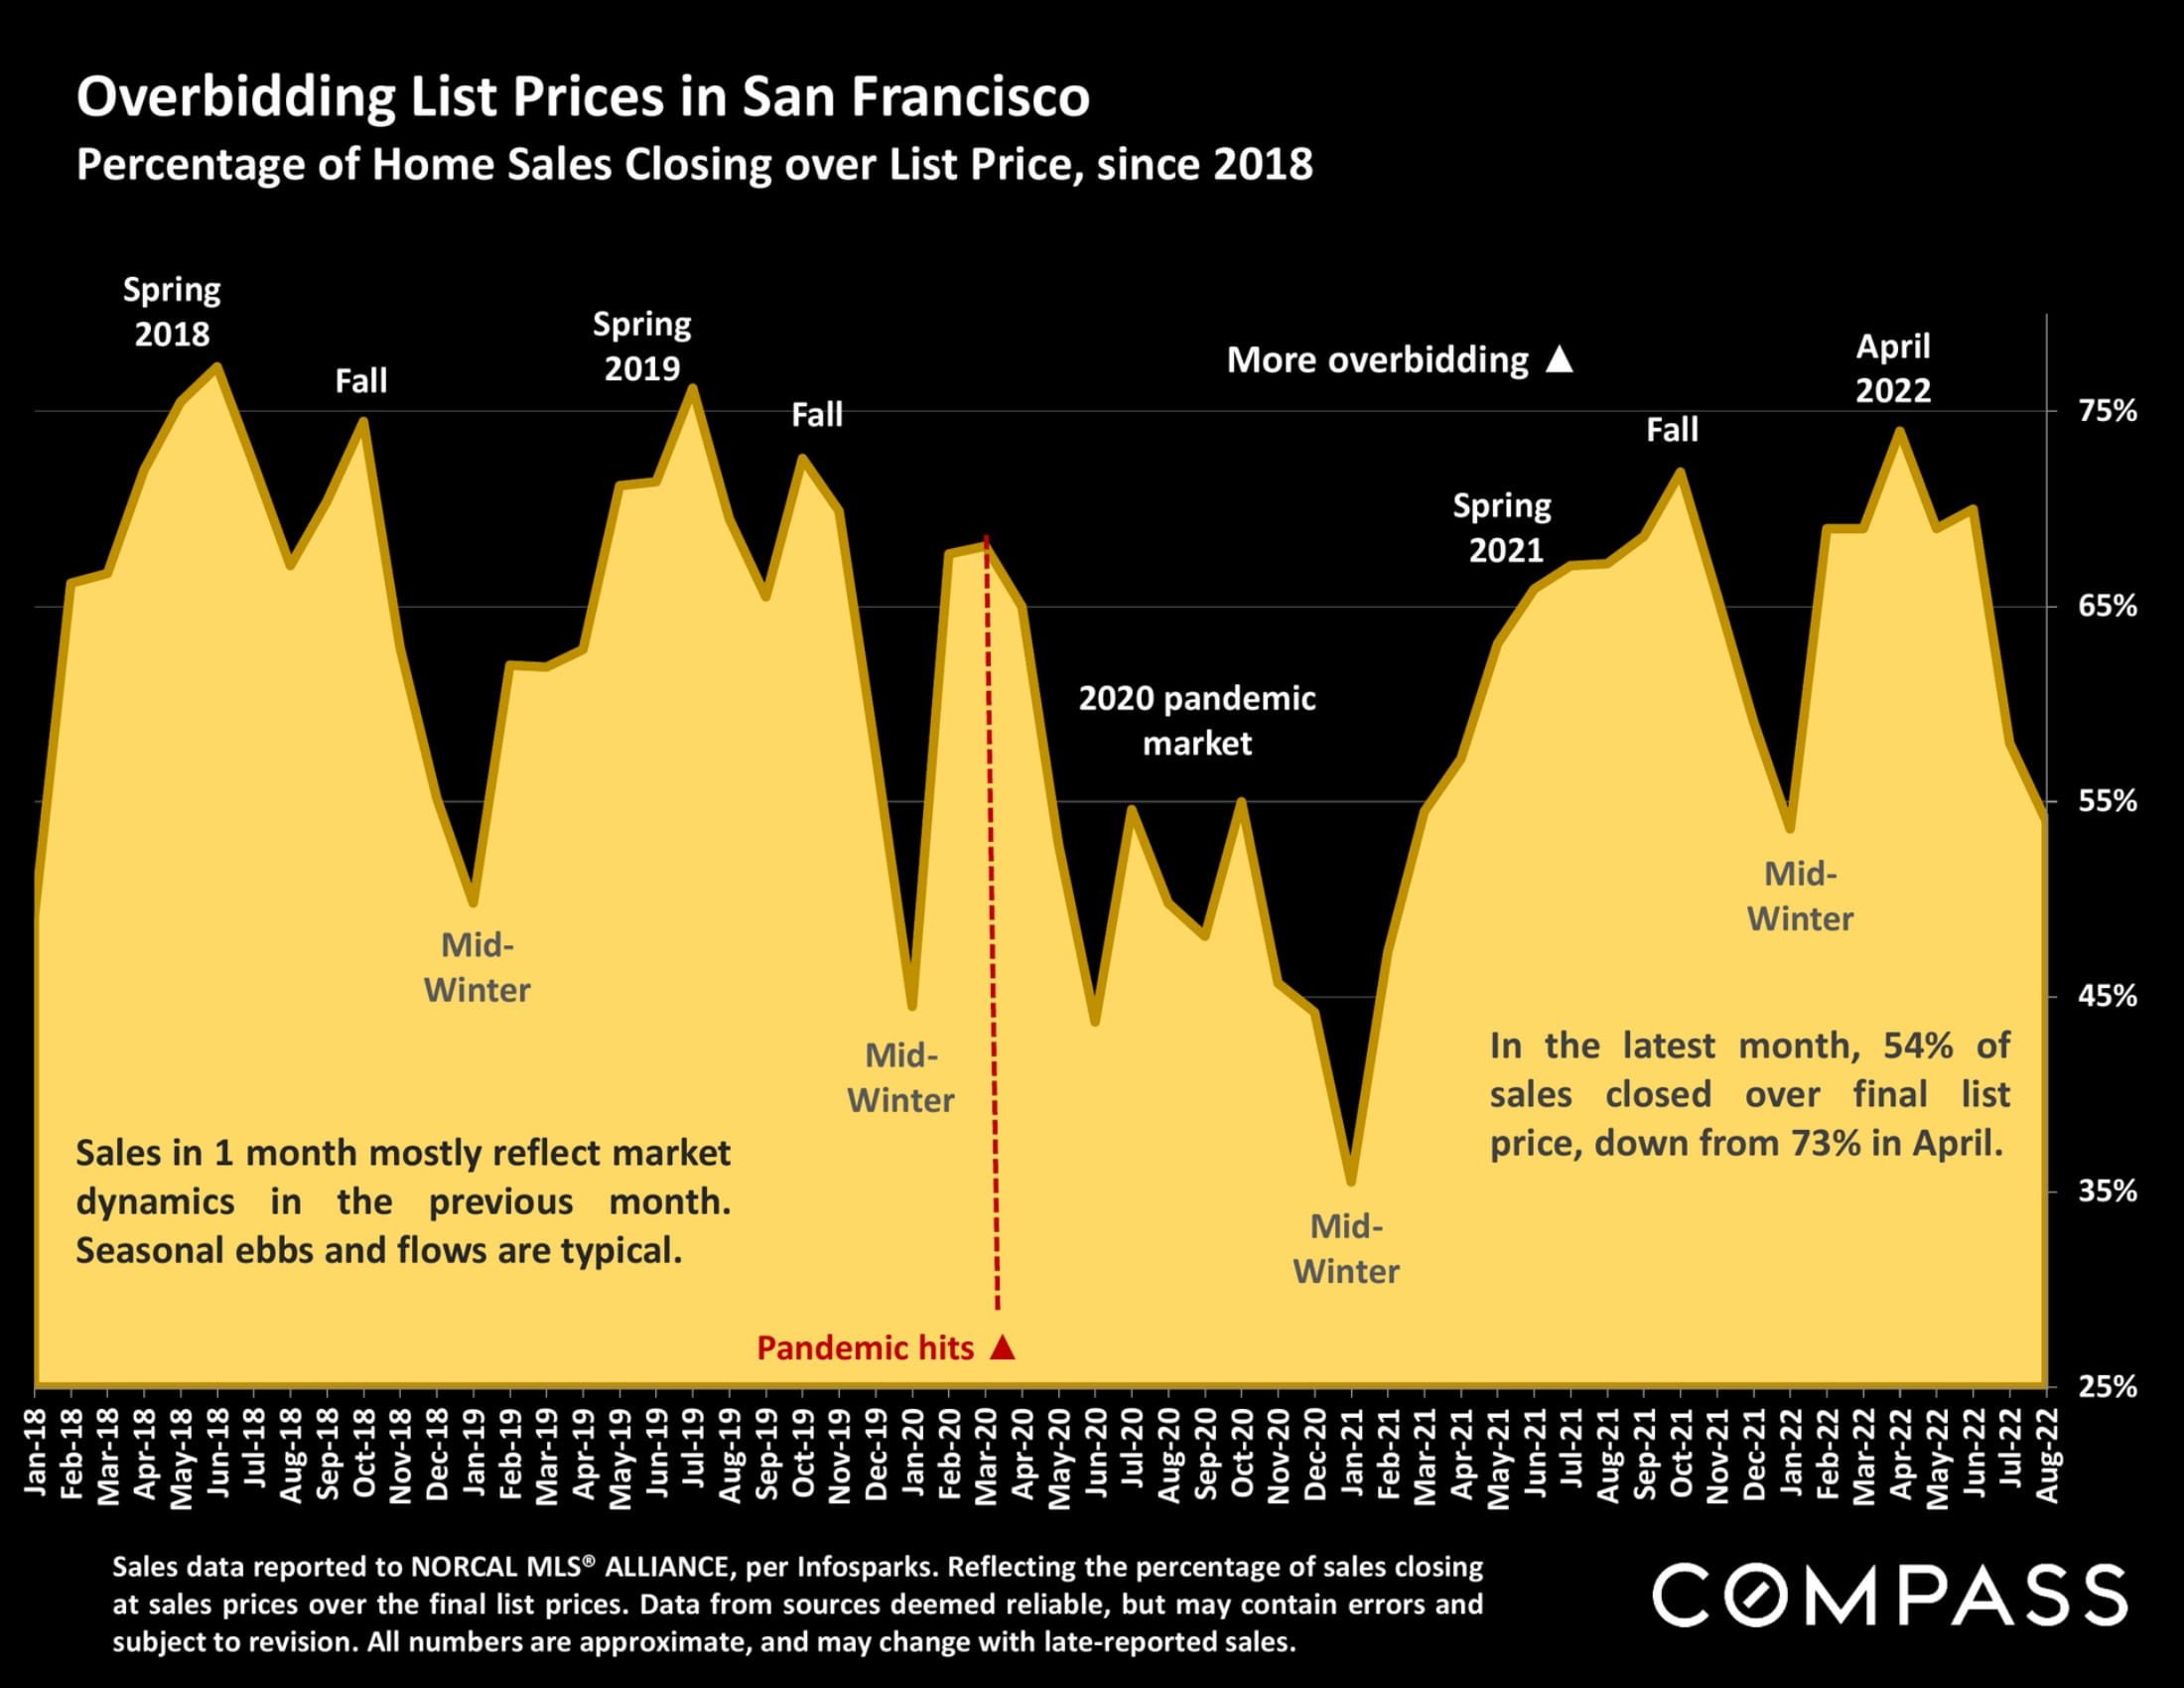
Chart of San Francisco home sales closing above list price, January 2018–August 2022, with a sharp pandemic-era dip.
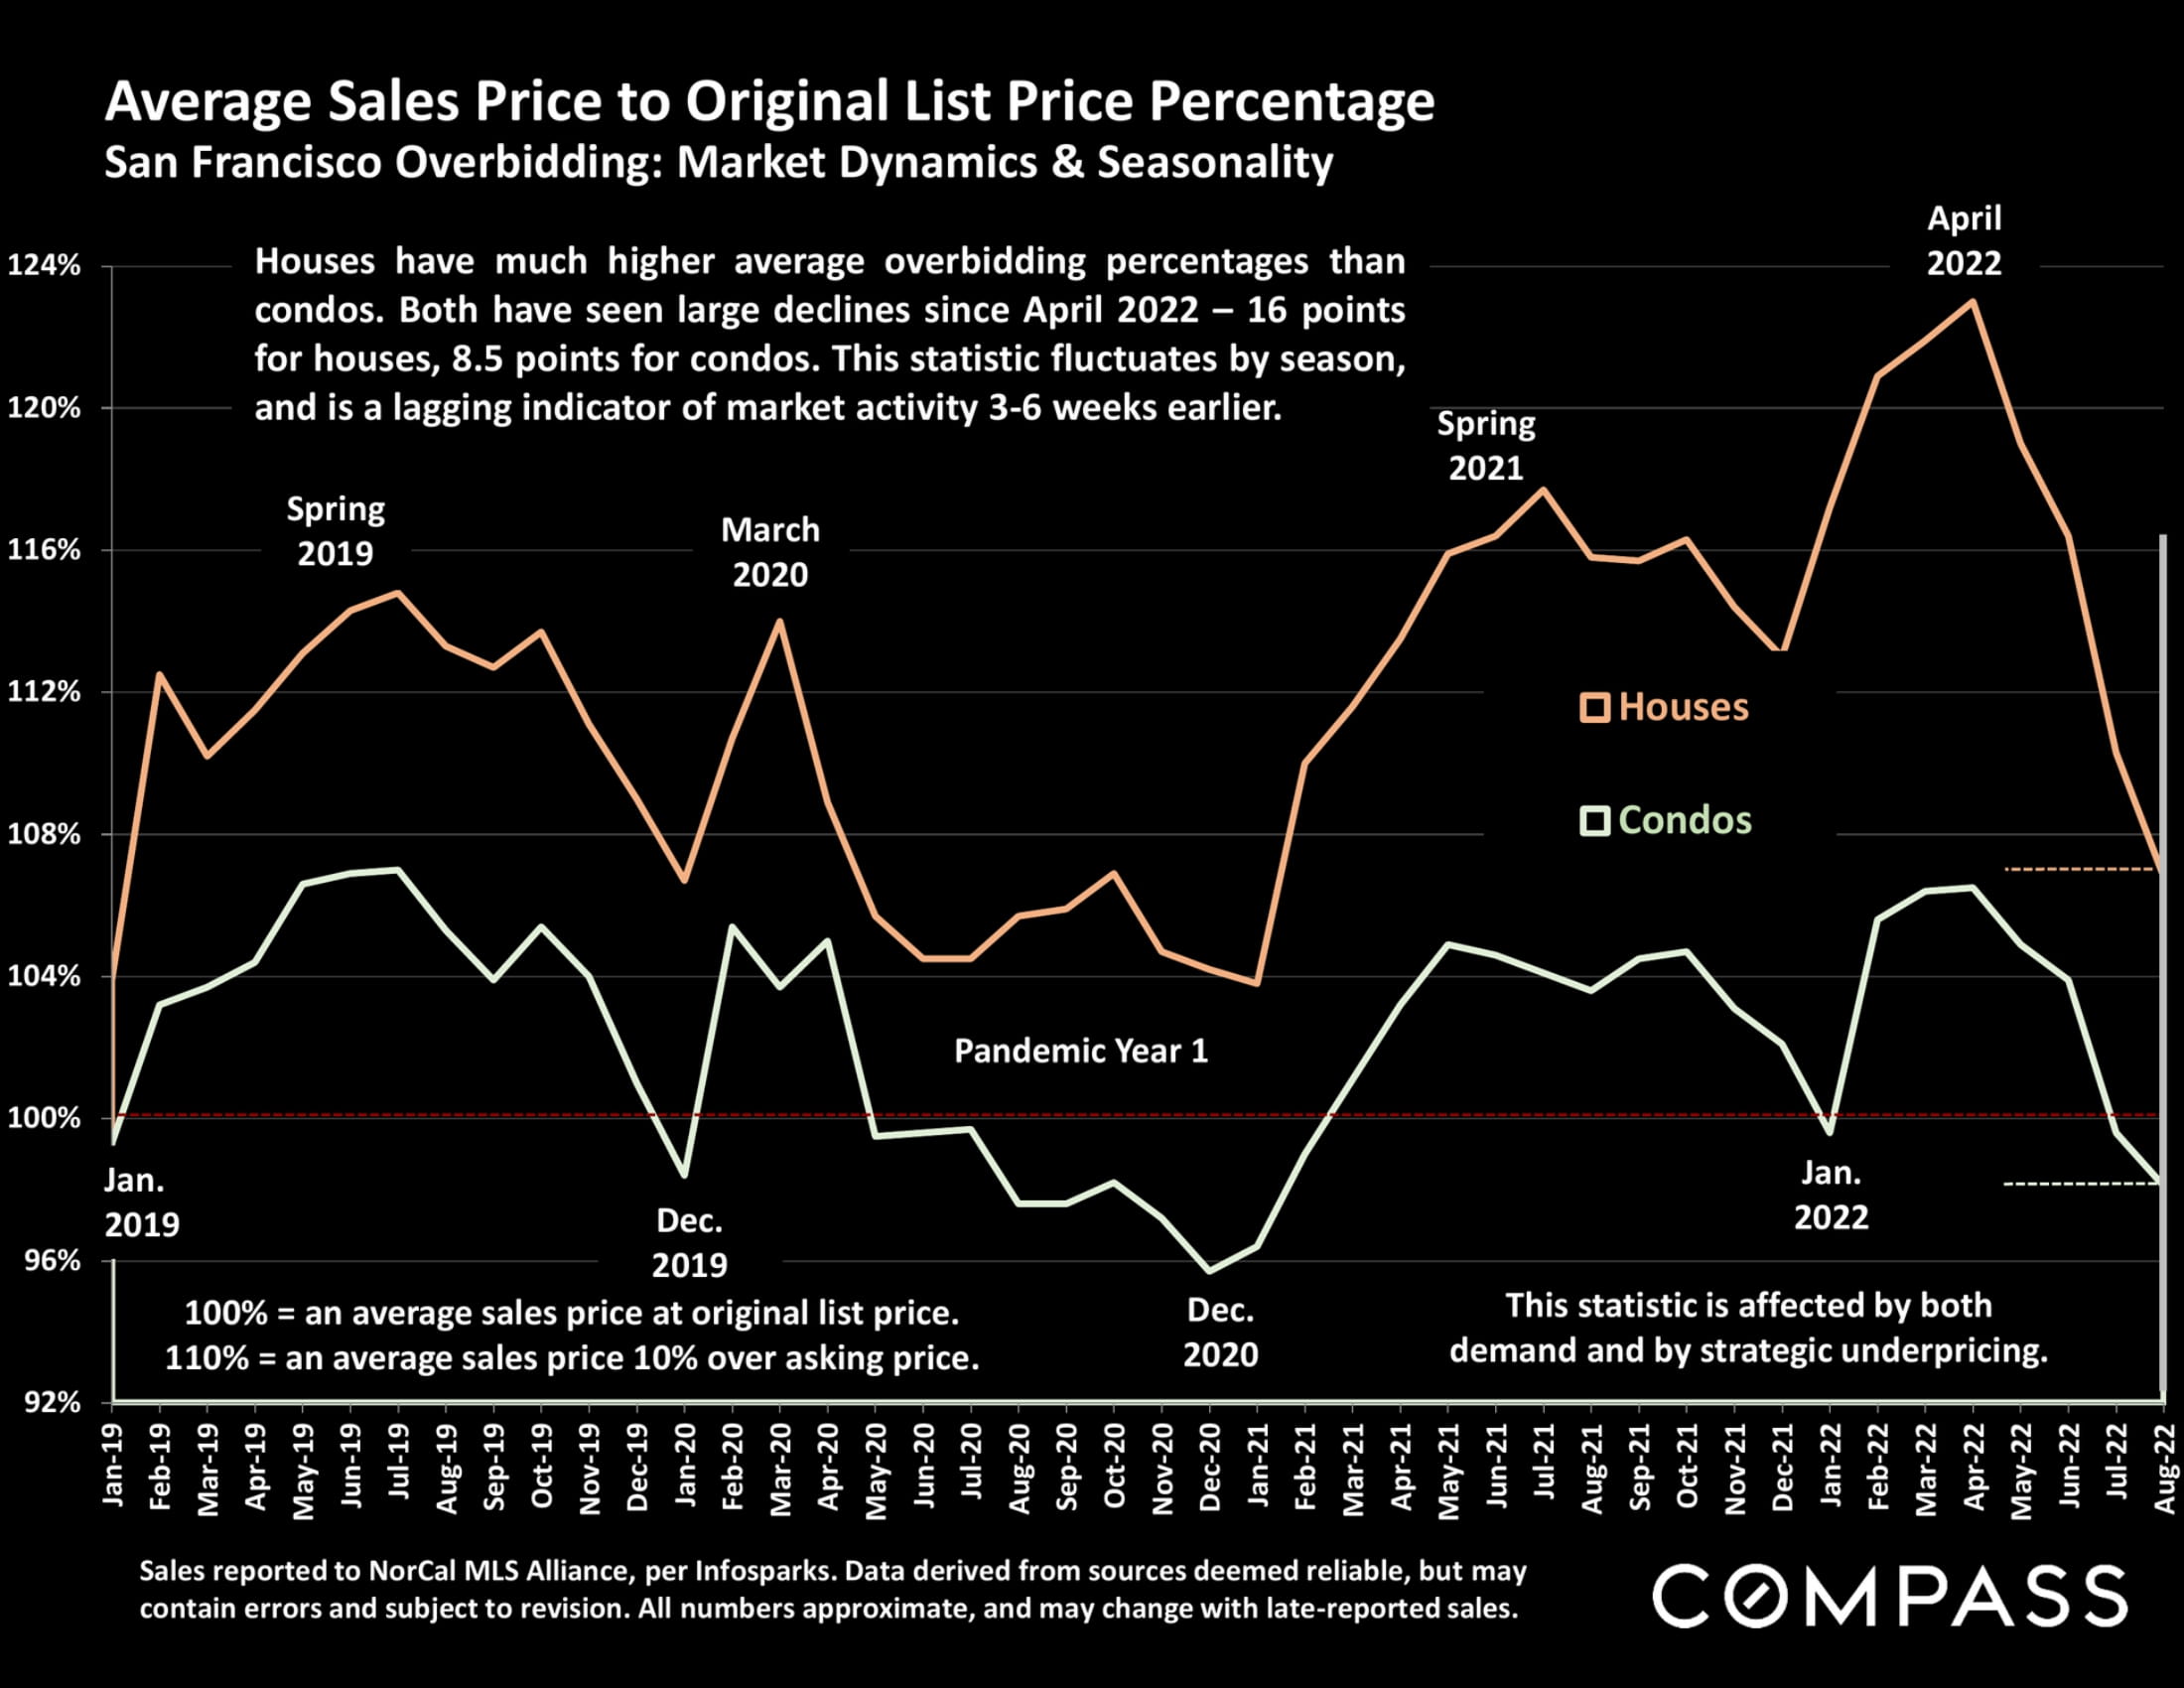
San Francisco line chart comparing house and condo sale prices to original list prices, January 2019–August 2022.
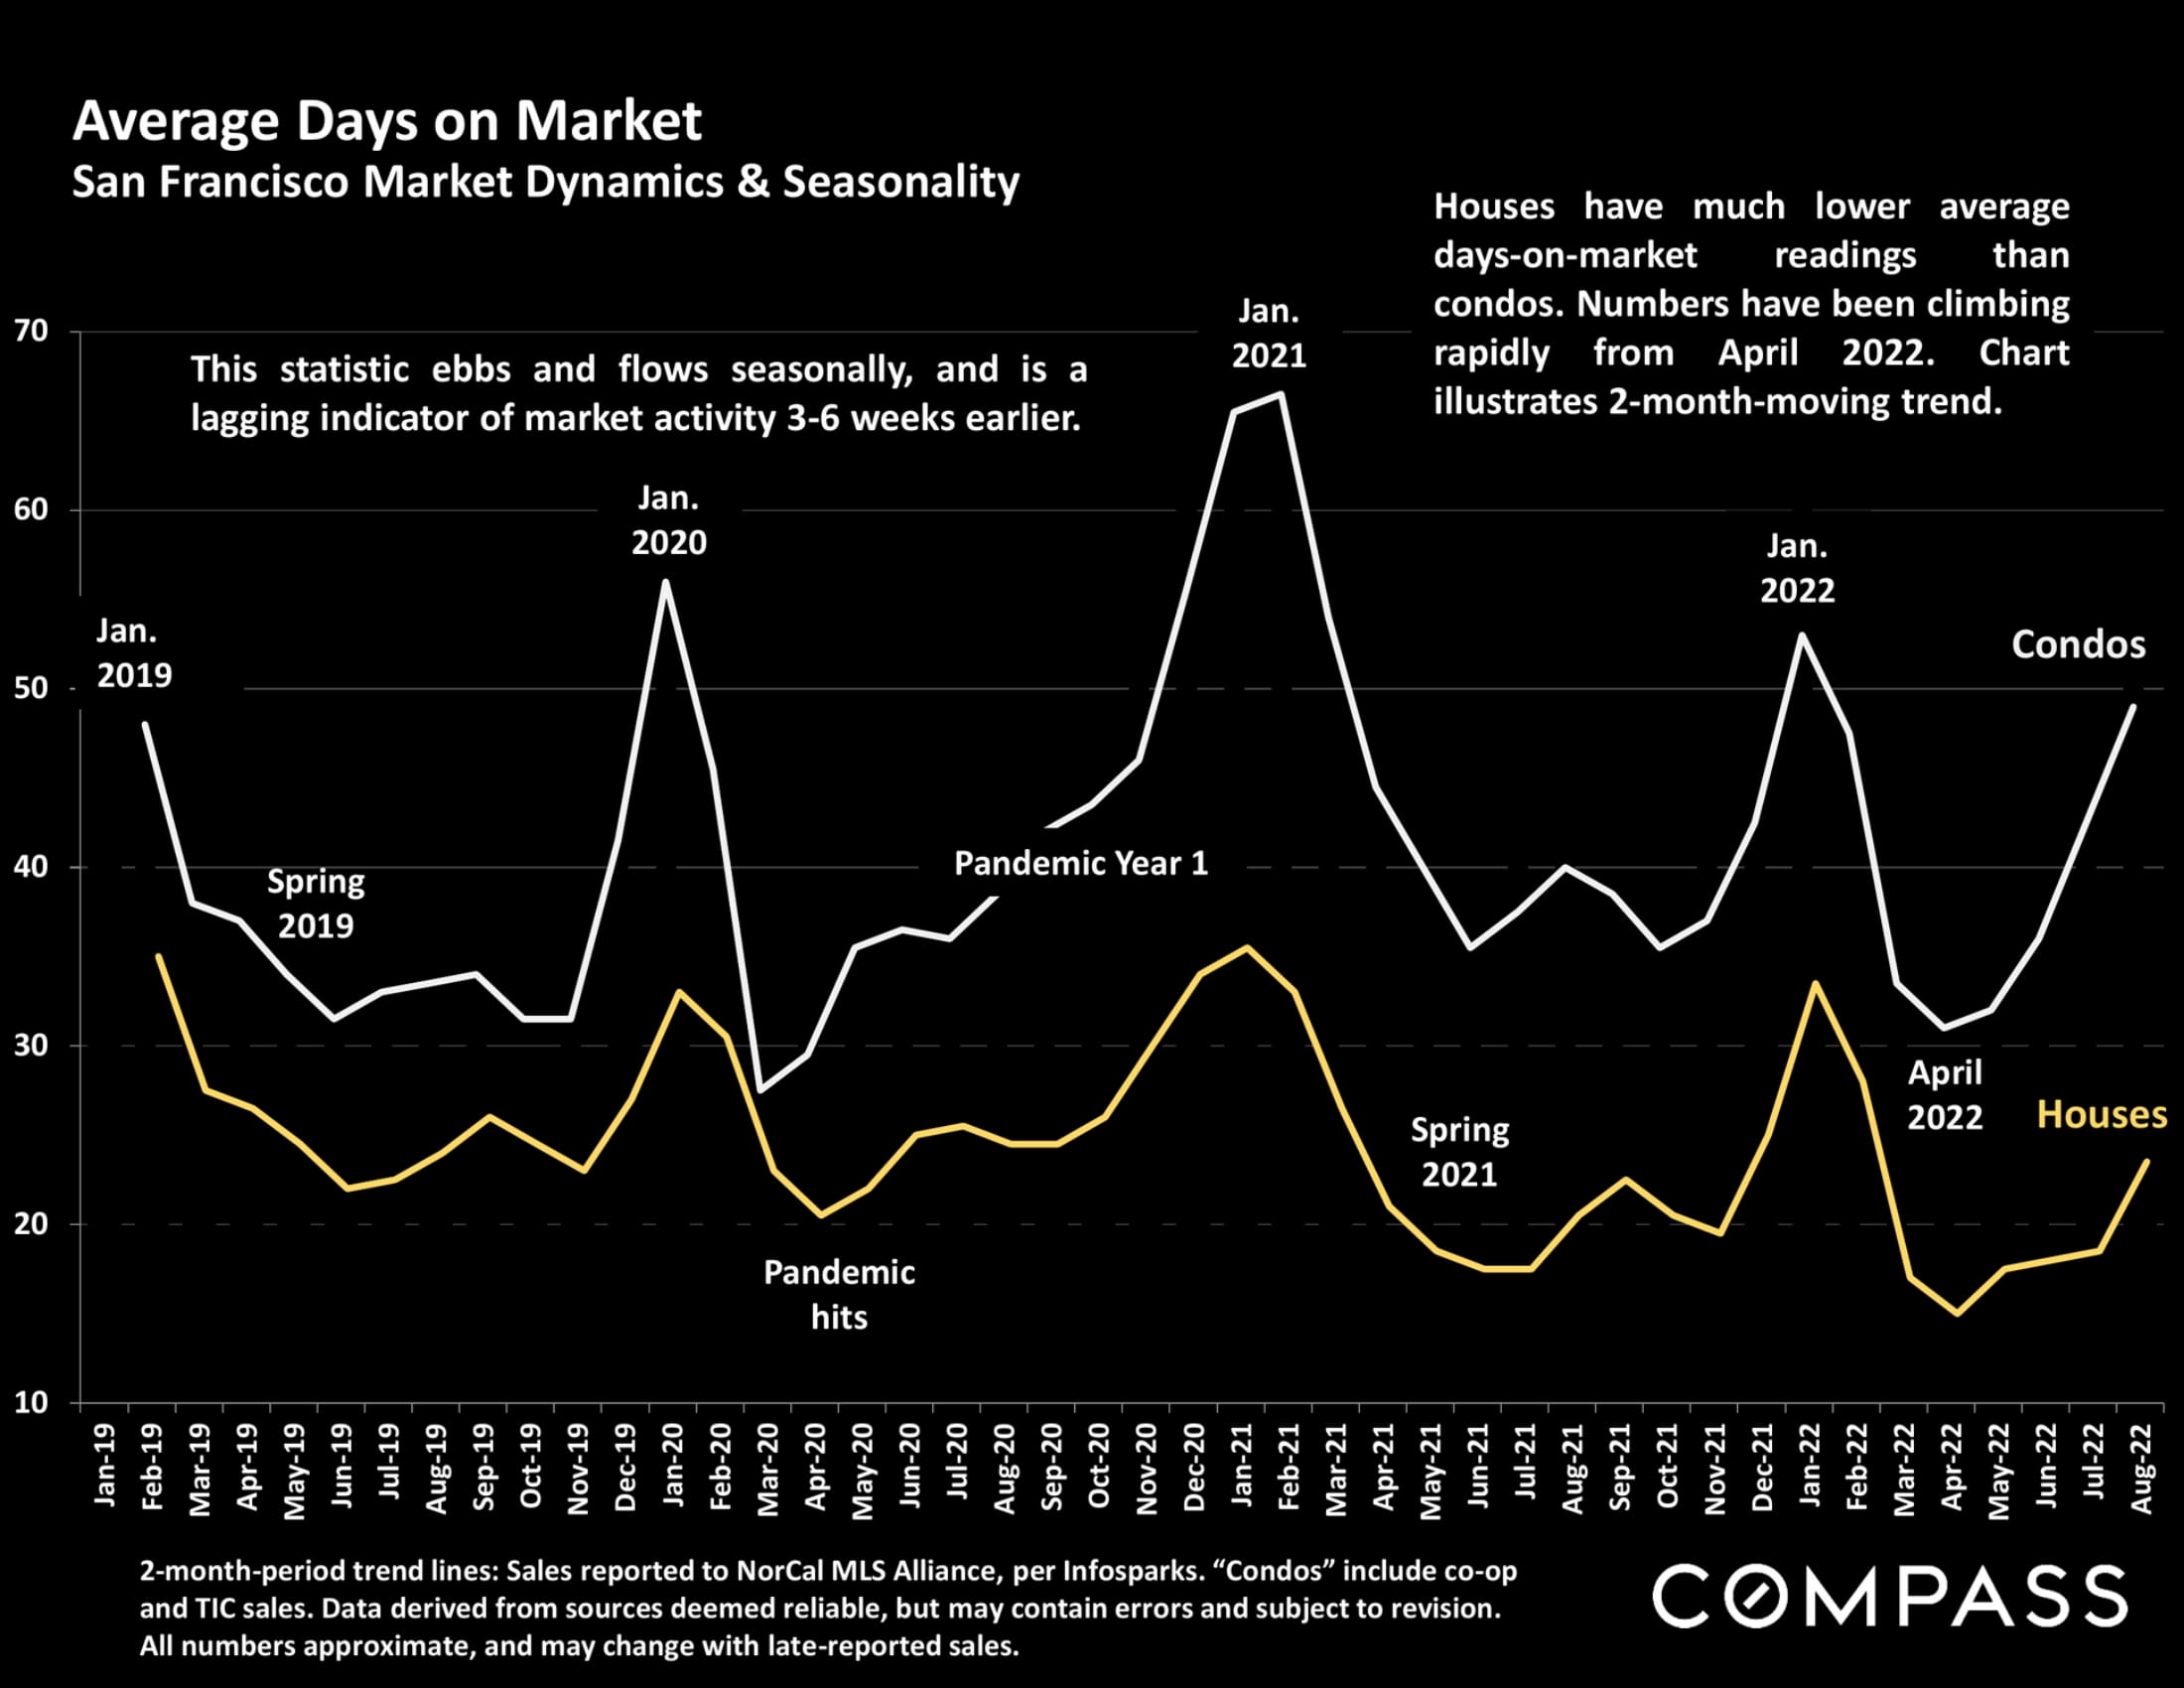
San Francisco average days-on-market chart comparing condos and houses from January 2019 to August 2022.
San Francisco Bay Area luxury home market report with an ornate wrought-iron garden gate photograph.
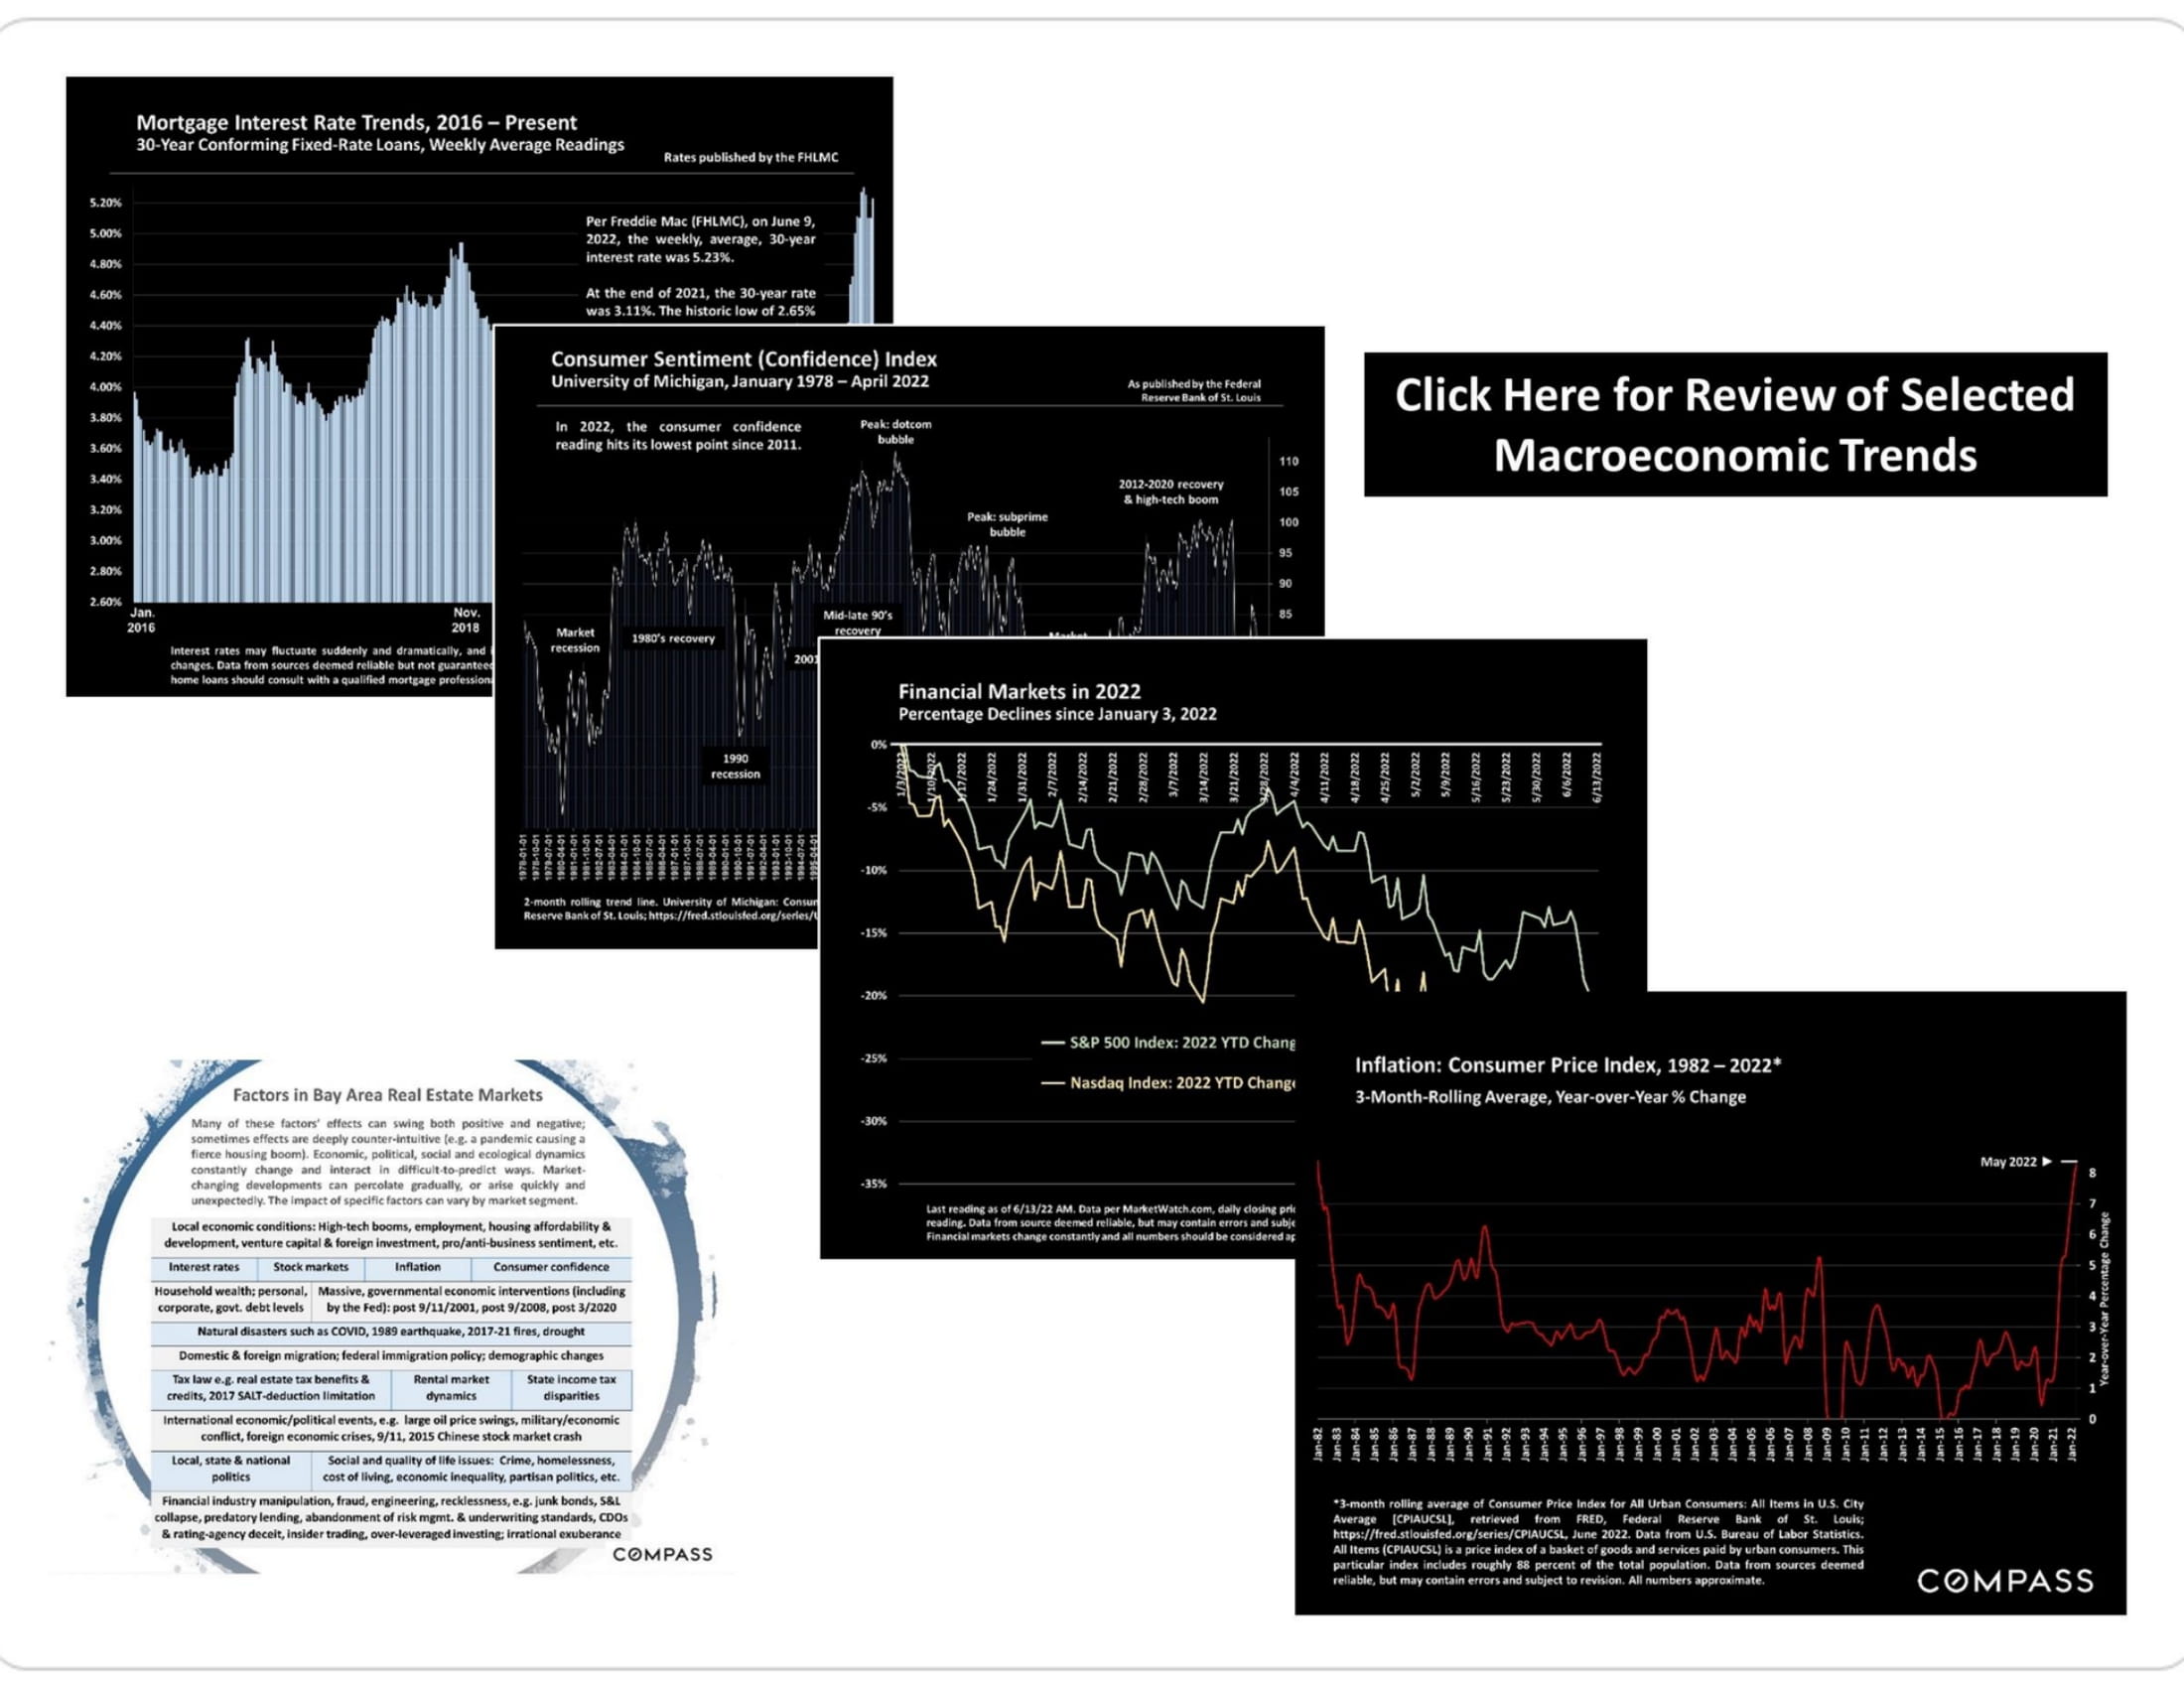
Economic charts on mortgage rates, consumer confidence, markets, inflation, and factors affecting Bay Area real estate.
San Francisco Bay Area real estate survey report graphic featuring the Golden Gate Bridge and a prompt to access the full report.
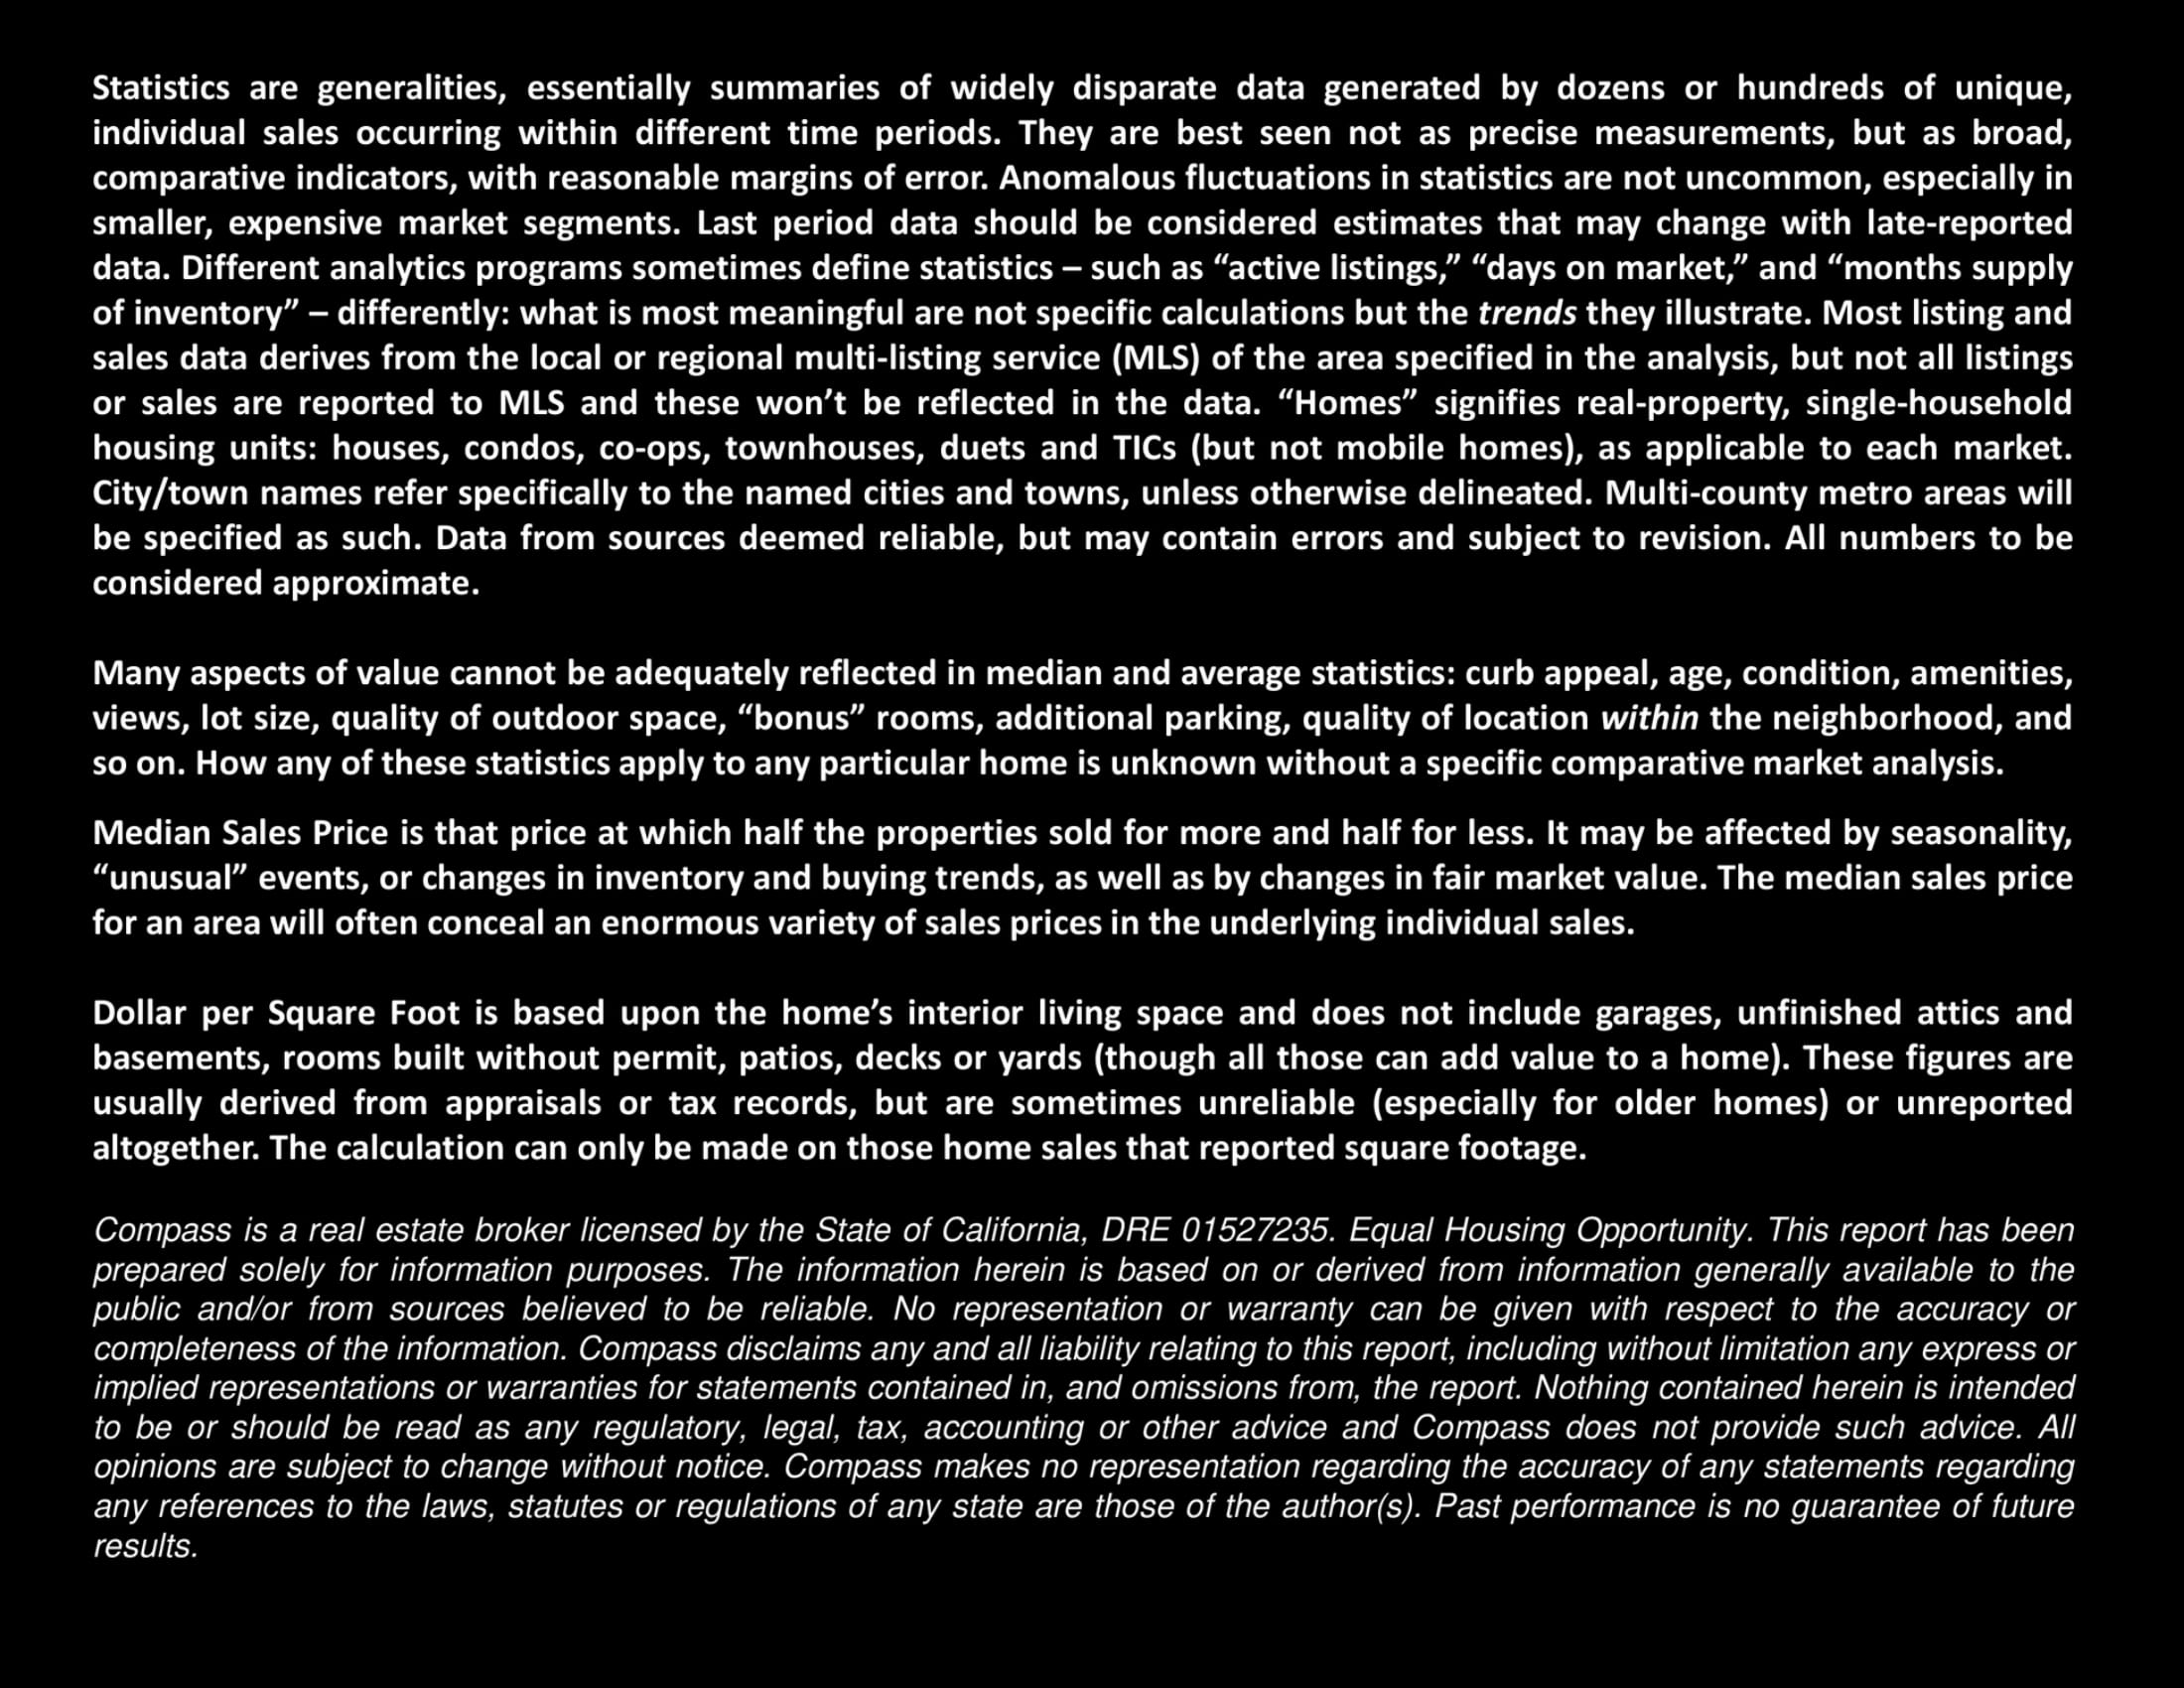
Real estate market report notes and disclaimers covering statistics, pricing metrics, and Compass licensing.


WORK WITH US

We offer the highest level of service and expertise to our clients. Our team has built a reputation for consistently representing the finest real estate in San Francisco and Napa Valley. Results driven and dedicated to your success, whether buying, selling, renting or investing. Contact us today for a private consultation.

Contact Us