San Francisco - October 2023

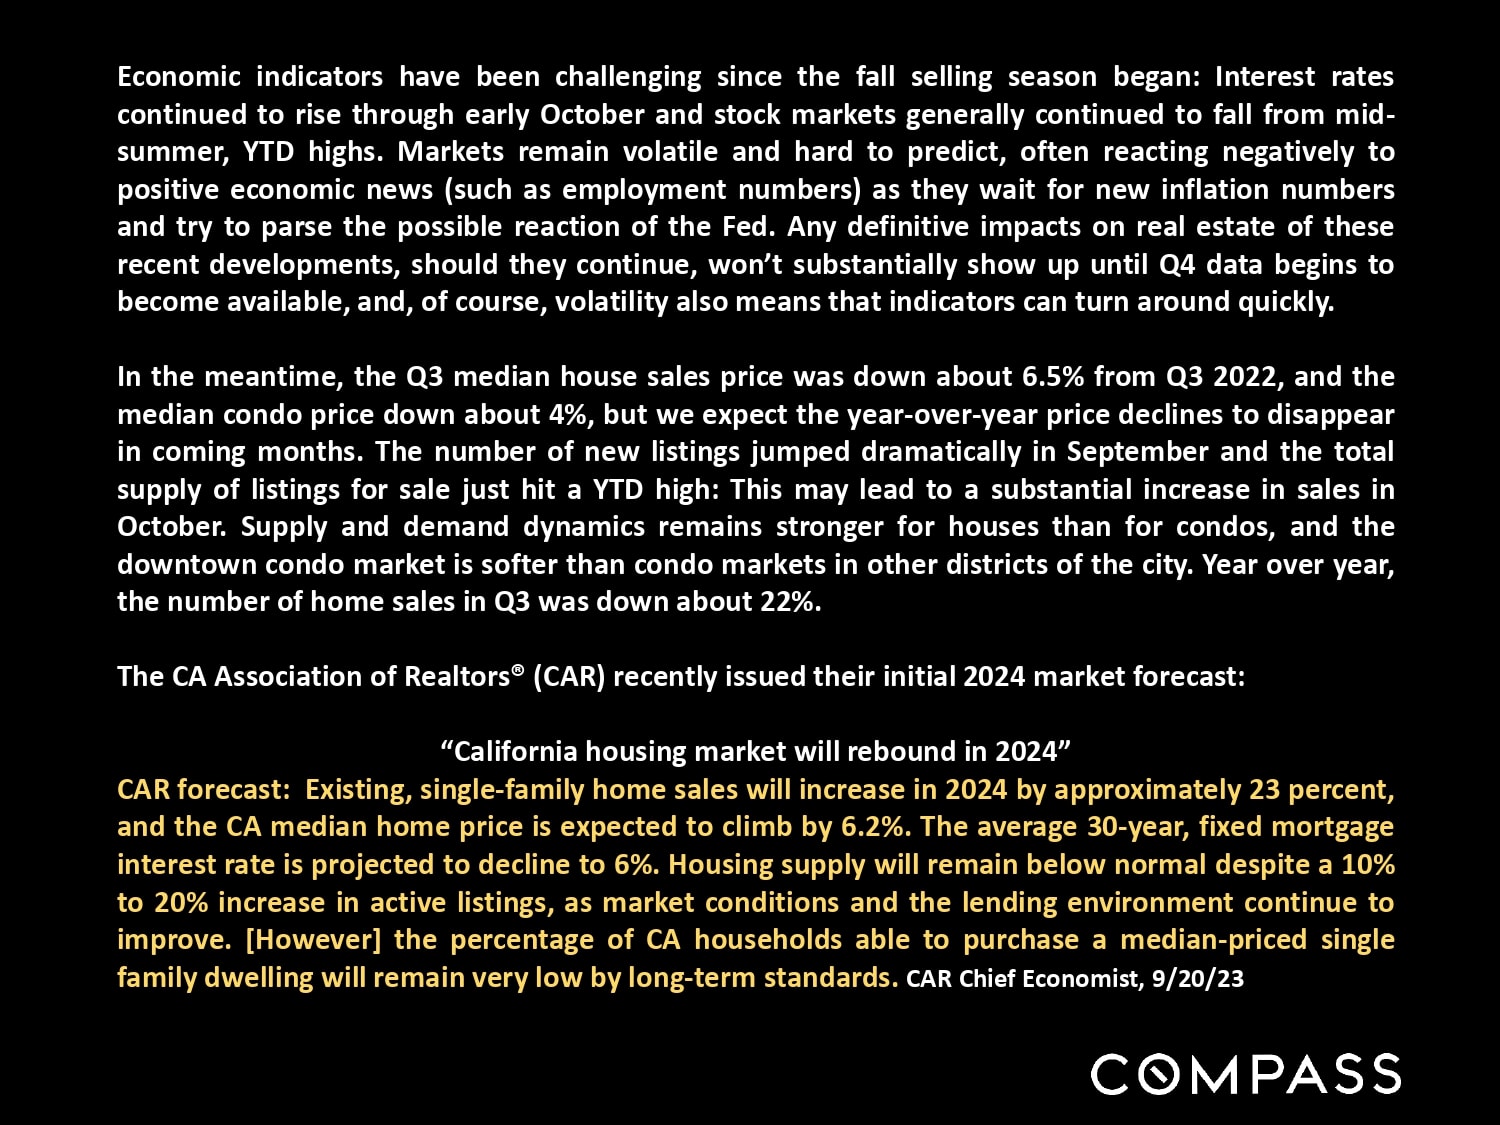
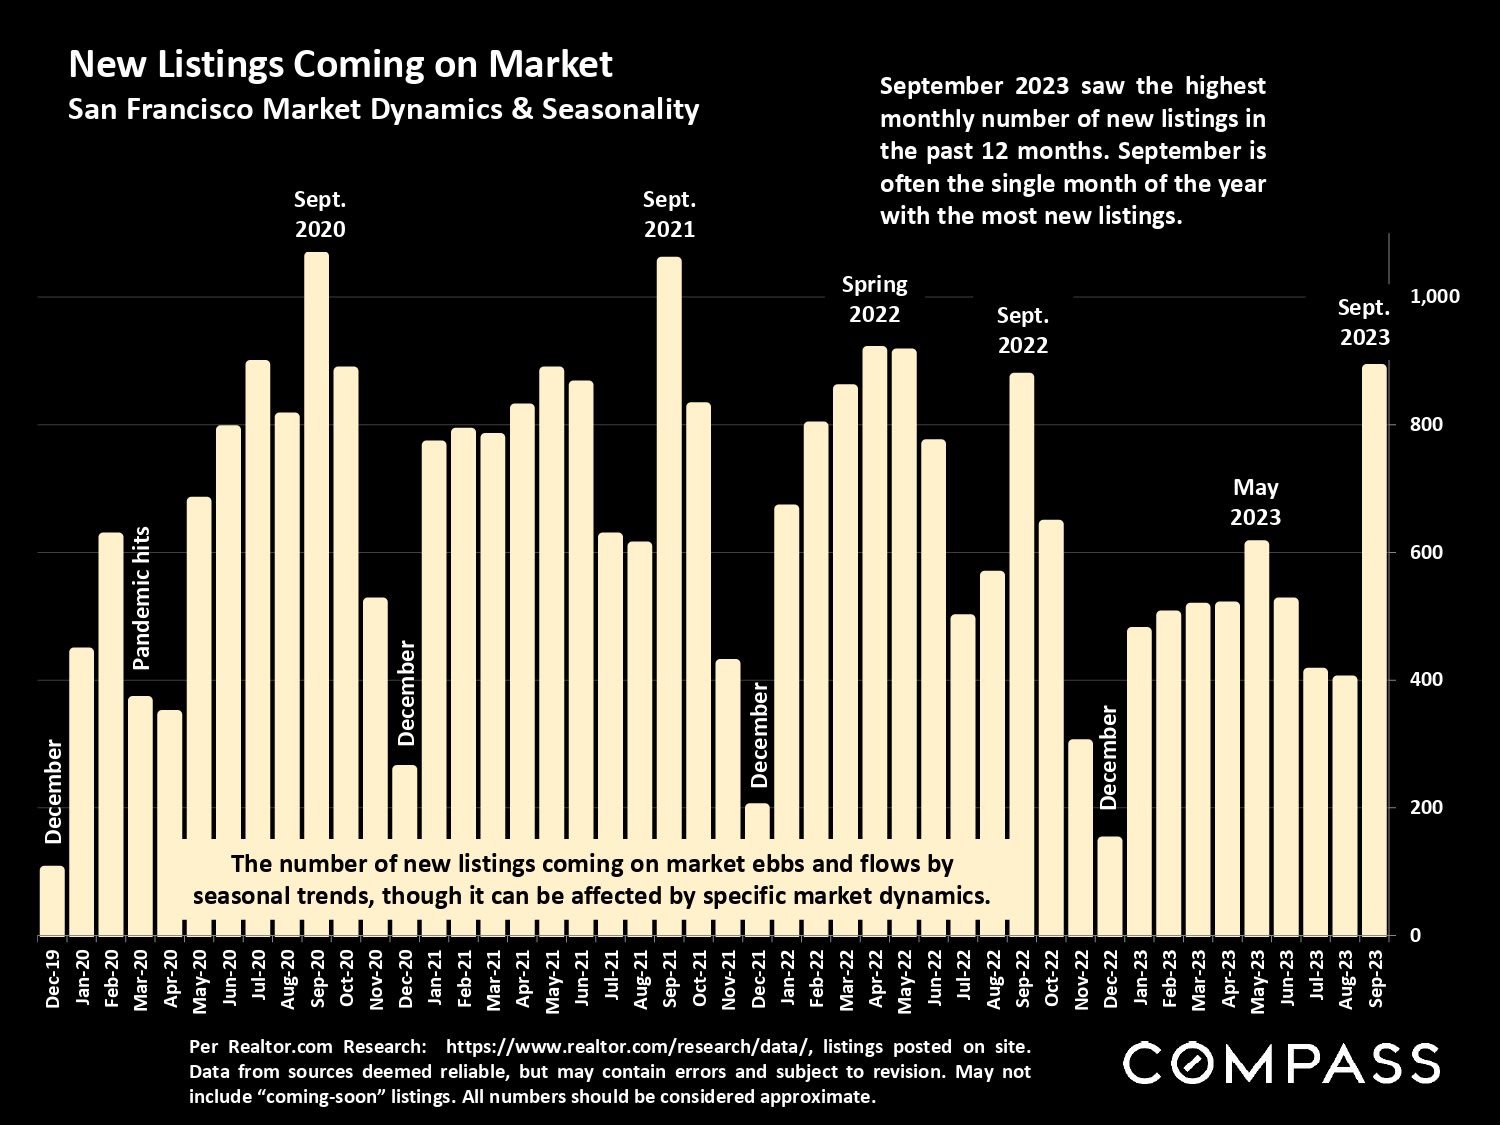
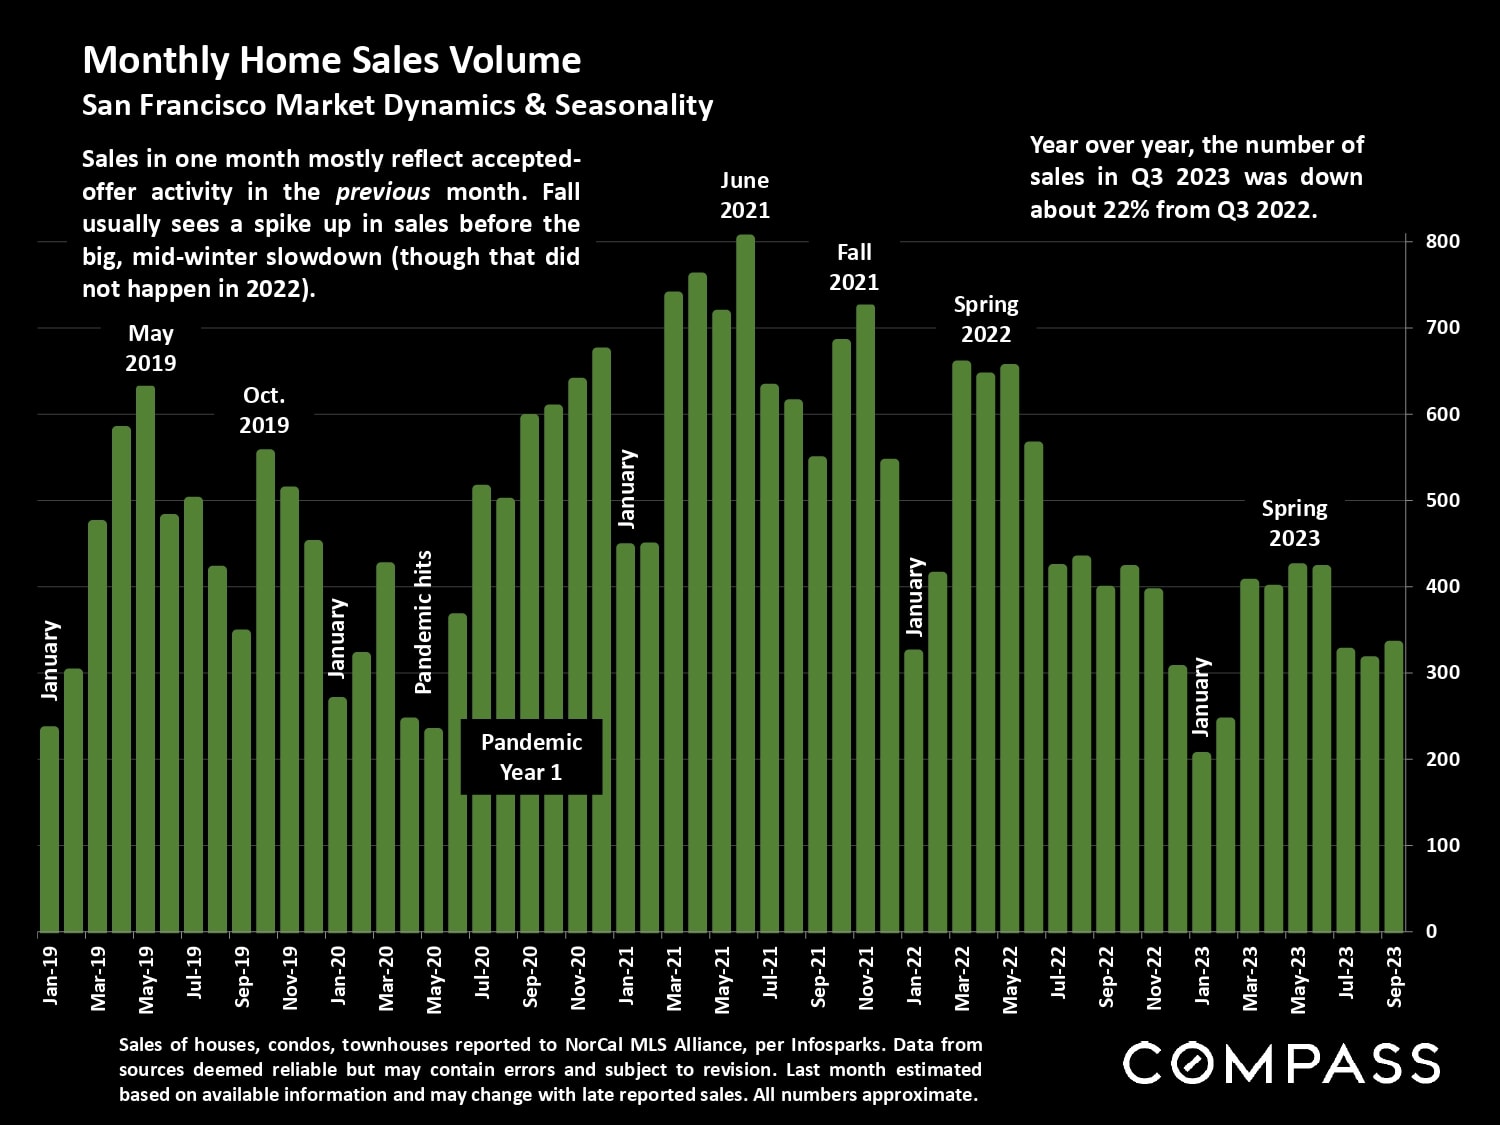
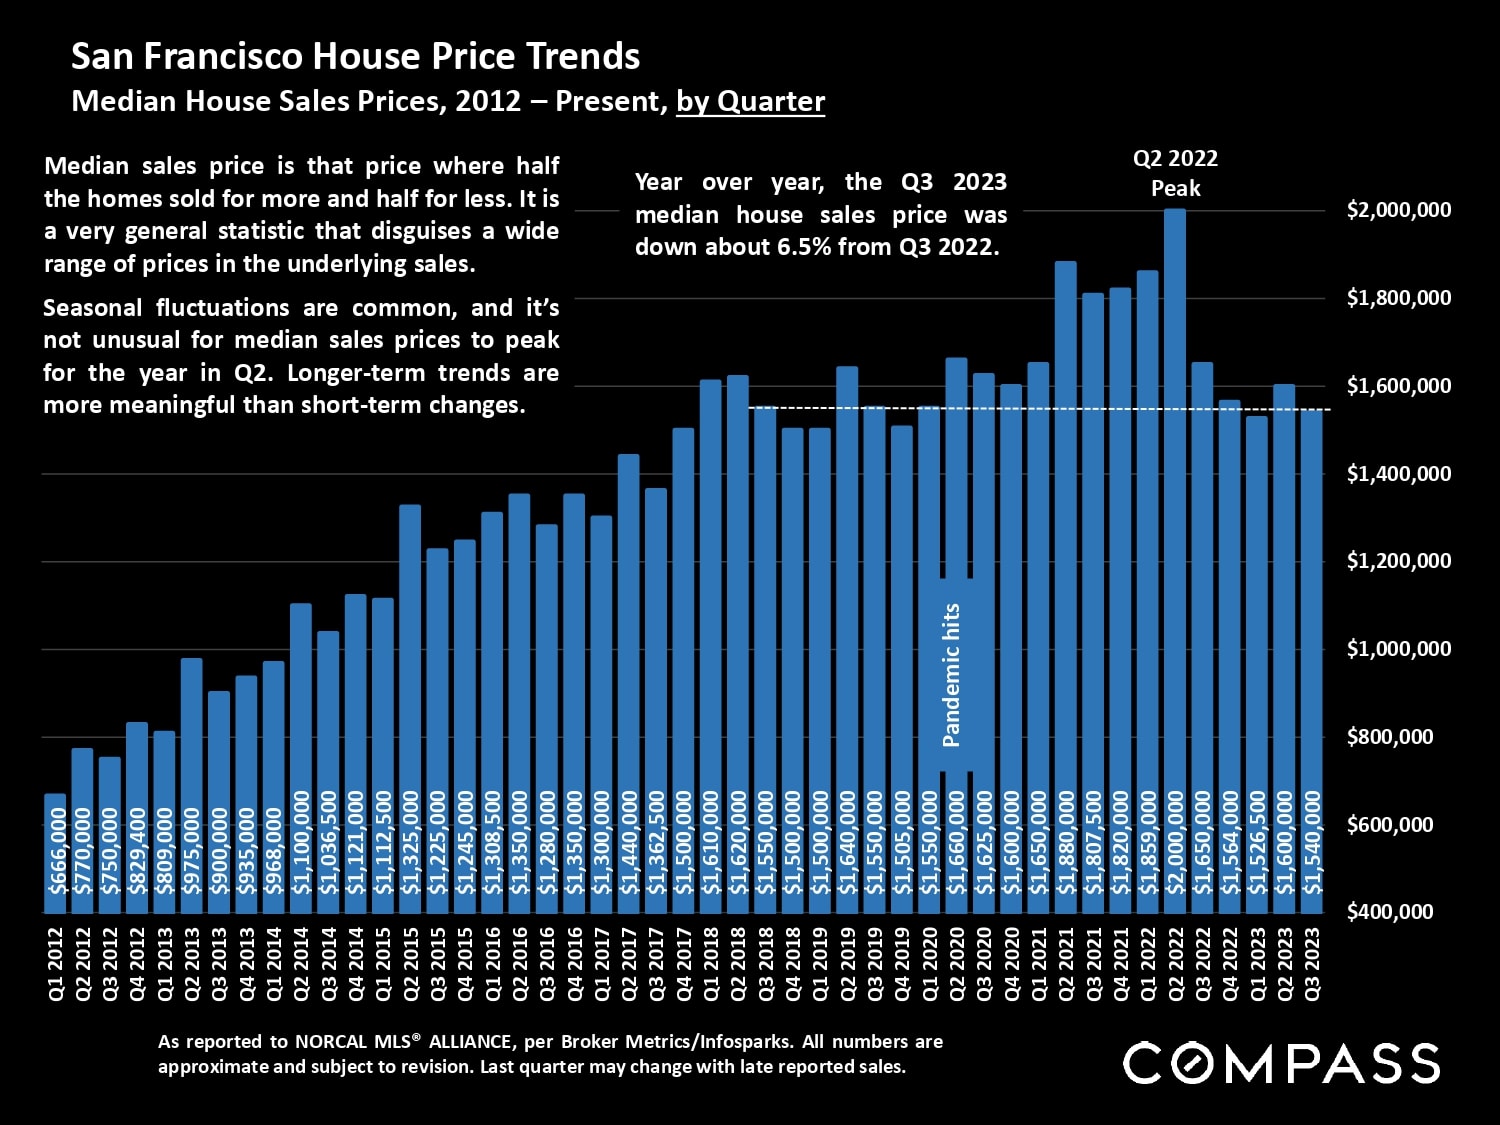
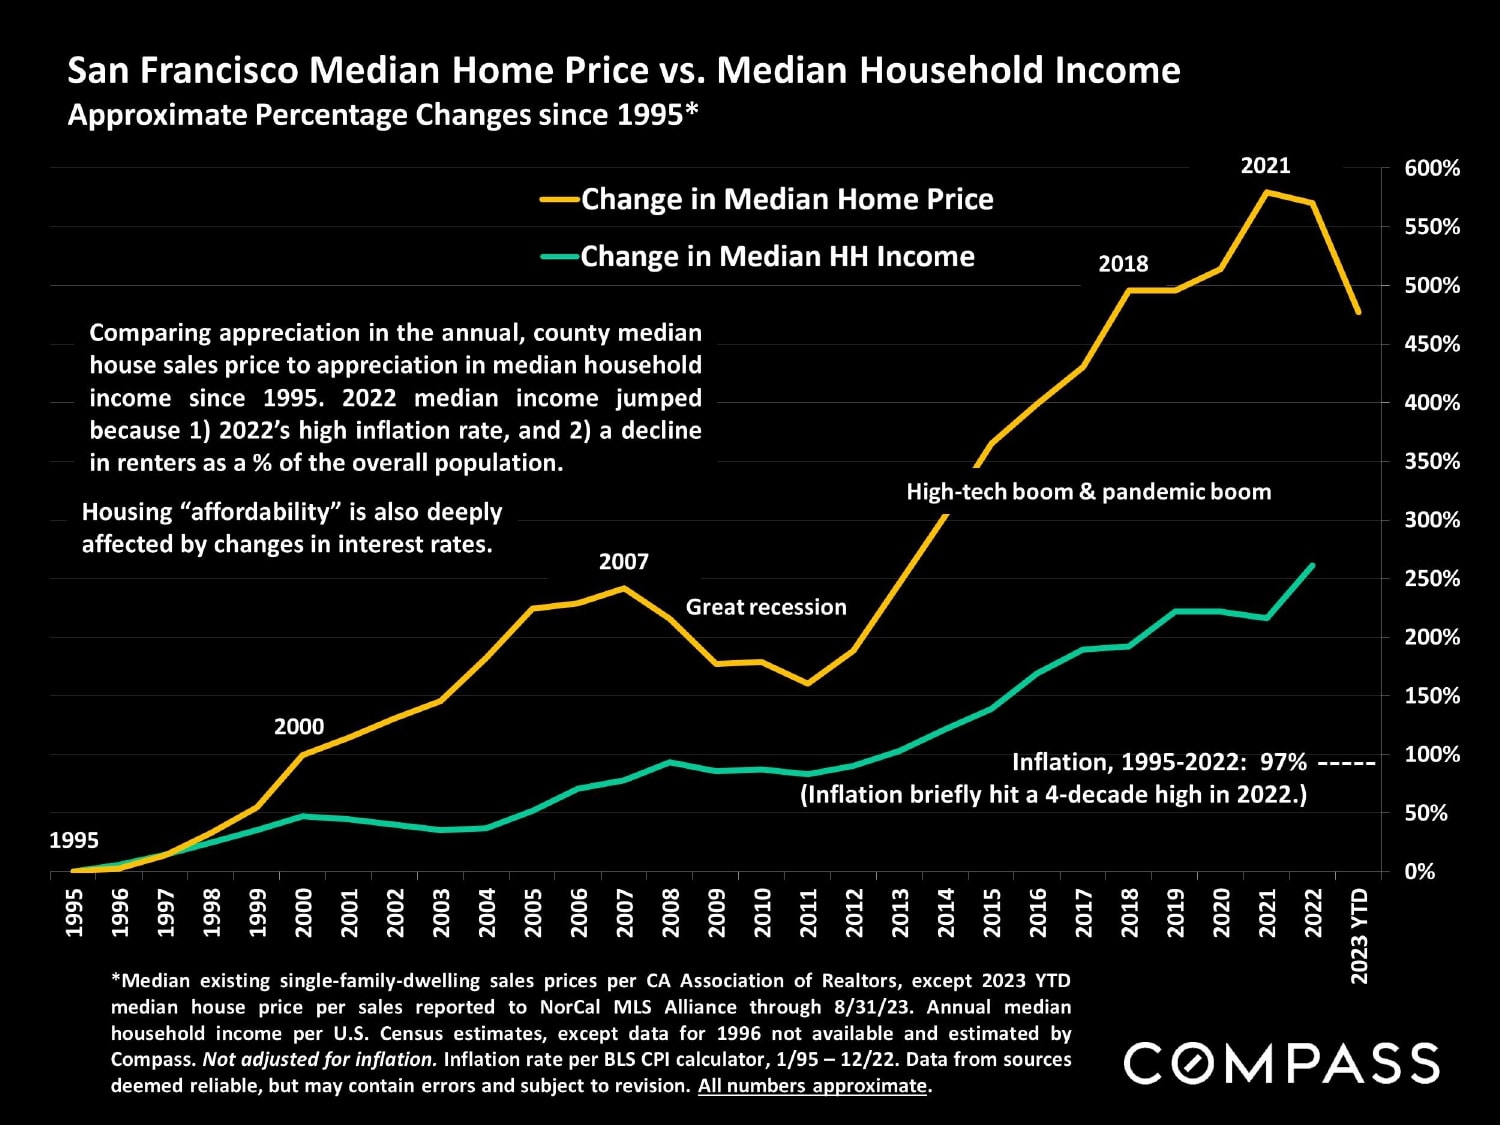
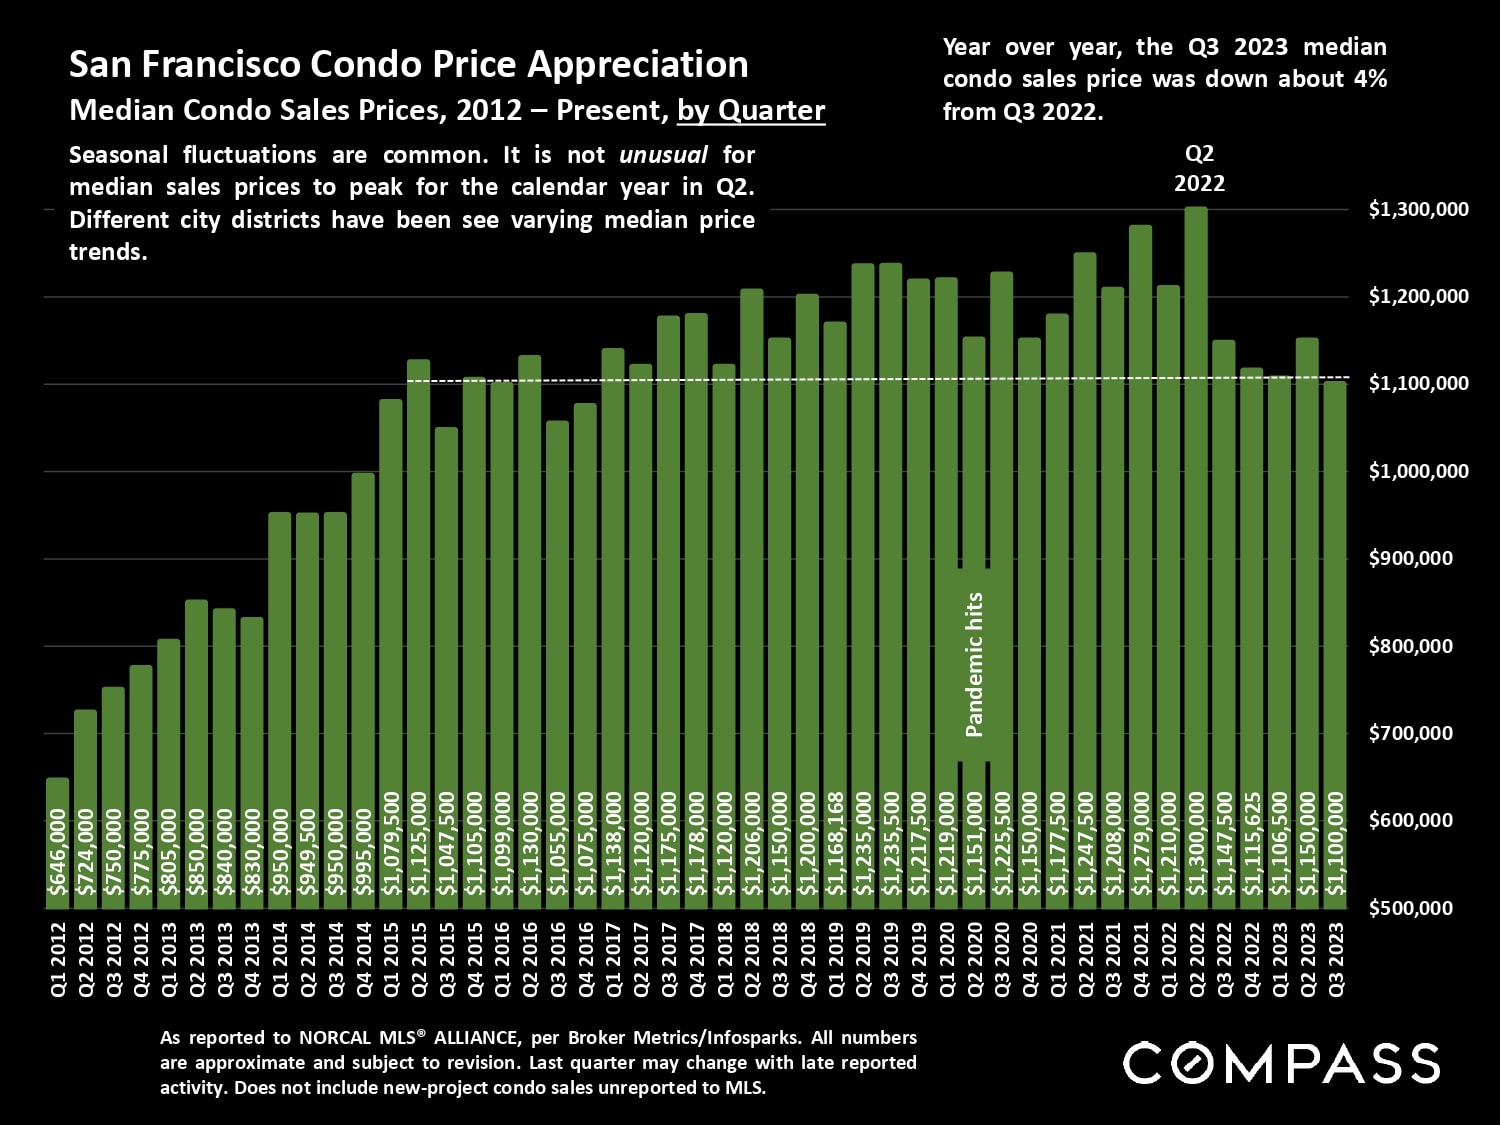
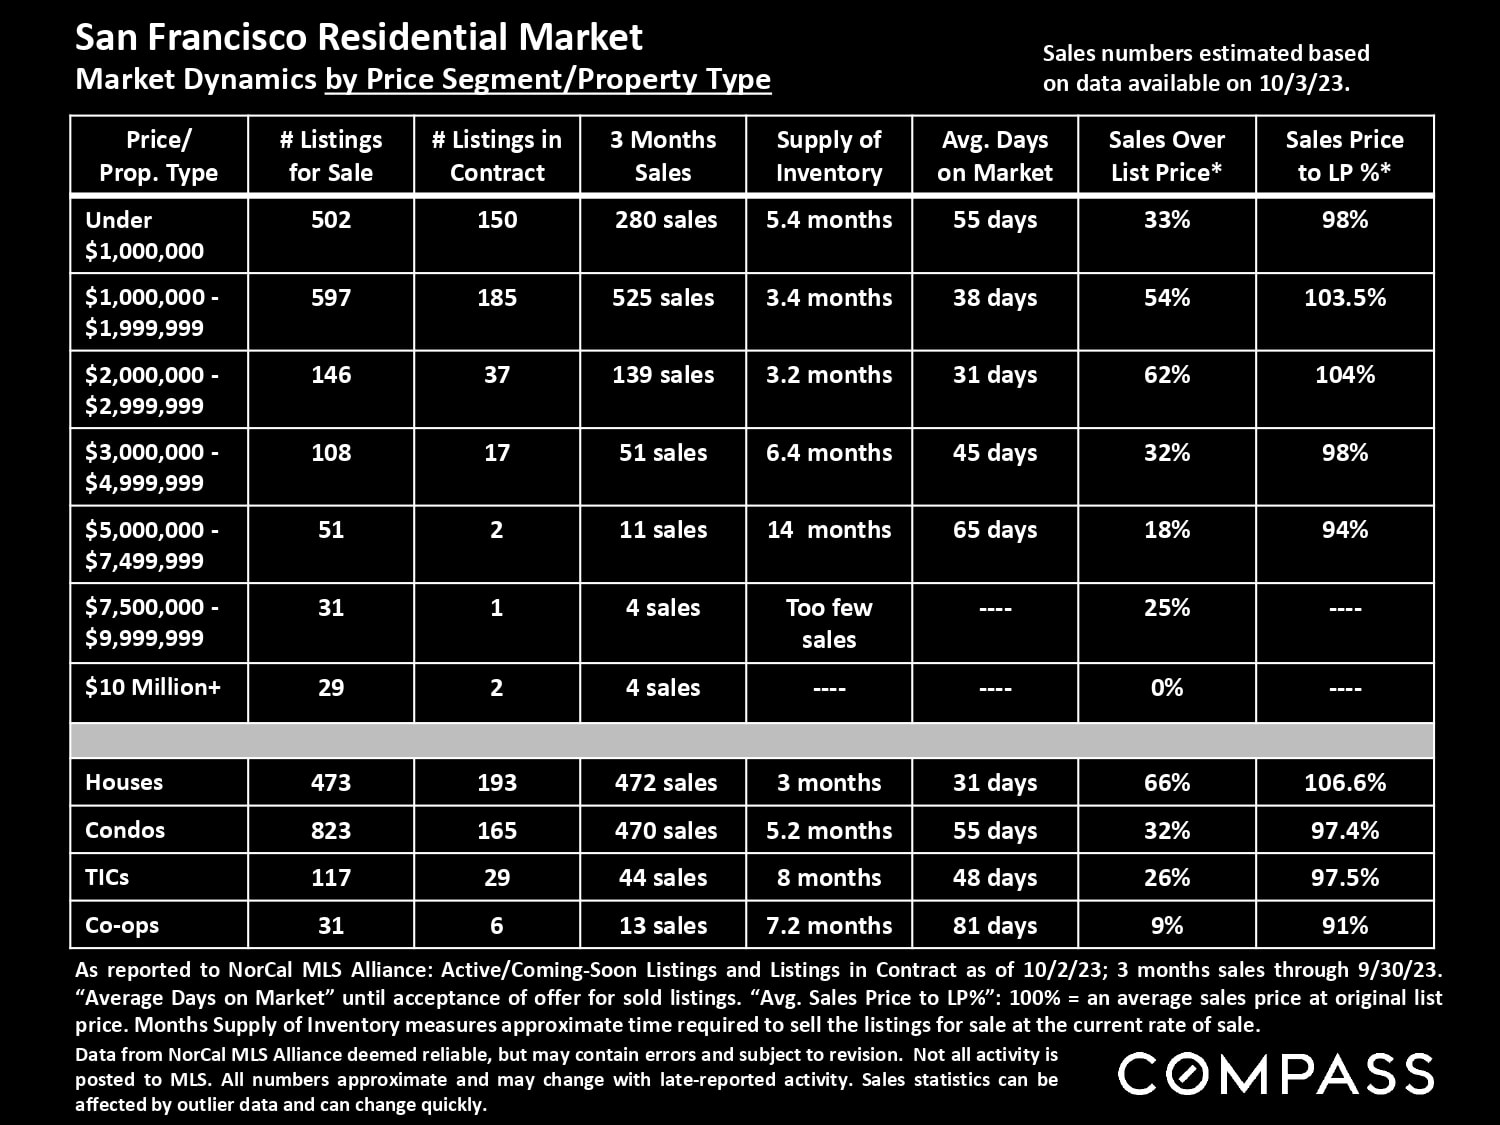
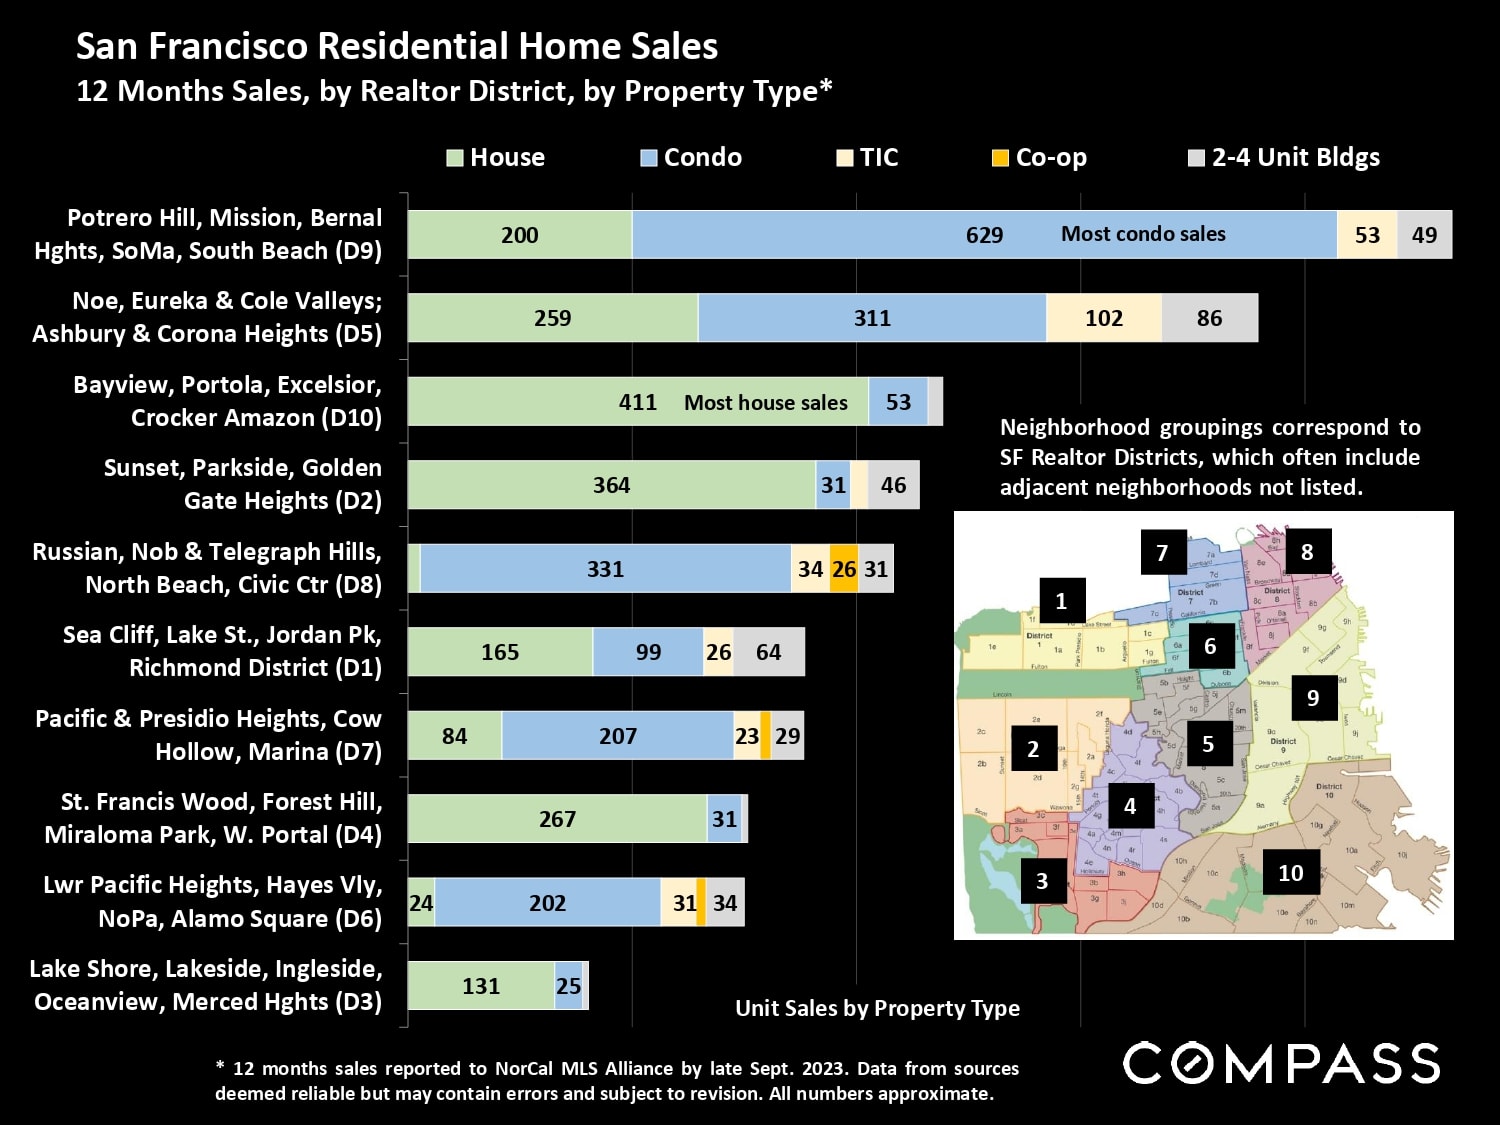
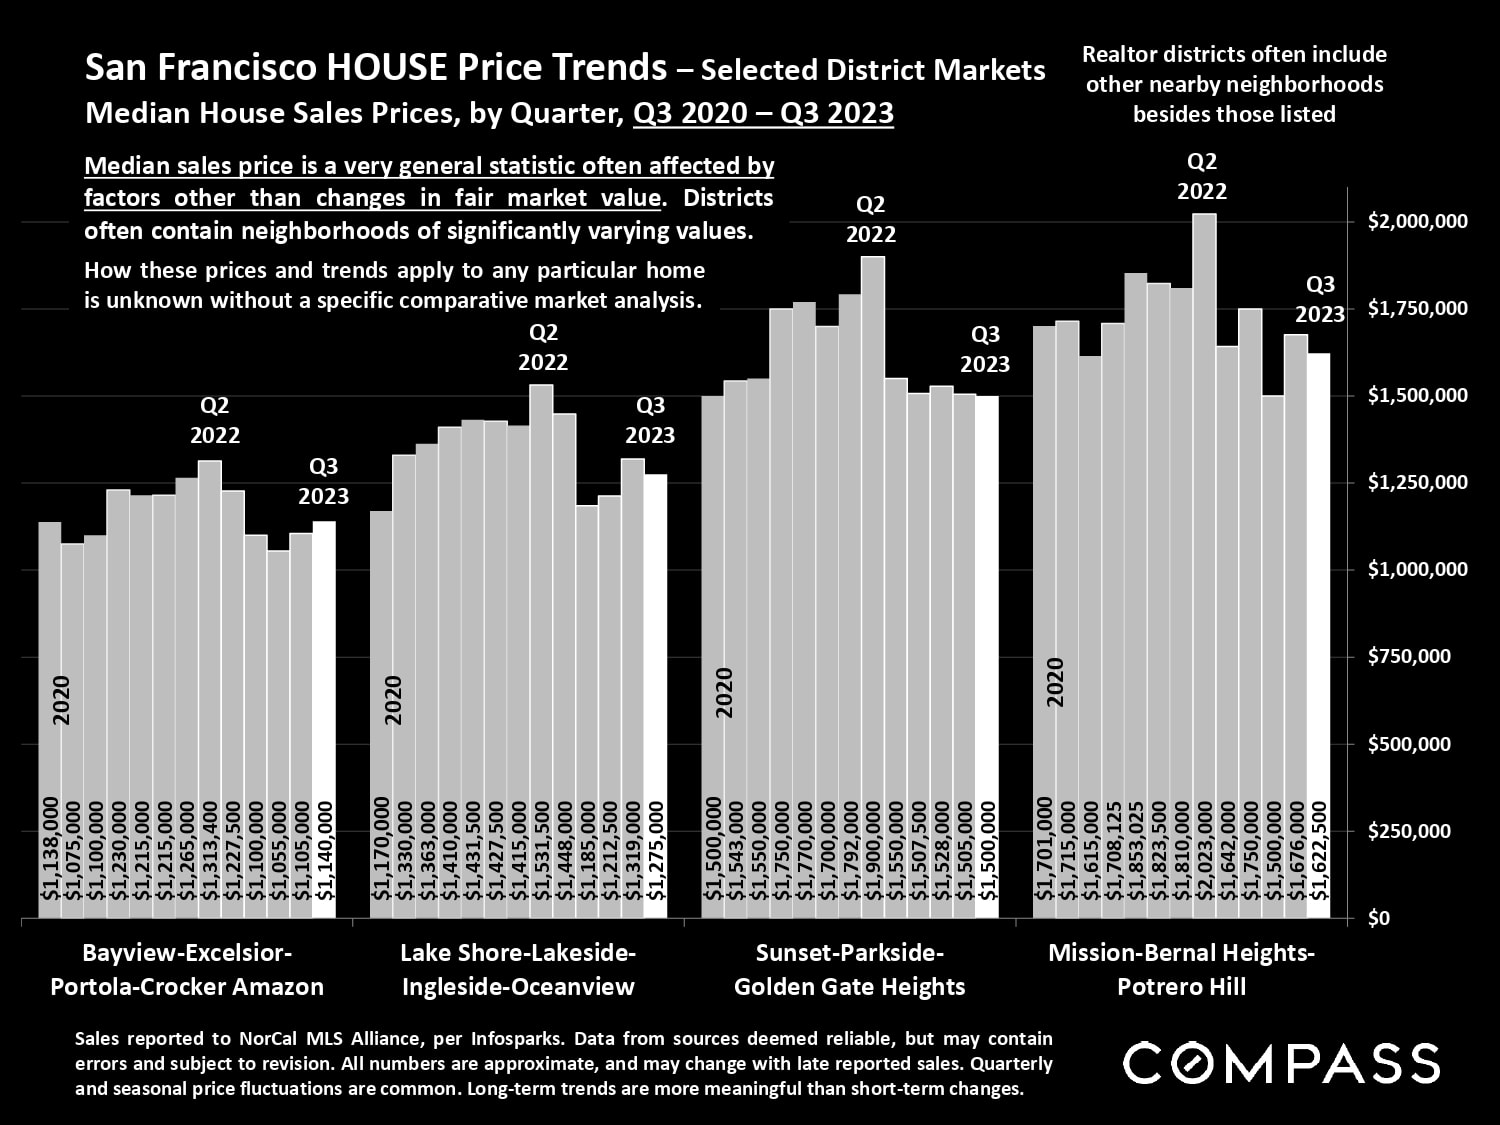
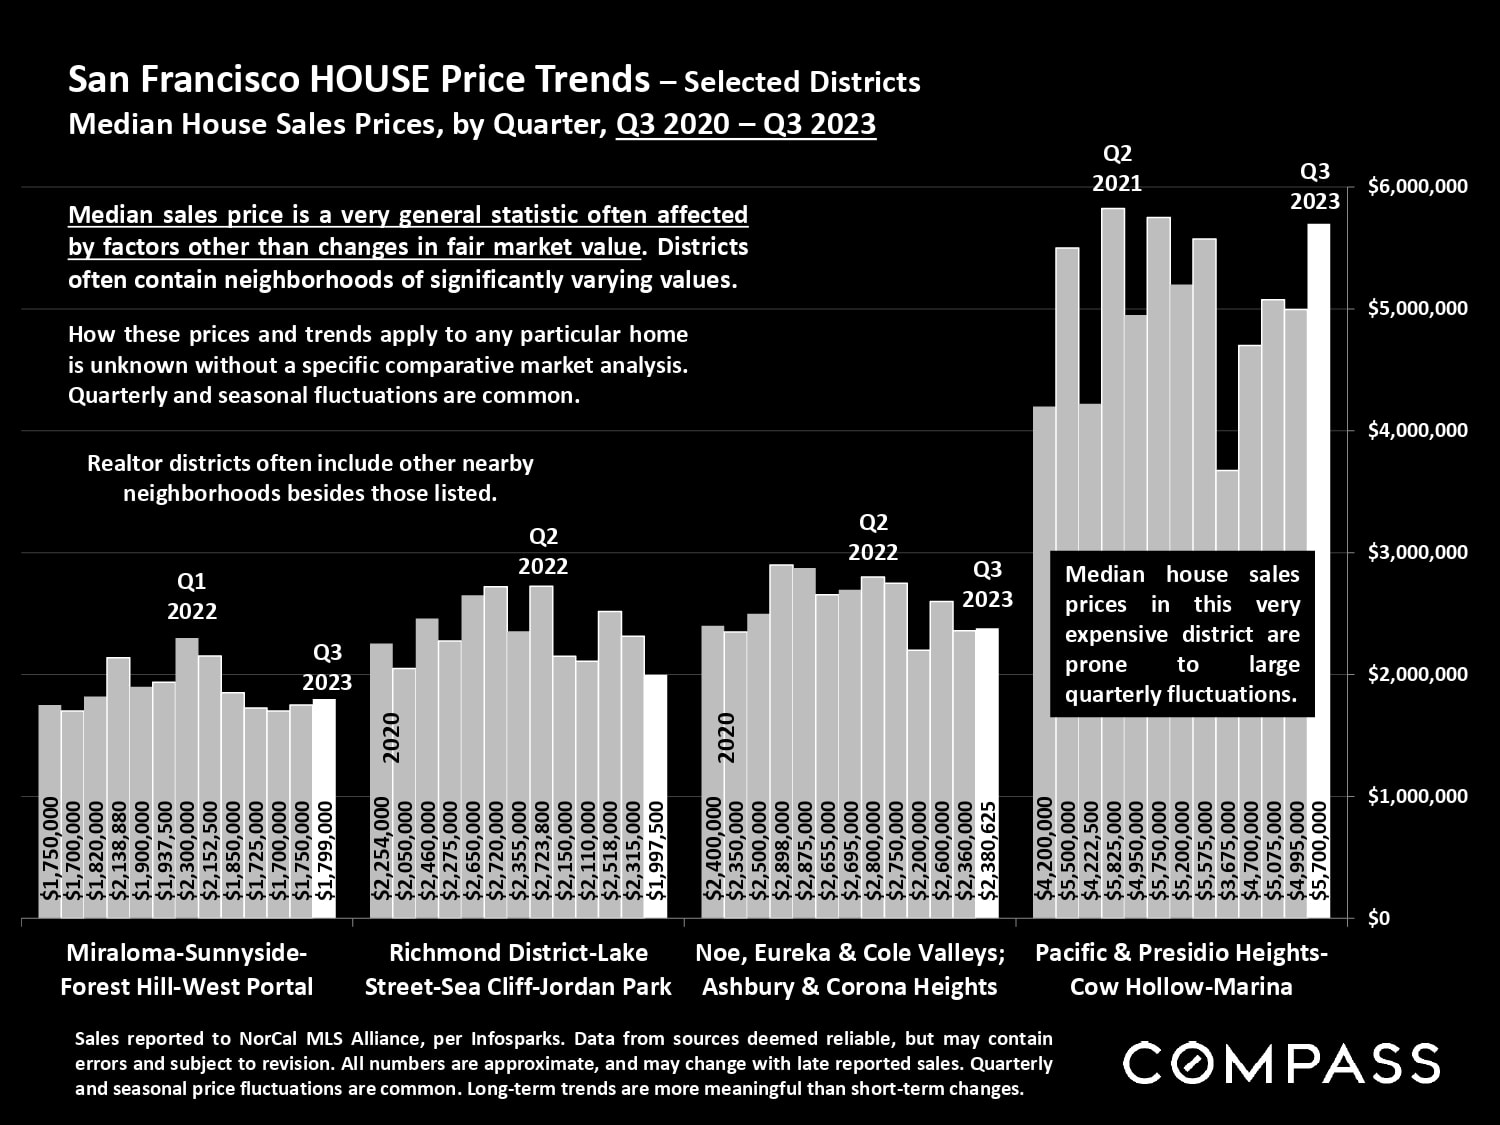
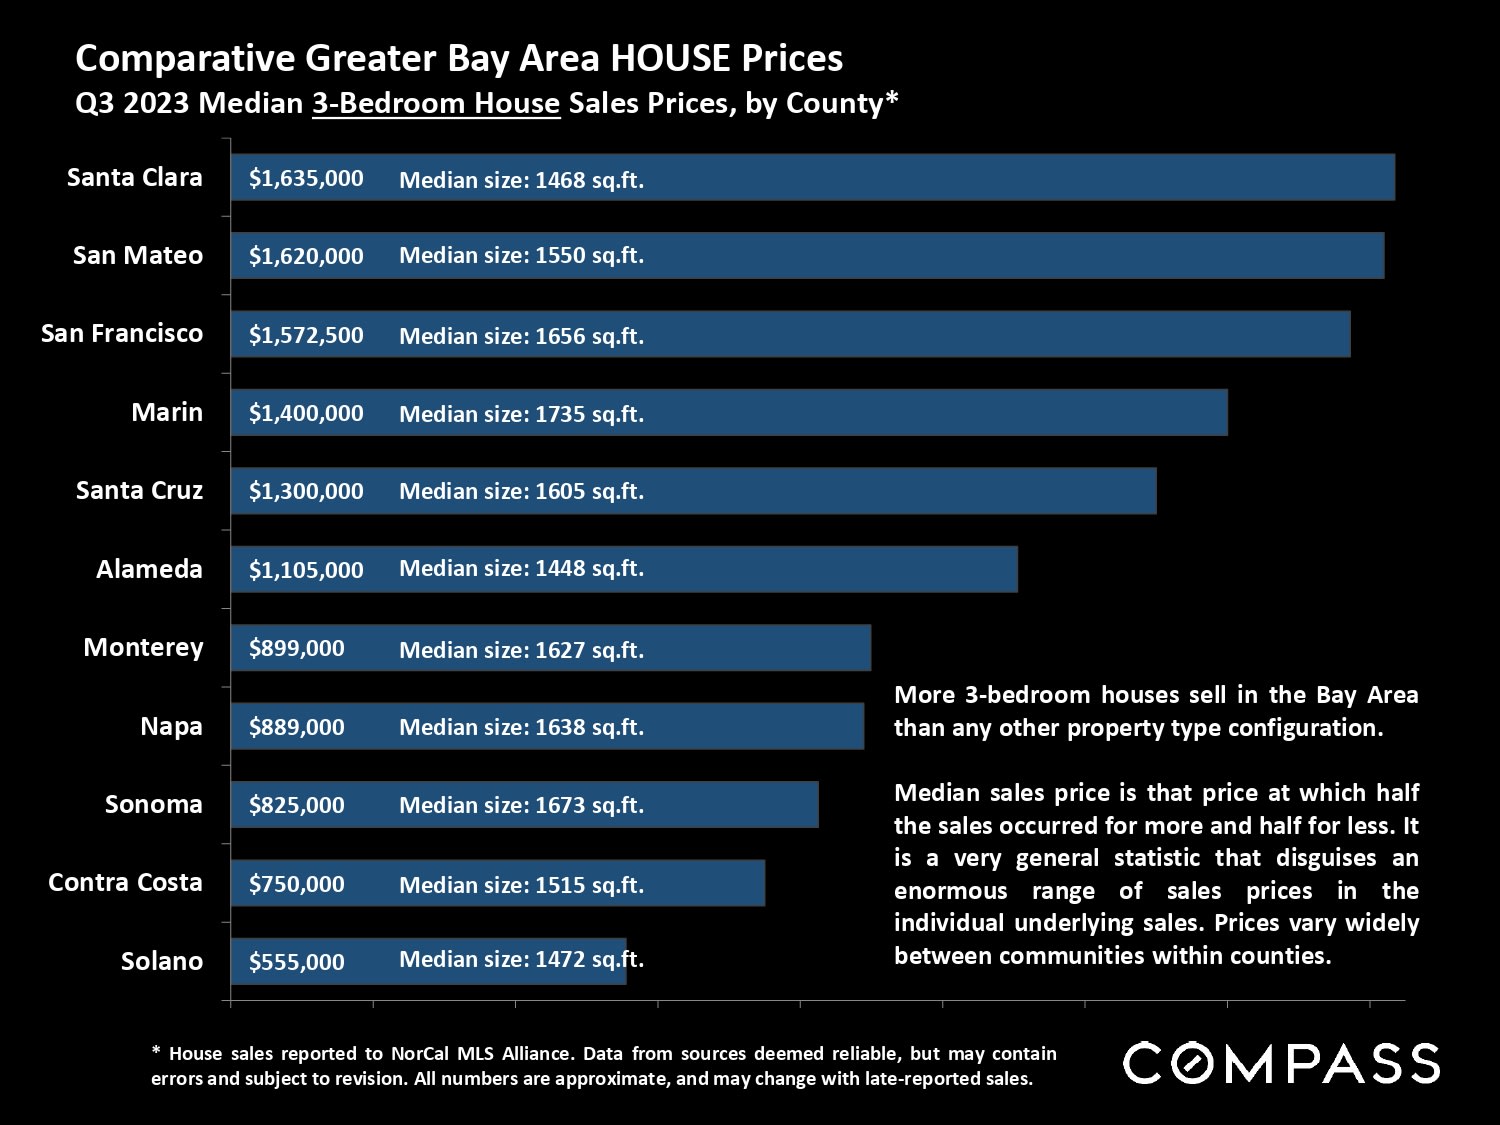
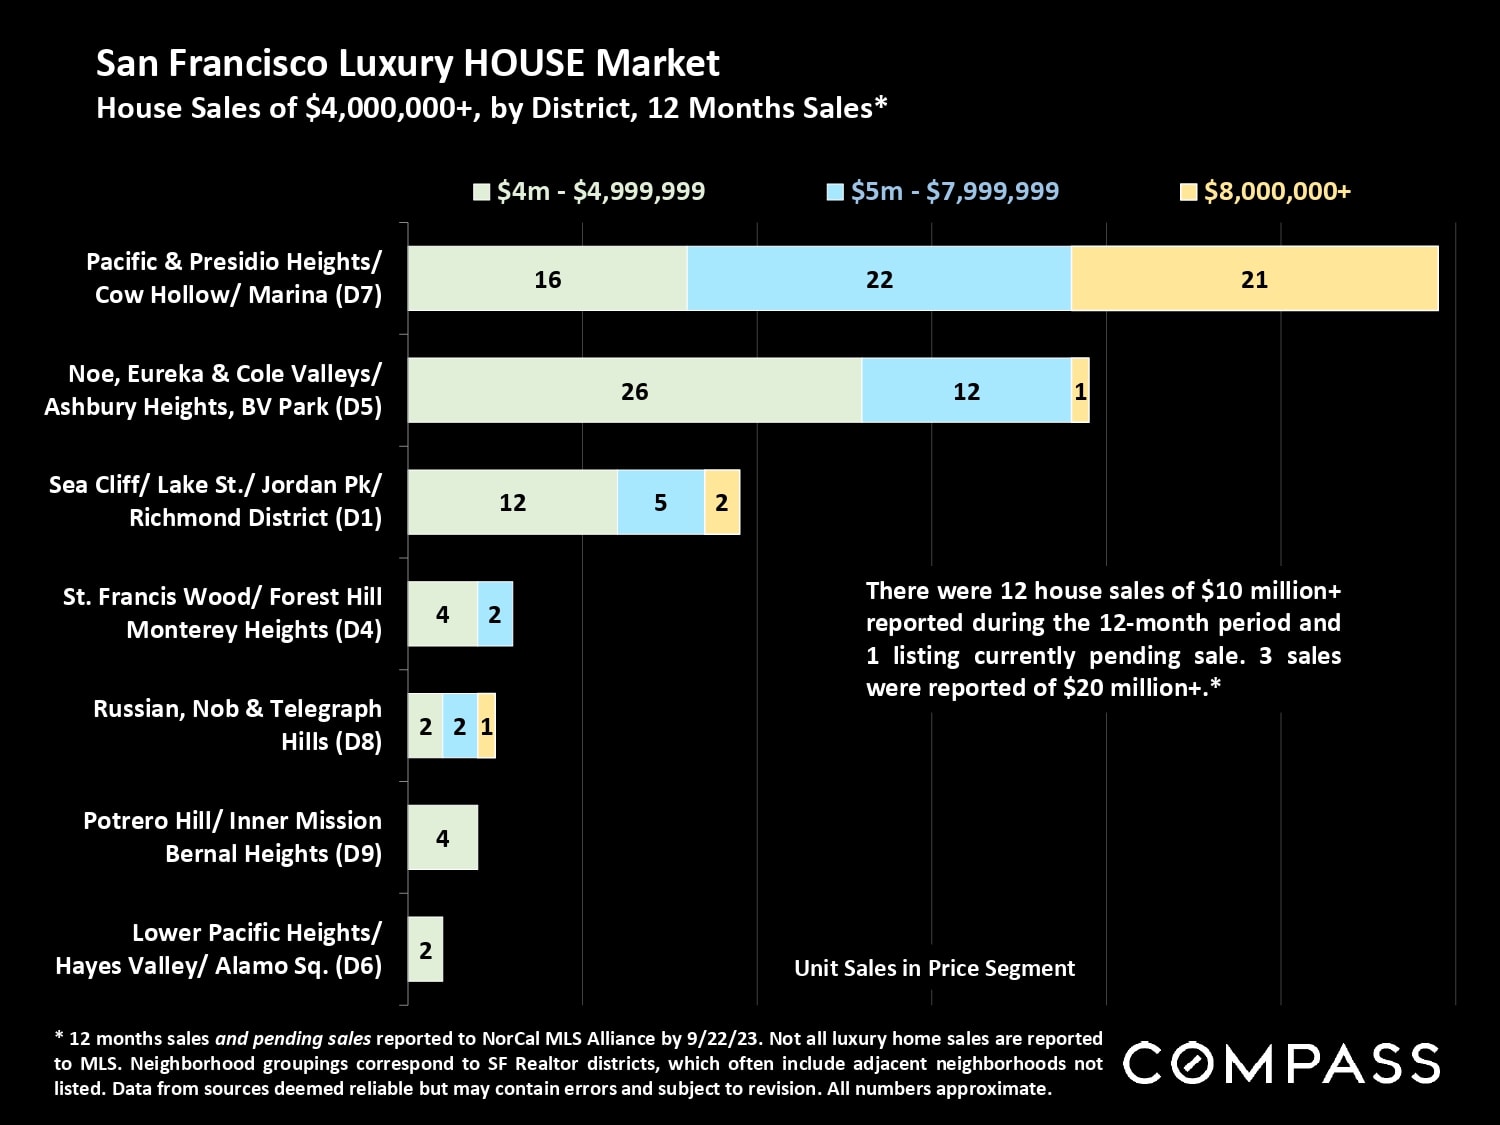
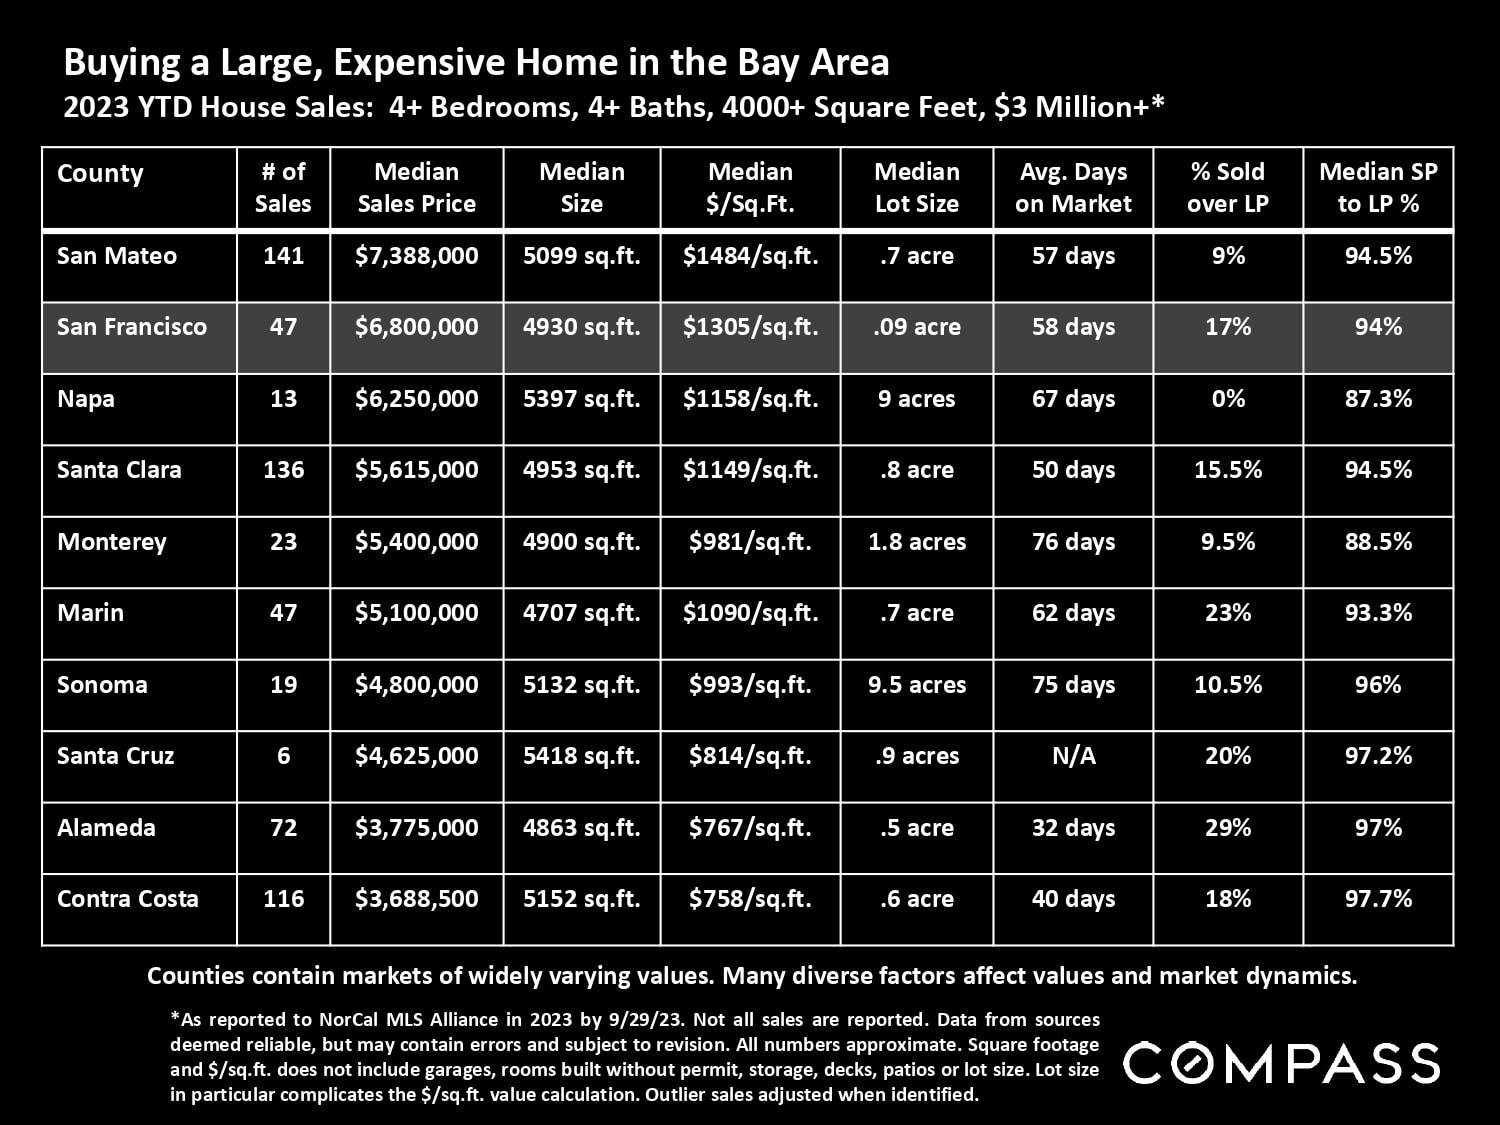
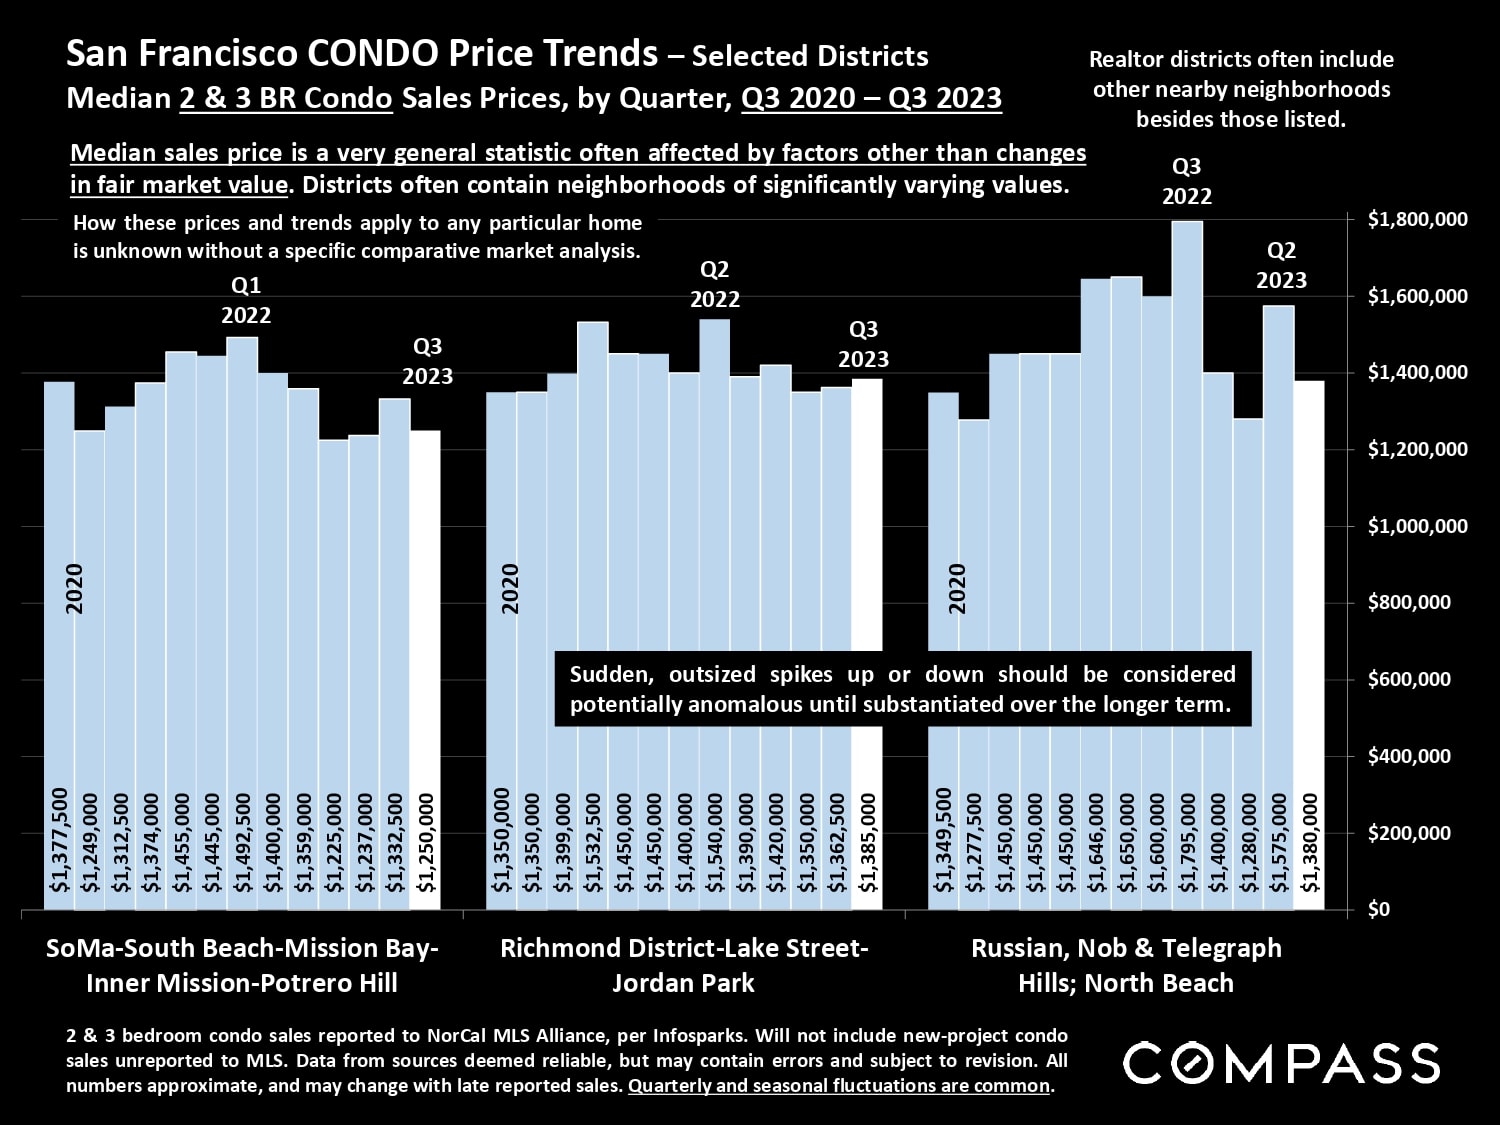
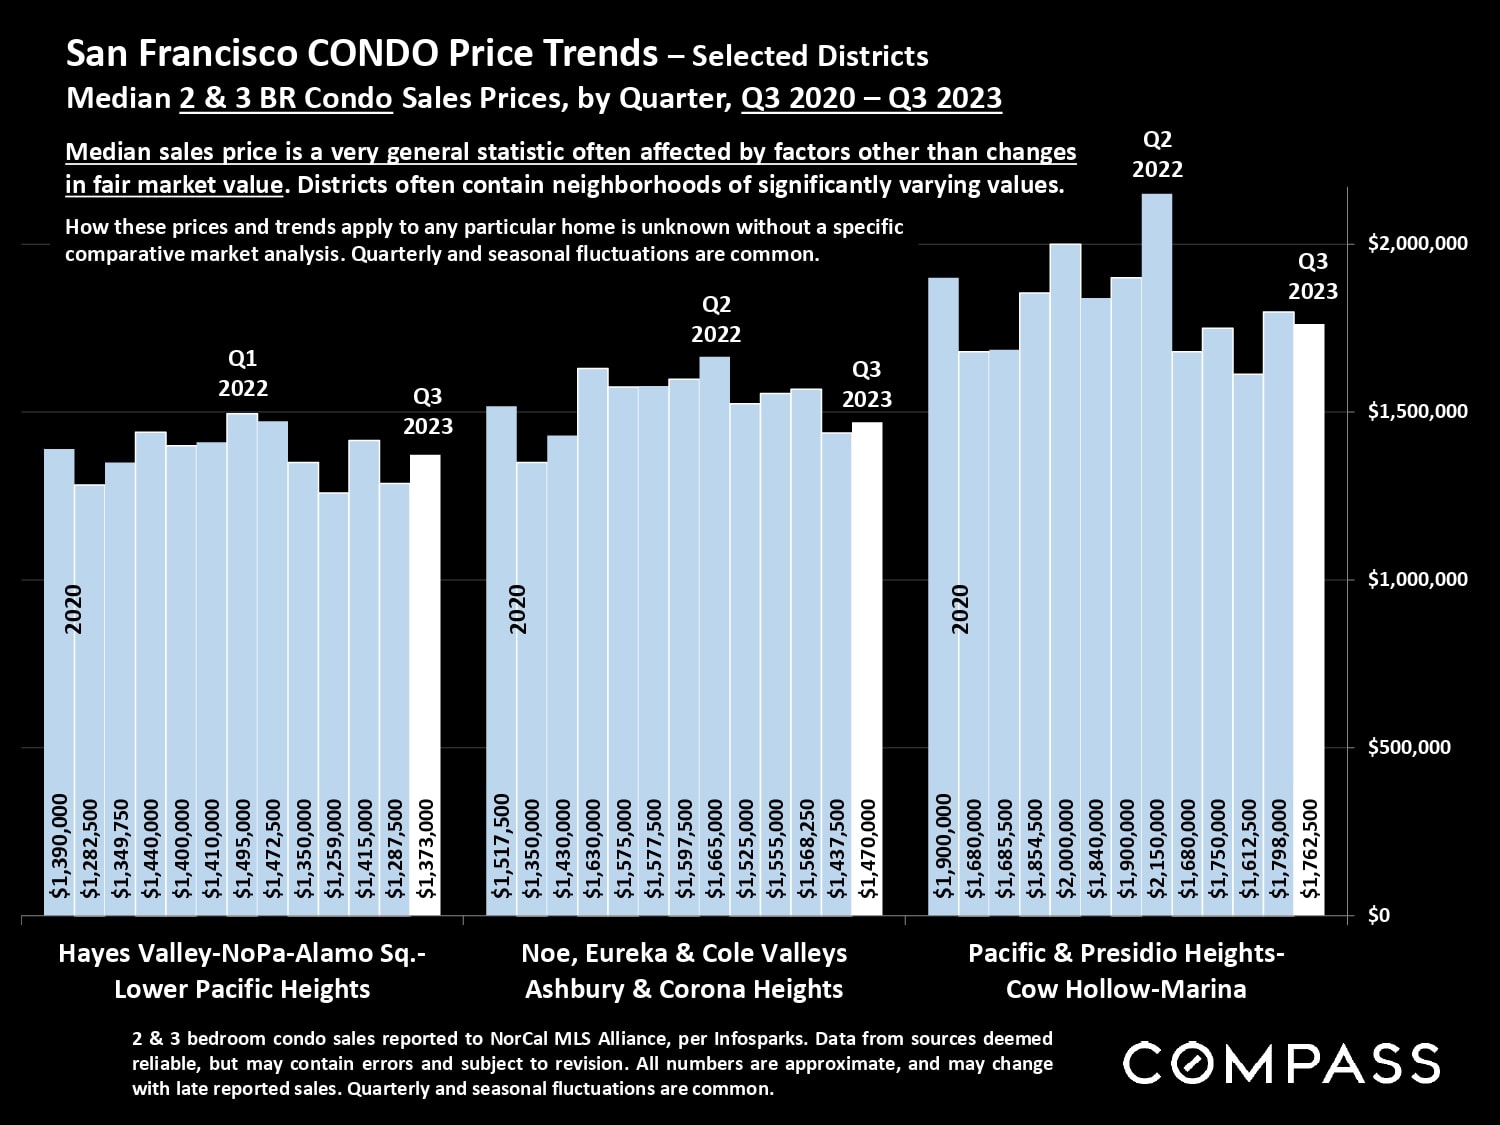
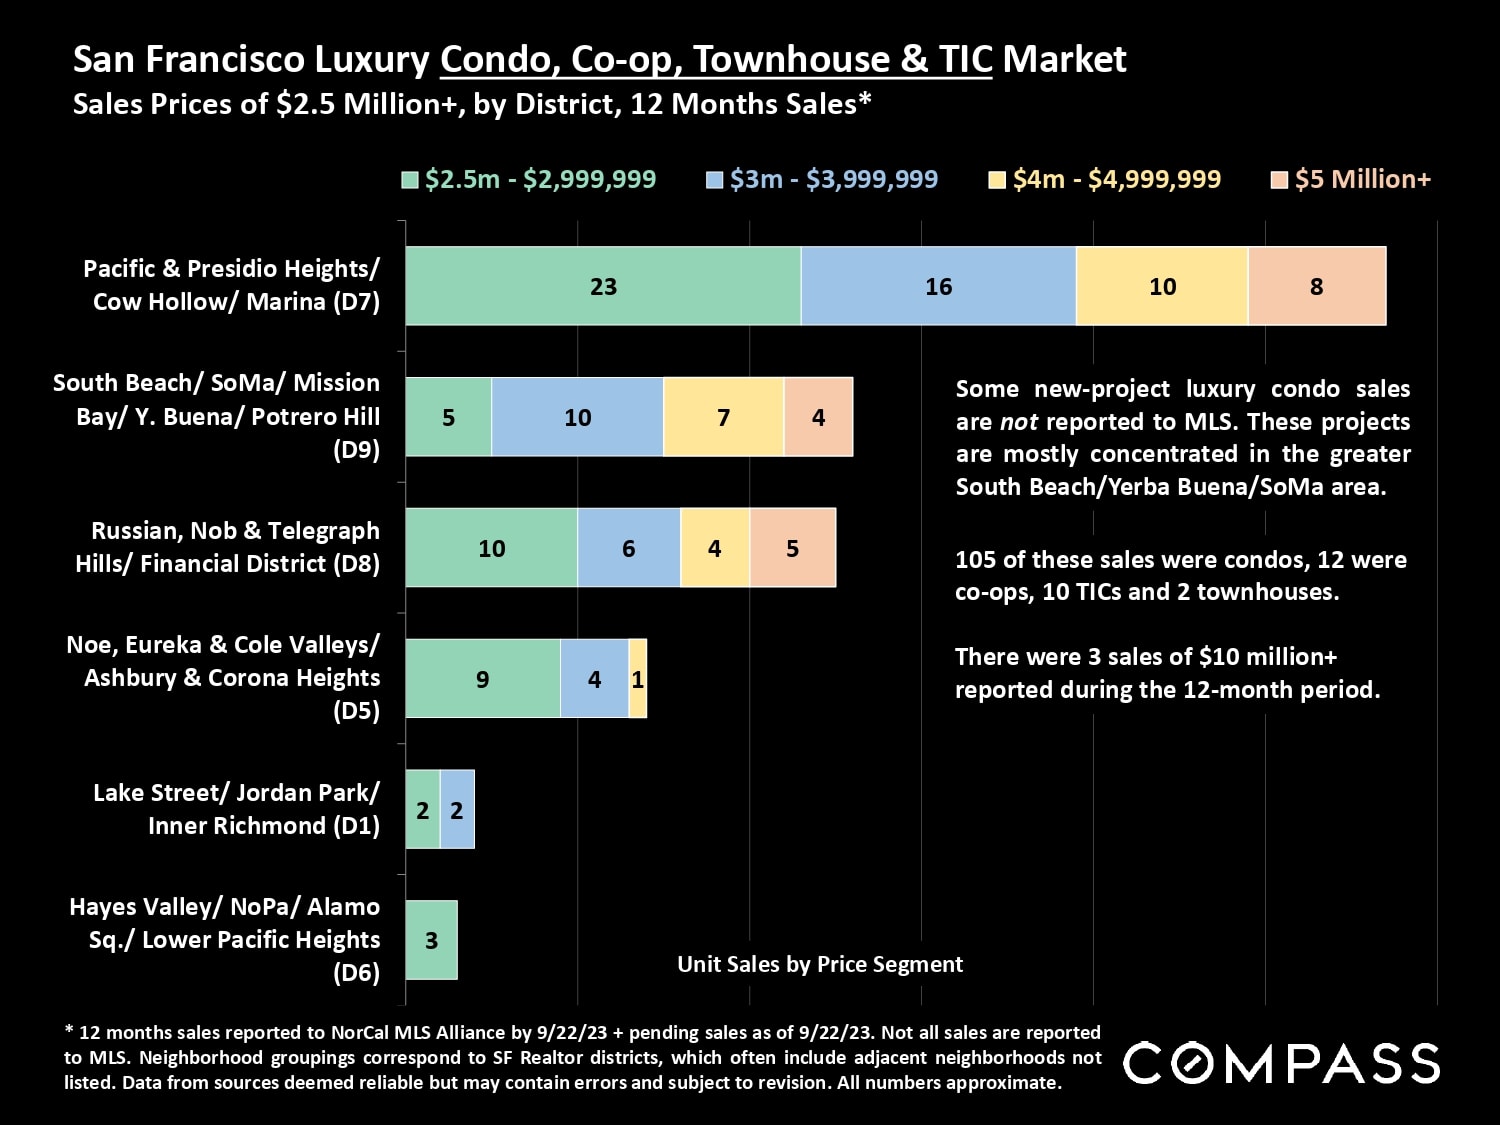
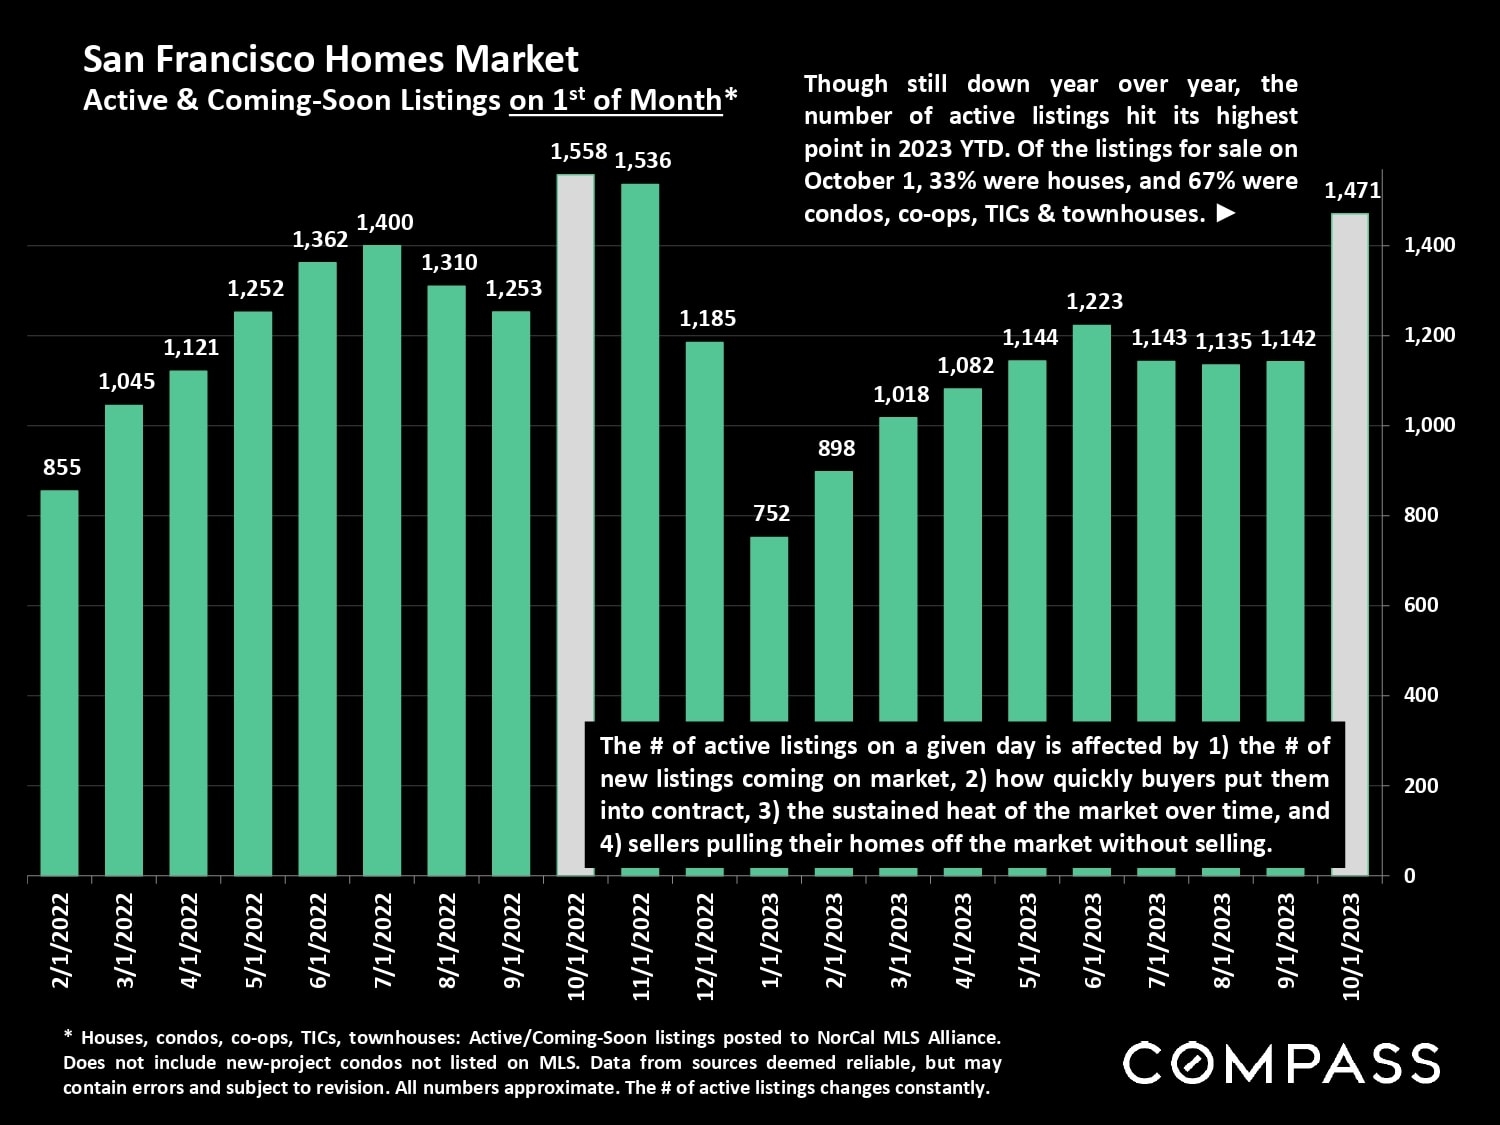
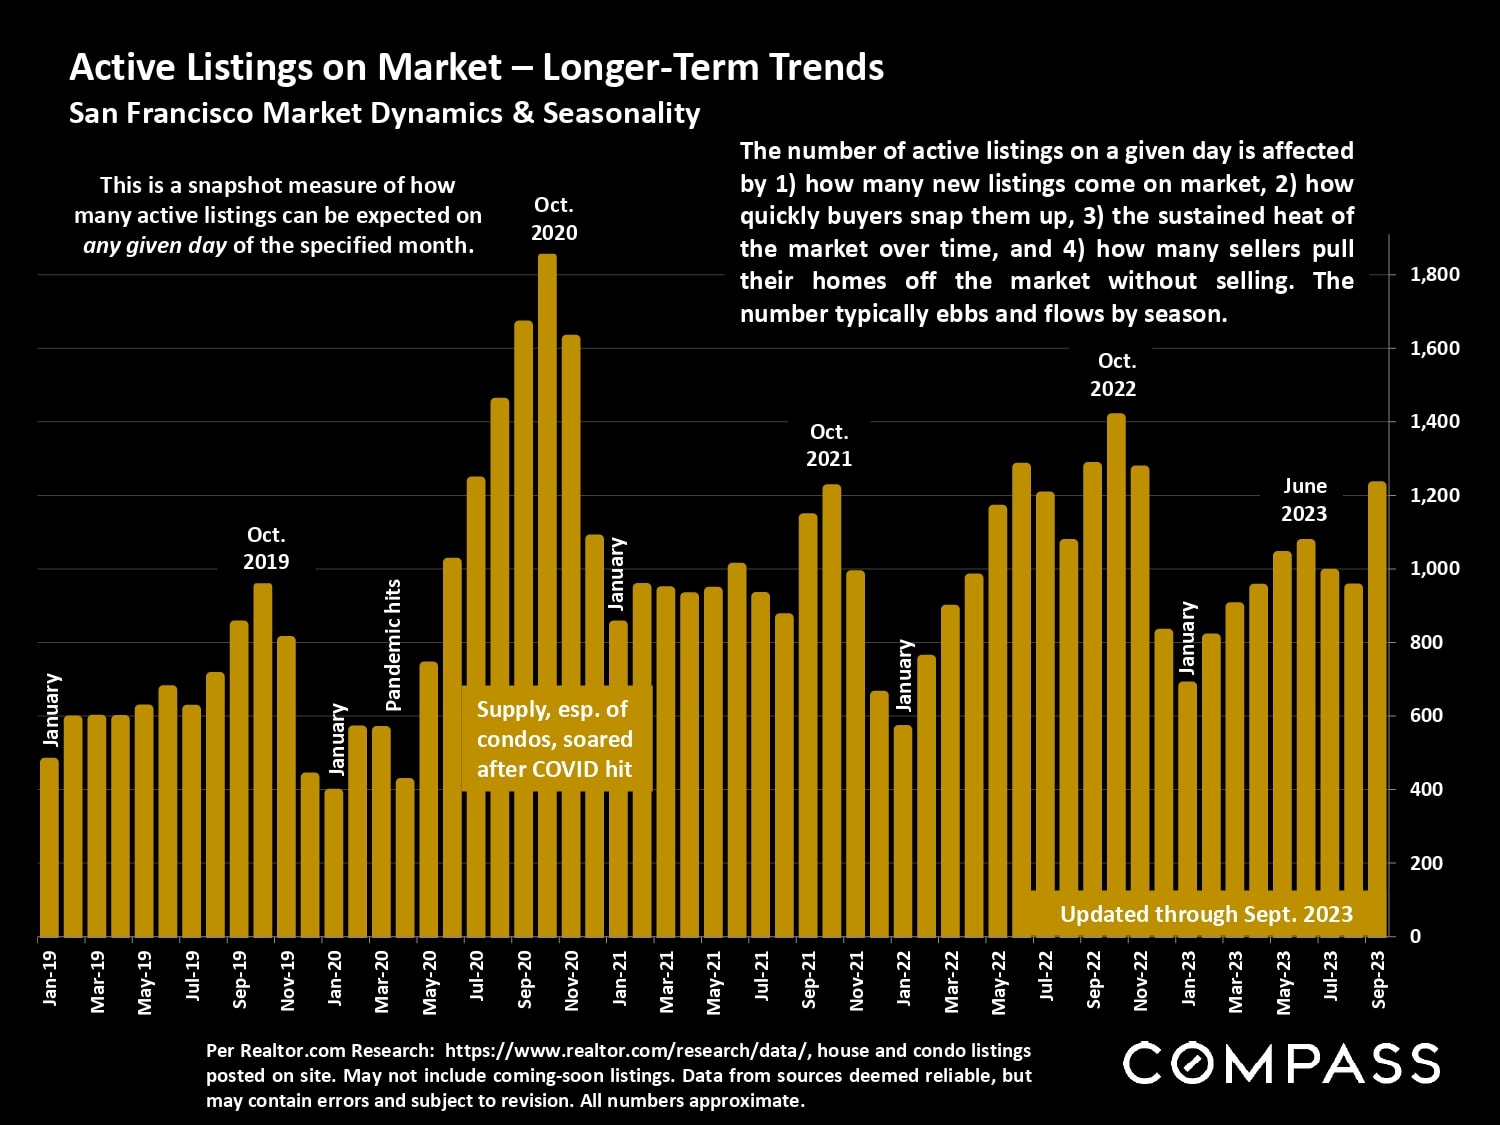
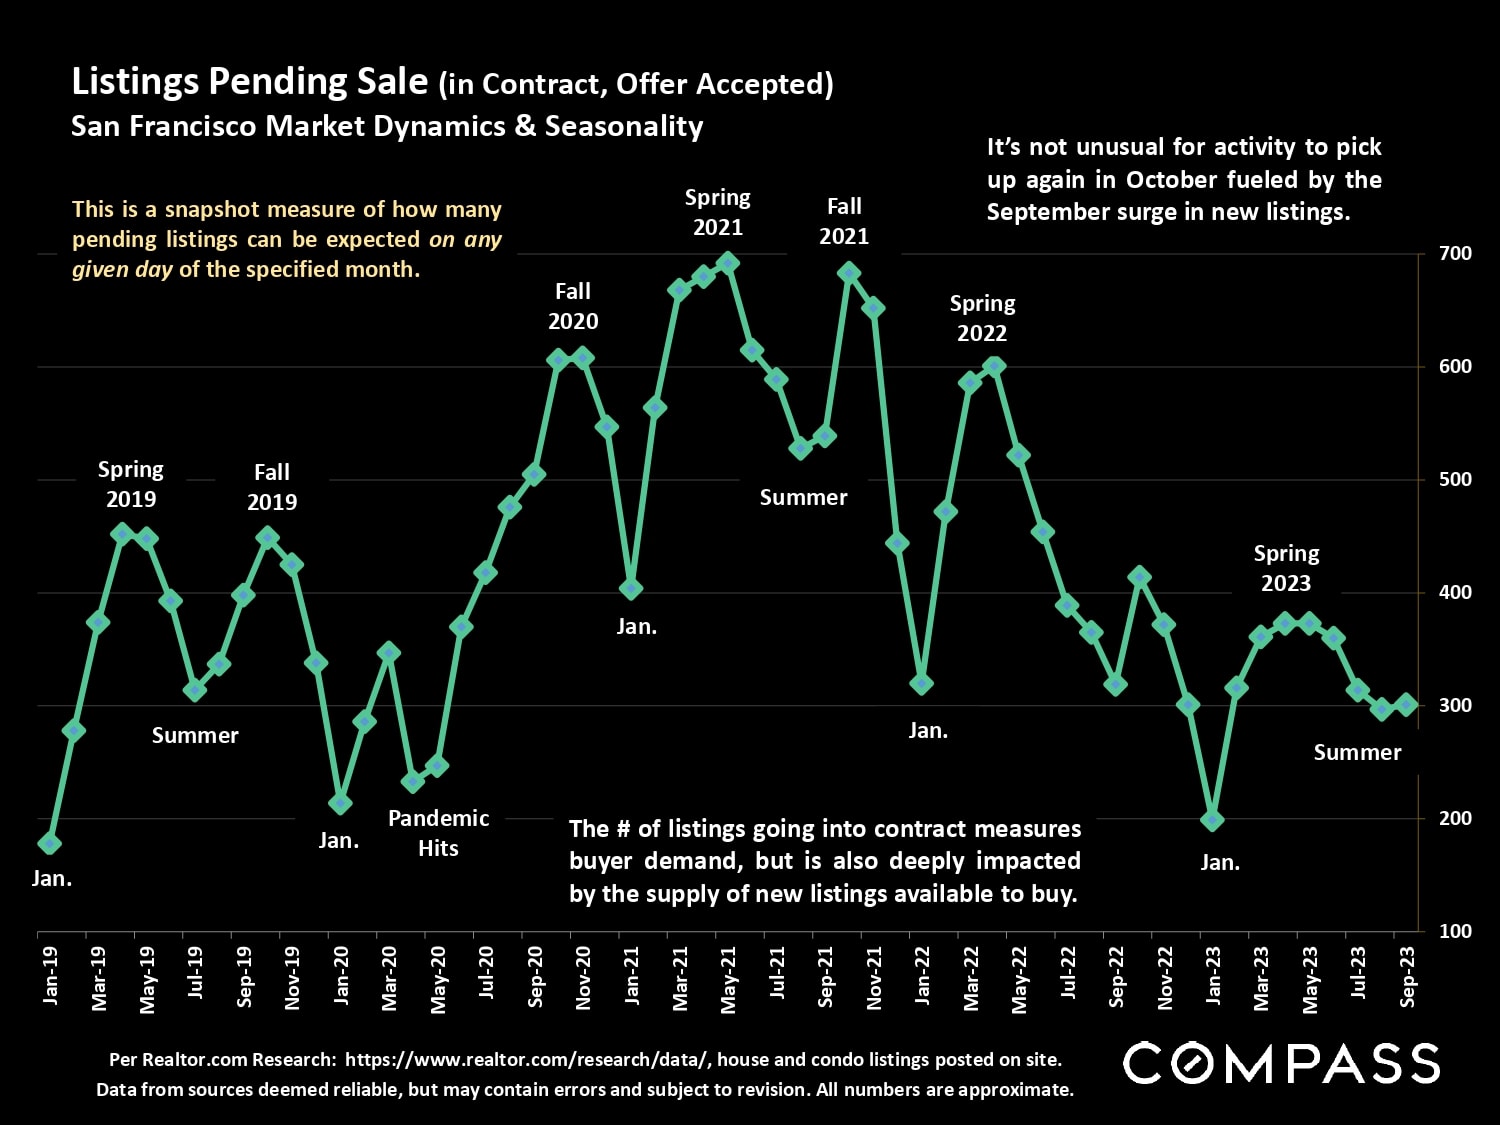
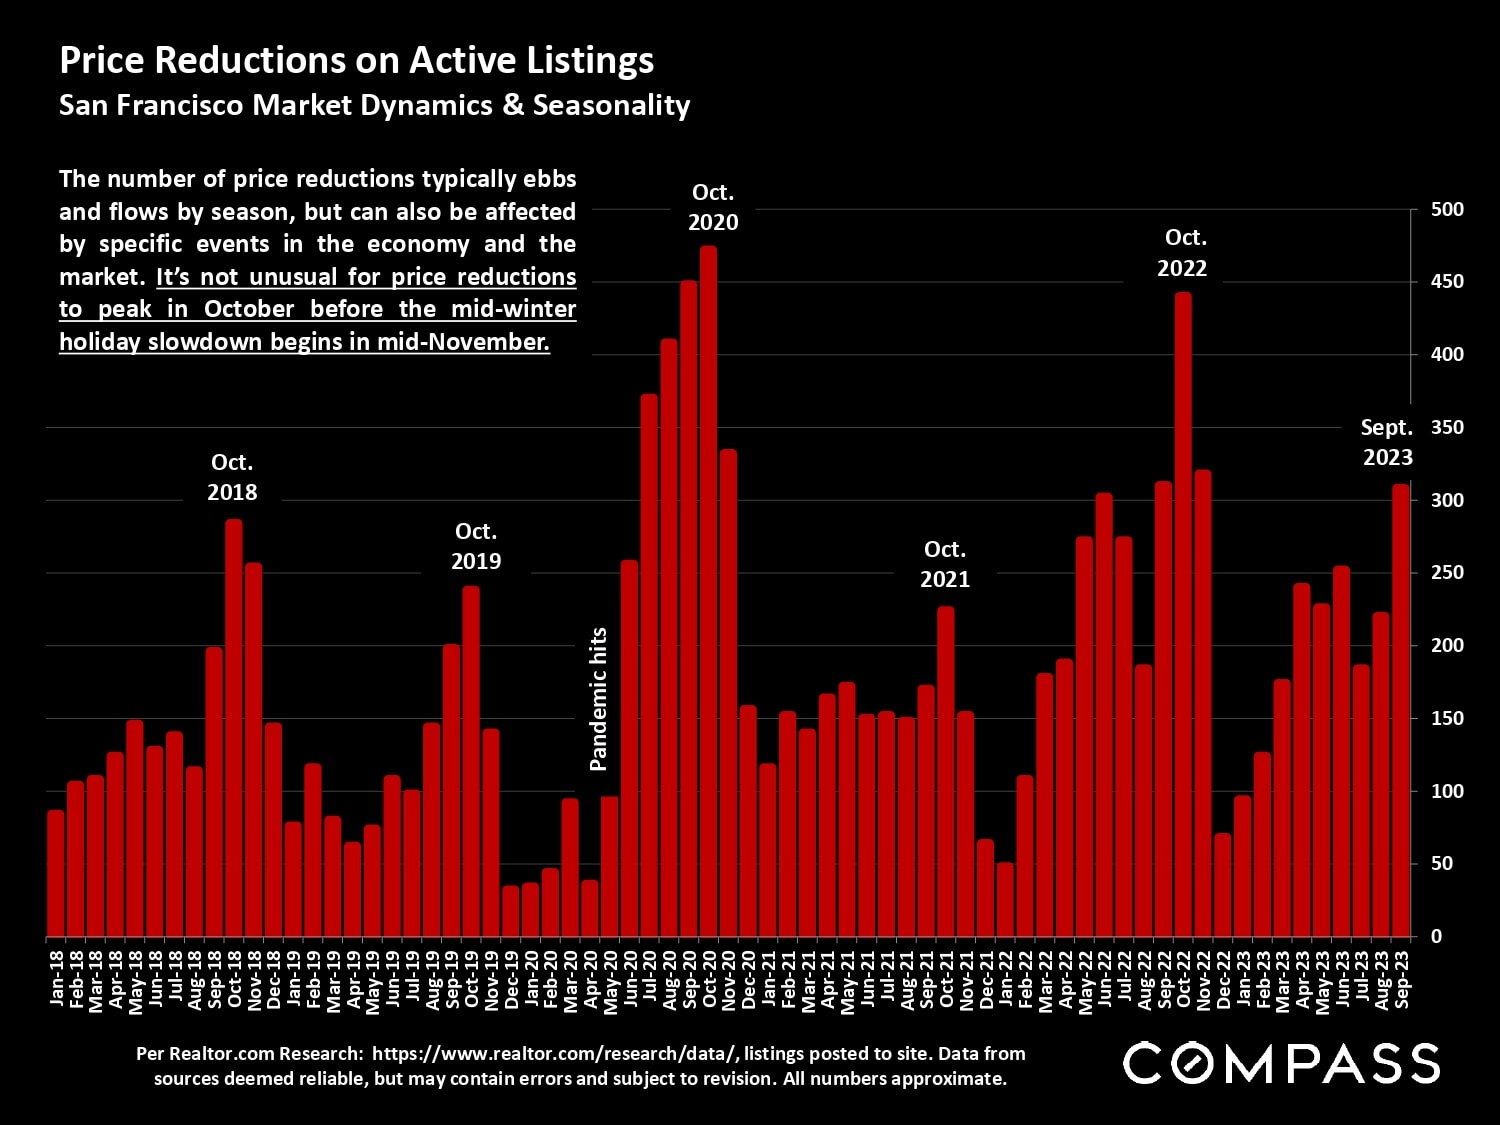
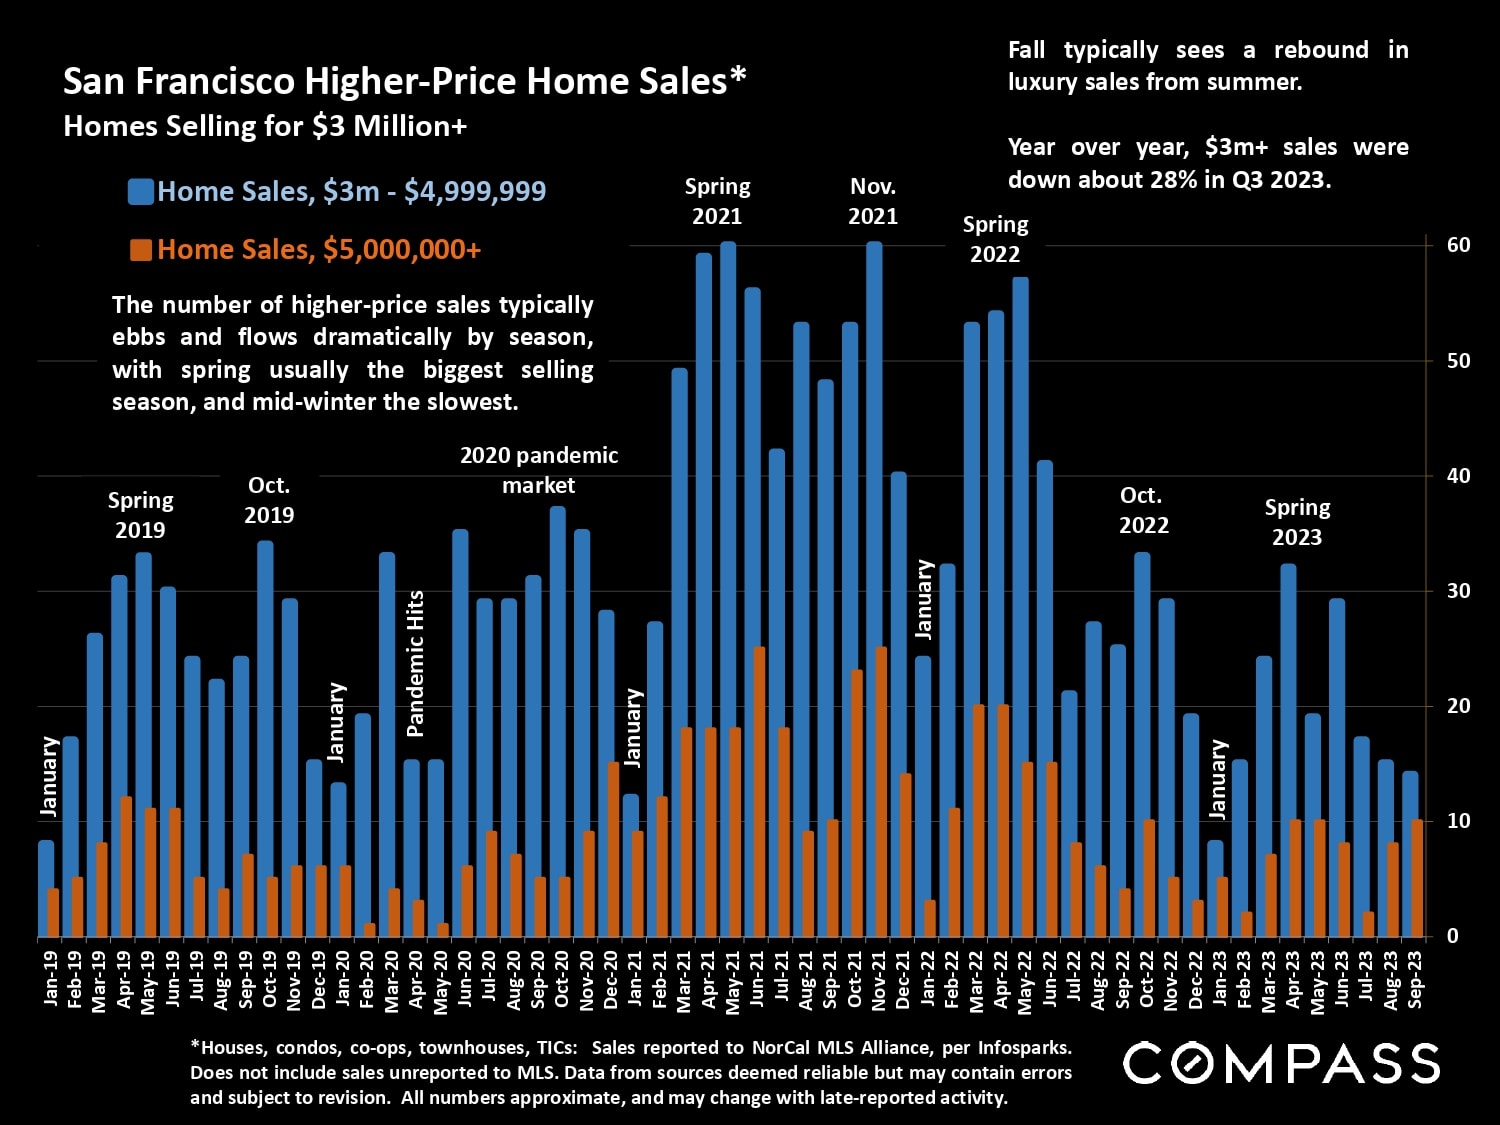
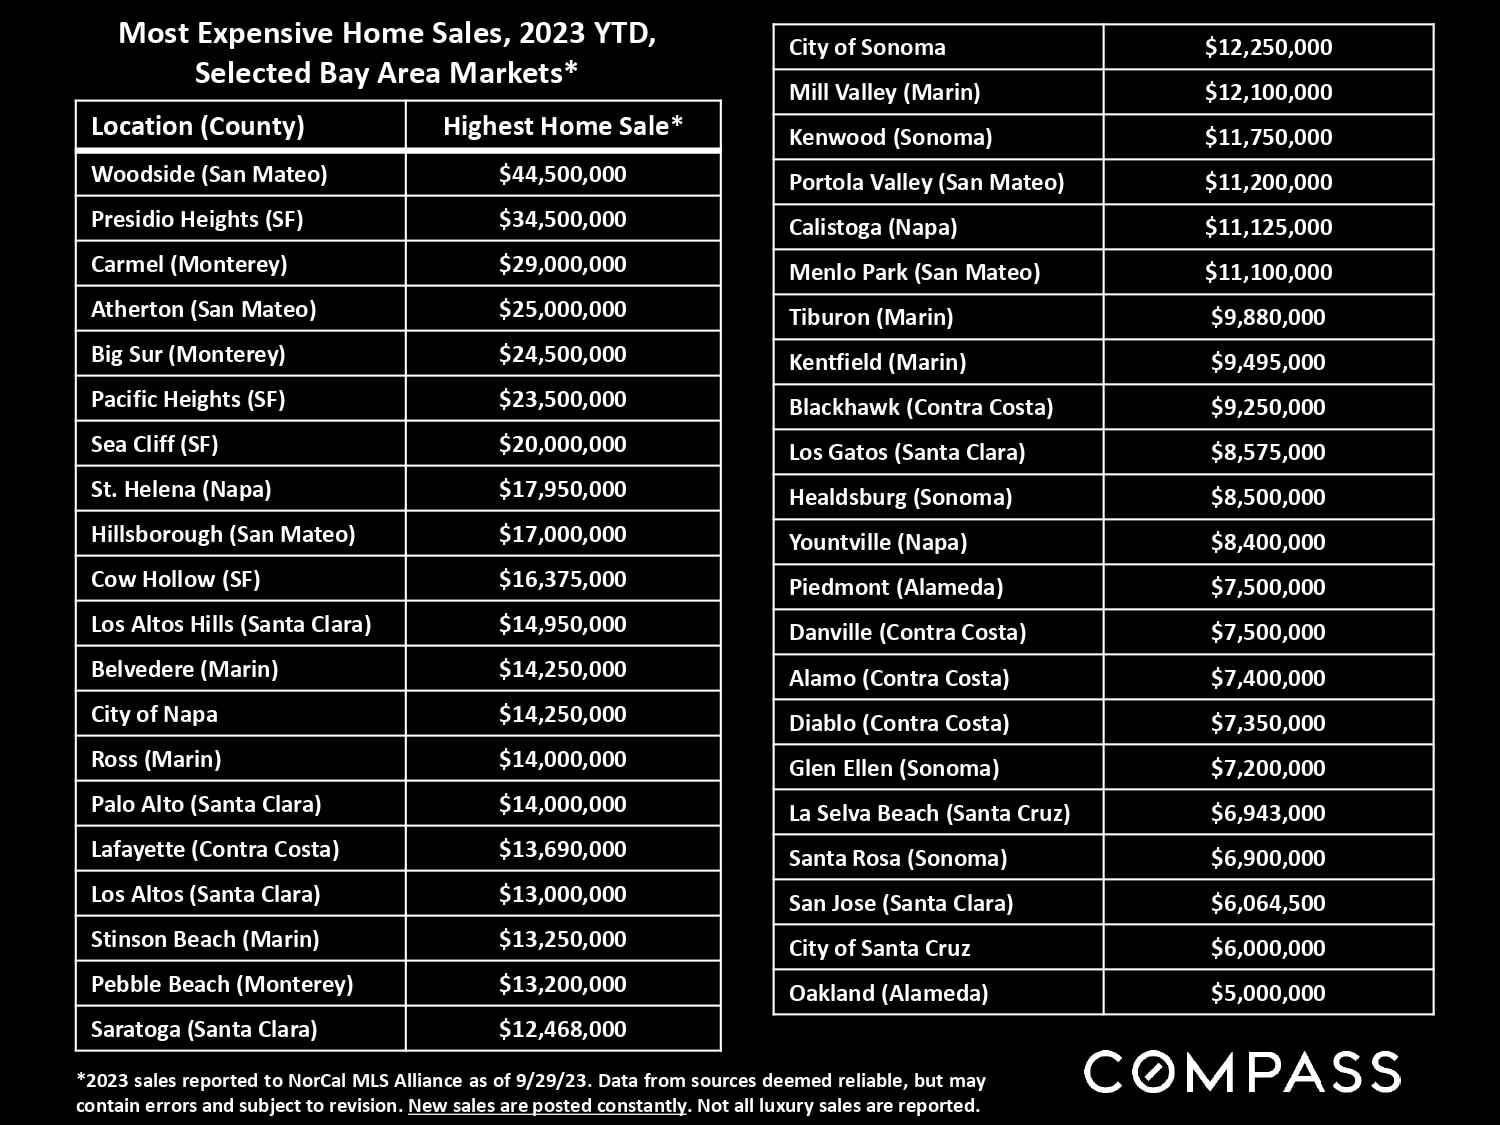
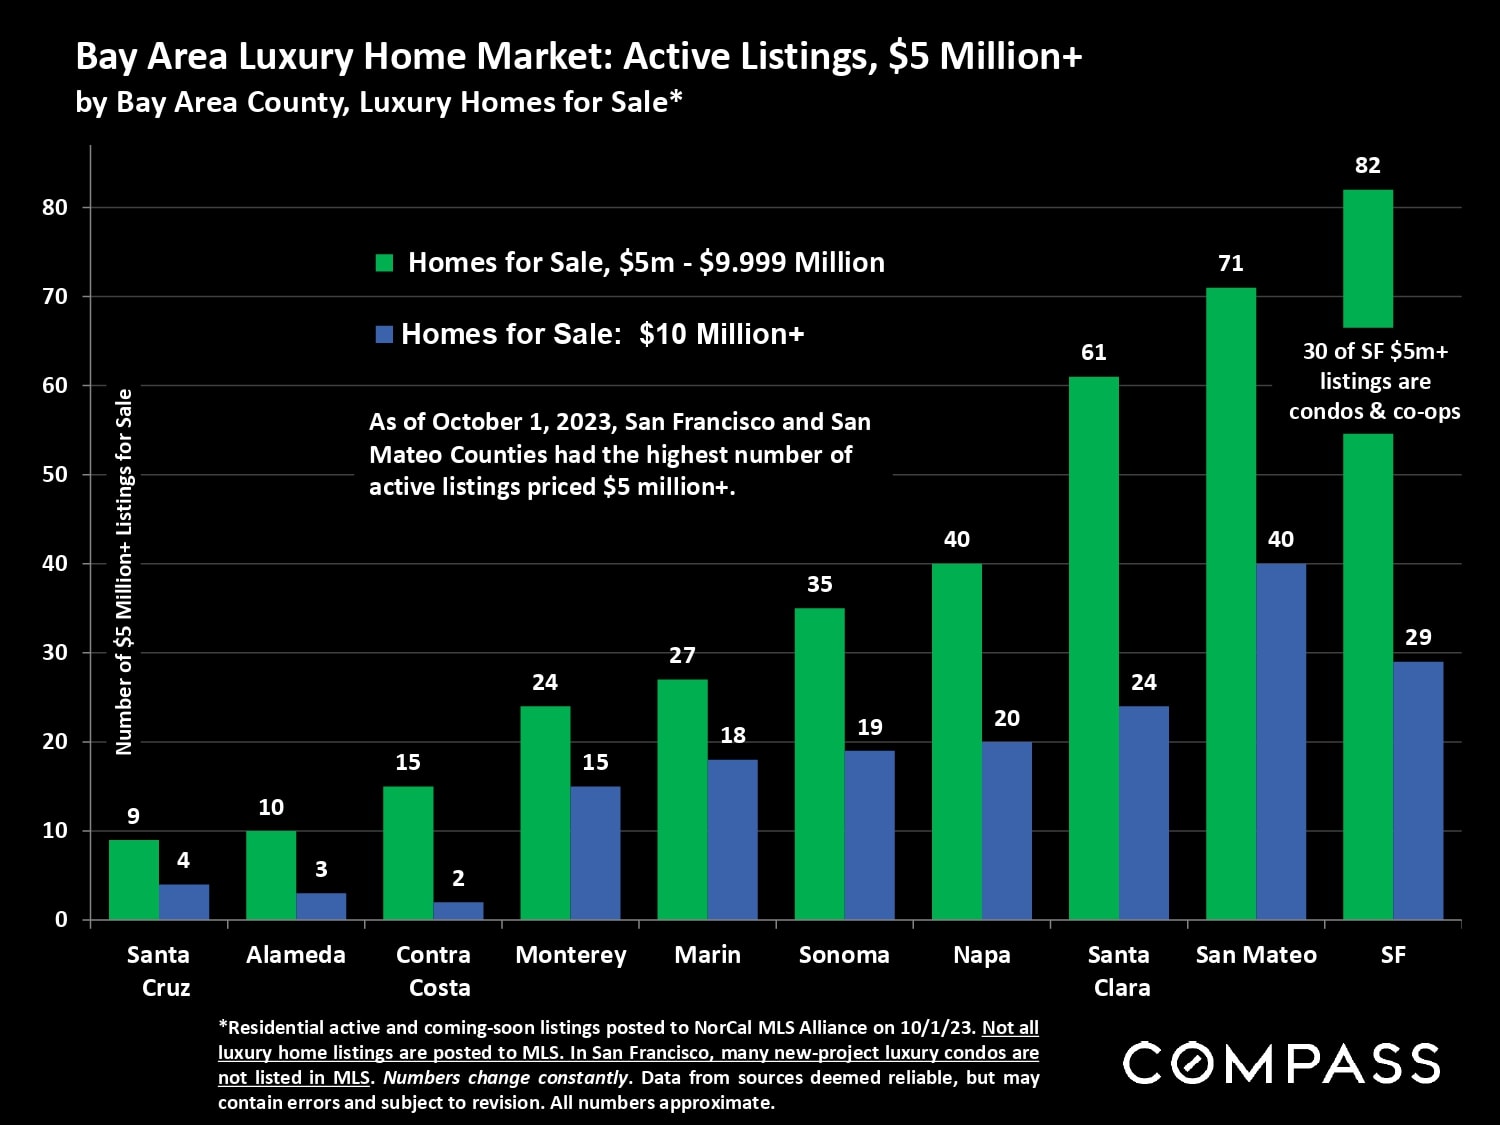
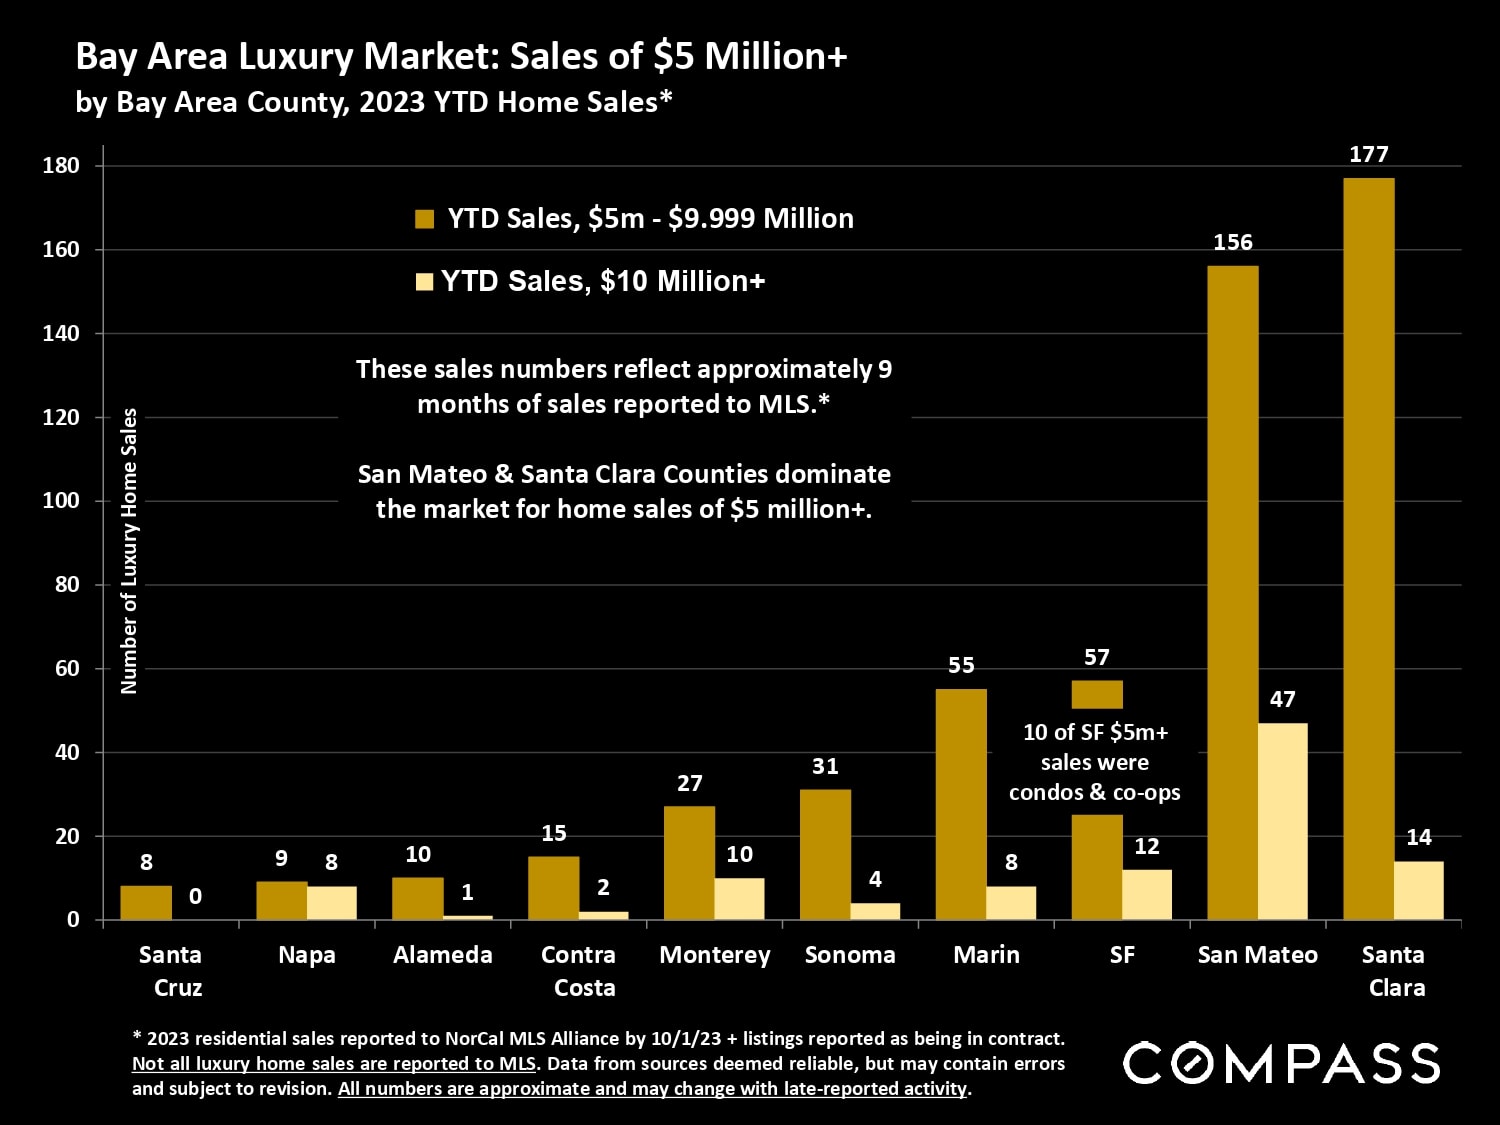
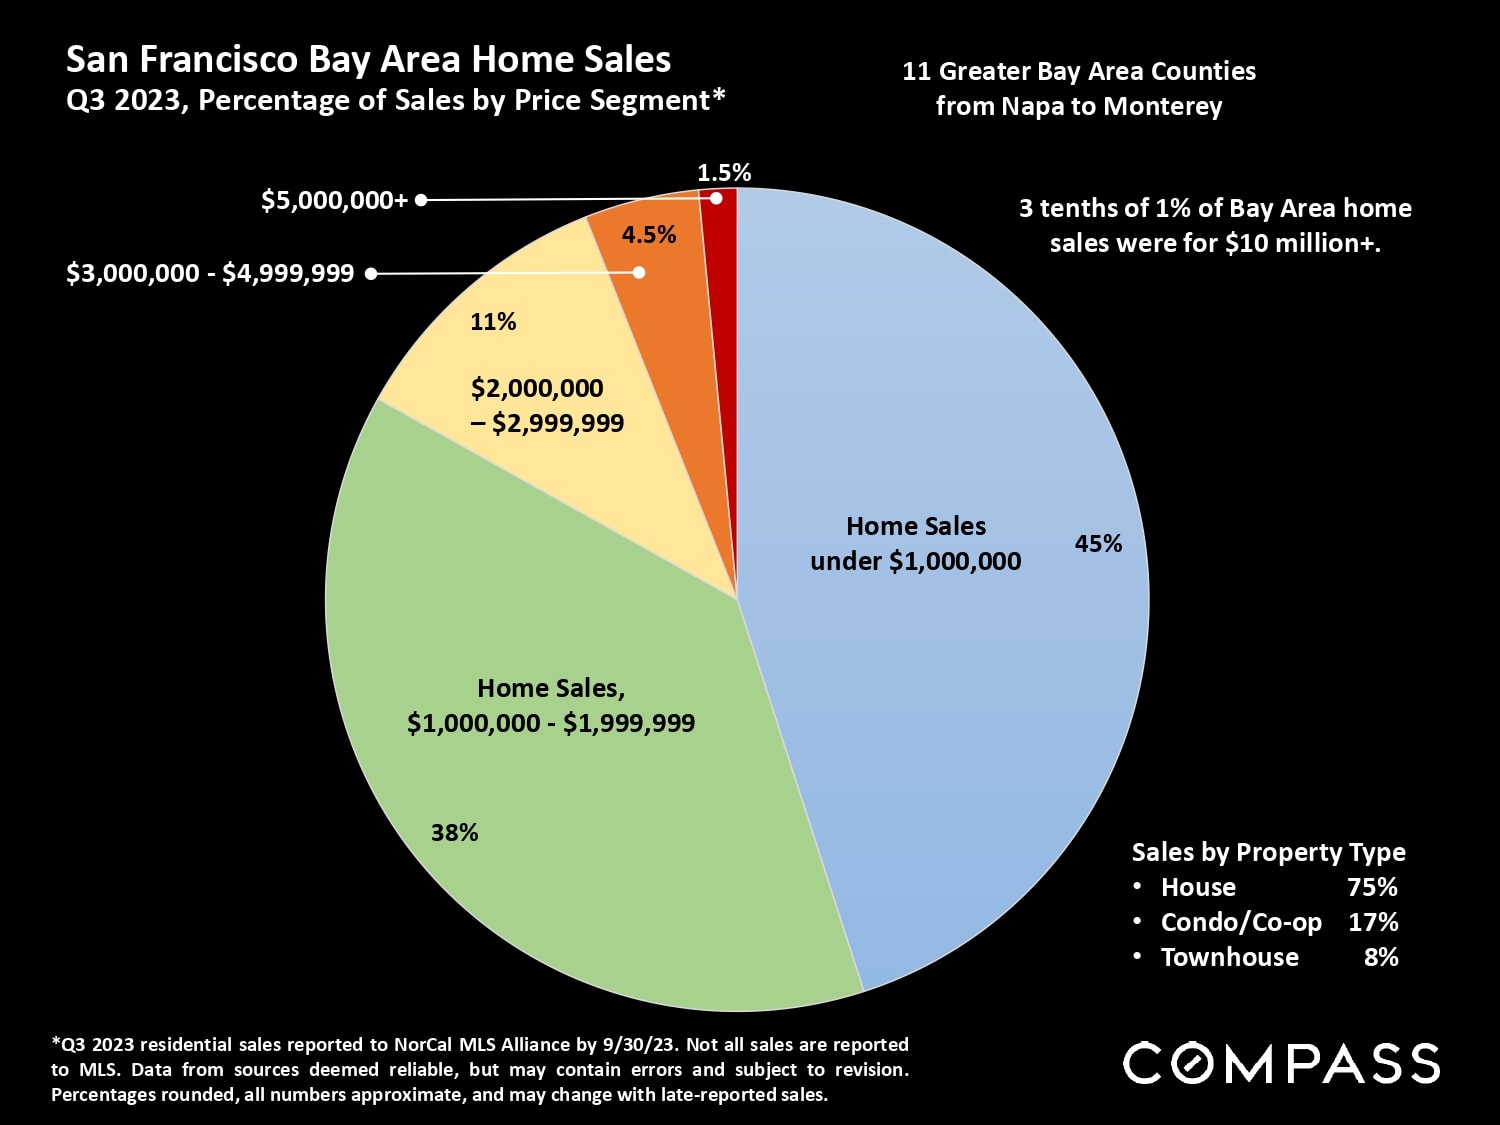
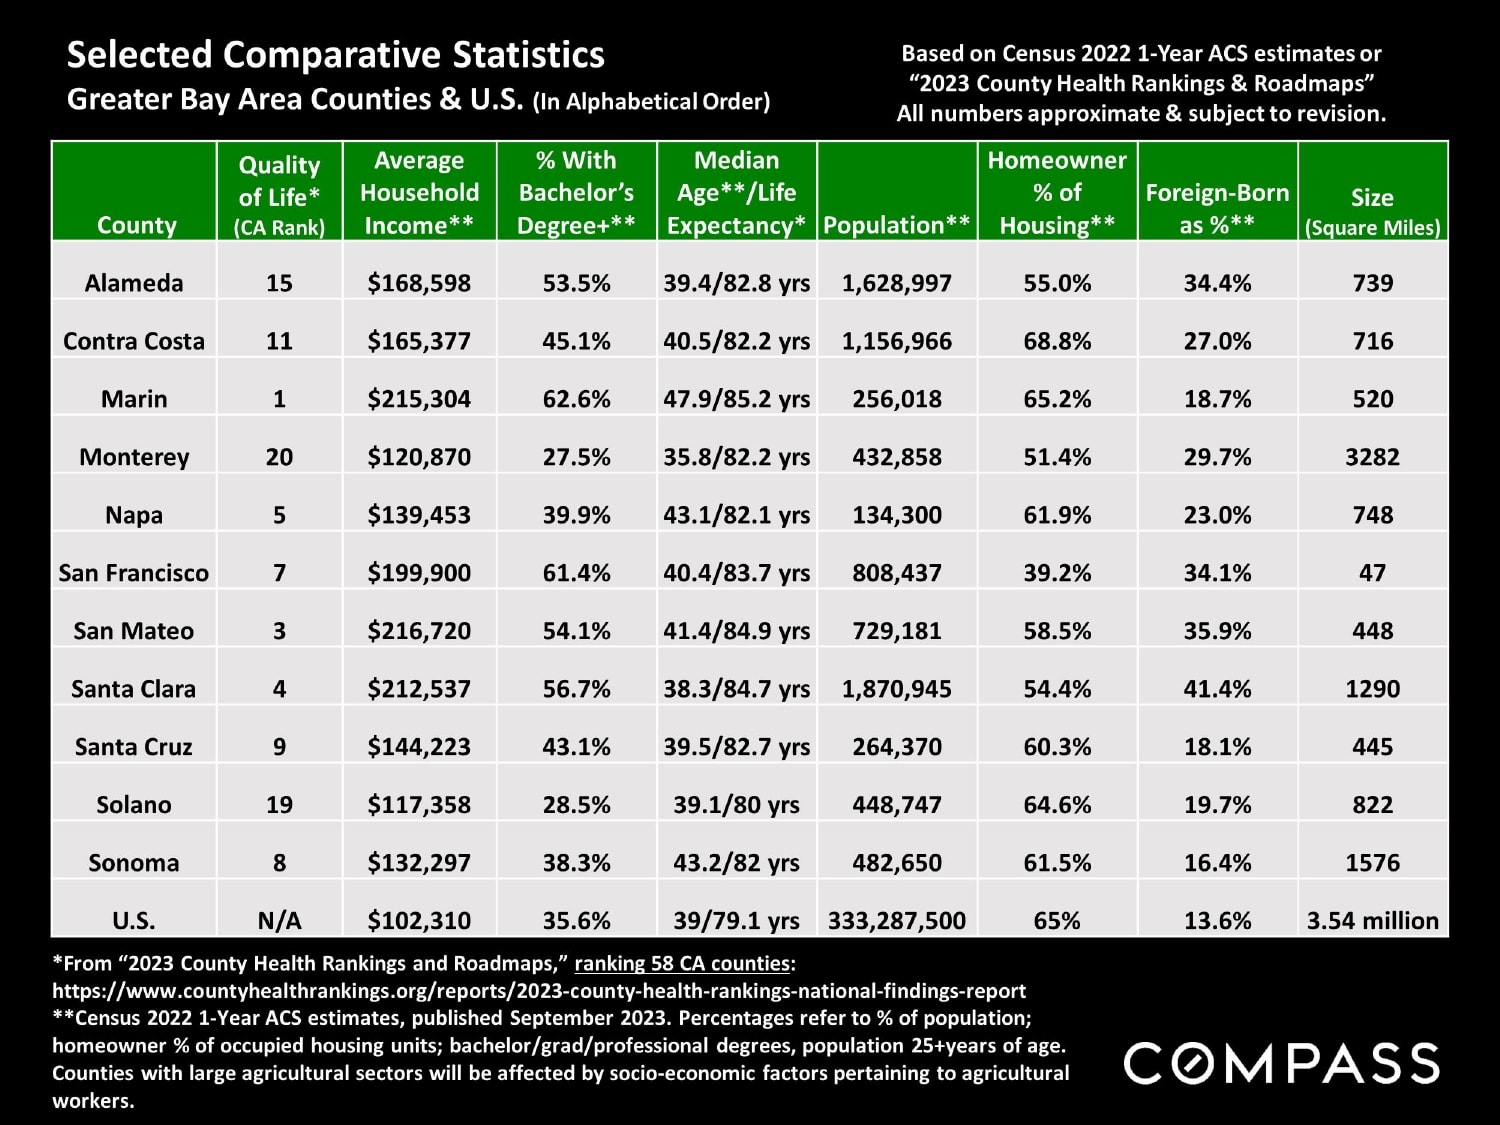
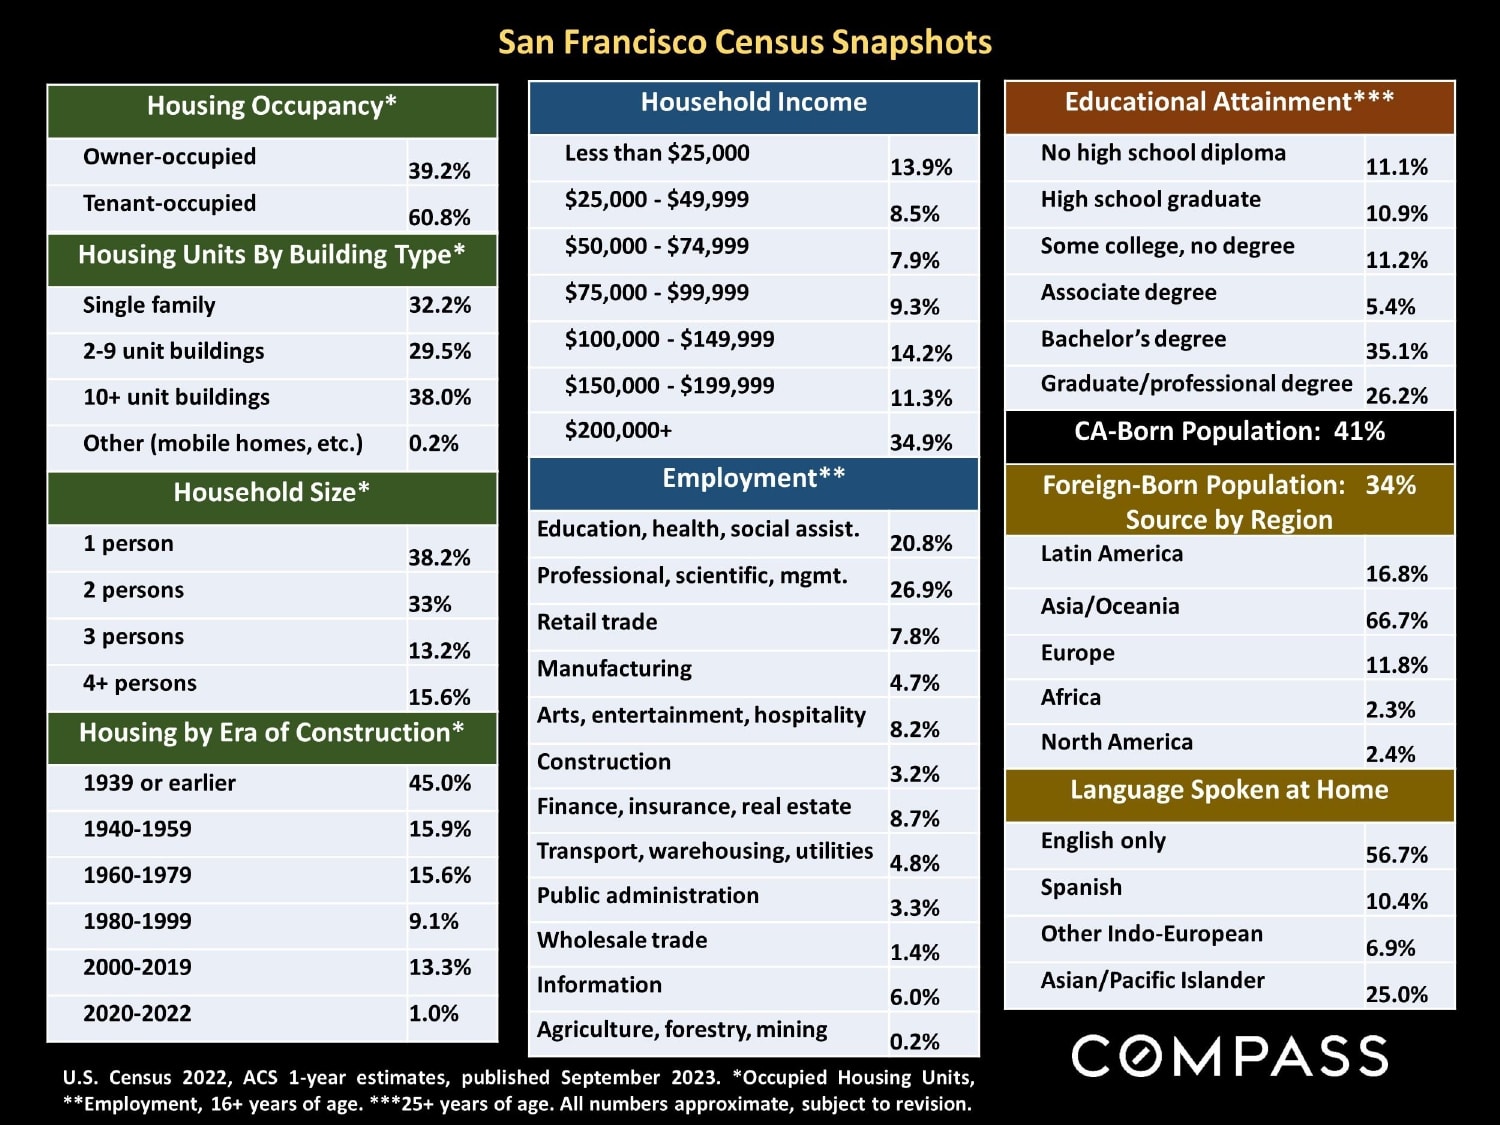
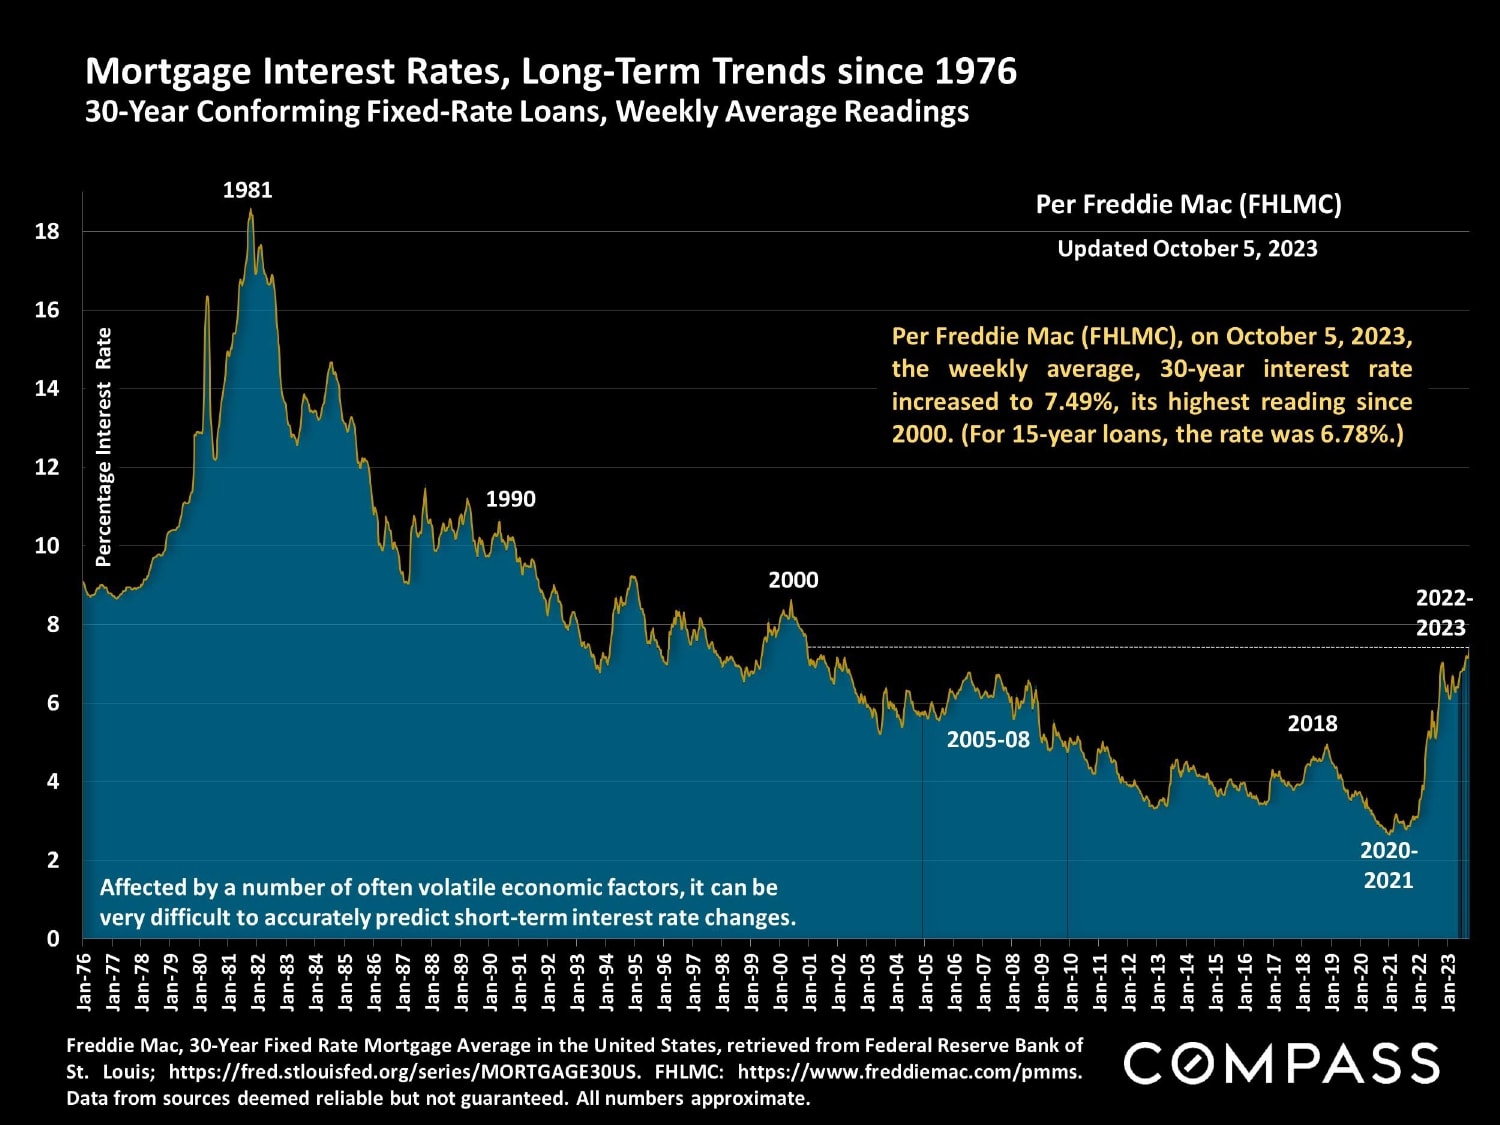
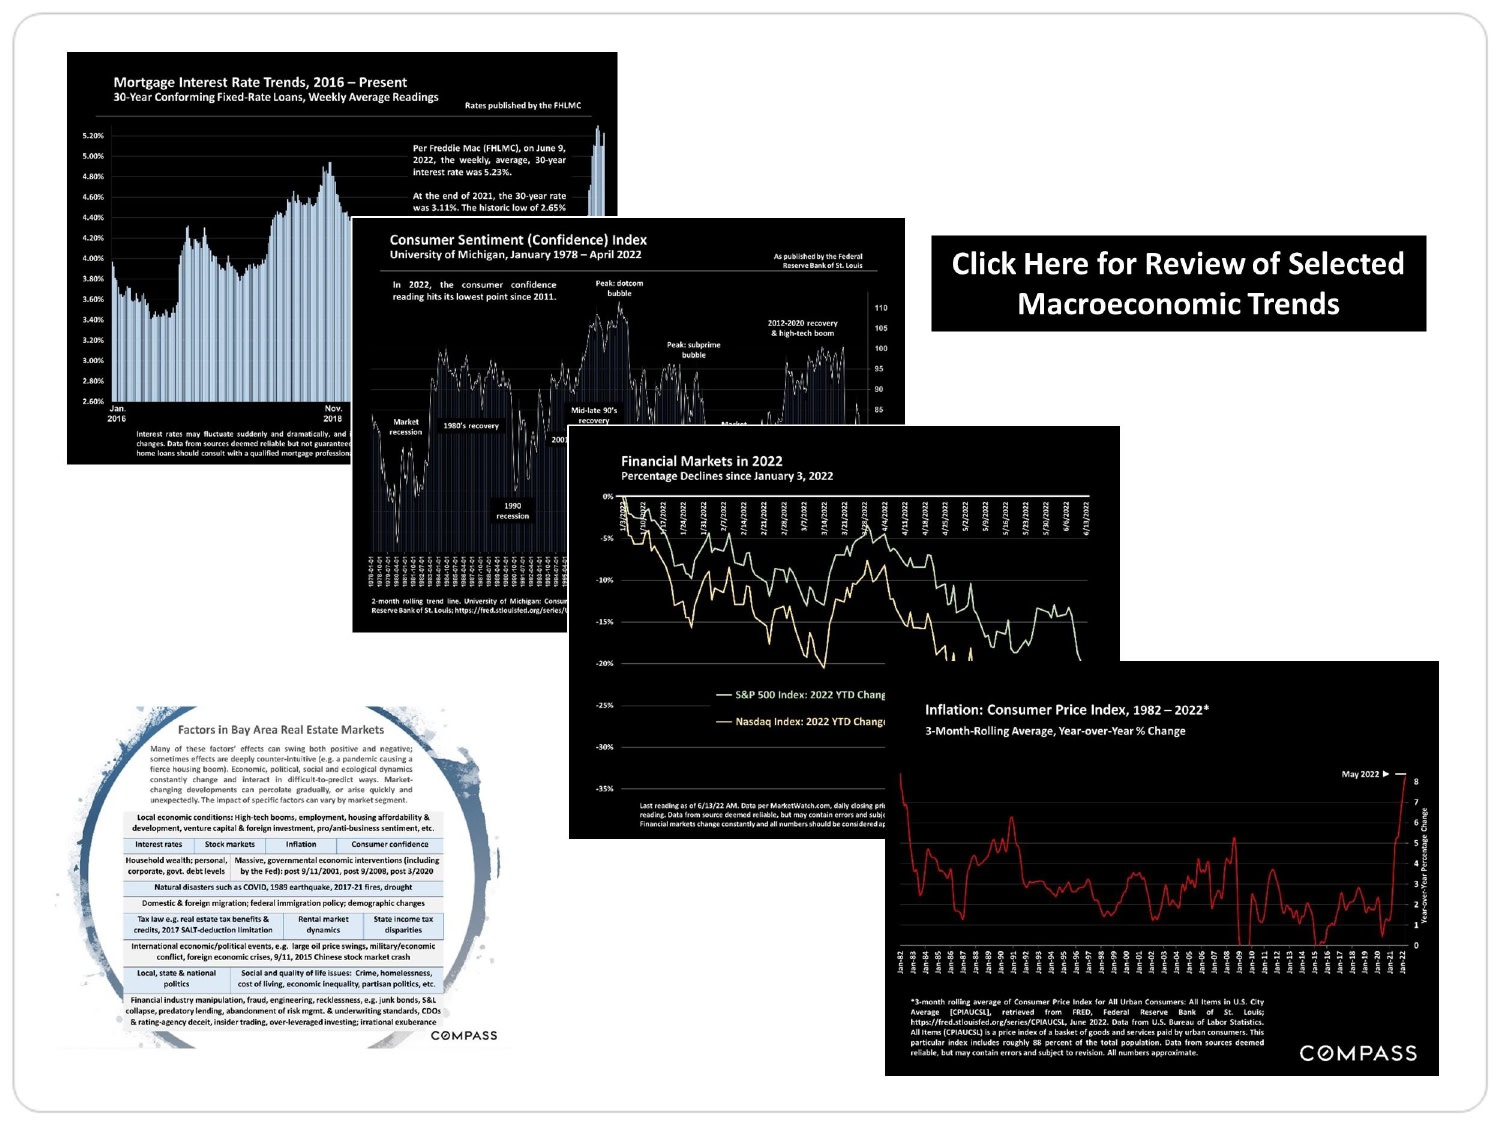
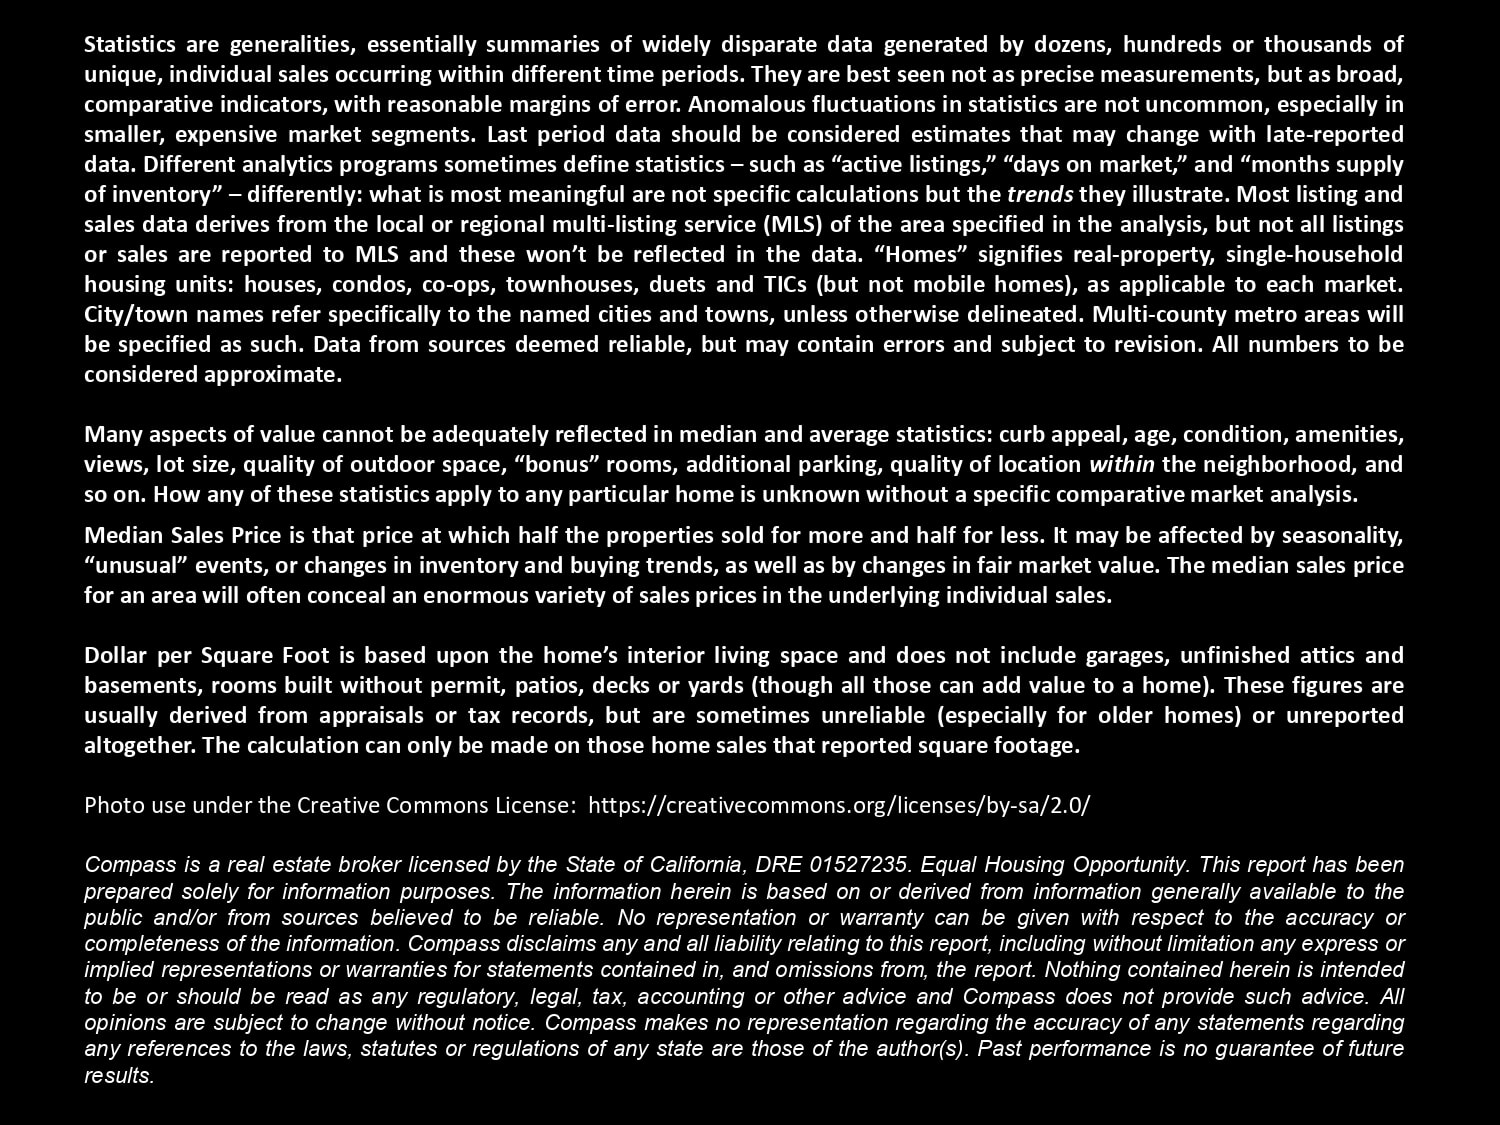
San Francisco Real Estate October 2023 Report cover with a city panorama and Compass branding. San Francisco housing market update with California Realtors’ 2024 forecast for sales, prices, and mortgage rates. Chart of San Francisco new listings, December 2019–September 2023, highlighting September 2023’s 12-month high. Bar chart of monthly San Francisco home sales from 2019 to September 2023, showing seasonal peaks and a 22% Q3 year-over-year decline. San Francisco quarterly median house sale prices, 2012–2023, peaking at $2 million in Q2 2022. Chart comparing San Francisco home-price and household-income changes from 1995 to 2023. San Francisco quarterly condo price chart, 2012–2023, with green bars and a 4% year-over-year decline noted. San Francisco residential market infographic comparing listings, sales, inventory, and sale prices by price range and property type. San Francisco home sales by Realtor district and property type, with a district map and unit counts. Bar chart comparing quarterly median house sale prices across four San Francisco district groups, Q3 2020–Q3 2023. Chart comparing quarterly median home sale prices across four groups of San Francisco districts, Q3 2020–Q3 2023. Chart of Q3 2023 three-bedroom house median prices and sizes across ten Bay Area counties. Chart of San Francisco luxury home sales by district and price range, with counts for seven neighborhood groupings. Infographic comparing 2023 sales of large, expensive homes across ten Northern California counties. Bar chart comparing quarterly median two- and three-bedroom condo sale prices across three San Francisco district groups, Q3 2020–Q3 2023. Chart of San Francisco two- and three-bedroom condo median prices by quarter in three neighborhood groups, Q3 2020–Q3 2023. San Francisco luxury home sales infographic with stacked bars by district and price segment. Bar chart of San Francisco active and coming-soon listings, February 2022–October 2023, ending at 1,471. Chart of San Francisco active listings from 2019 to 2023, with a sharp rise after COVID hit. San Francisco pending-sale listings chart, January 2019–September 2023, with seasonal annotations and market notes. San Francisco monthly listing price reductions, January 2018–September 2023, shown in a red bar chart. Chart comparing monthly San Francisco home sales priced at $3 million or more, January 2019–September 2023. Chart of 2023 year-to-date highest home sale prices in selected Bay Area markets, led by Woodside at $44.5 million. Bar chart compares $5 million-plus home listings across Bay Area counties; San Mateo leads with 71 listings under $10 million. Bar chart of 2023 Bay Area home sales over $5 million by county, with Santa Clara and San Mateo leading. San Francisco Bay Area Q3 2023 home sales by price segment, shown in a pie chart. Comparative statistics table for Bay Area counties and the U.S., including San Francisco, with a Compass wordmark. Infographic of San Francisco census snapshots, with housing, income, employment, education, birthplace, and language statistics. Chart tracing U.S. 30-year mortgage rates from 1976 to 2023, with a sharp rise to 7.49% in October 2023. Macroeconomic trends infographic with charts on mortgage rates, consumer confidence, financial markets, and inflation. Real estate market statistics methodology and legal disclosures, including definitions of median sales price and dollar per square foot.


WORK WITH US

We offer the highest level of service and expertise to our clients. Our team has built a reputation for consistently representing the finest real estate in San Francisco and Napa Valley. Results driven and dedicated to your success, whether buying, selling, renting or investing. Contact us today for a private consultation.

Contact Us