San Mateo County - April 2024

San Mateo County Real Estate April 2024 Report
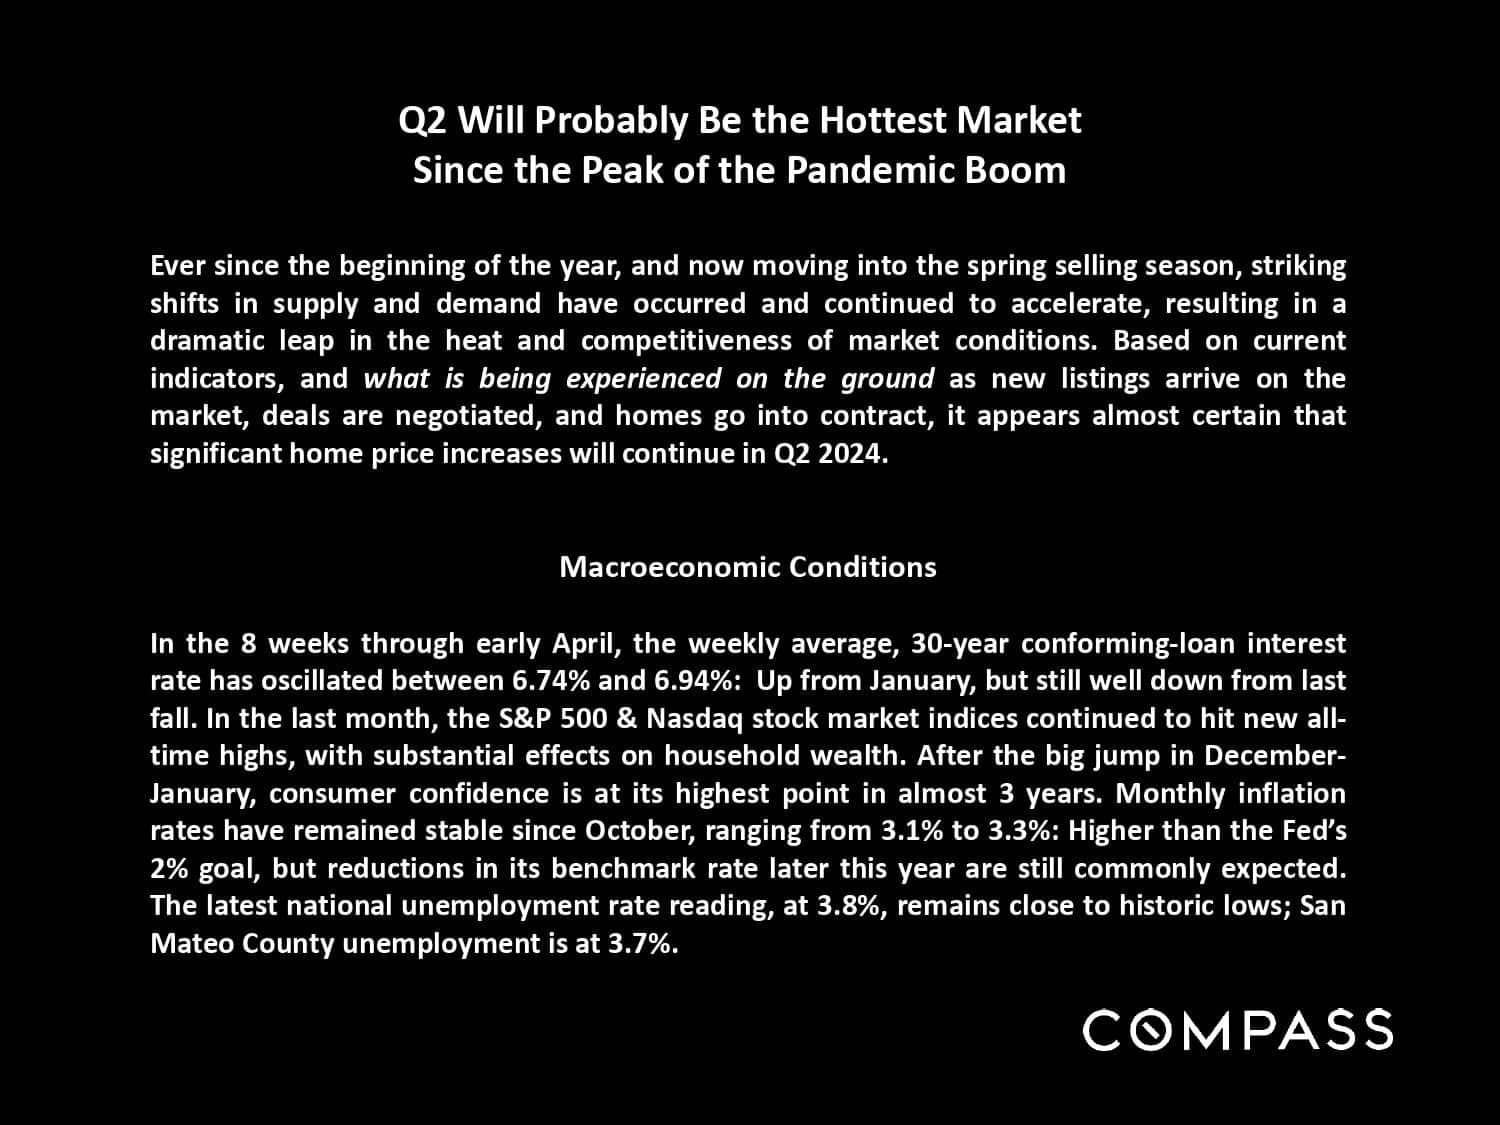
Compass market update predicts a hot Q2 2024 housing market and summarizes economic conditions.
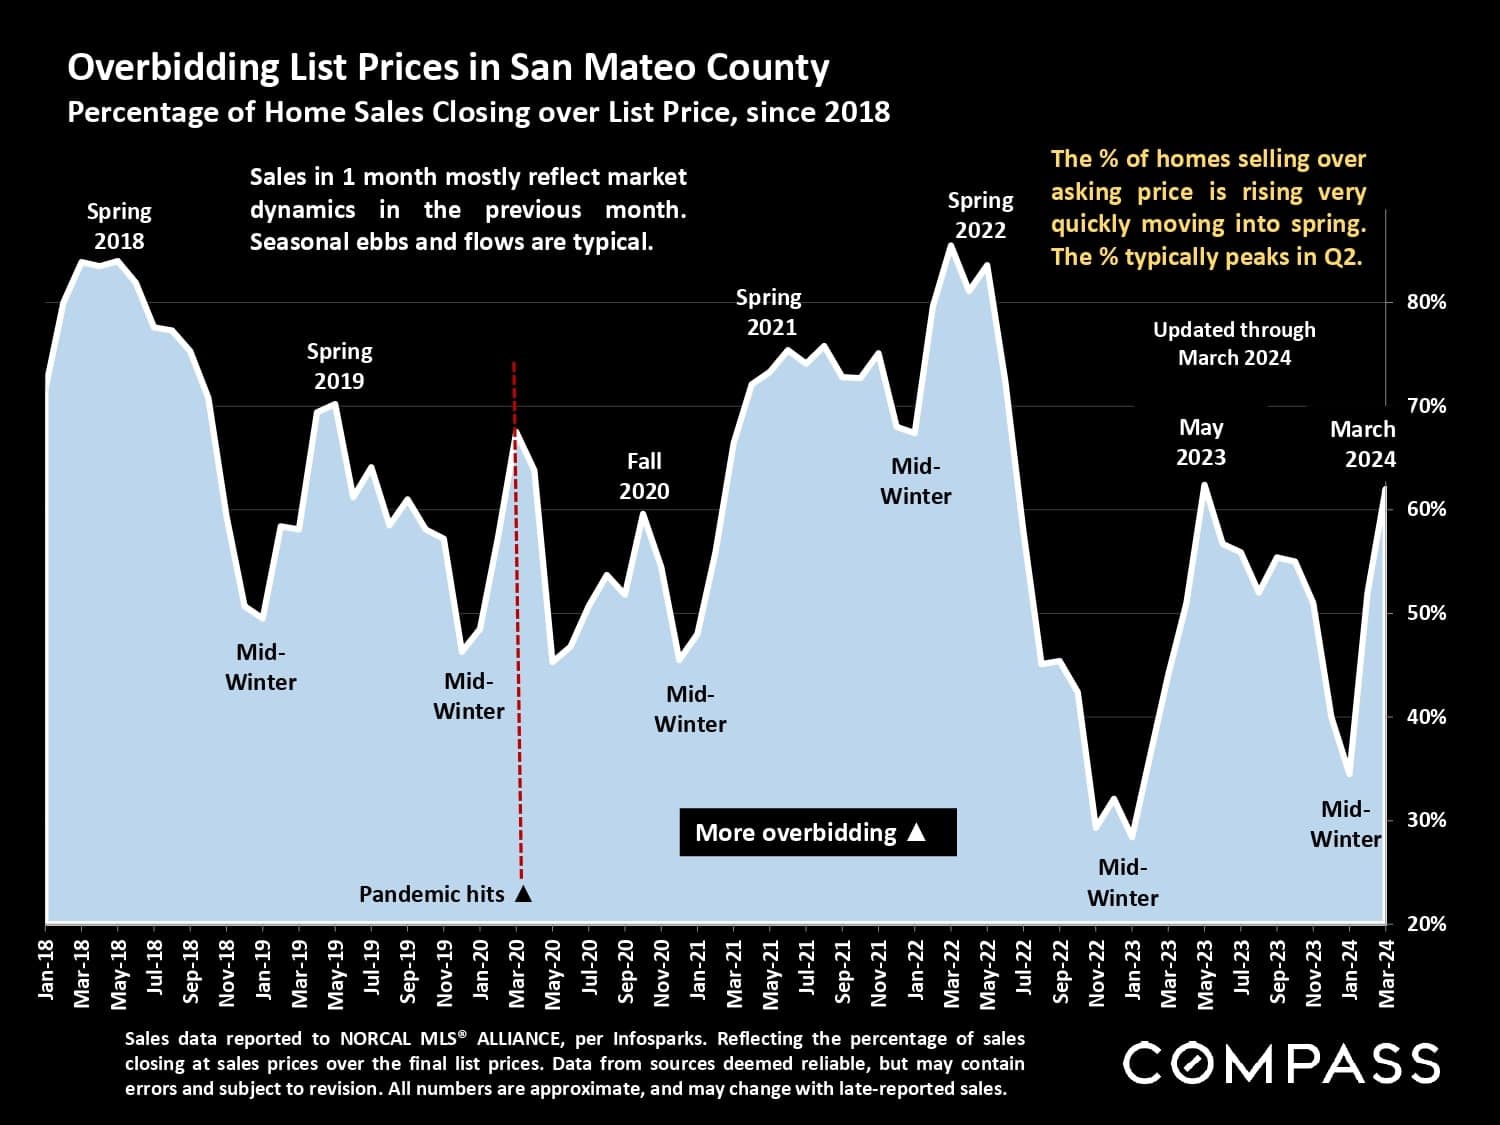
San Mateo County overbidding chart tracks home sales closing above list price from 2018 through March 2024.
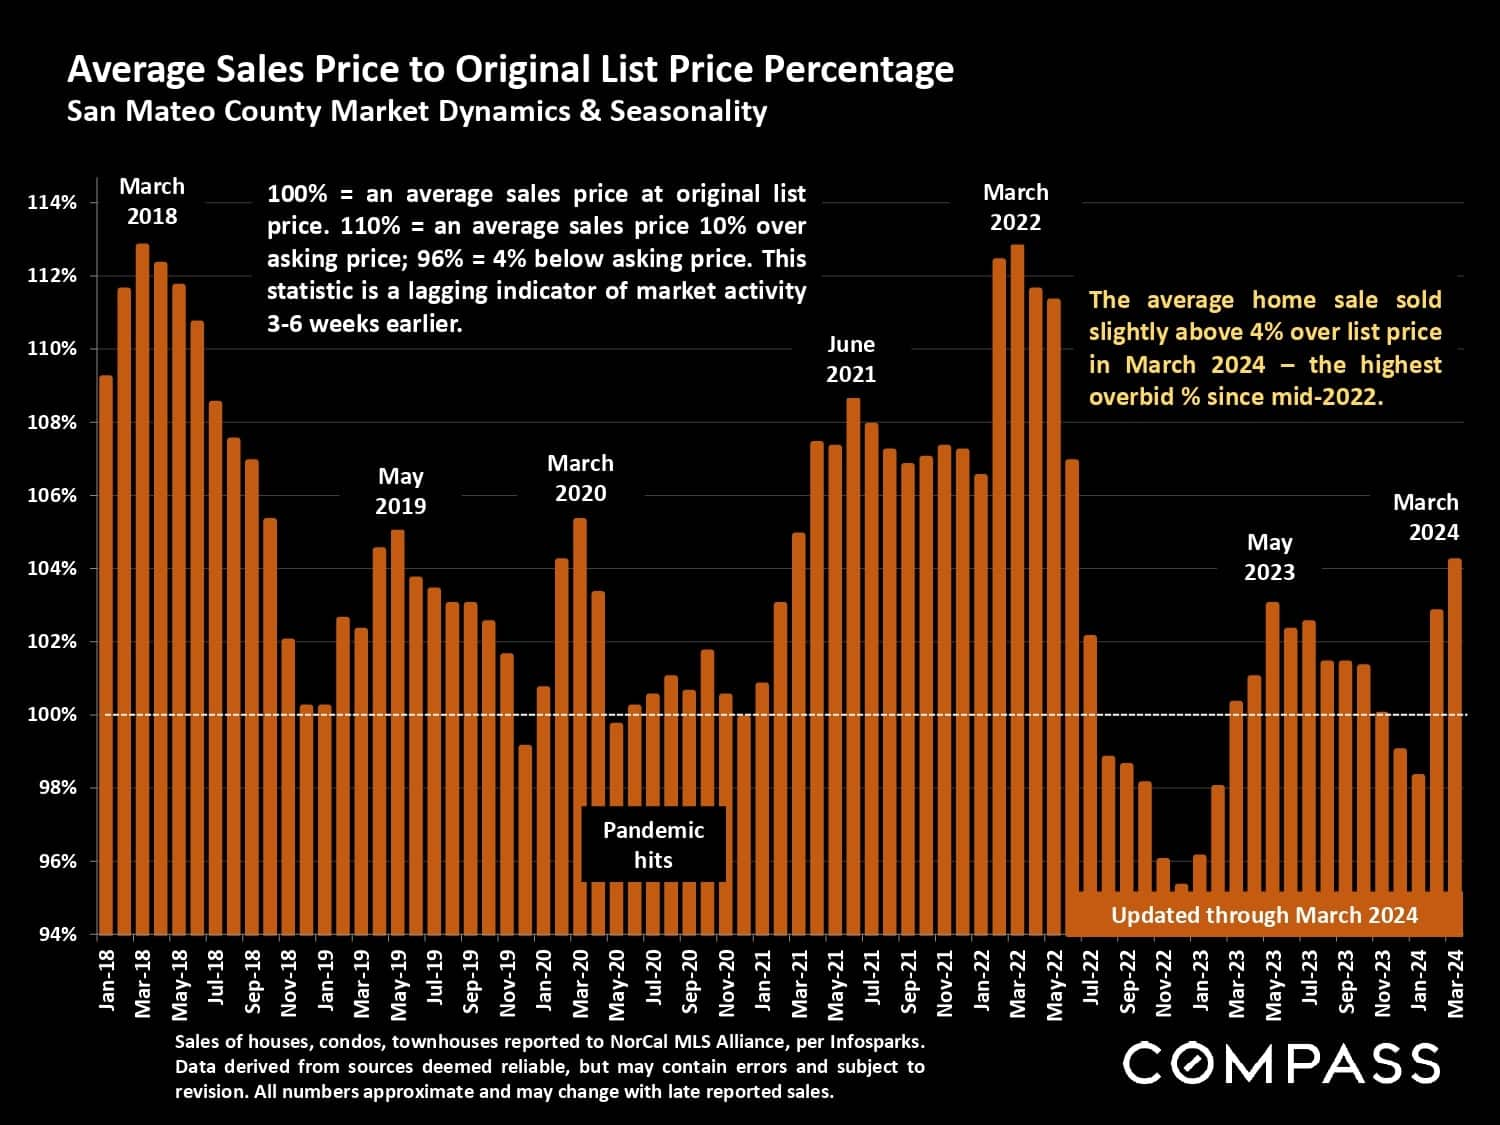
San Mateo County chart of sale prices versus list prices, with March 2024 averaging just over 4% above list.
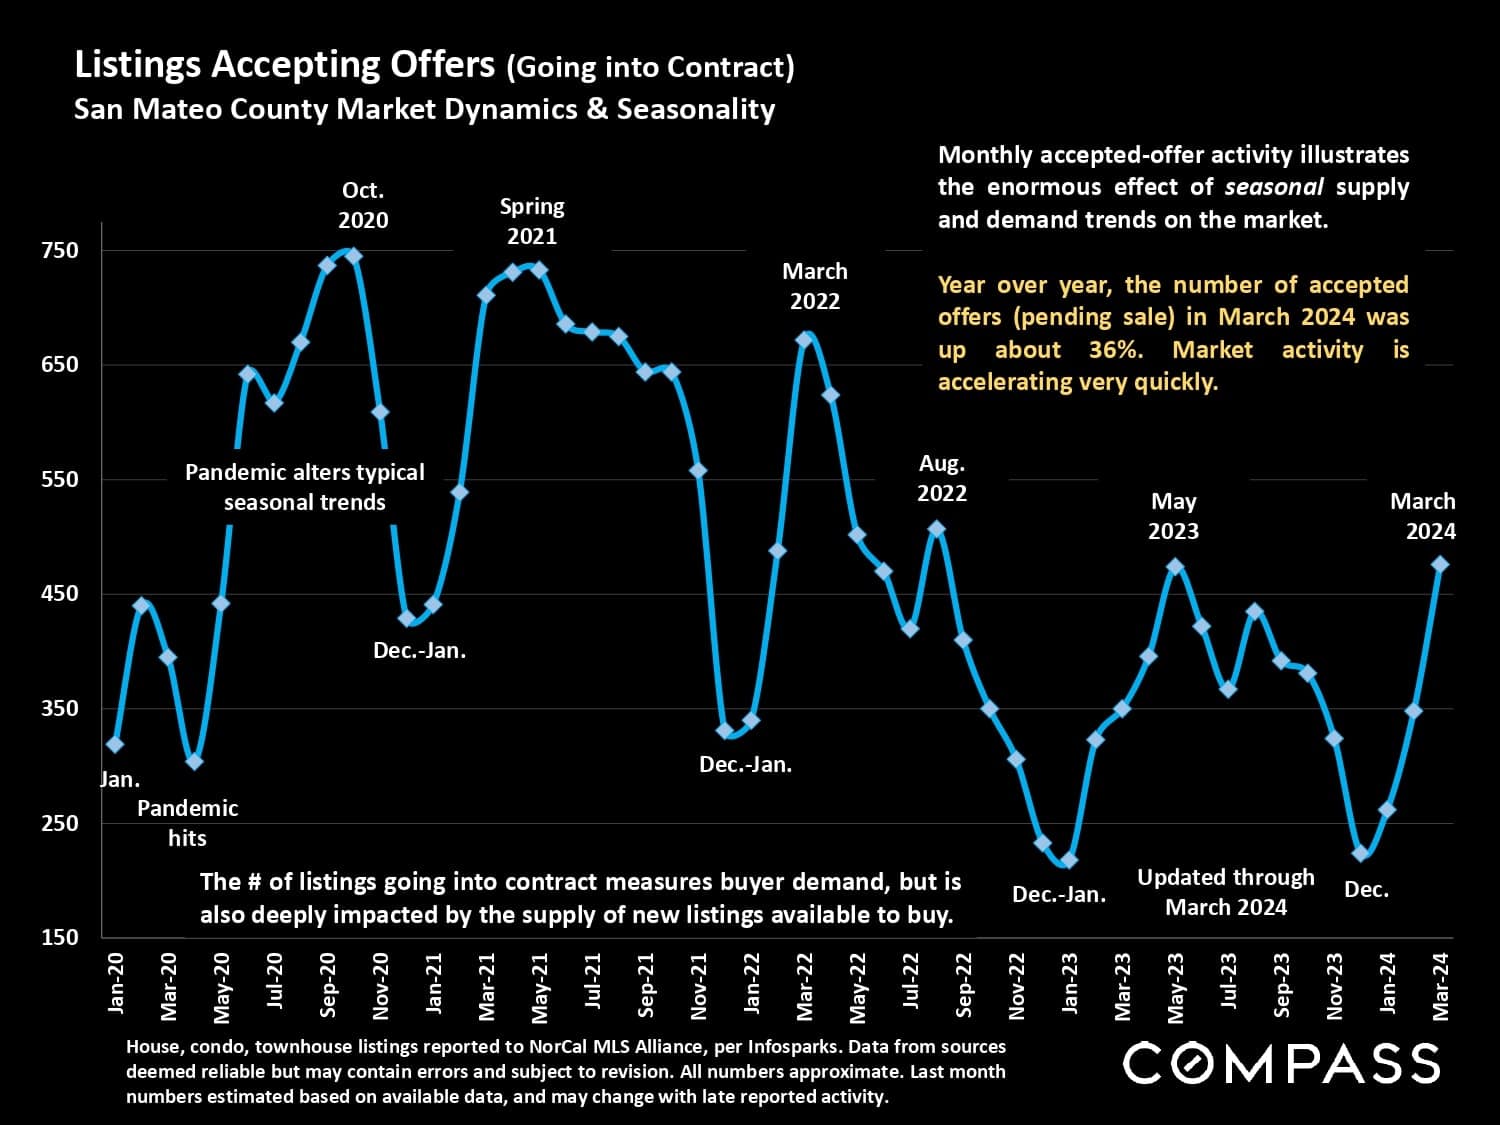
San Mateo County accepted-offer activity chart, showing seasonal fluctuations from January 2020 to March 2024.
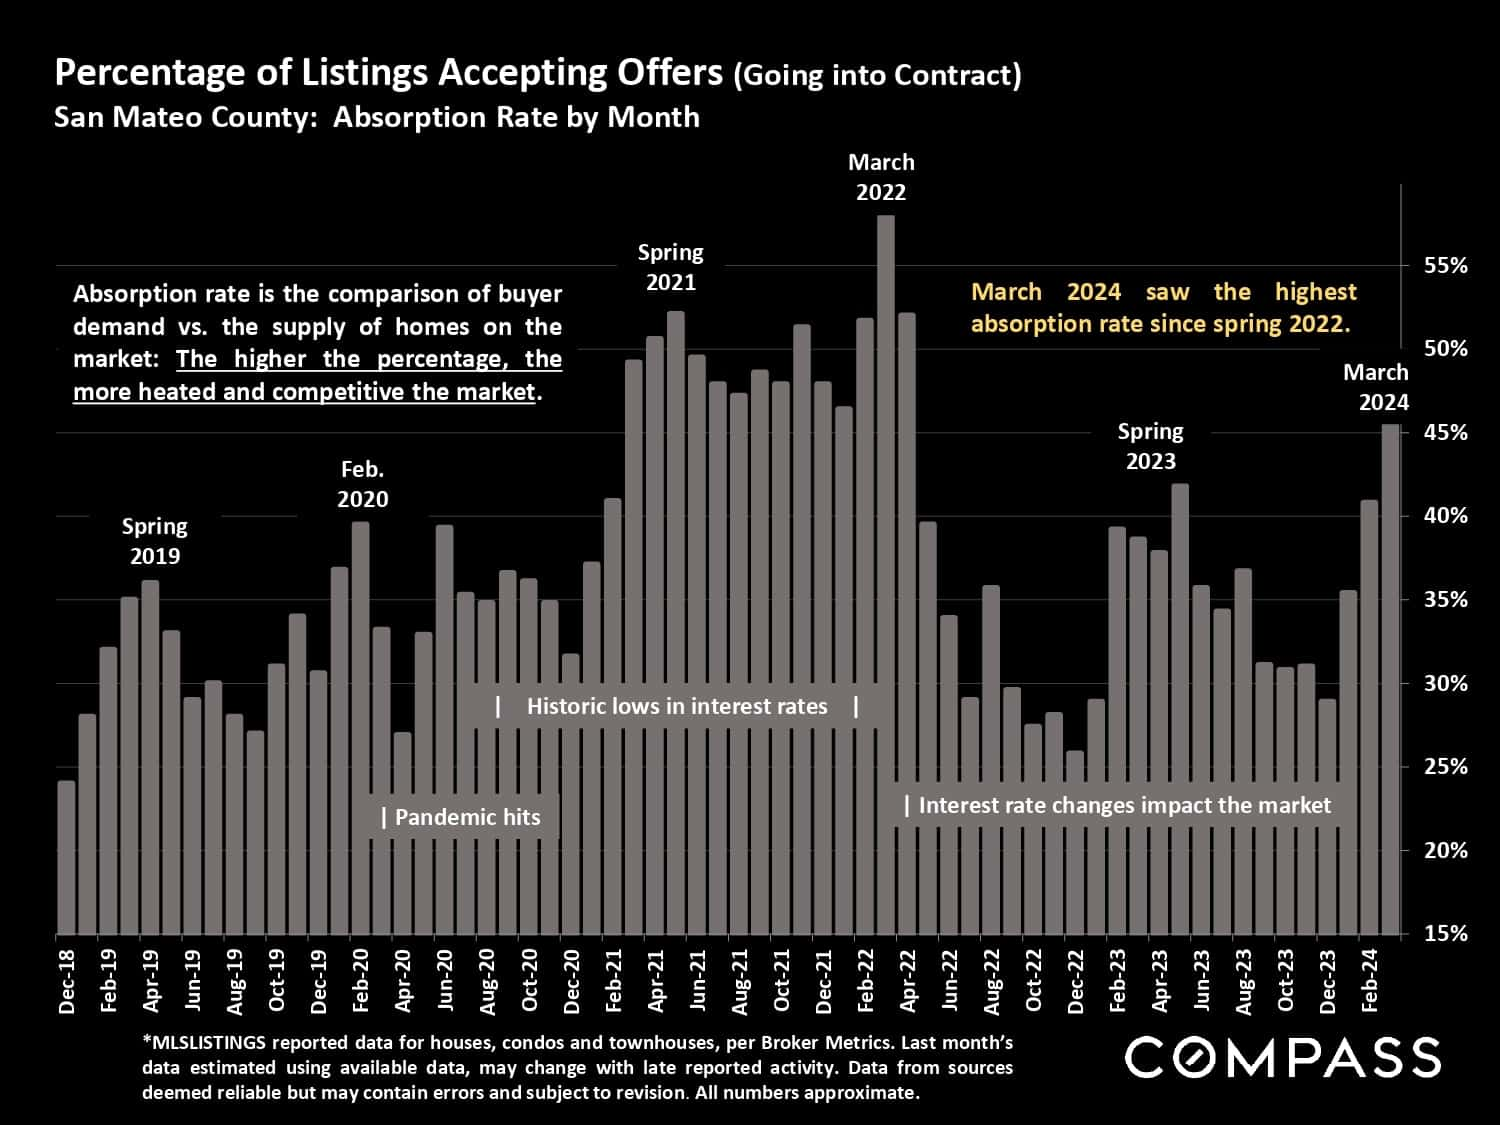
San Mateo County monthly listing absorption rates, with March 2024 reaching the highest level since spring 2022.
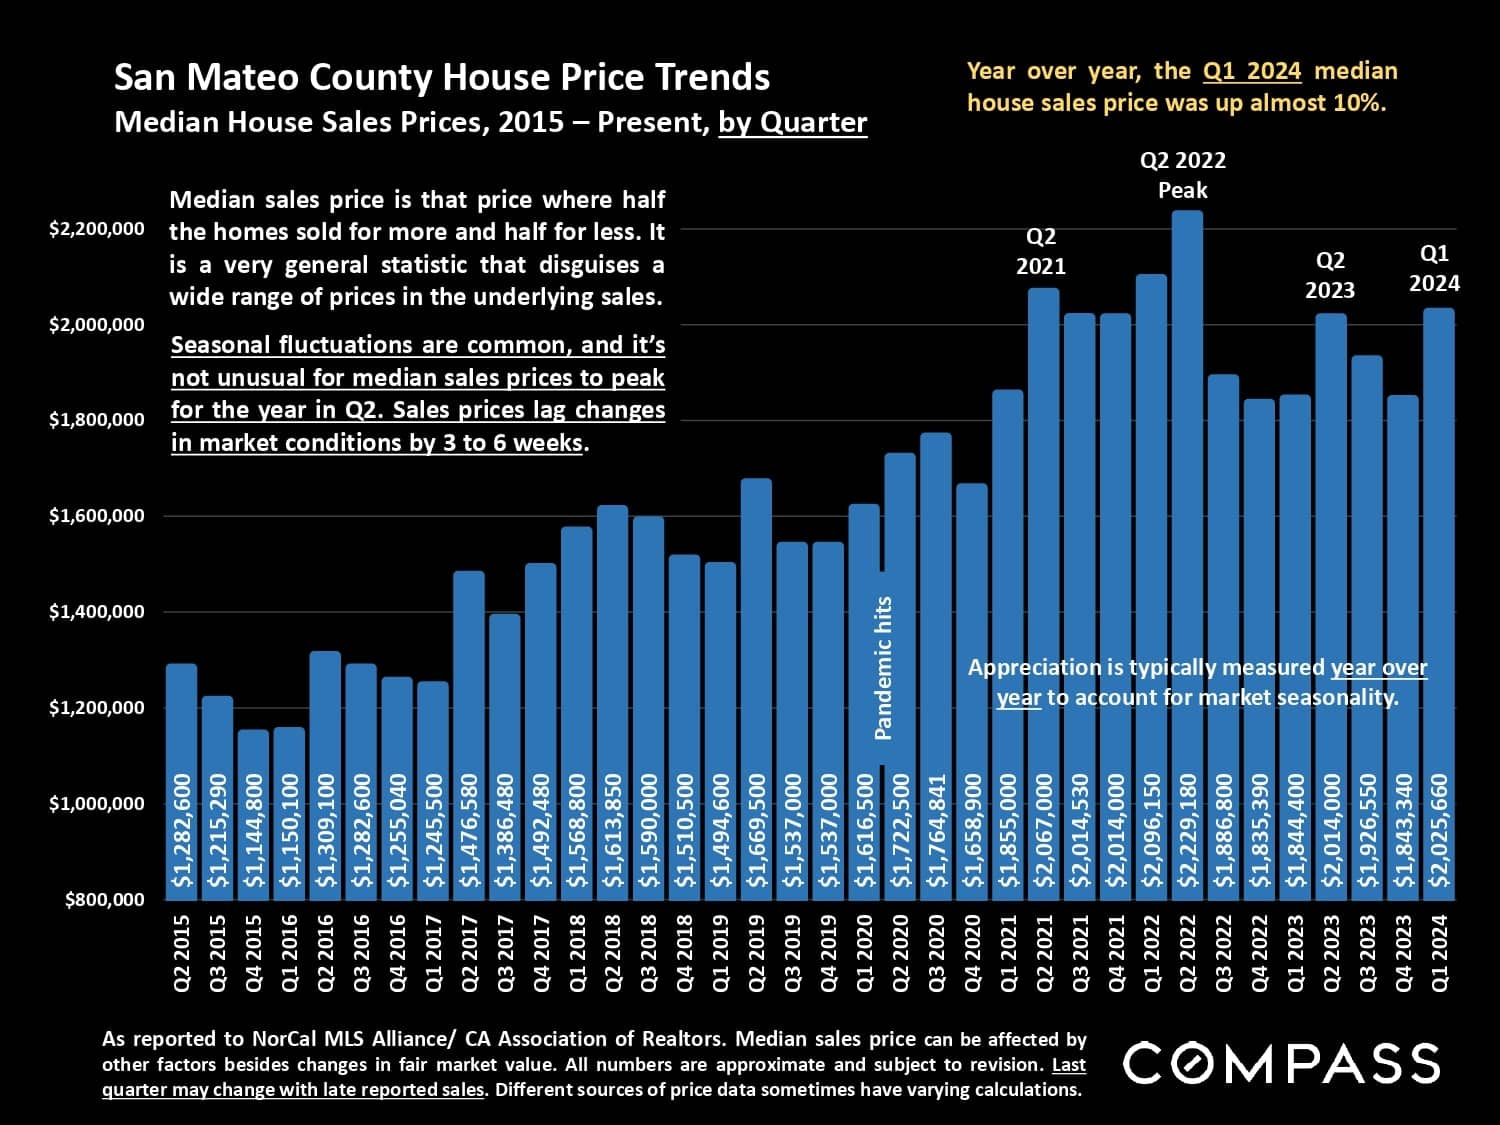
San Mateo County quarterly median house prices, 2015–Q1 2024; Q1 2024 rose almost 10% year over year.
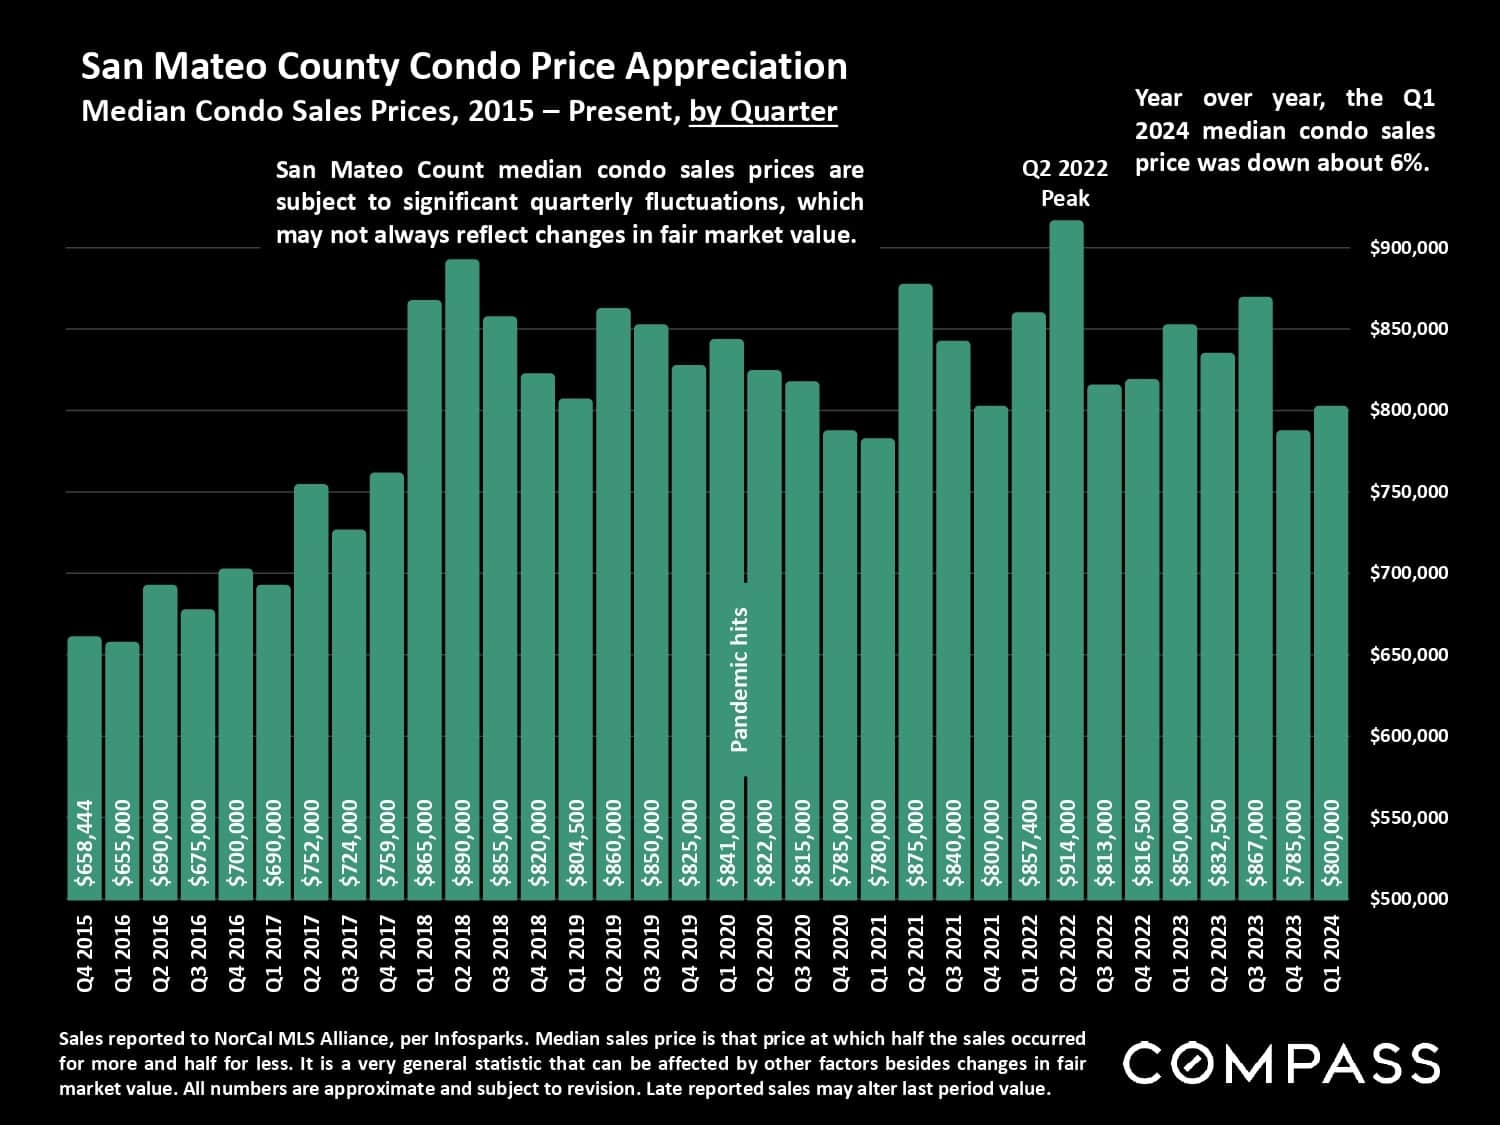
San Mateo County condo price chart, showing quarterly median sales prices from 2015 through Q1 2024.
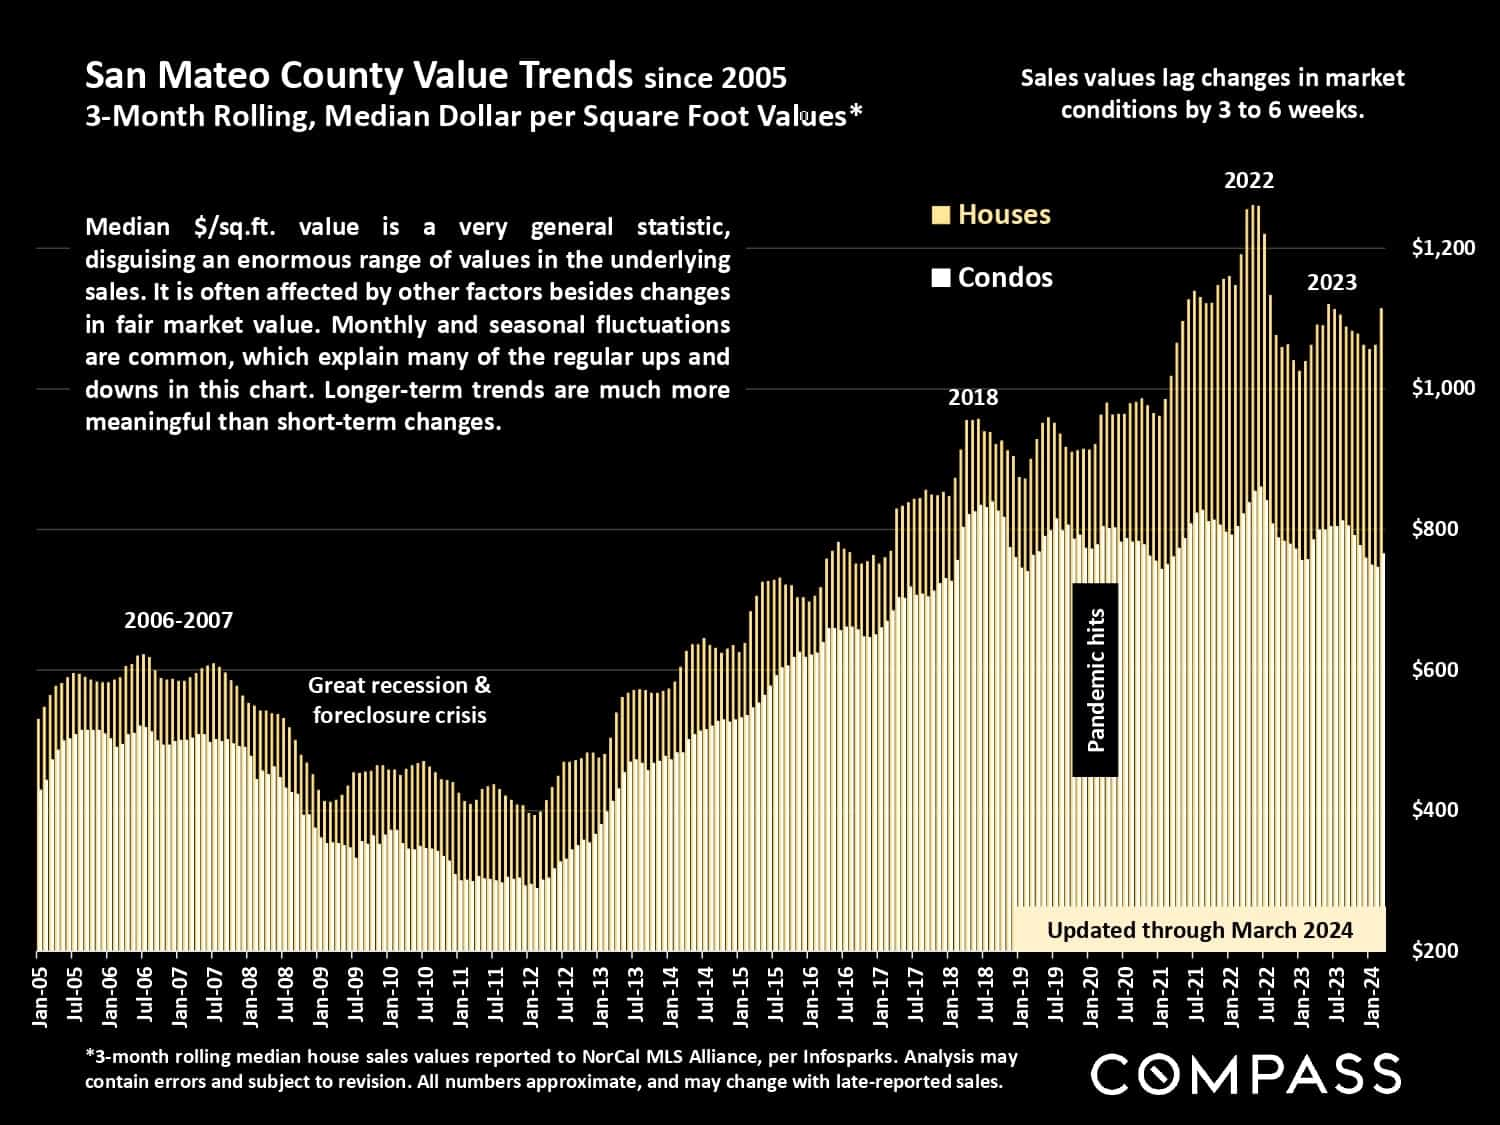
San Mateo County home and condo price-per-square-foot trends from 2005 through March 2024.
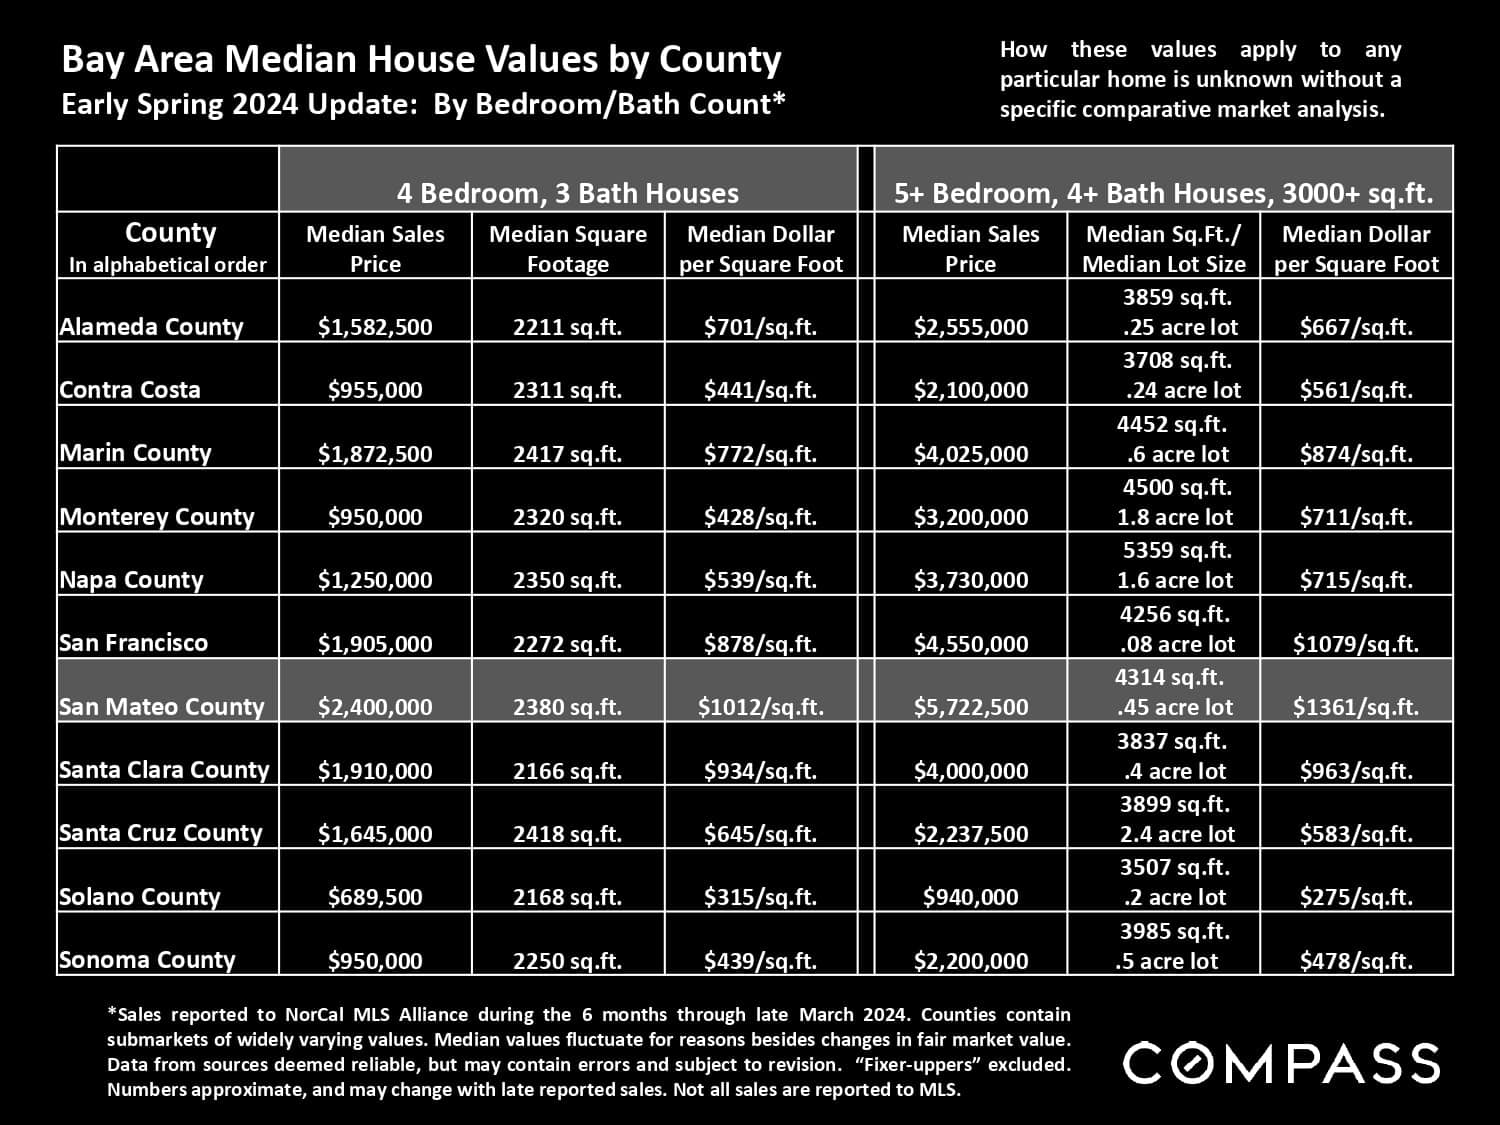
Bay Area county house values for early spring 2024, by bedroom and bath count.
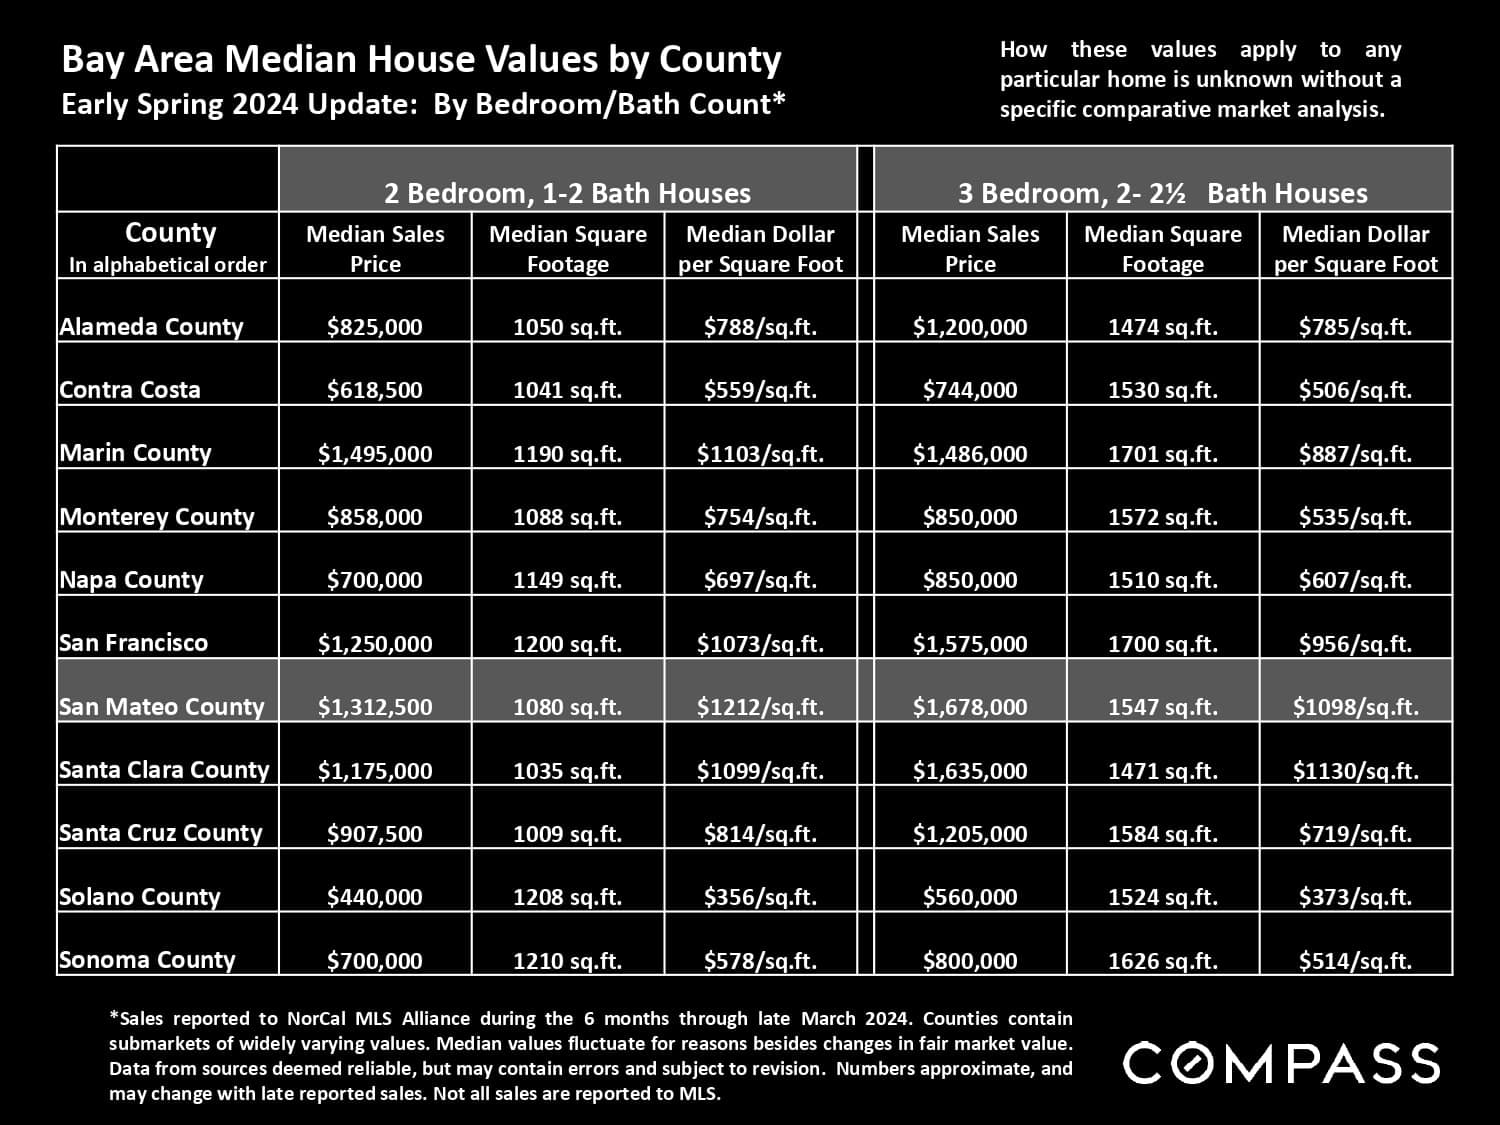
Bay Area county home-value table for early spring 2024, with San Mateo County highlighted.
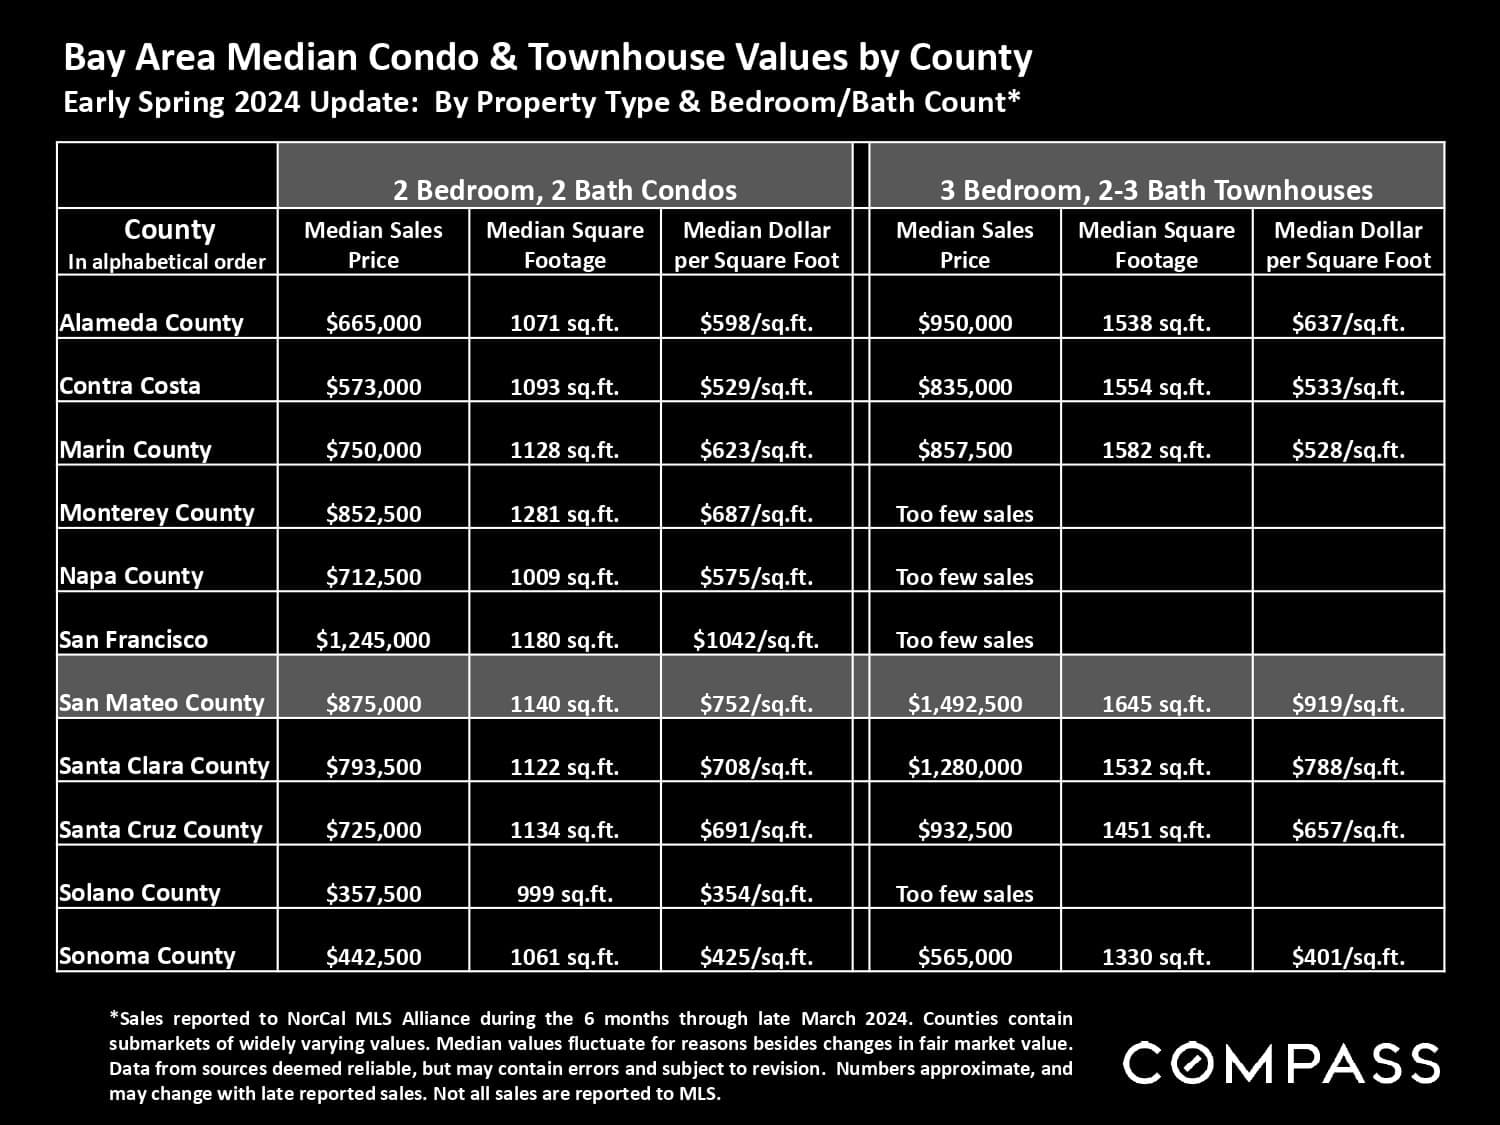
Bay Area county housing values table, with the San Mateo County row highlighted.
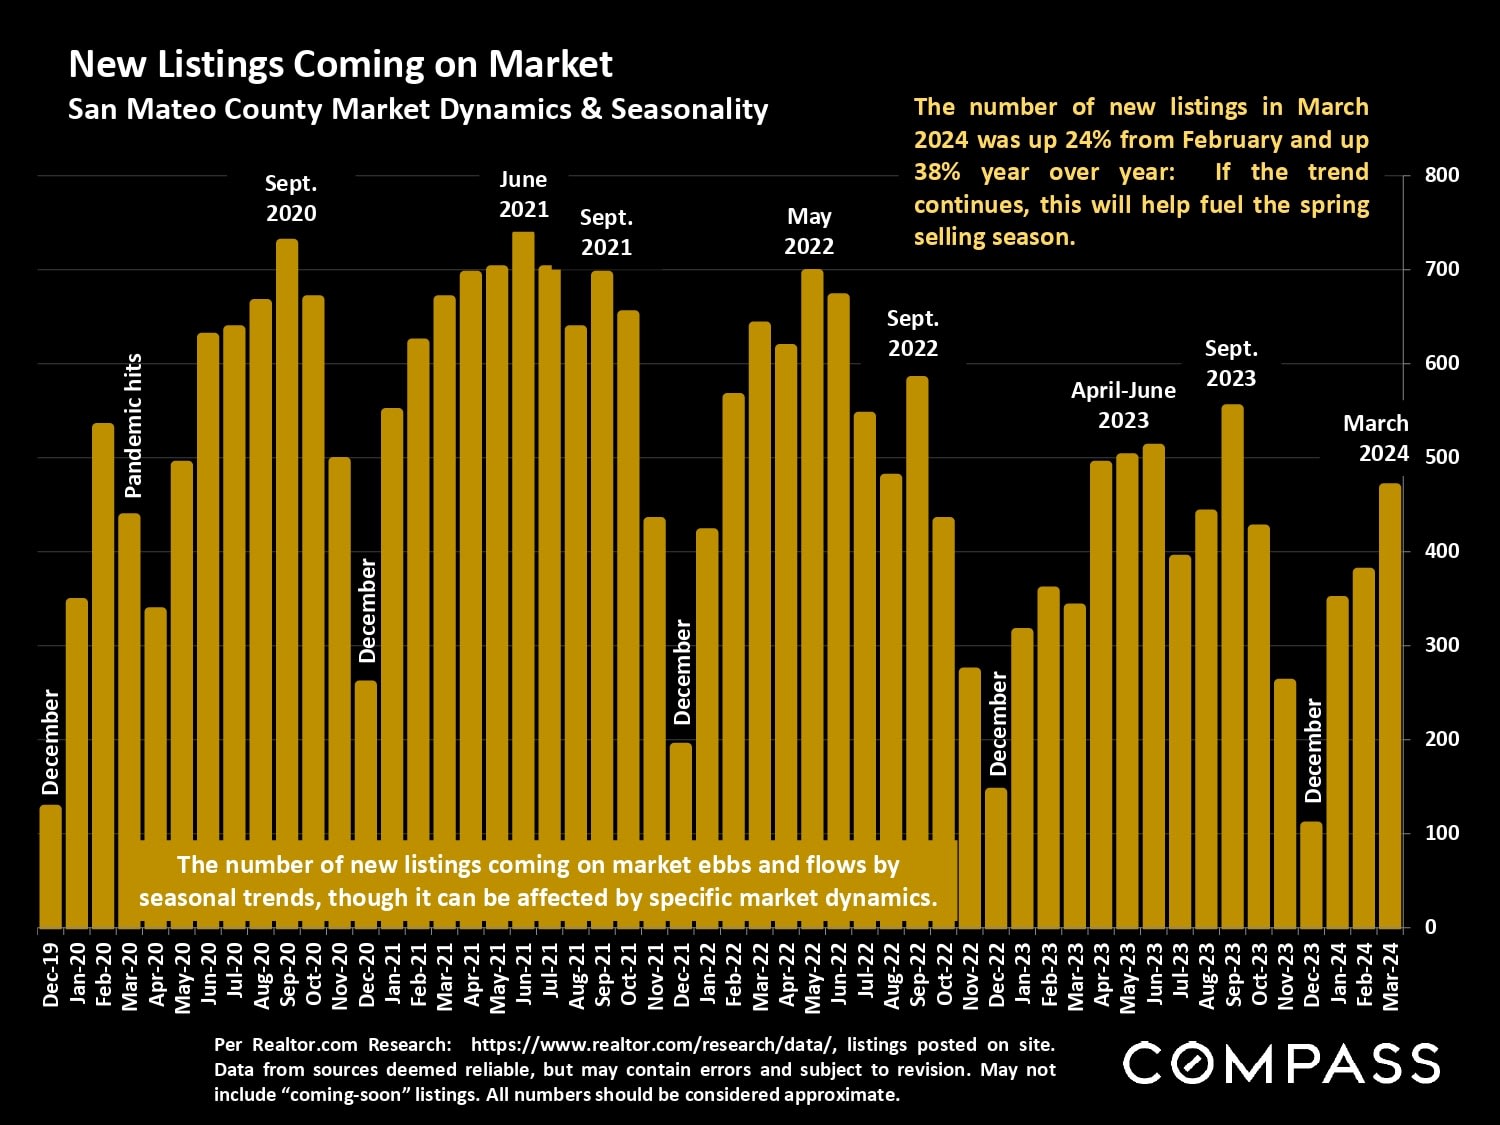
Chart of San Mateo County new listings, December 2019–March 2024, with gold bars and a March 2024 increase.
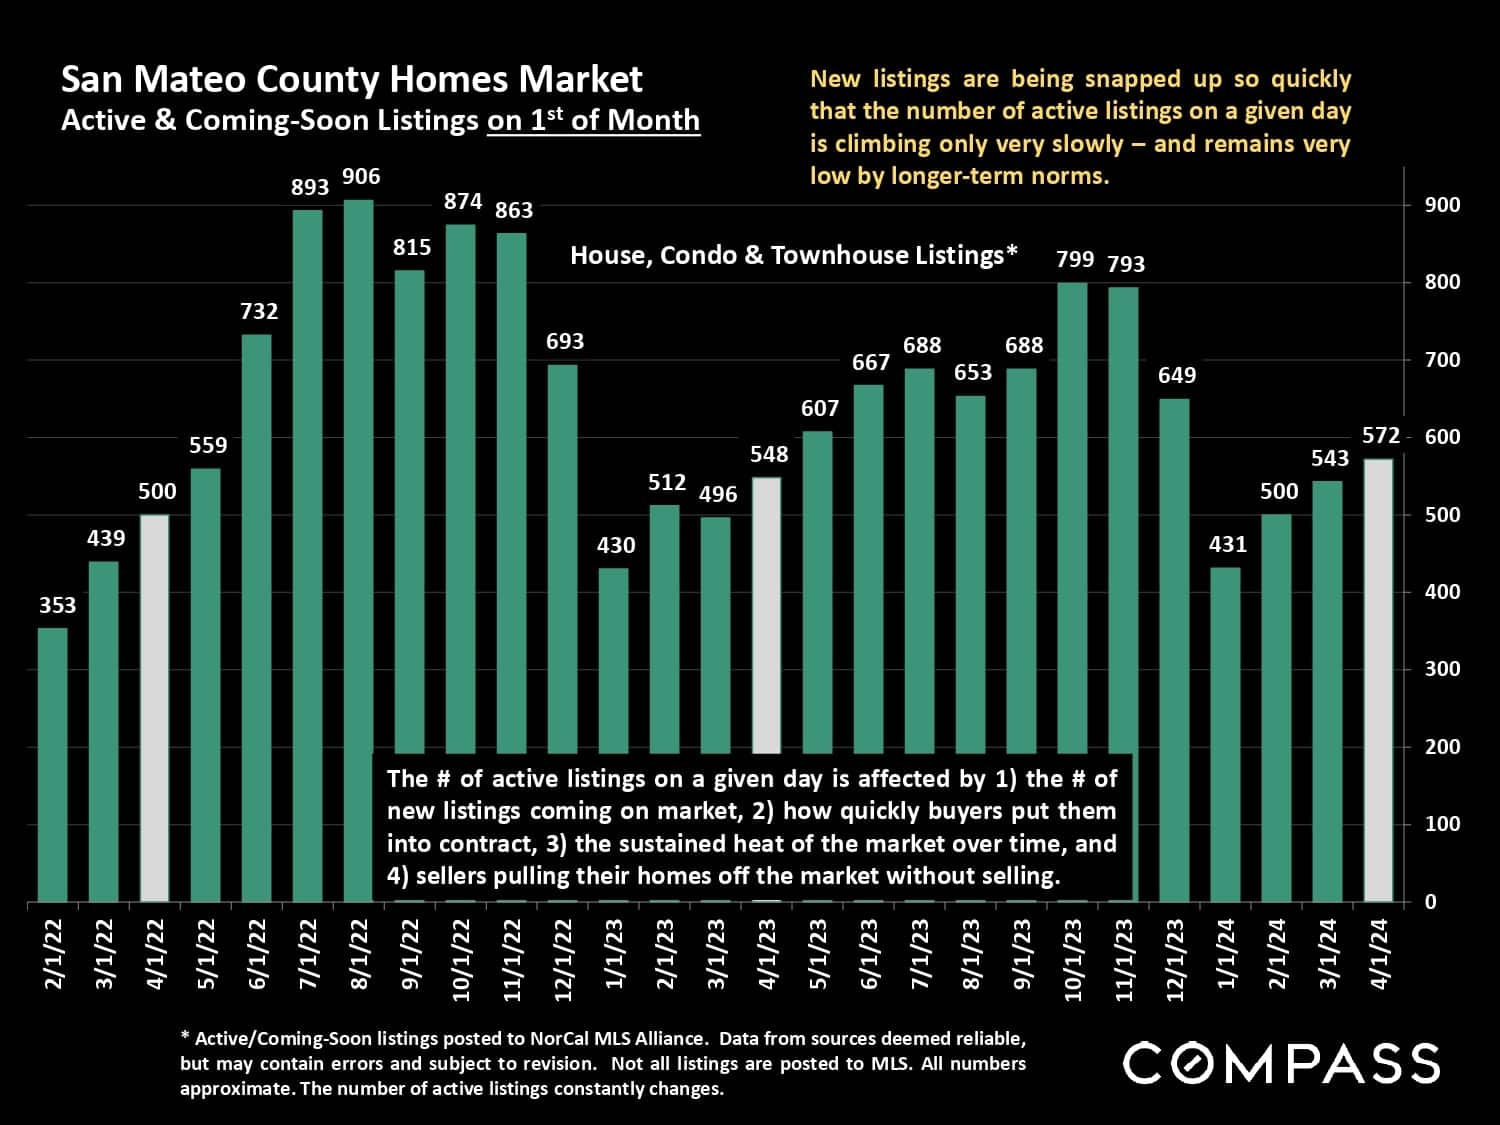
San Mateo County home-listing bar chart, February 2022–April 2024.
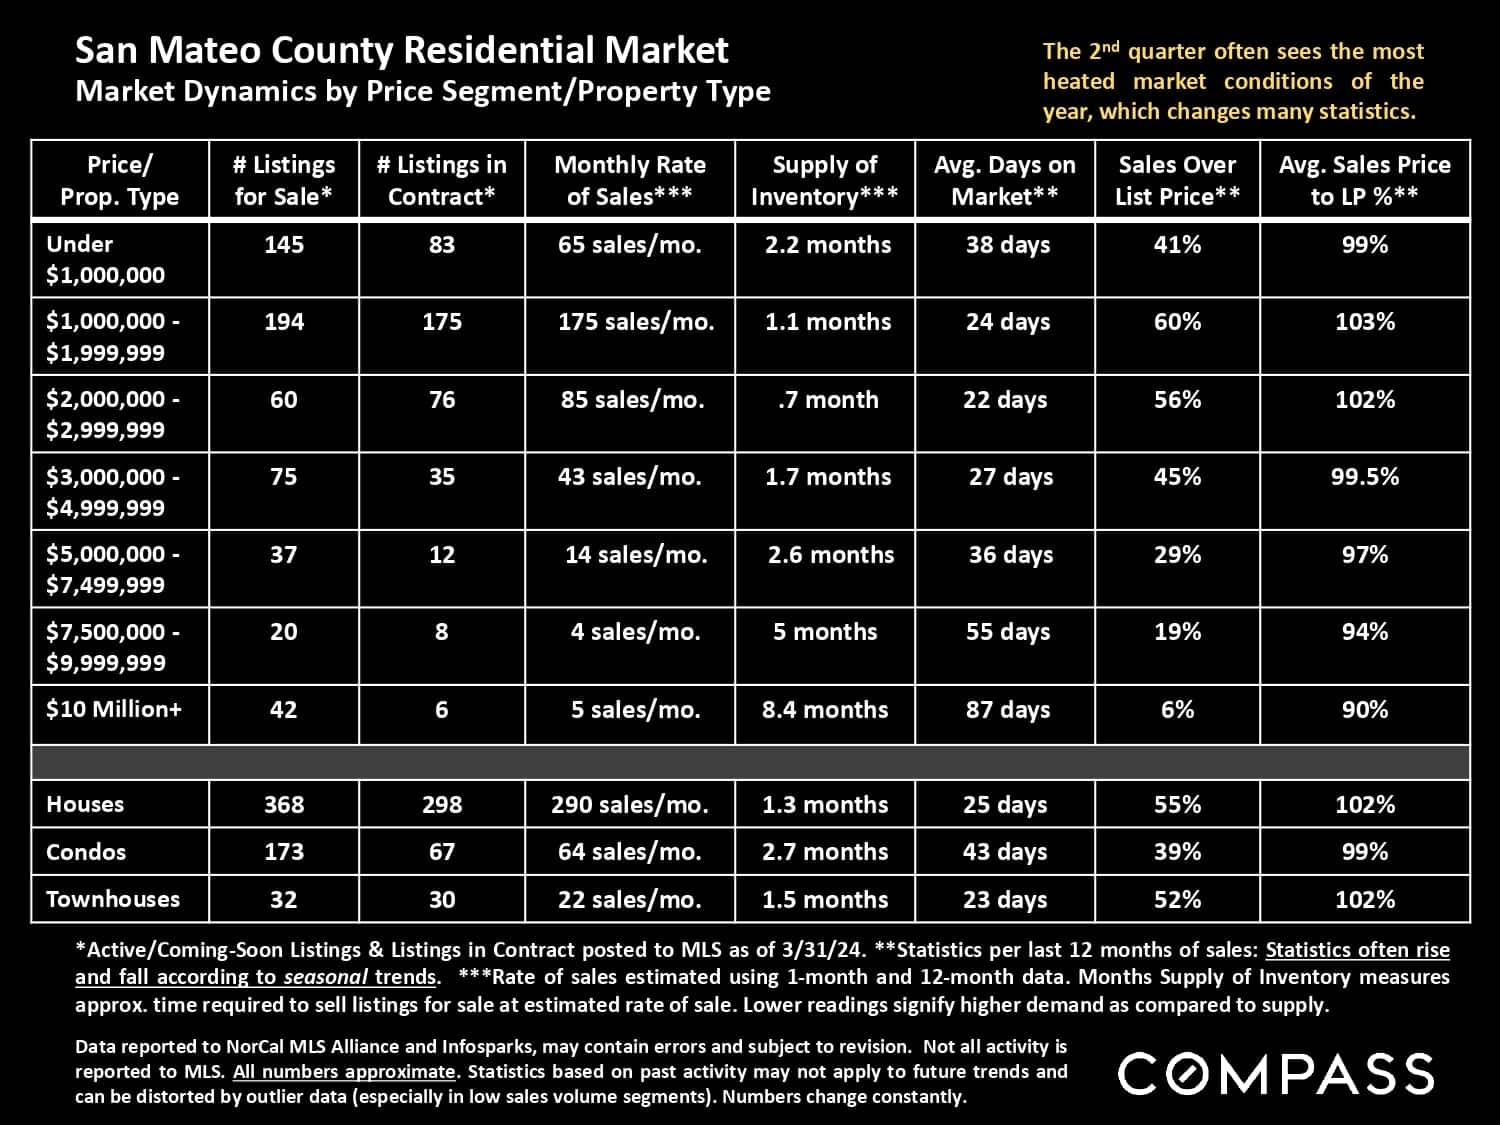
San Mateo County residential market statistics by price segment and property type, April 2024.
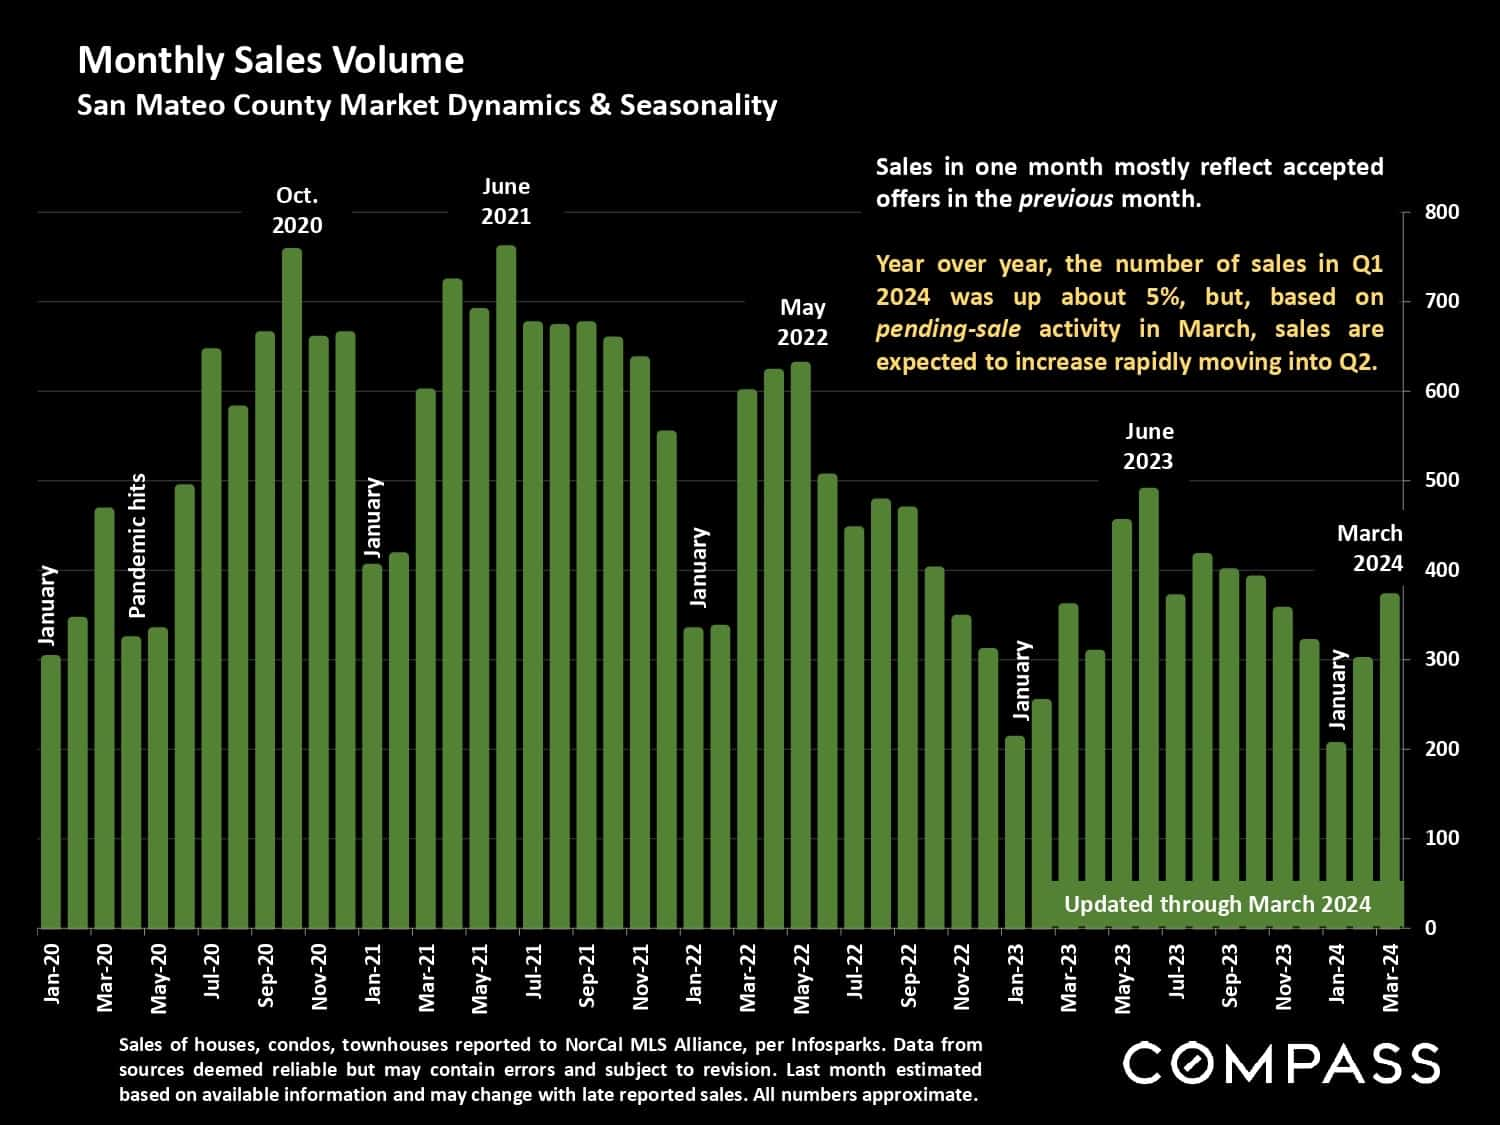
San Mateo County monthly home sales chart, January 2020–March 2024, with sales volume and market notes.
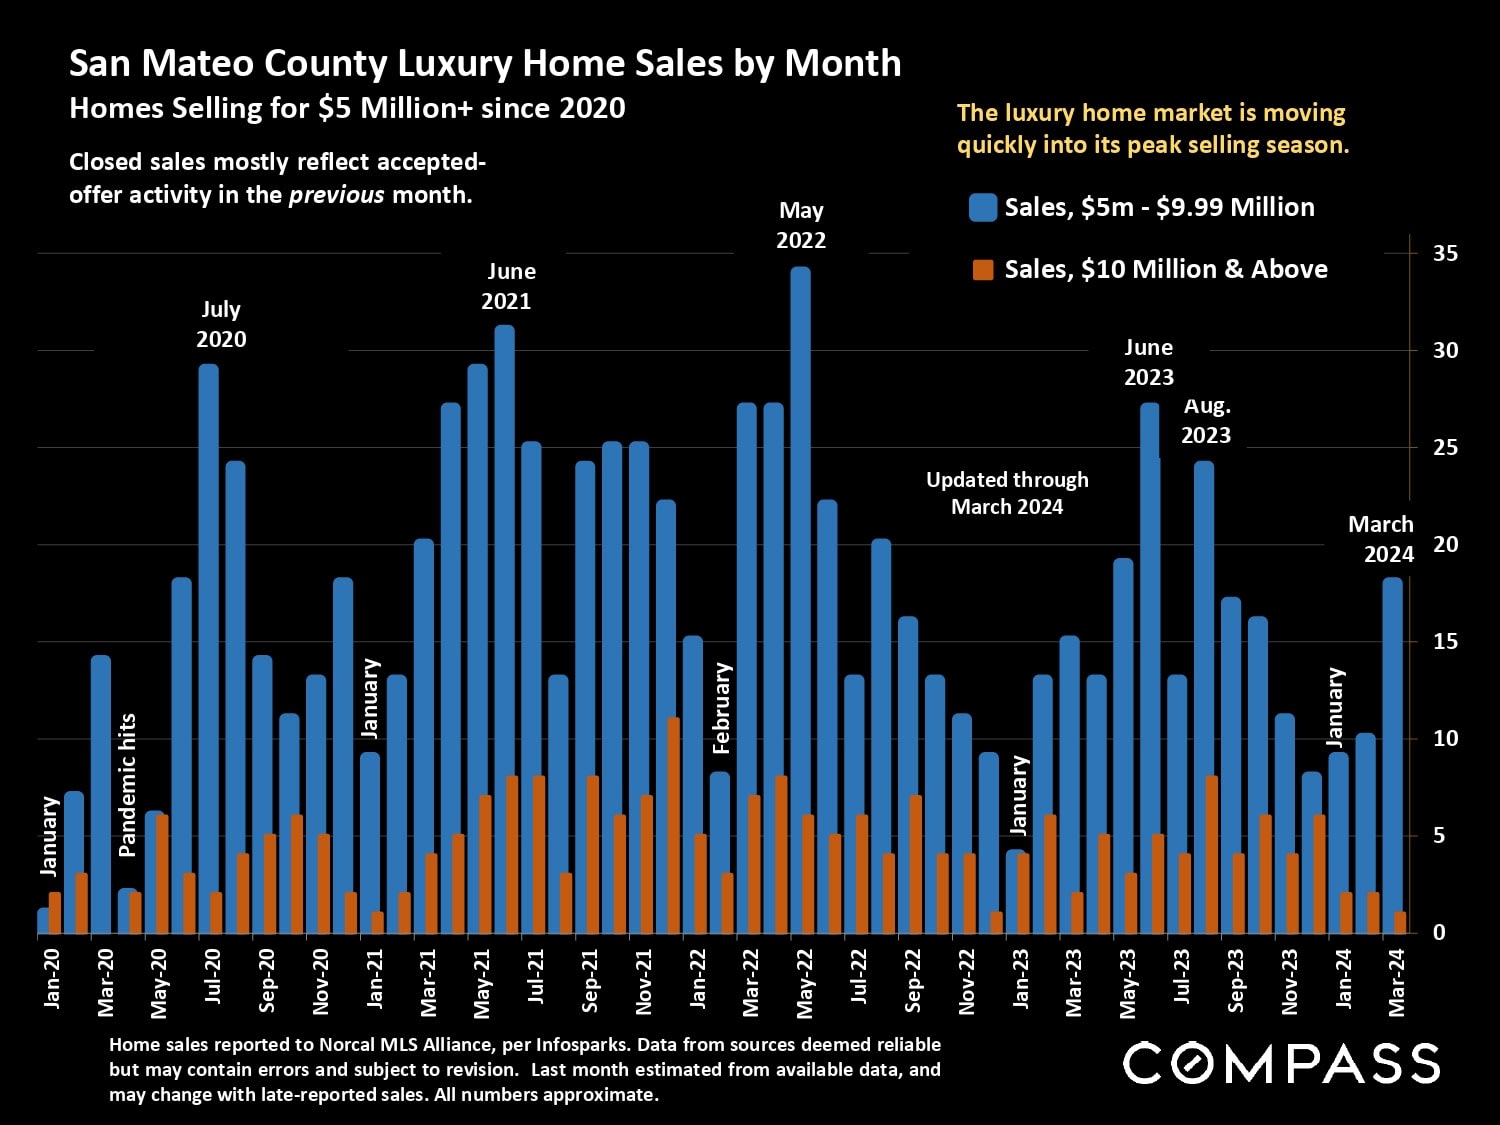
Chart of monthly San Mateo County home sales over $5 million, separated into two price ranges, from 2020 to 2024.
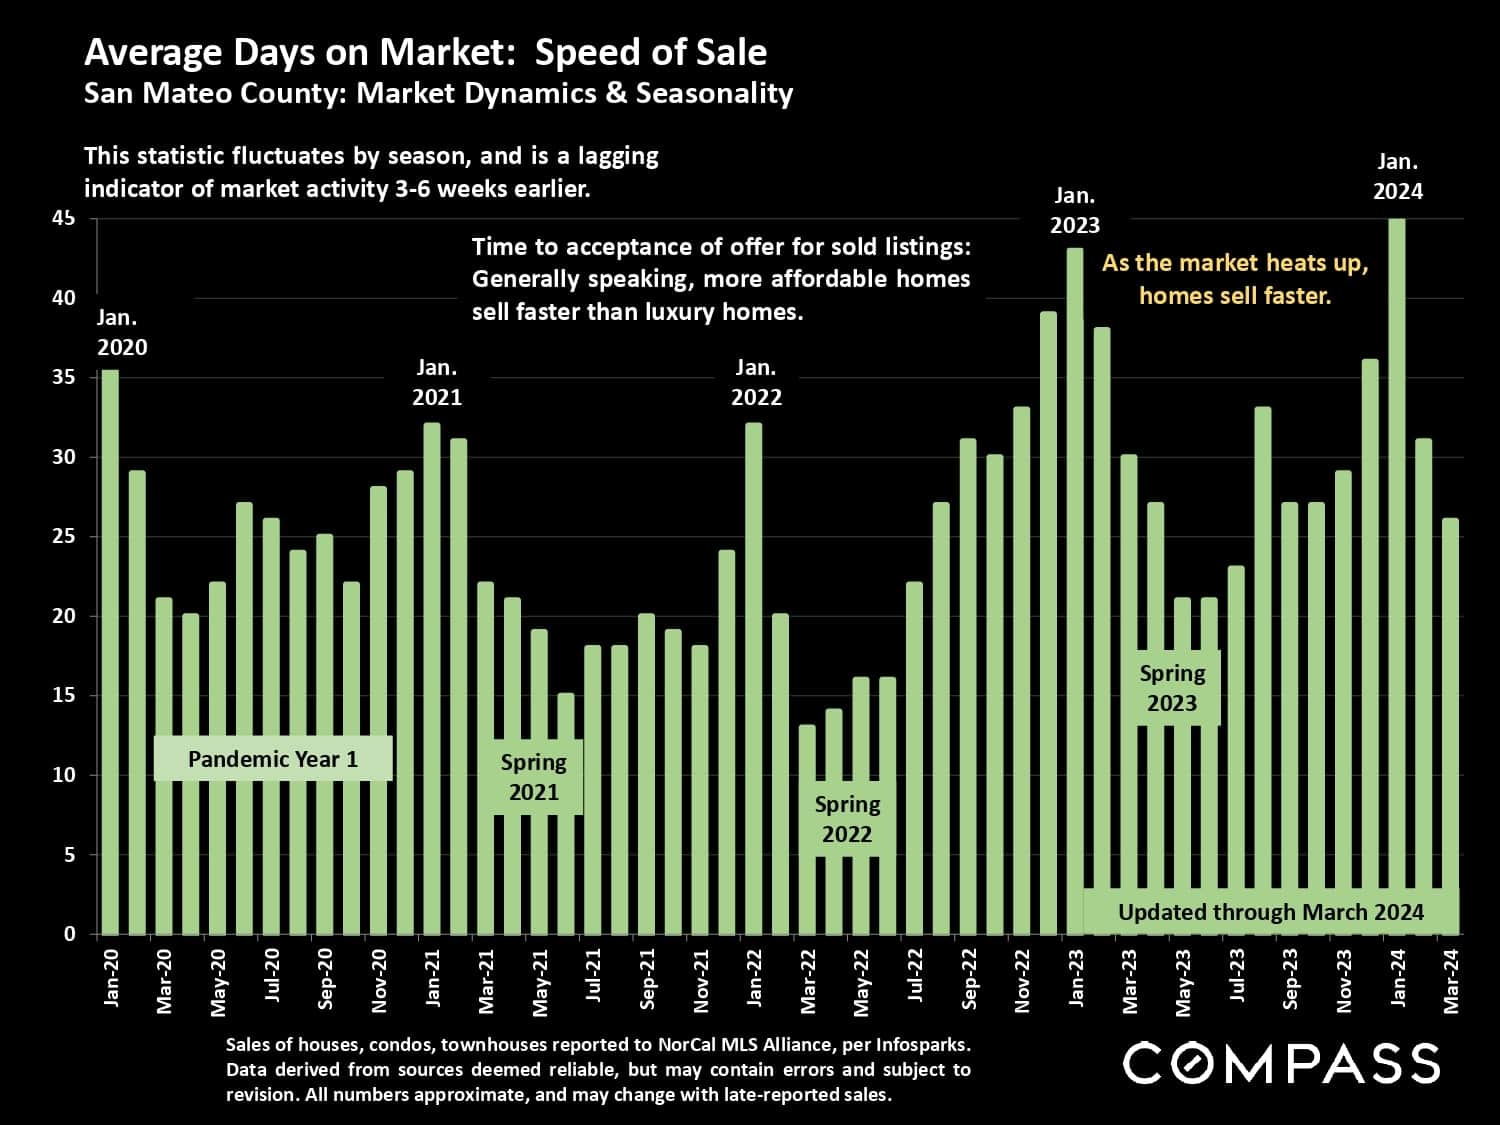
San Mateo County days-on-market bar chart, January 2020–March 2024, with seasonal annotations and a 45-day peak.
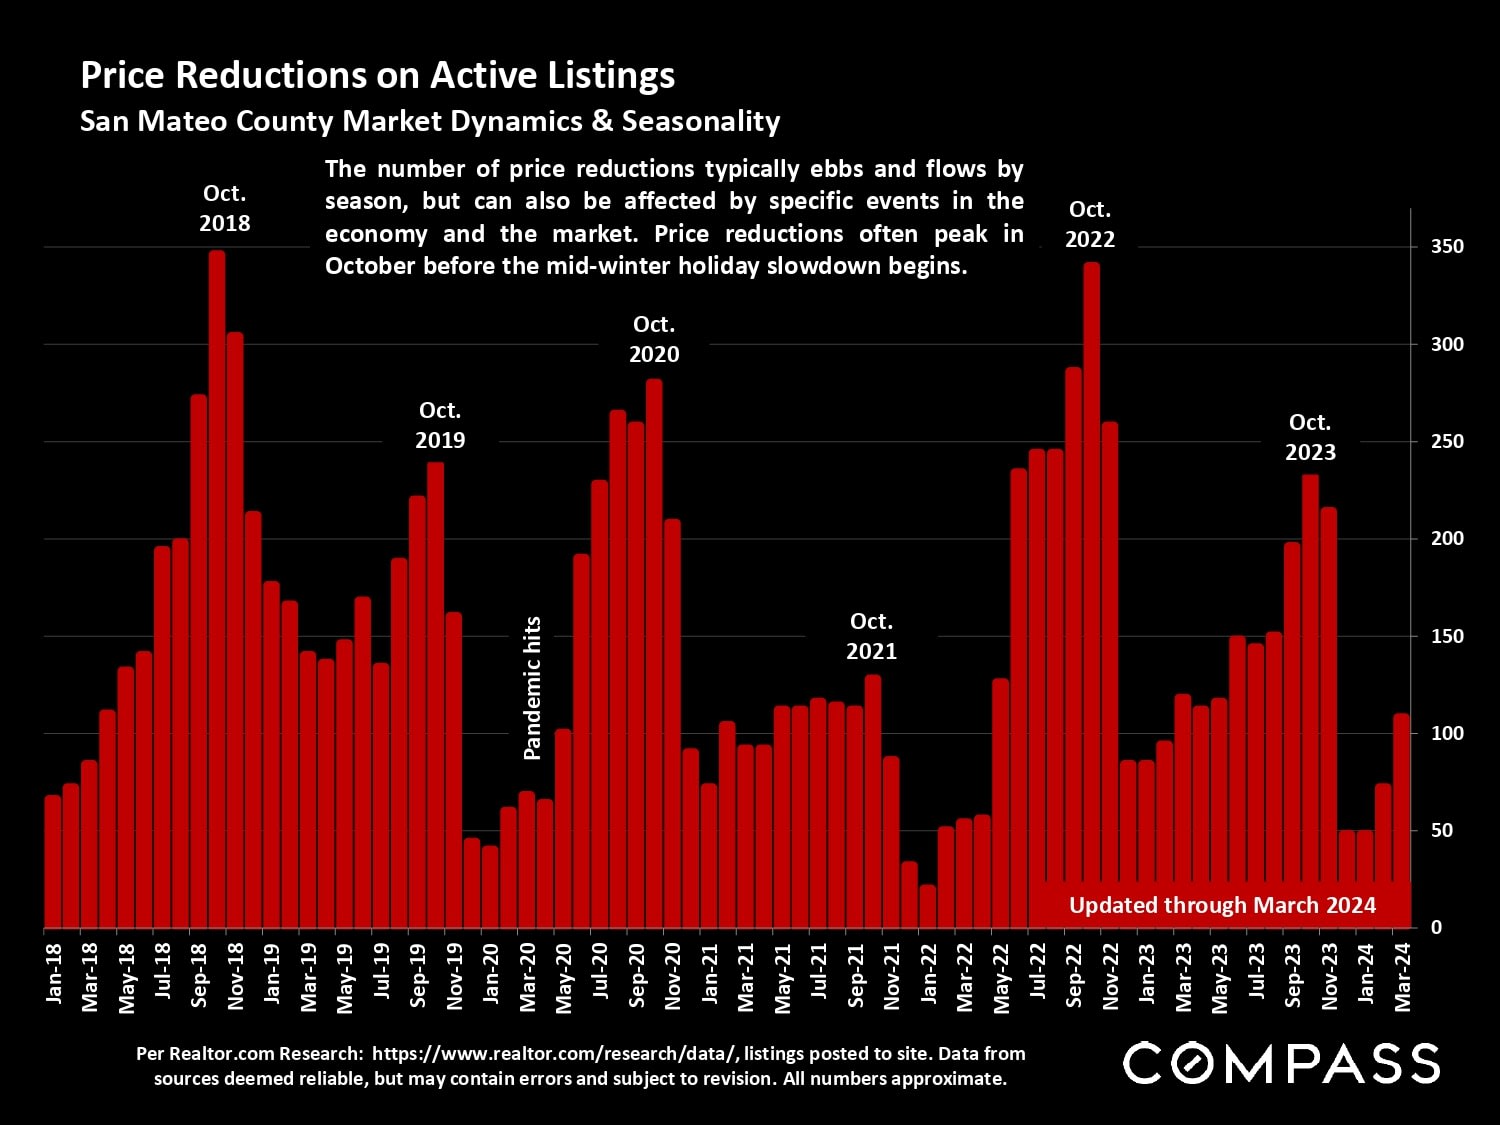
San Mateo County active-listing price reductions, charted monthly from January 2018 through March 2024.
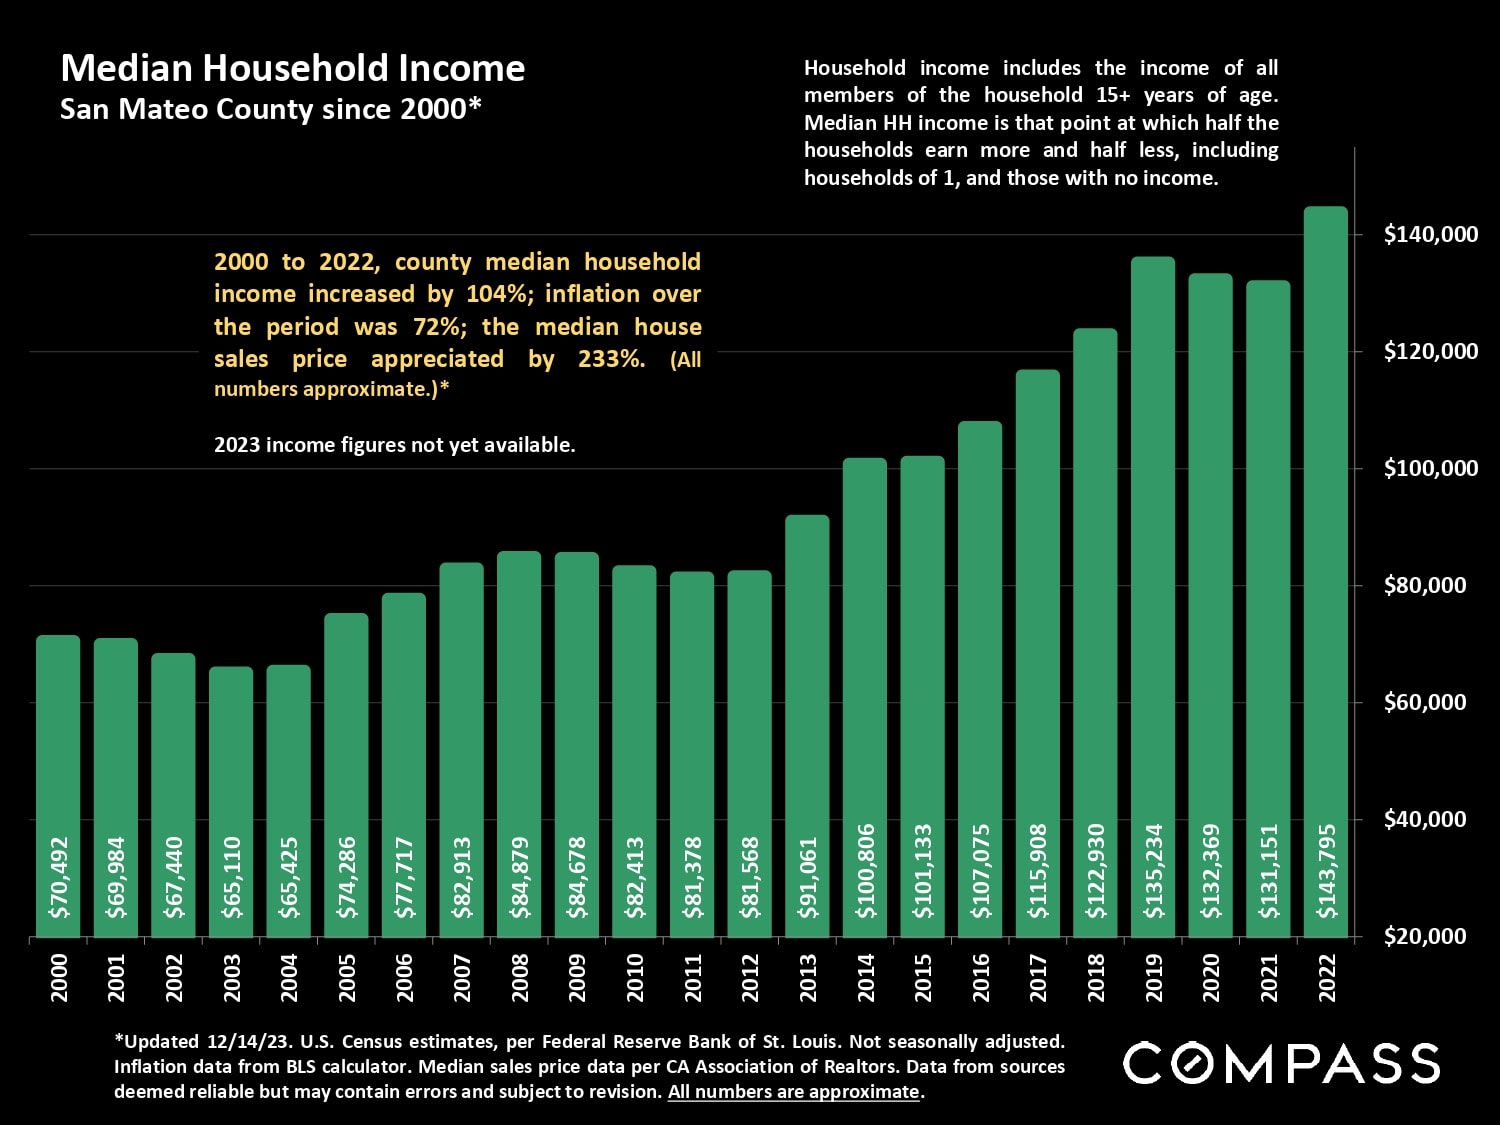
Bar chart of San Mateo County median household income, rising from $70,492 in 2000 to $143,795 in 2022.
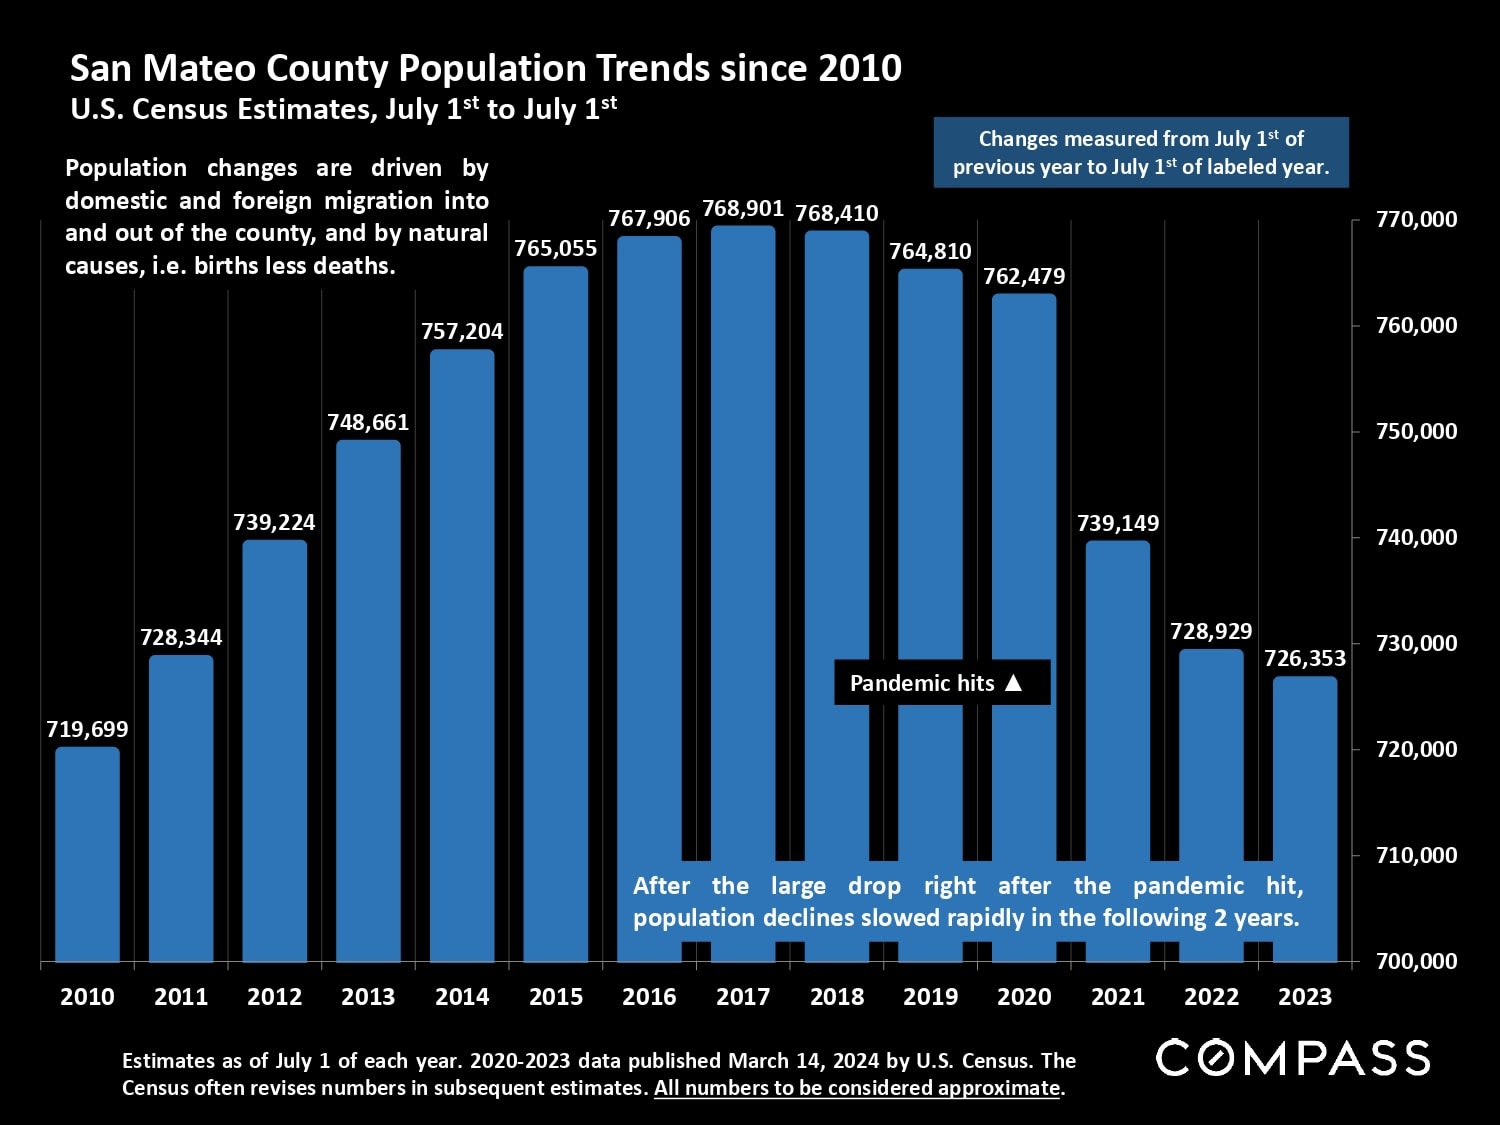
Bar chart of San Mateo County population estimates, peaking in 2017 before declining to 726,353 in 2023.
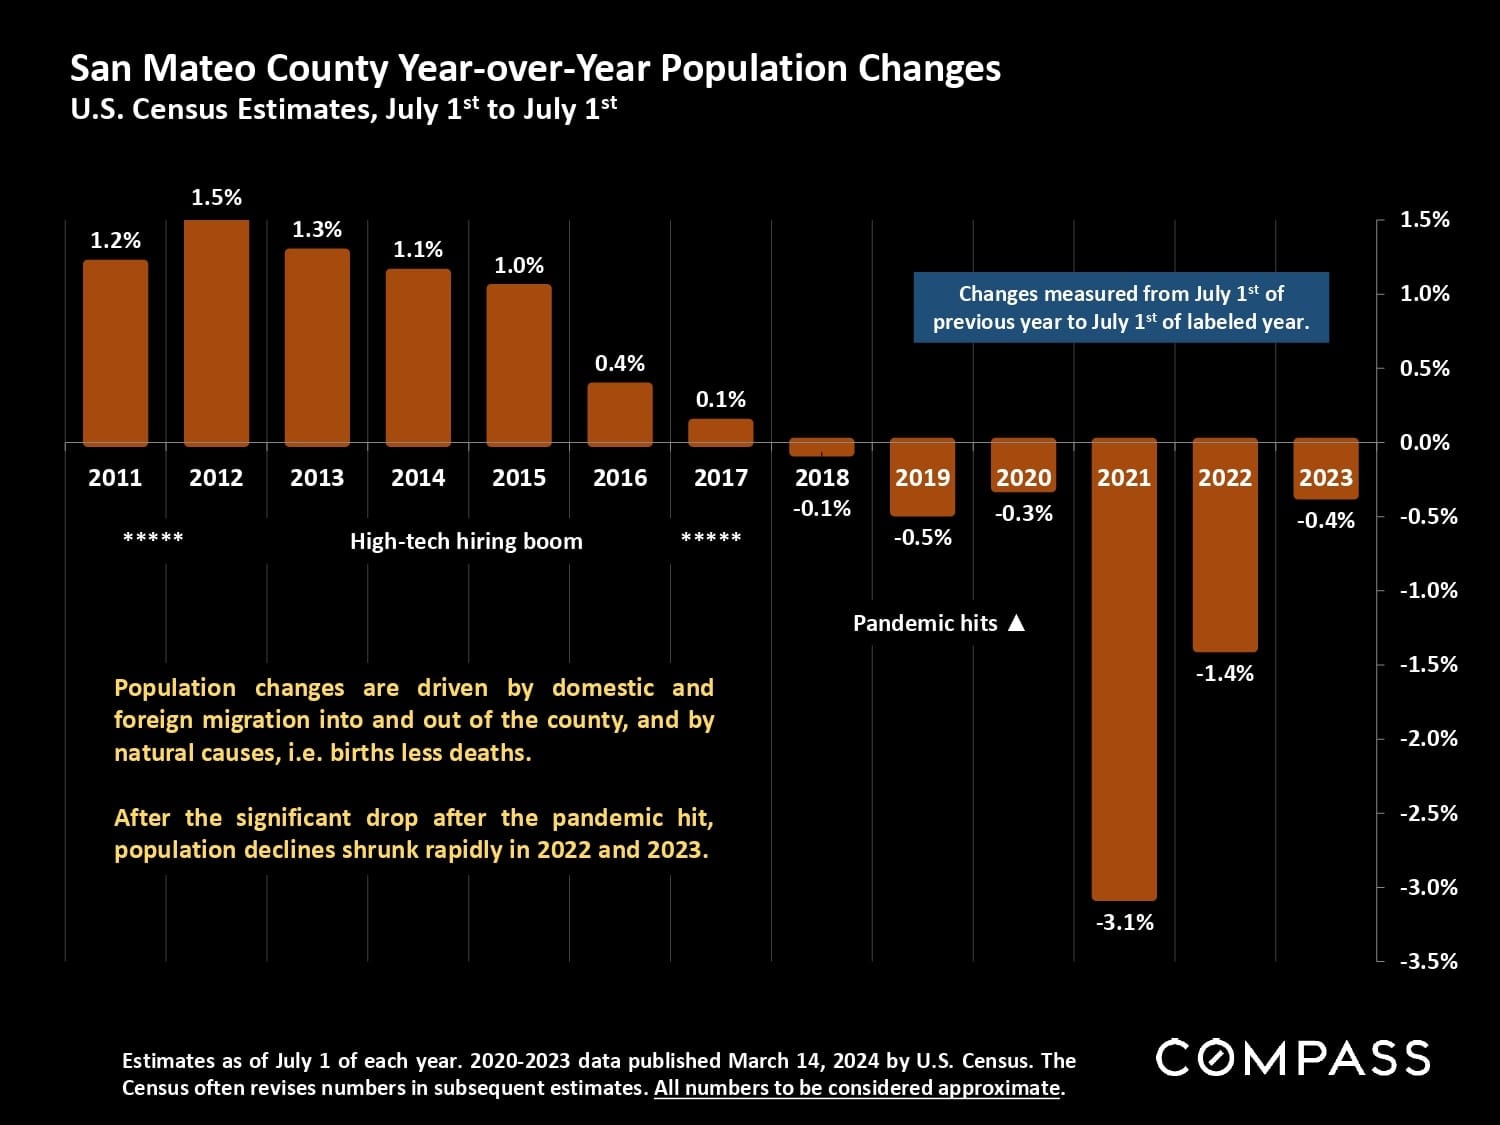
San Mateo County population change chart, showing a sharp 2021 decline and smaller decreases in 2022 and 2023.
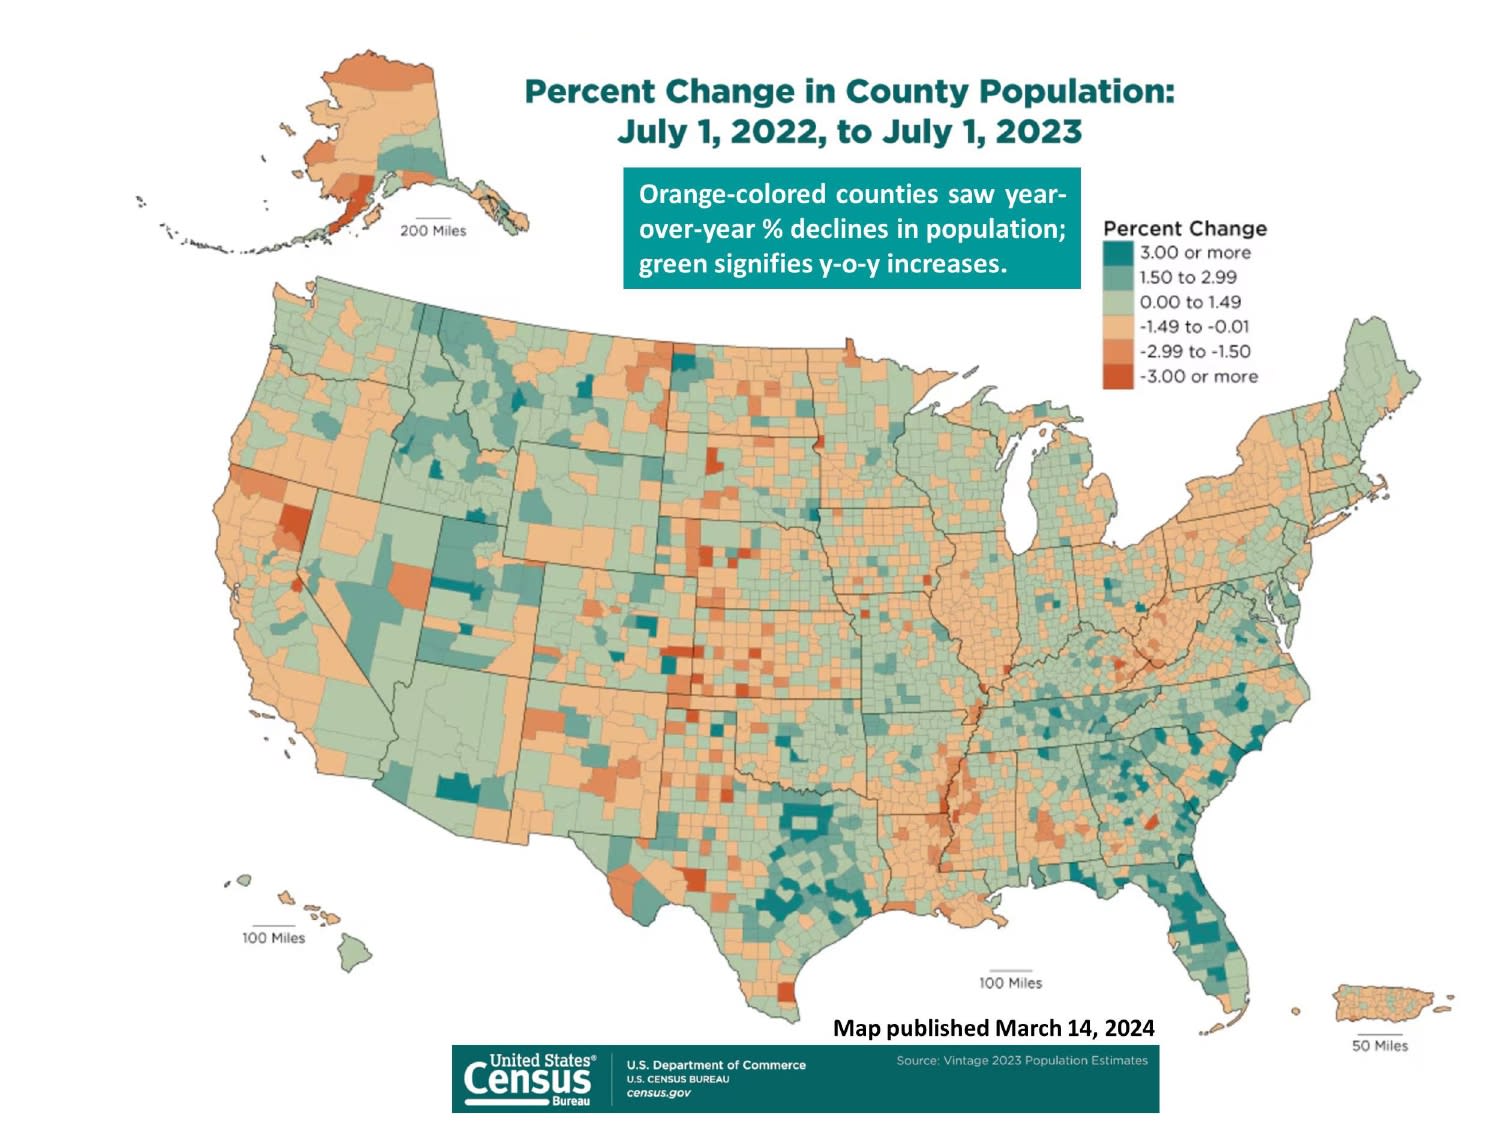
U.S. map of county population changes from July 2022 to July 2023, with orange declines and green increases.
San Mateo County market report notes explaining real estate statistics, data limitations, and Compass disclaimers.


WORK WITH US

We offer the highest level of service and expertise to our clients. Our team has built a reputation for consistently representing the finest real estate in San Francisco and Napa Valley. Results driven and dedicated to your success, whether buying, selling, renting or investing. Contact us today for a private consultation.

Contact Us