San Mateo County Real Estate March 2025 Report

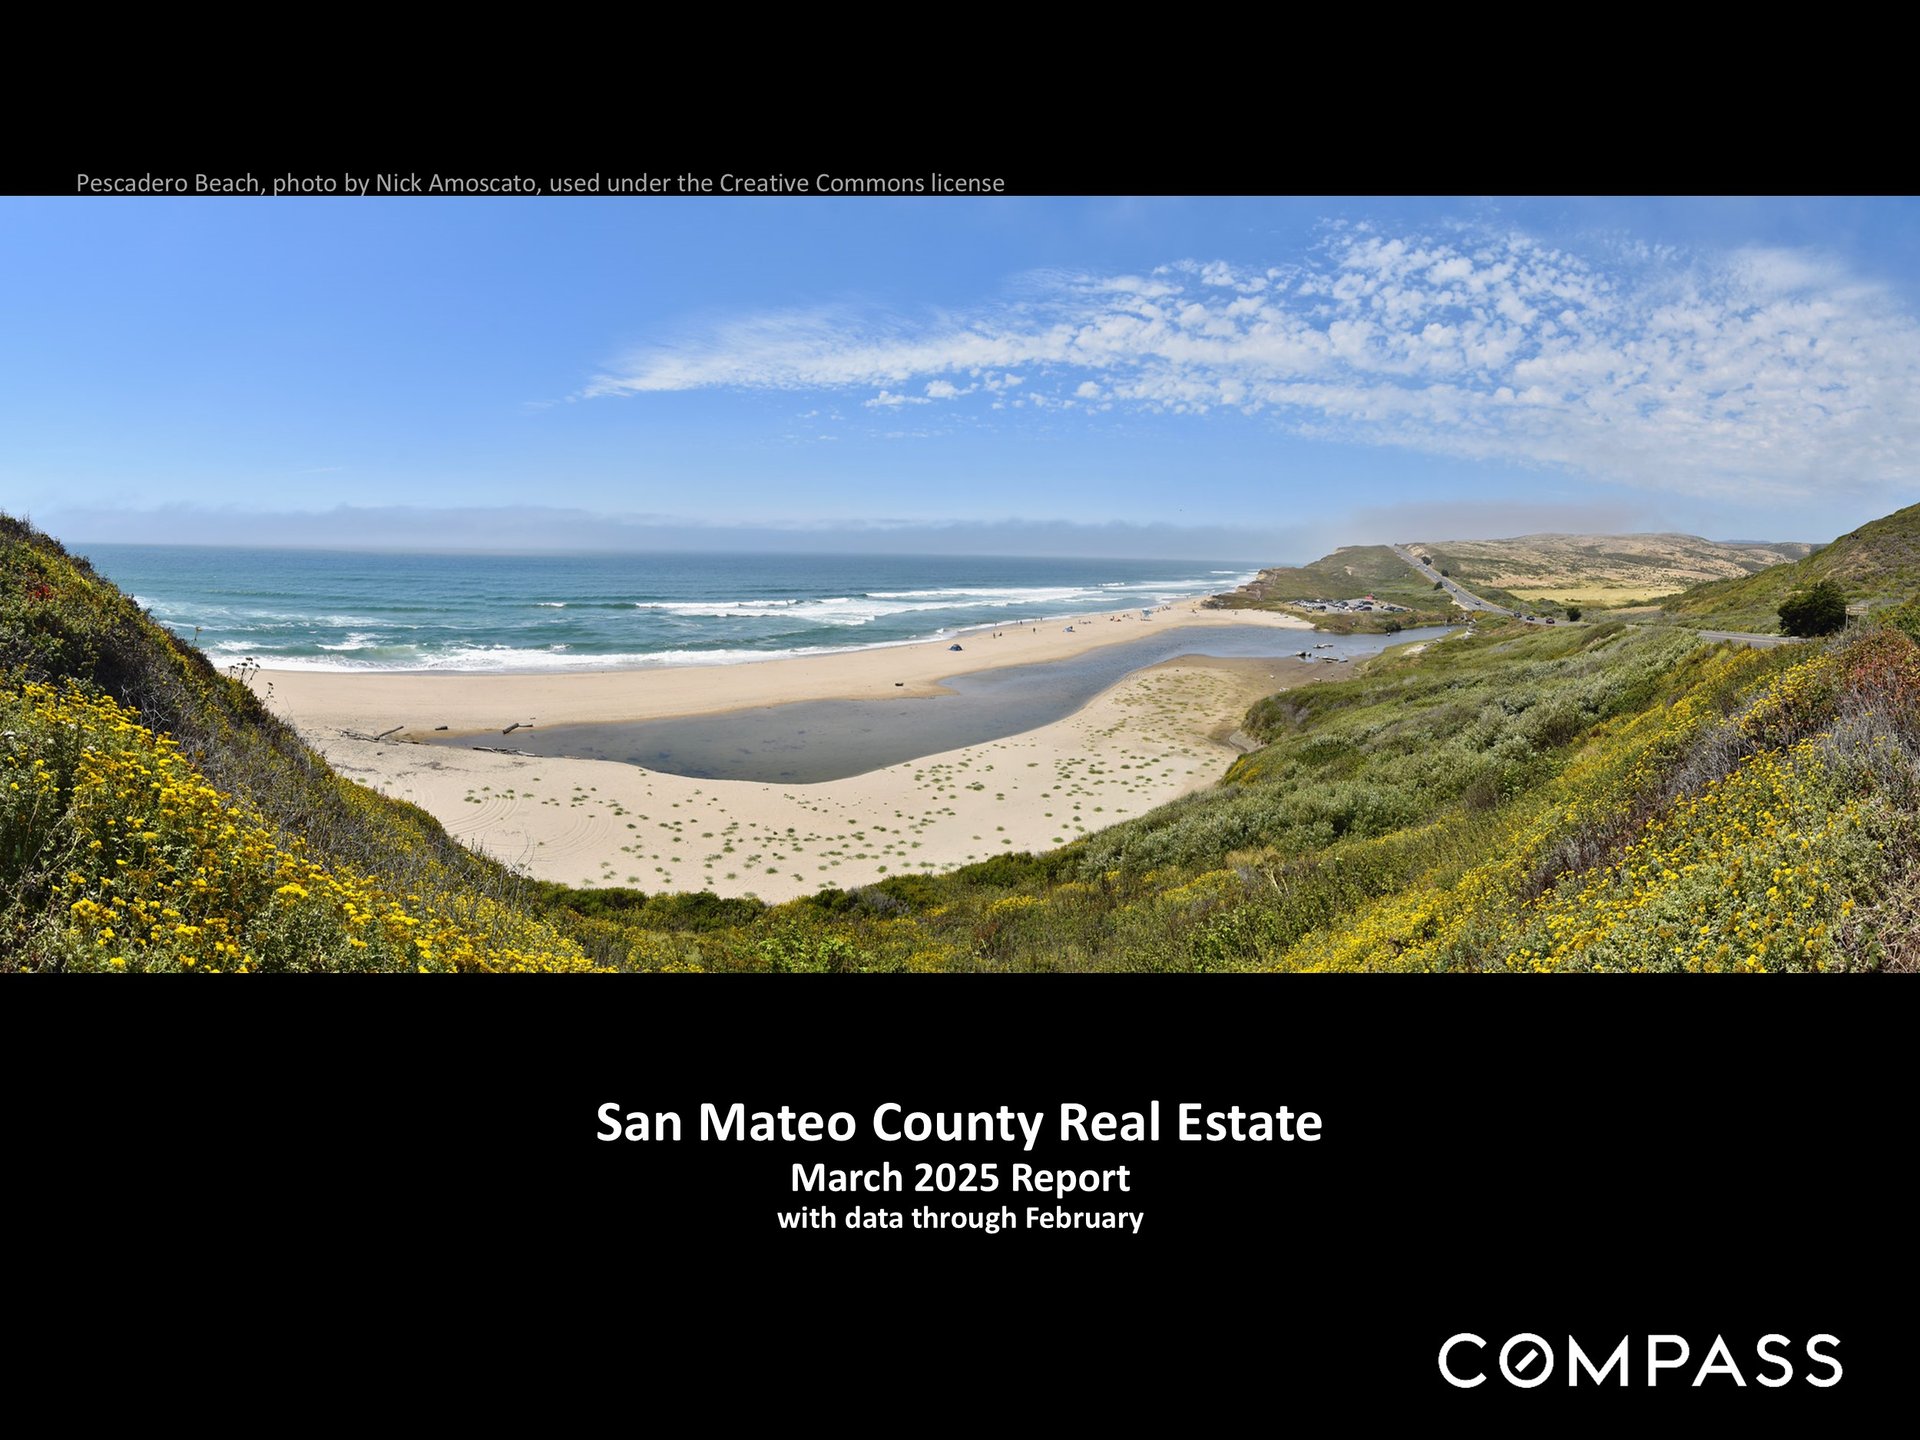
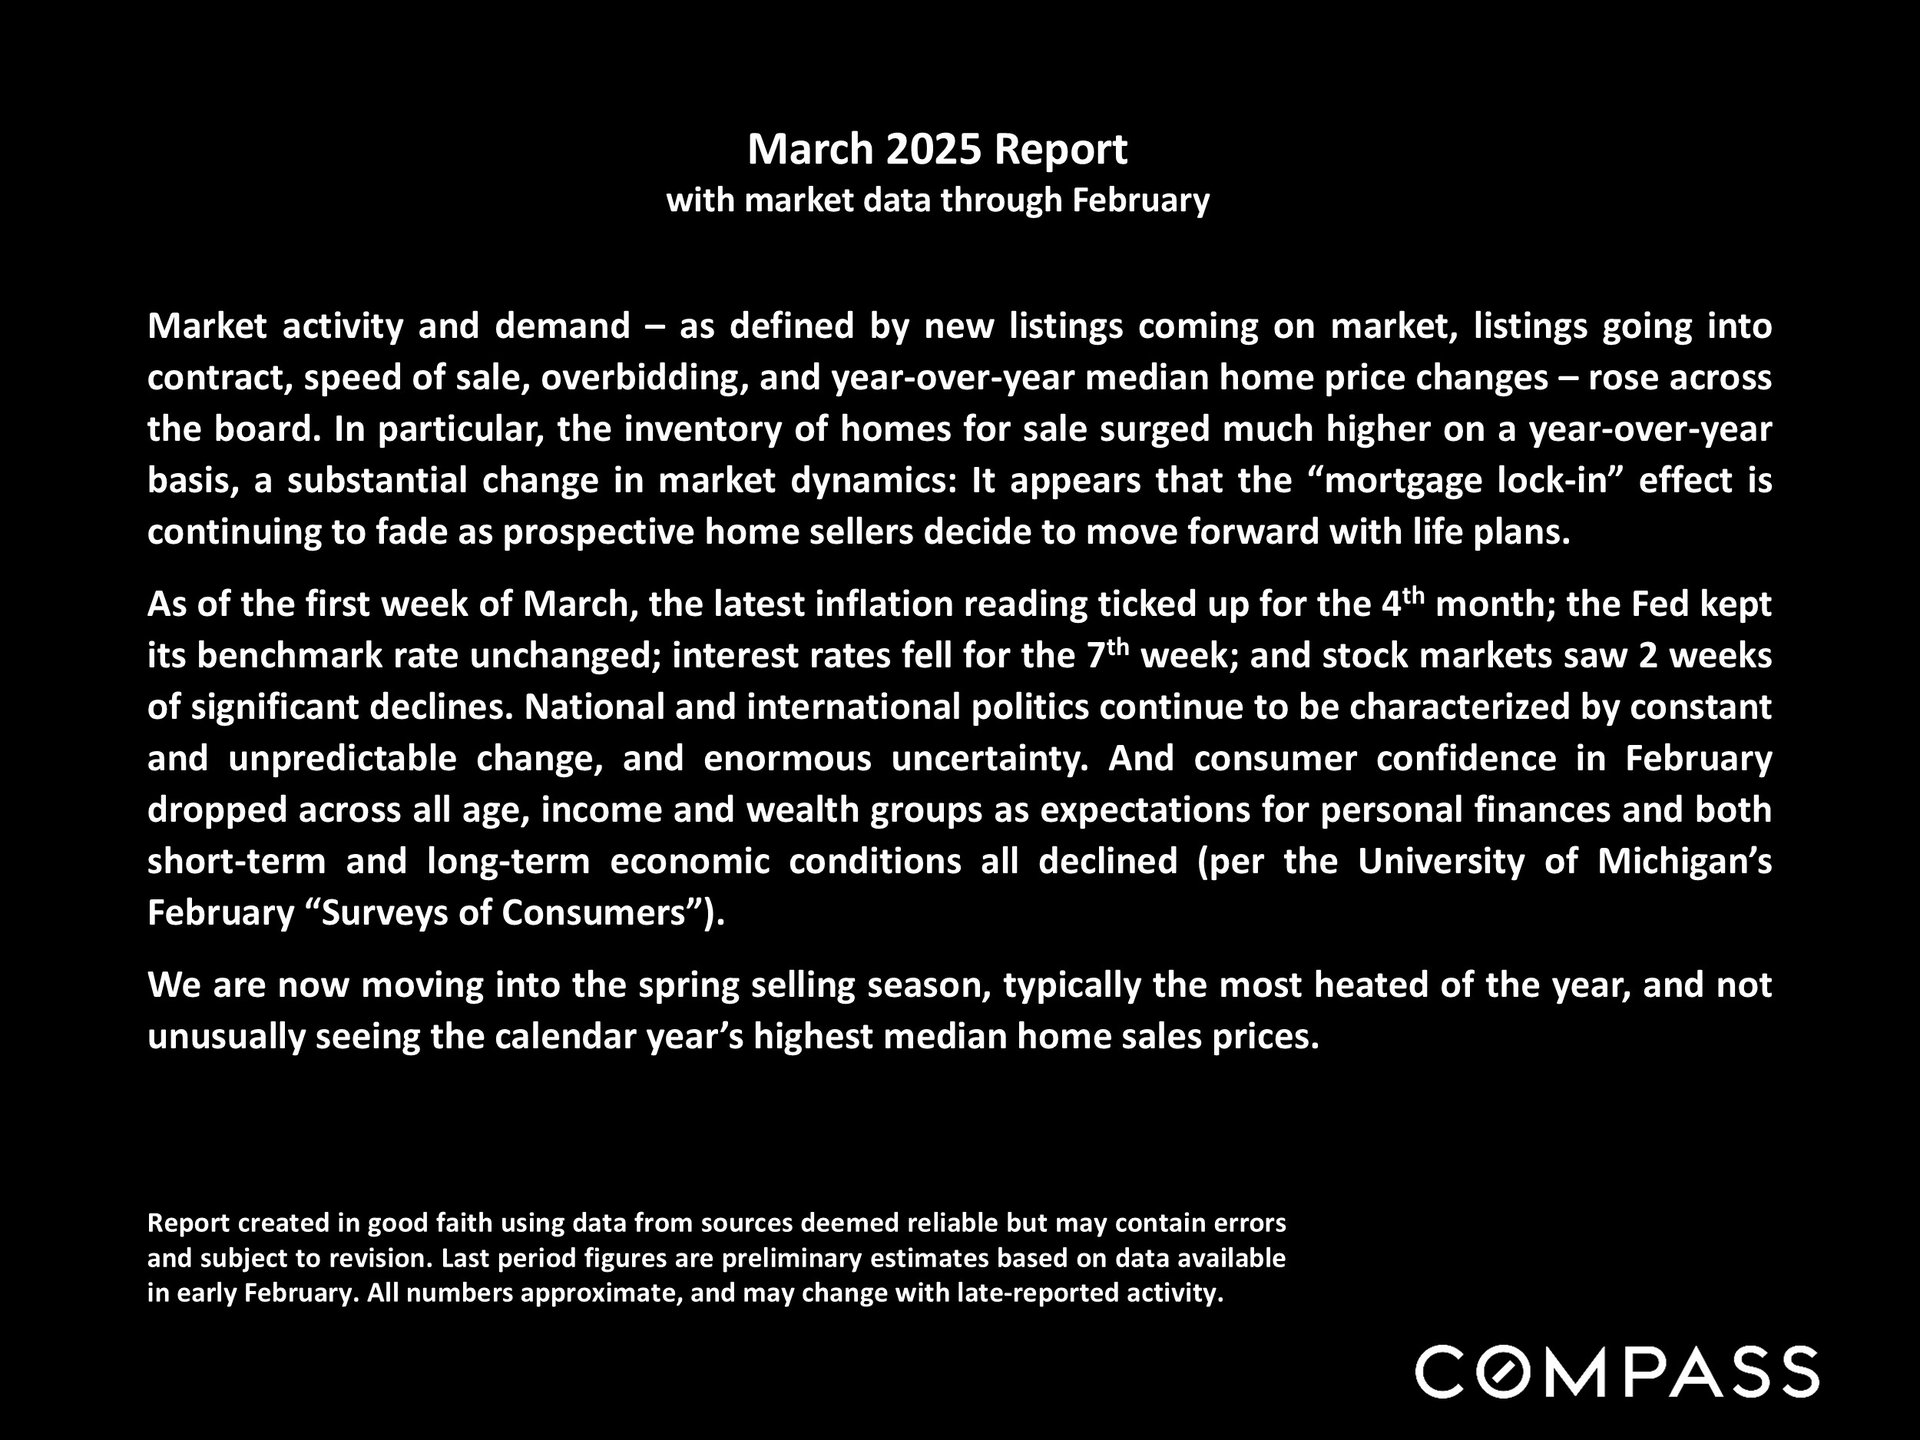
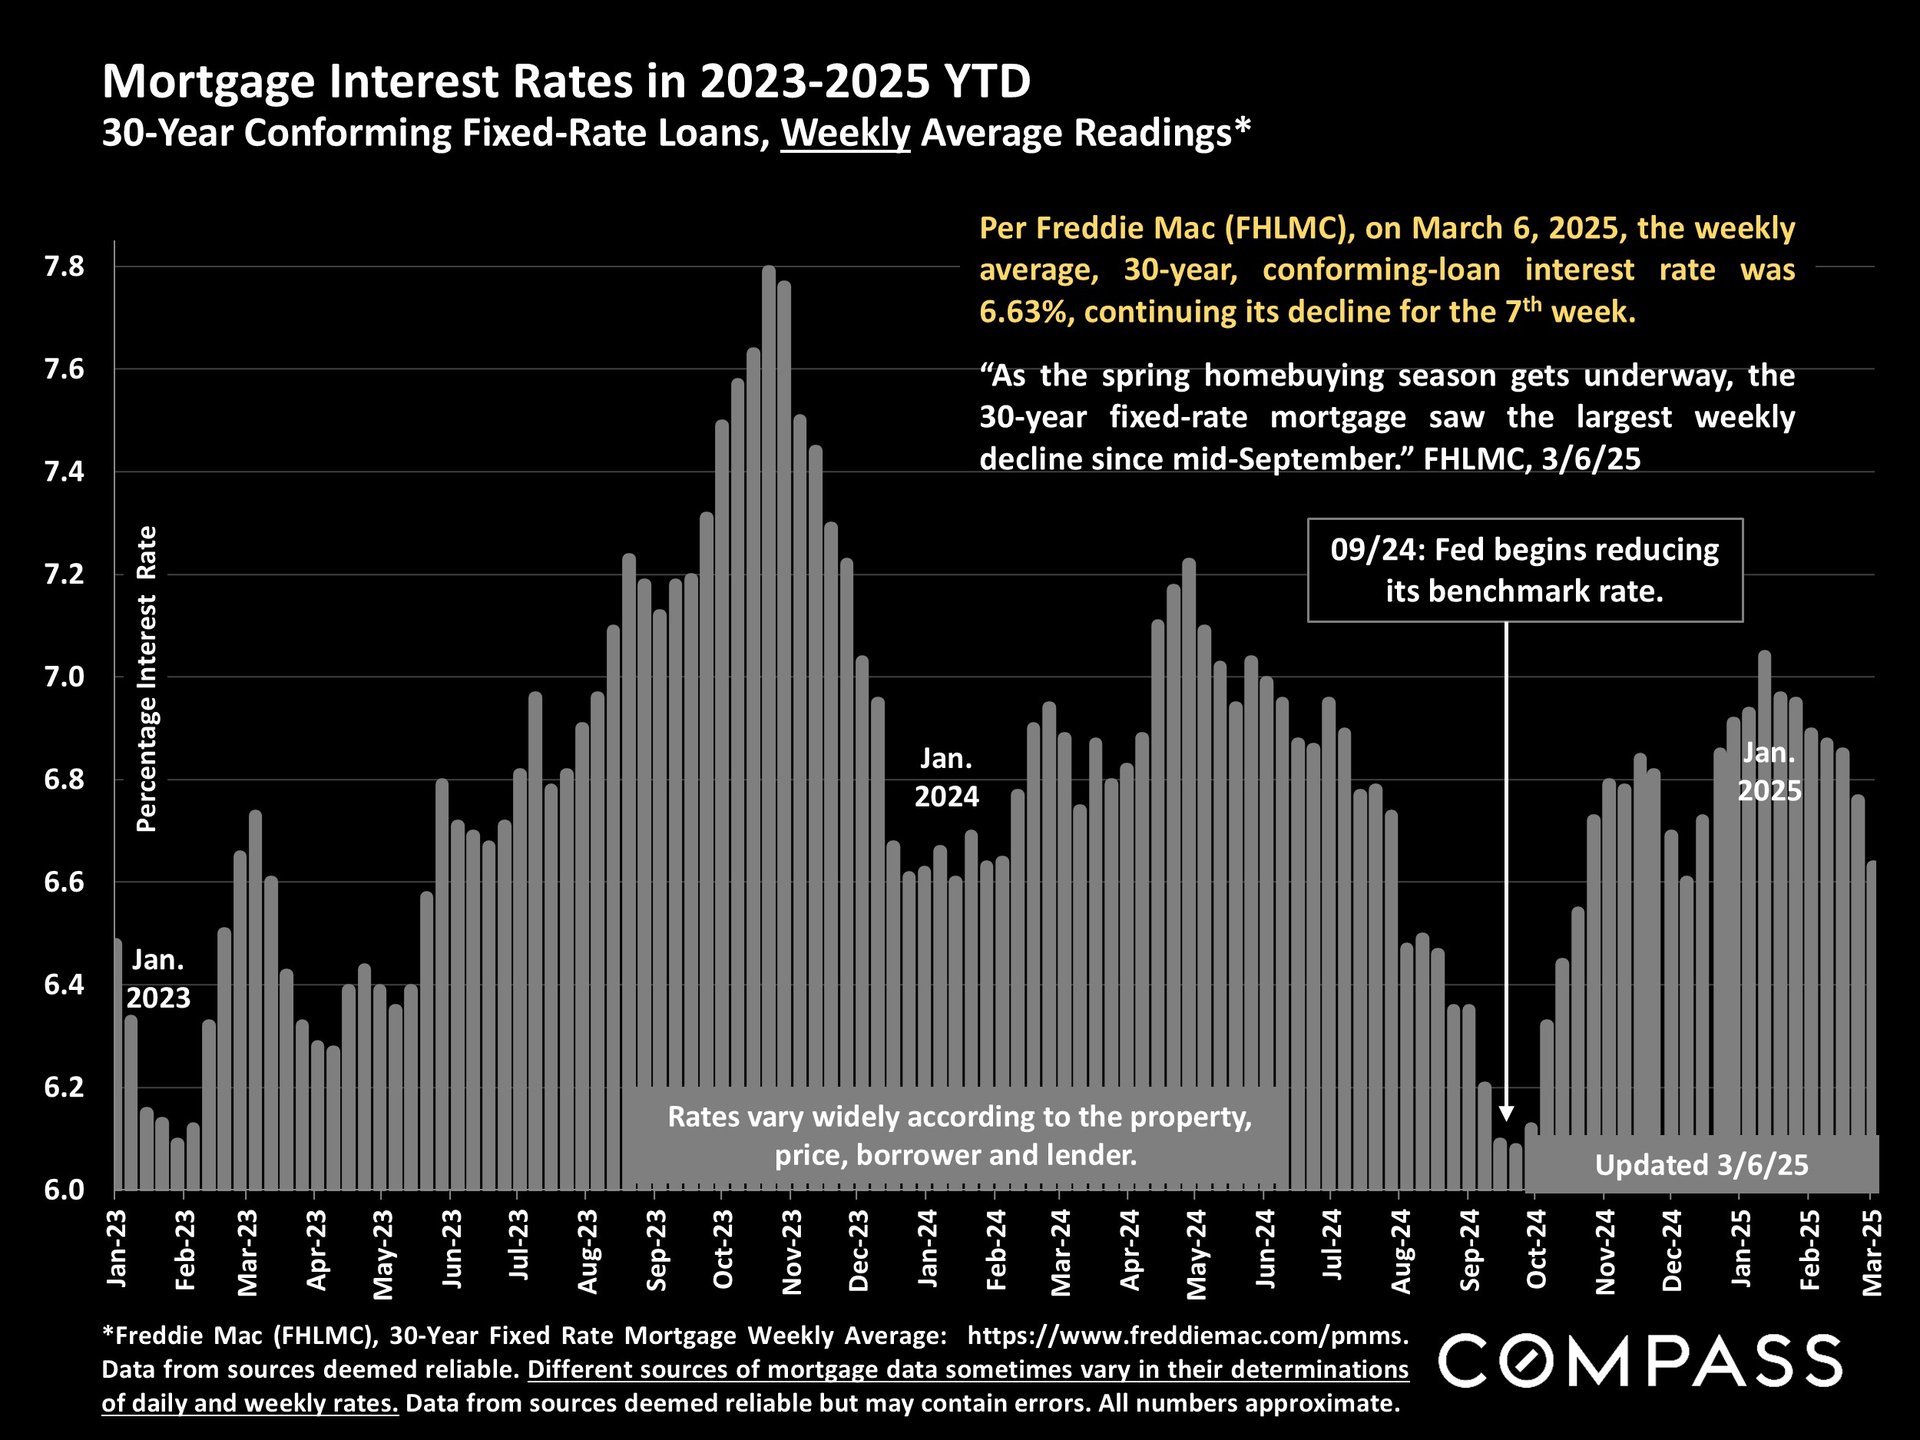
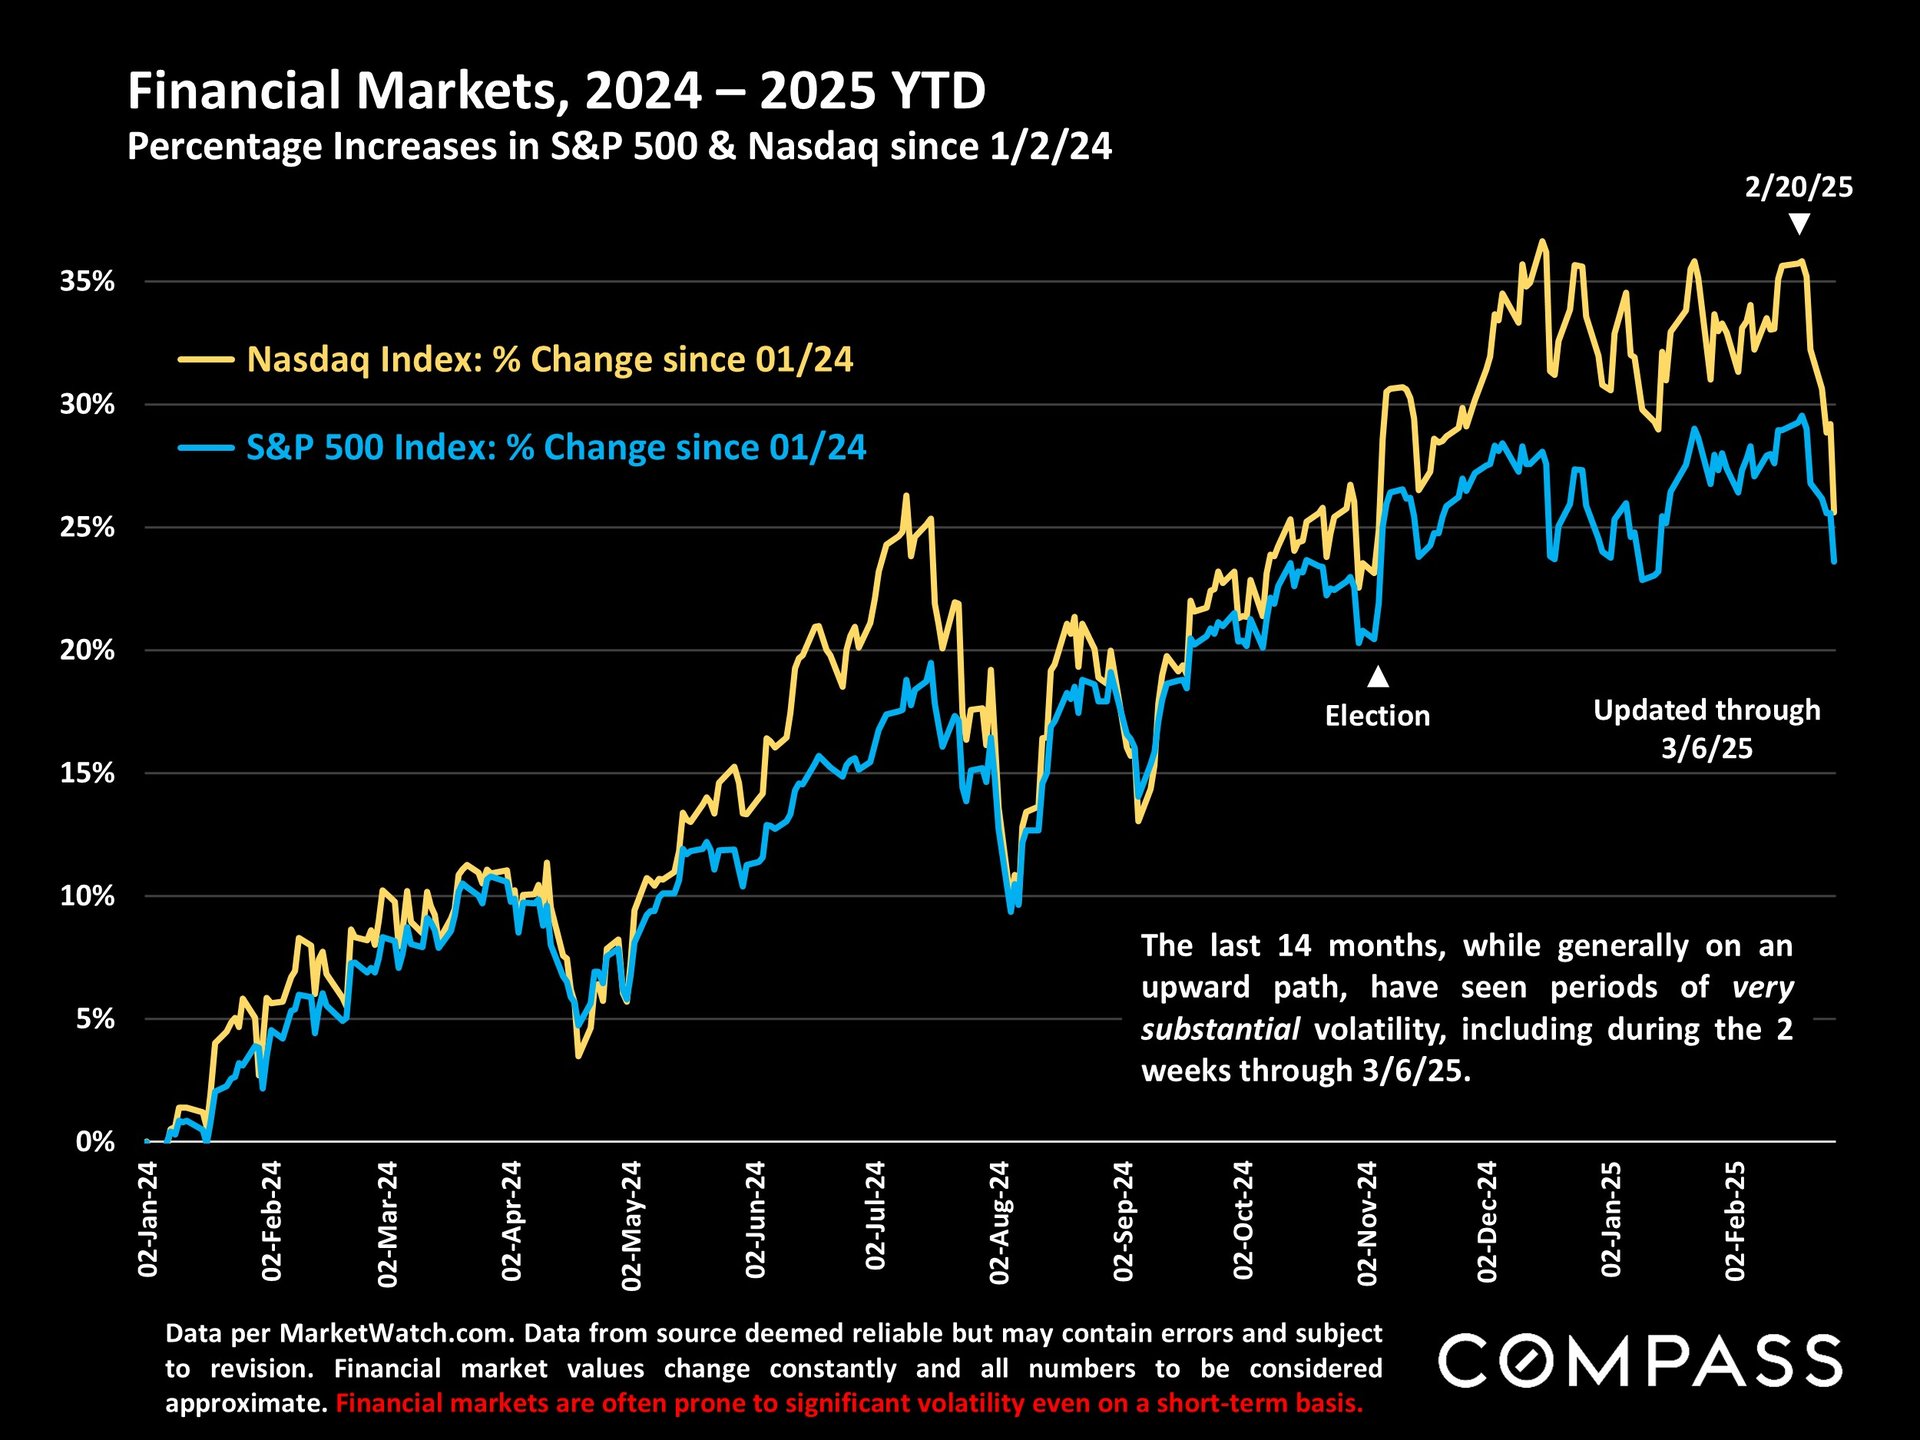
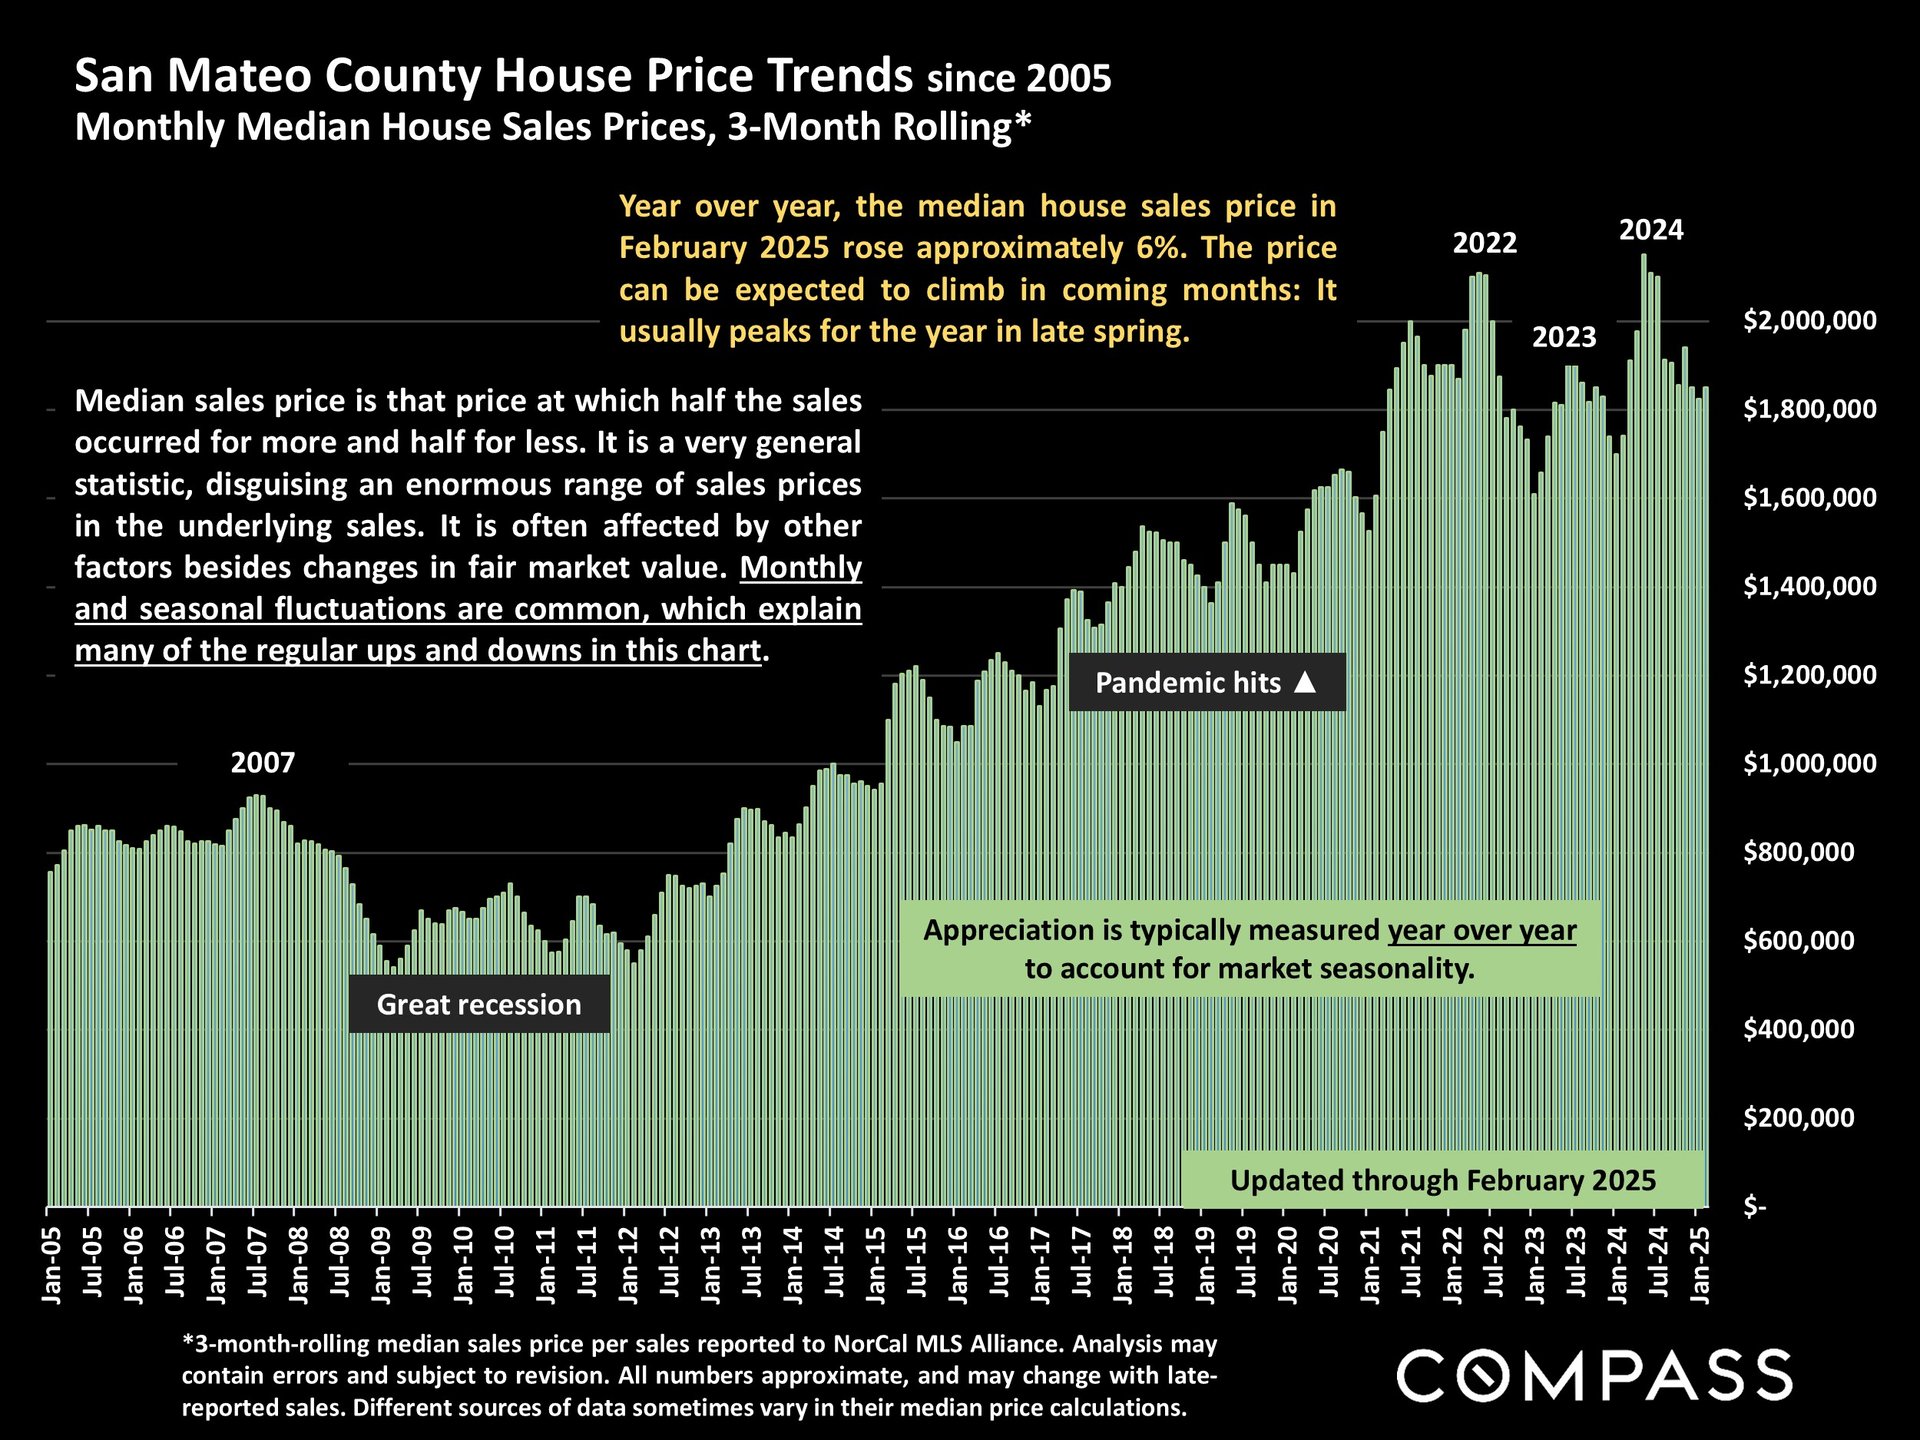
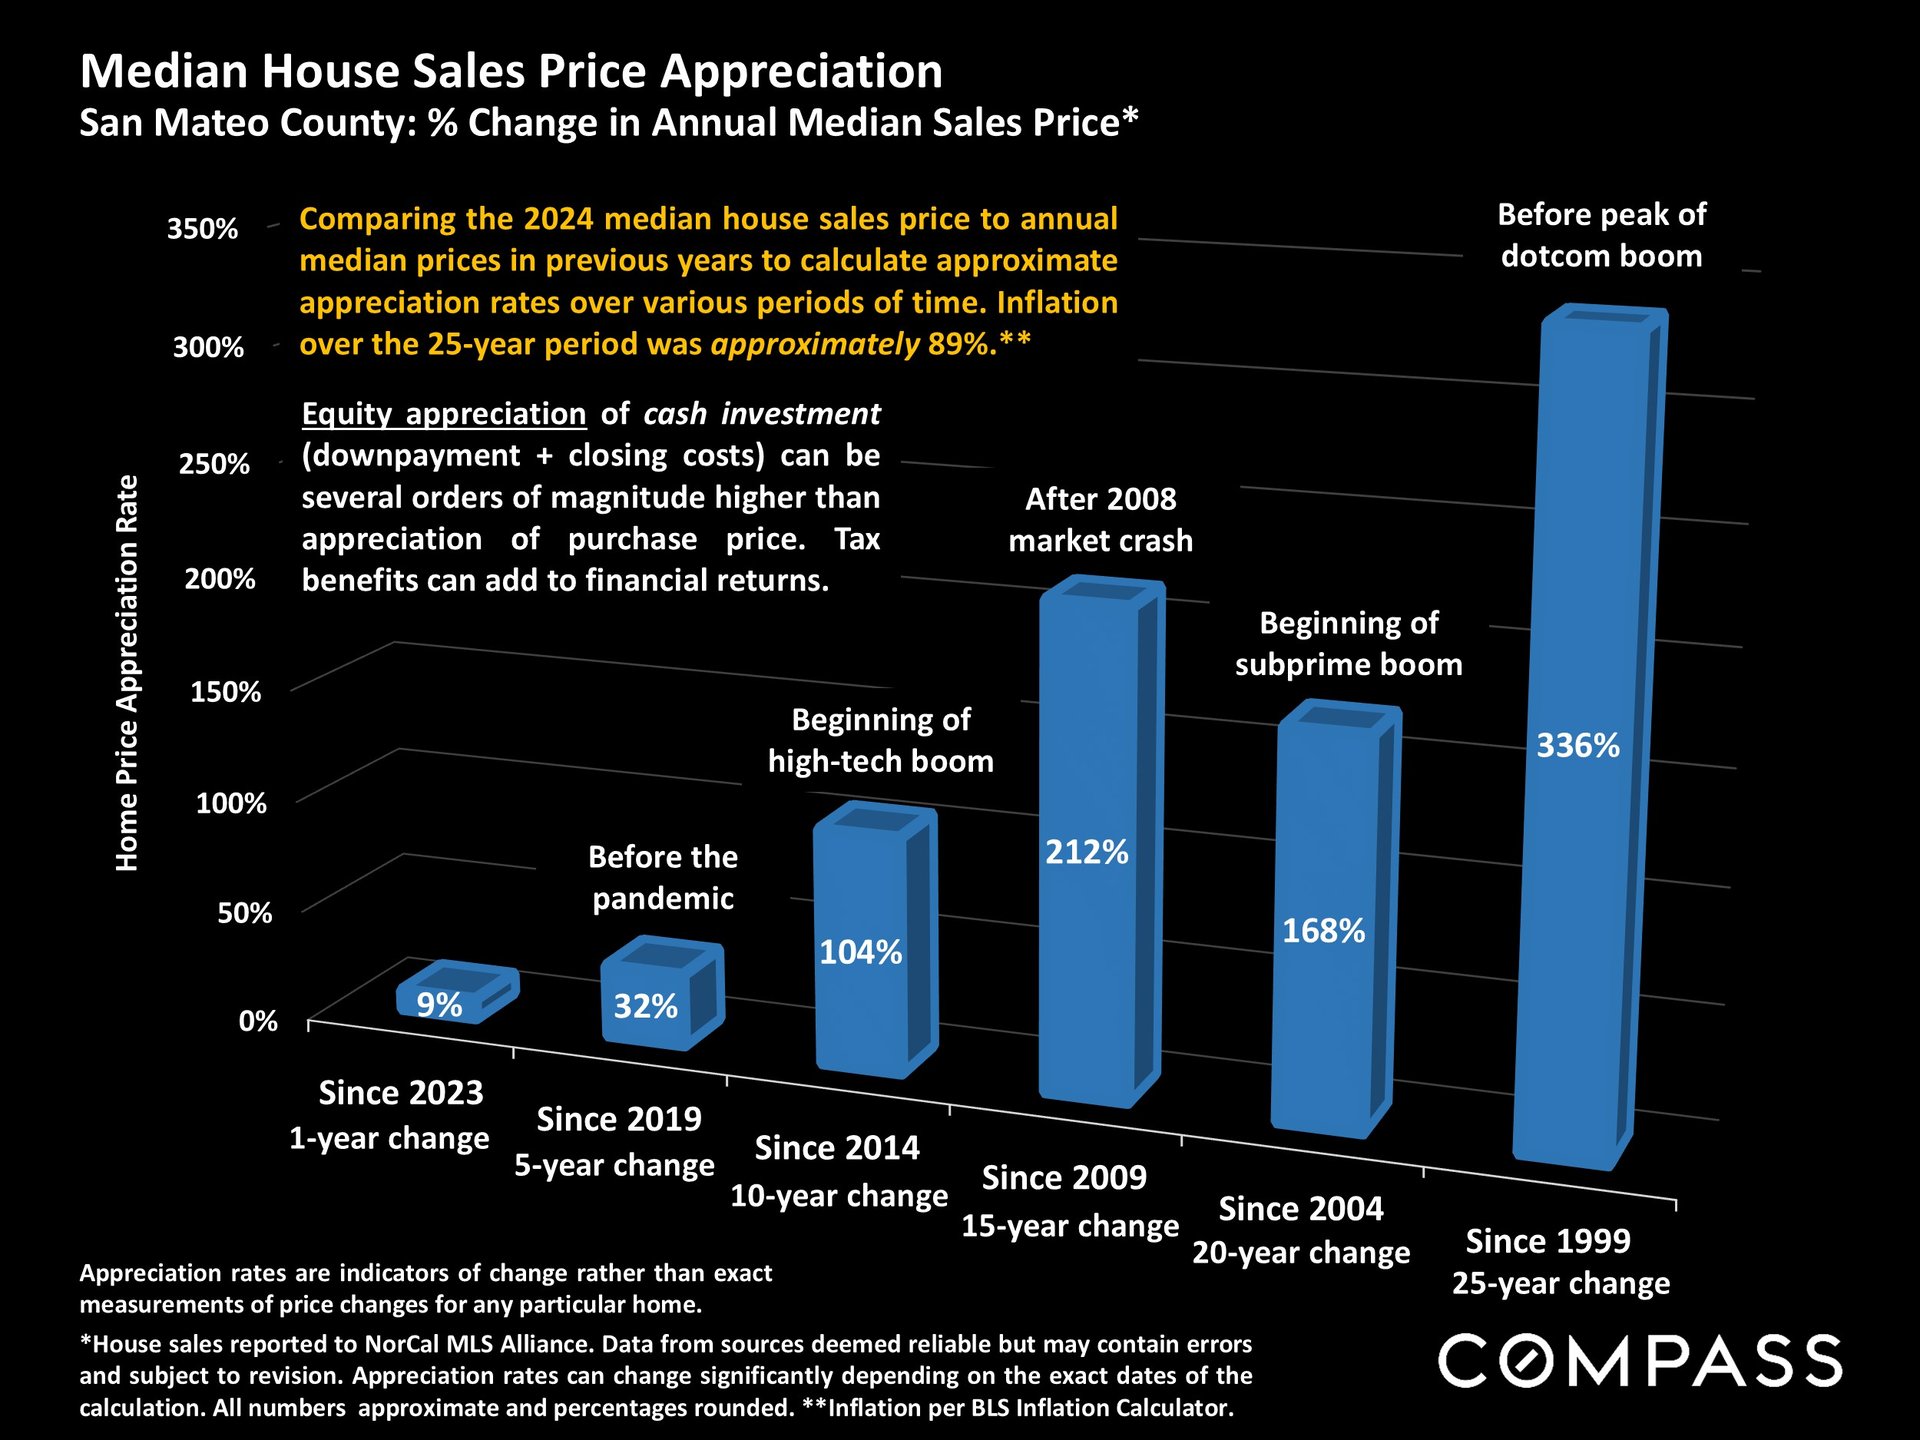
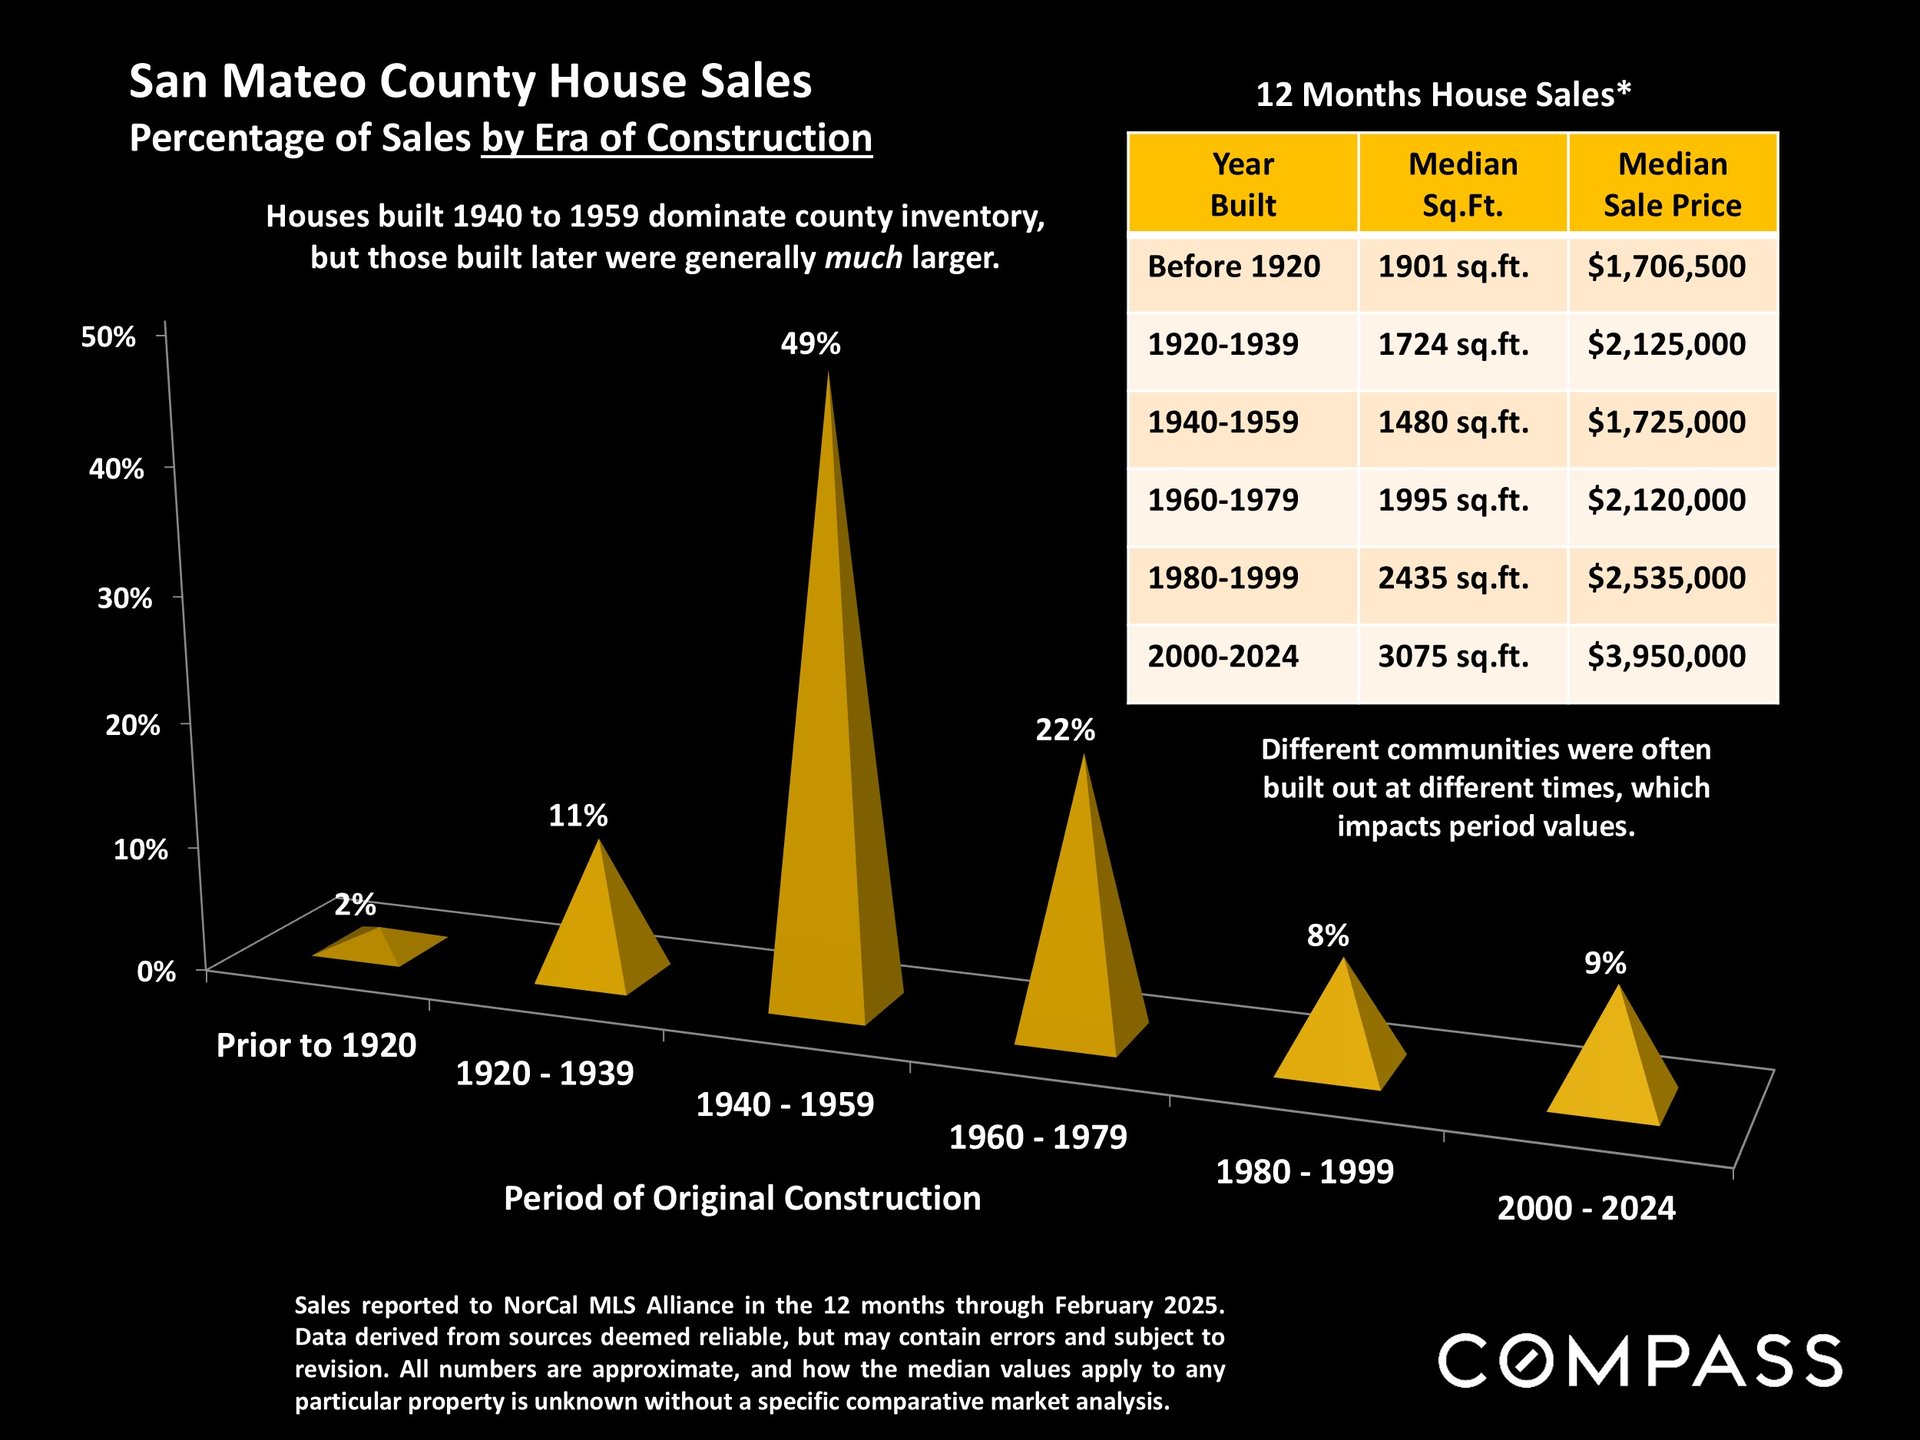
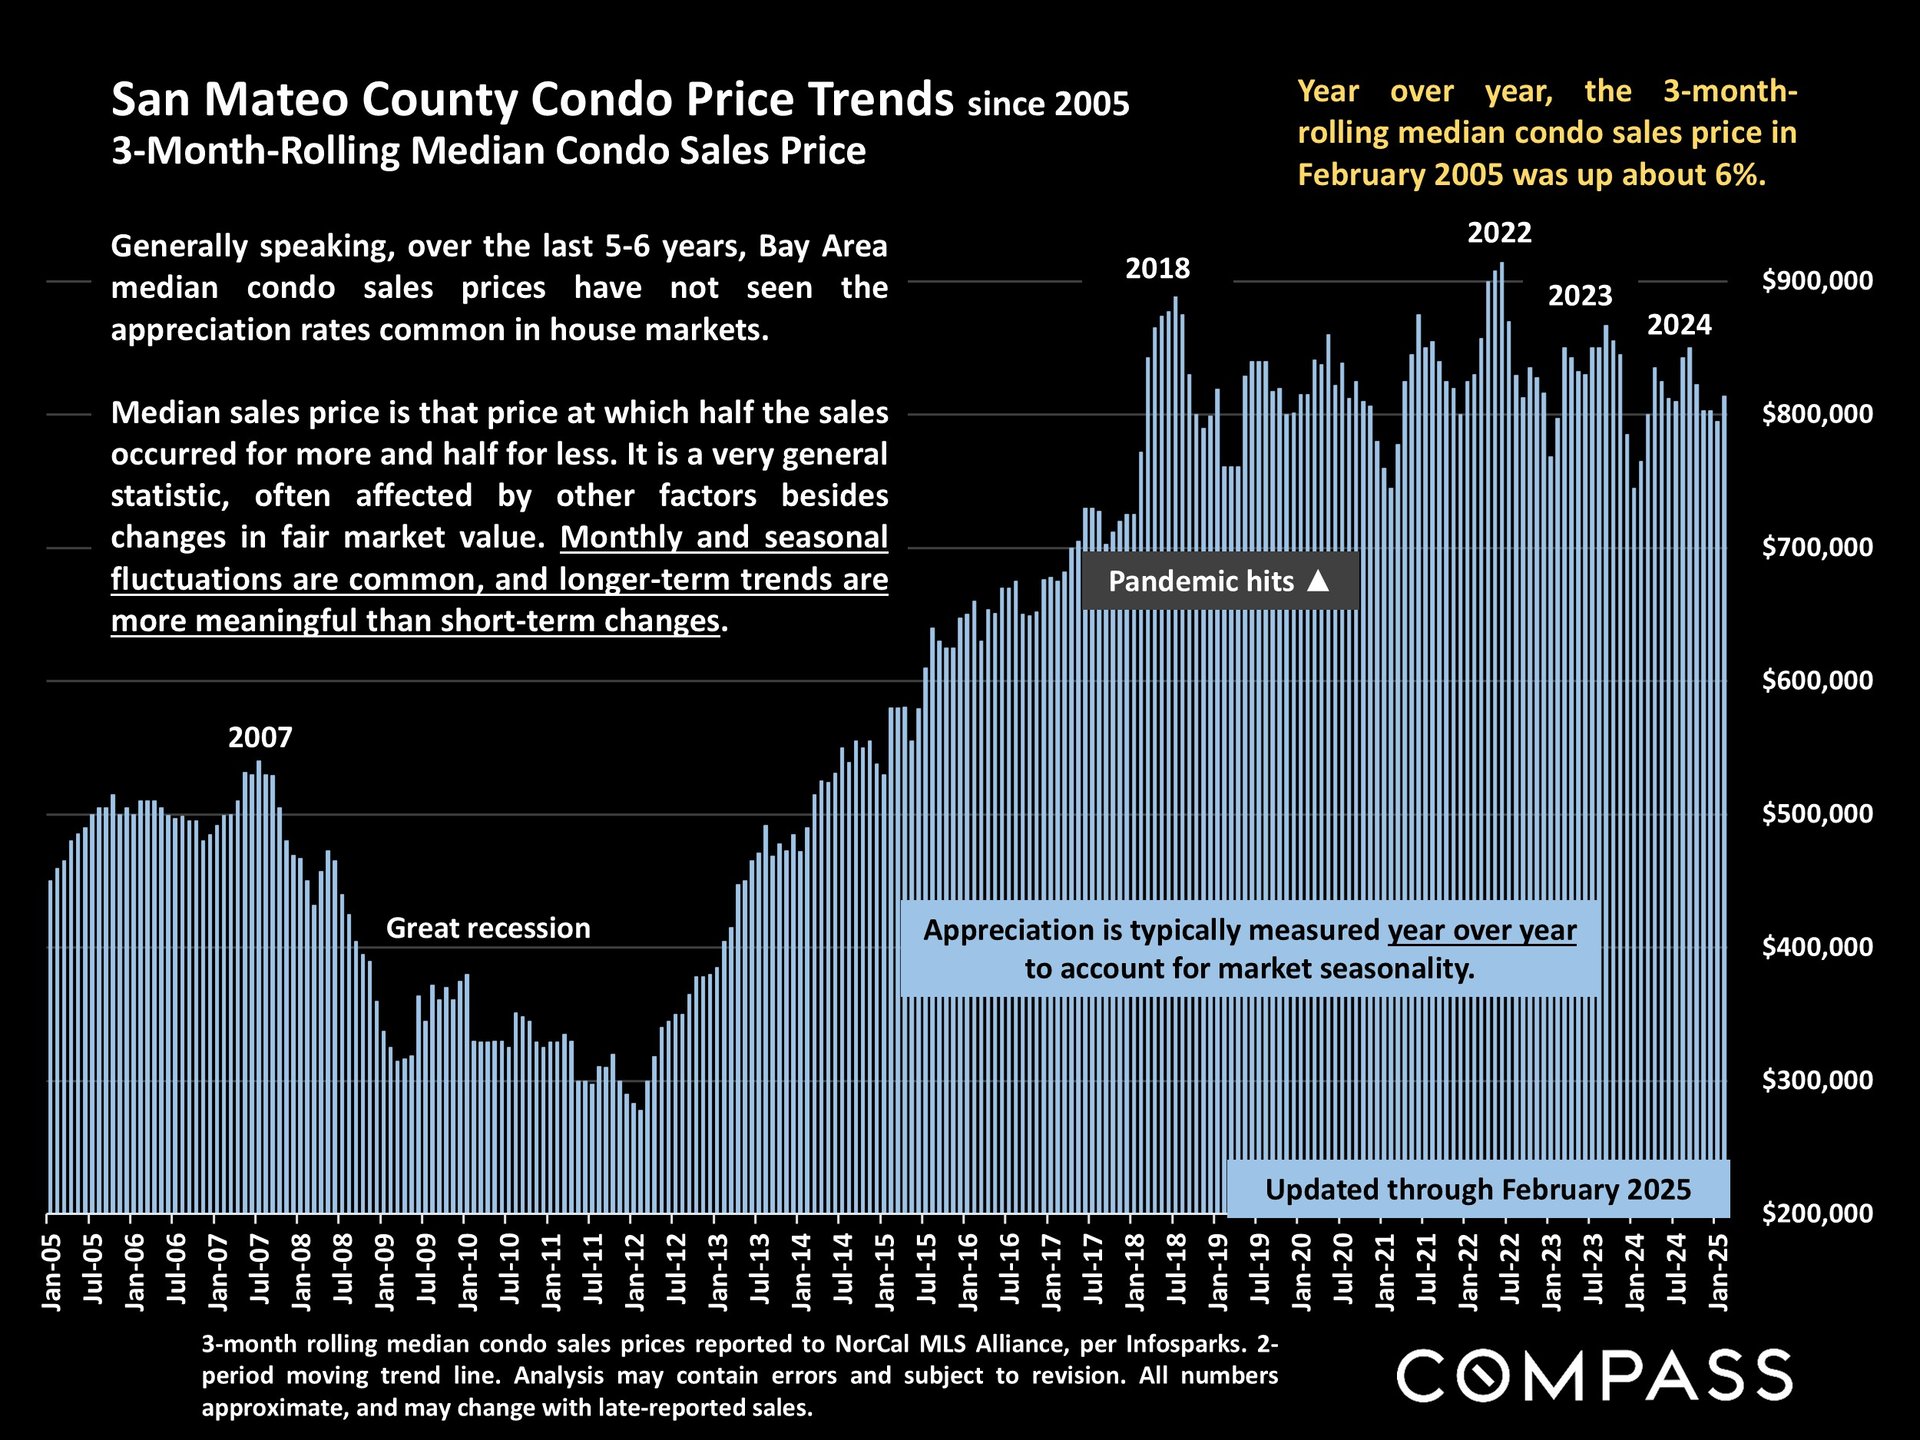
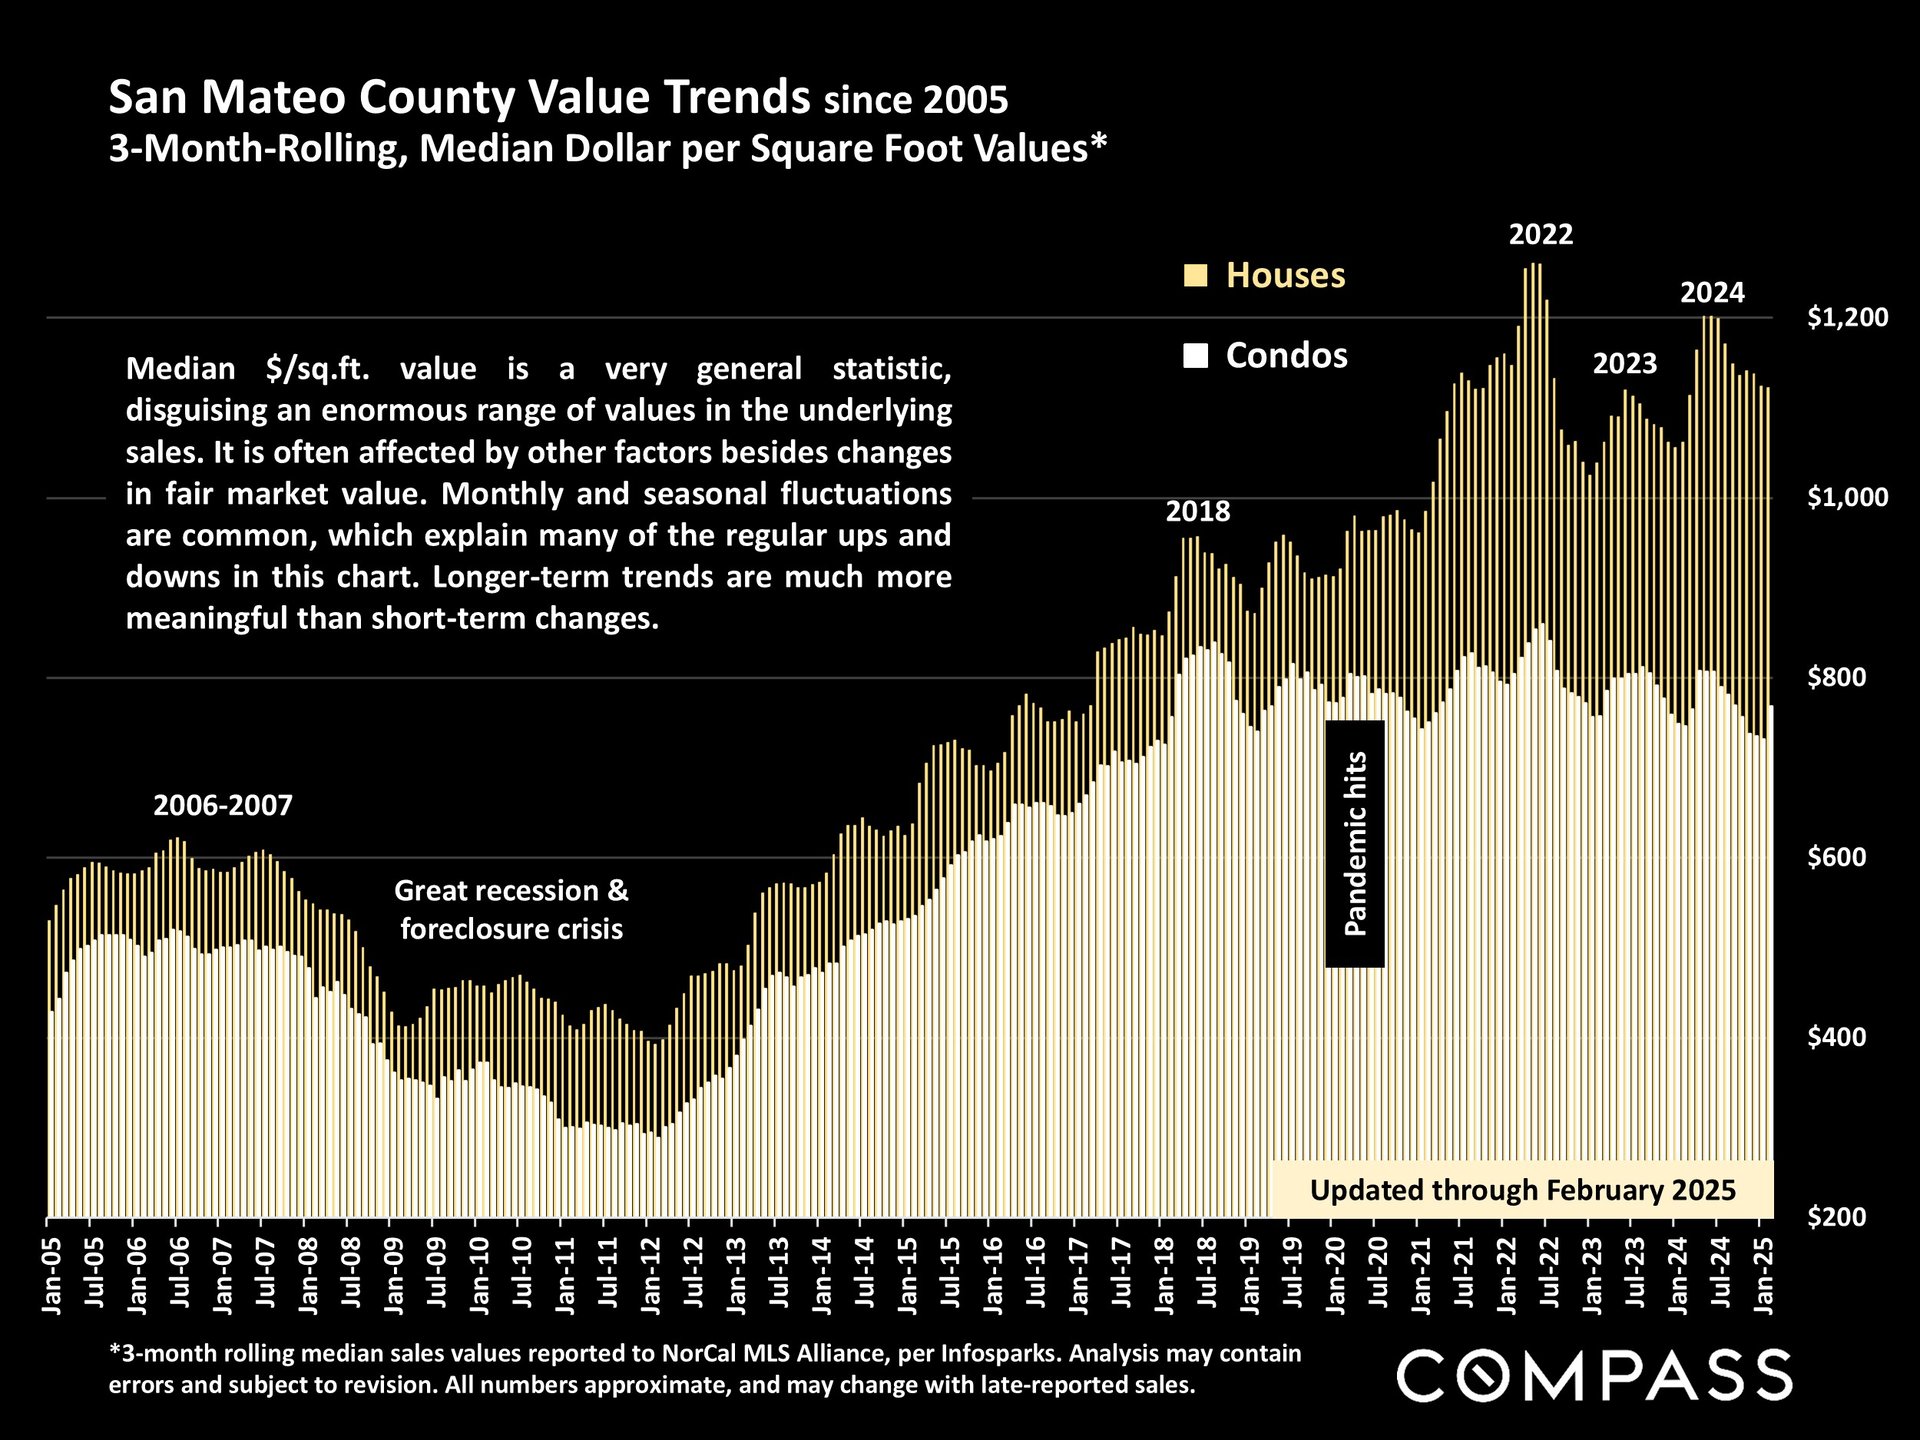
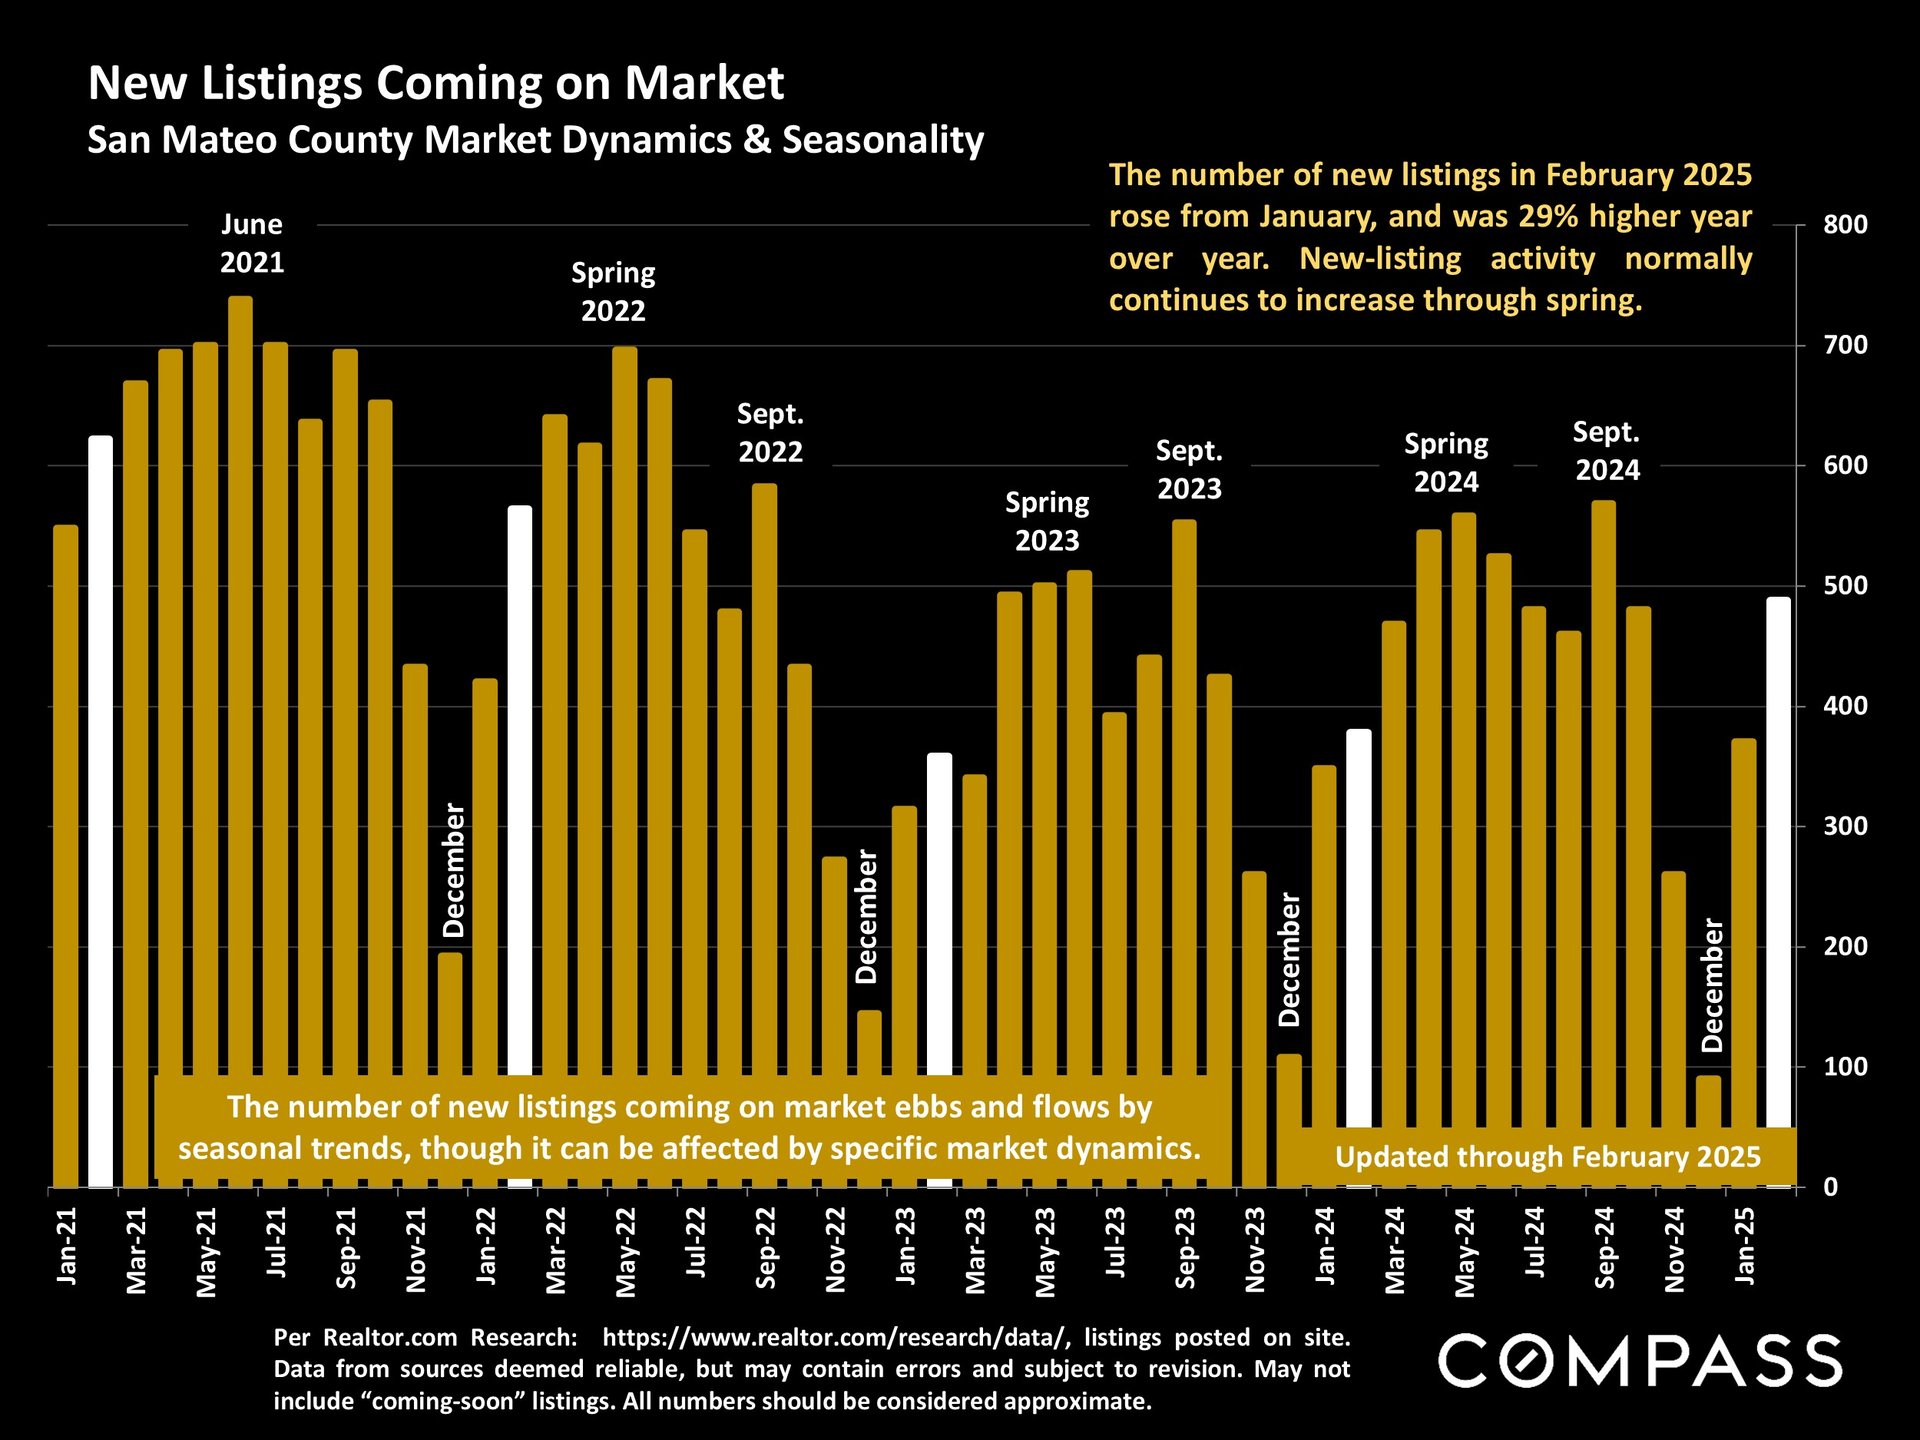
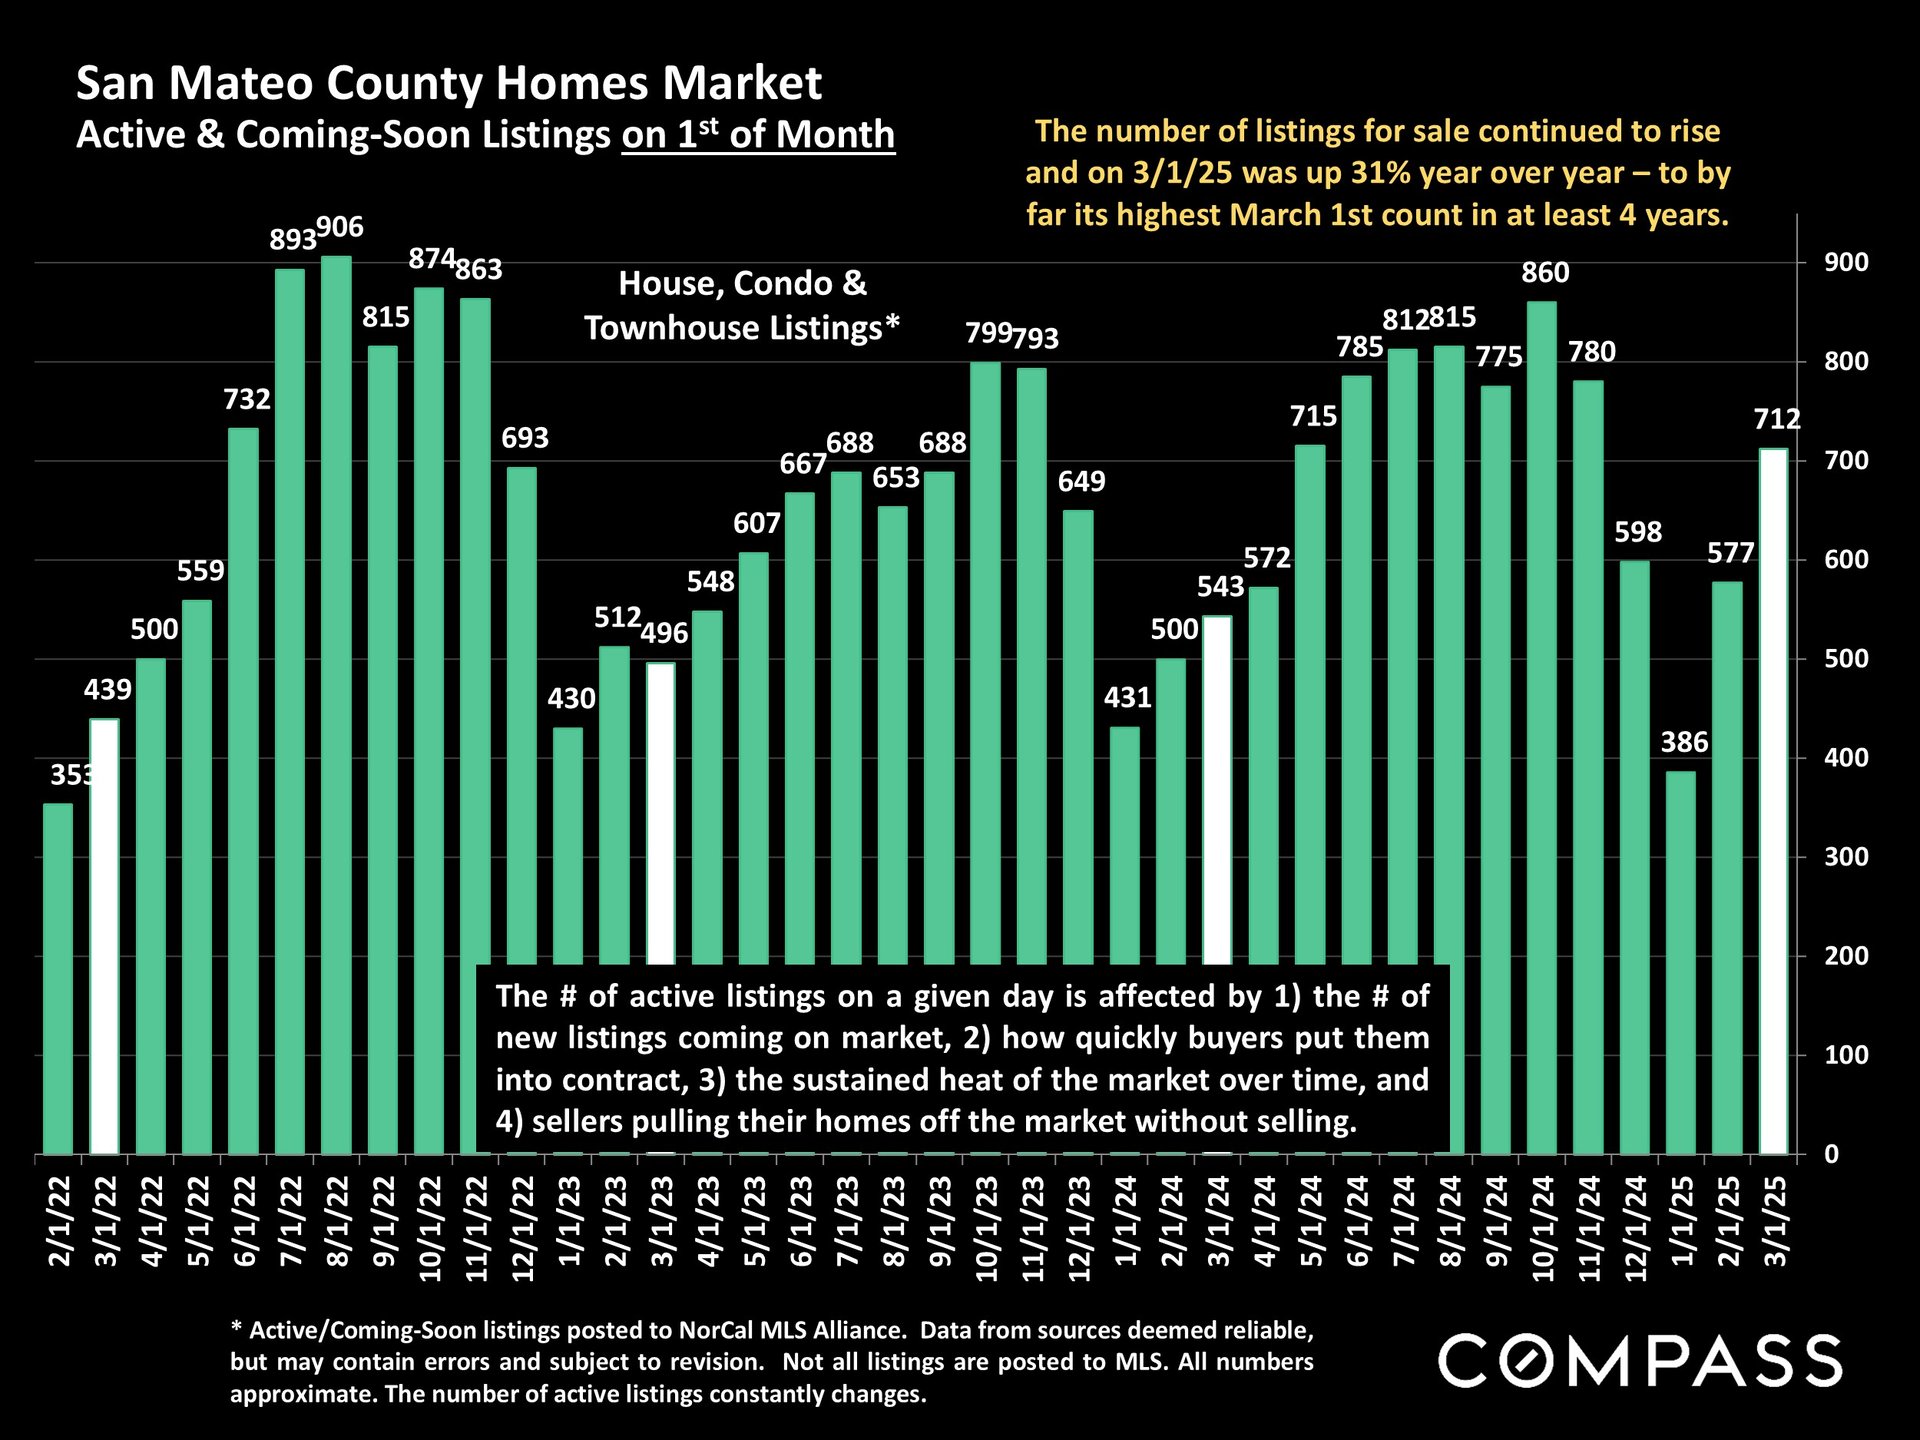
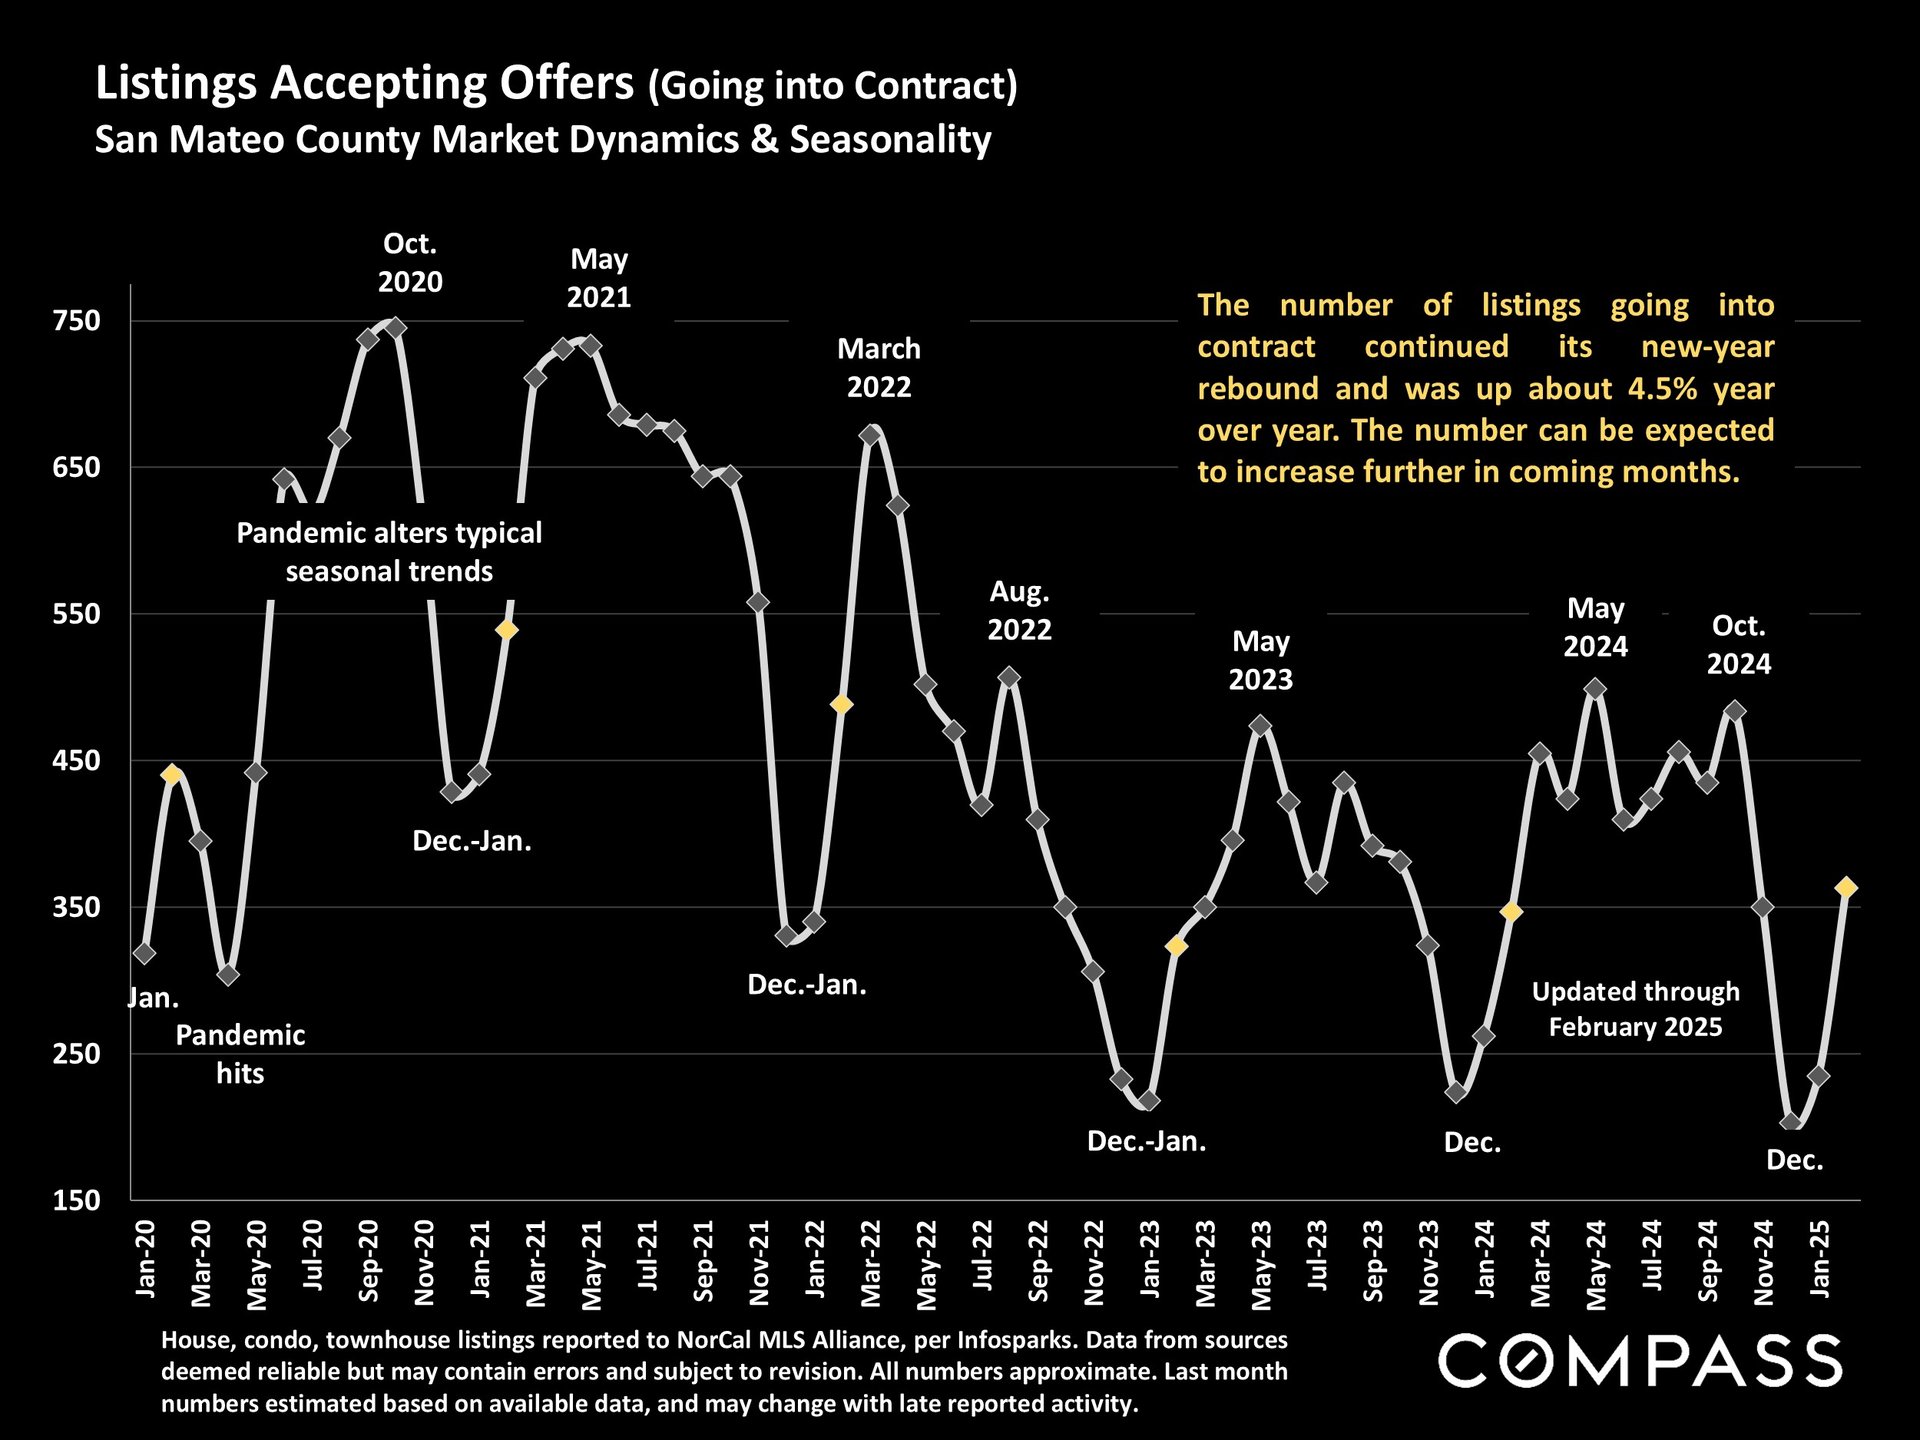
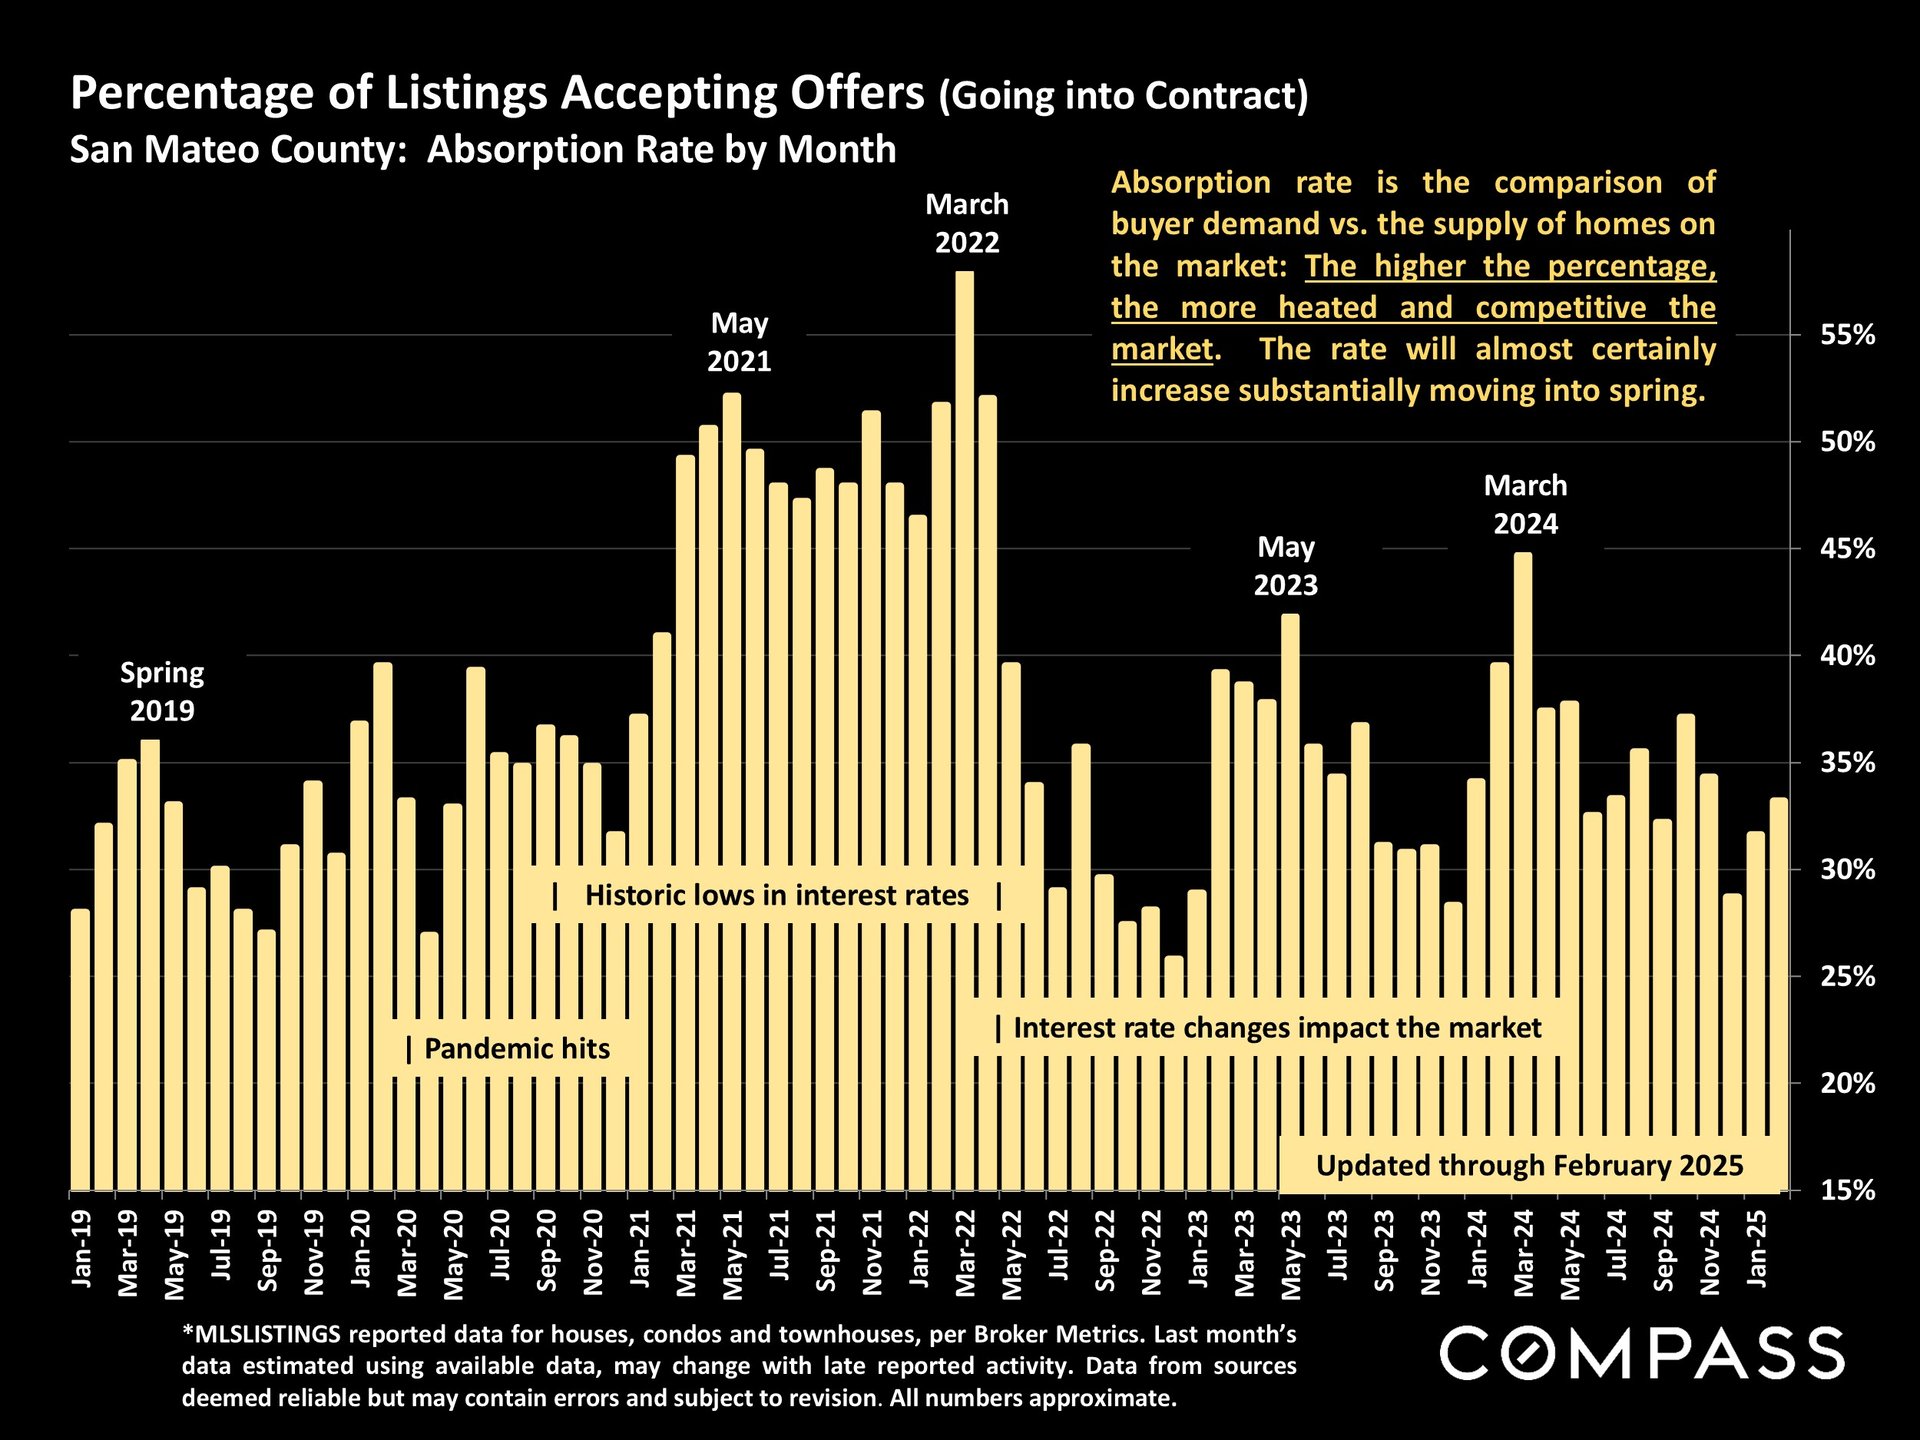
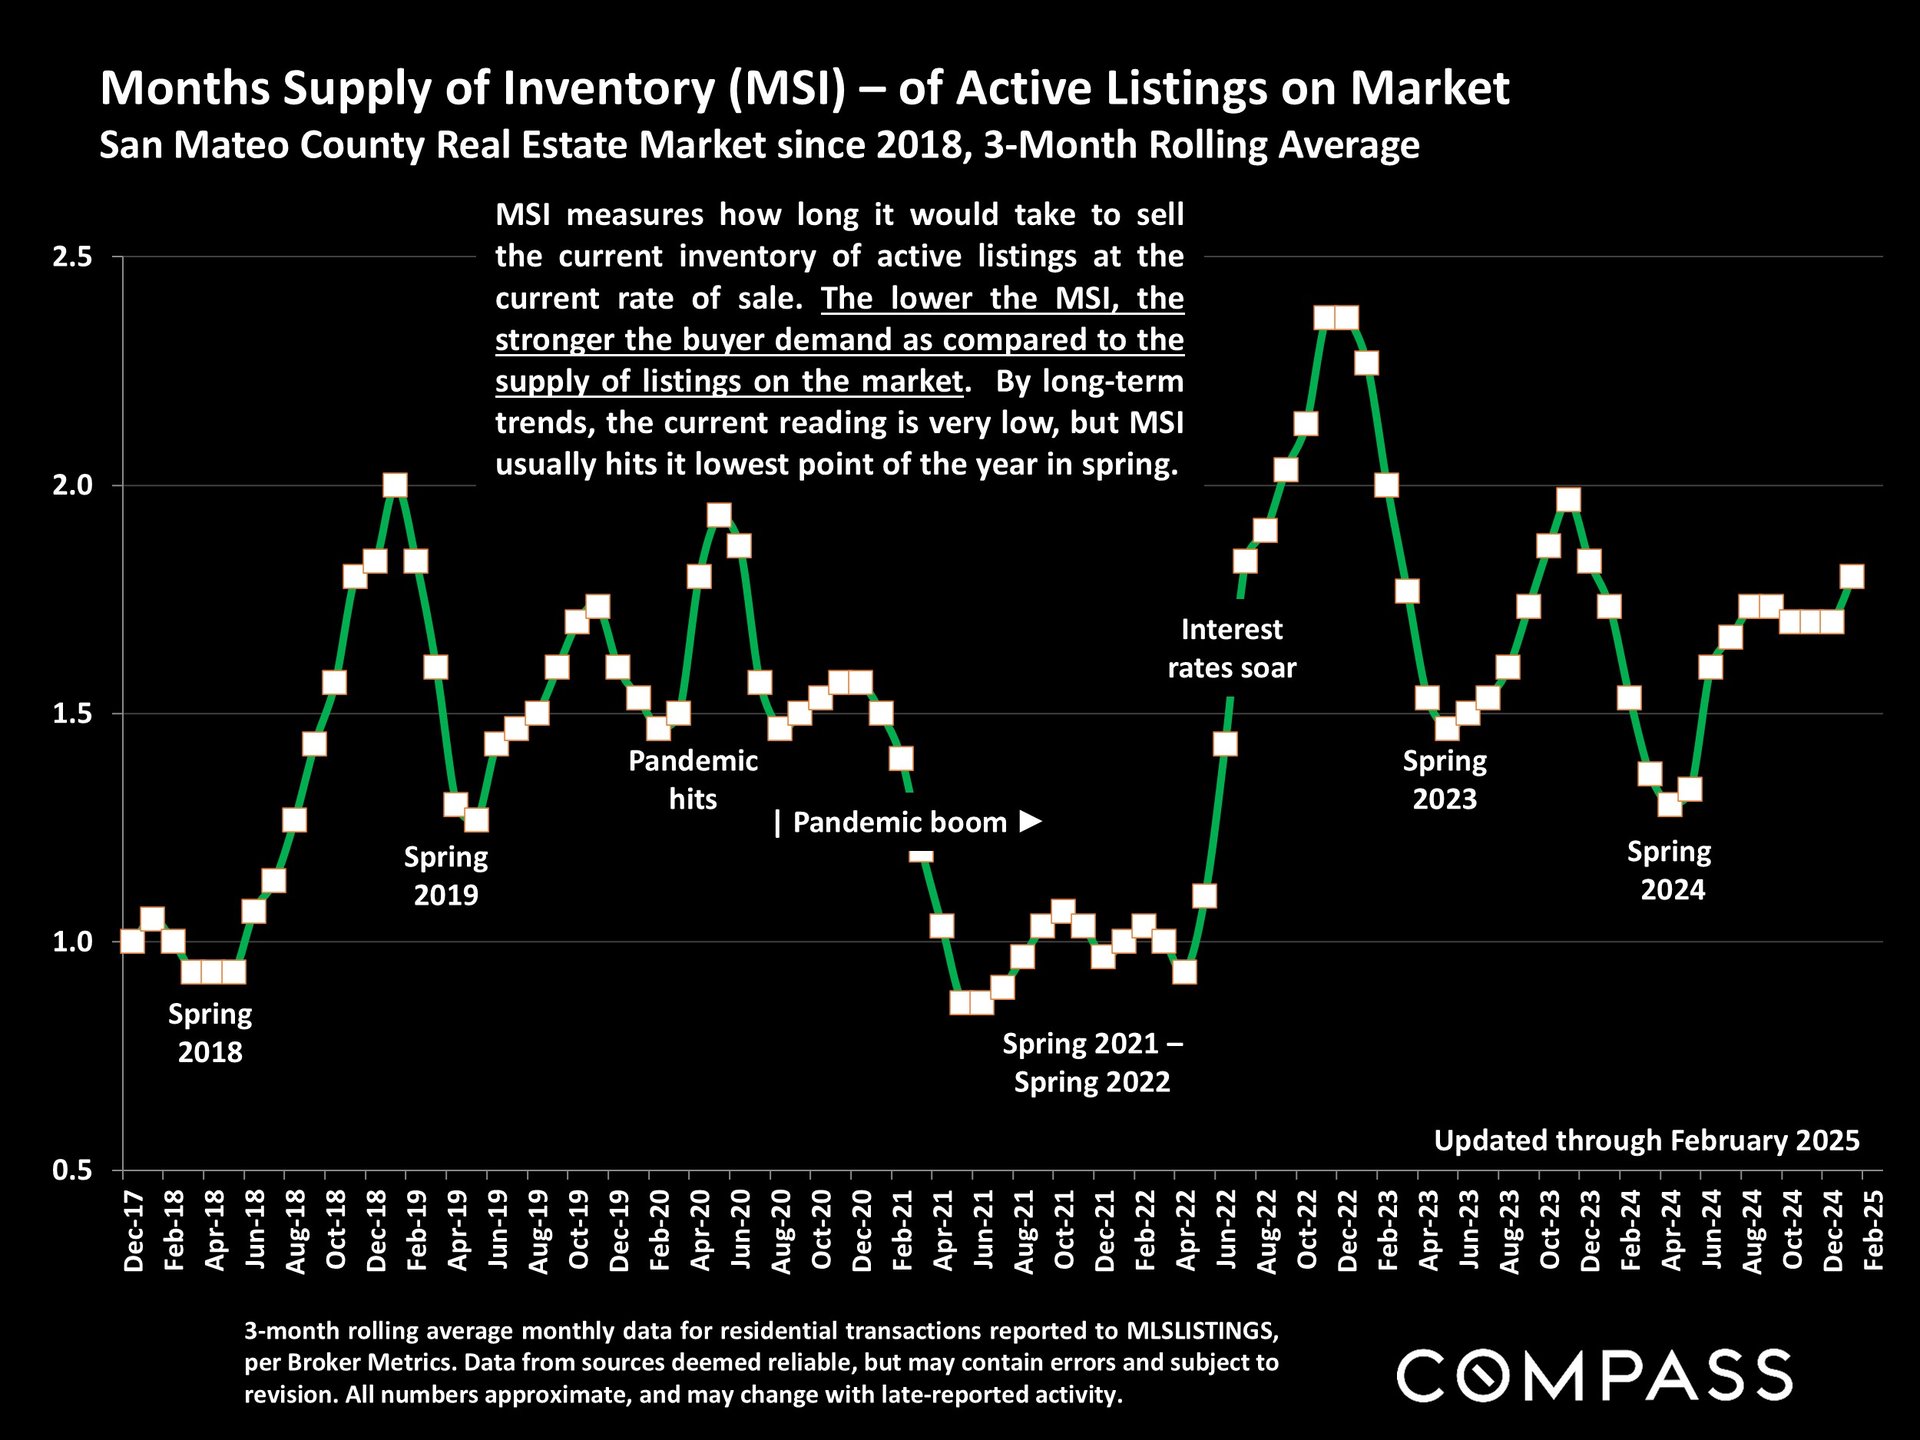
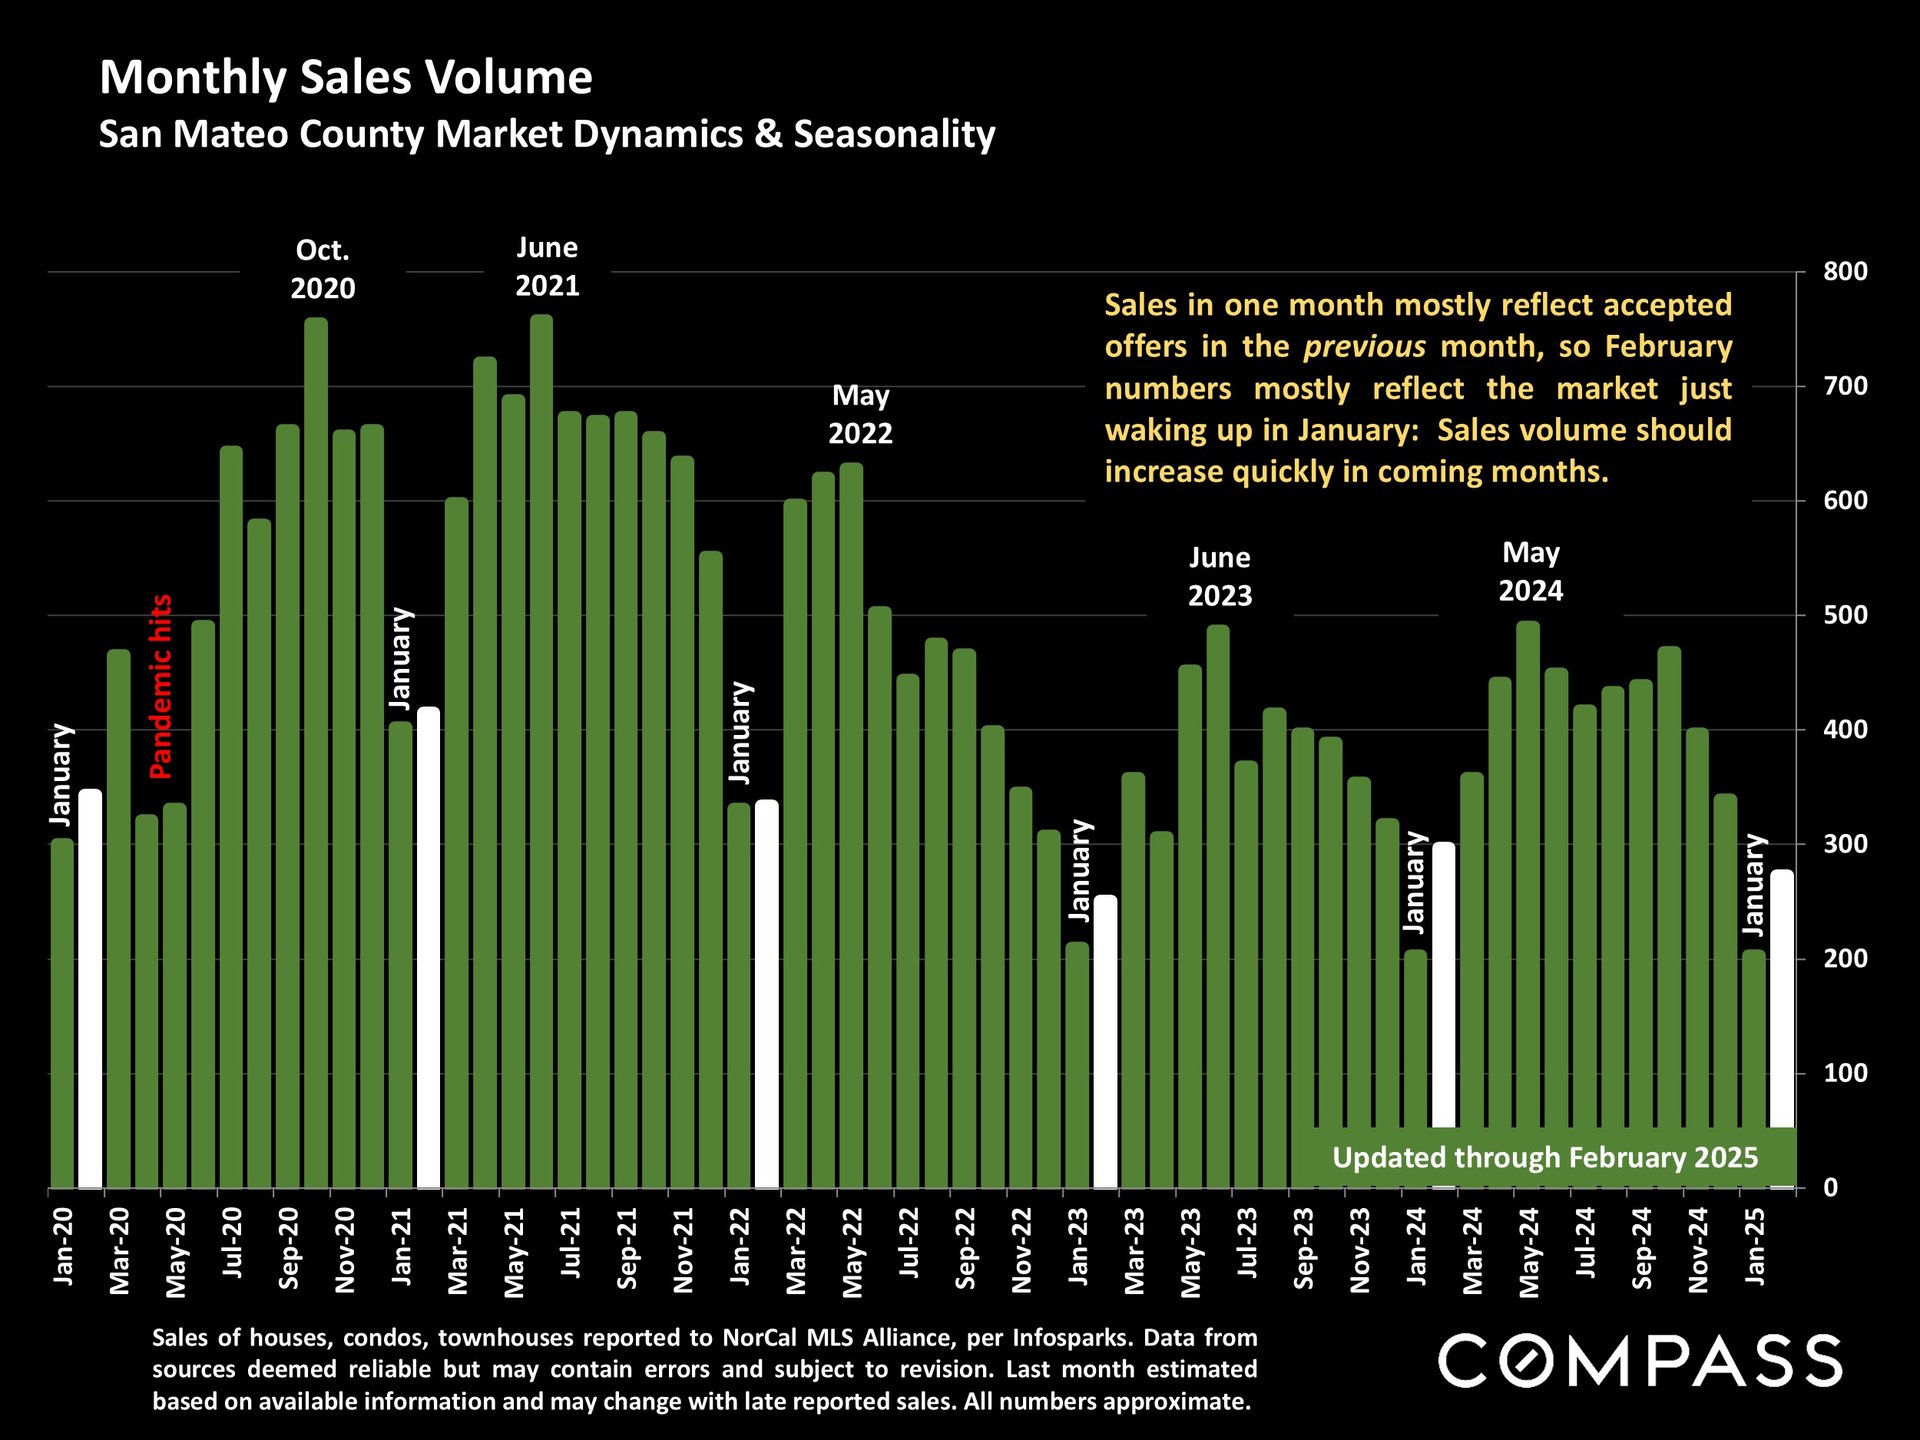
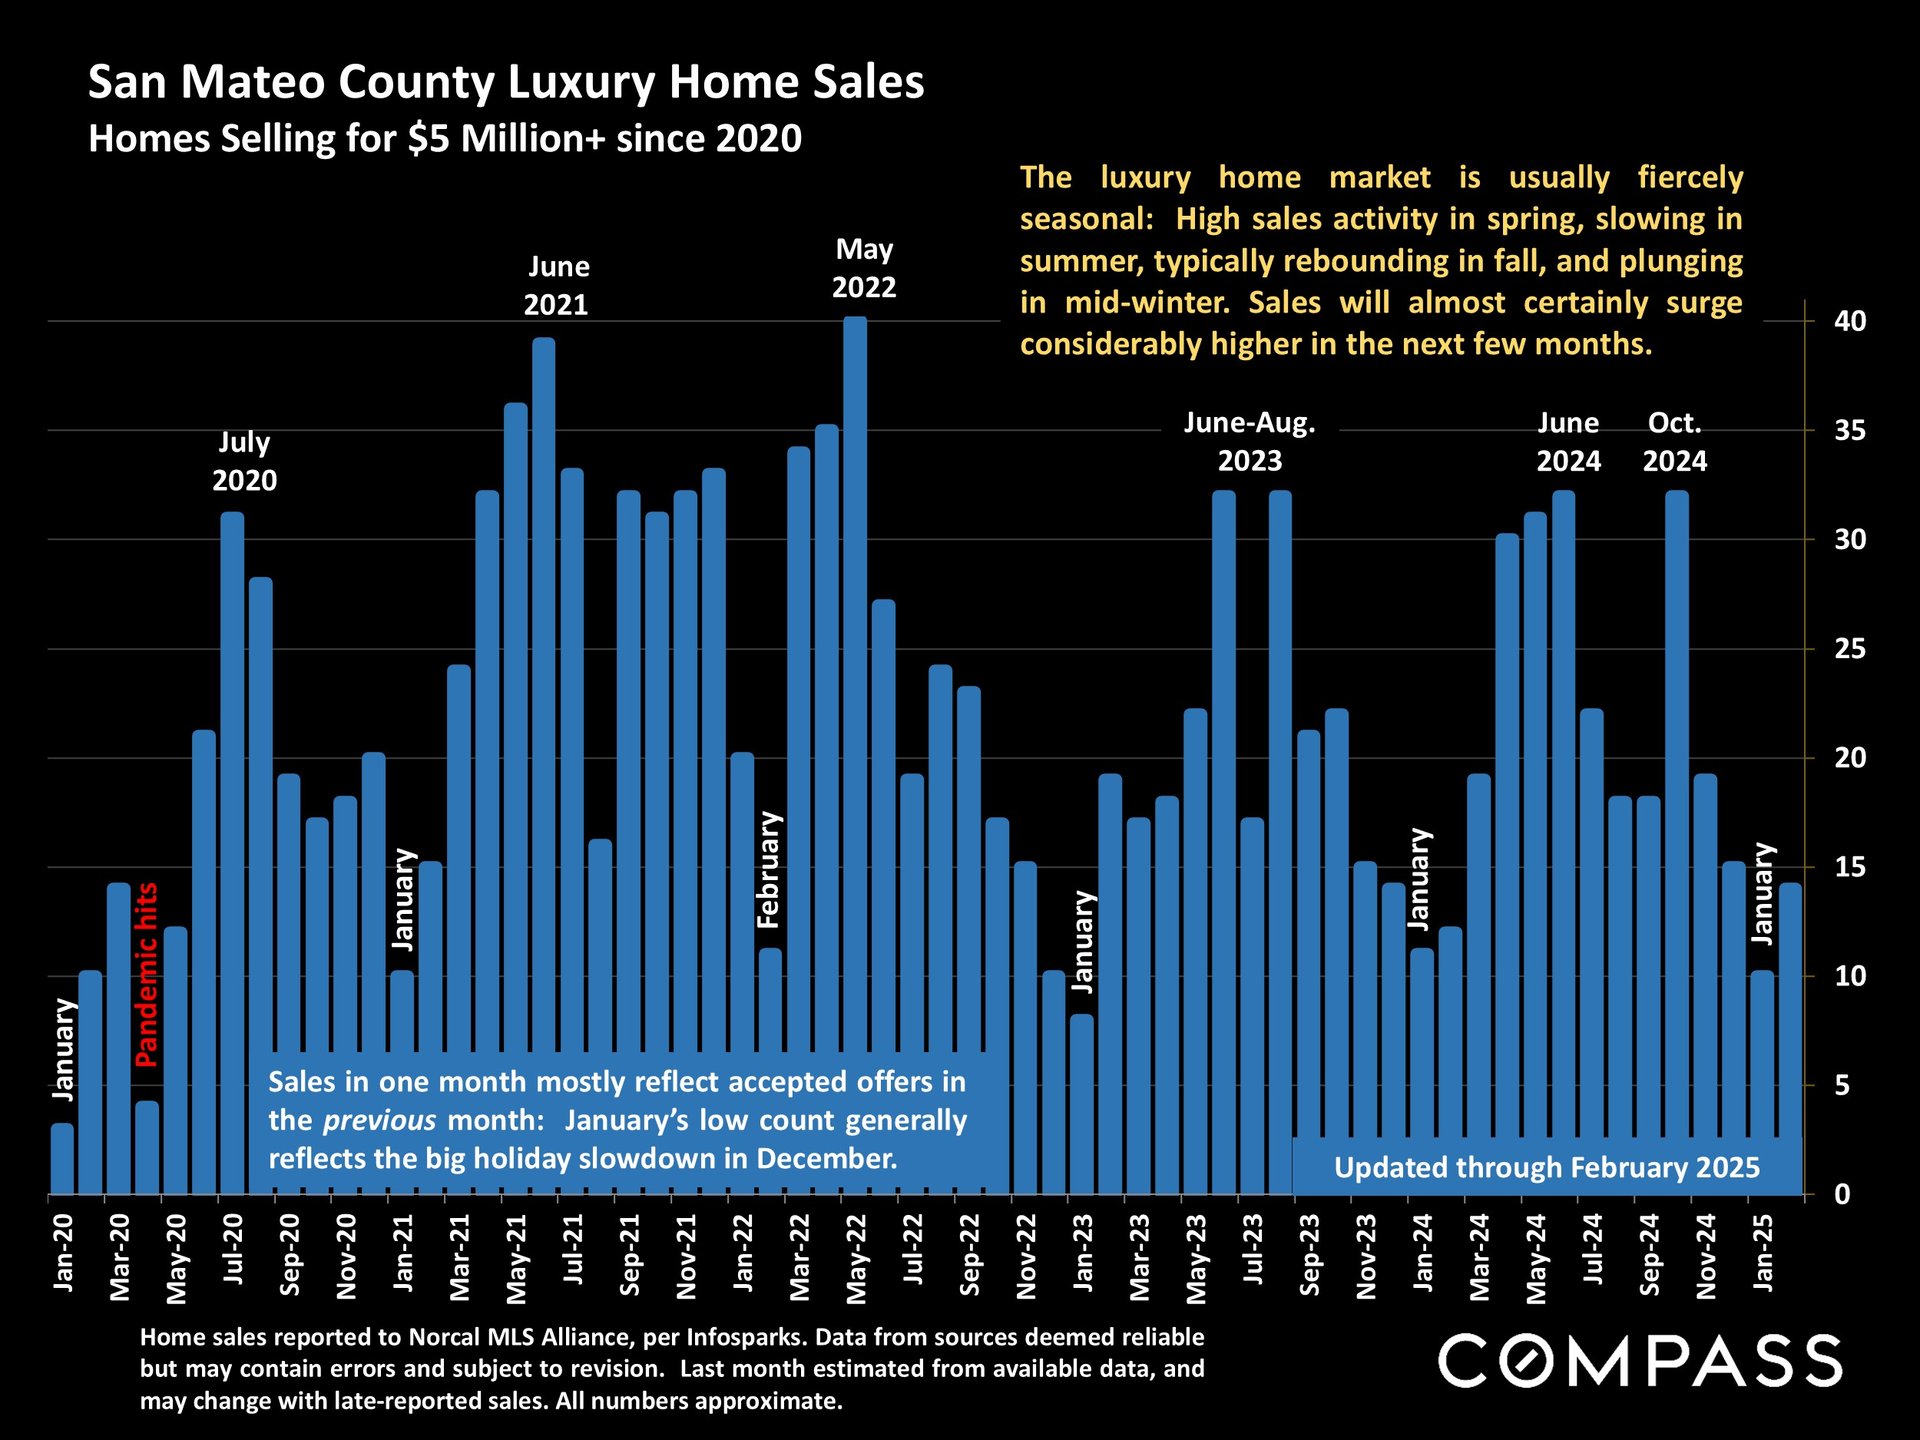
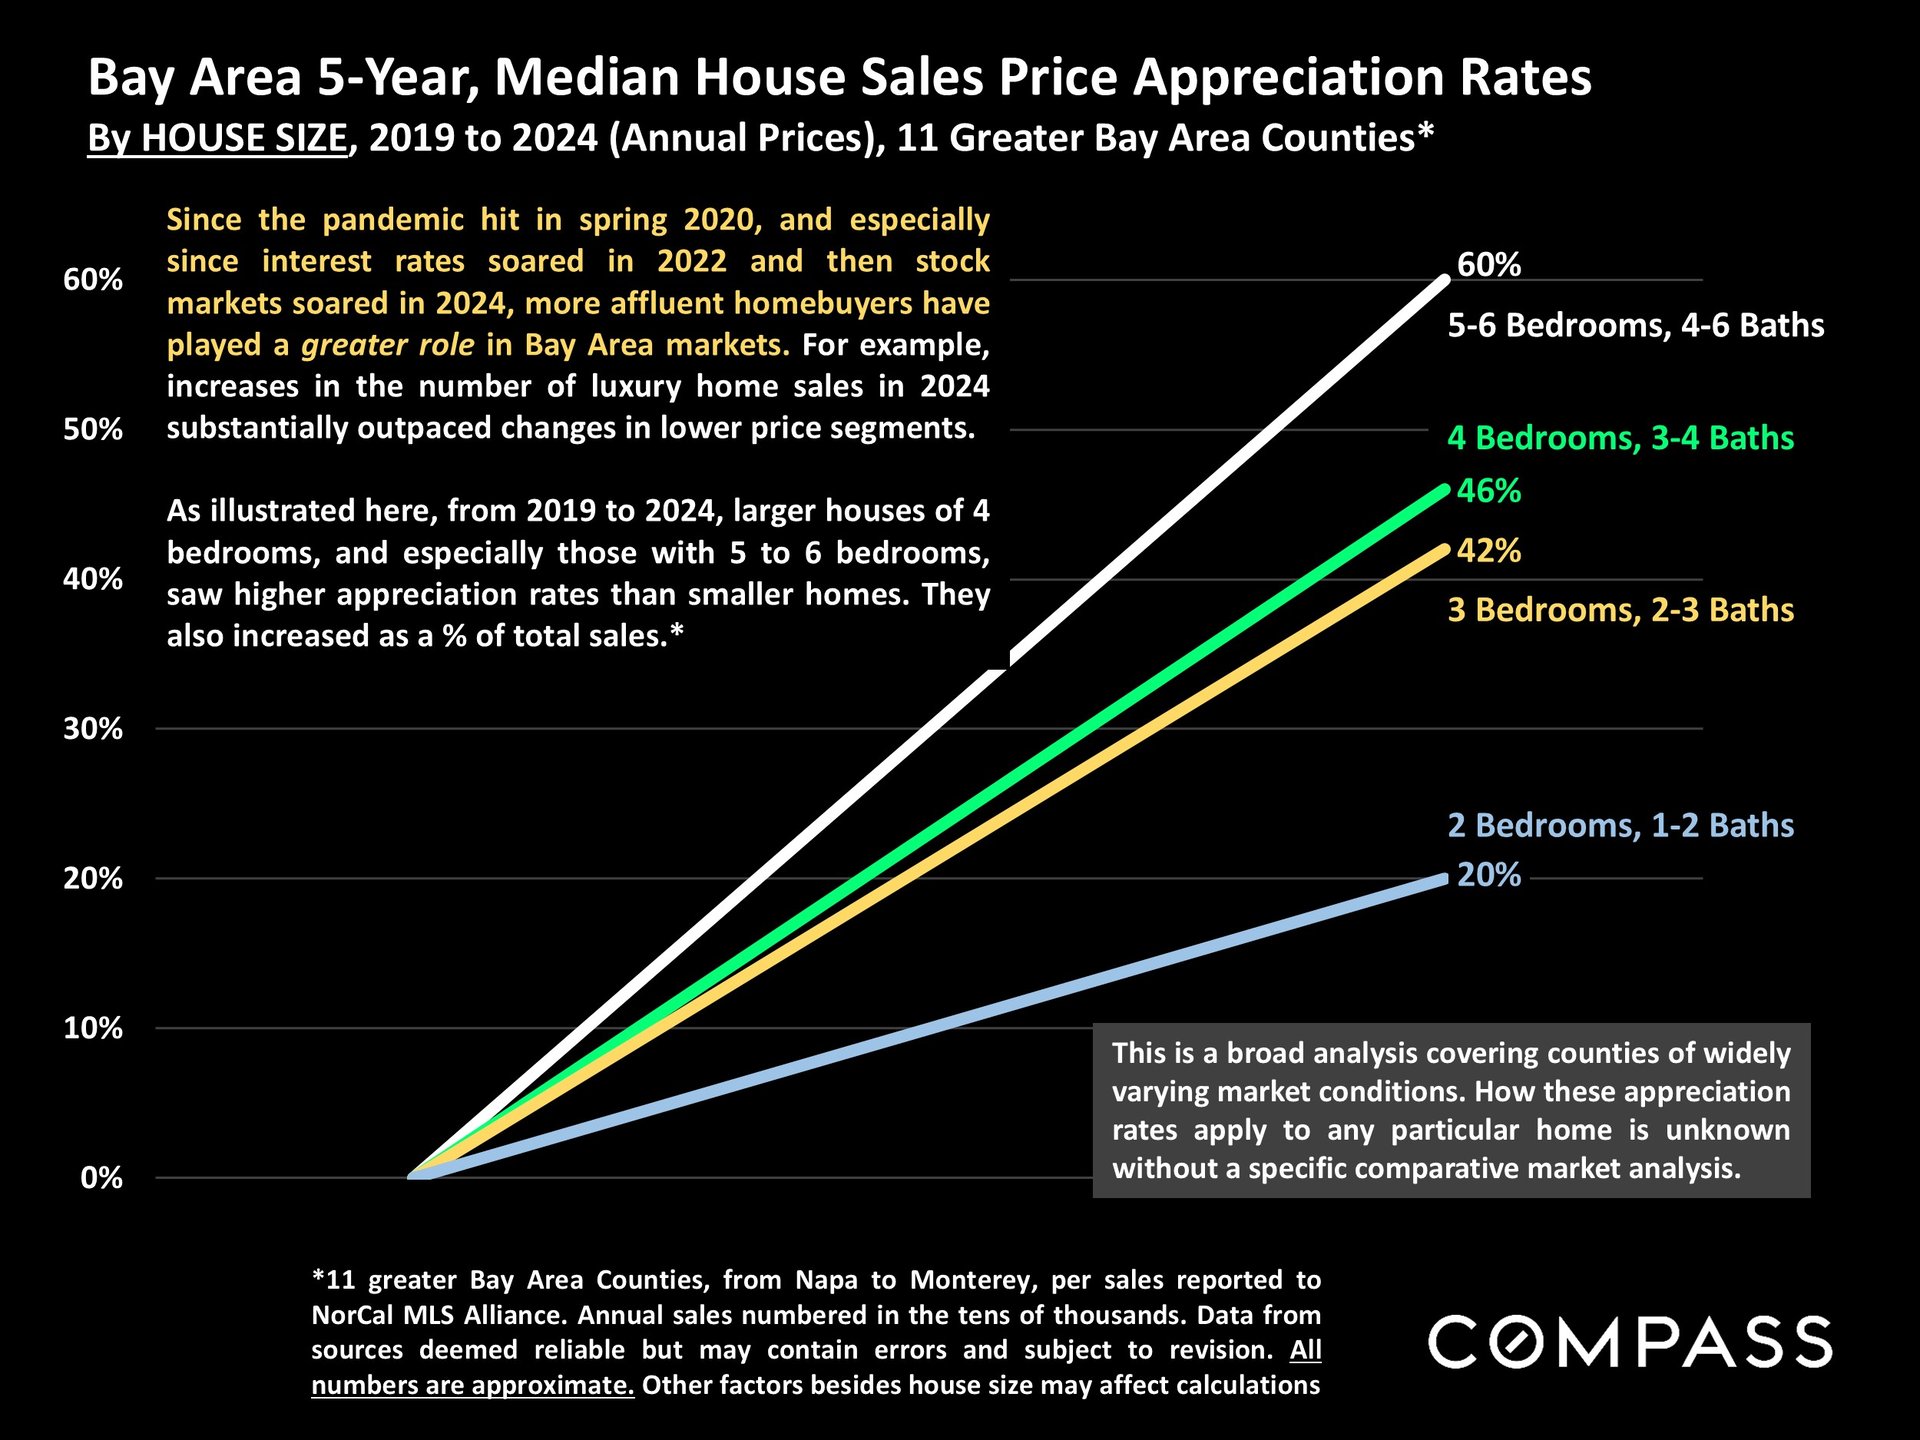
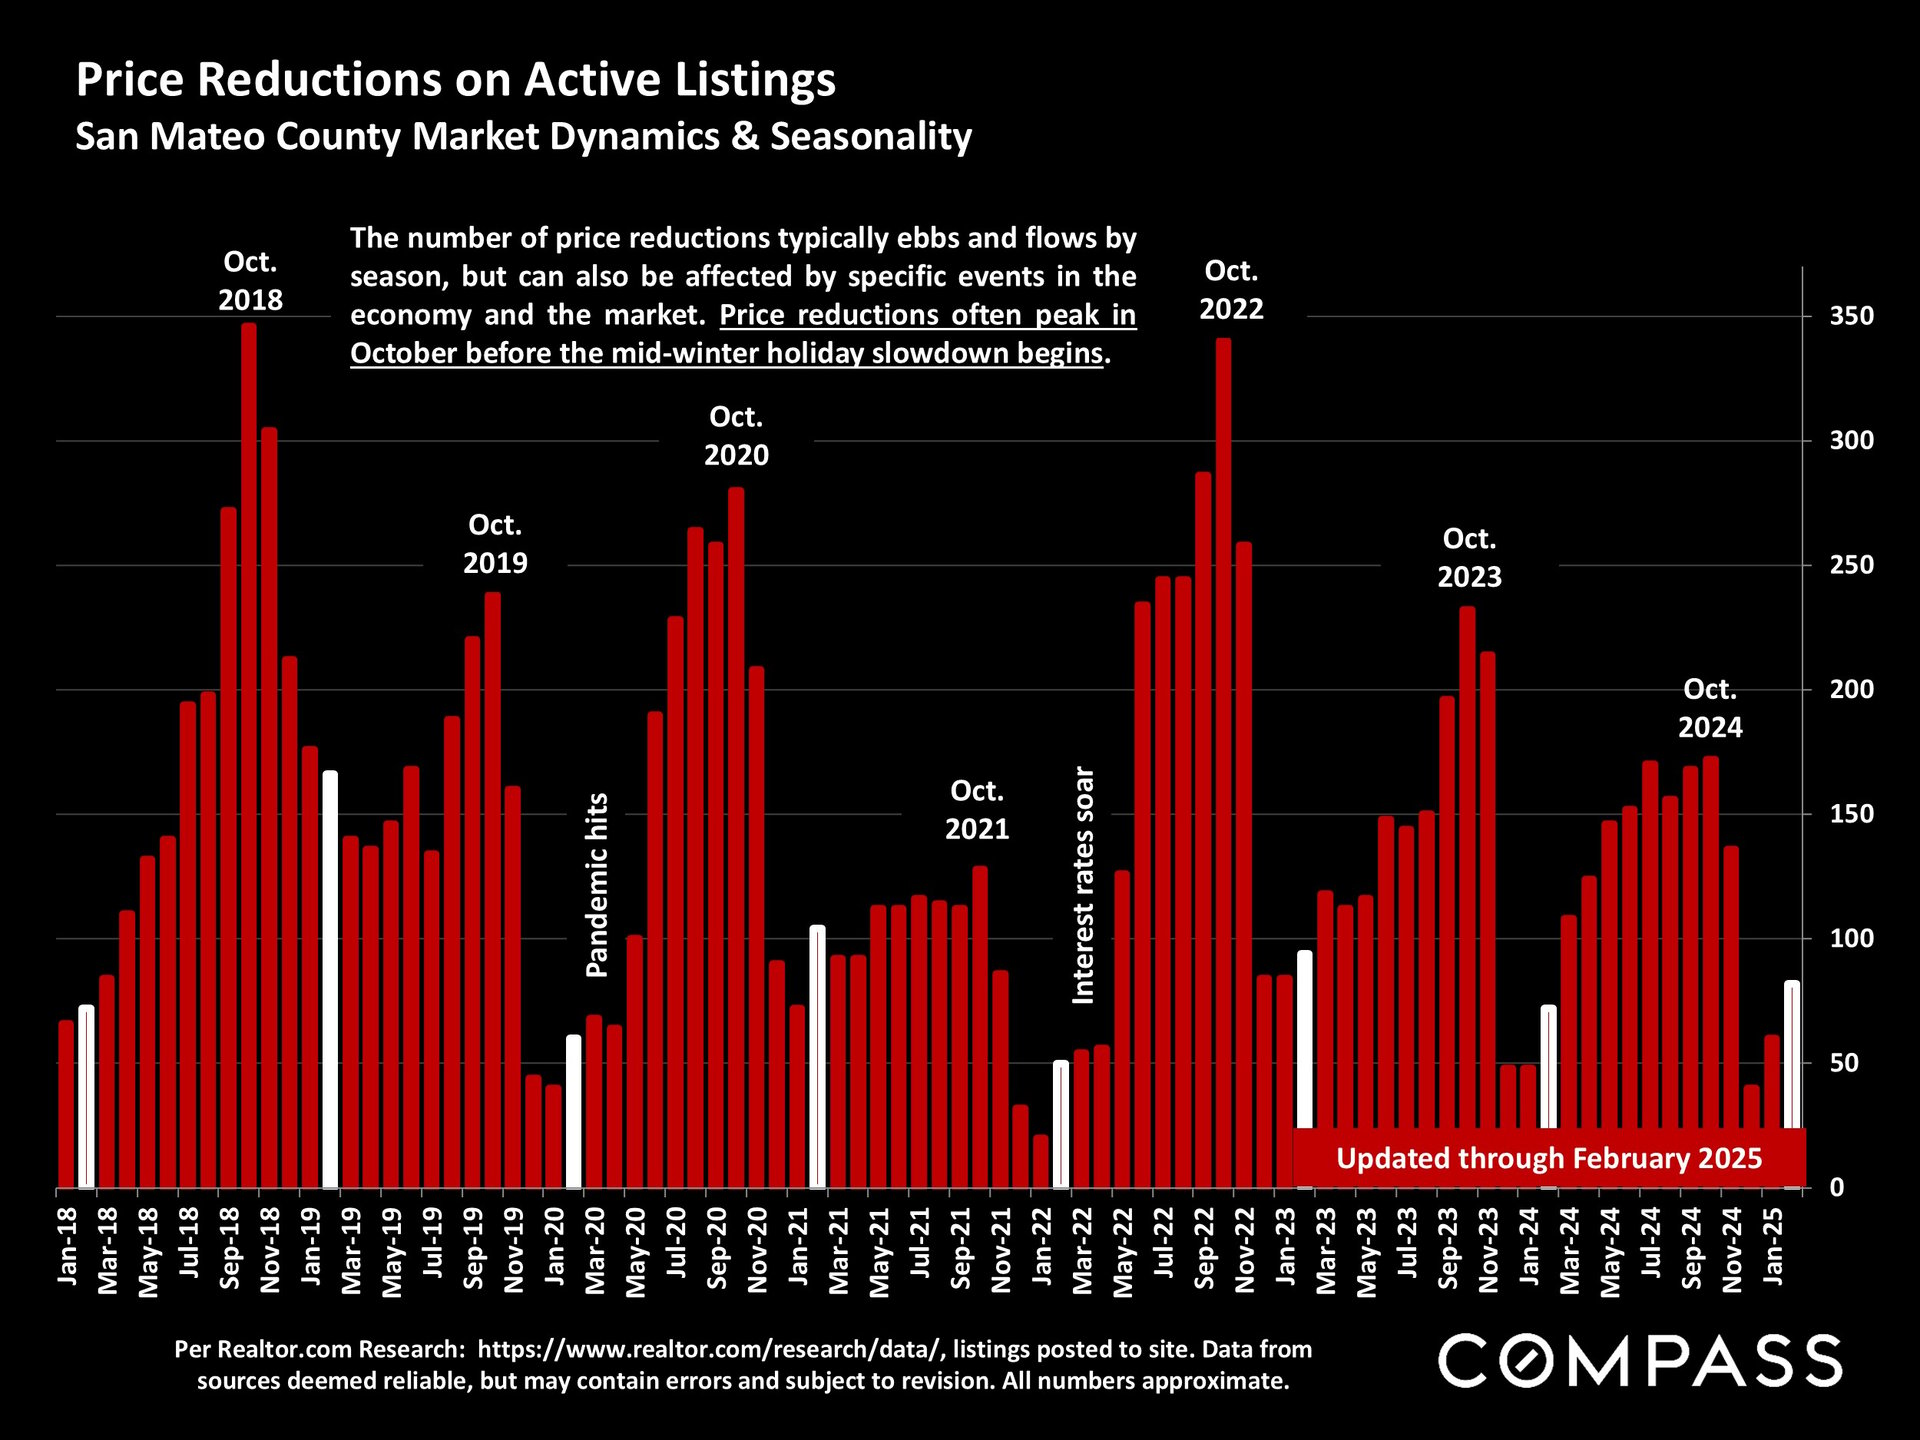
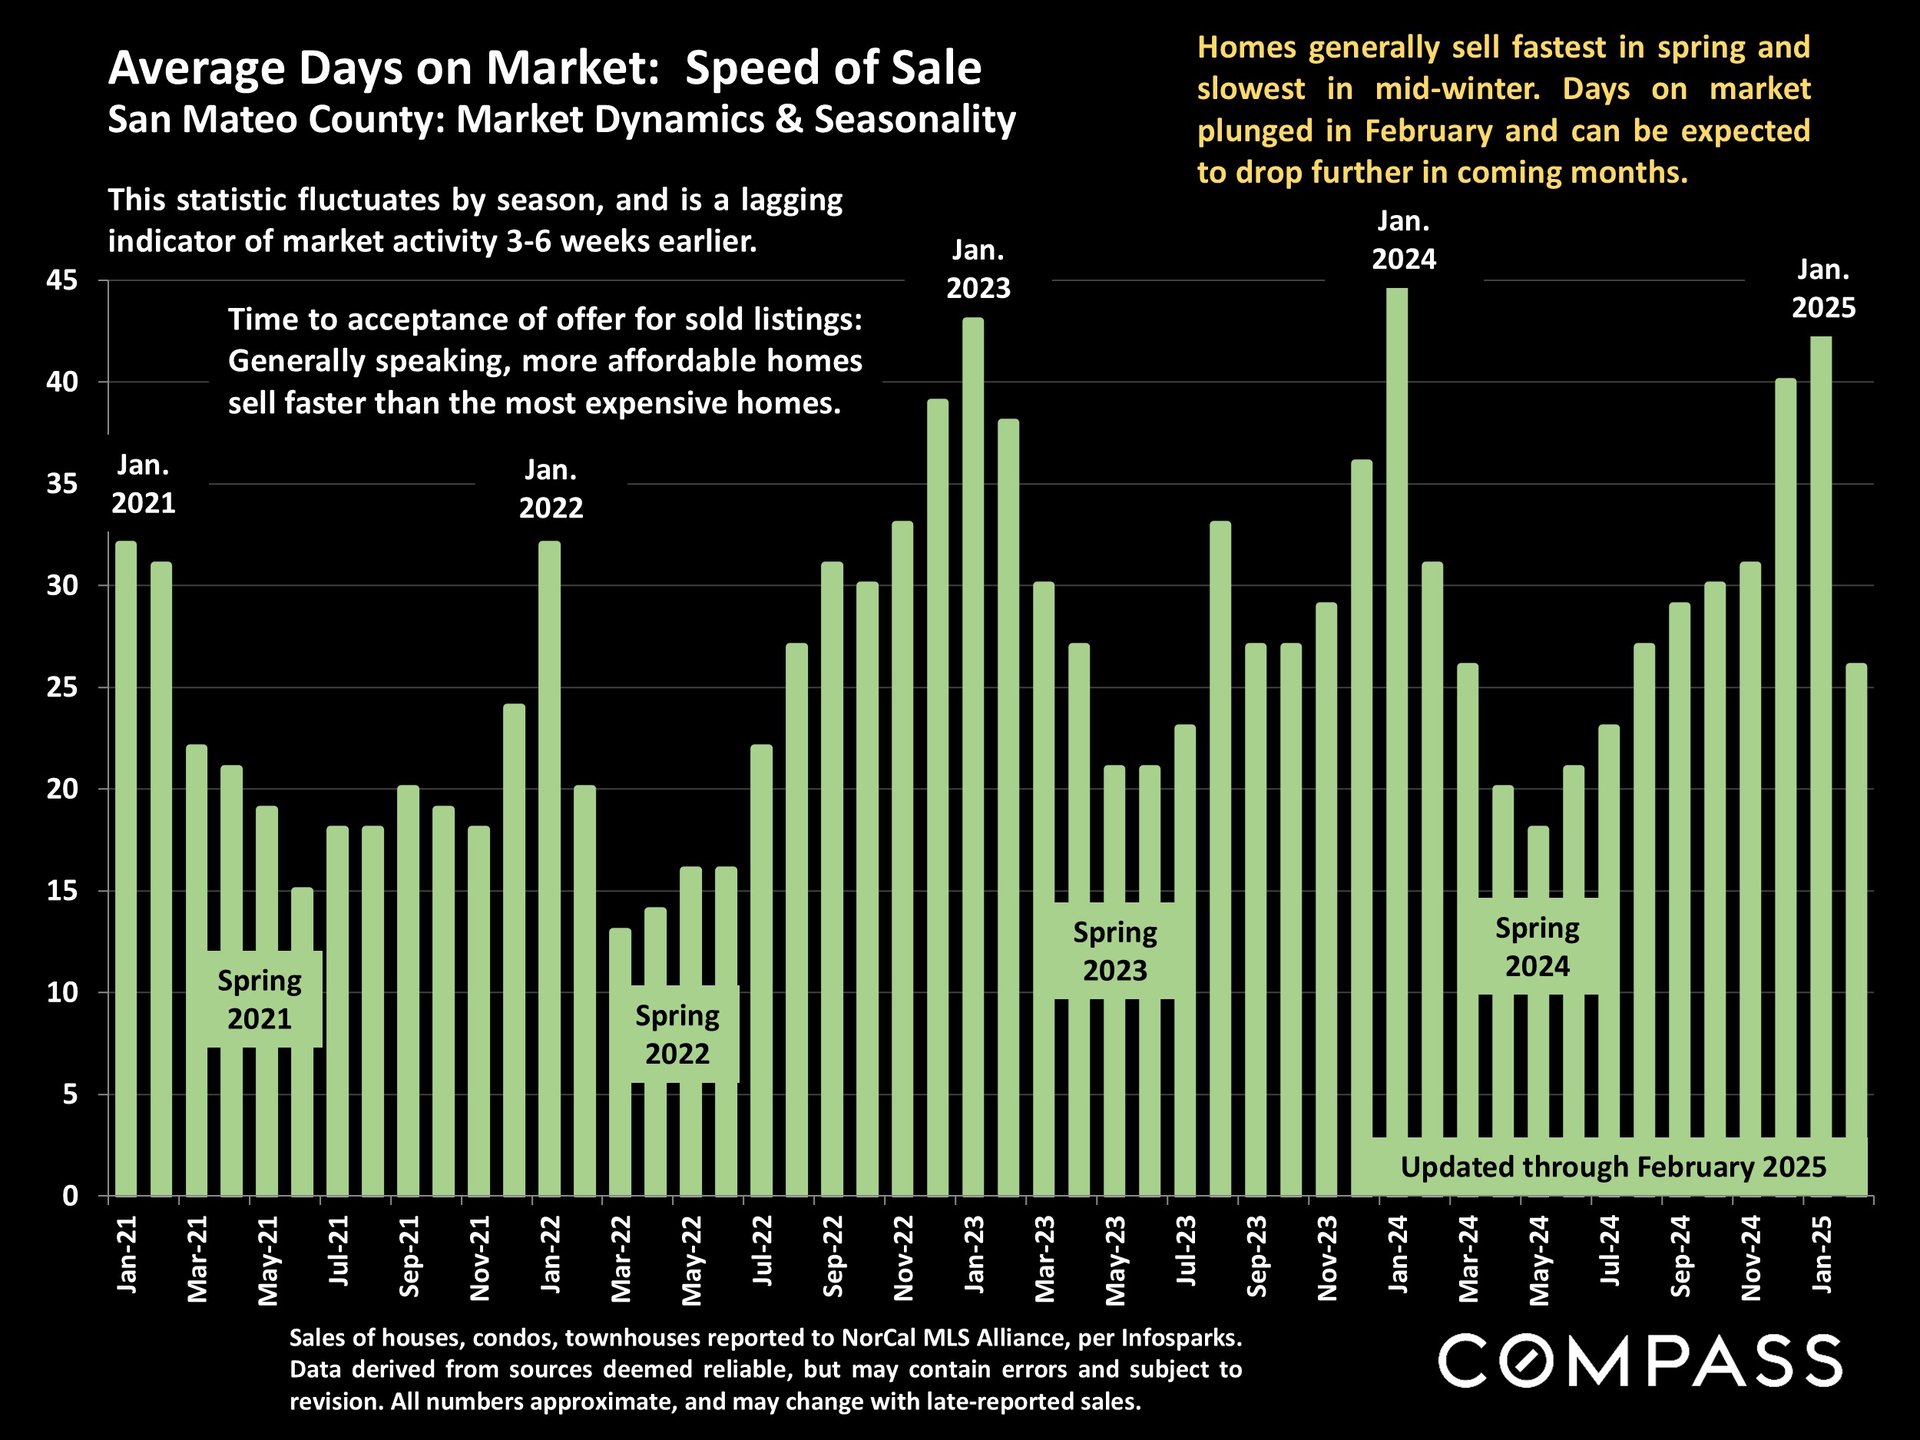
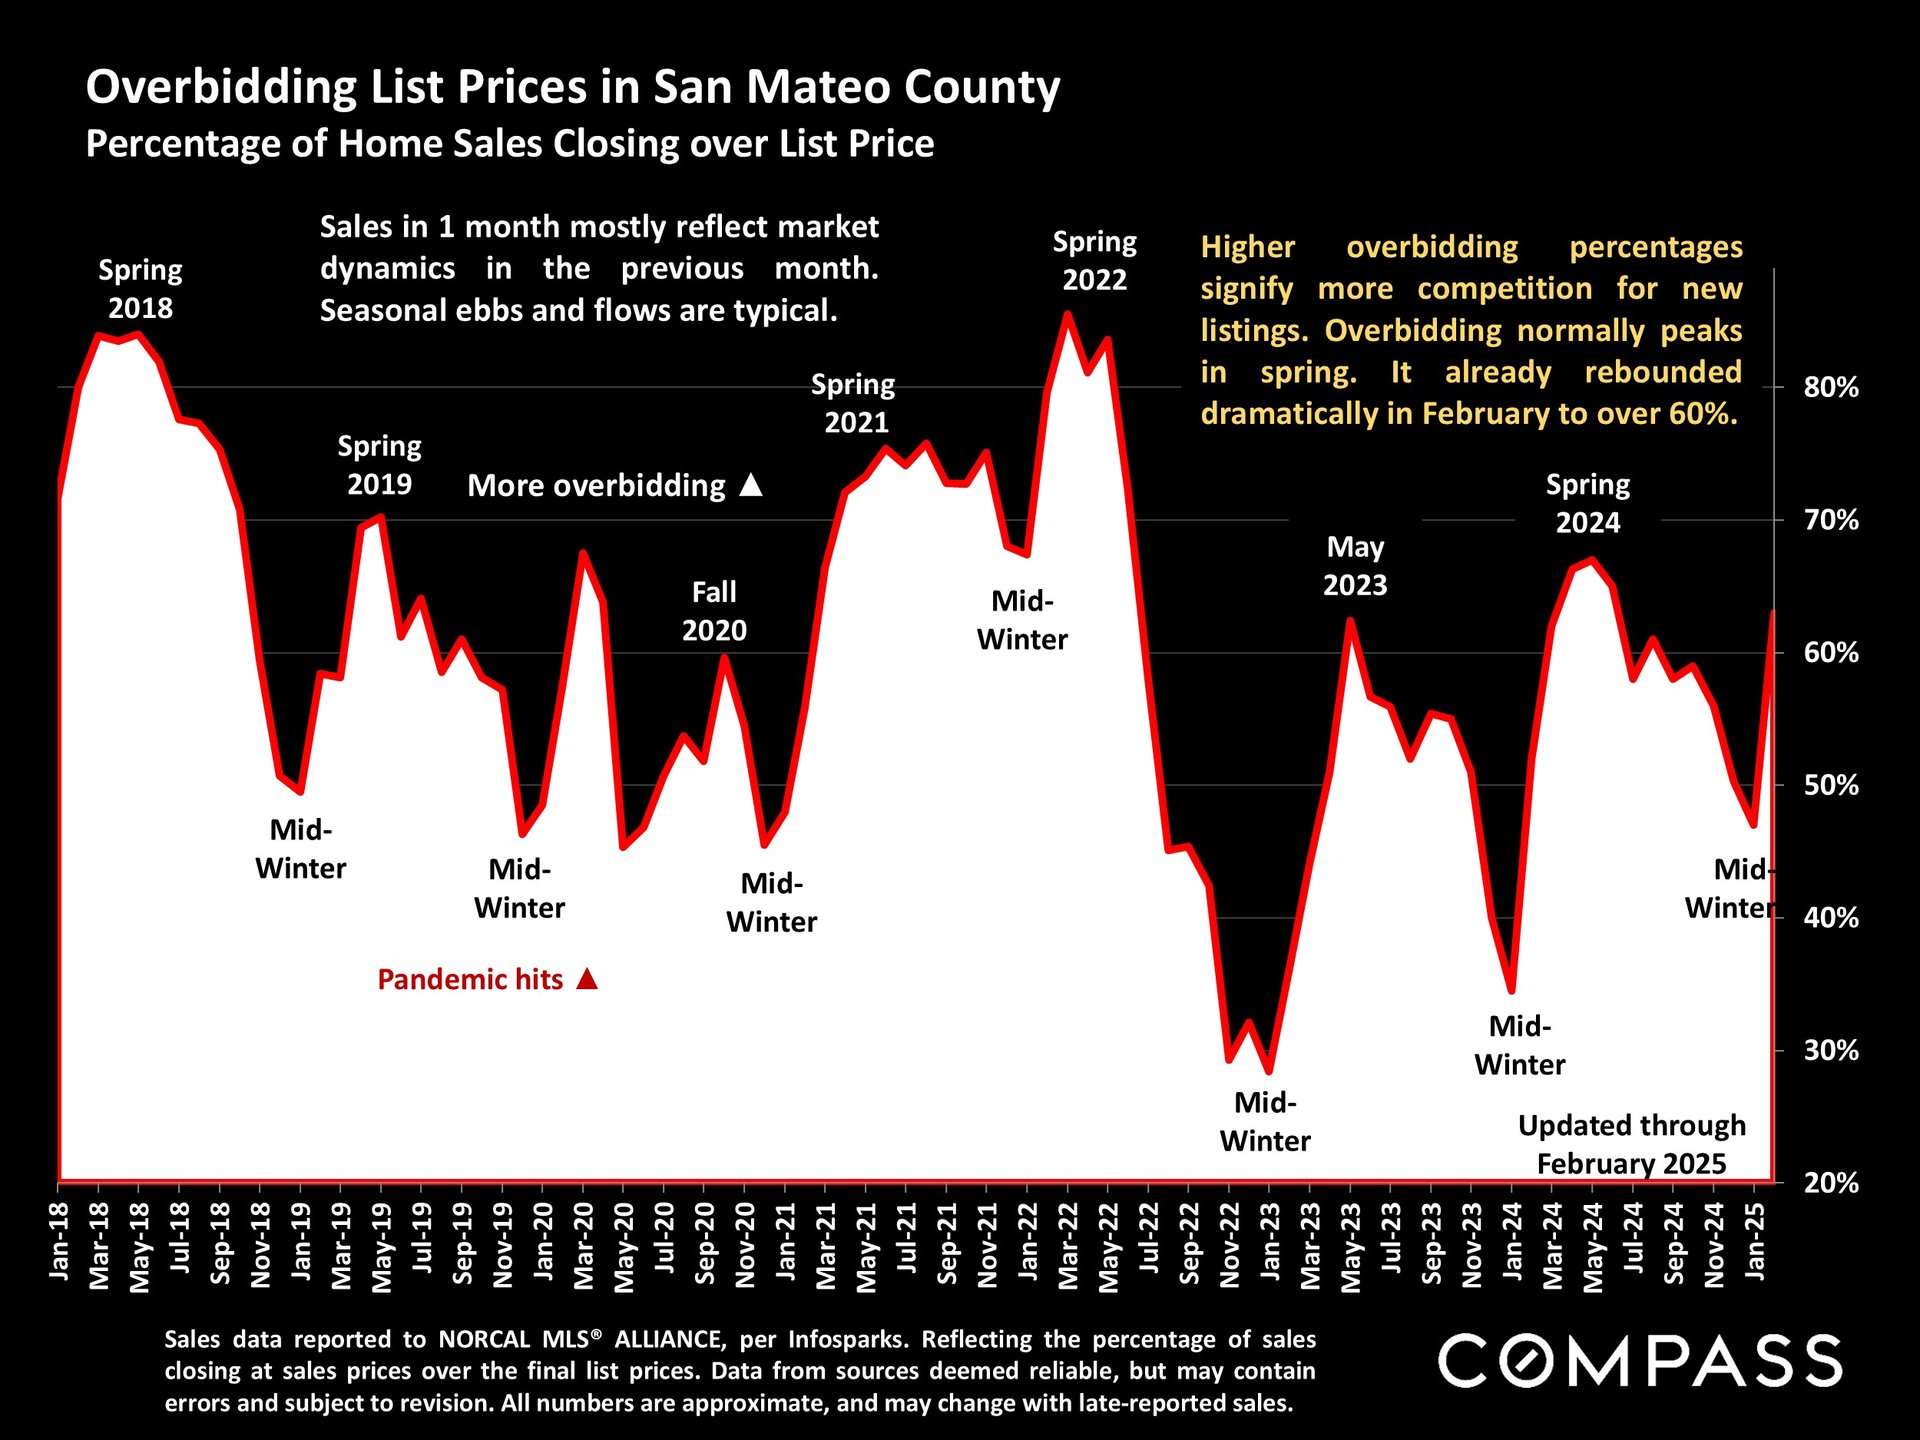
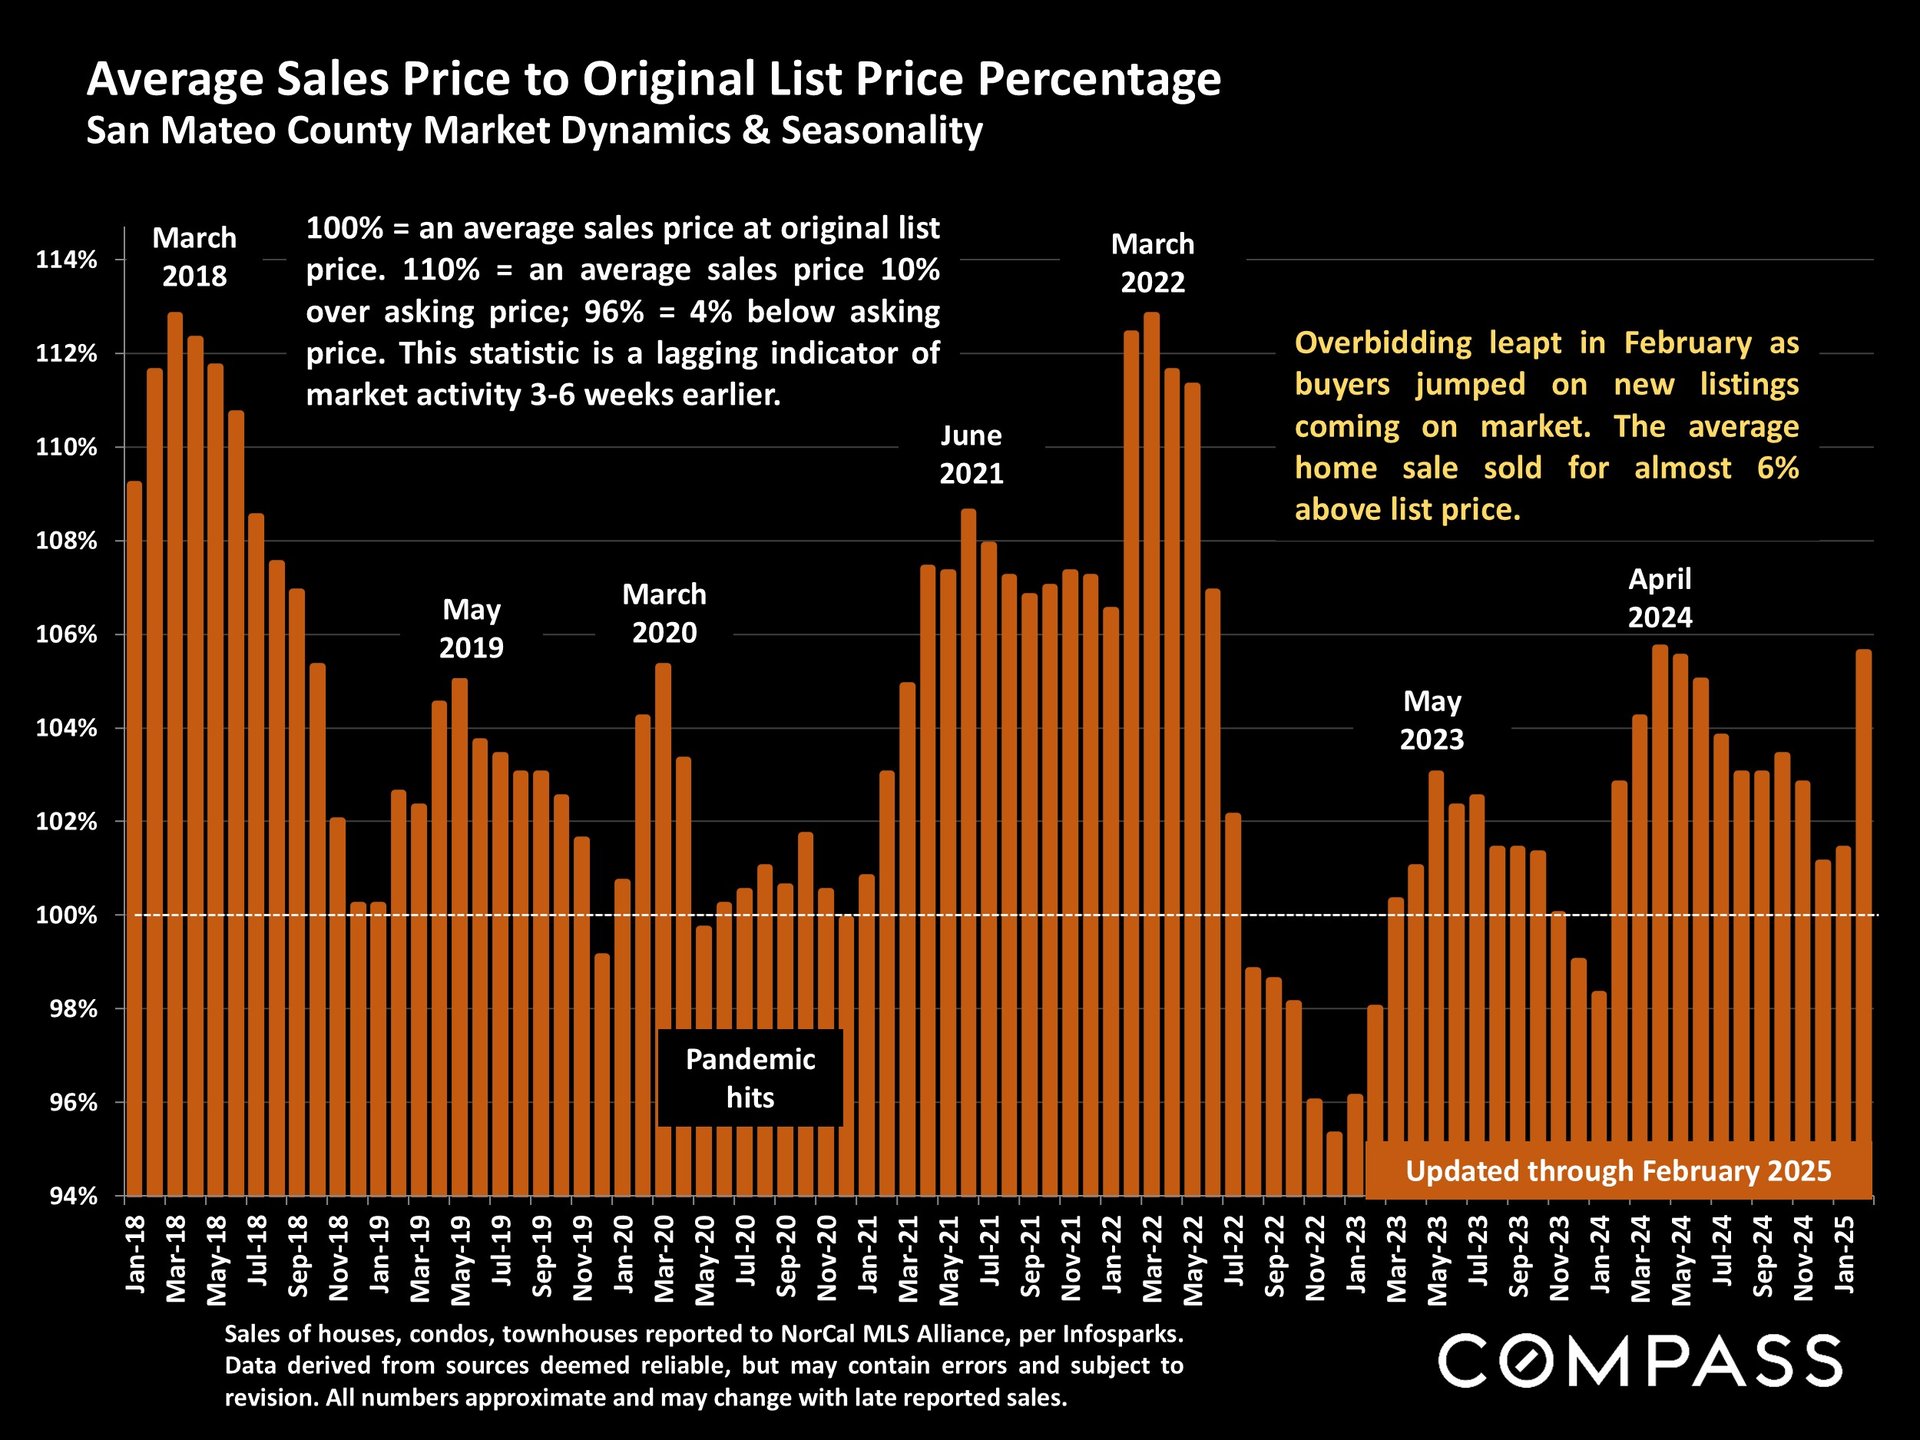
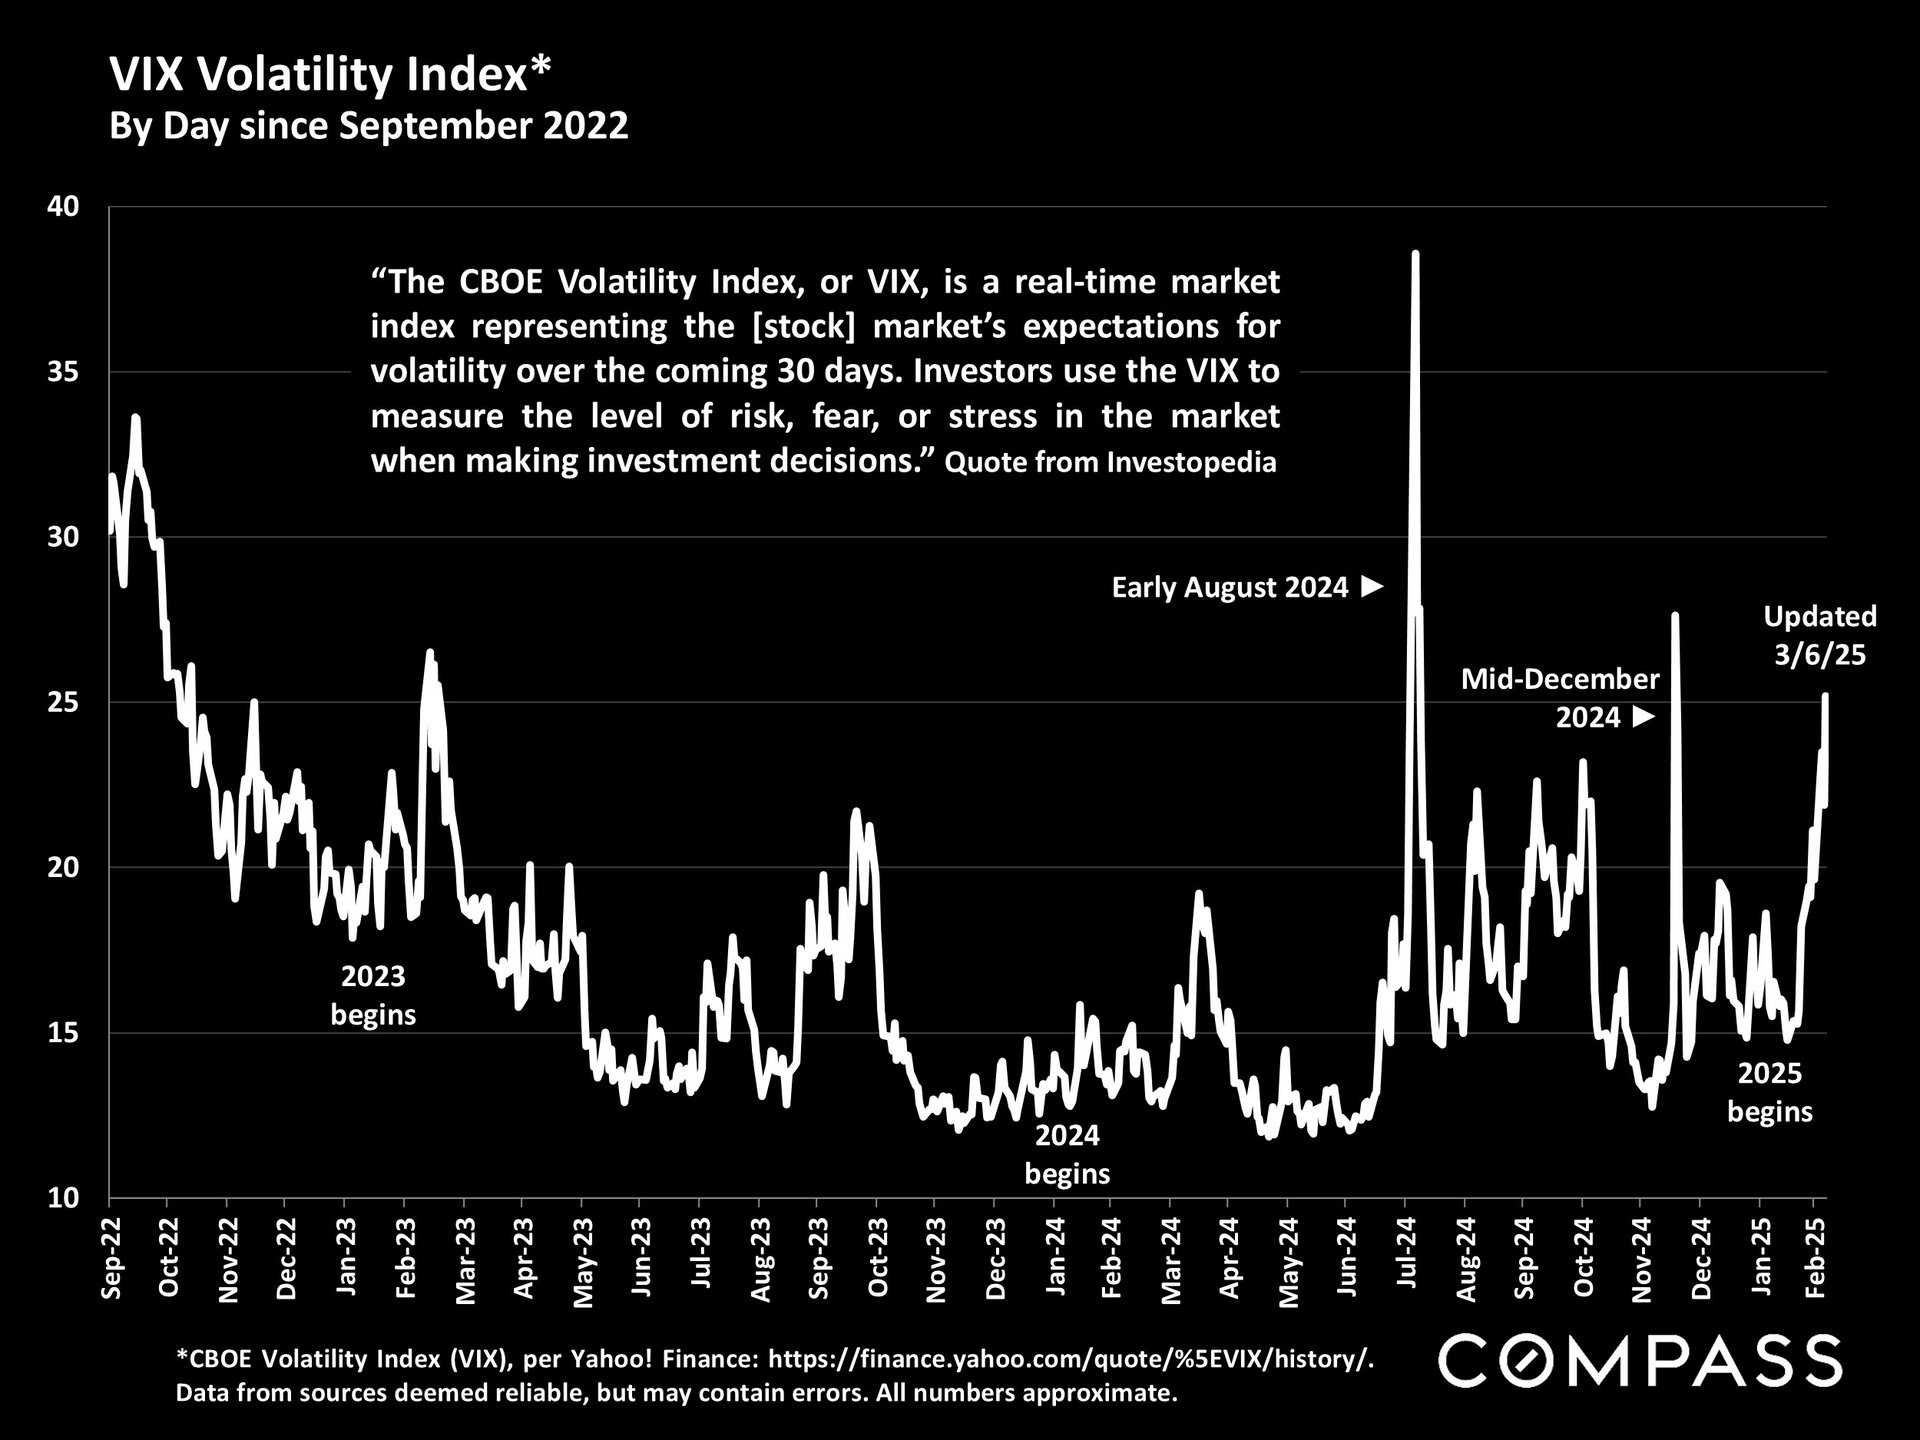
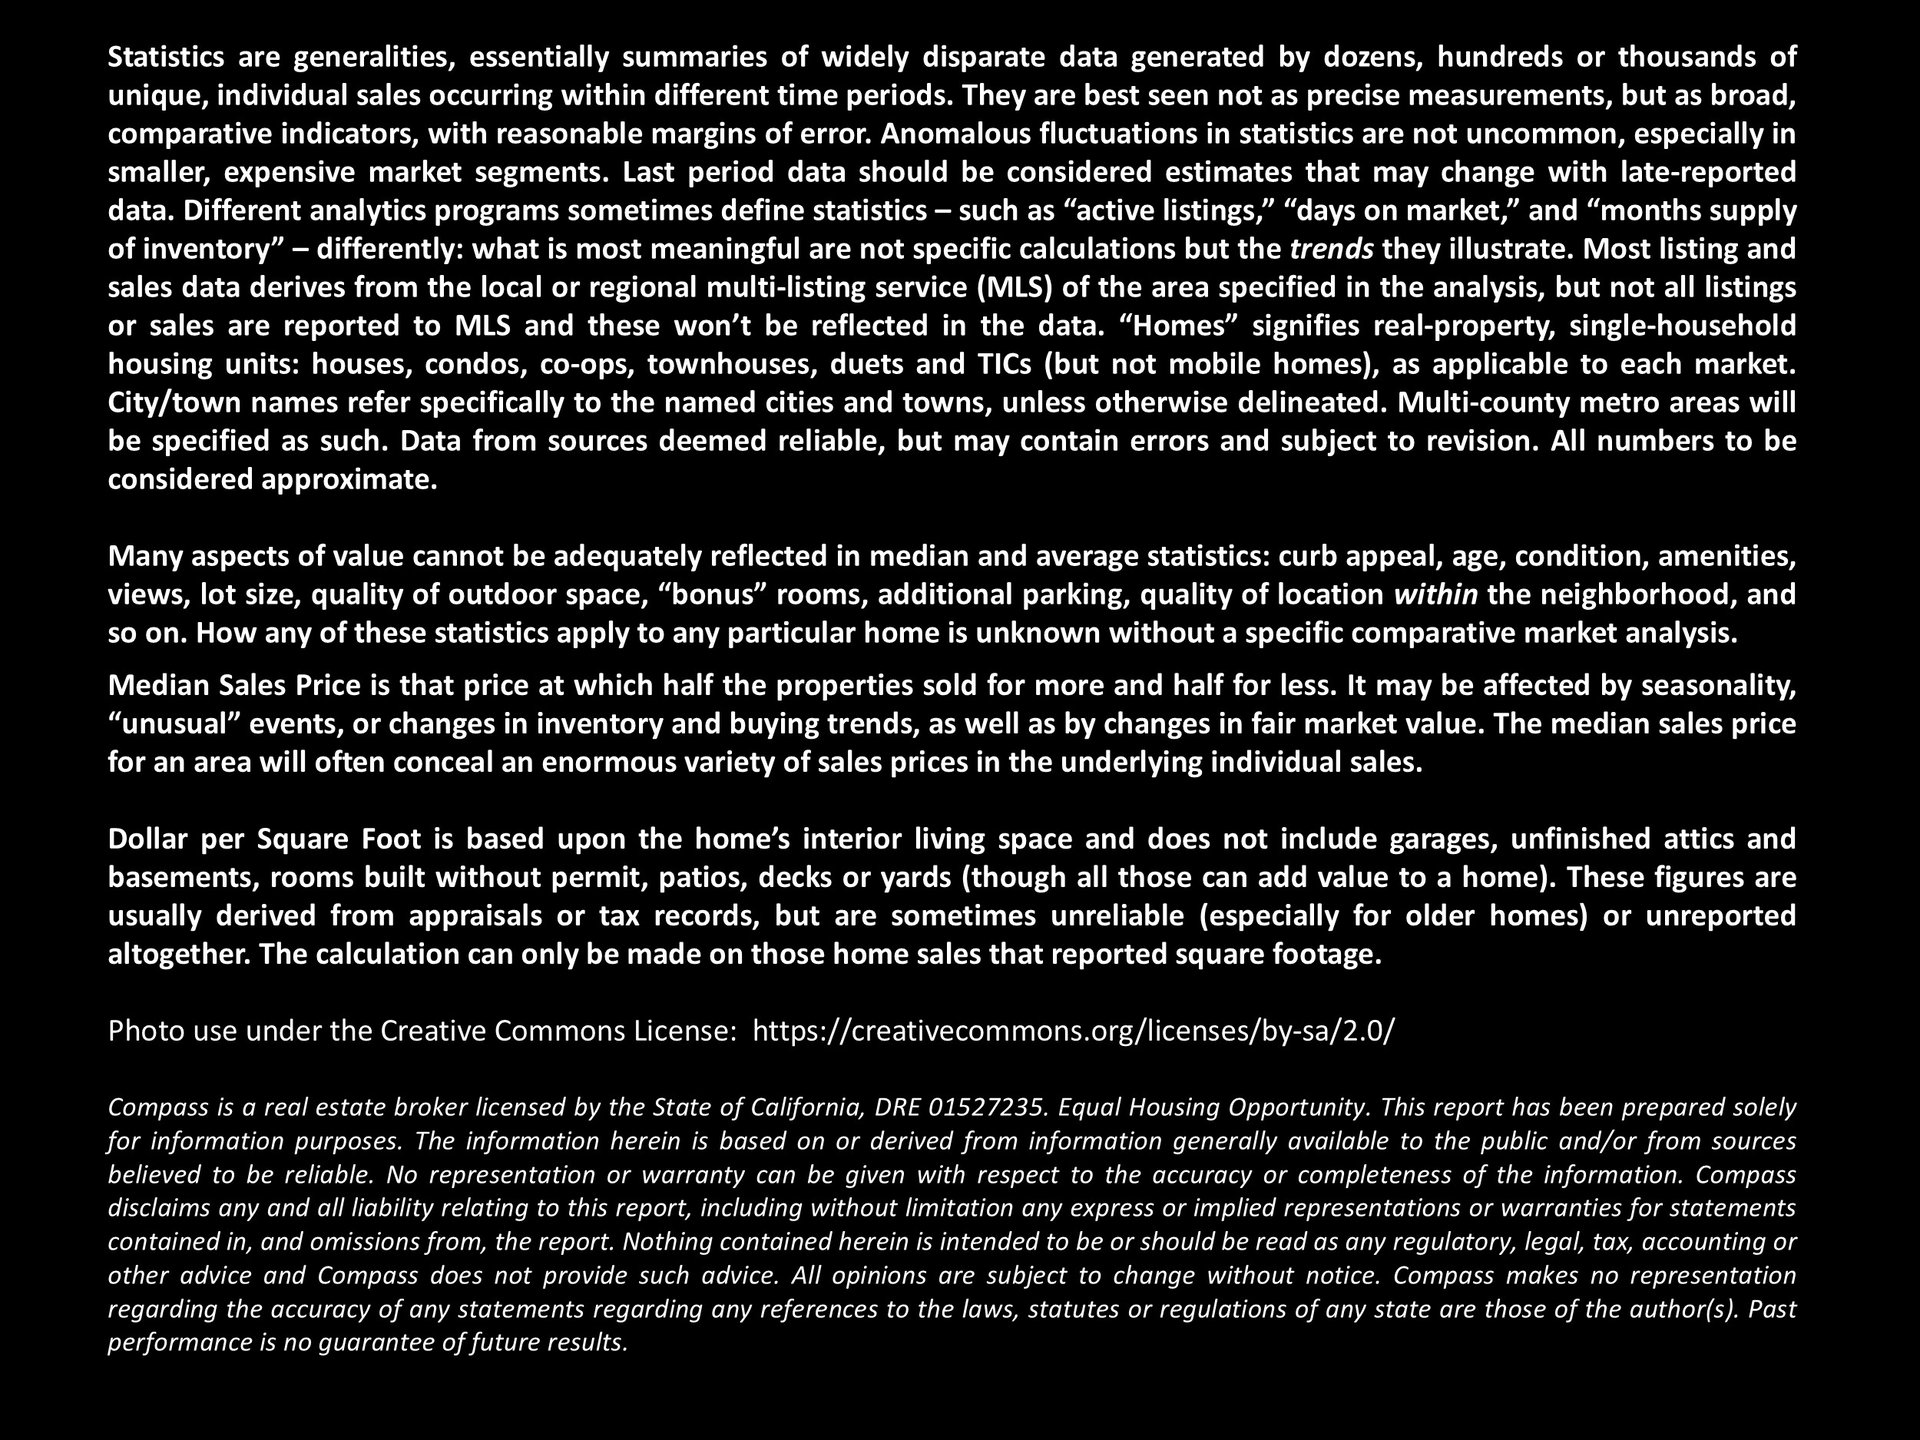
San Mateo County Real Estate March 2025 Report cover featuring a panoramic view of Pescadero Beach.March 2025 real estate report summarizing rising market activity, increased home inventory, and declining consumer confidence.Chart of weekly 30-year mortgage rates from 2023 to March 2025, with a 6.63% average on March 6, 2025.Line chart comparing Nasdaq and S&P 500 gains from January 2024 through March 6, 2025, with volatile upward trends.Chart of San Mateo County median house prices, 2005–2025, with recession and pandemic milestones.San Mateo County home price appreciation chart, with blue bars showing 9% over one year and 336% over 25 years.San Mateo County home sales by construction era, with a chart and median size and price table.San Mateo County condo price trend chart, 2005–2025, showing a 6% year-over-year increase through February 2025.San Mateo County home value chart comparing house and condo prices per square foot from 2005 to 2025.San Mateo County housing market table compares March 2025 listings, sales activity, inventory, and prices by segment and property type.San Mateo County new listings chart, January 2021–February 2025, highlighting seasonal trends and February’s year-over-year increase.Bar chart of San Mateo County active and coming-soon listings, February 2022 to March 2025, highlighting a 31% annual increase.Line chart of San Mateo County listings accepting offers, showing a 4.5% year-over-year increase and seasonal trends.San Mateo County monthly absorption-rate bar chart, January 2019 to January 2025, with a peak in March 2022.Chart of San Mateo County inventory supply from 2017 to February 2025, with a green trend line and market annotations.San Mateo County monthly home sales chart, January 2020 to February 2025, with seasonal peaks and a pandemic marker.Chart of monthly San Mateo County home sales over $5 million, January 2020 through February 2025.Chart of 2019–2024 Bay Area home price appreciation by house size, with the largest homes rising 60%.Bar chart of San Mateo County active-listing price reductions, with October peaks highlighted from 2018 to 2024.San Mateo County days-on-market chart, January 2021 to February 2025, with seasonal spring and winter patterns.Chart tracks San Mateo County home sales over list price, with a February 2025 rebound above 60%.San Mateo County chart of monthly sale prices as a percentage of original list prices, January 2018–January 2025.VIX volatility index chart from September 2022 to February 2025, with sharp spikes in August 2024 and February 2025.Real estate report notes explain market statistics, data limitations, price measures, photo licensing, and legal disclaimers.

WORK WITH US

We offer the highest level of service and expertise to our clients. Our team has built a reputation for consistently representing the finest real estate in San Francisco and Napa Valley. Results driven and dedicated to your success, whether buying, selling, renting or investing. Contact us today for a private consultation.

Contact Us