San Mateo county: September 2022

San Mateo County Real Estate: September 2022 Report
Text slide summarizing September 2022 Bay Area housing activity, market uncertainty, and real estate statistics.
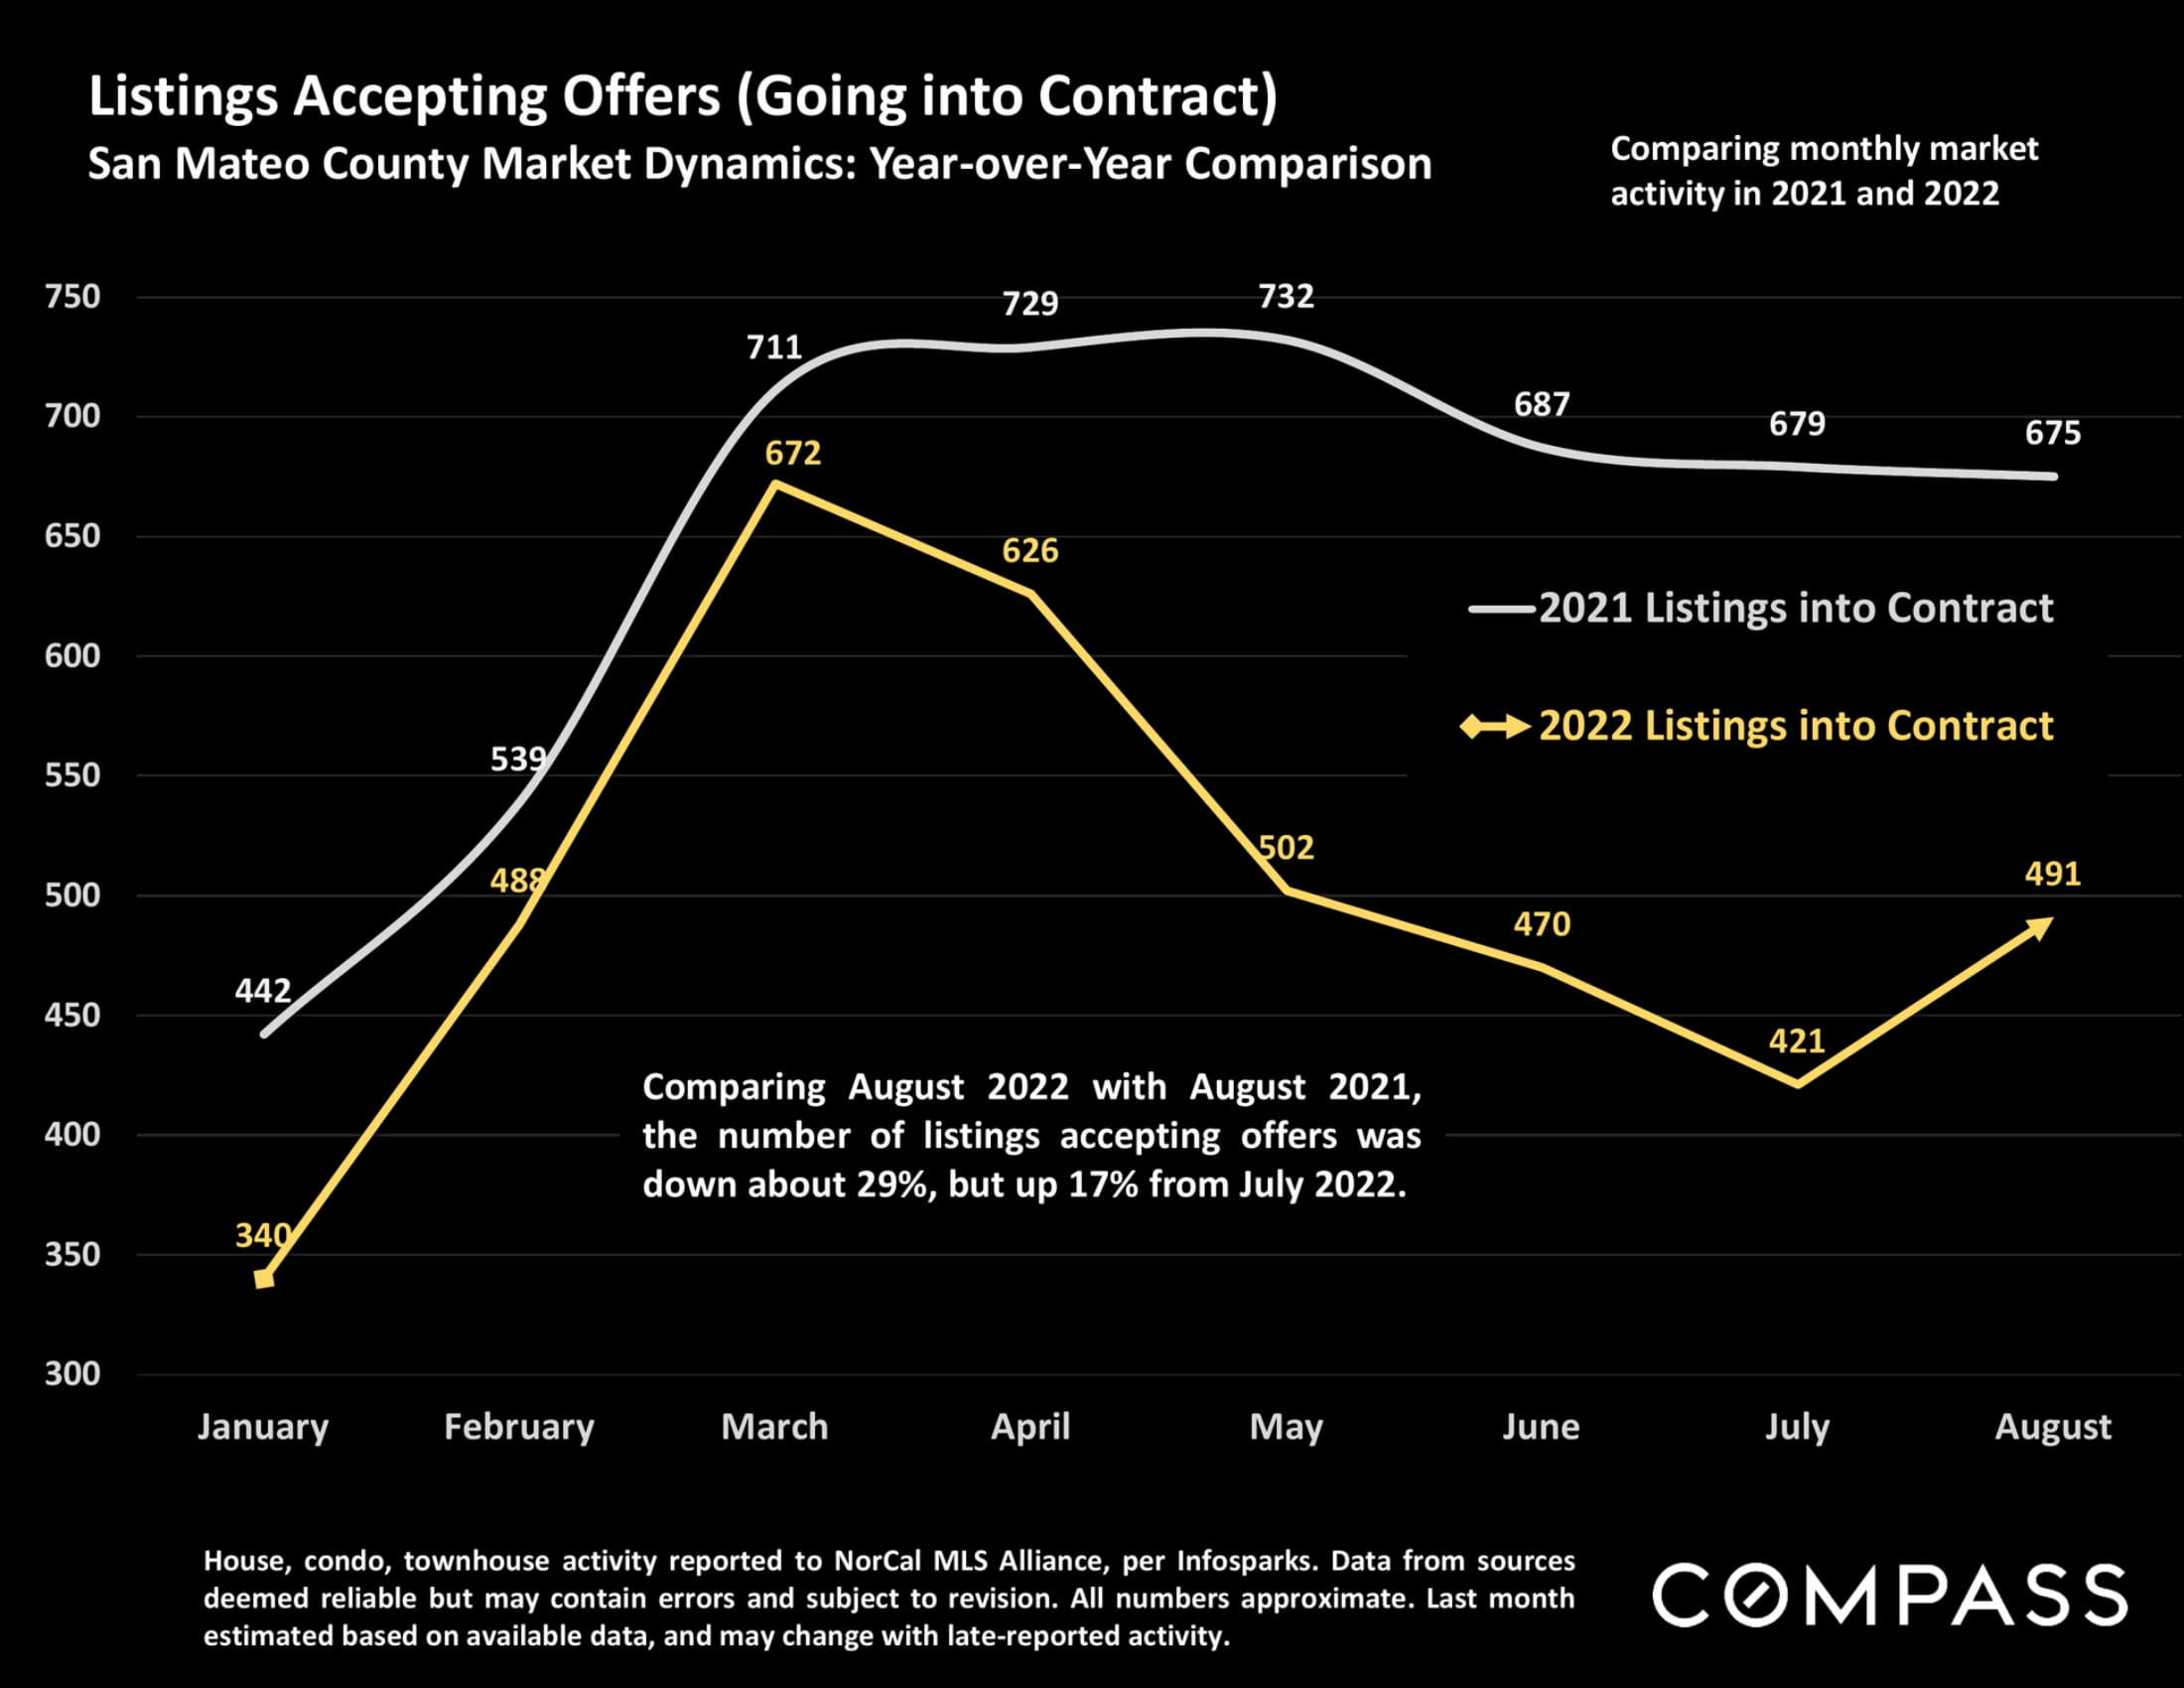
Line chart comparing San Mateo County listings accepting offers in 2021 and 2022; August totals are 675 and 491, respectively.
Chart of San Mateo County median house prices from January 2018 through August 2022, peaking in April 2022.
Bar chart of San Mateo County home-price appreciation from 2020 to August 2022, with recent rates falling sharply.
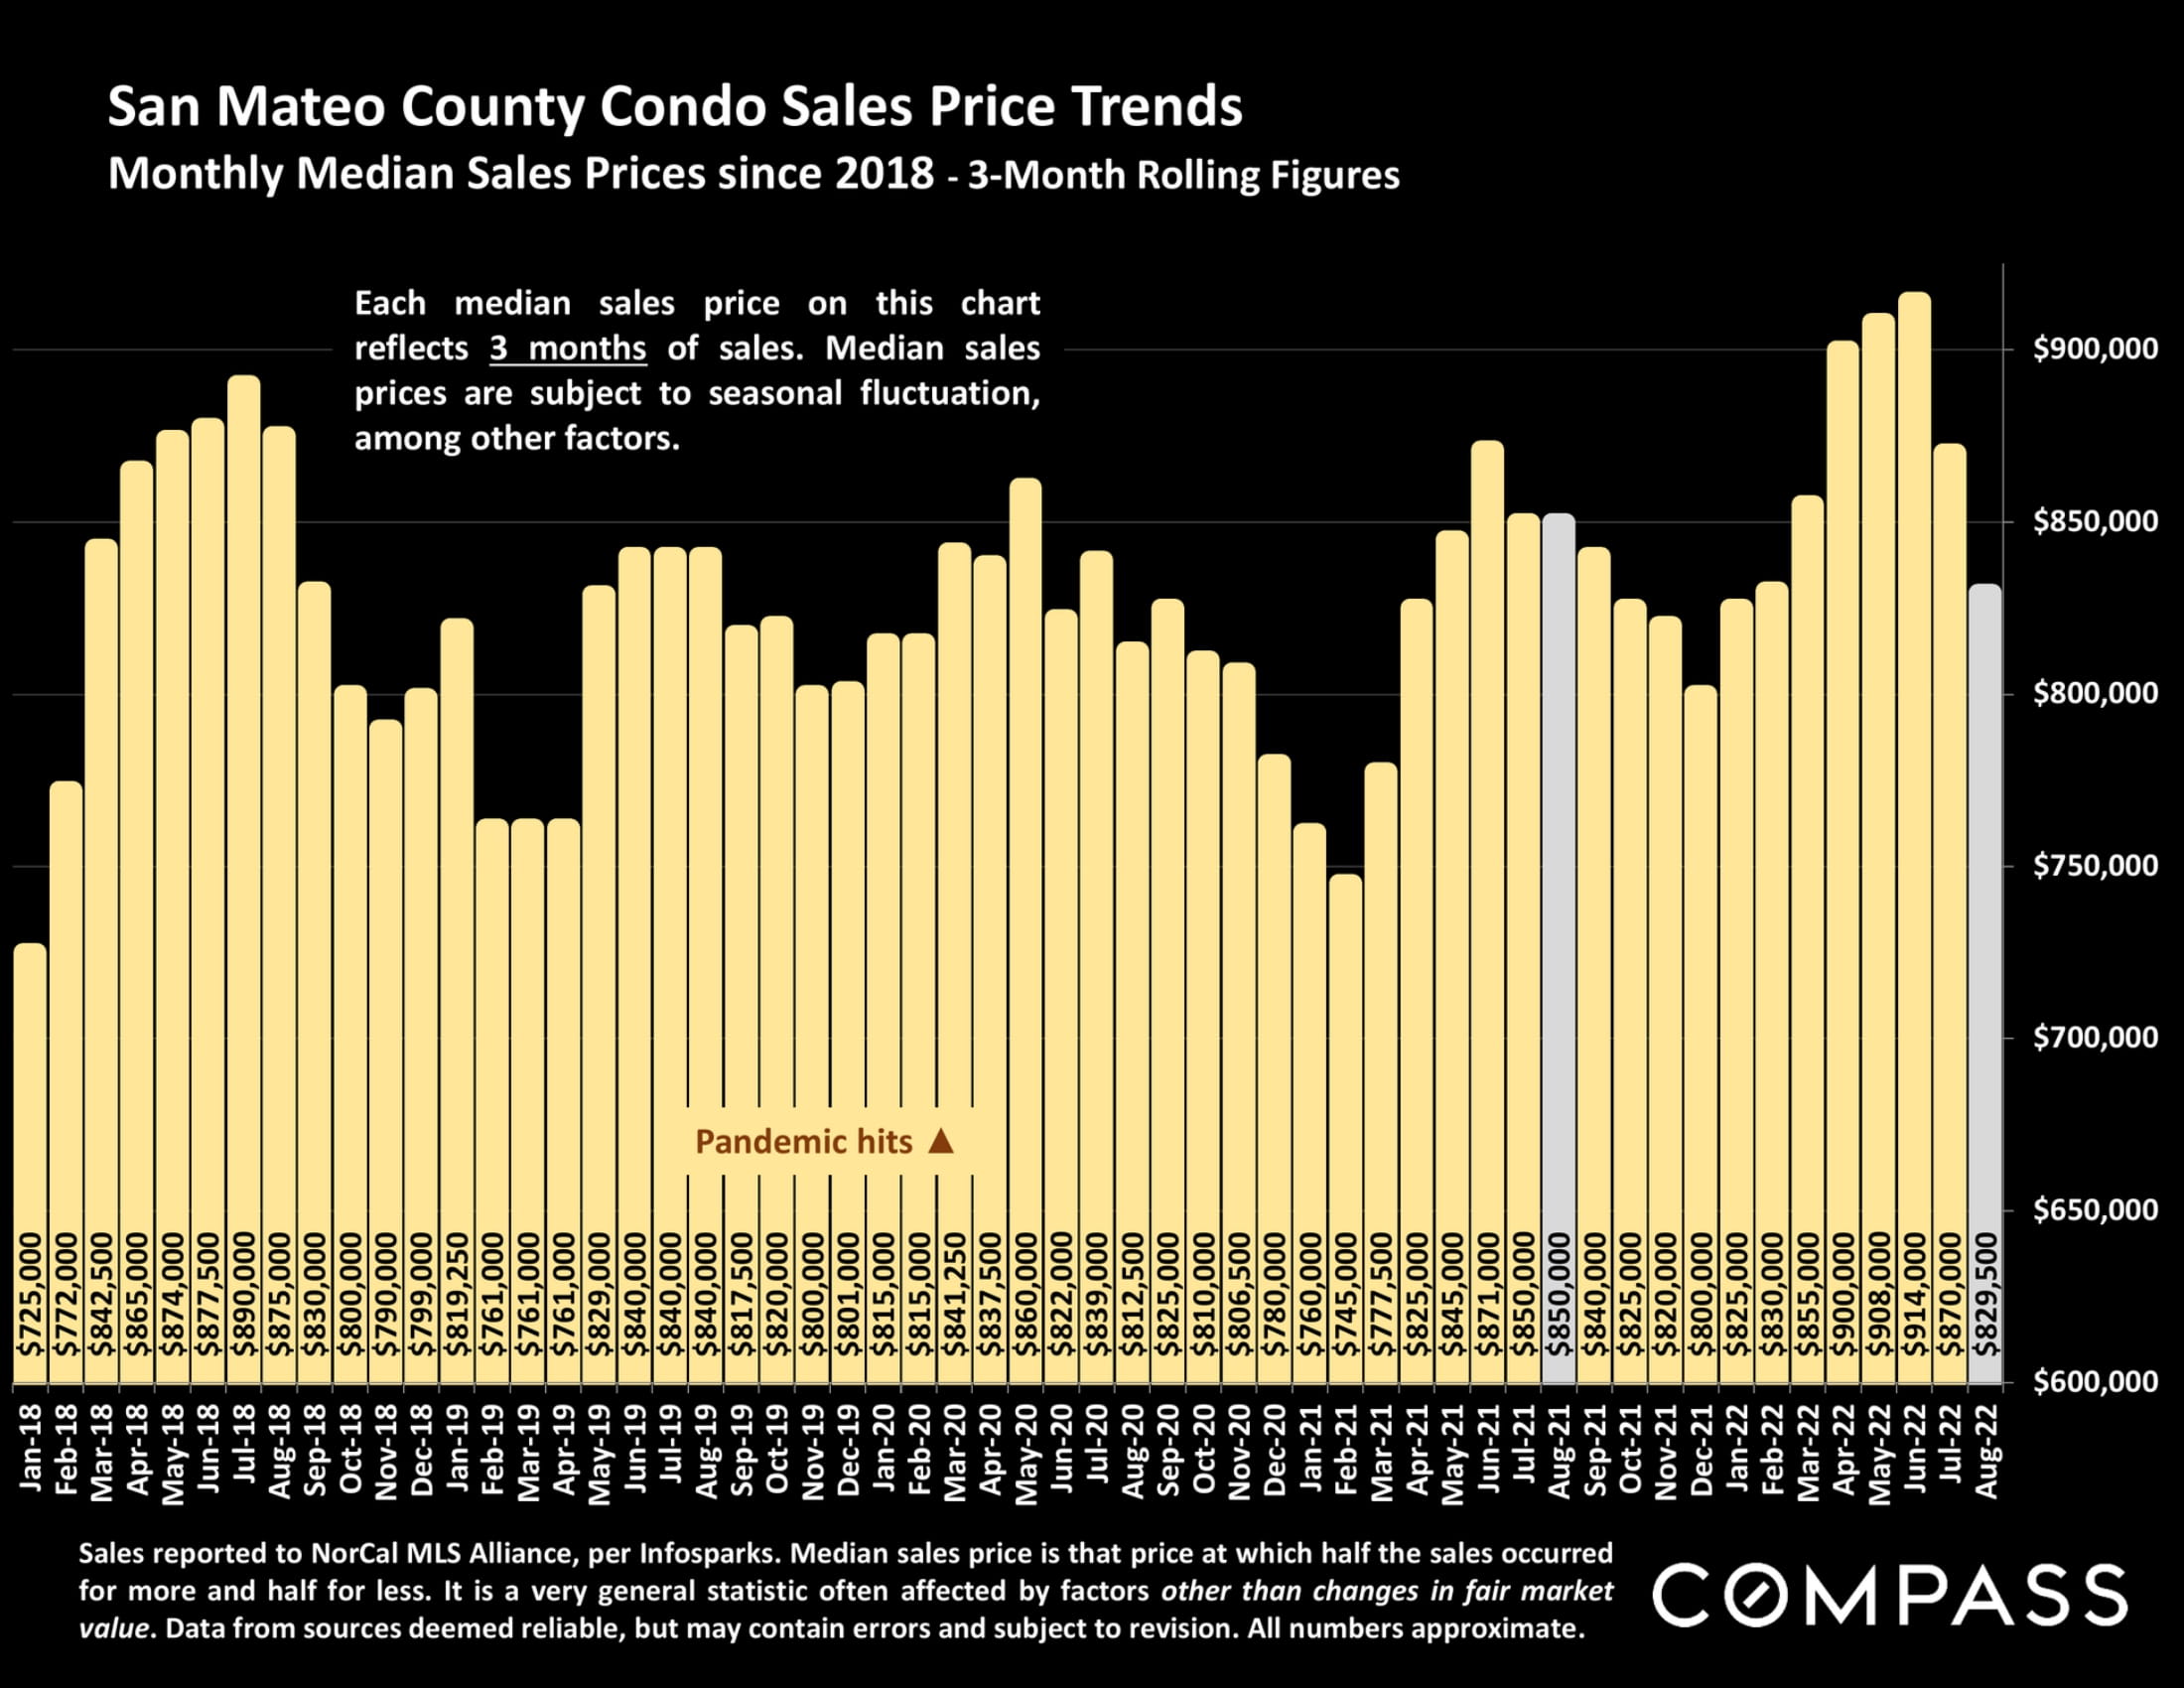
Bar chart of San Mateo County condo median prices, peaking near $914,000 in June 2022 before falling.
San Mateo County days-on-market bar chart, January 2019–August 2022, with a rise to 27 days by August 2022.
San Mateo County home sale prices as a percentage of list price, charted monthly from 2018 to 2022.
San Mateo County chart comparing 2021 and 2022 monthly new listings, with 2022 listings down 24% in August.
Chart of San Mateo County new listings from 2018 to 2022, showing recurring spring and autumn peaks and winter lows.
San Mateo County active listings chart comparing 2021 and 2022, with August 2022 up about 34%.
San Mateo County active listings, January 2017–August 2022; gold bars peak near 1,000 in fall 2020.
Line chart comparing San Mateo County monthly price reductions in 2021 and 2022, with a sharp rise in 2022.
San Mateo County monthly active-listing price reductions, January 2018–August 2022, shown in a red bar chart.
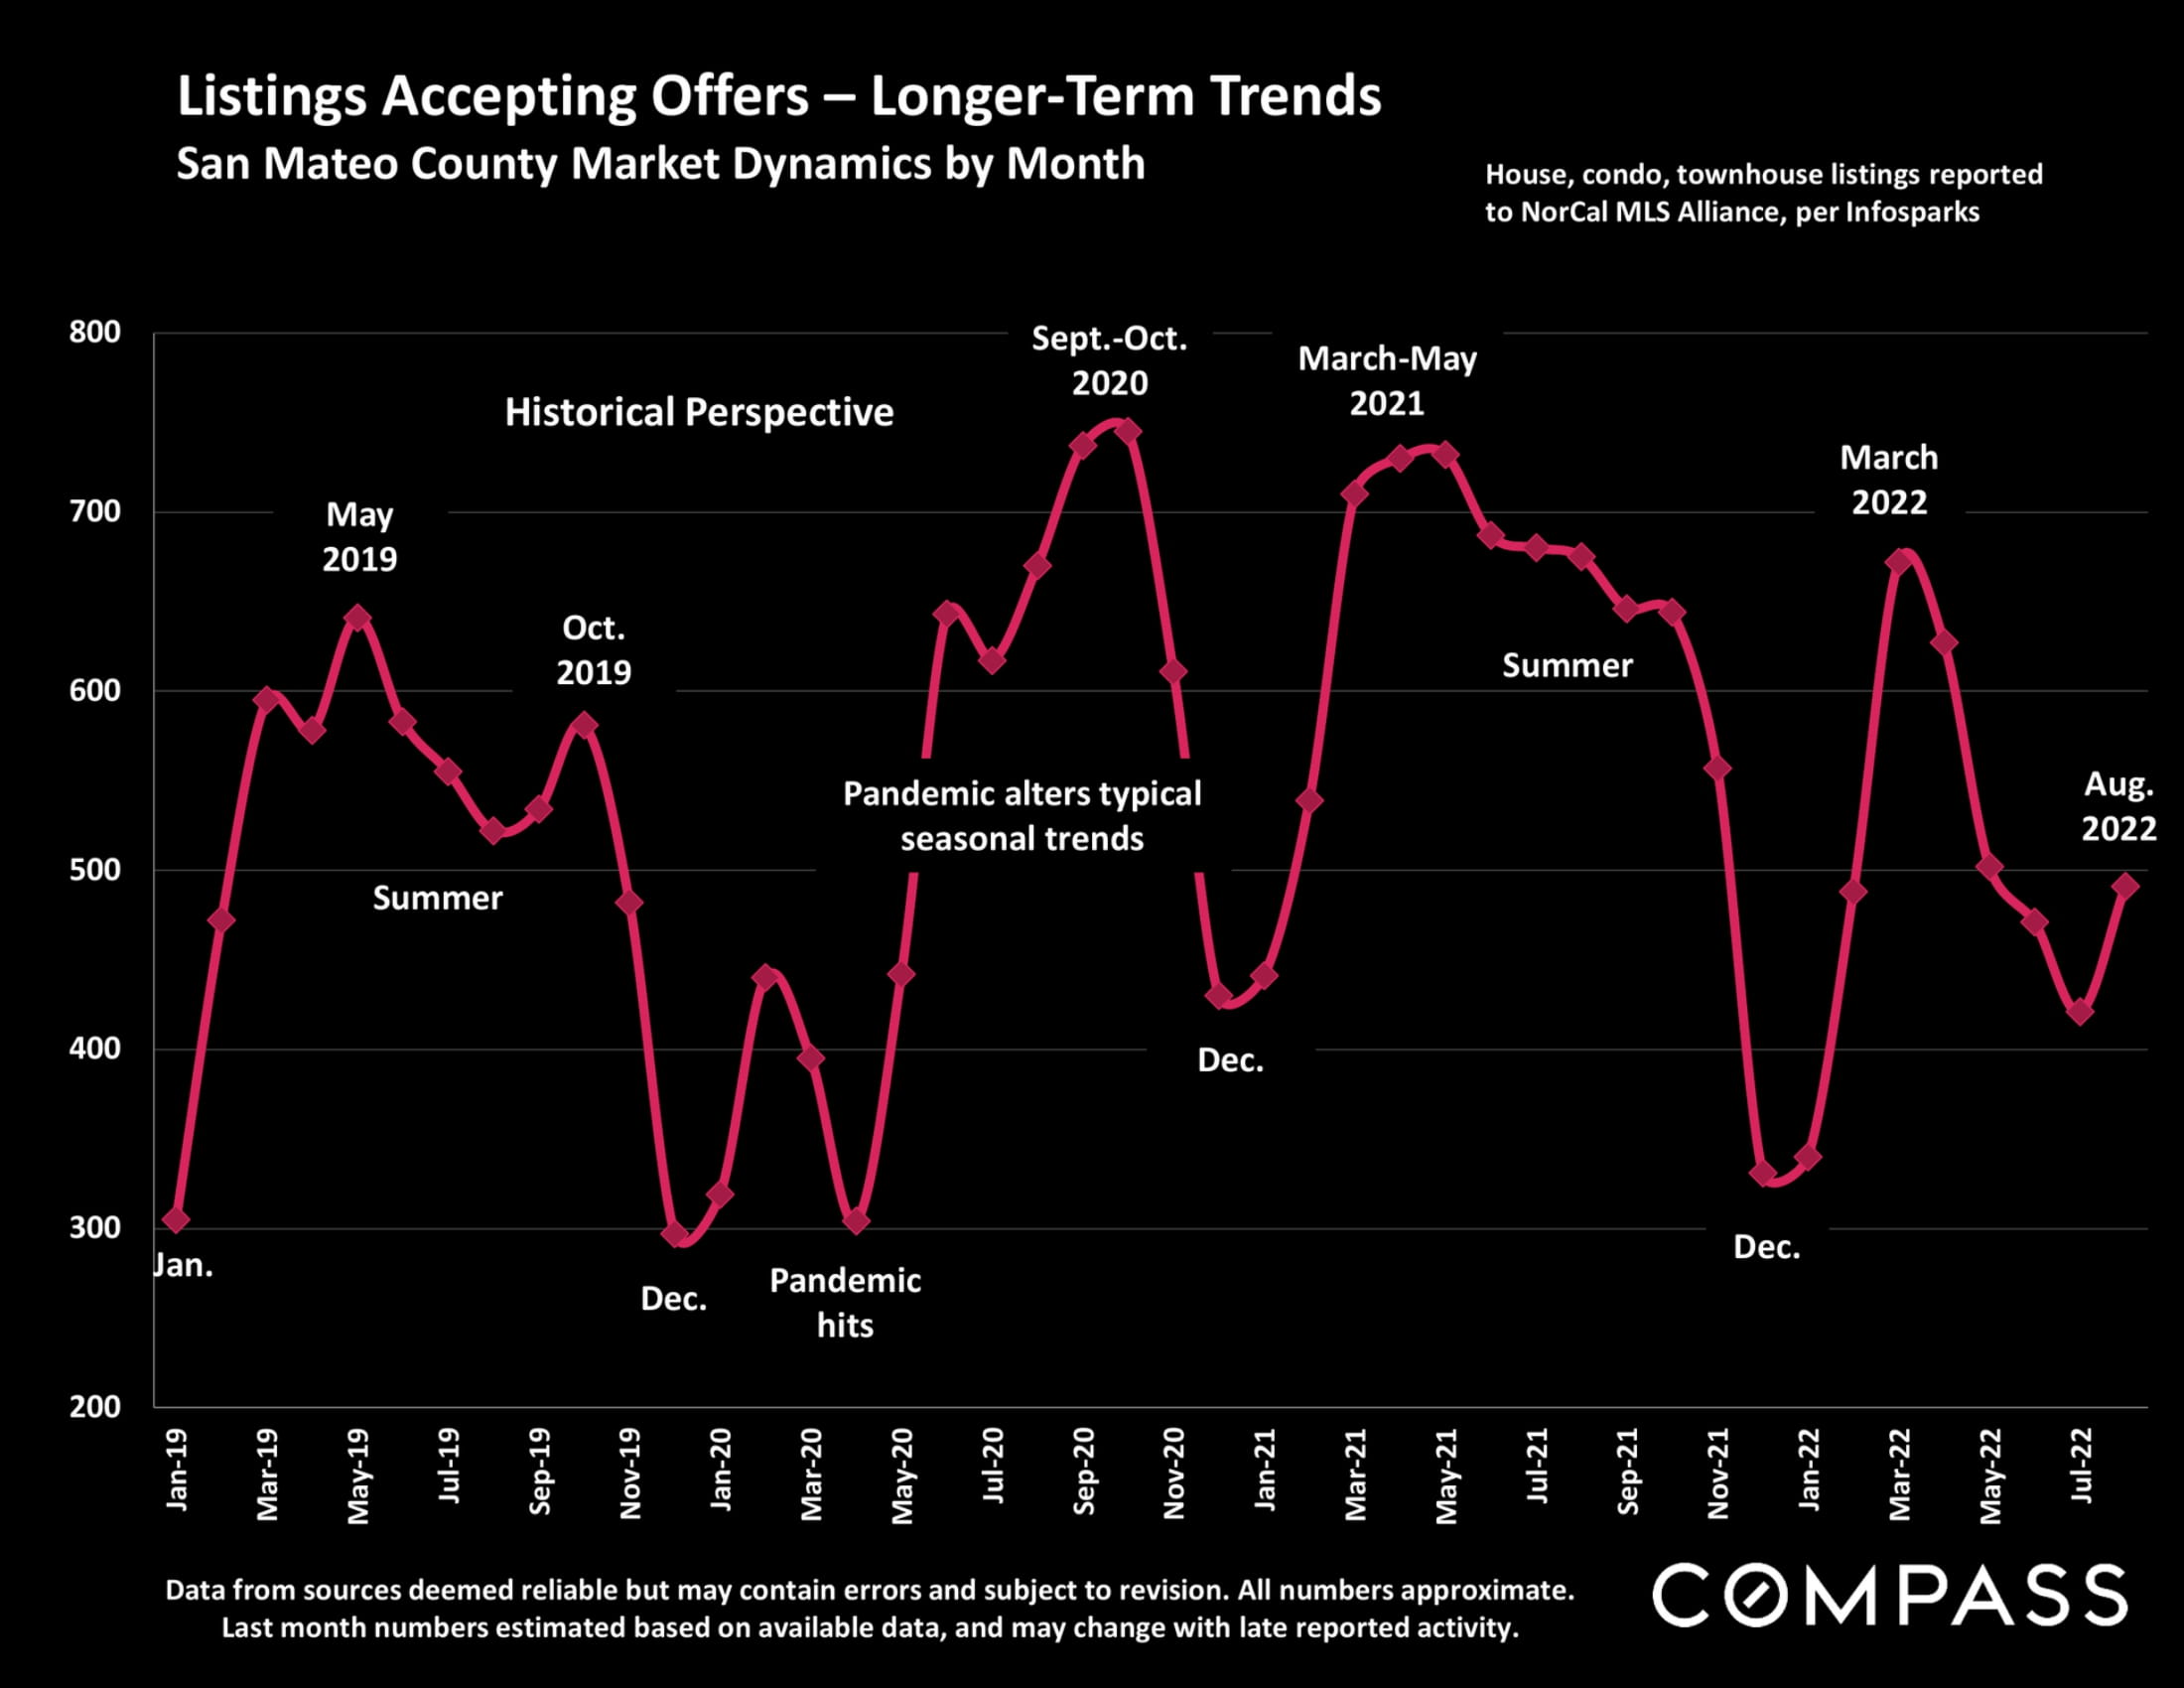
San Mateo County listings-accepting-offers trend chart, with monthly counts from 2019 to 2022 and pandemic annotations.
Chart comparing San Mateo County listing-to-contract percentages in 2021 and 2022, with 2022 falling sharply after March.
Line chart comparing monthly San Mateo County home sales in 2021 and 2022, with August totals of 670 and 480.
San Mateo County monthly home sales, January 2018–August 2022; bars peak in 2020–2021 and decline in early 2022.
Chart comparing monthly San Mateo County home sales over $3 million in 2021 and 2022, January through August.
Bar chart of San Mateo County $3 million-plus home sales, January 2018–August 2022, with seasonal peaks noted.
Bay Area large-home sales comparison table, with San Mateo County highlighted in yellow.
San Francisco Bay Area Luxury Home Market report access graphic.
Economic charts and an infographic about factors affecting Bay Area real estate markets.
San Francisco Bay Area Real Estate Survey
Text explaining real estate market statistics, valuation measures, and Compass report disclaimers.


WORK WITH US

We offer the highest level of service and expertise to our clients. Our team has built a reputation for consistently representing the finest real estate in San Francisco and Napa Valley. Results driven and dedicated to your success, whether buying, selling, renting or investing. Contact us today for a private consultation.

Contact Us