Santa Clara County - April 2024

Santa Clara County real estate report cover, featuring green hills and the April 2024 title.
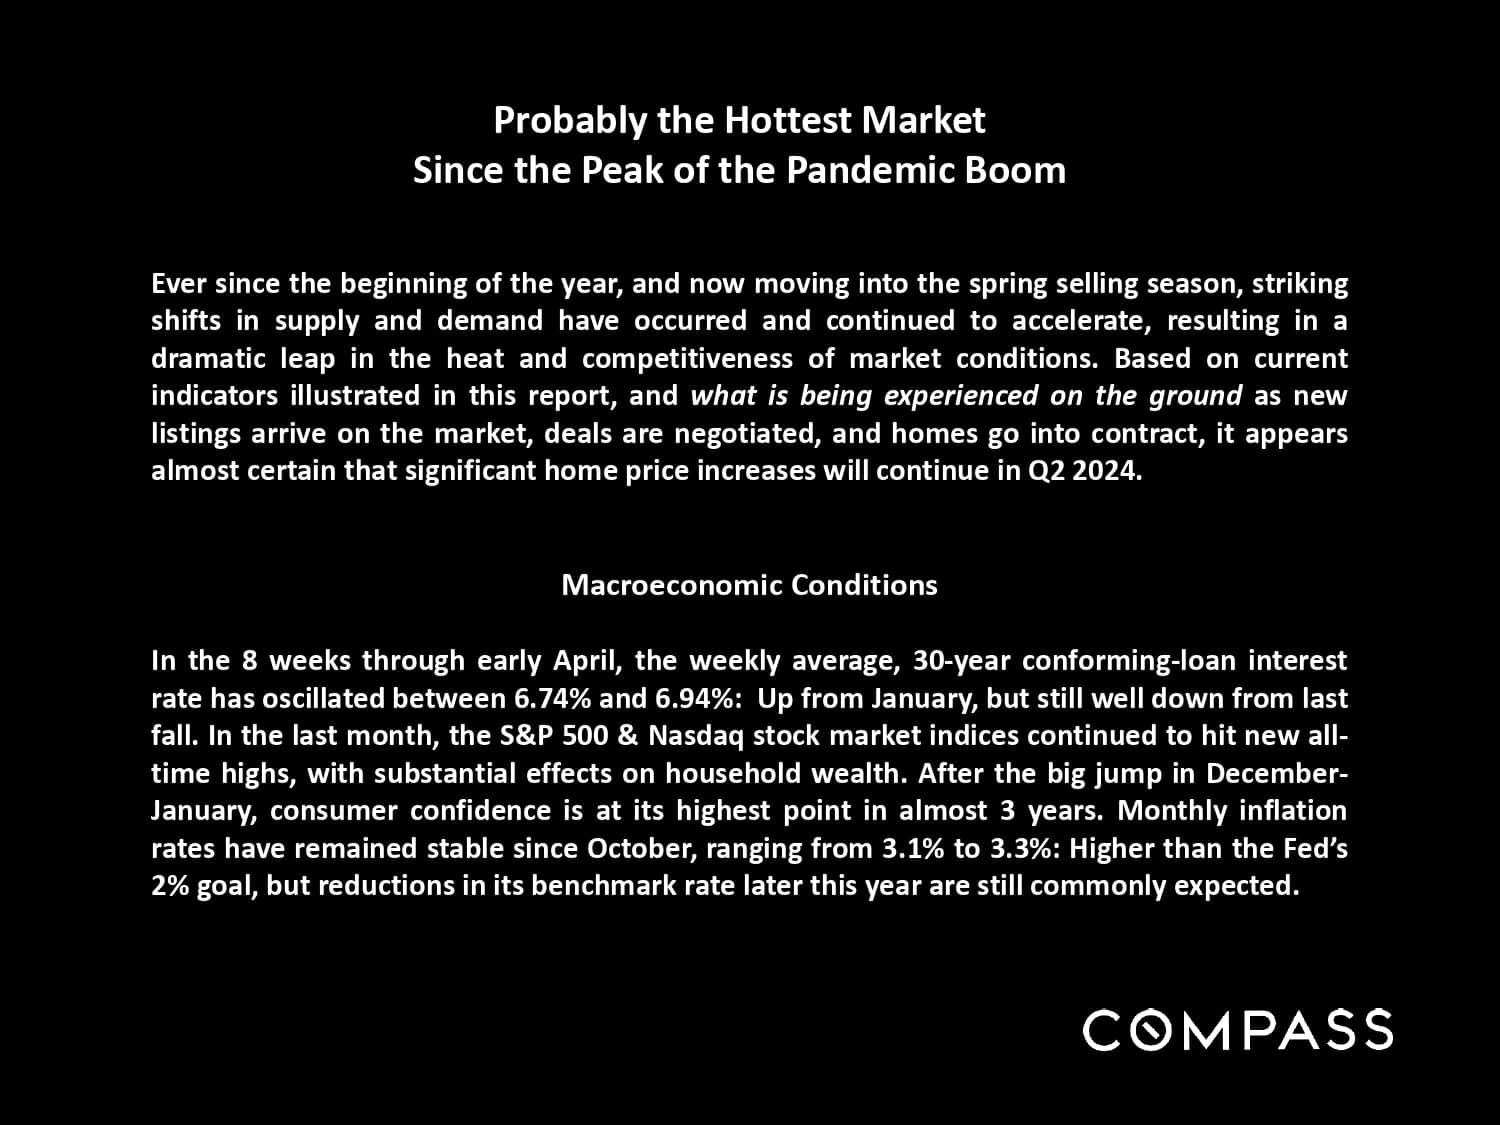
Santa Clara County market report page summarizing hot market conditions and macroeconomic indicators.
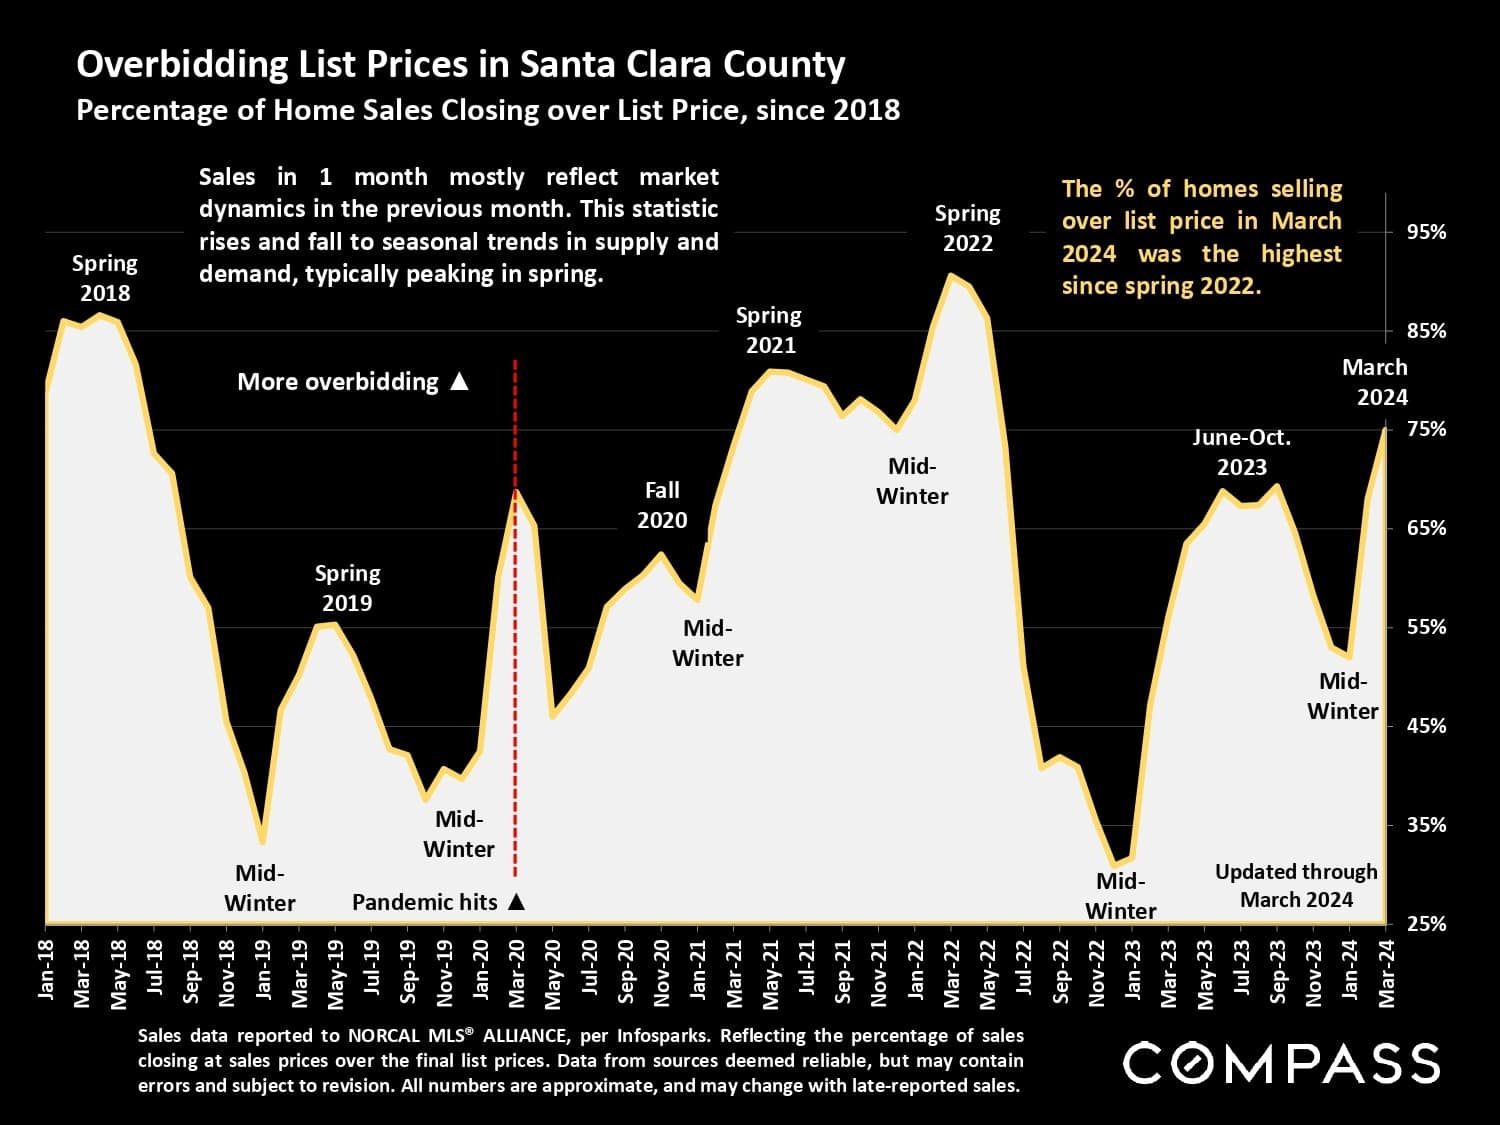
Chart of Santa Clara County home sales over list price, rising to 75% in March 2024.
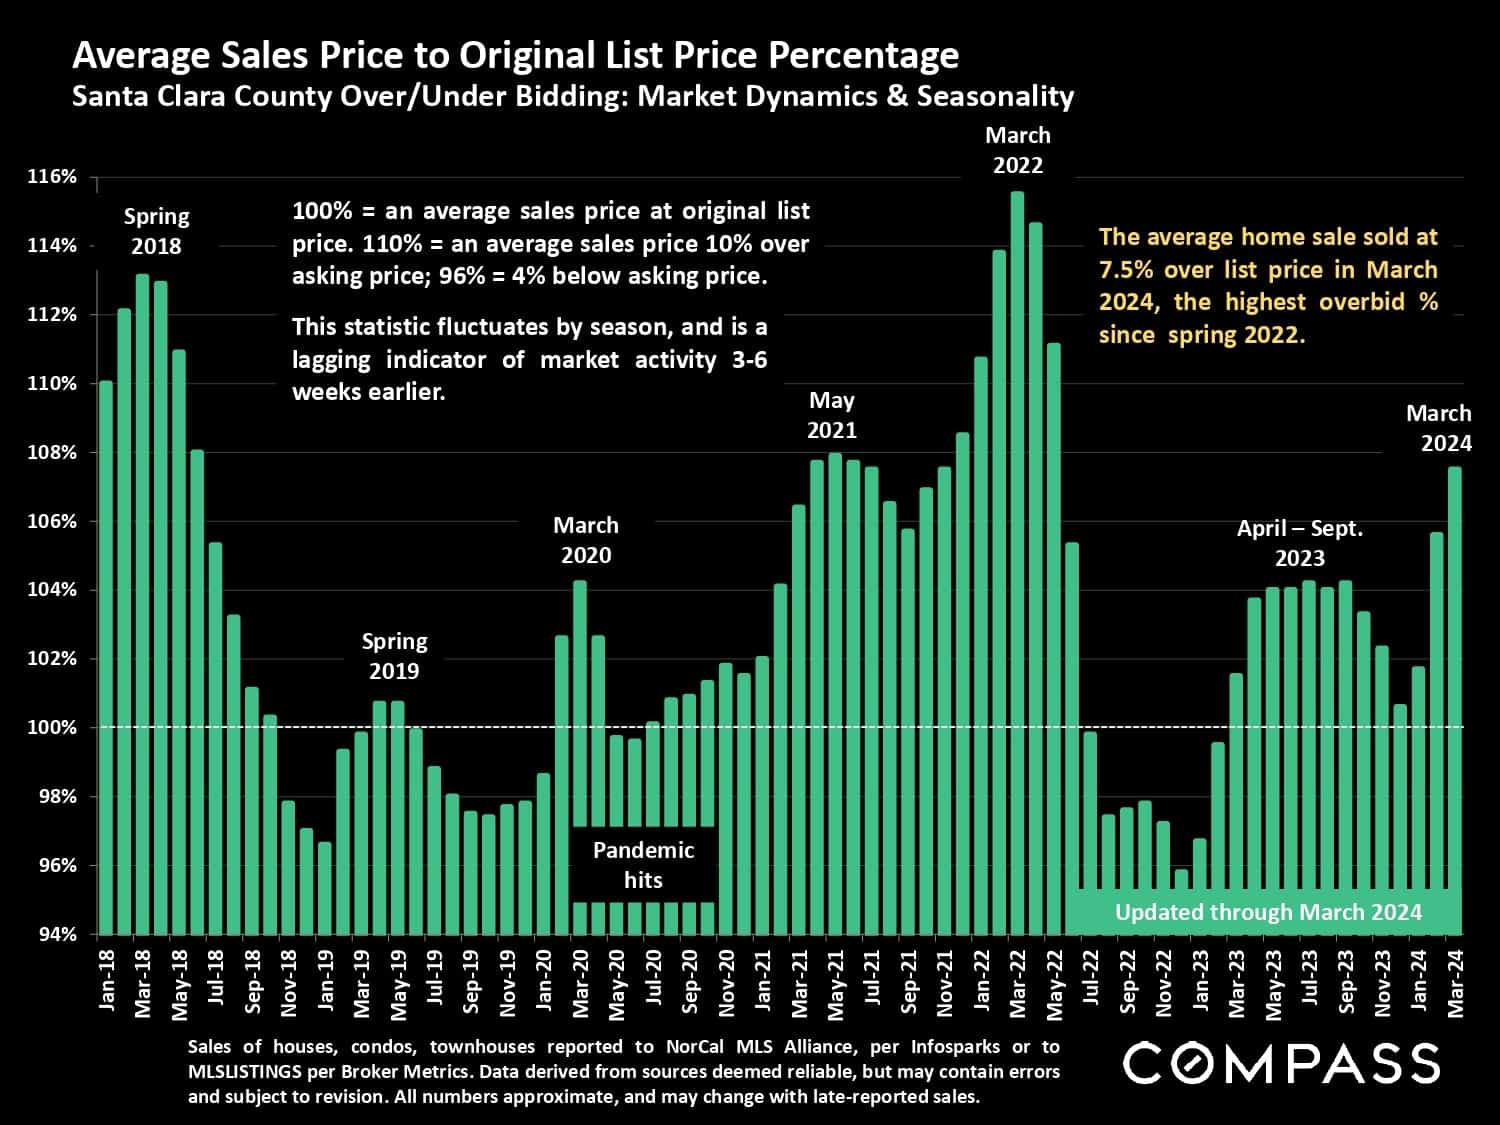
Santa Clara County home sale-to-list price percentages, January 2018–March 2024.
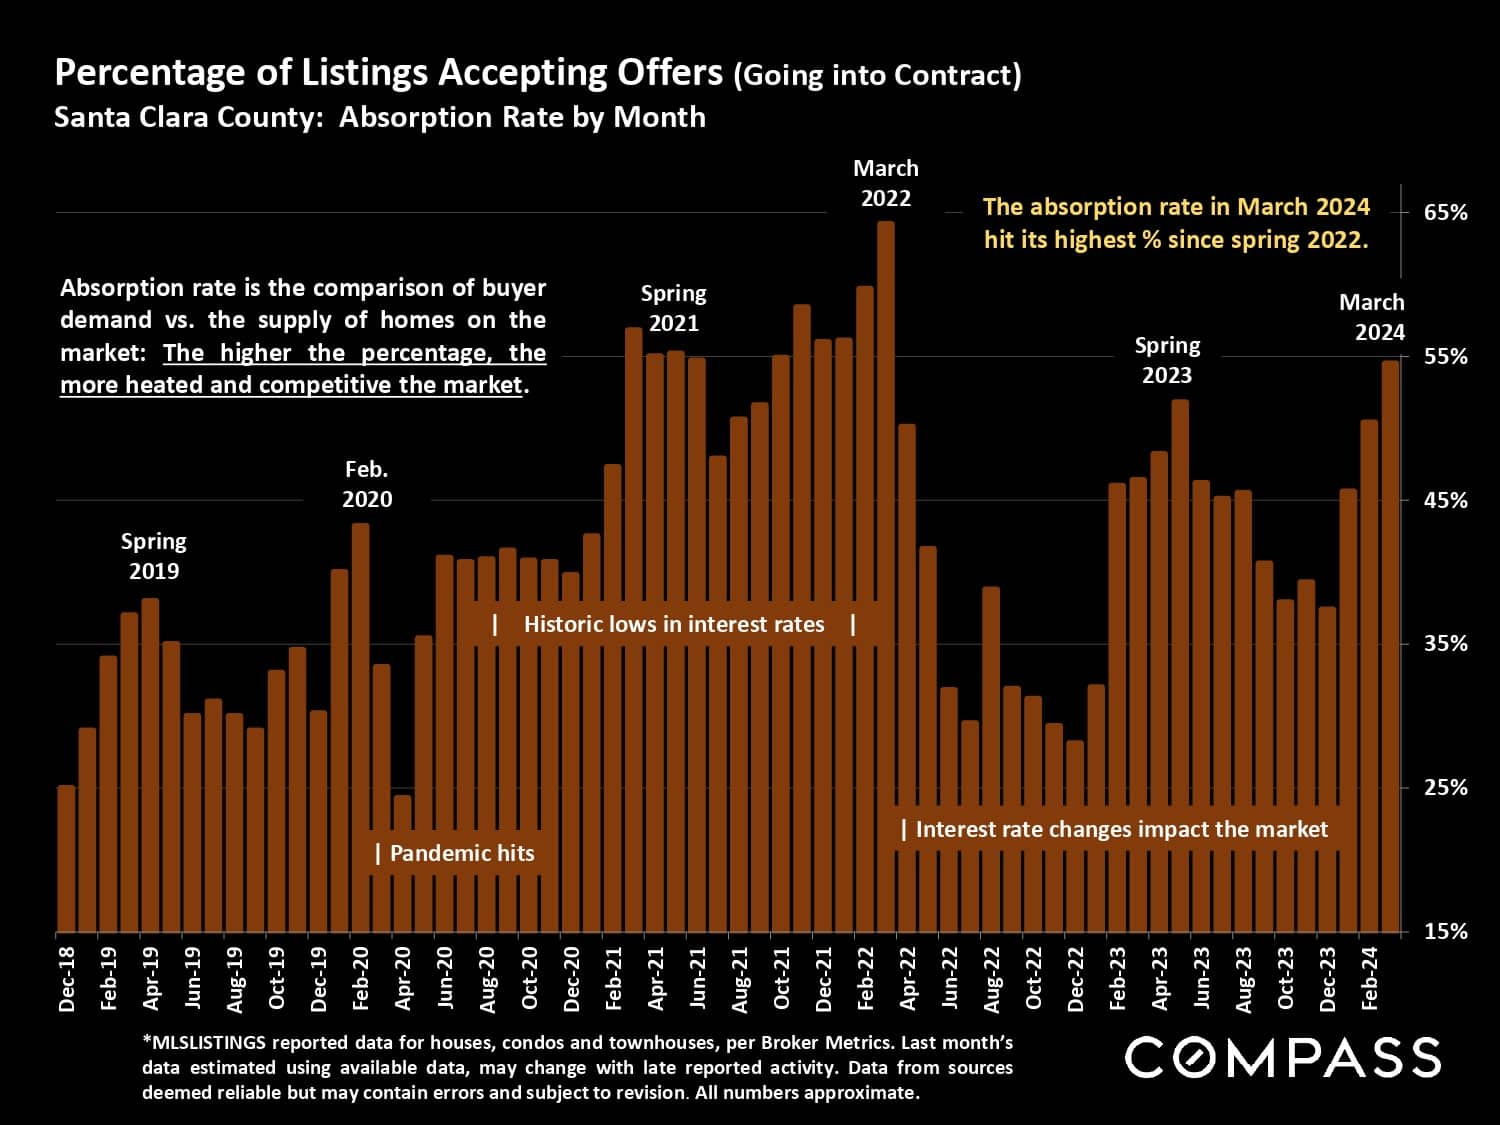
Santa Clara County monthly home-listing absorption rates, with March 2024 highest since spring 2022.
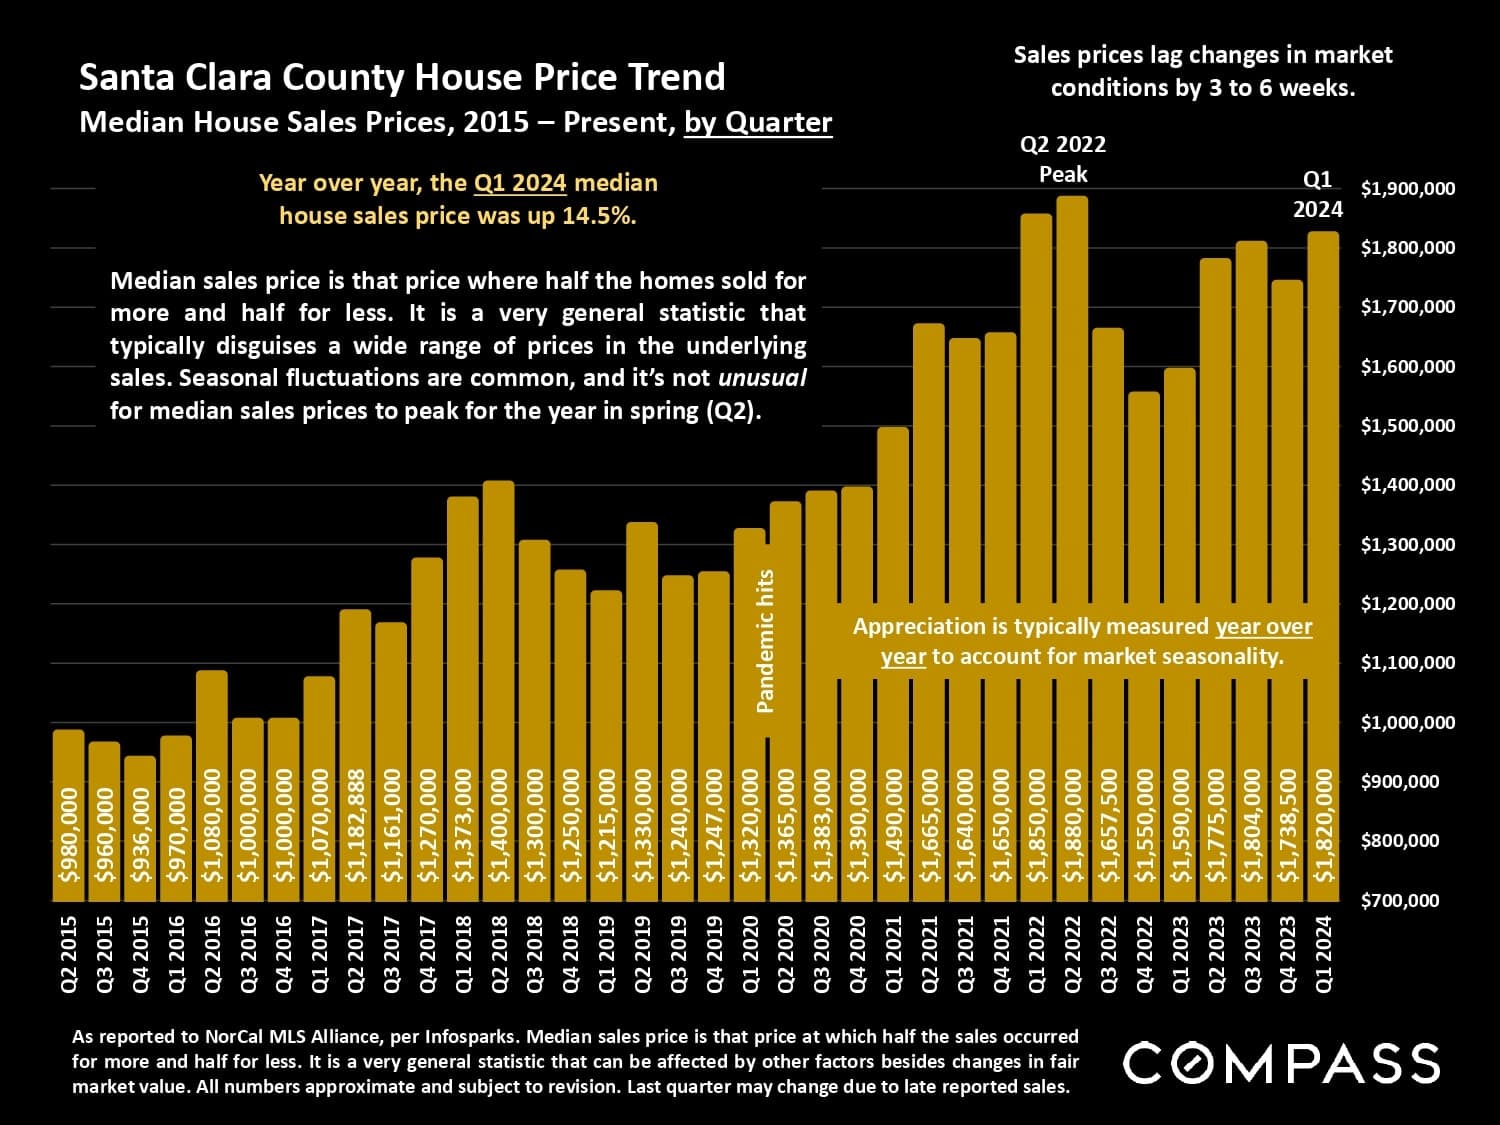
Santa Clara County quarterly median home prices, 2015–2024, with Q1 2024 at $1.82 million.
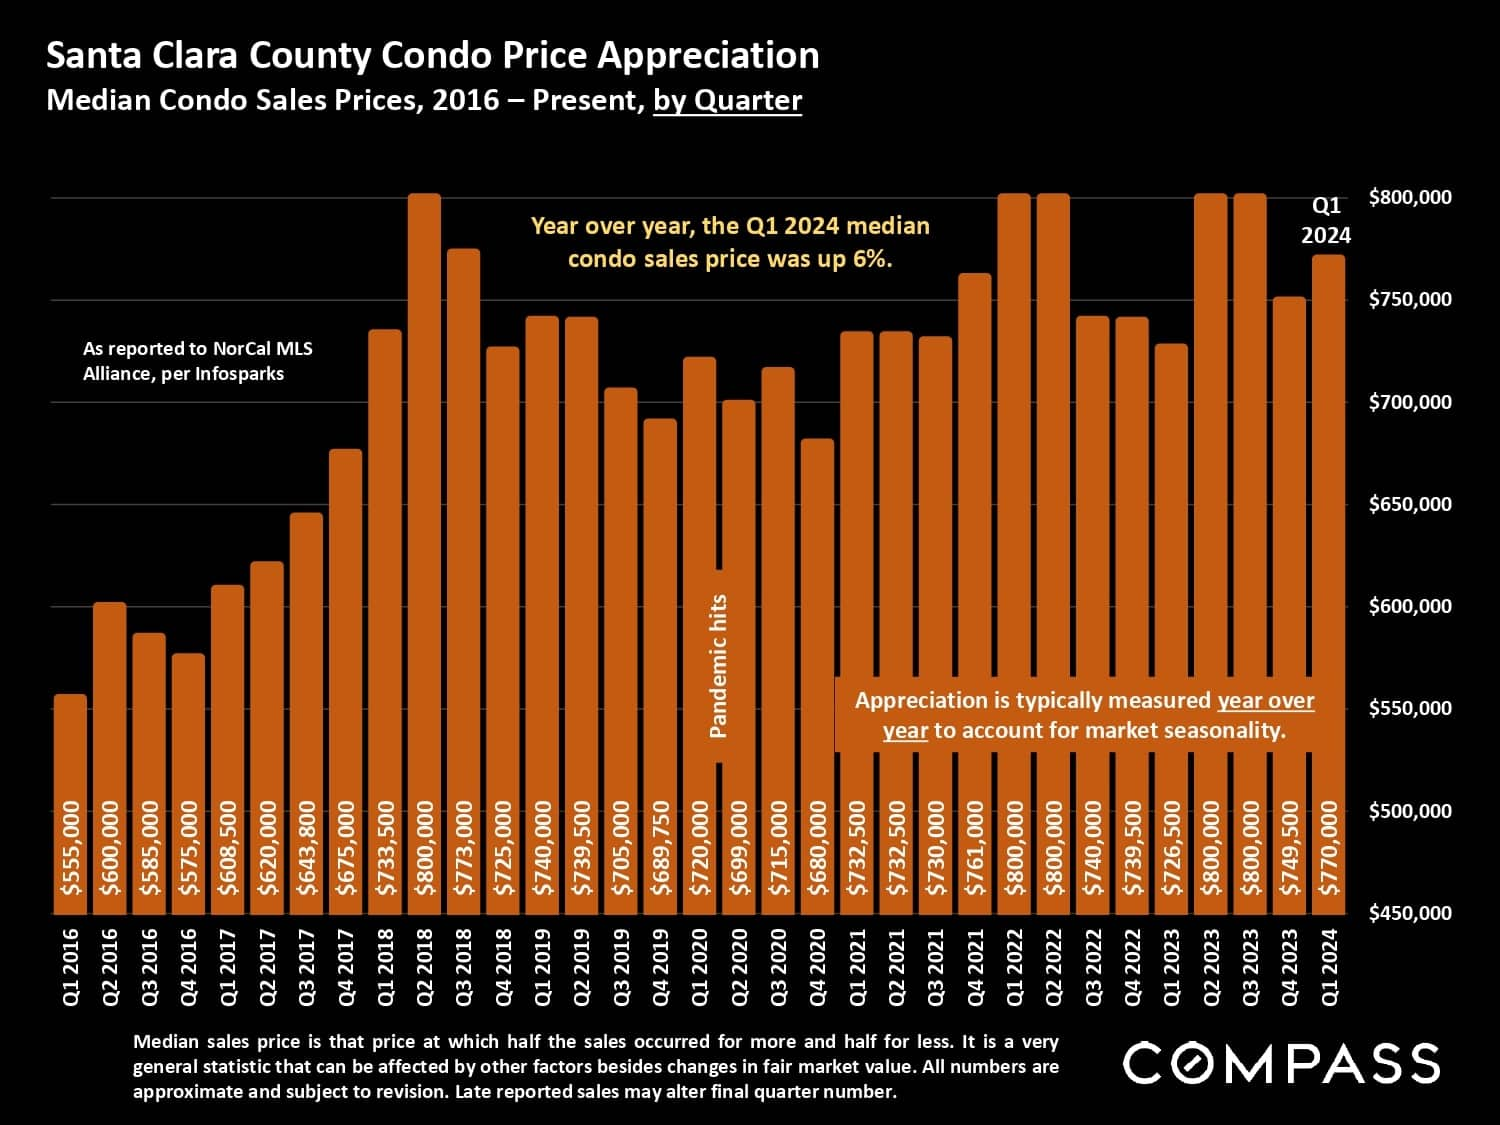
Santa Clara County condo prices, quarterly 2016–Q1 2024; latest quarter up 6% year over year.
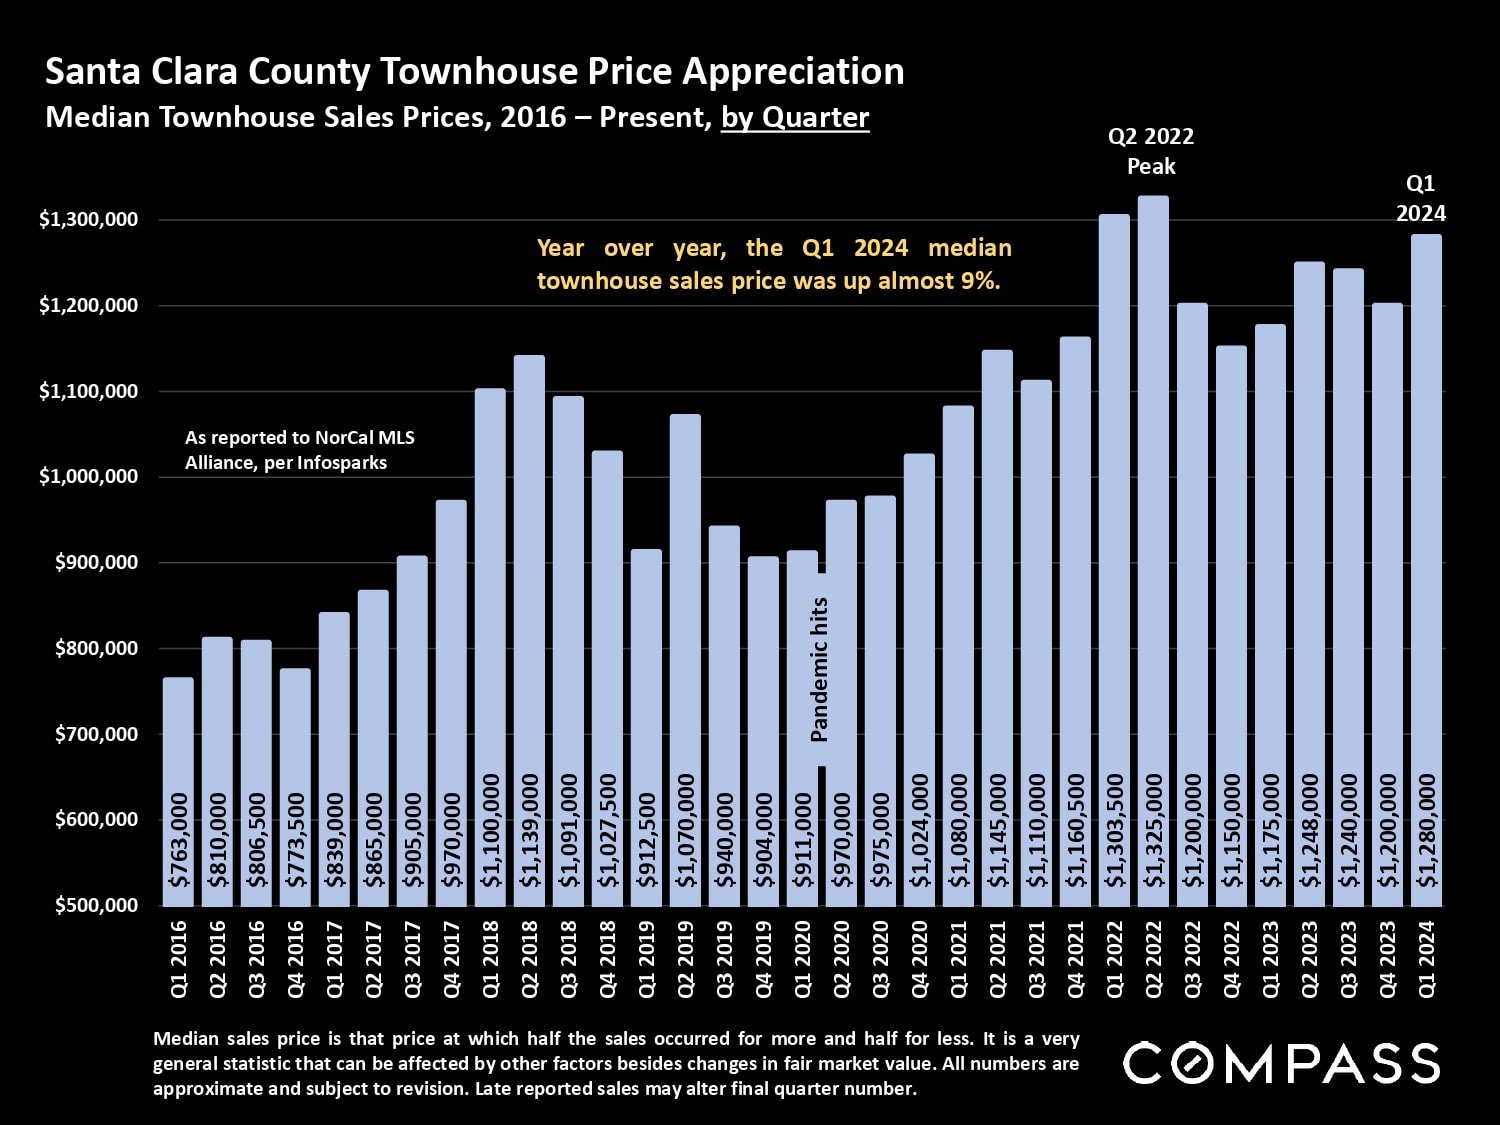
Santa Clara County townhouse price chart shows quarterly median prices rising to $1.28 million in Q1 2024.
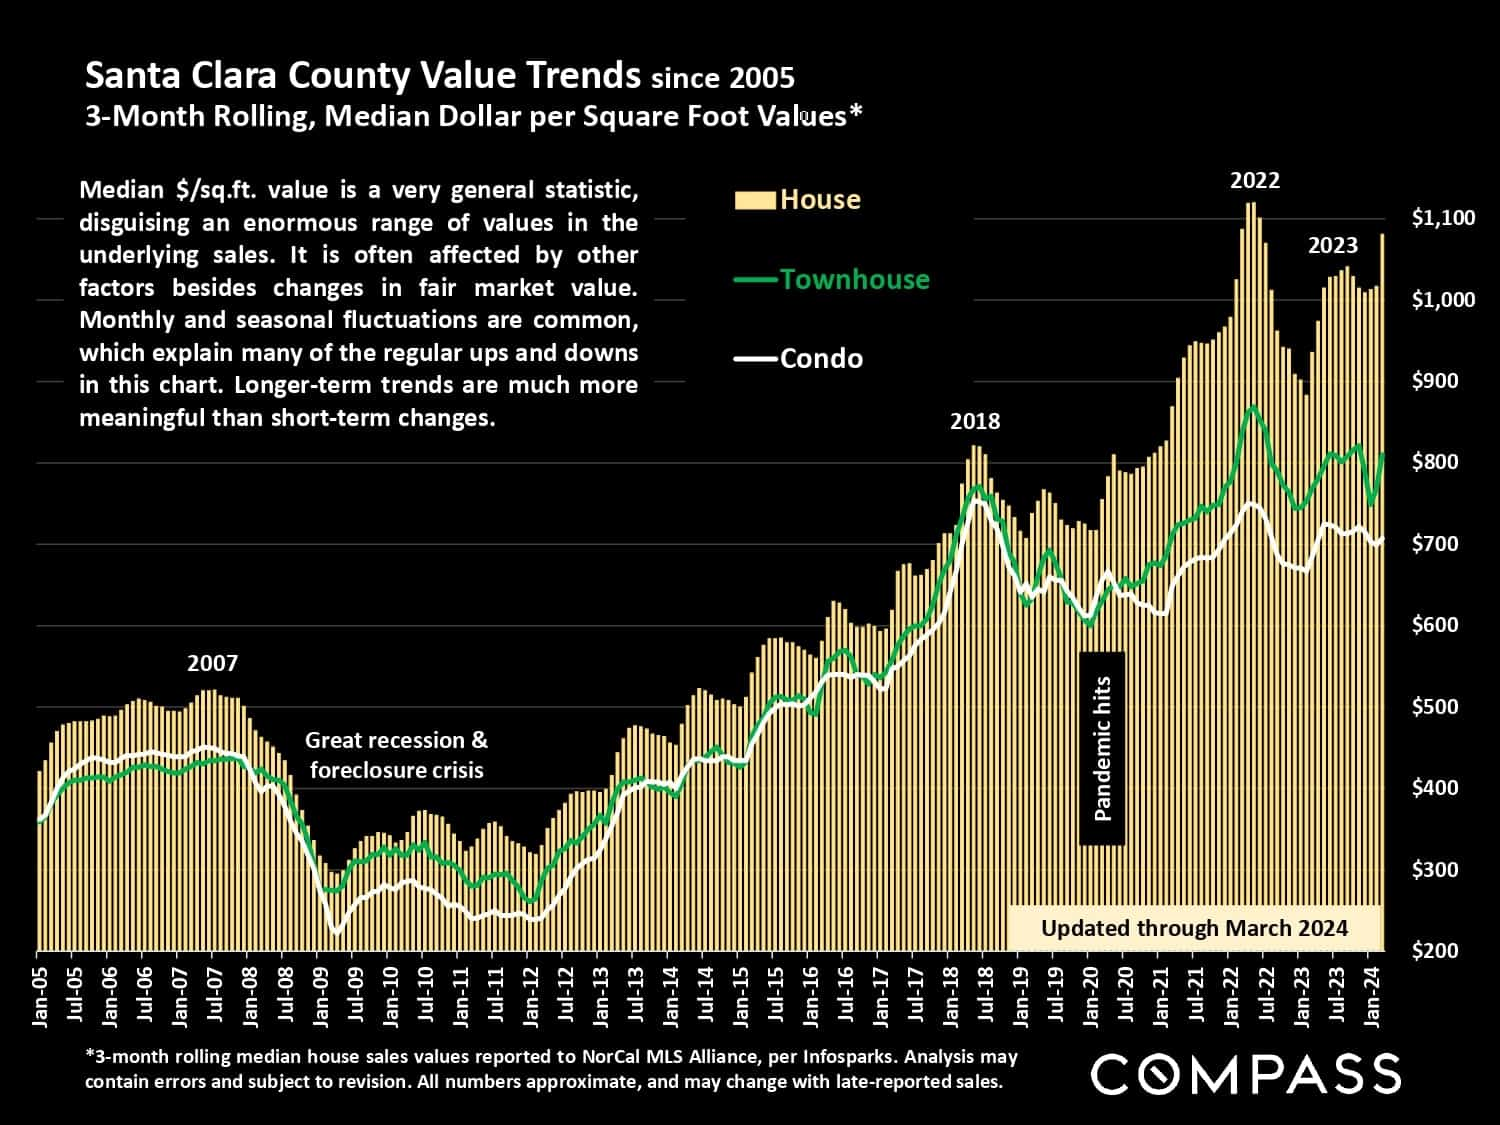
Santa Clara County home, townhouse, and condo values per square foot from 2005 to March 2024.
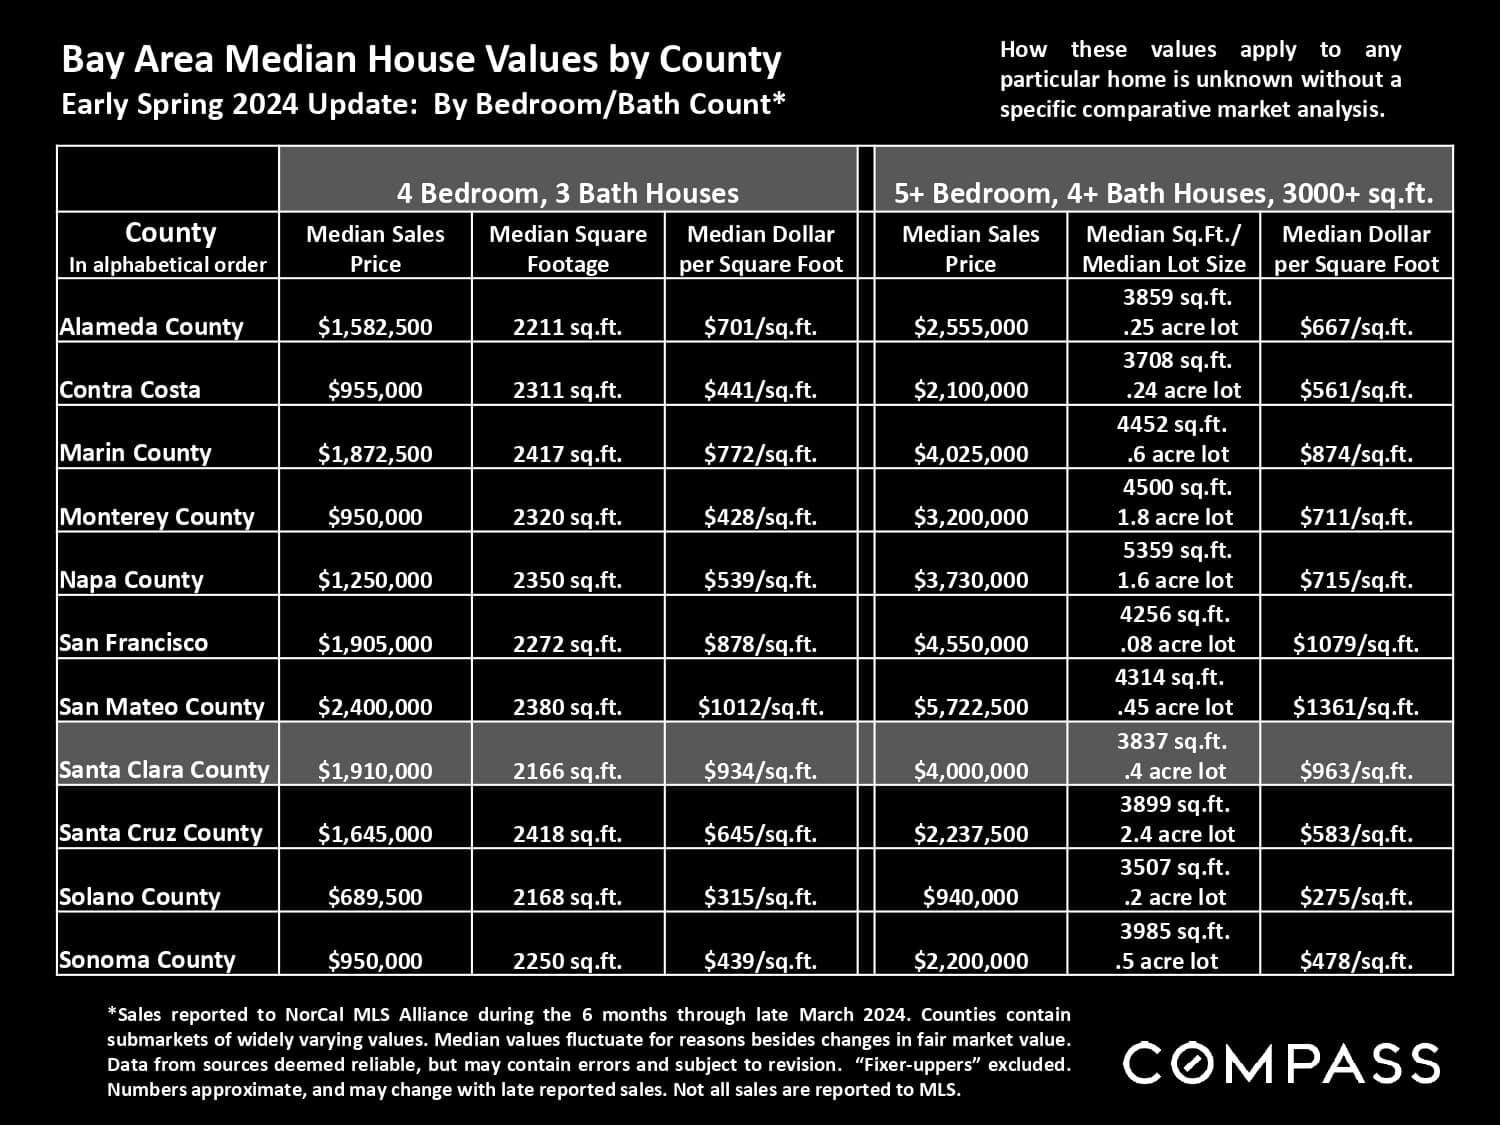
Chart comparing Bay Area county home values by bedroom and bath count, with Santa Clara County highlighted.
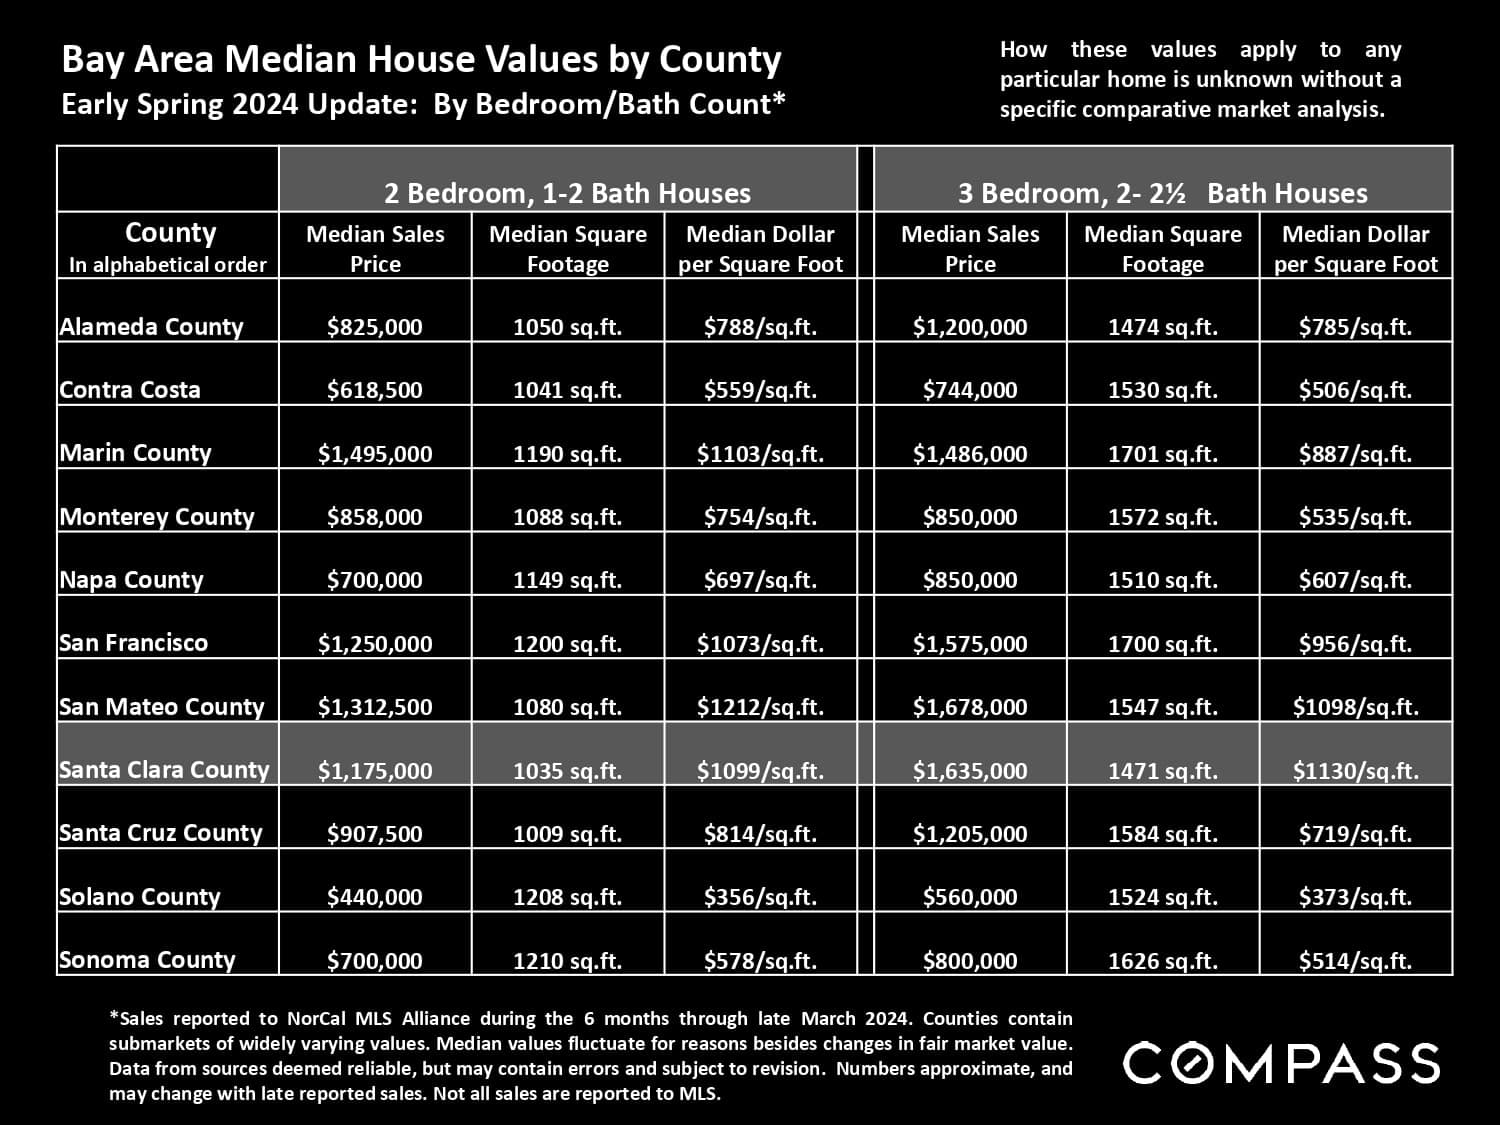
Bay Area county home-value table, with Santa Clara County highlighted for two- and three-bedroom homes.
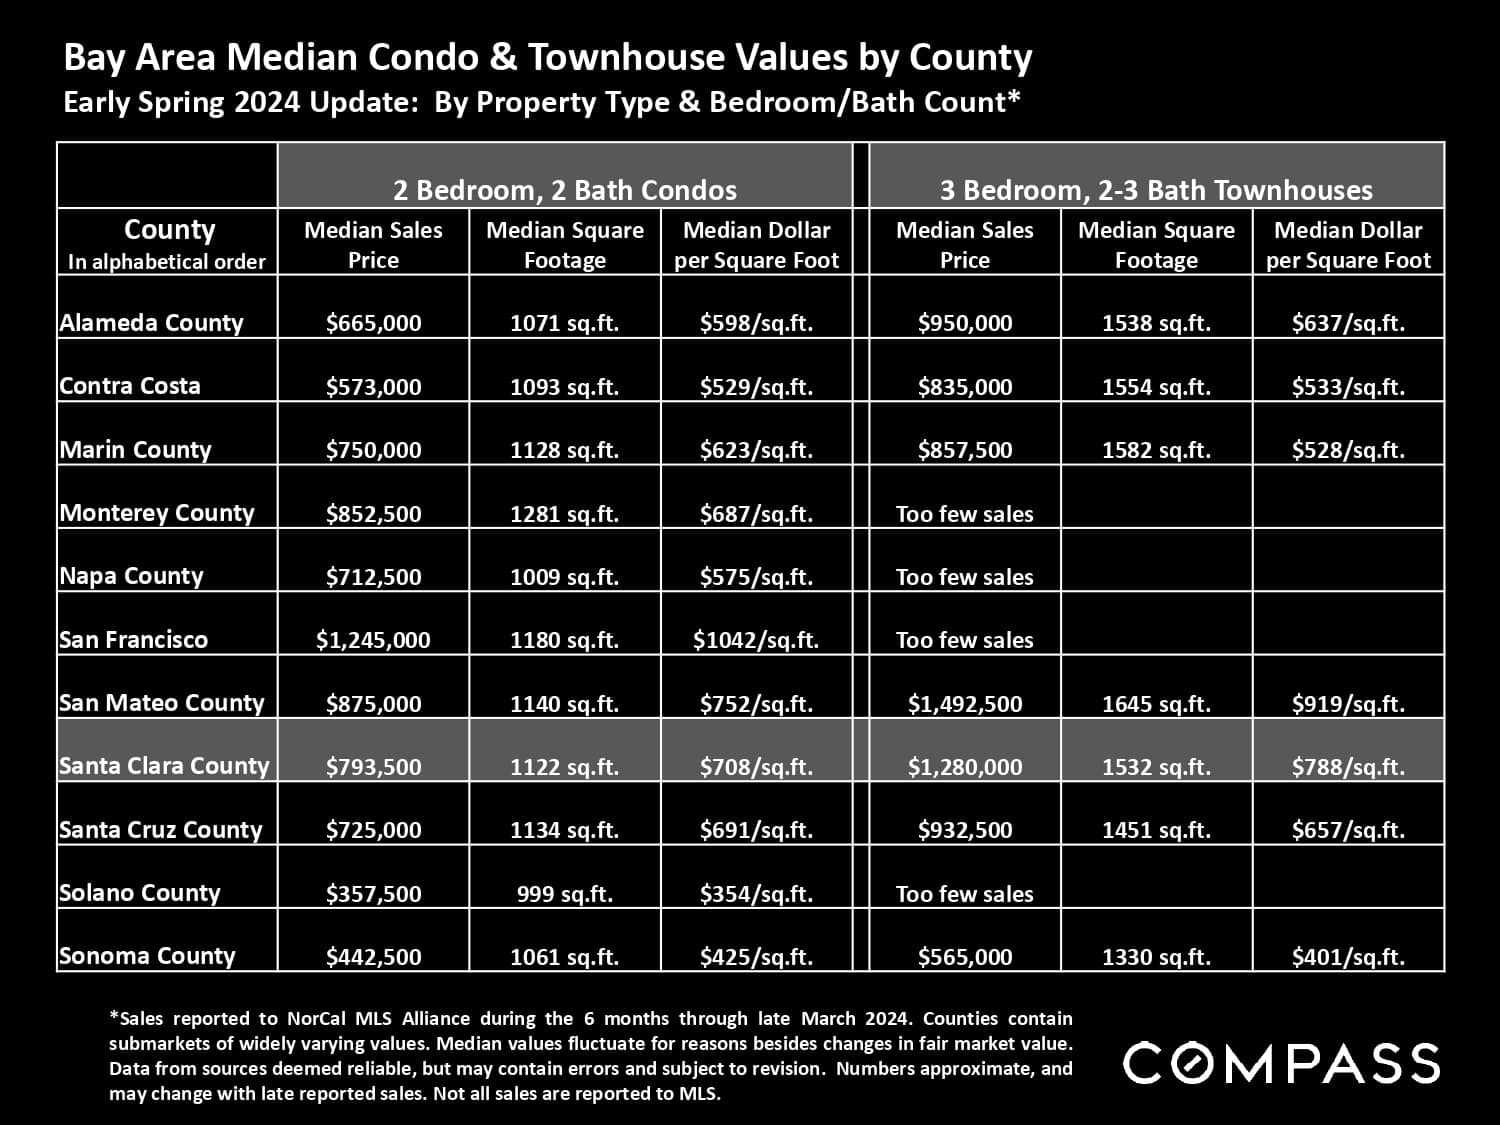
Bay Area condo and townhouse values by county; Santa Clara County is highlighted.
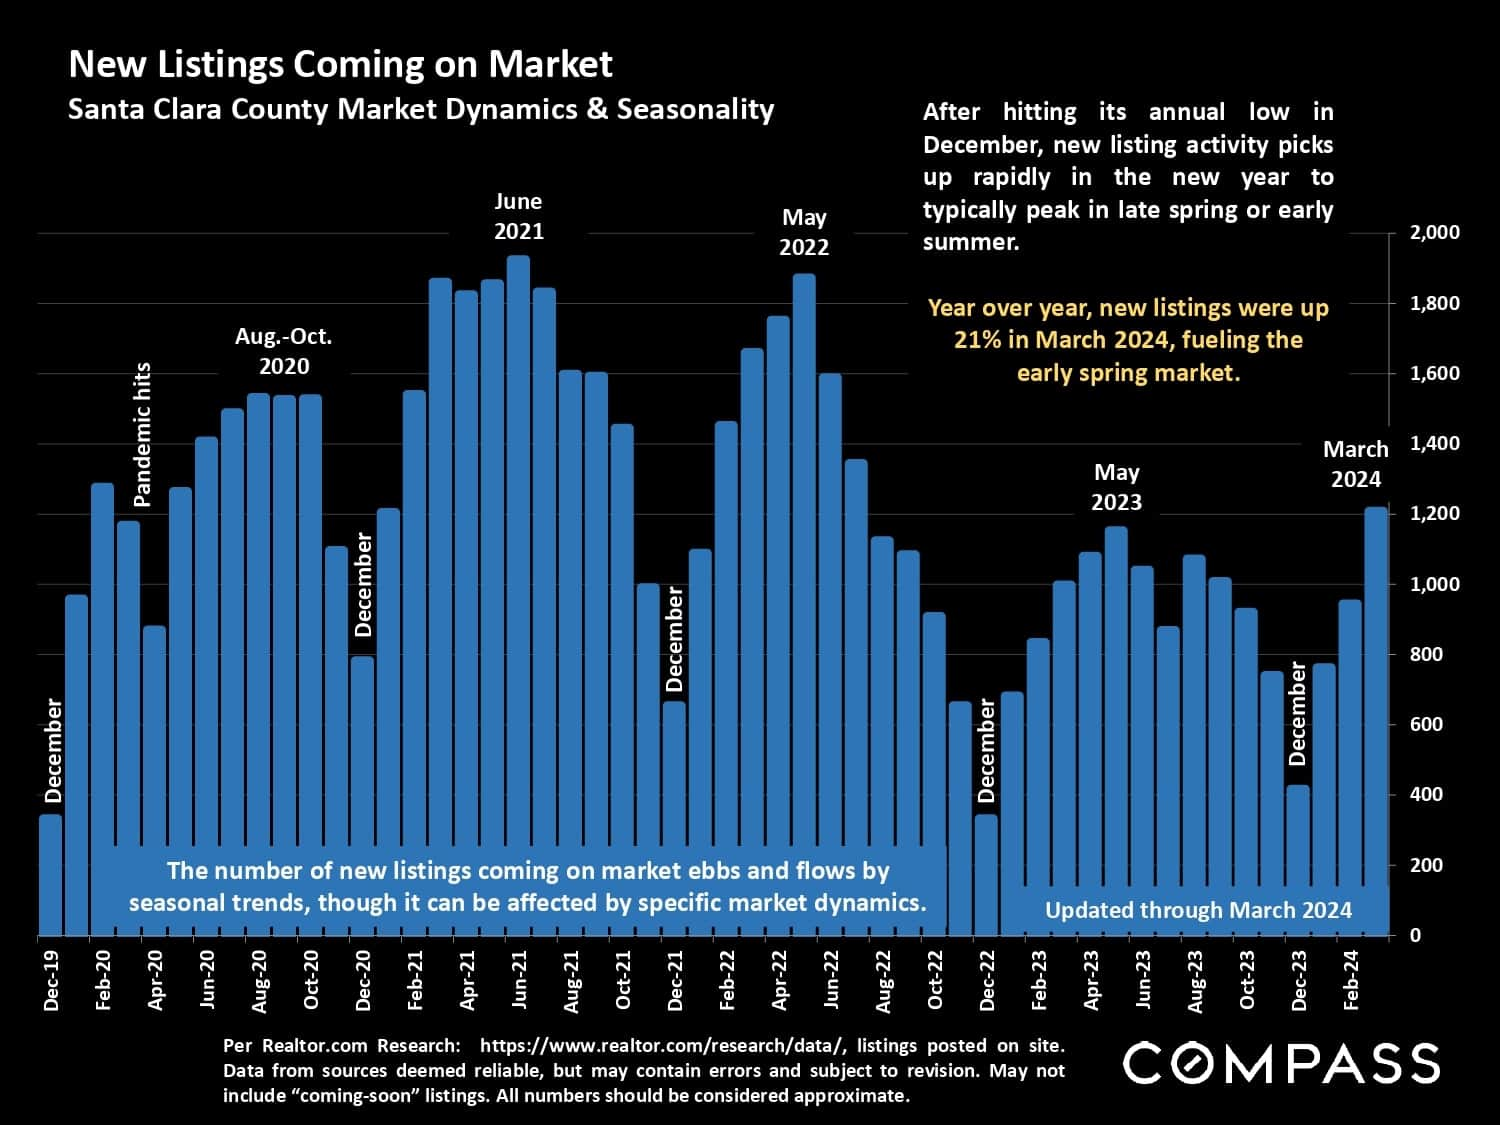
Santa Clara County new listings chart, December 2019 to March 2024, with seasonal peaks and a 21% year-over-year increase.
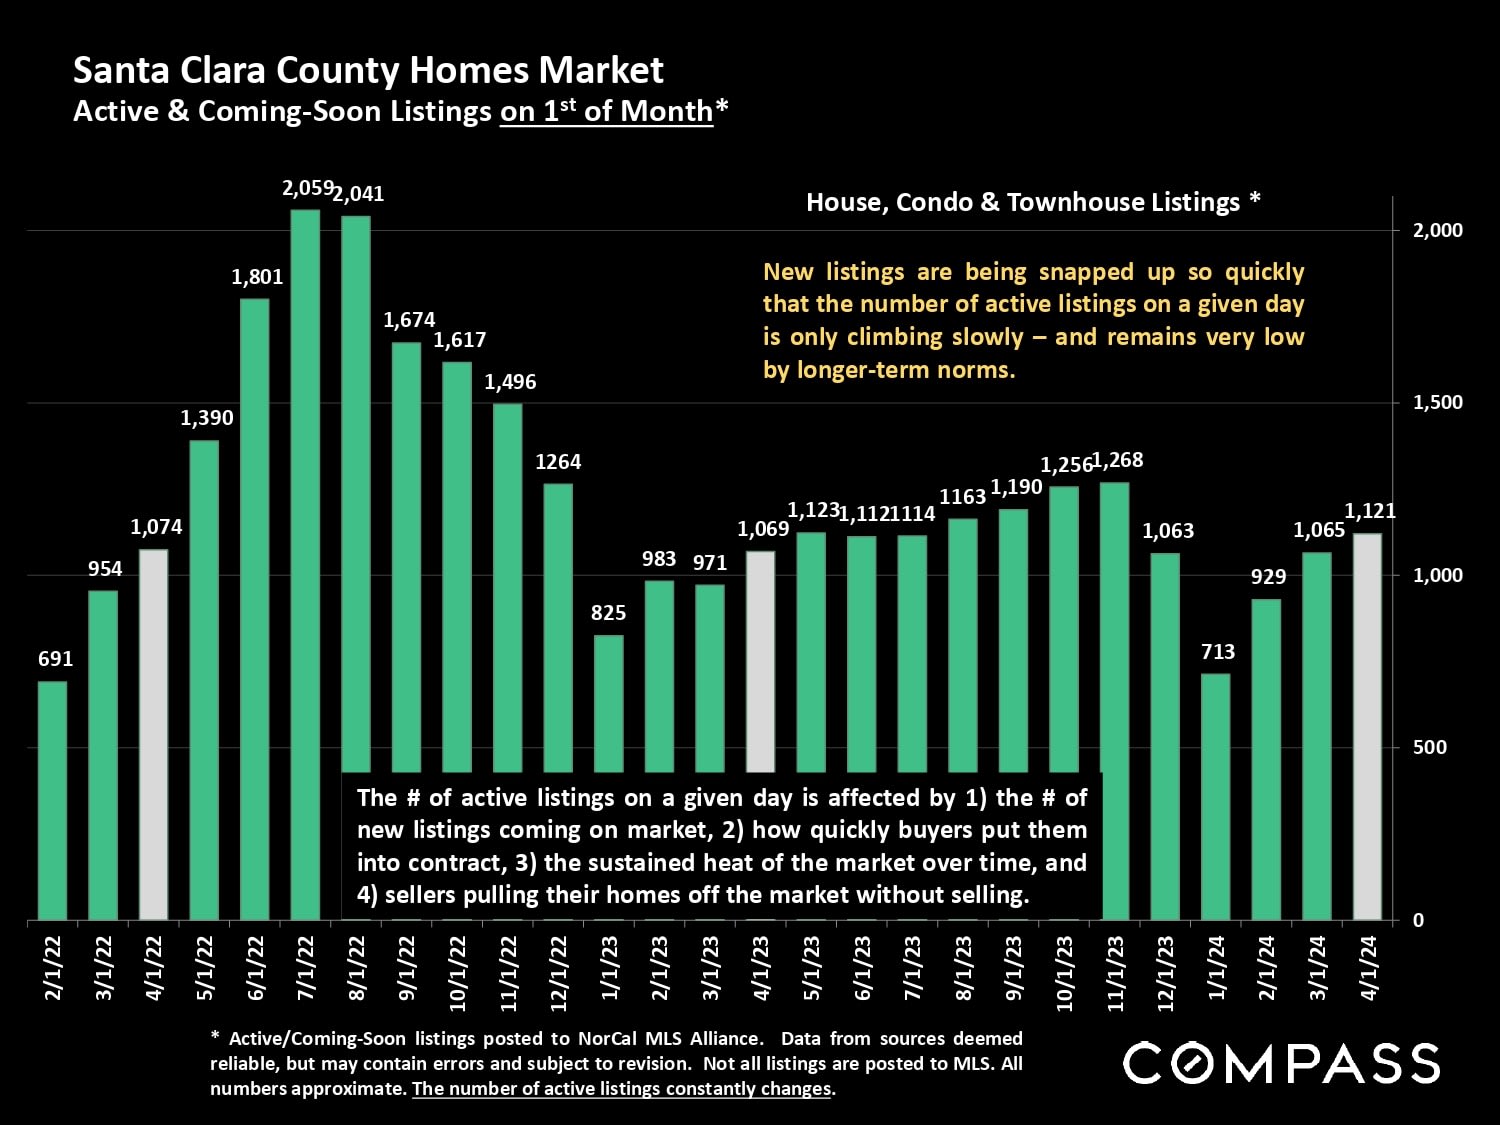
Bar chart of Santa Clara County active and coming-soon listings, peaking in July 2022 and ending at 1,121 in April 2024.
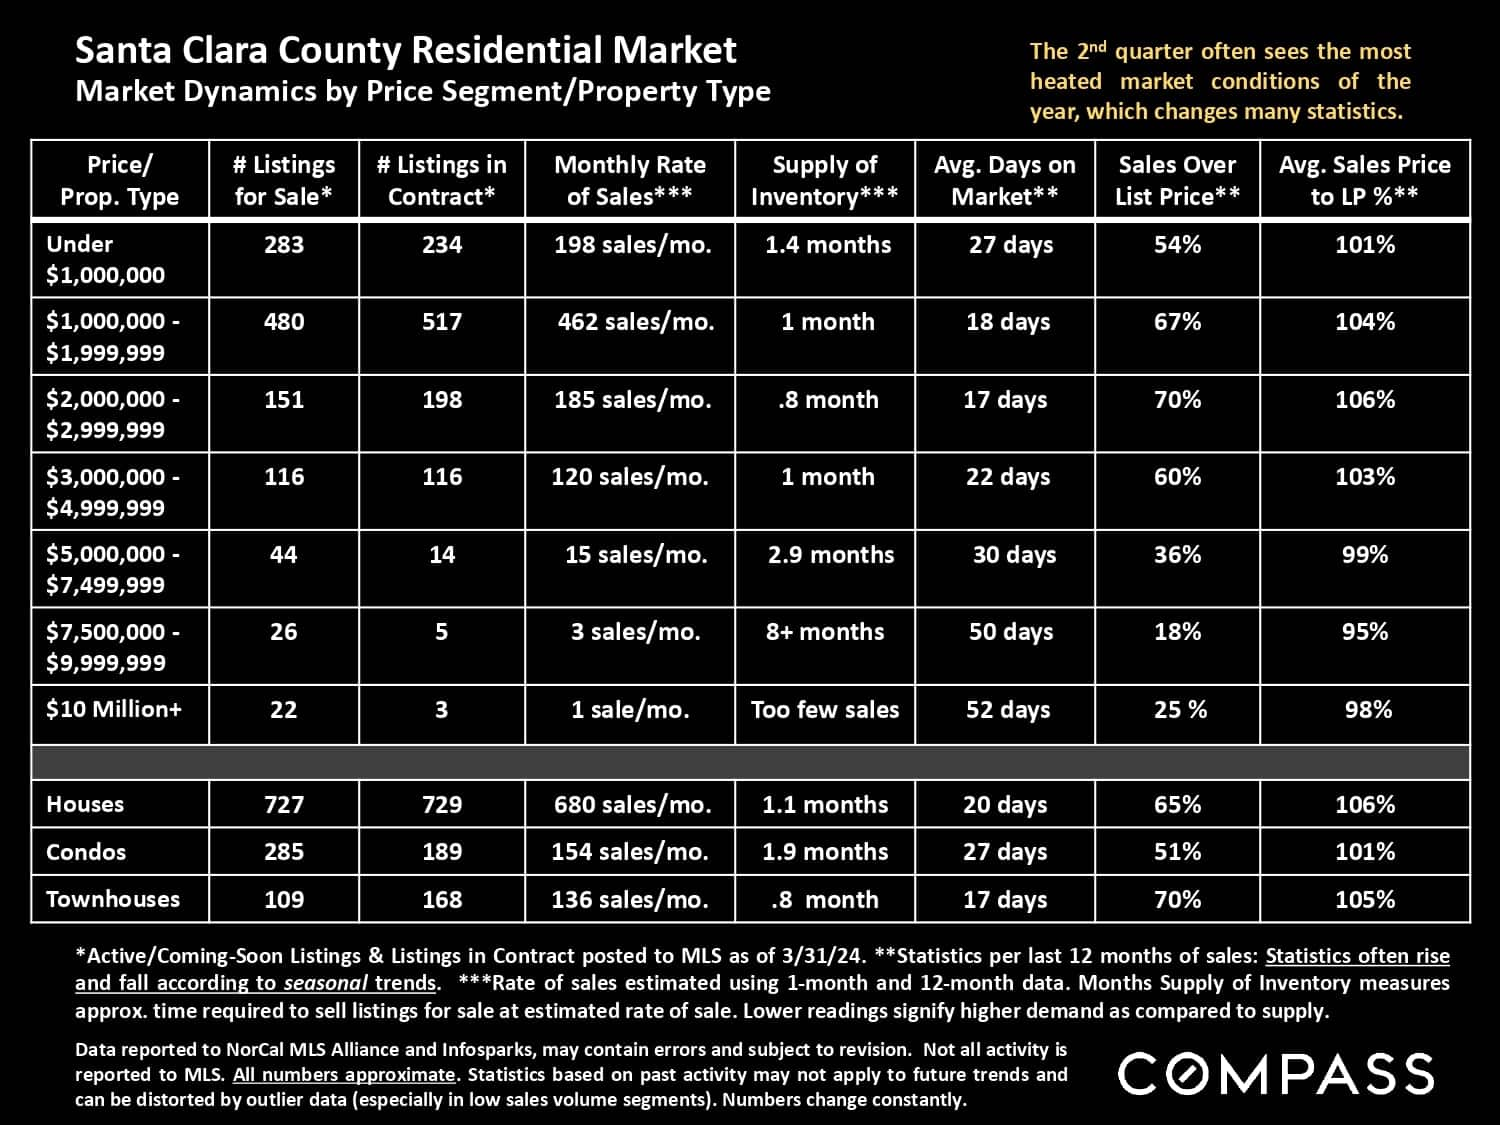
Santa Clara County April 2024 residential market statistics by price range and property type.
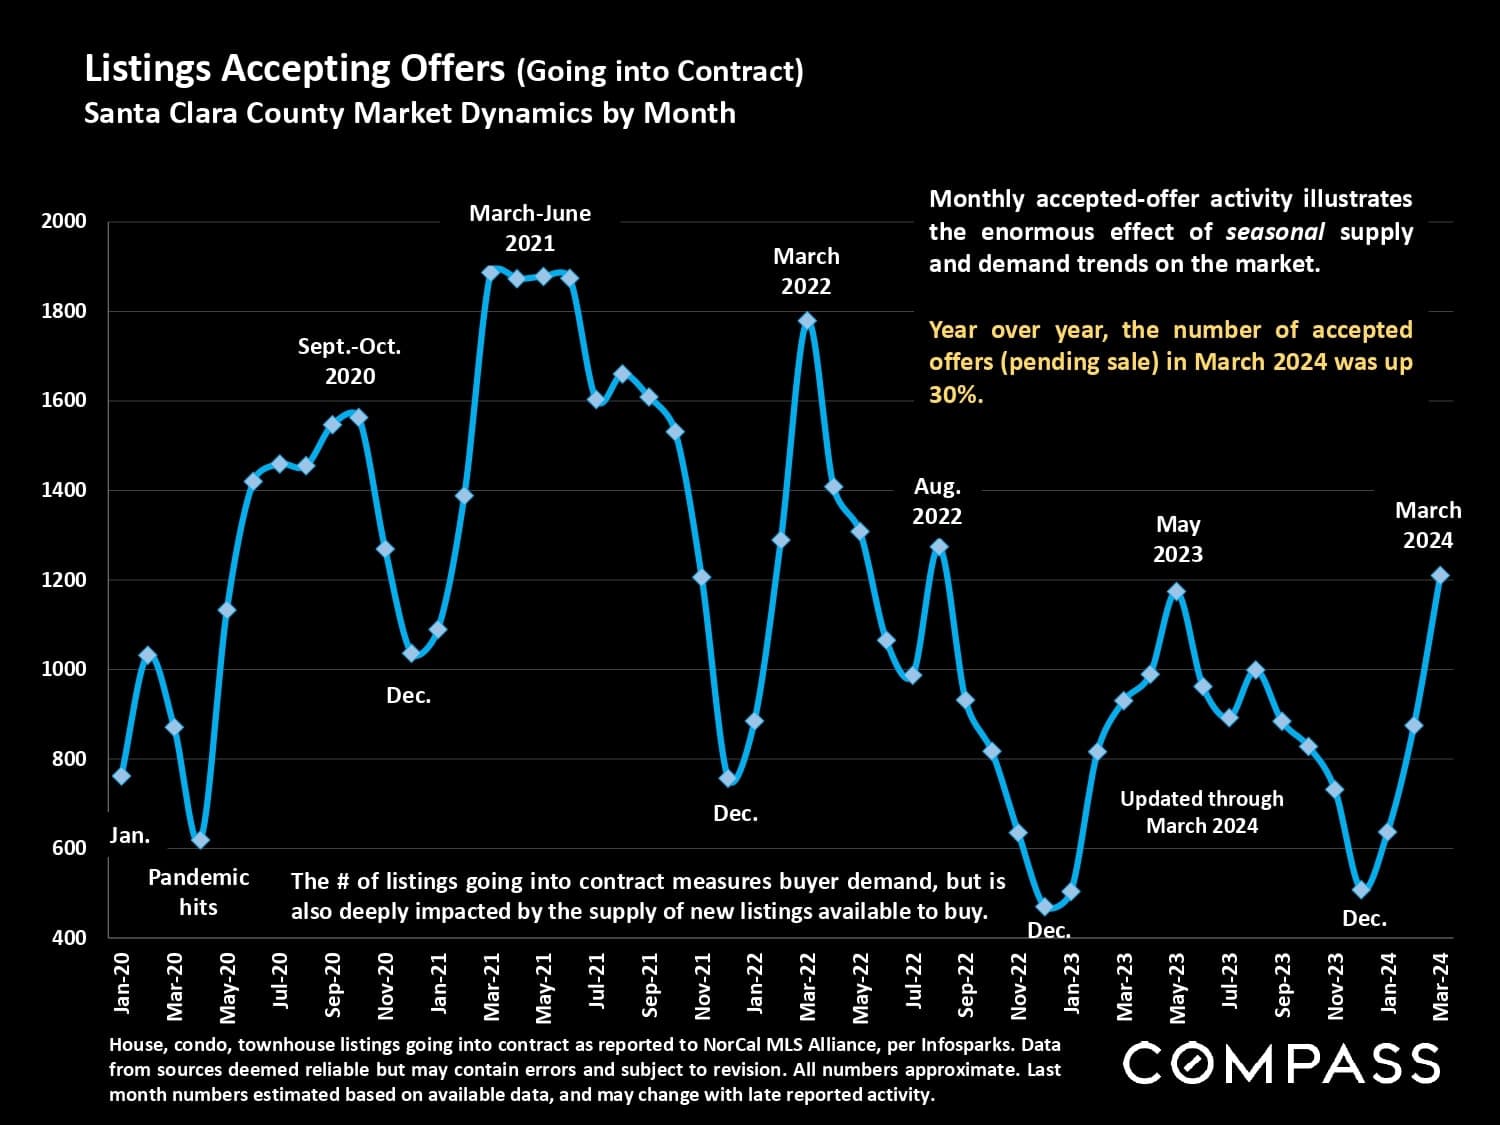
Santa Clara County accepted-offer activity, January 2020–March 2024; March 2024 was up 30% year over year.
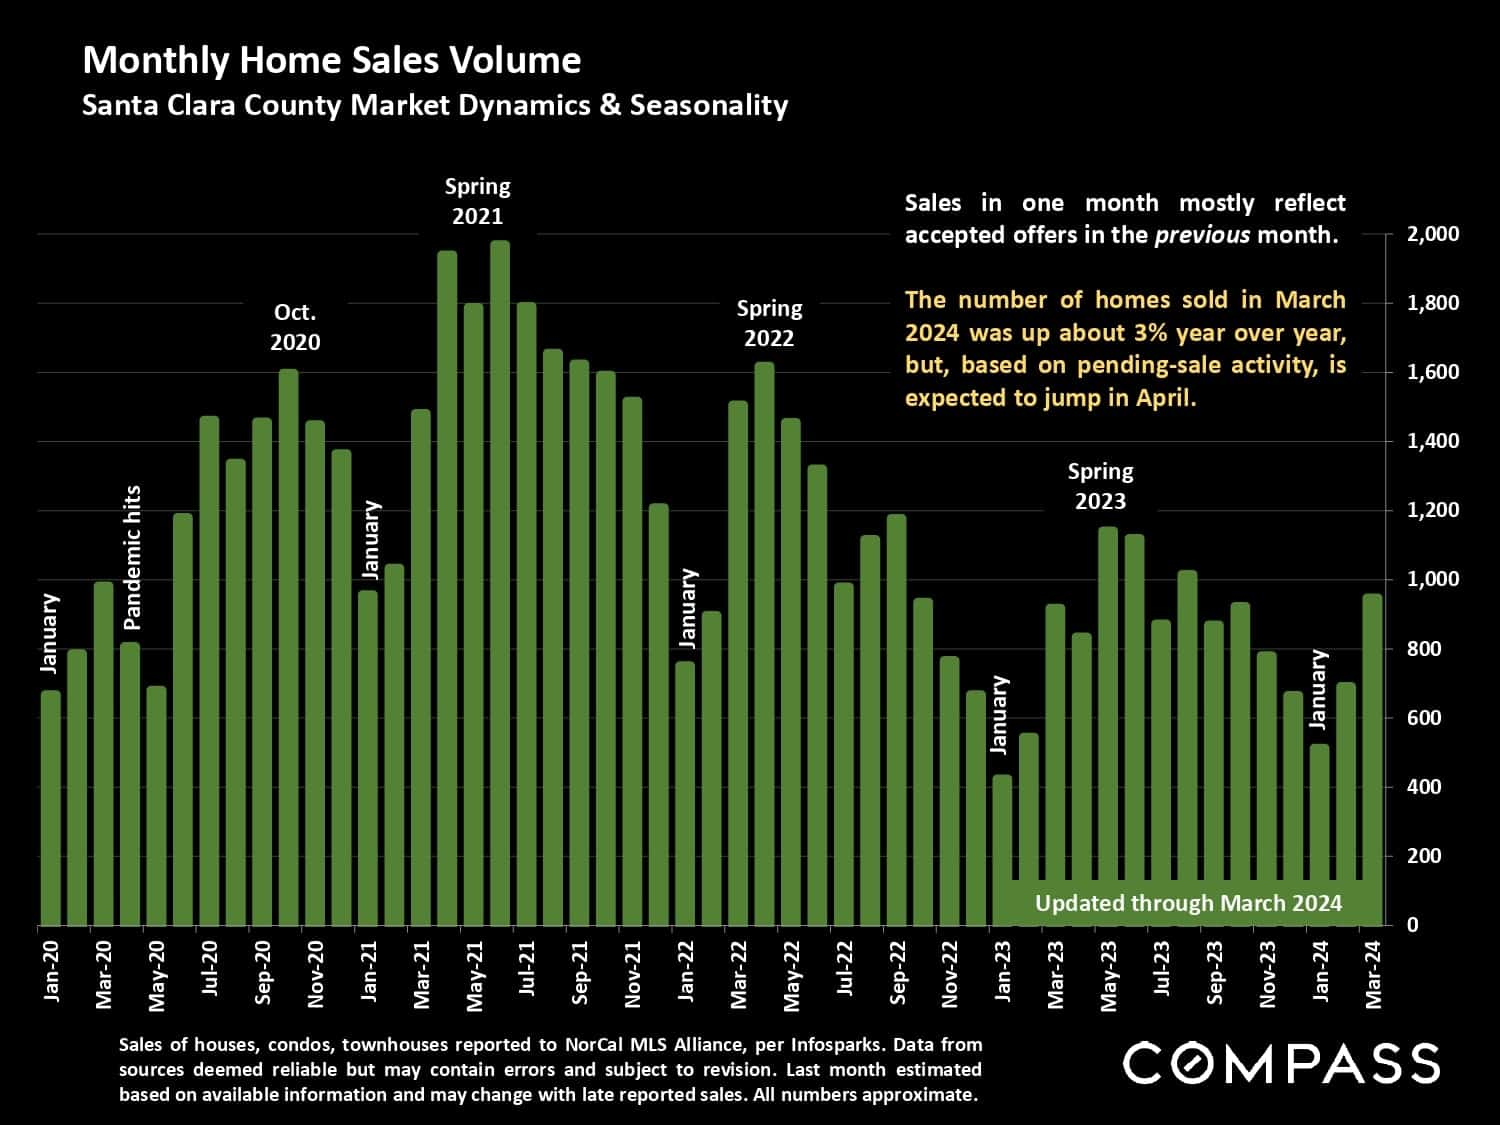
Santa Clara County monthly home sales chart, January 2020–March 2024, with spring seasonality and April outlook.
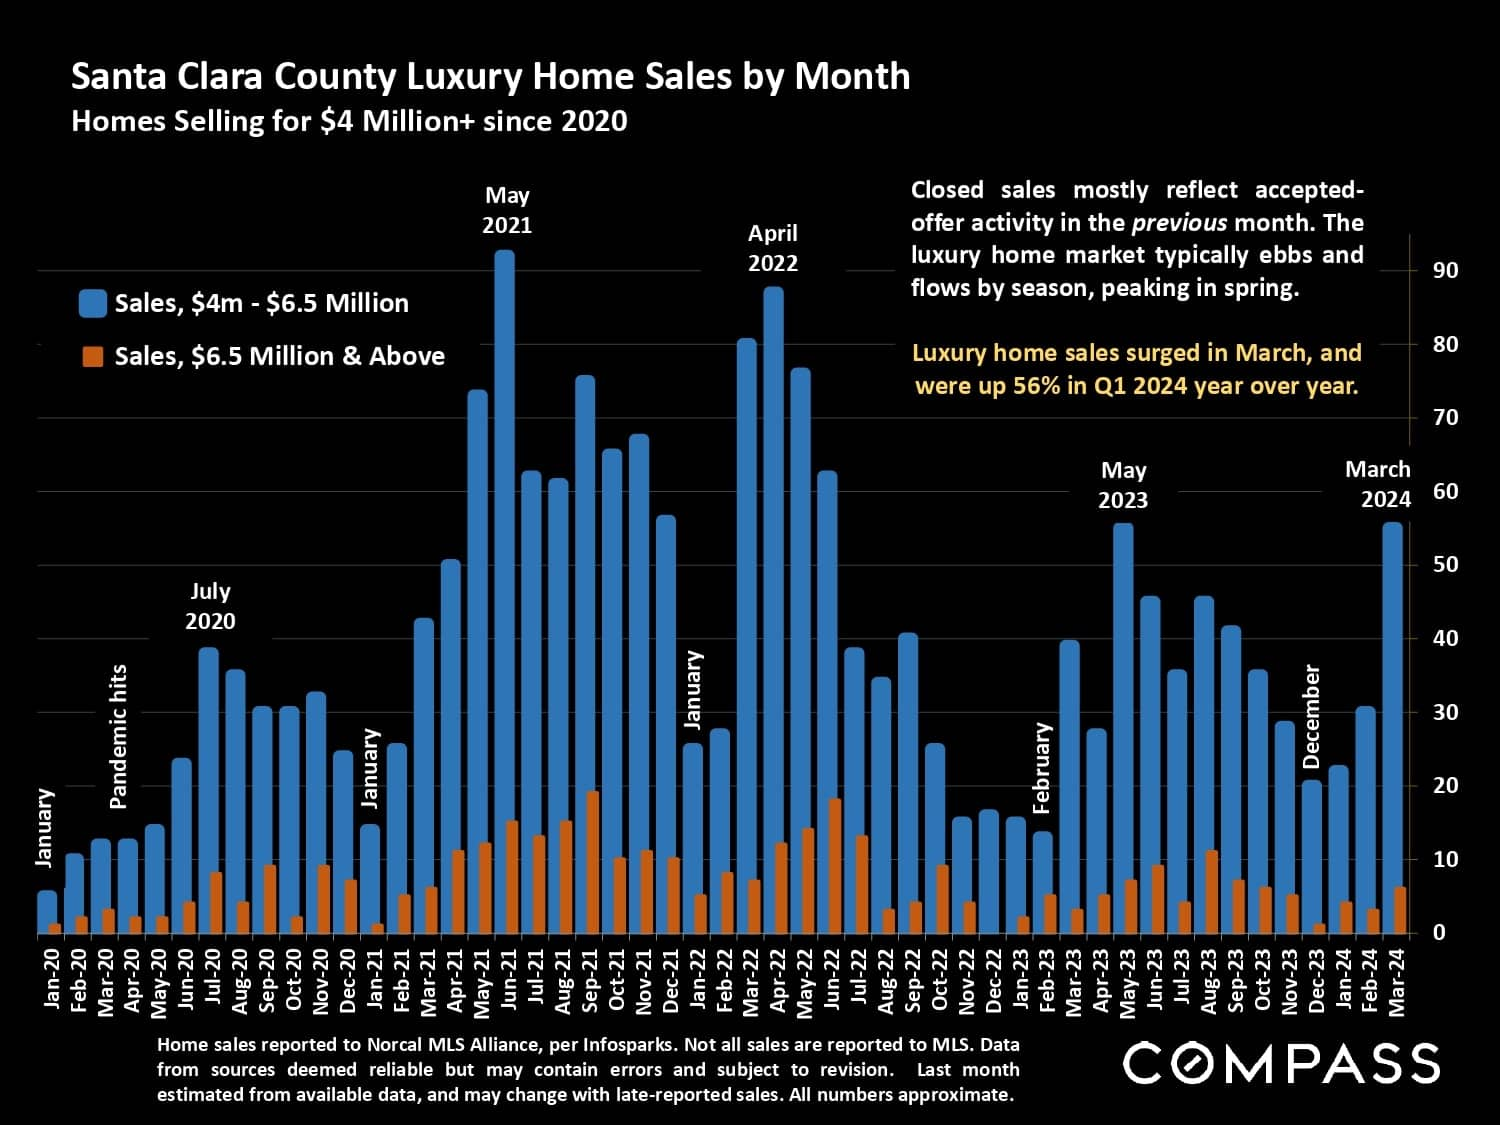
Santa Clara County monthly luxury home sales chart, with blue and orange bars and a March 2024 sales increase annotation.
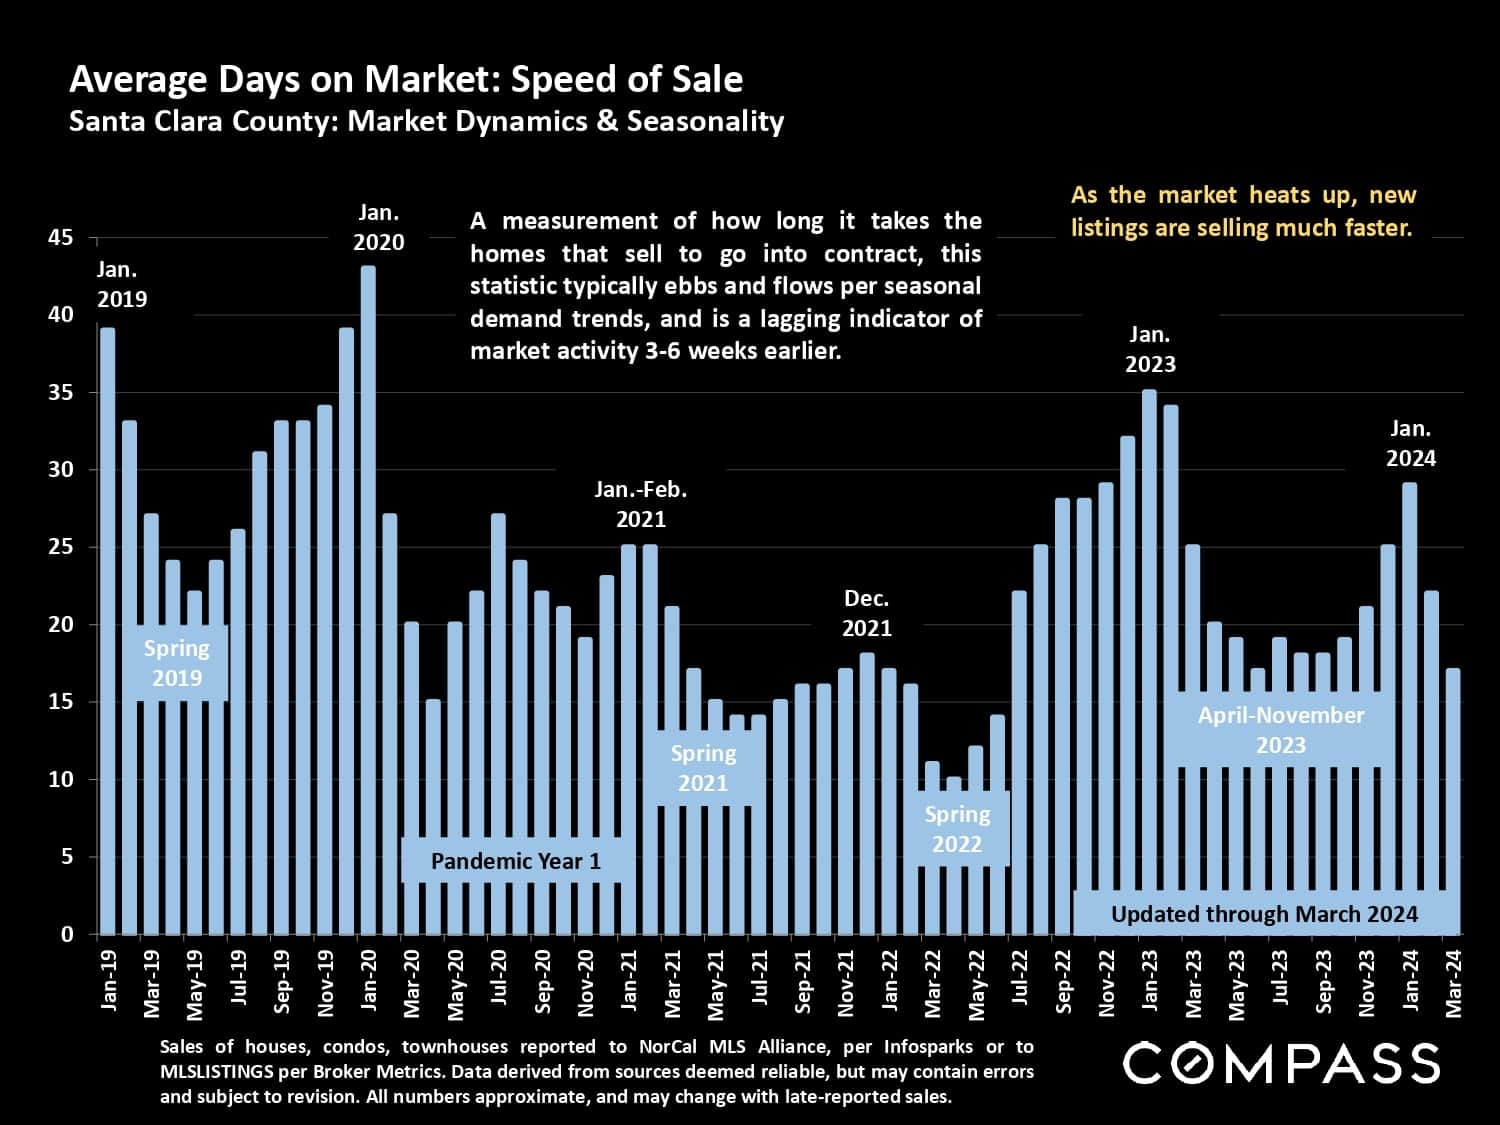
Santa Clara County average days-on-market chart, with monthly bars from 2019 to March 2024 and seasonal annotations.
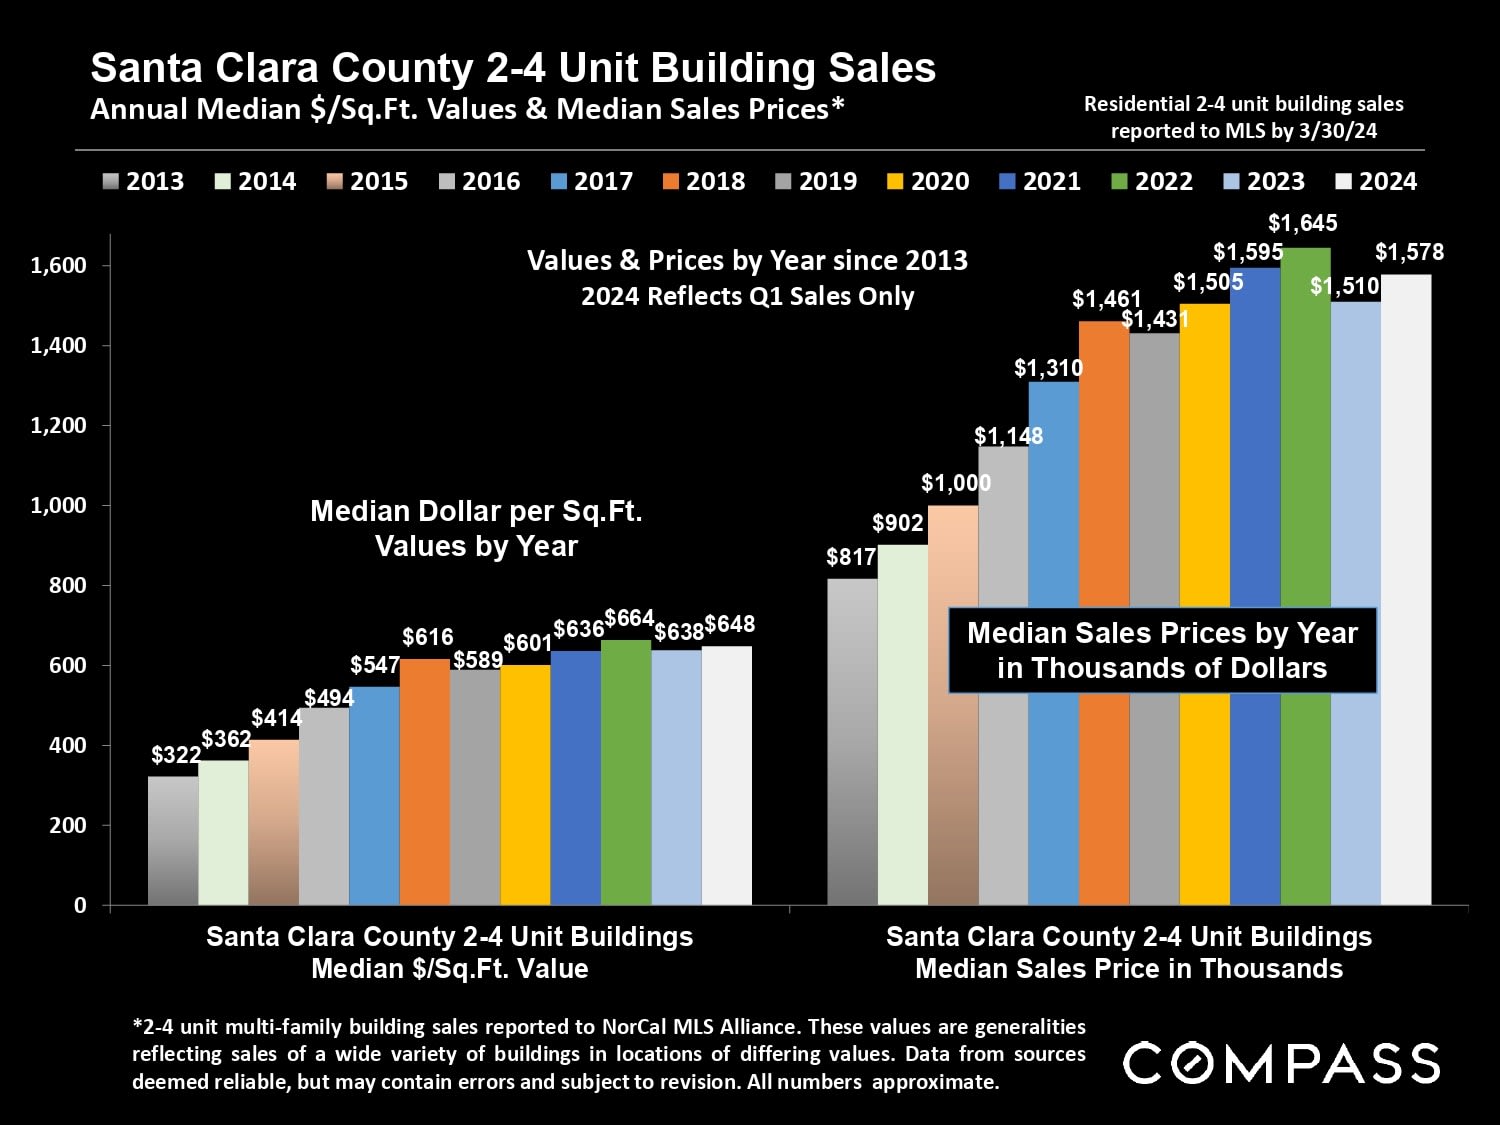
Chart of Santa Clara County 2–4 unit building values and sale prices from 2013 to Q1 2024.
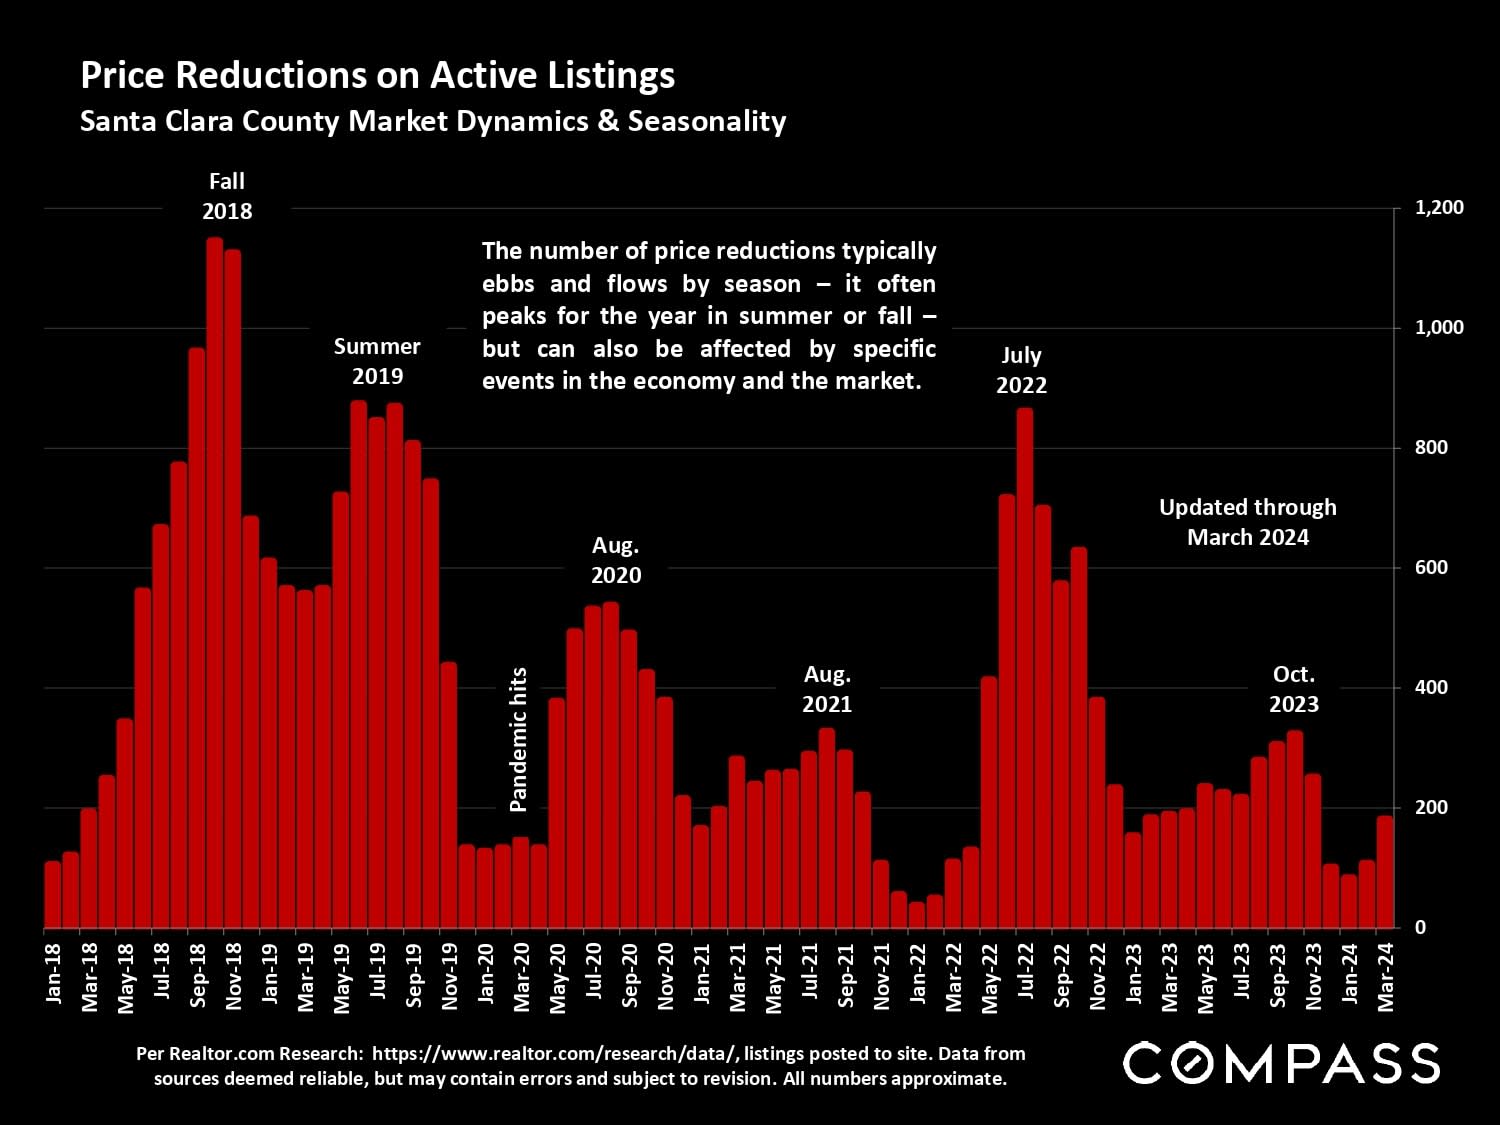
Chart of Santa Clara County active-listing price reductions, January 2018–March 2024, with prominent peaks in fall 2018 and summer 2022.
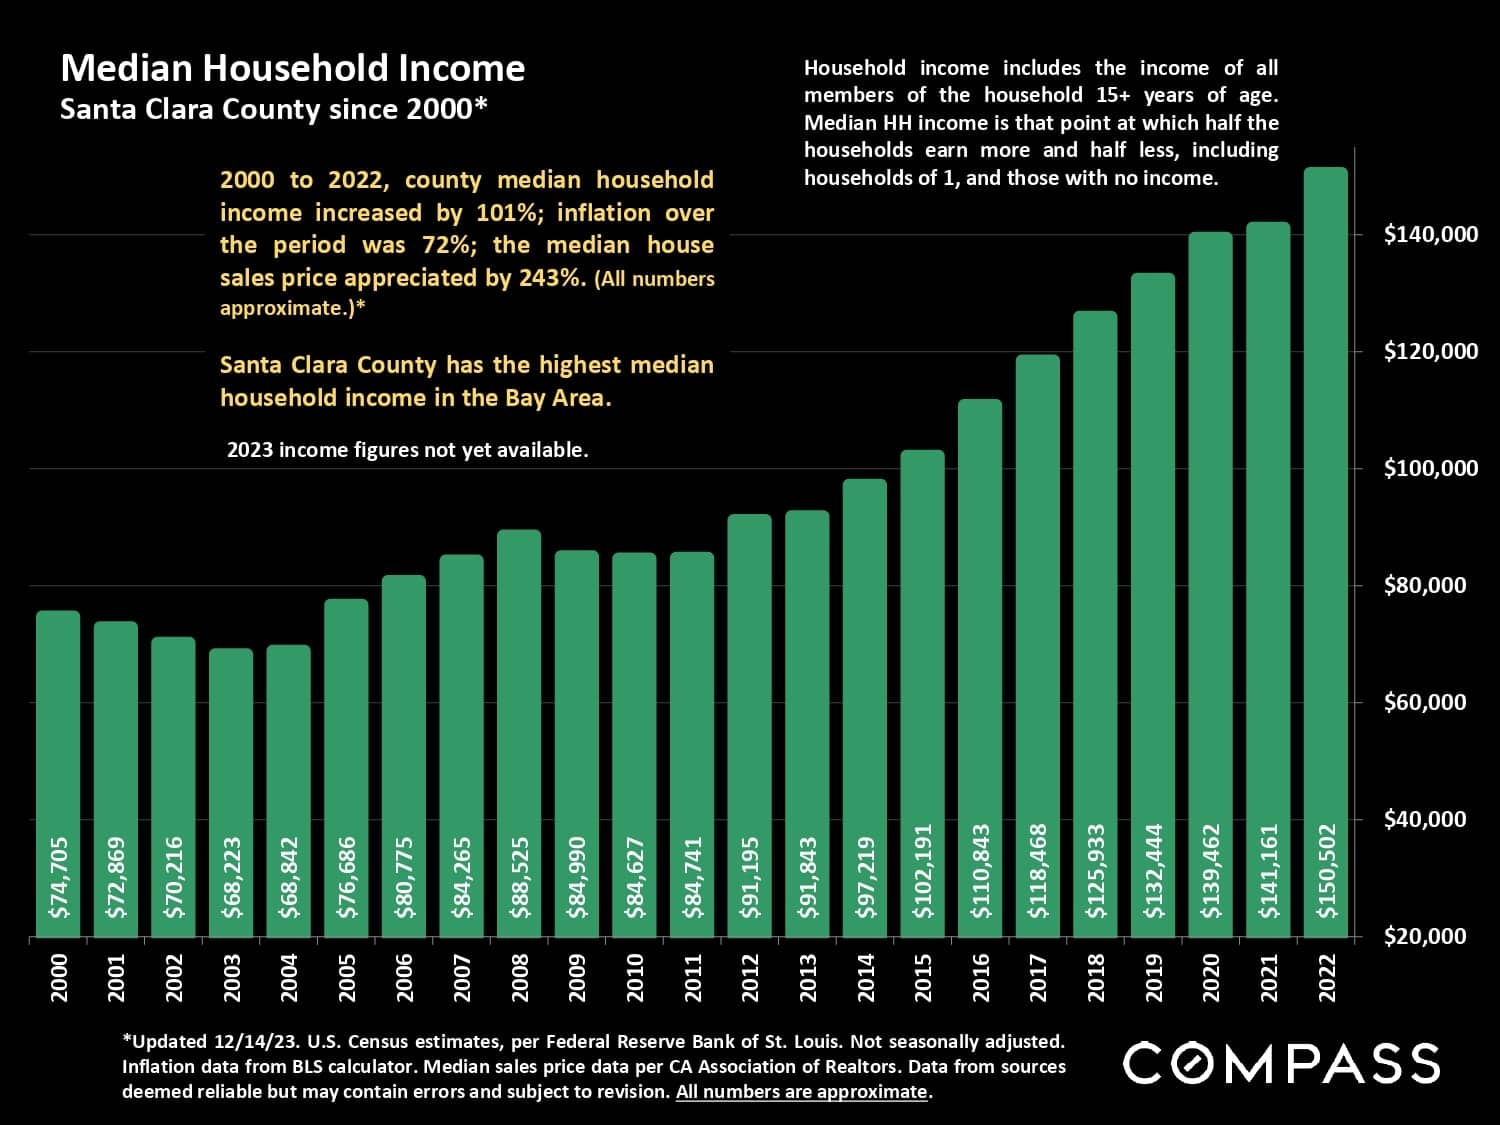
Chart of Santa Clara County median household income, rising from $74,705 in 2000 to $150,502 in 2022.
Chart of Santa Clara County population estimates from 2010 to 2023, peaking in 2017 before declining.
Santa Clara County population-change chart, with a sharp decline in 2021 followed by smaller declines in 2022 and 2023.
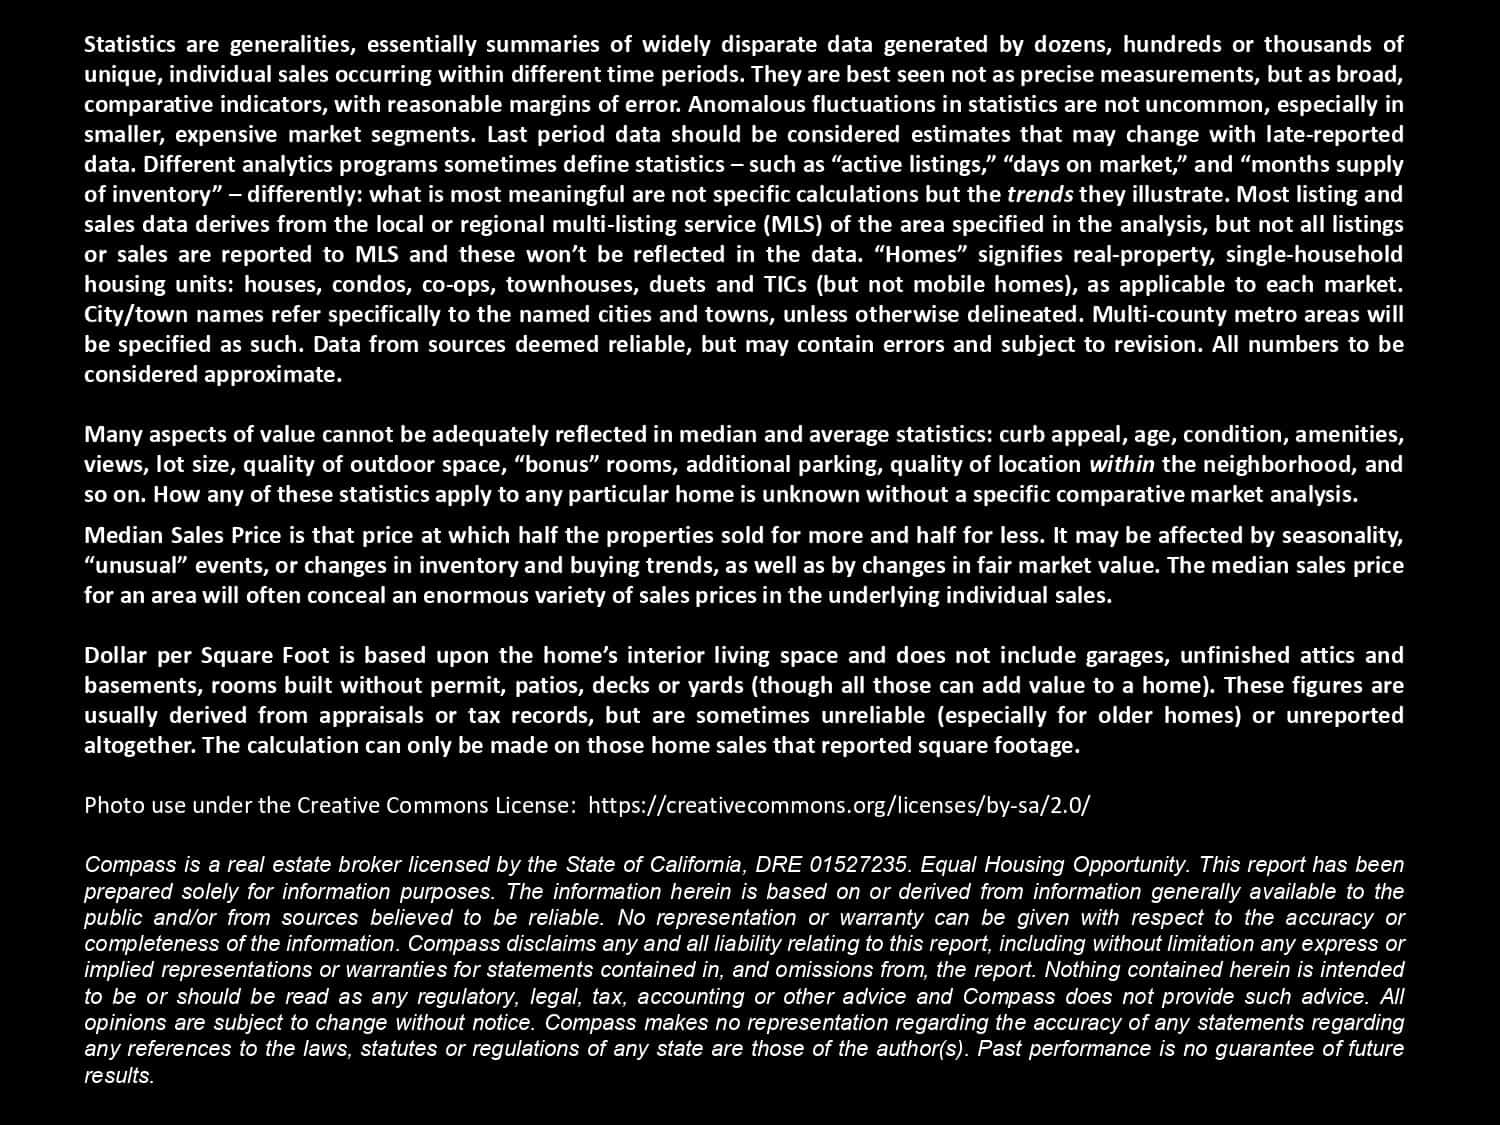
Report notes explaining real estate statistics and data limitations, followed by image licensing and Compass legal disclosures.


WORK WITH US

We offer the highest level of service and expertise to our clients. Our team has built a reputation for consistently representing the finest real estate in San Francisco and Napa Valley. Results driven and dedicated to your success, whether buying, selling, renting or investing. Contact us today for a private consultation.

Contact Us