Santa Clara County - December 2023

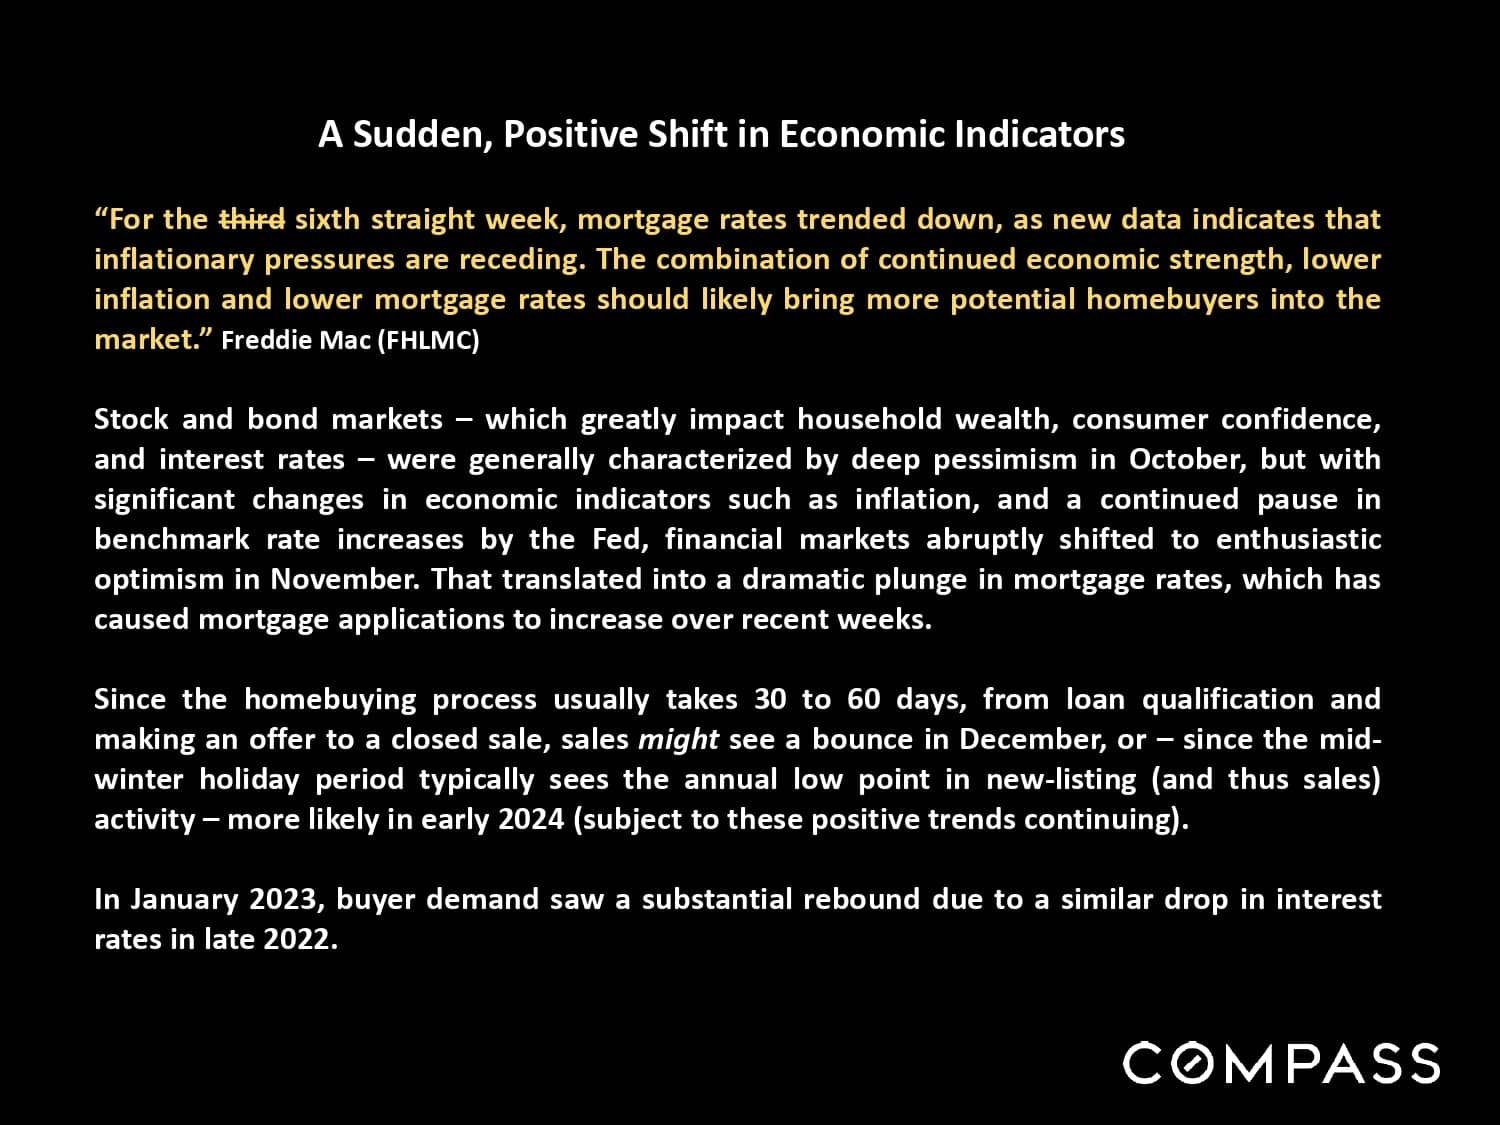
Santa Clara County real estate report cover for December 2023, featuring a sunset lake landscape.\Economic indicators update on falling mortgage rates, market optimism, and expected home-sale activity.

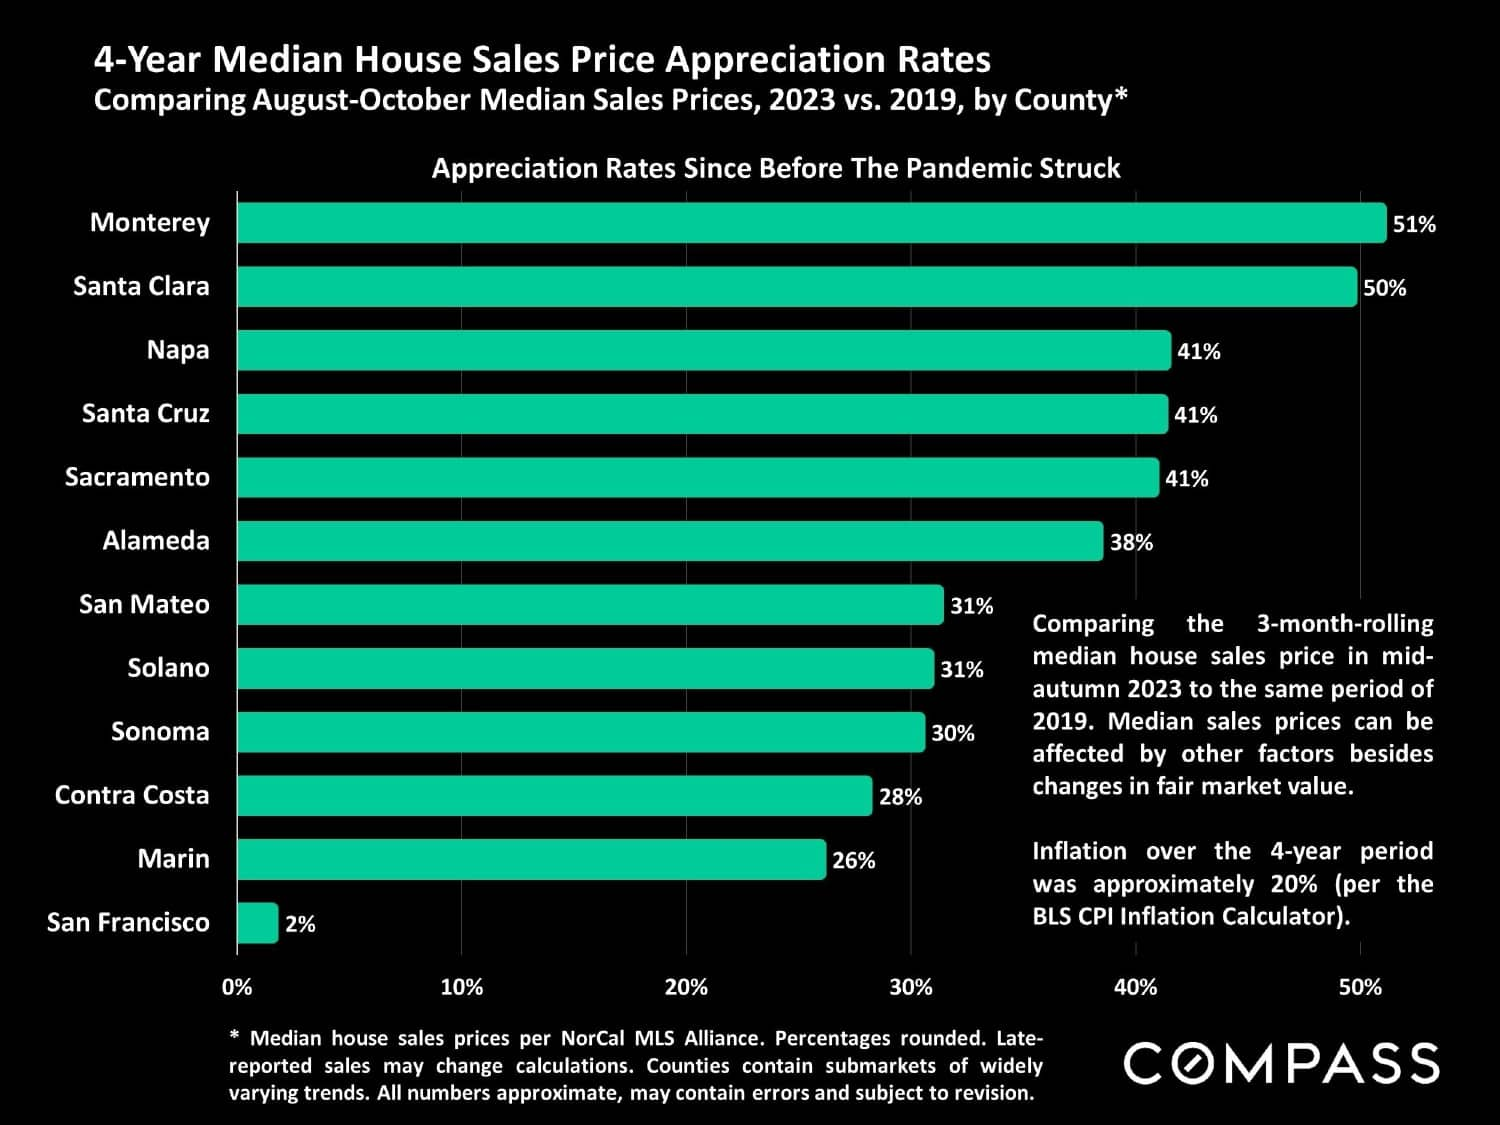
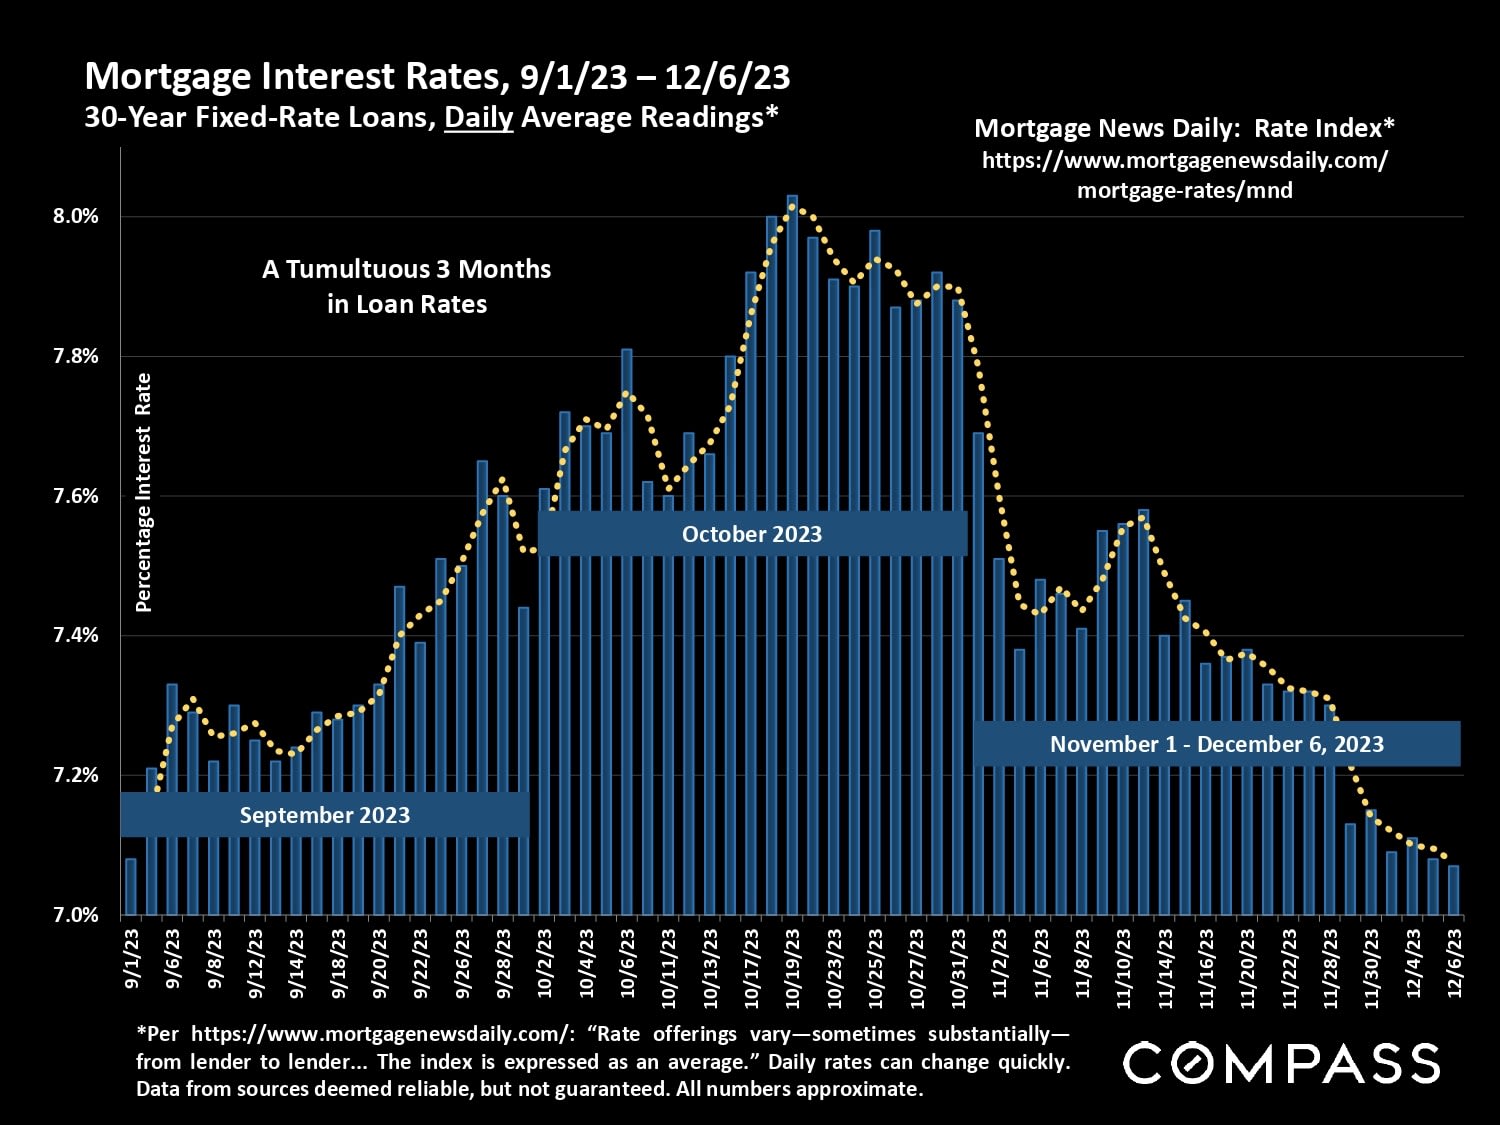
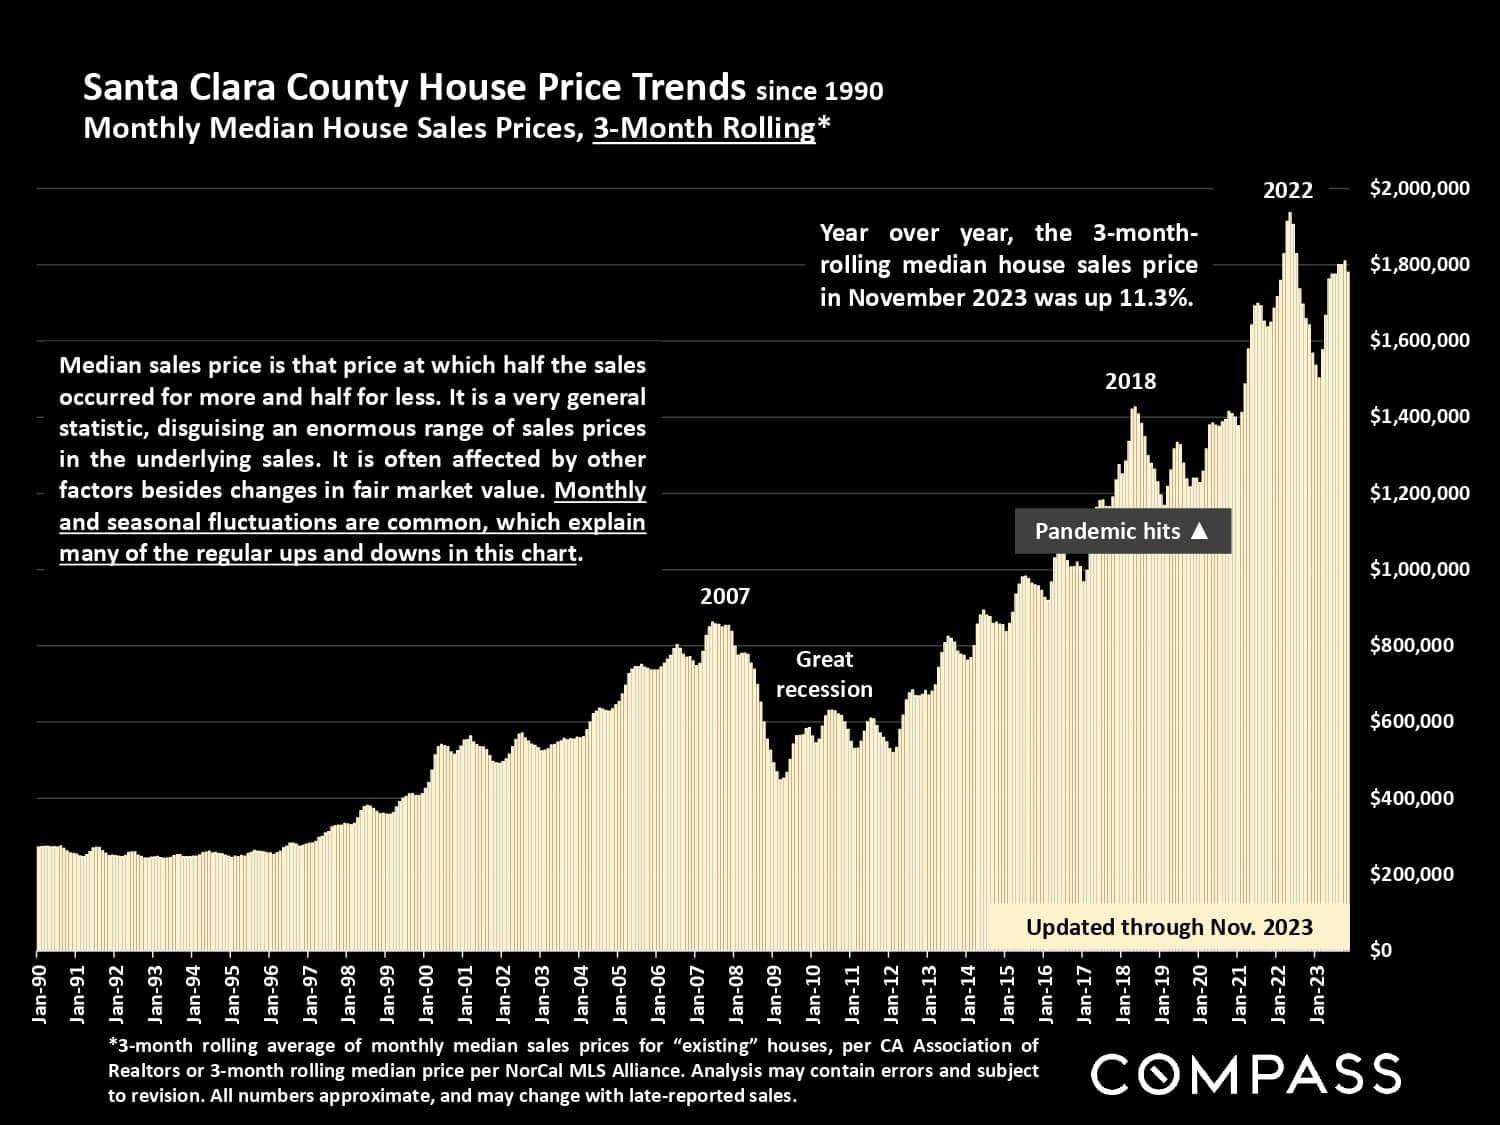
Chart of 30-year fixed mortgage rates, rising above 8% in October 2023 before falling to about 7% in December.\Santa Clara County median house sale prices rose from about $250,000 in 1990 to $1.8 million in 2023.\Chart comparing four-year median home sale price appreciation by county; Monterey is highest at 51%, Santa Clara at 50%.

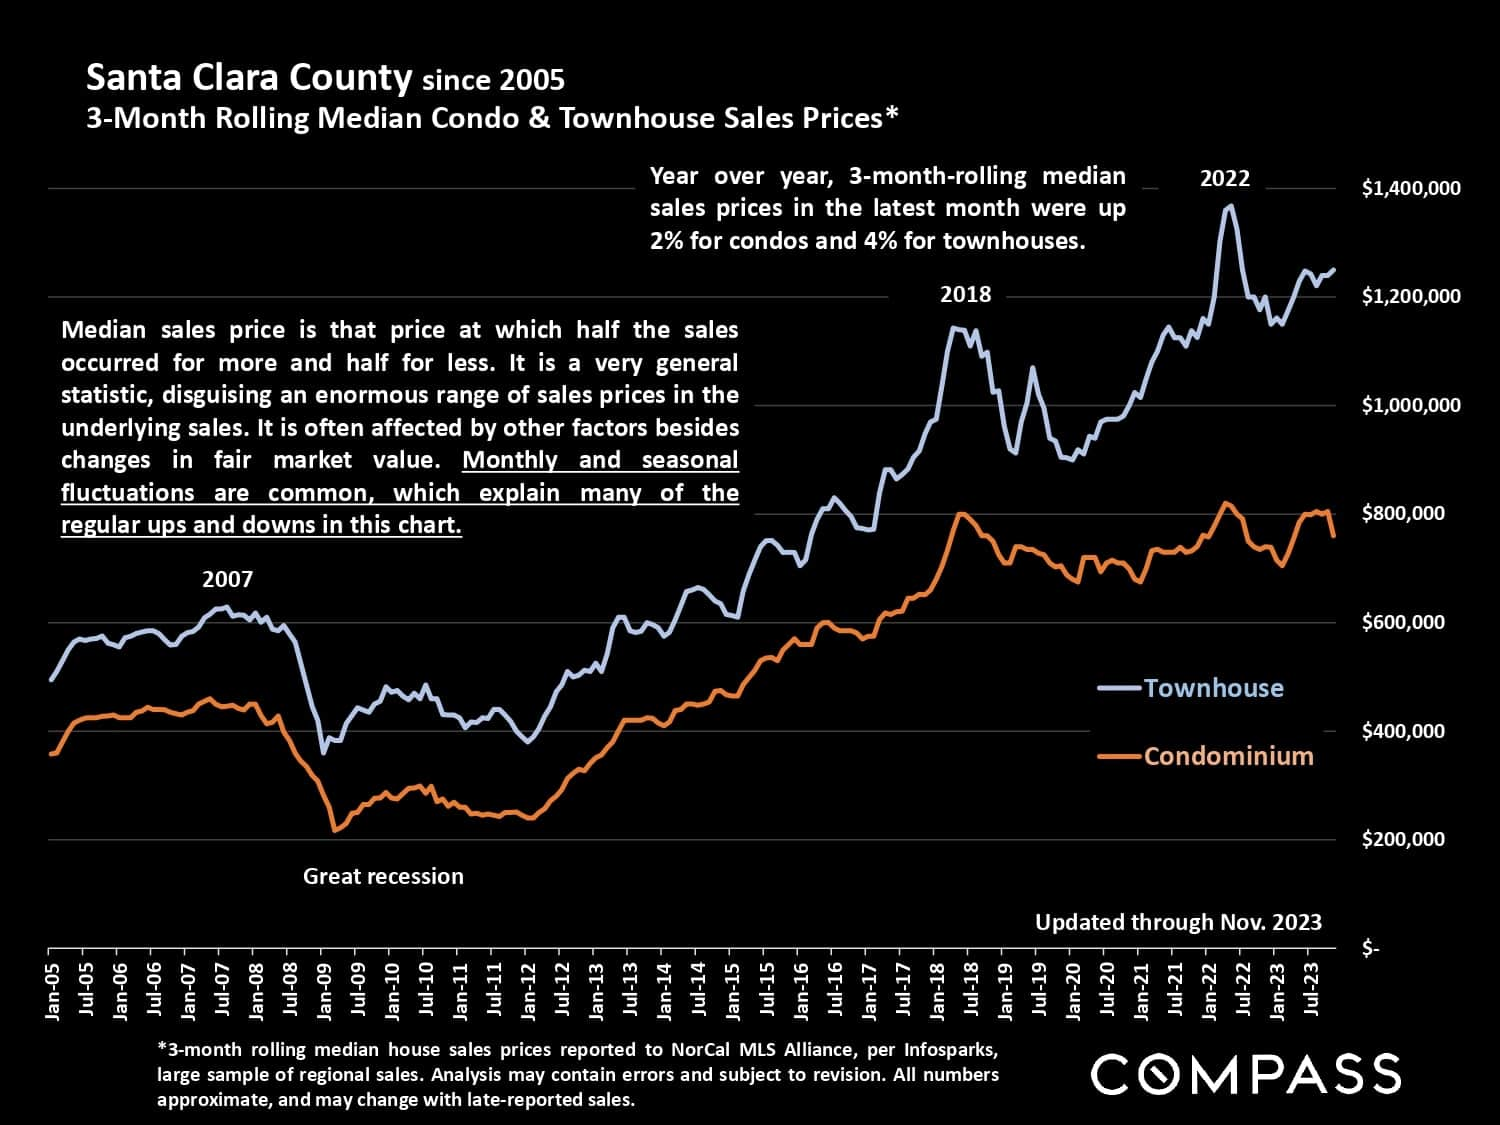
Santa Clara County condo and townhouse median sale prices, 2005–2023, shown in a line chart.

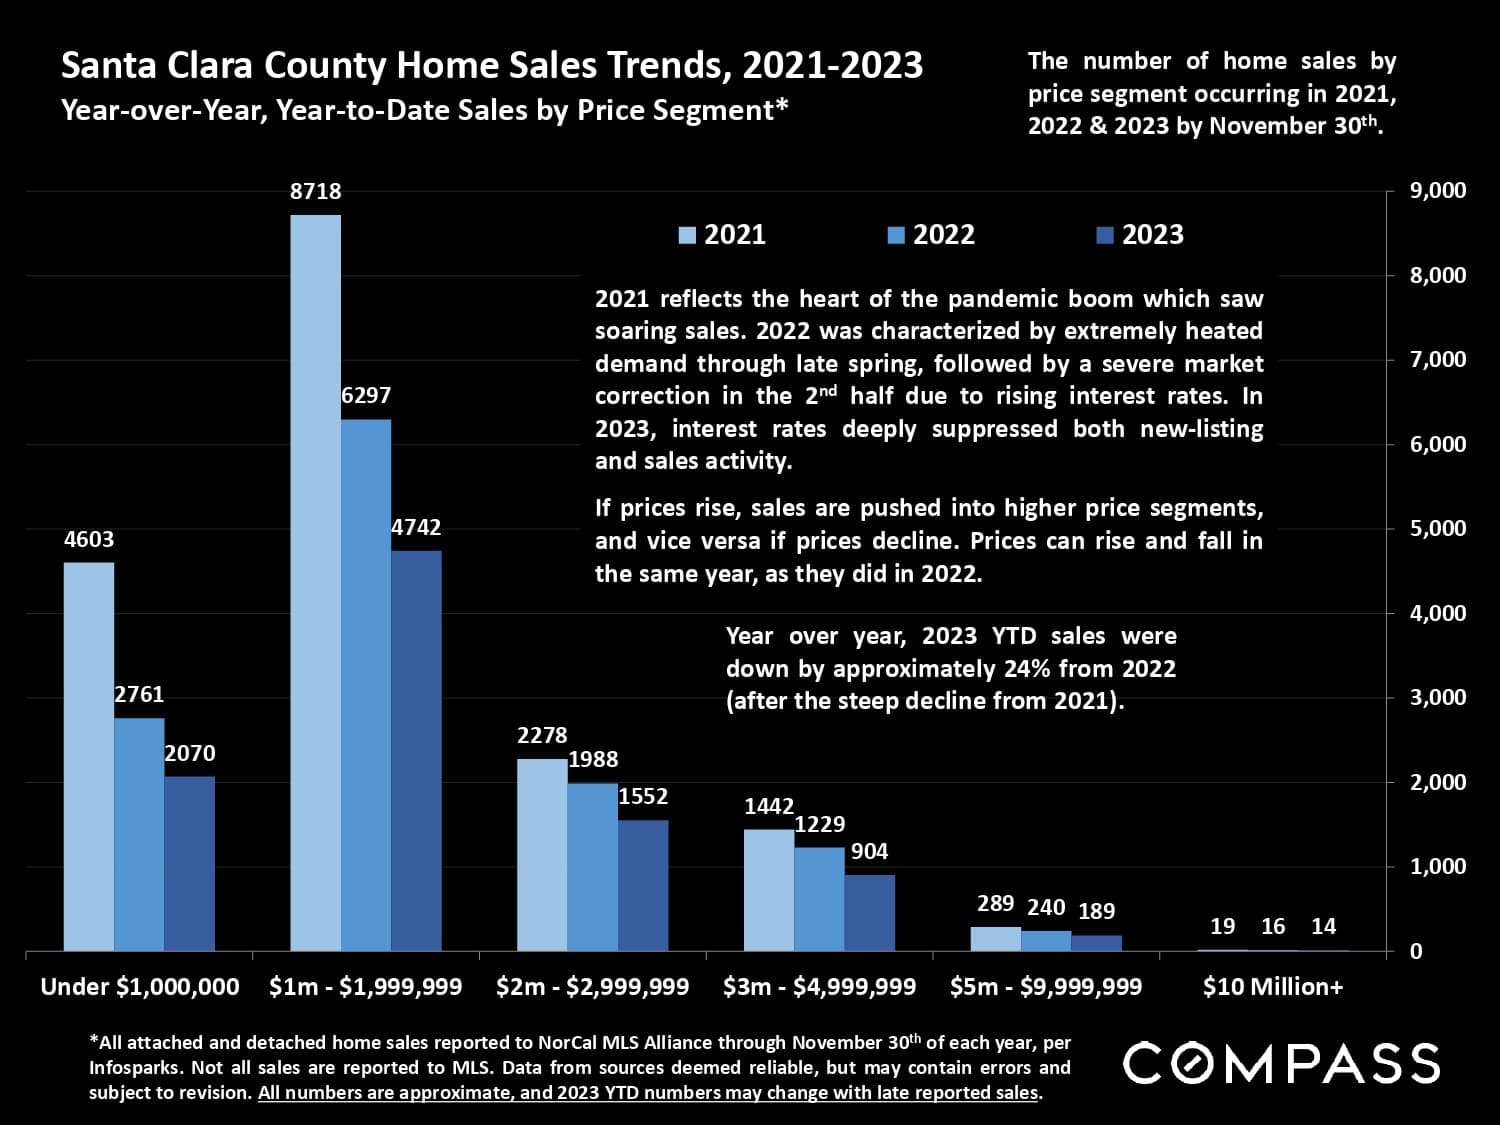
Chart comparing Santa Clara County home sales by price segment in 2021, 2022, and 2023.

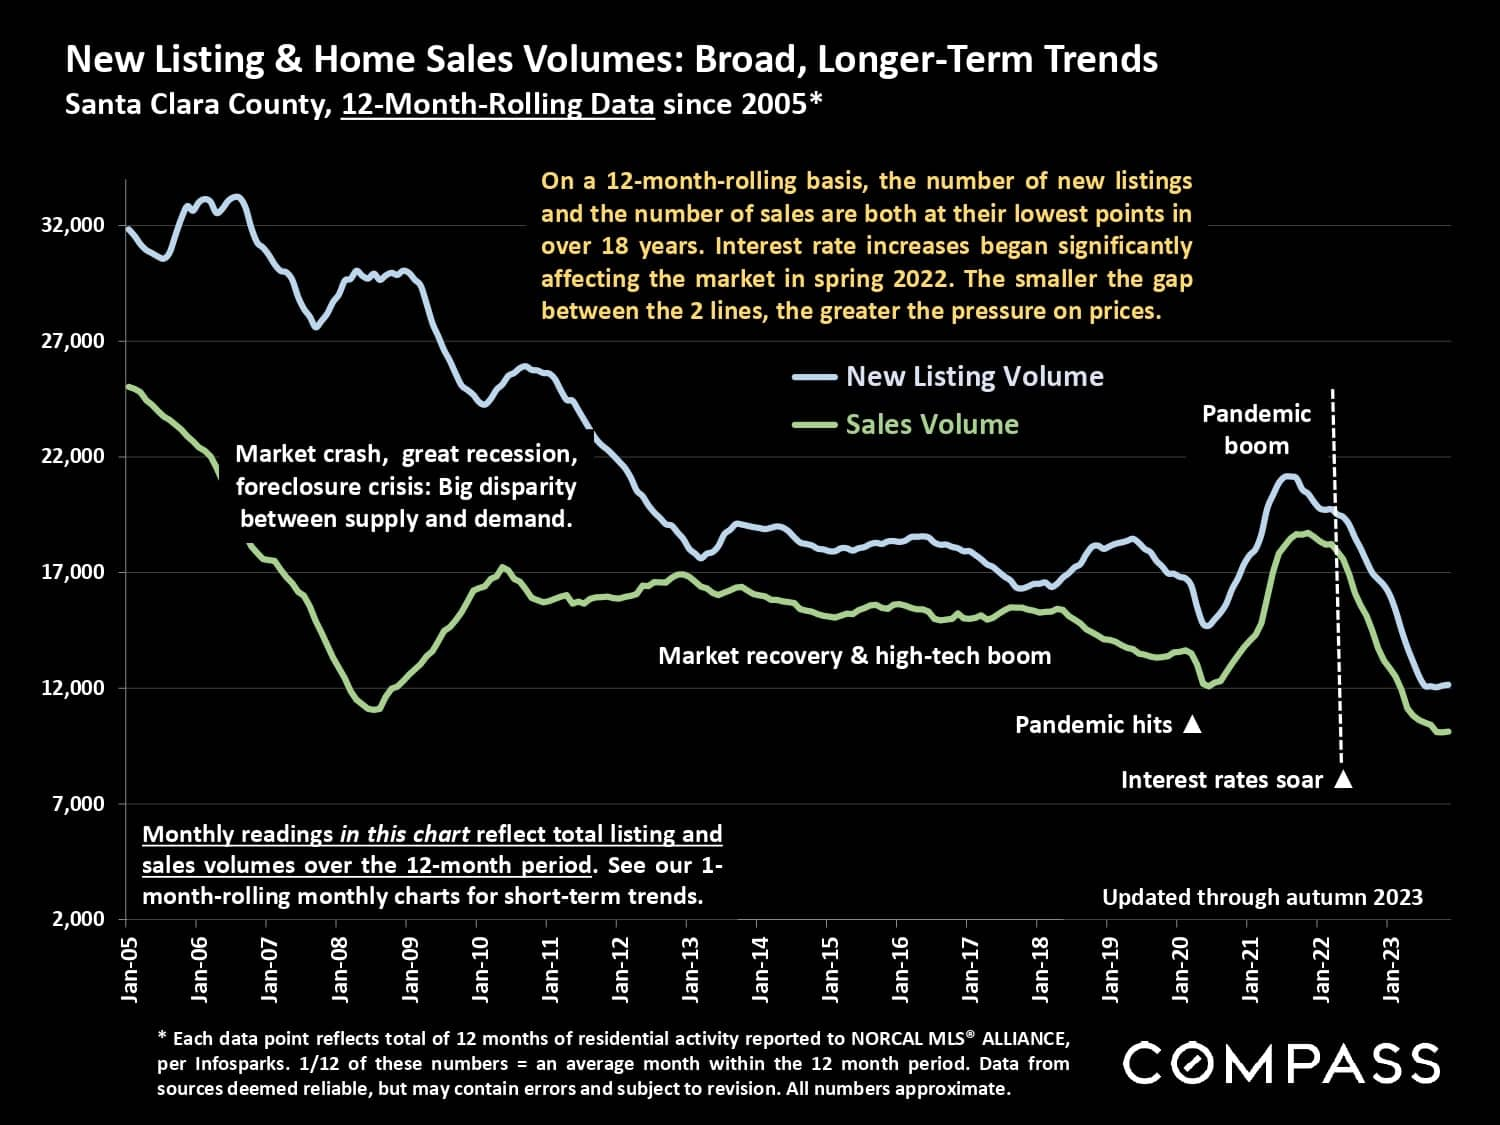
Santa Clara County chart comparing rolling new listing and home sales volumes from 2005 through 2023.

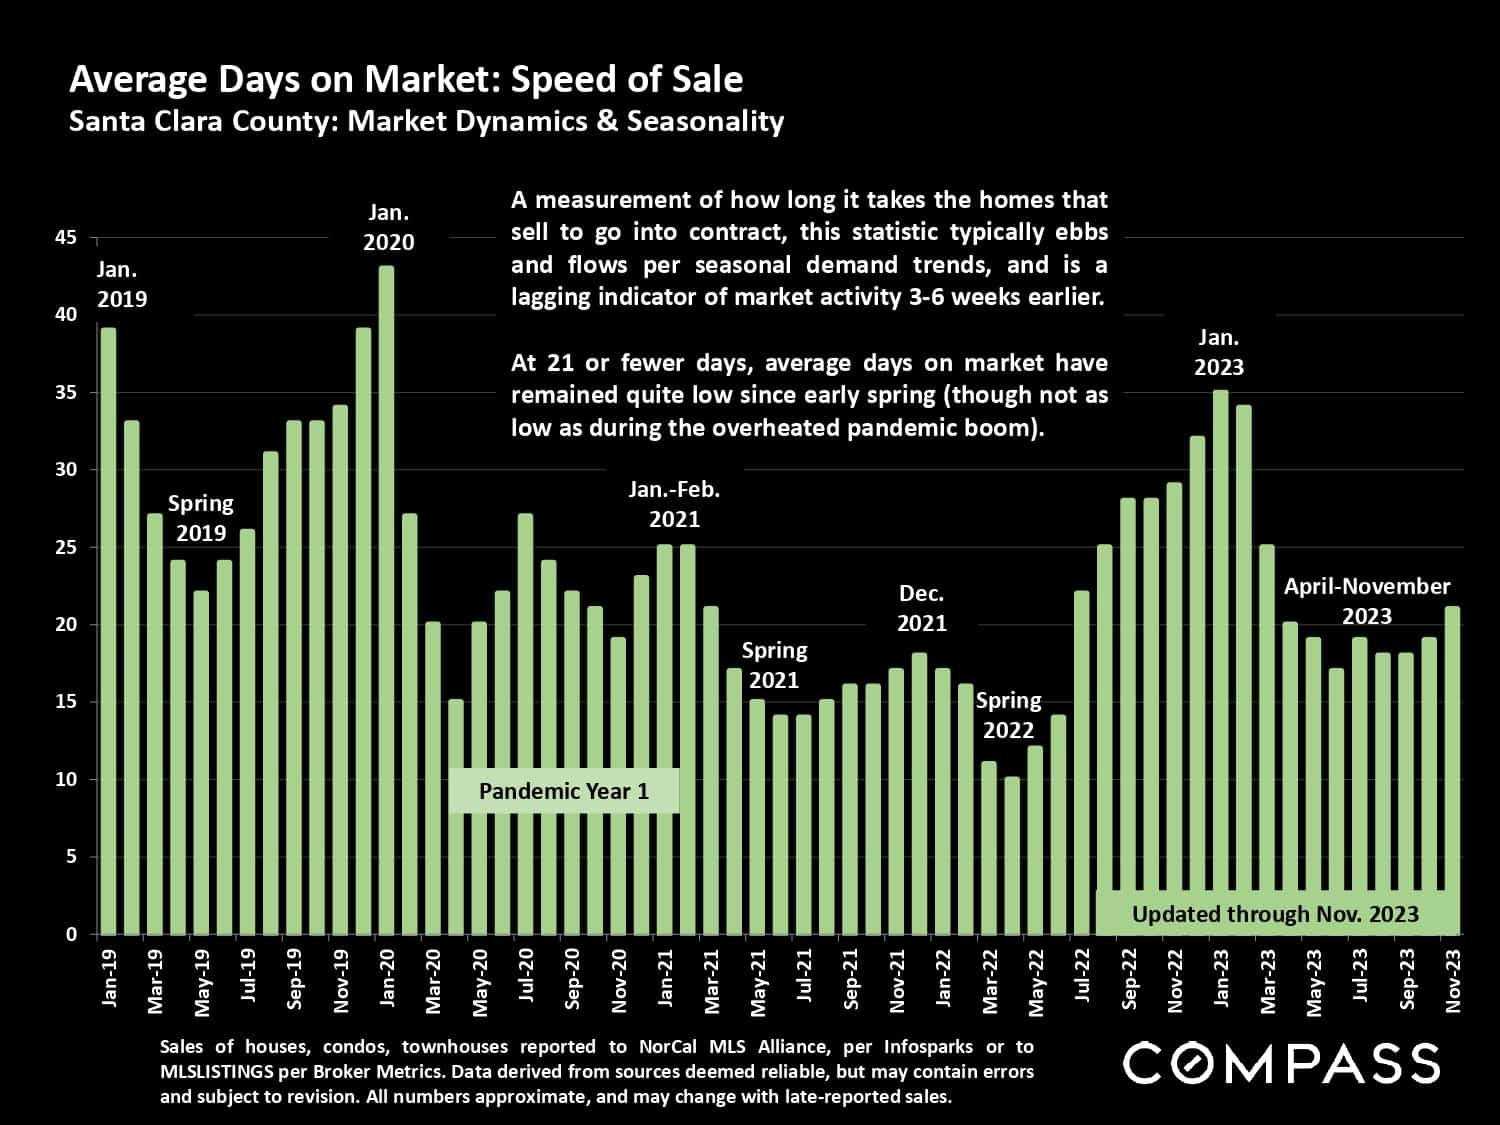
Santa Clara County average days on market chart, January 2019–November 2023, with seasonal and pandemic-era annotations.

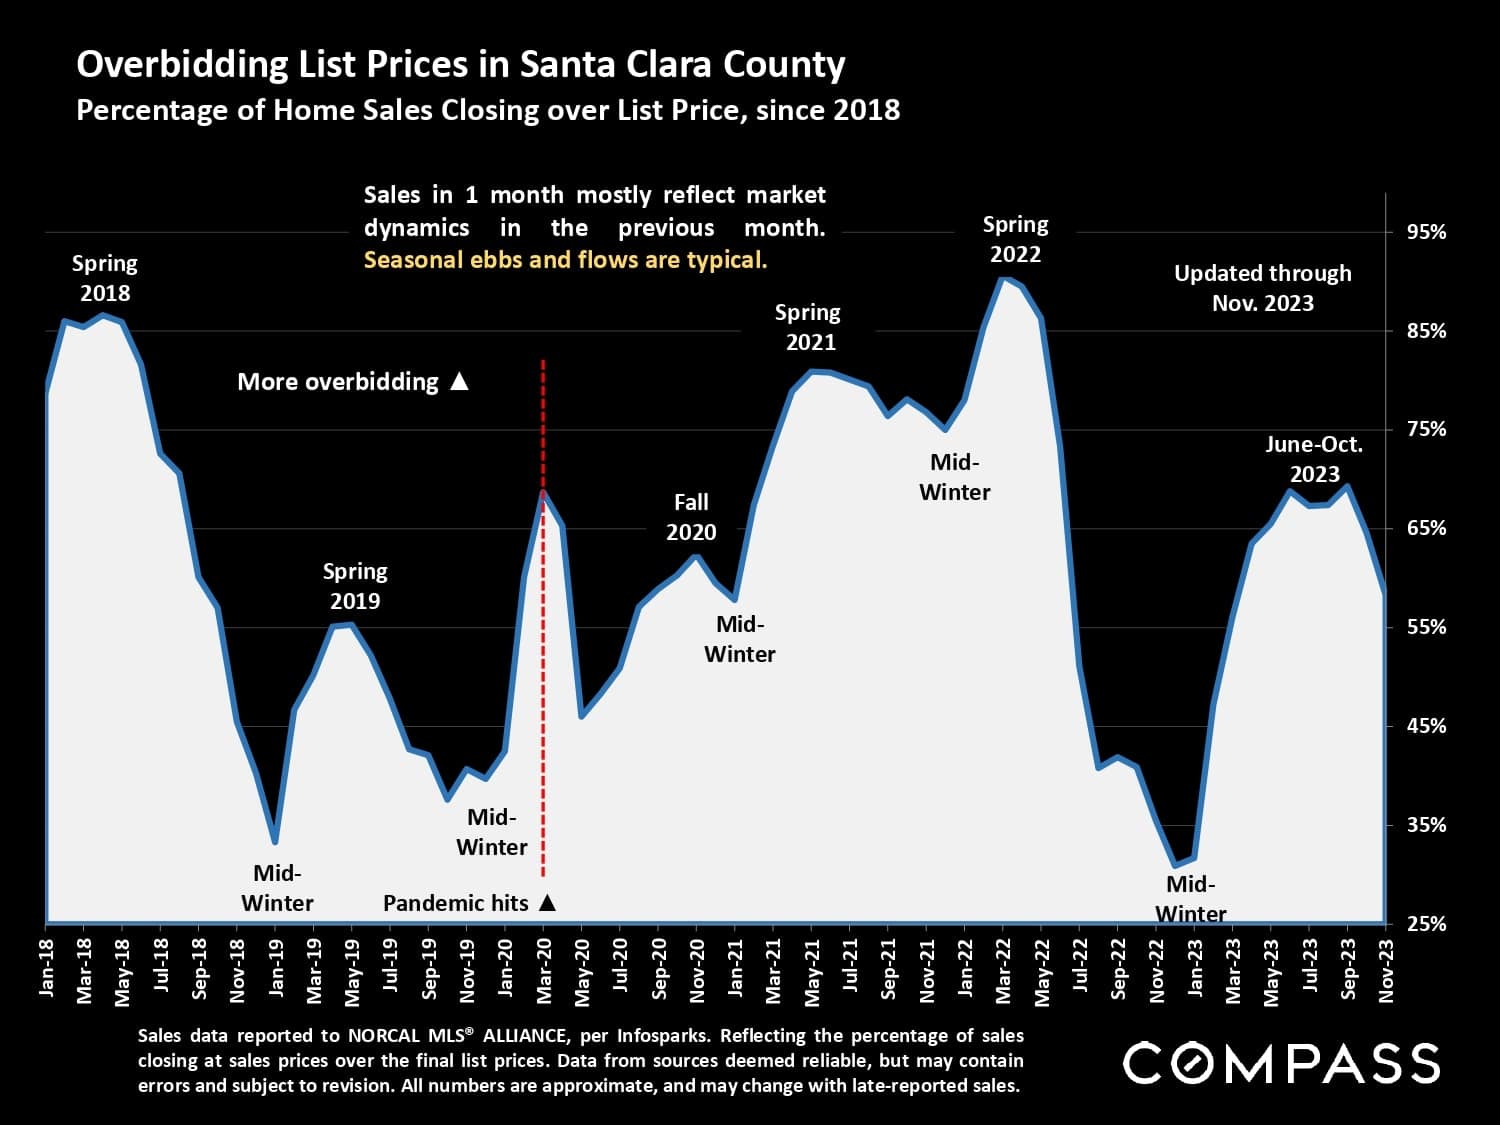
Chart of Santa Clara County home sales over list price, peaking in spring 2022 and updated through November 2023.

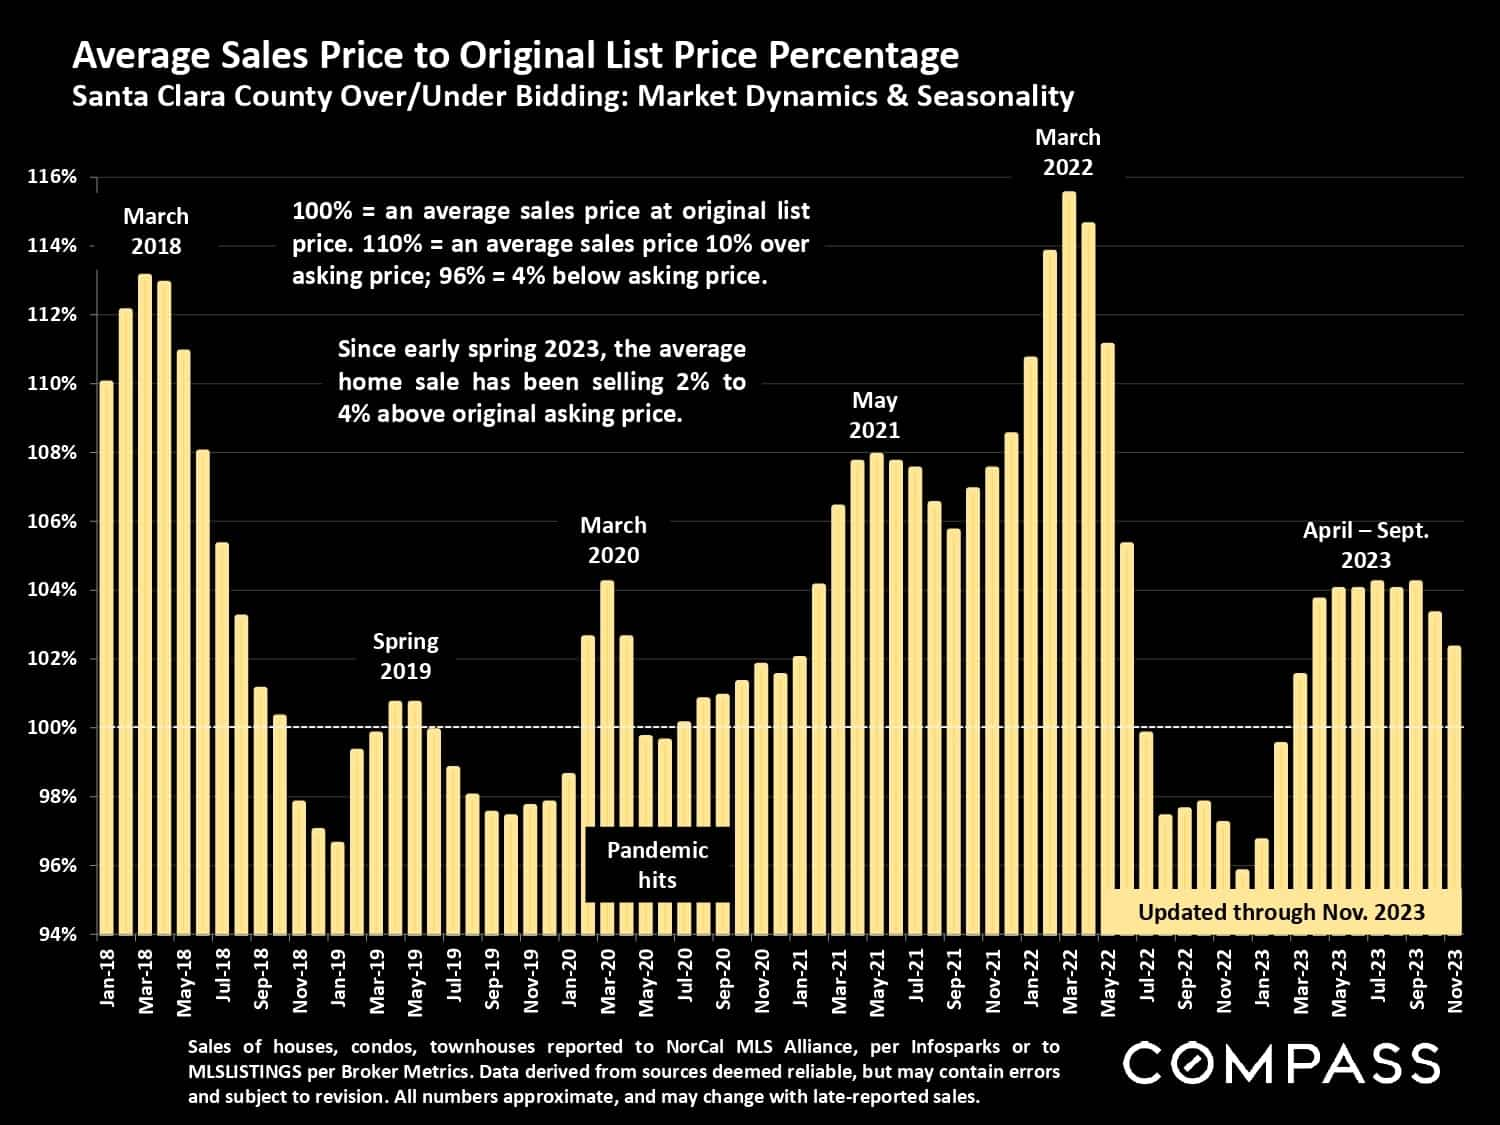
Bar chart of Santa Clara County home sale prices versus original list prices, January 2018–November 2023; recent sales averaged 2%–4% above asking.

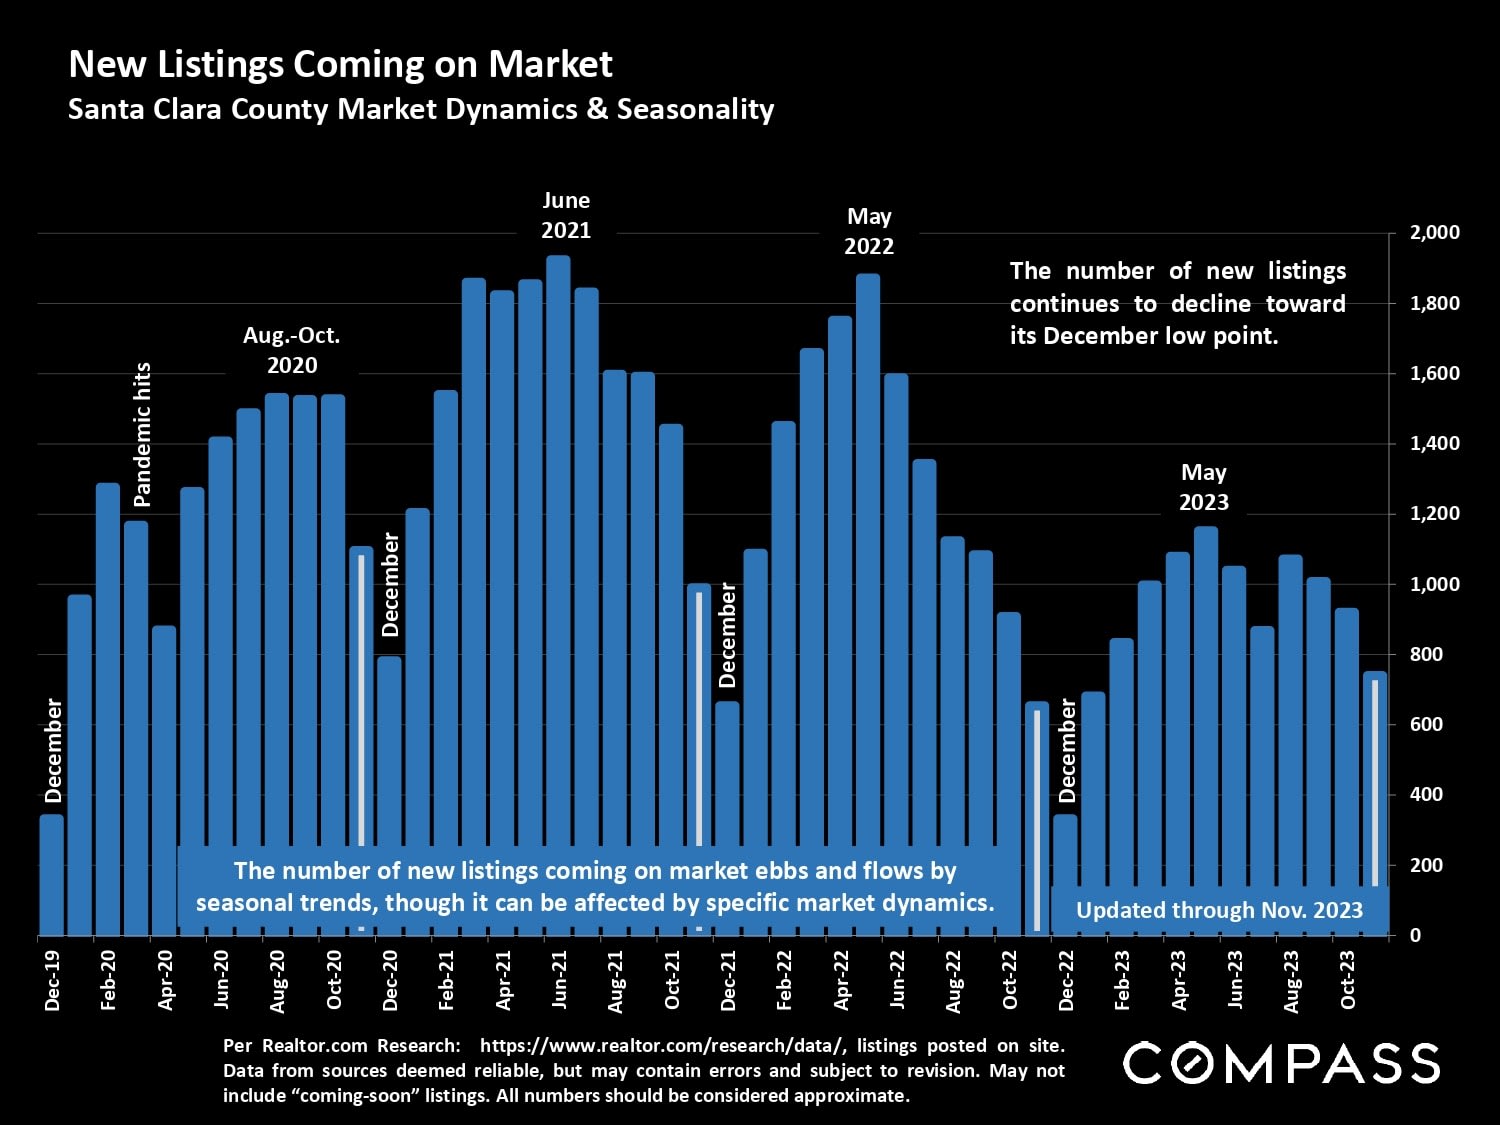
Santa Clara County new-listings chart, December 2019–November 2023, showing seasonal peaks and December lows.

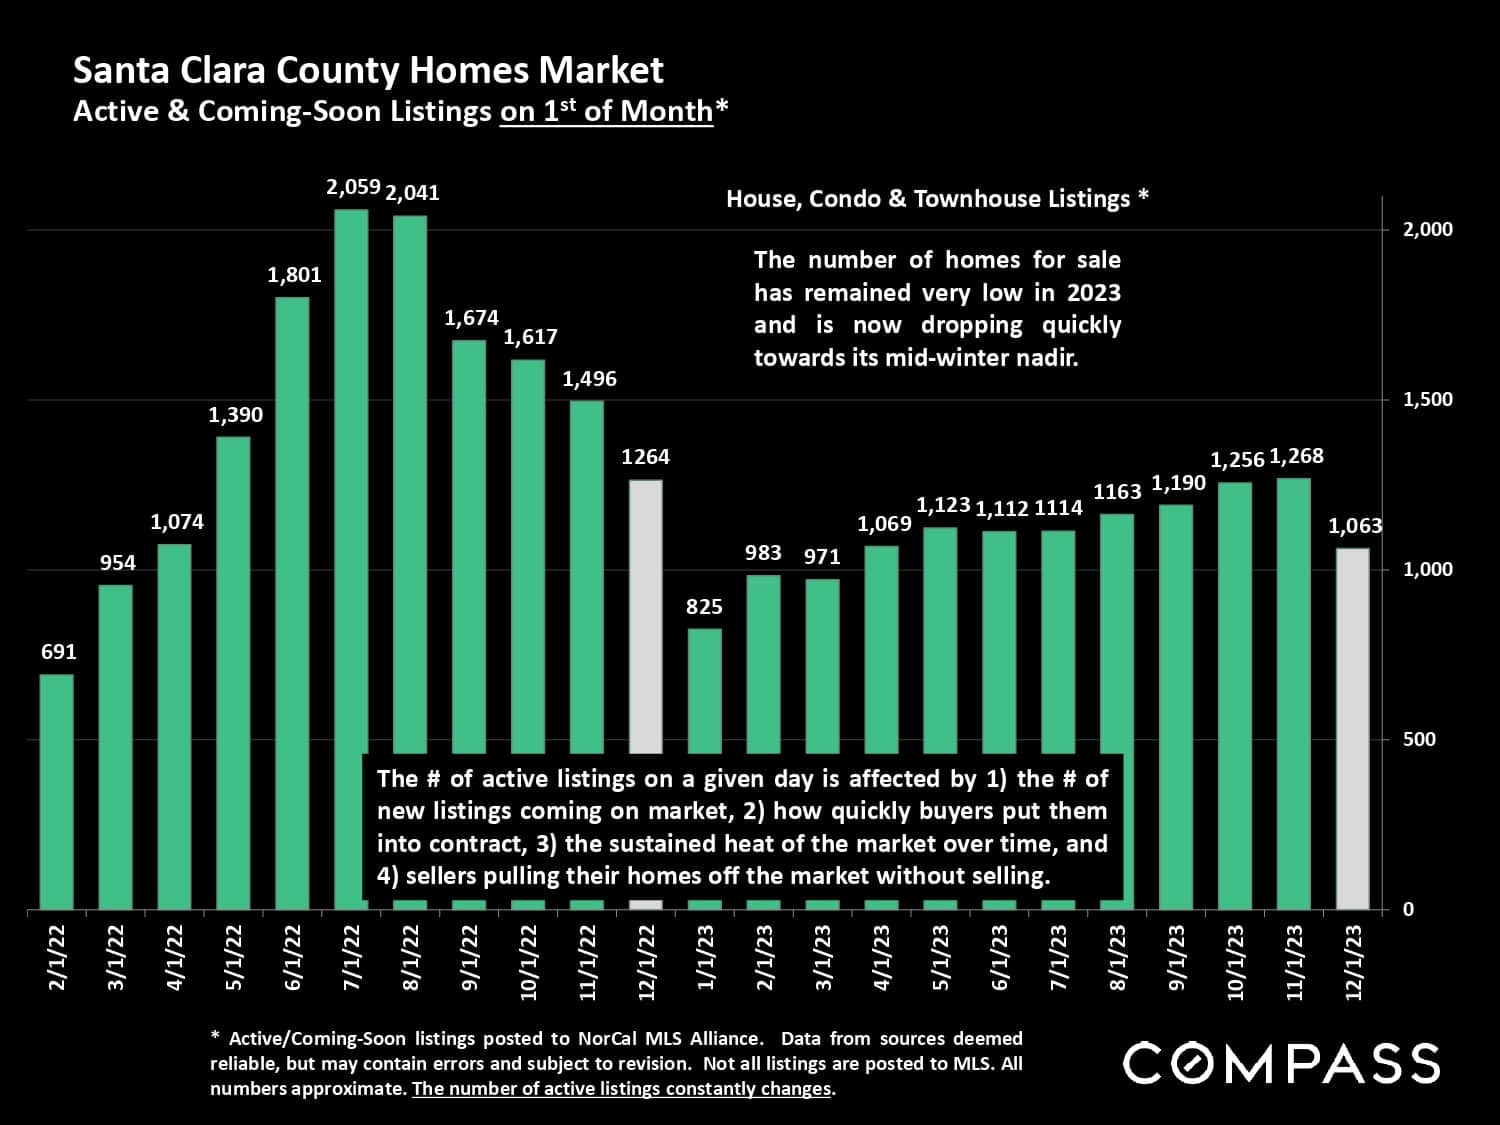
Chart of Santa Clara County home listings from February 2022 to December 2023, peaking in July 2022 before declining.

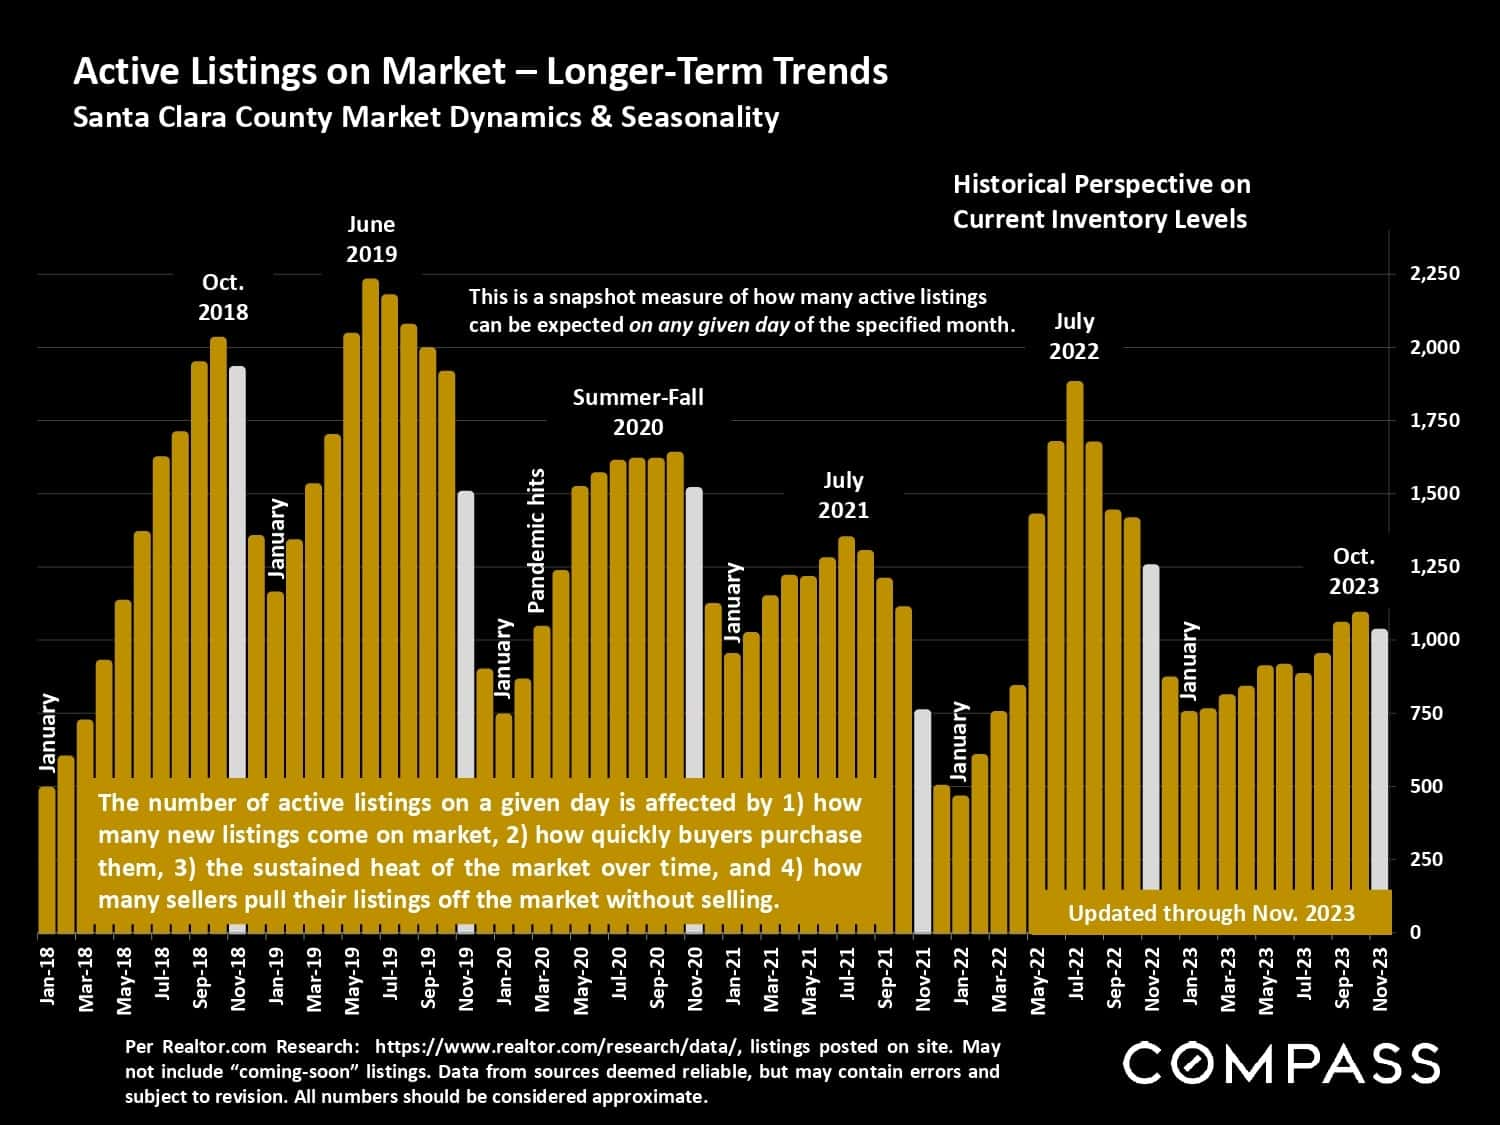
Chart of Santa Clara County active listings from 2018–2023, showing seasonal inventory patterns and a sharp mid-2022 peak.

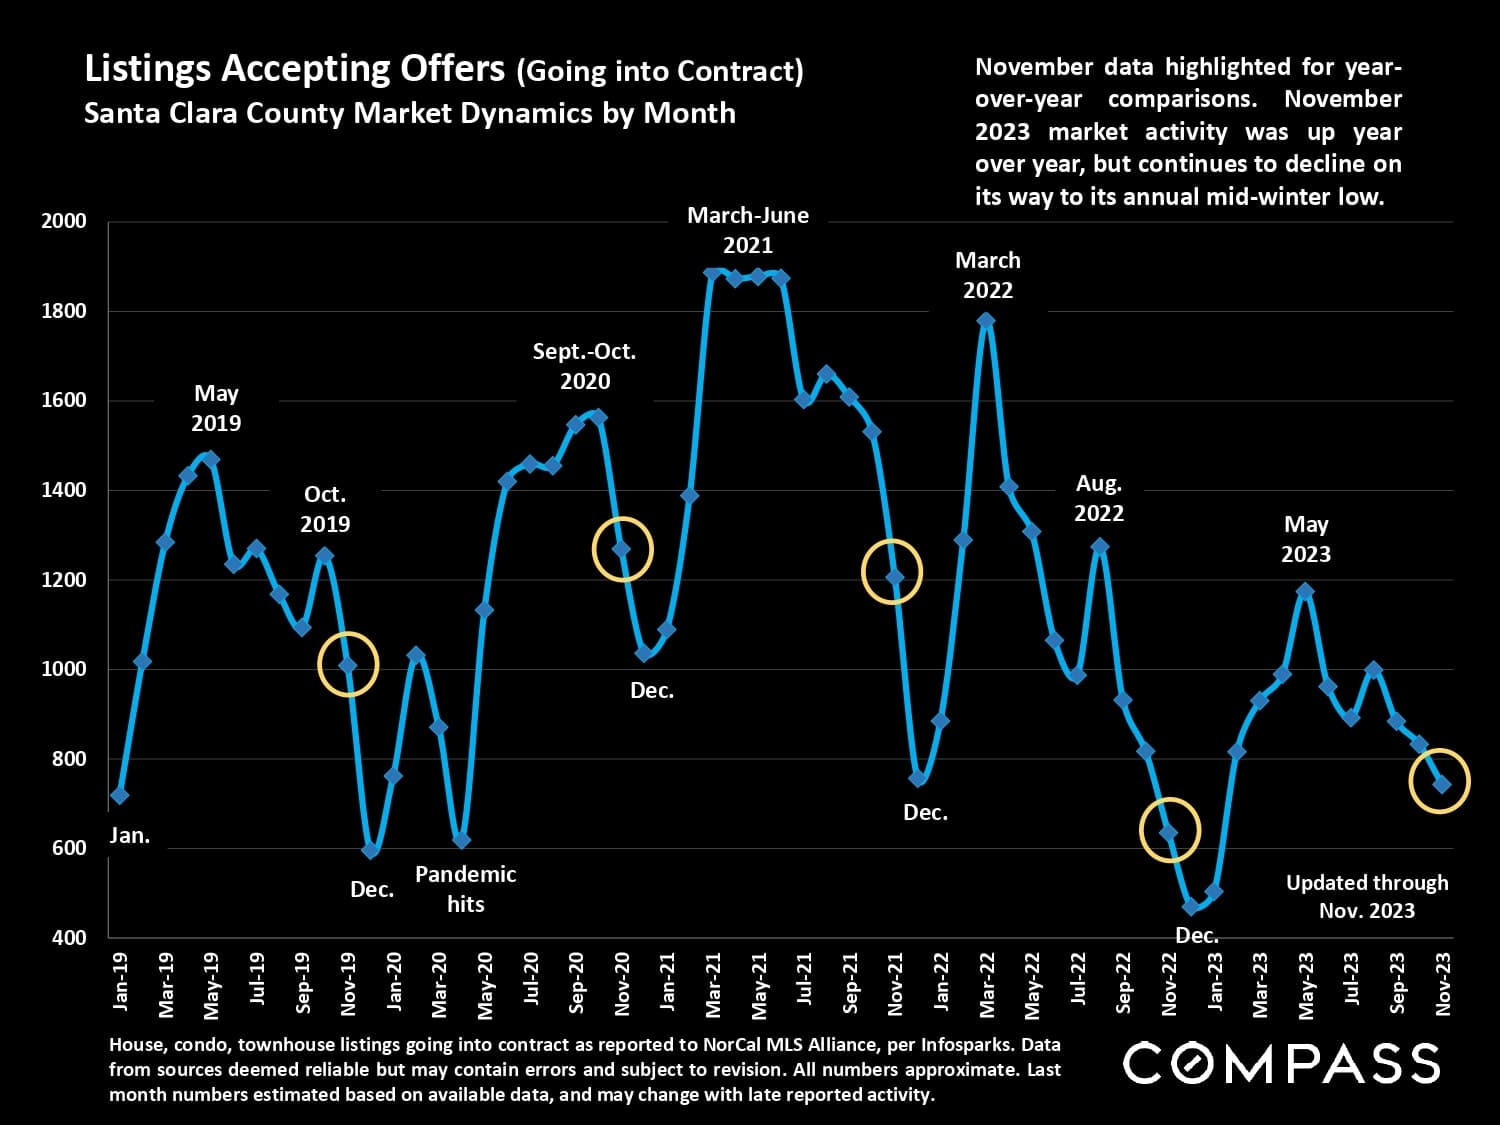
Santa Clara County monthly listings accepting offers, January 2019–November 2023, with peaks in 2021 and a late-2023 decline.

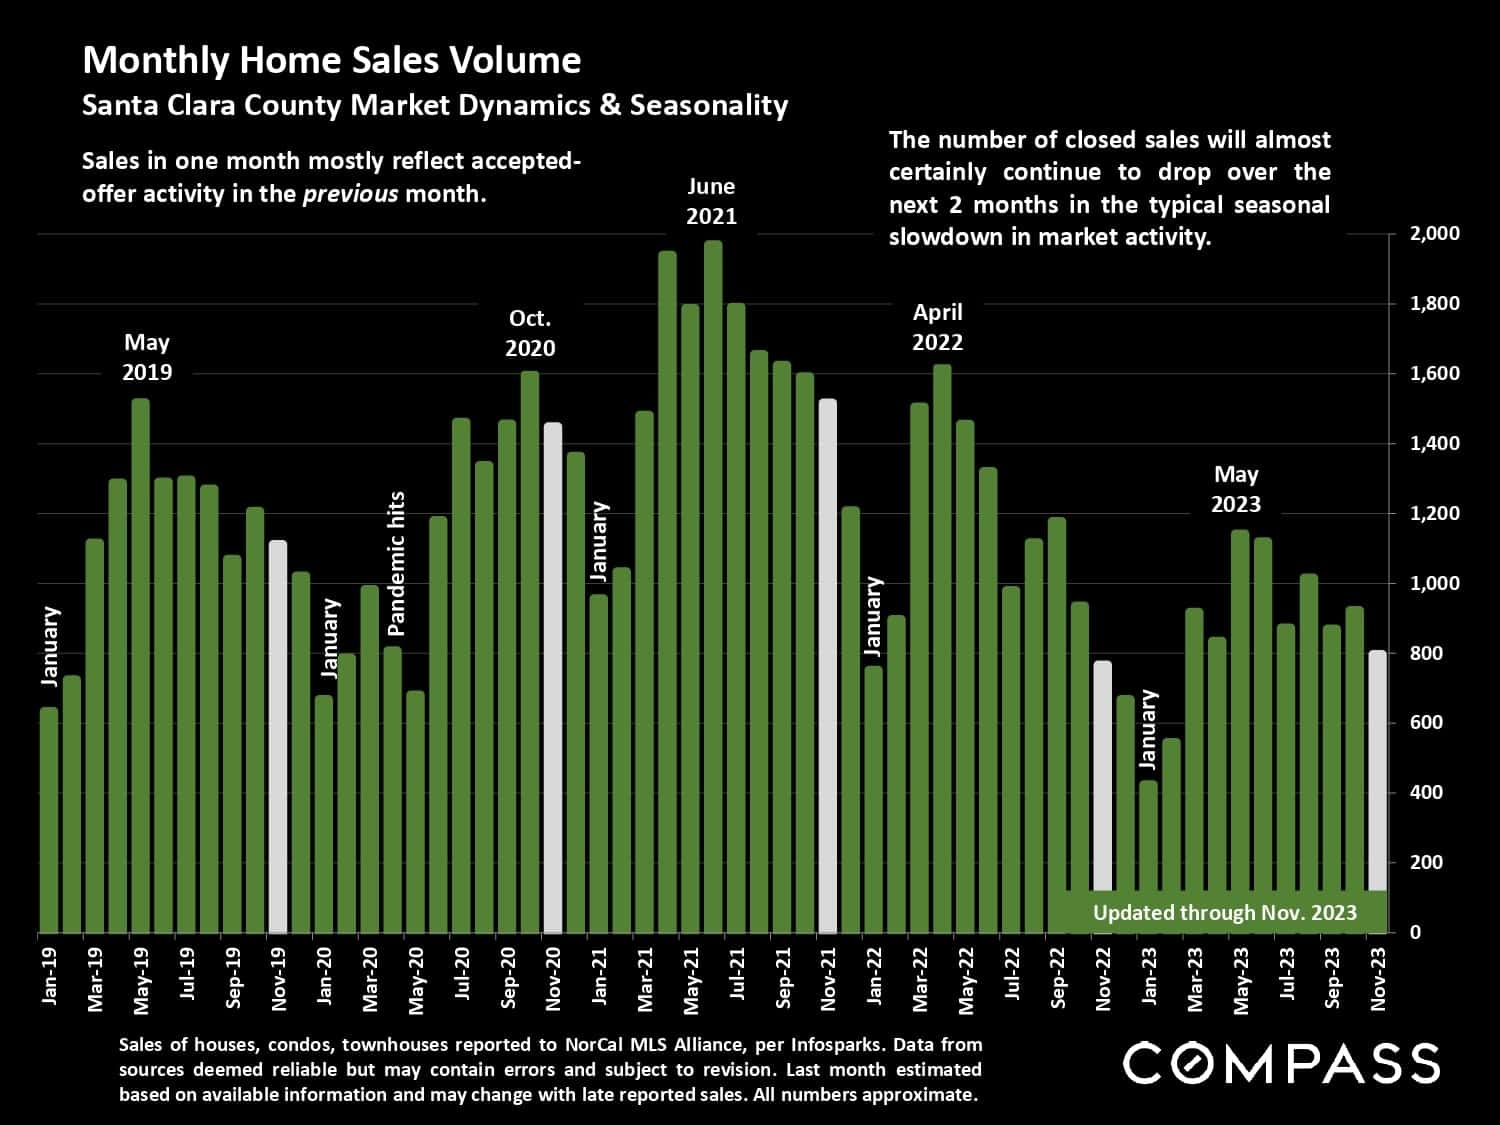
Santa Clara County monthly home sales chart, January 2019–November 2023, peaking in 2021 and declining afterward.

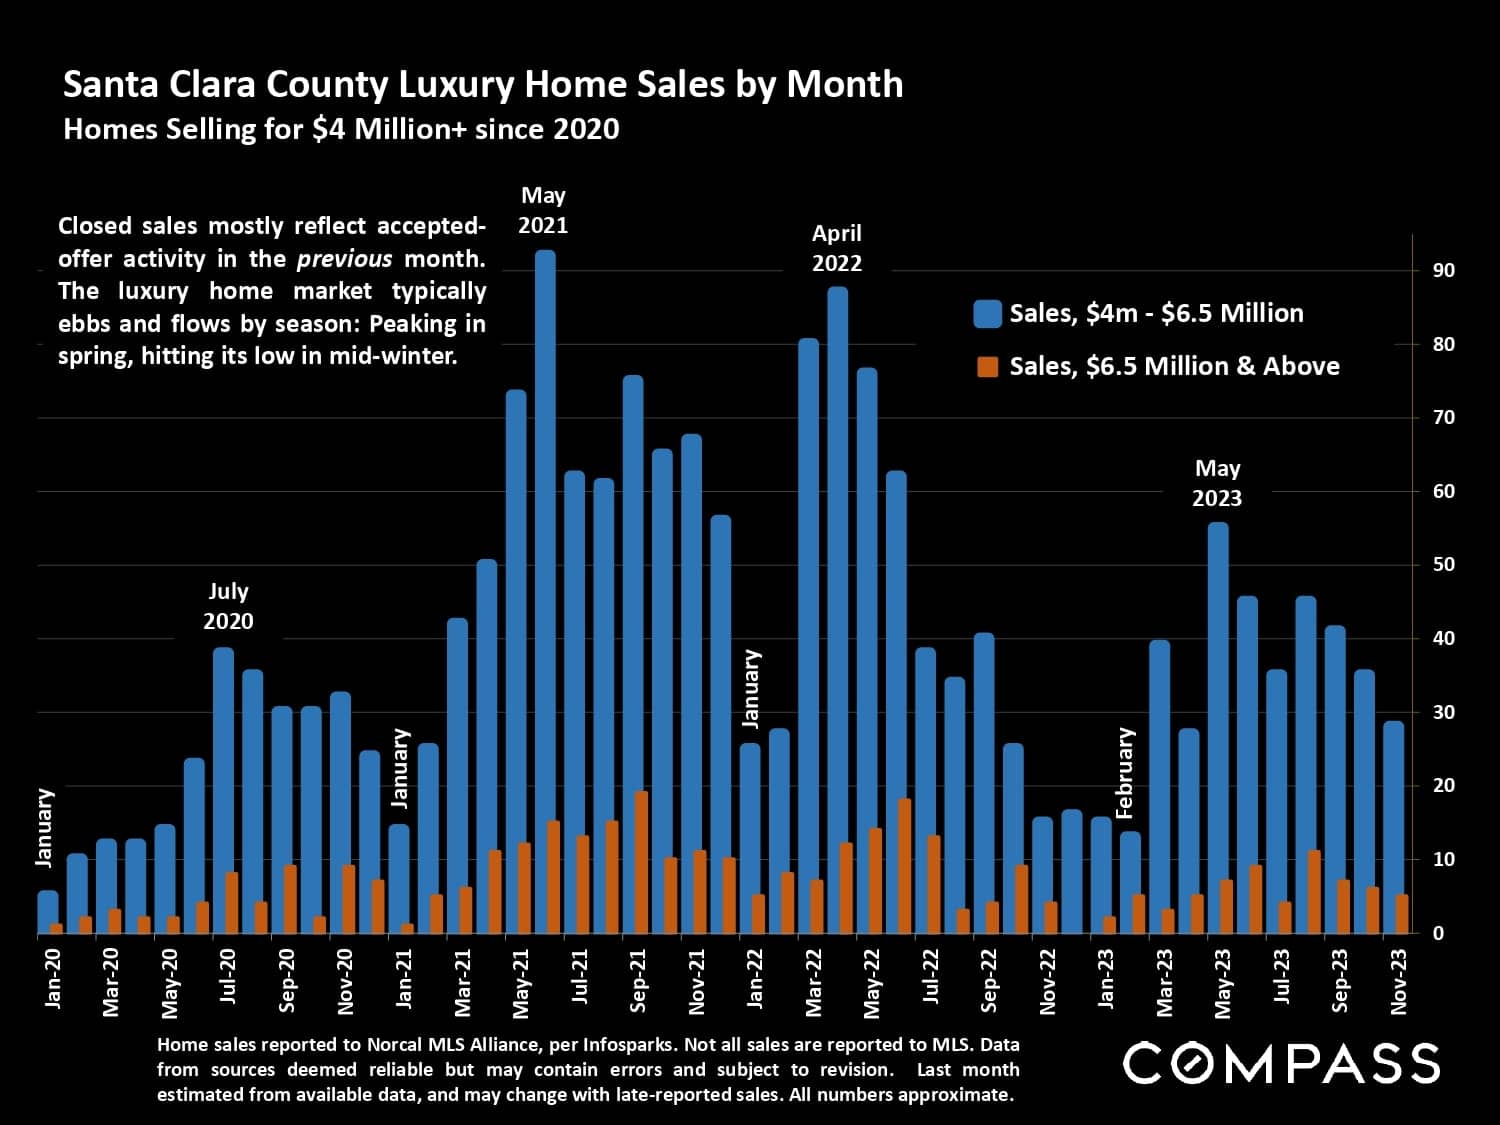
Chart of monthly Santa Clara County luxury home sales from 2020 to 2023, split by price range.

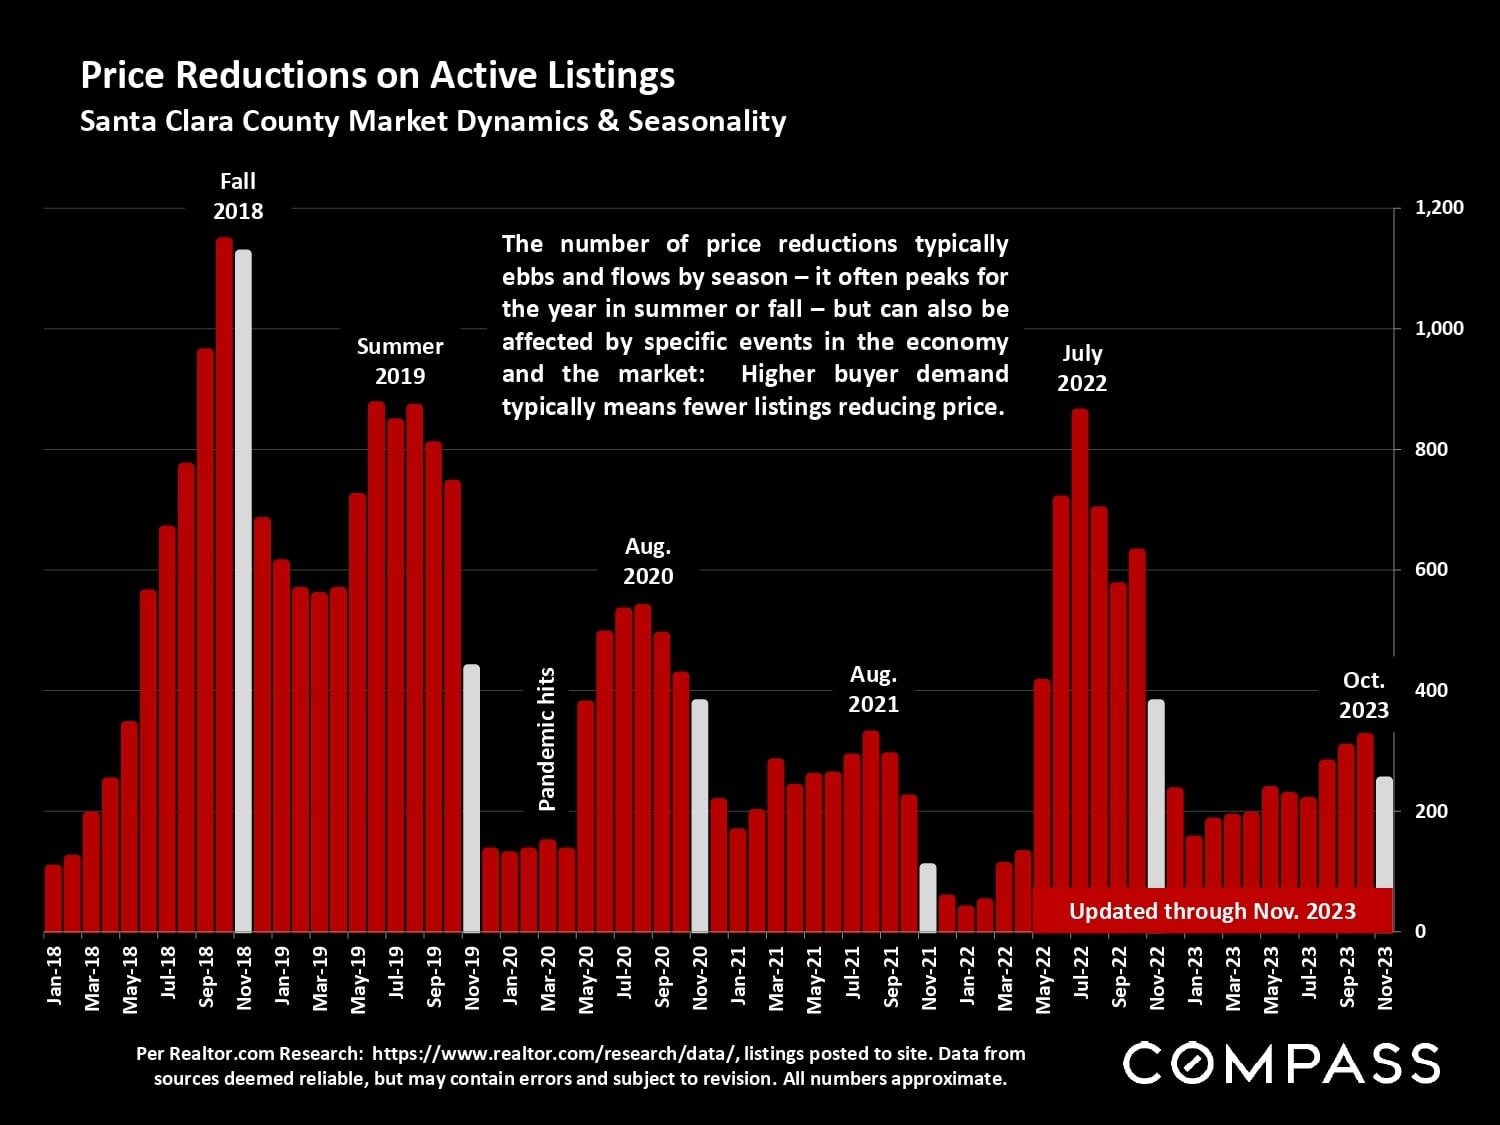
Bar chart of Santa Clara County listing price reductions from 2018 to 2023, with seasonal peaks and a November 2023 update.

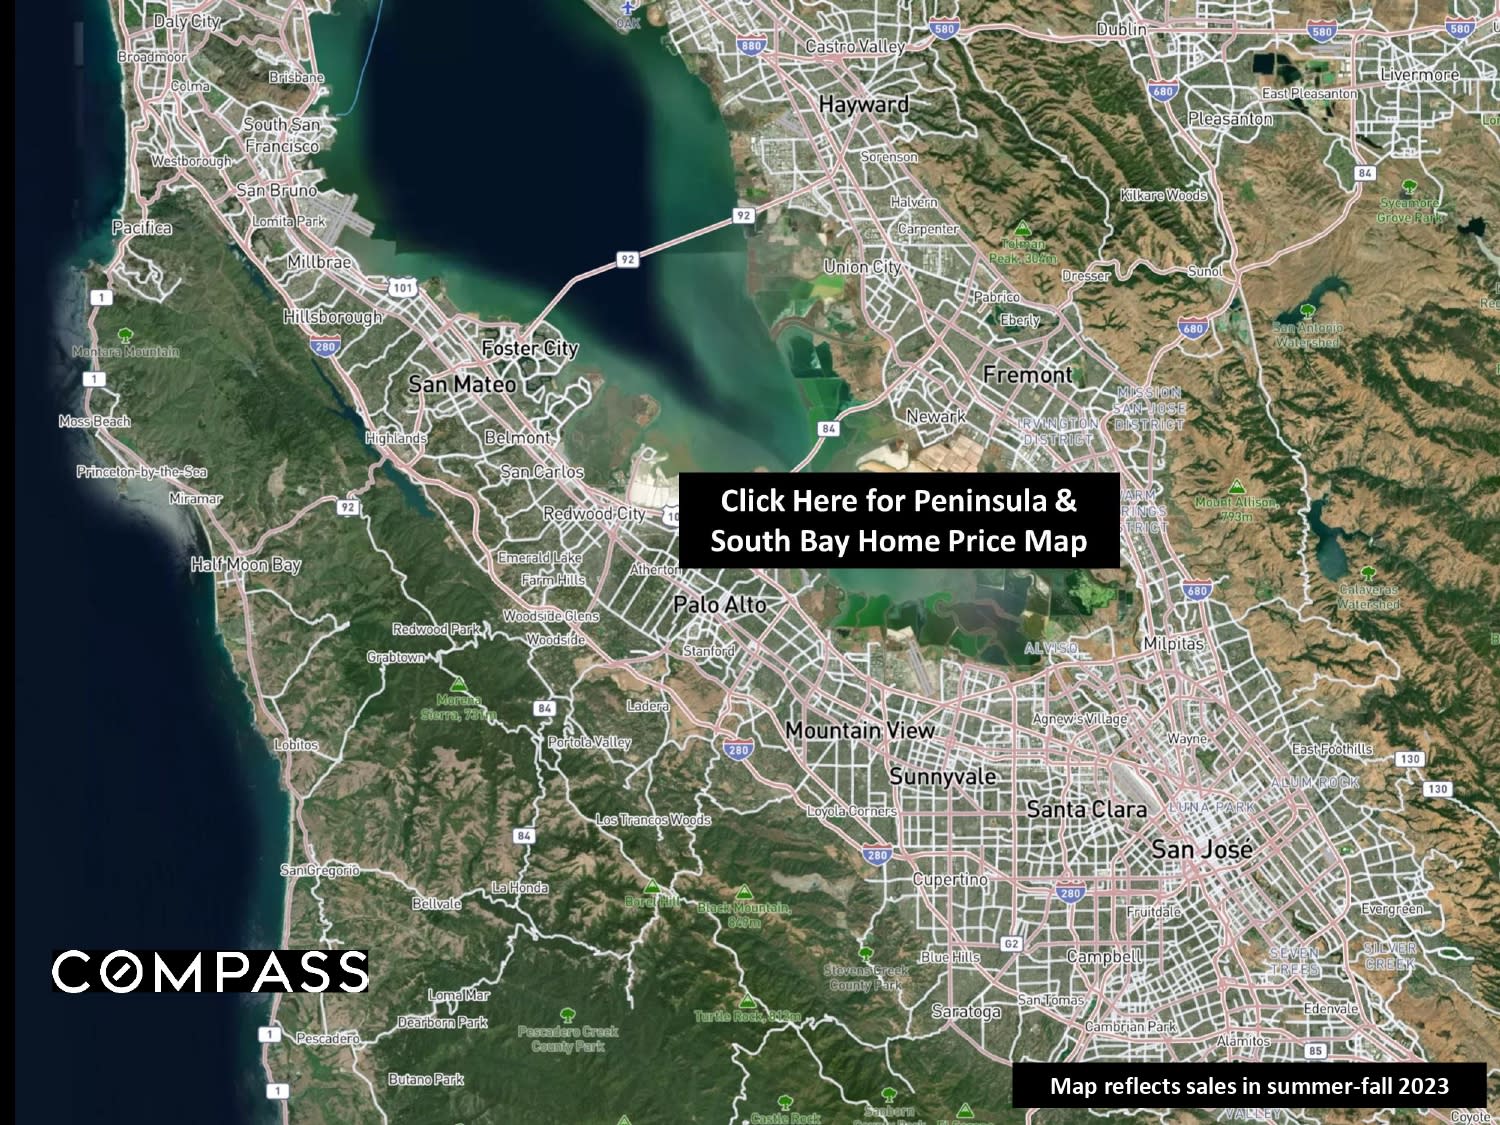
Map of the Peninsula and South Bay showing labeled cities, with a Compass logo and summer-fall 2023 sales note.

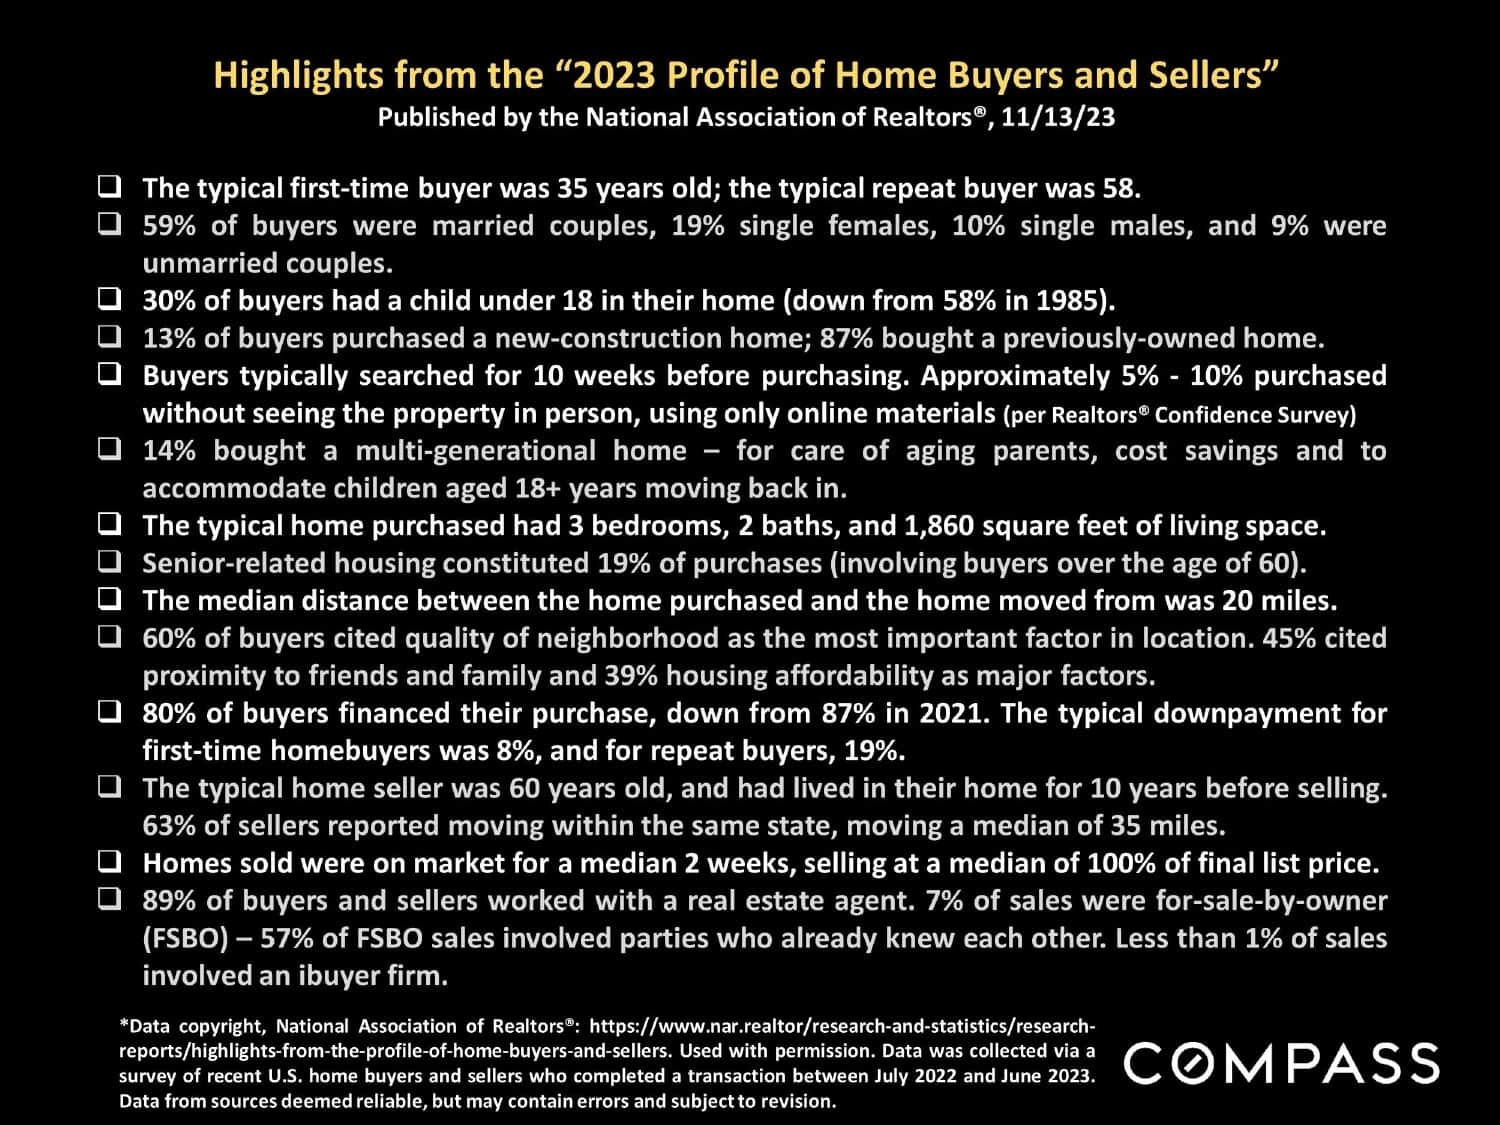
Infographic summarizing 2023 U.S. home buyer and seller trends from the National Association of Realtors.

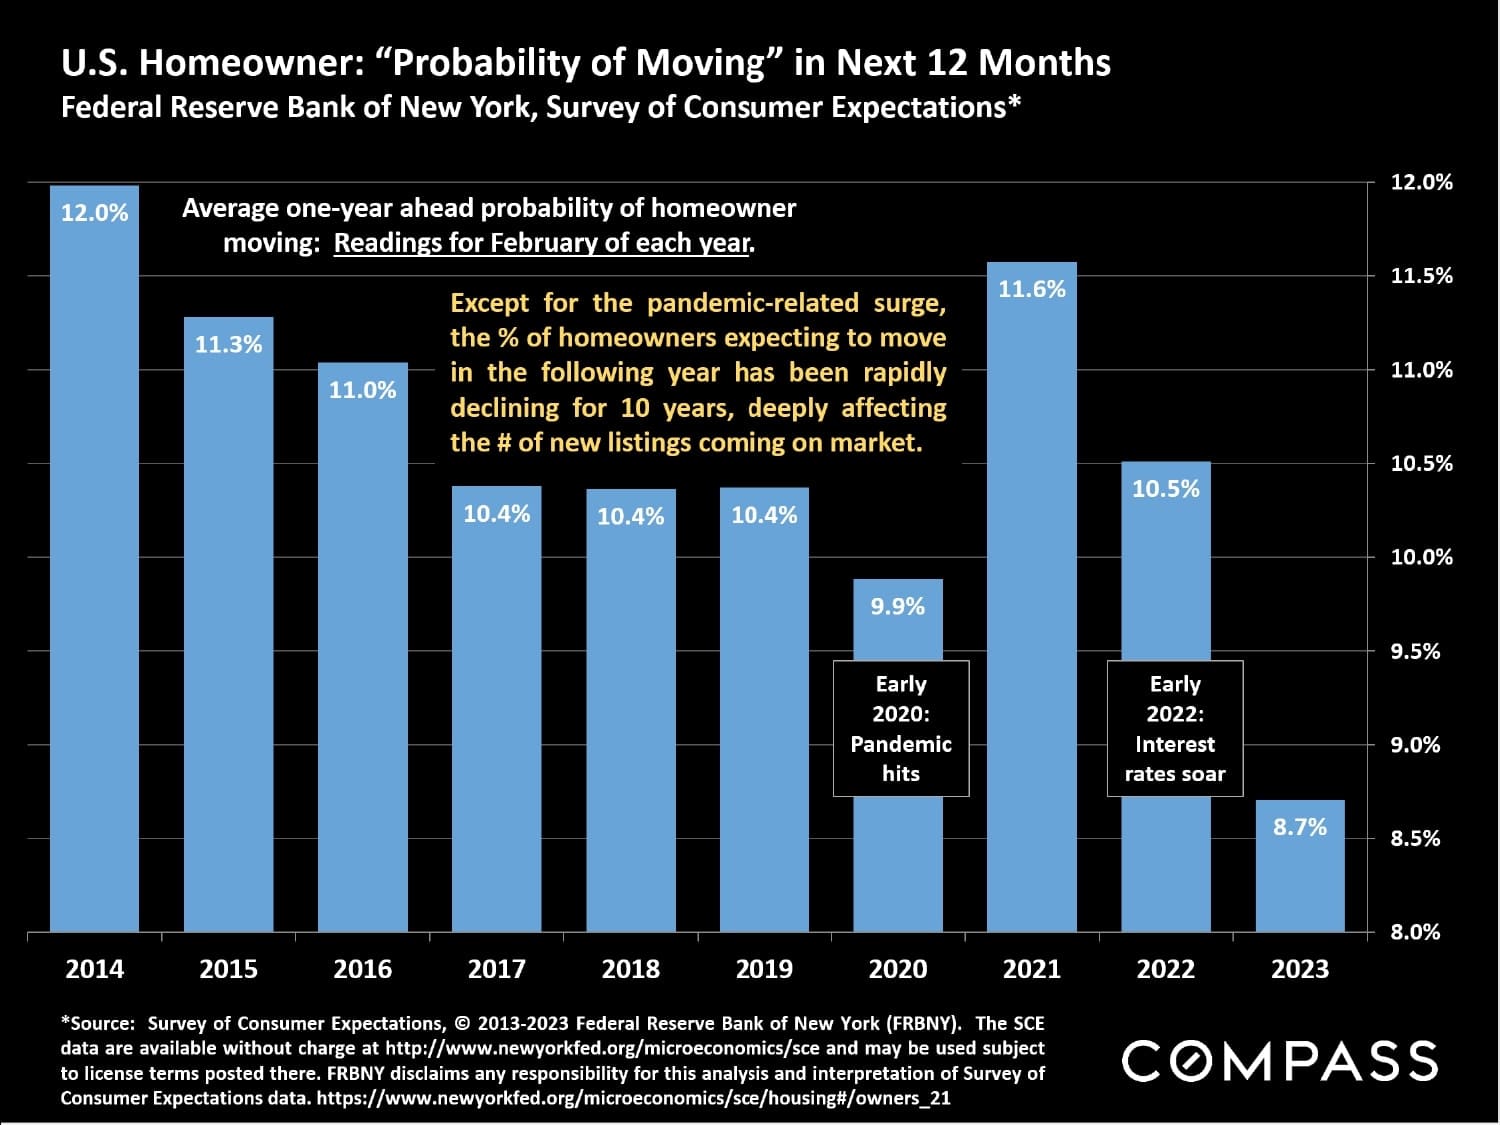
Bar chart of U.S. homeowners’ moving probability, falling to 8.7% in 2023 after a 2021 pandemic-era rise.

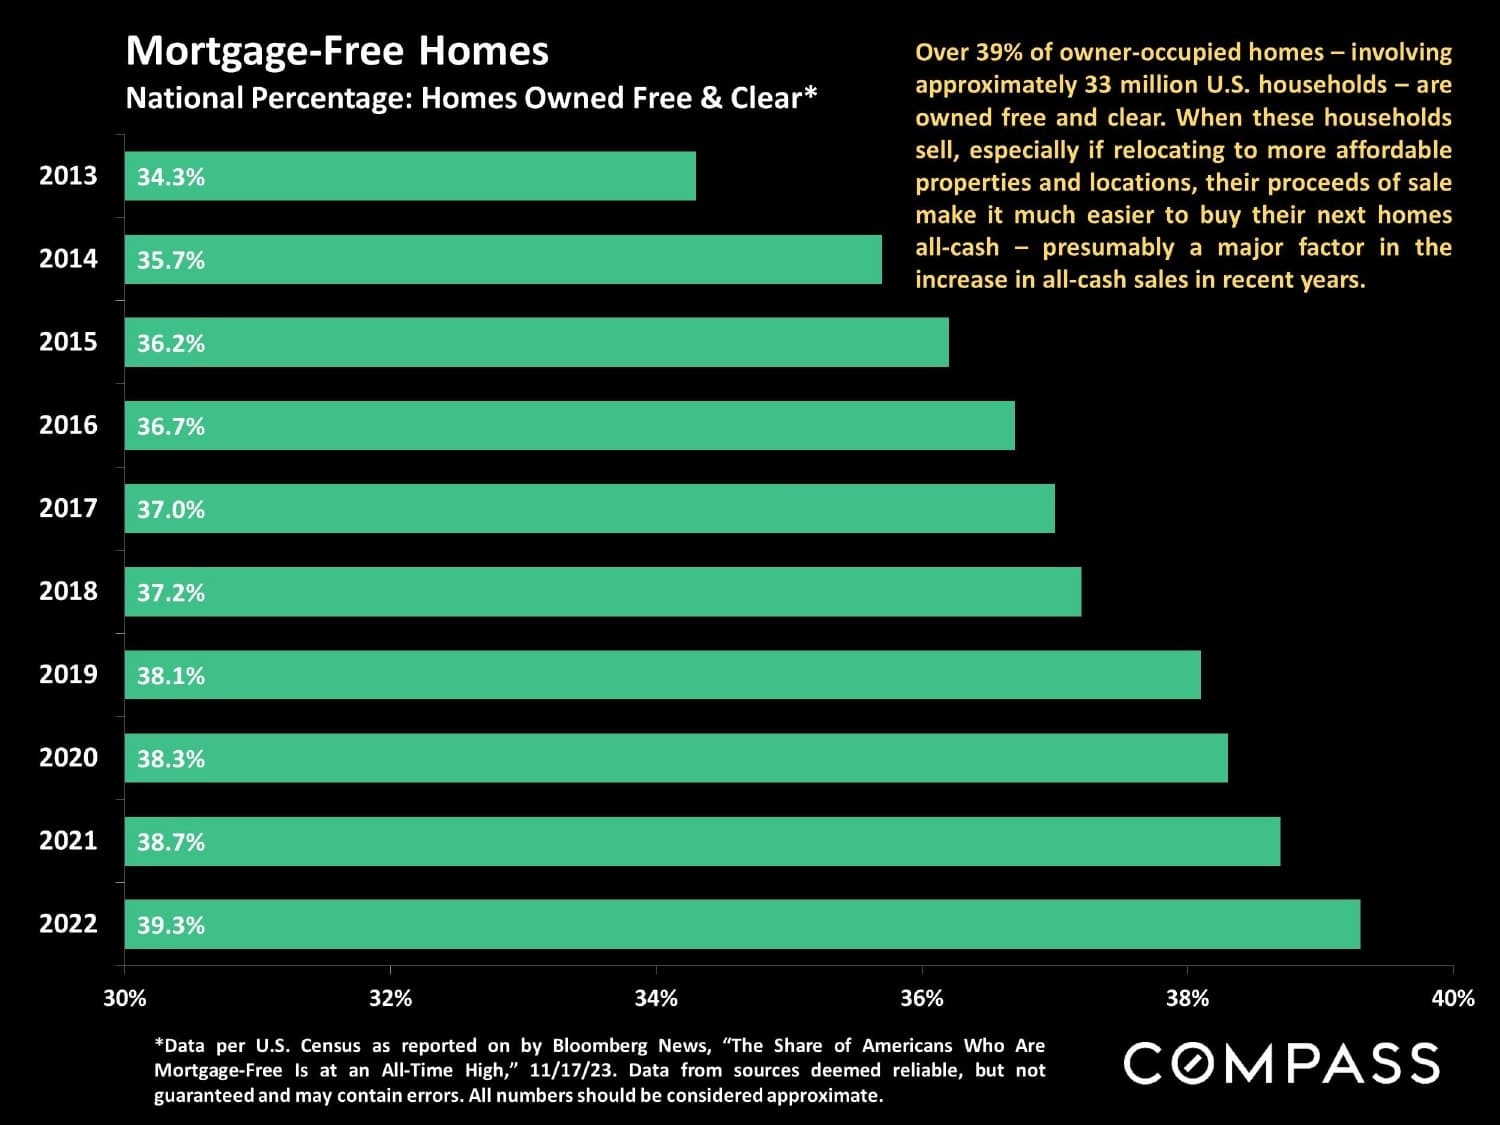
Bar chart showing U.S. mortgage-free homeownership rising from 34.3% in 2013 to 39.3% in 2022.

Compass National Real Estate Insights graphic featuring a mountain cabin and a link to the new market report.

Compass report graphic comparing San Francisco Bay Area home values, with a satellite map and report-access link.

Definitions of real estate market statistics and report disclaimers for Santa Clara County, December 2023.

WORK WITH US

We offer the highest level of service and expertise to our clients. Our team has built a reputation for consistently representing the finest real estate in San Francisco and Napa Valley. Results driven and dedicated to your success, whether buying, selling, renting or investing. Contact us today for a private consultation.

Contact Us