
Santa Clara County - June 2024

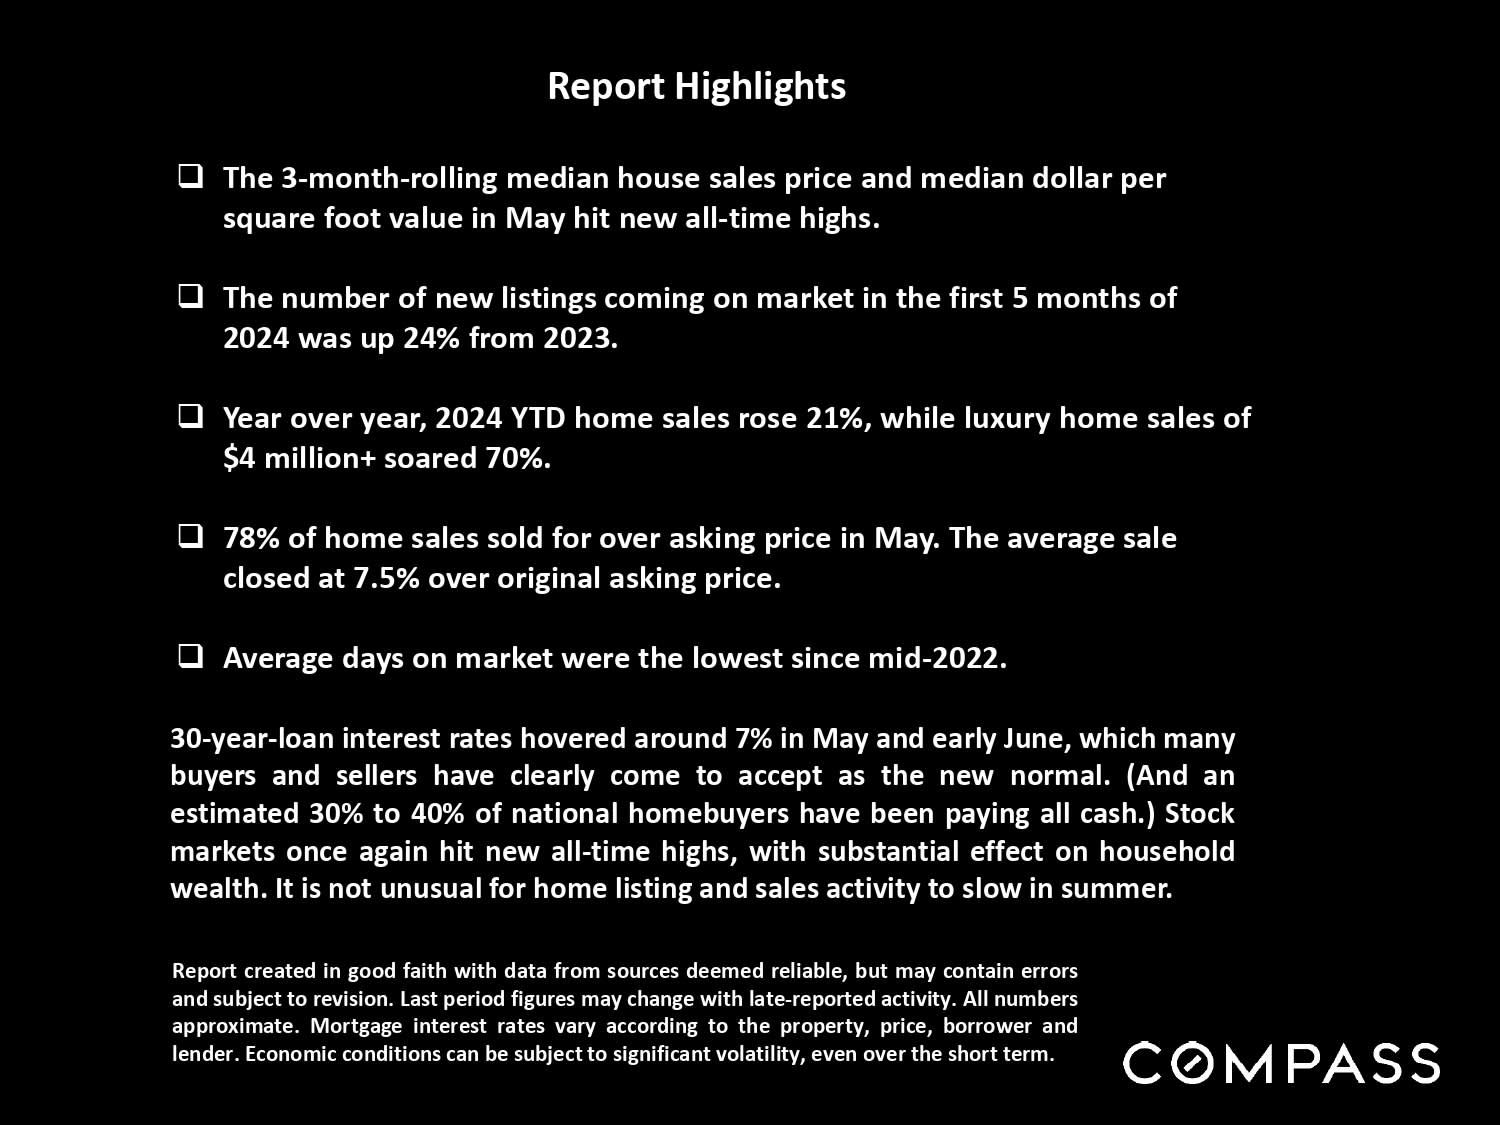
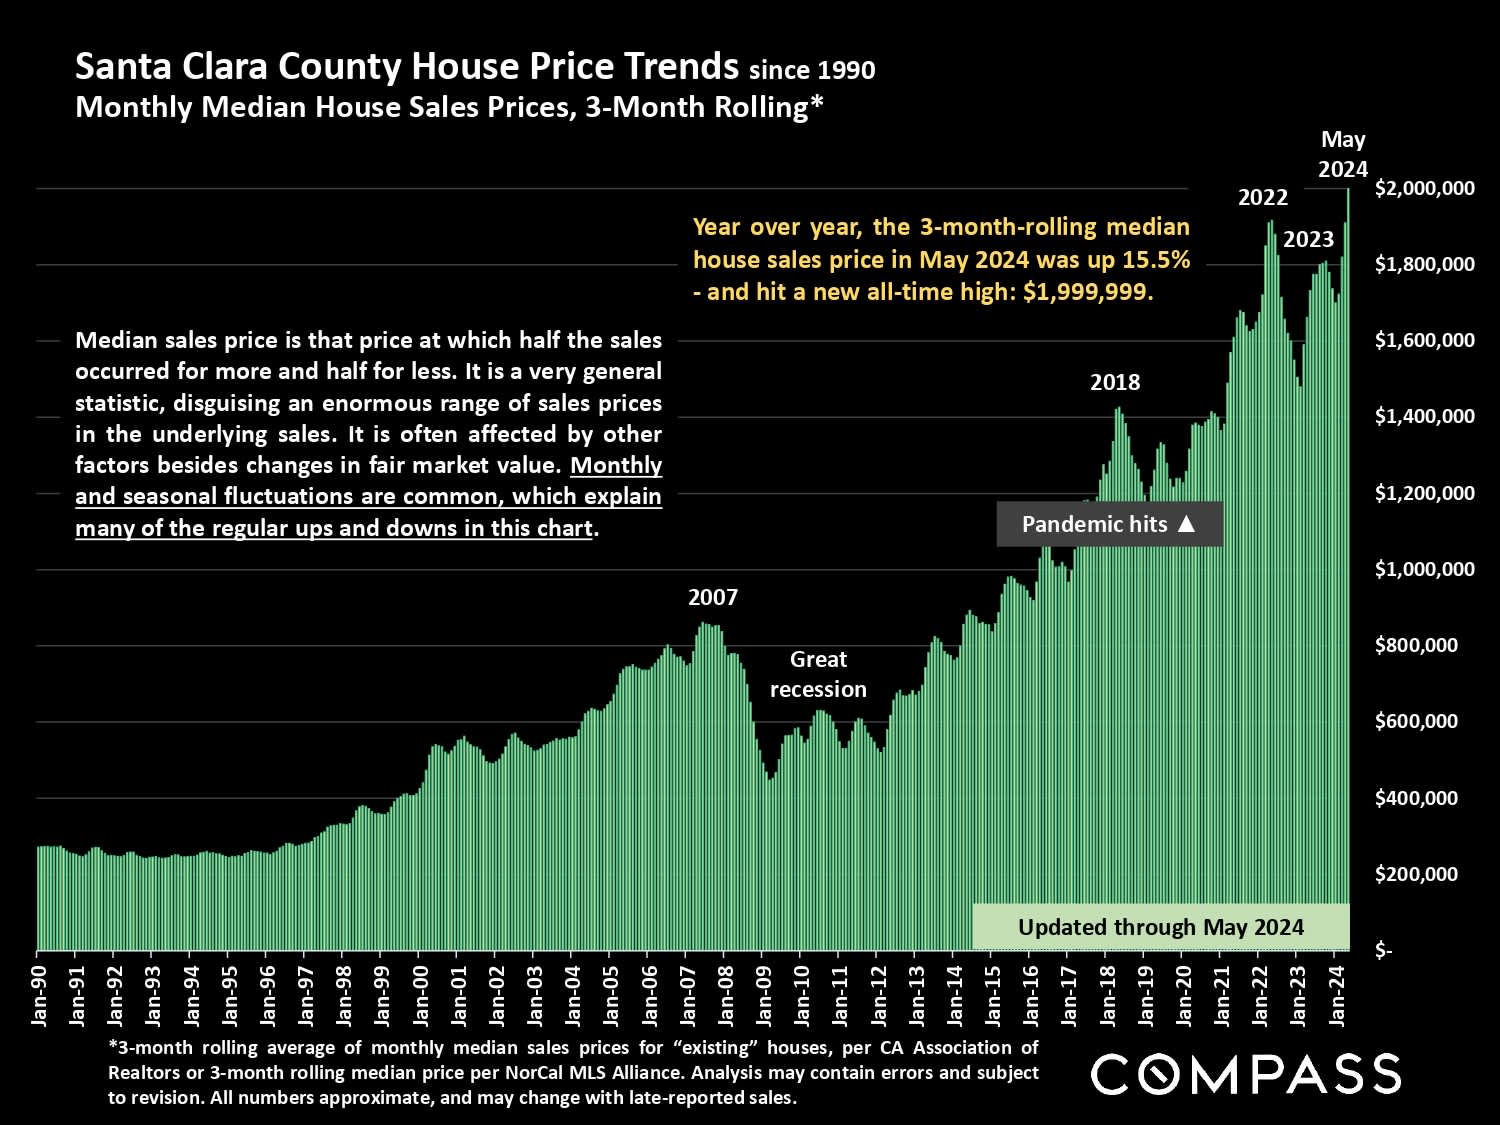
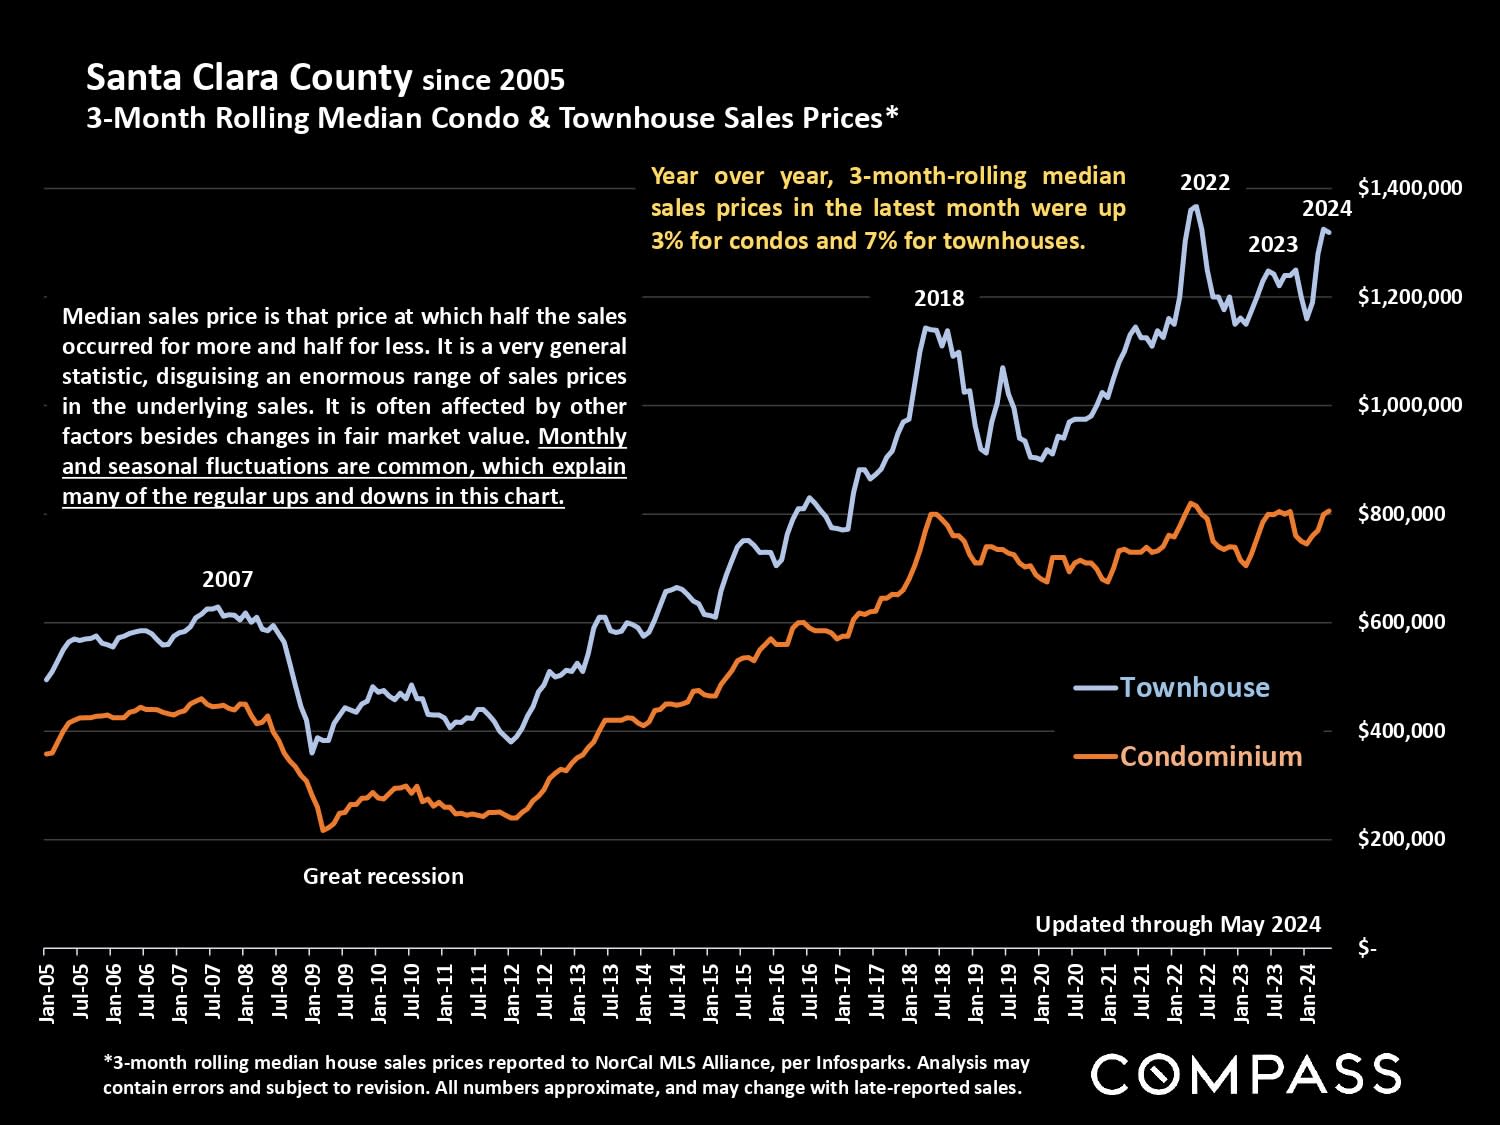
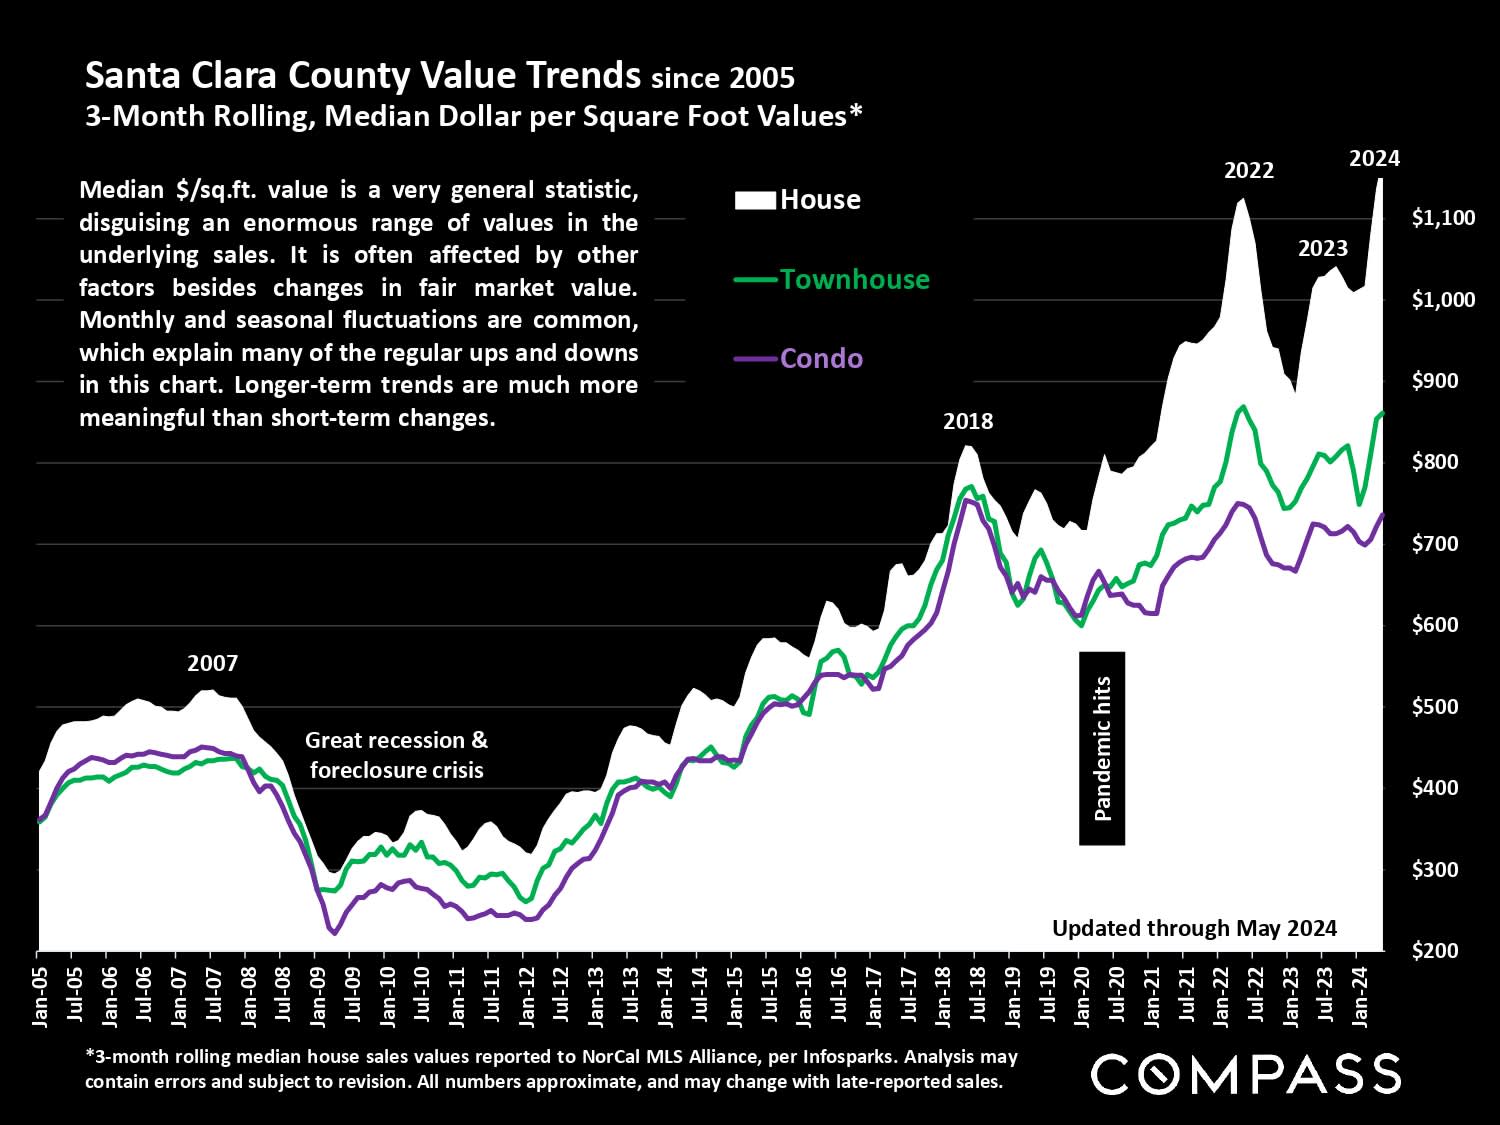
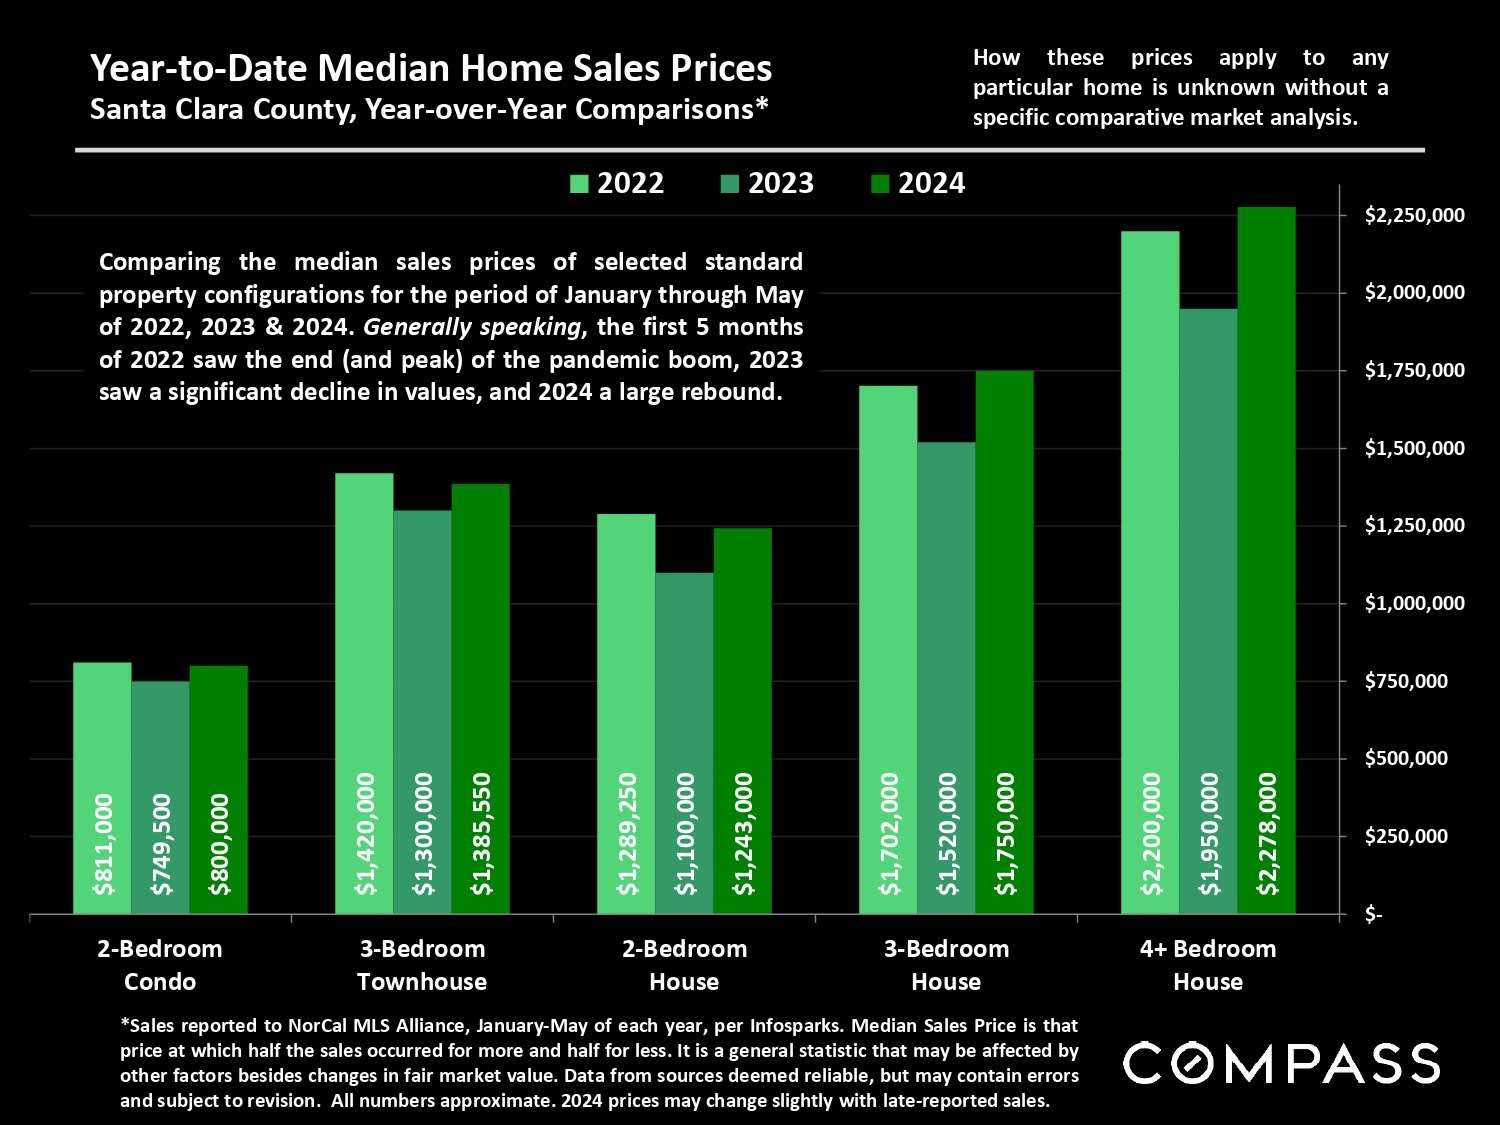
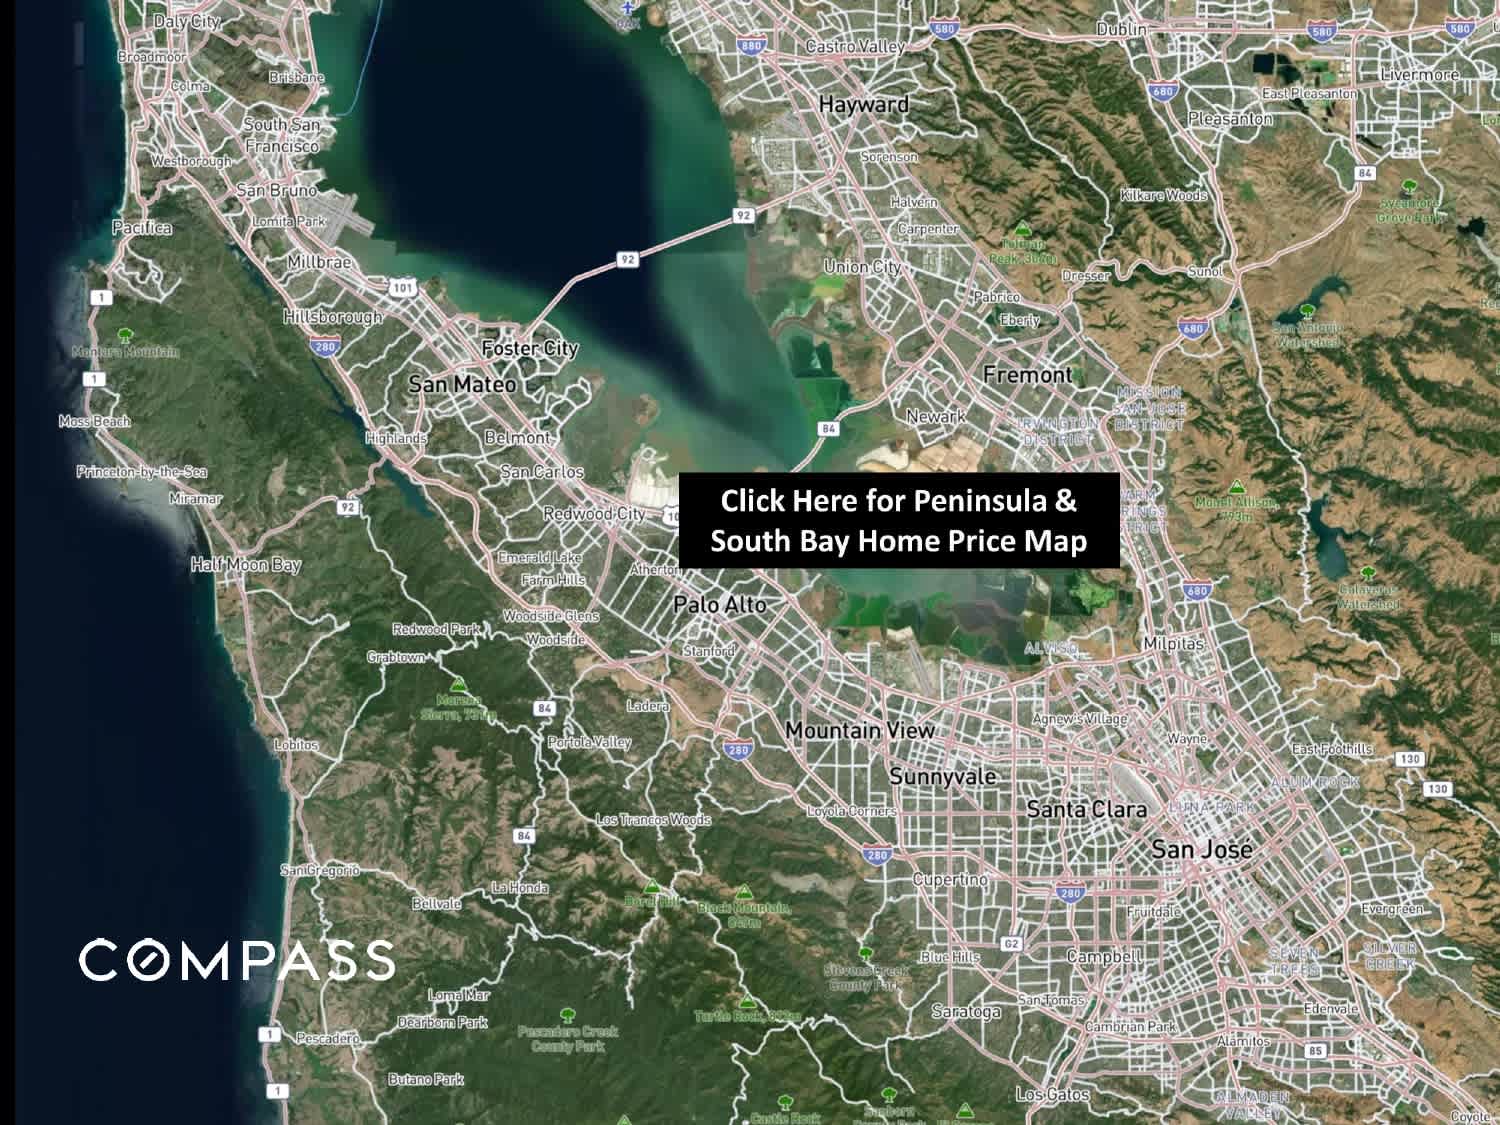
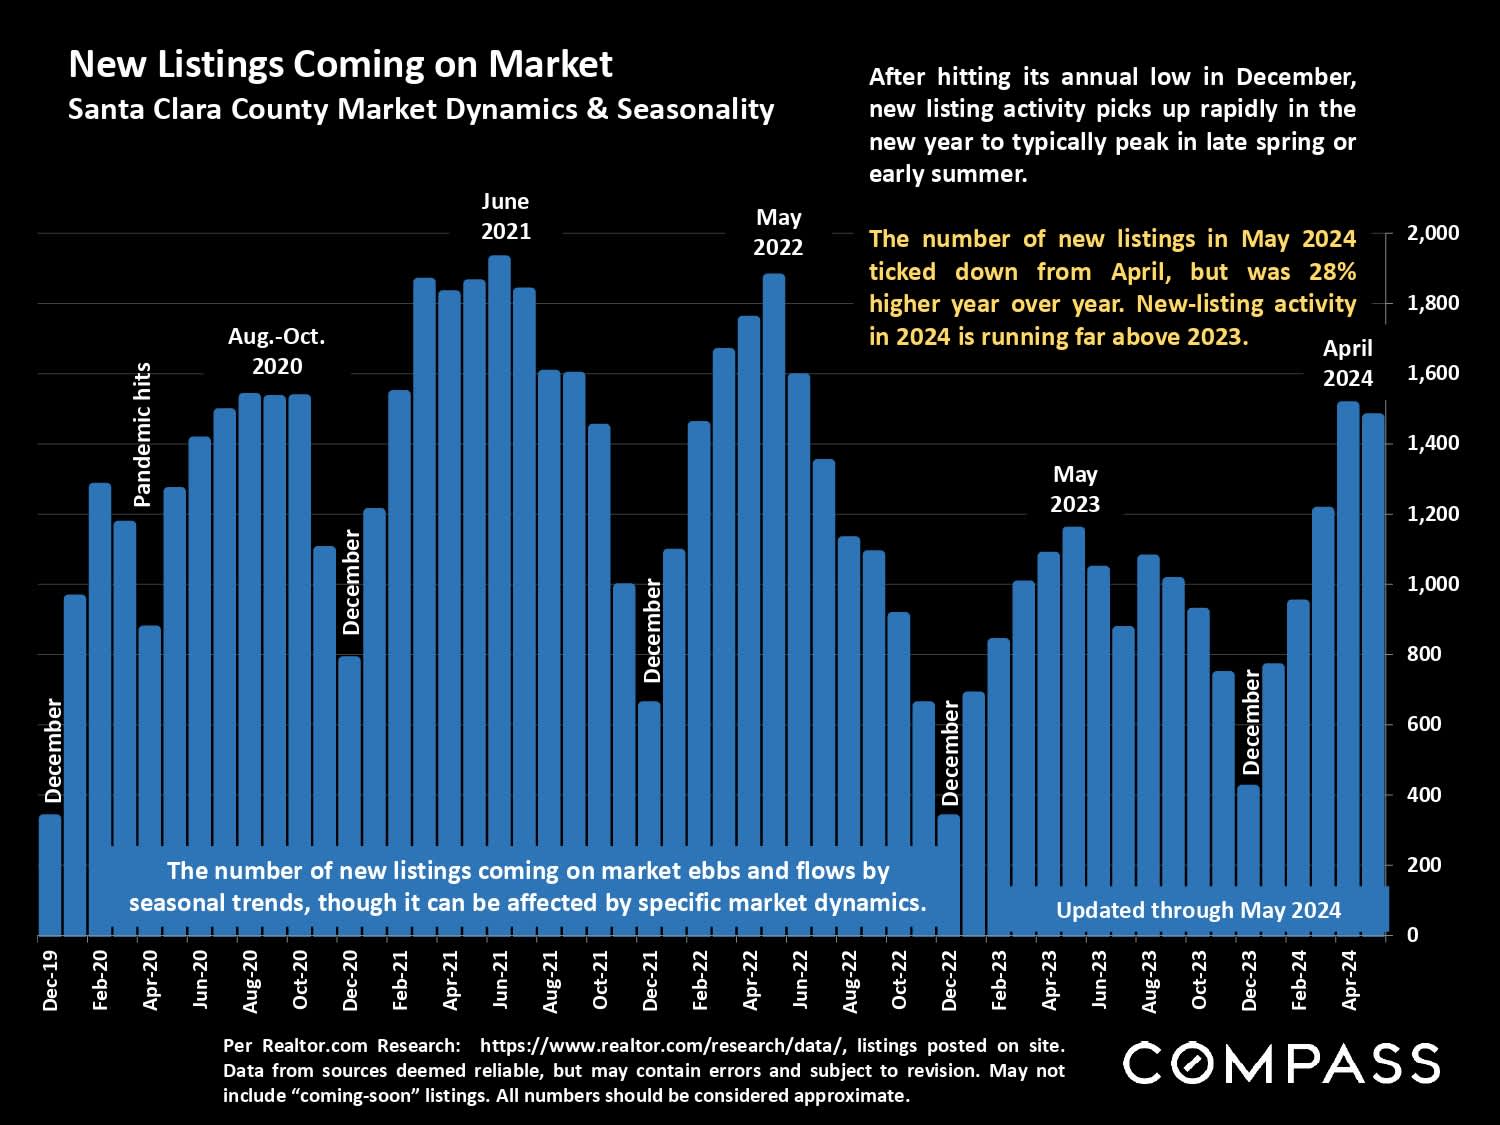
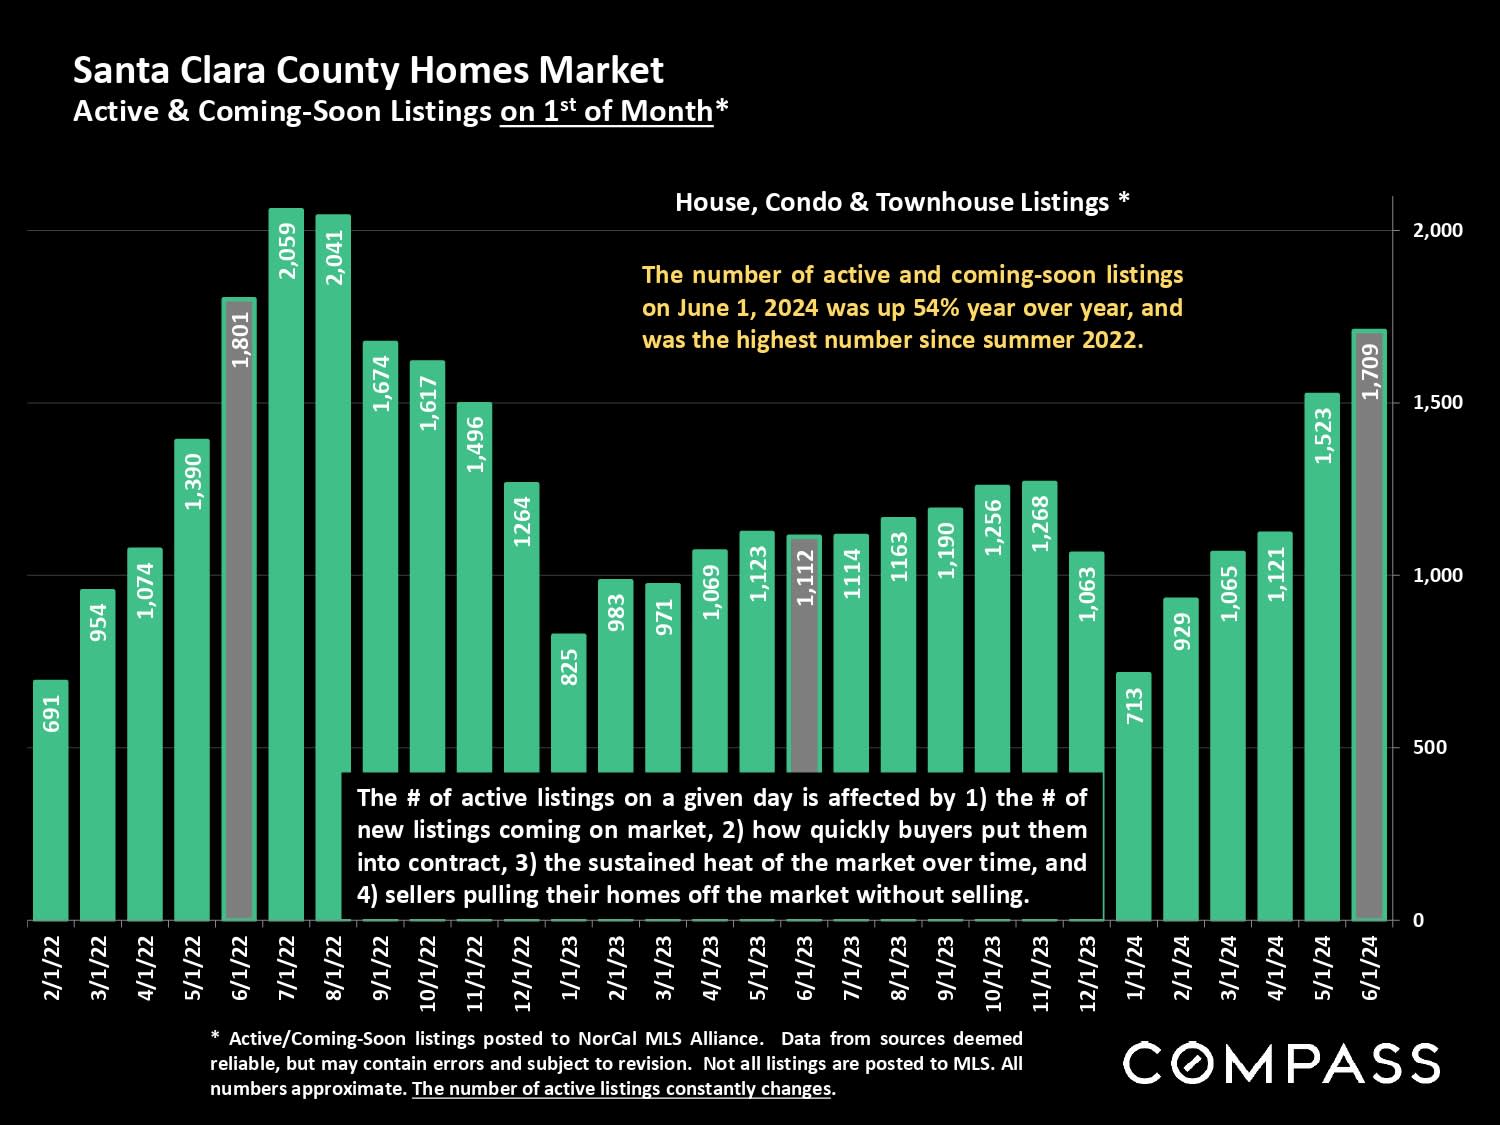
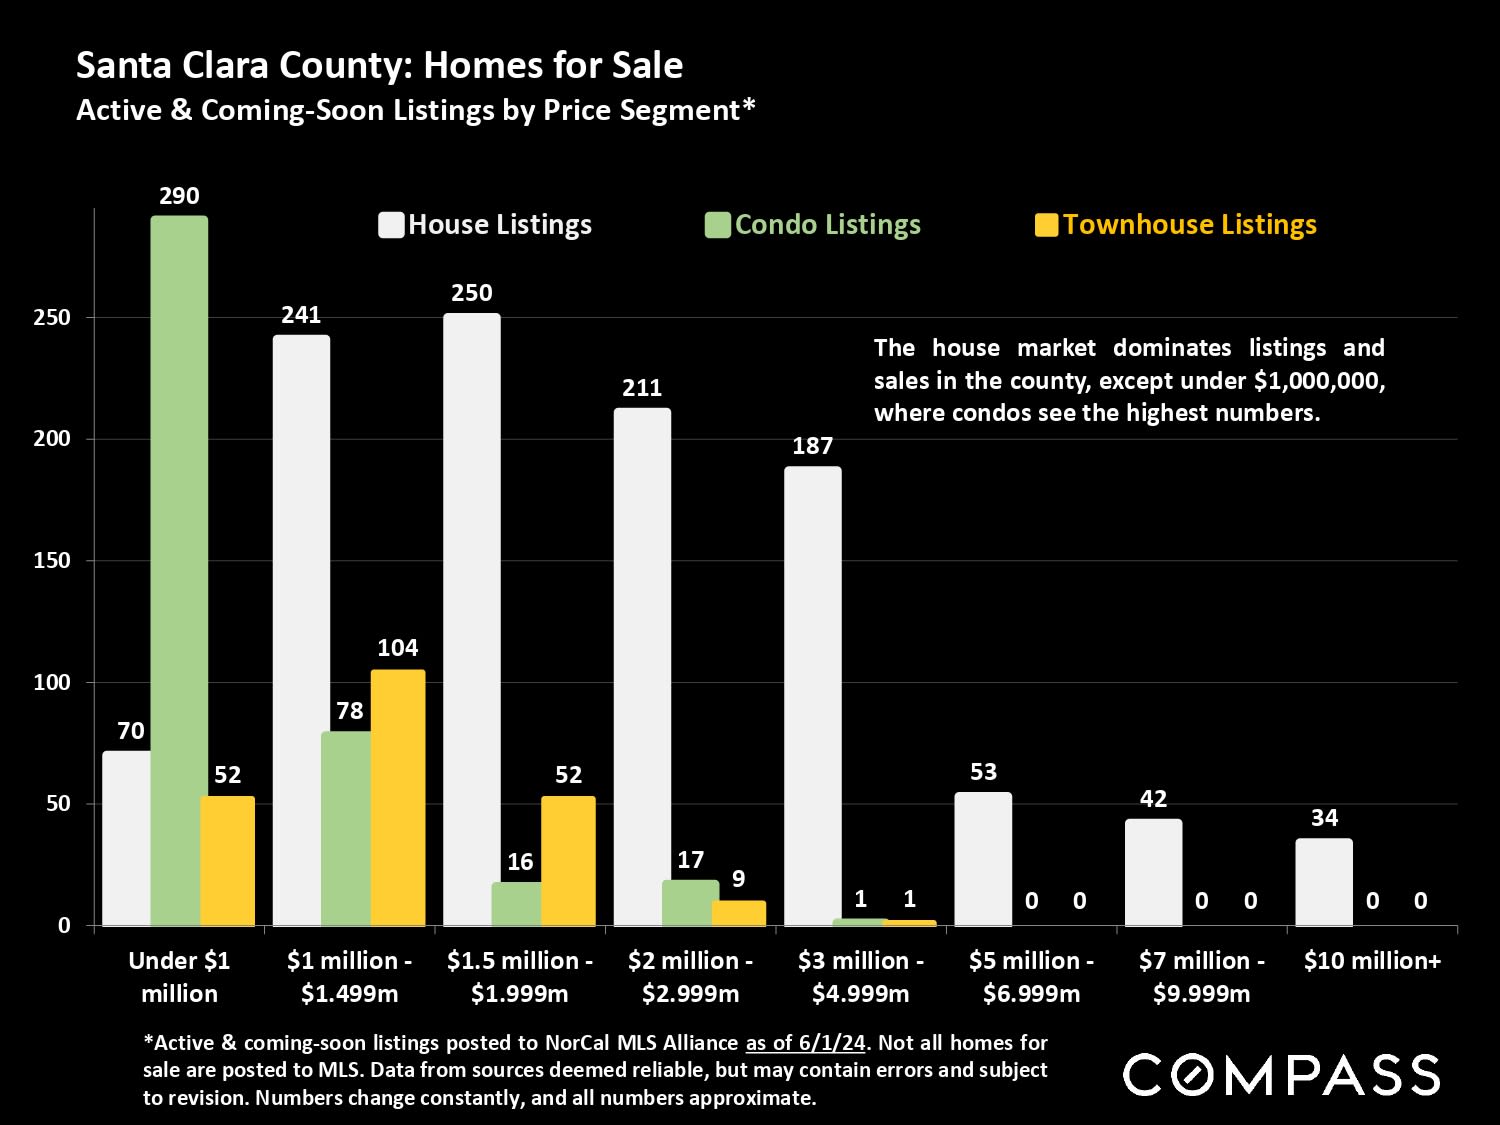
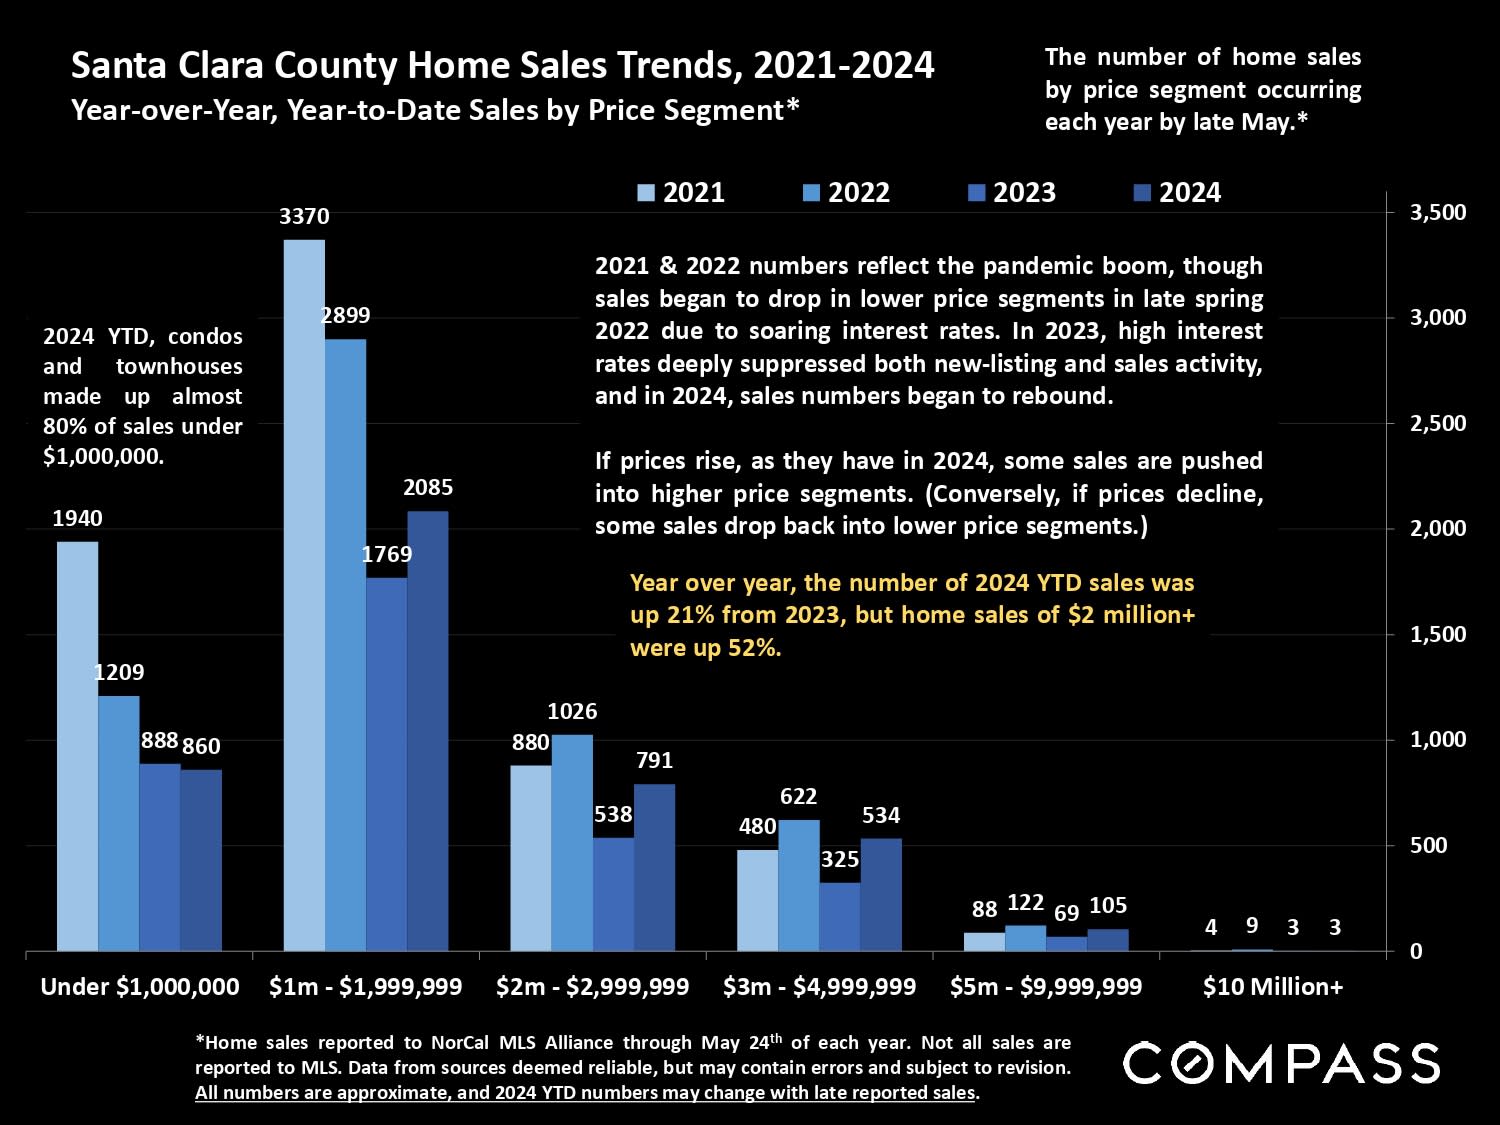
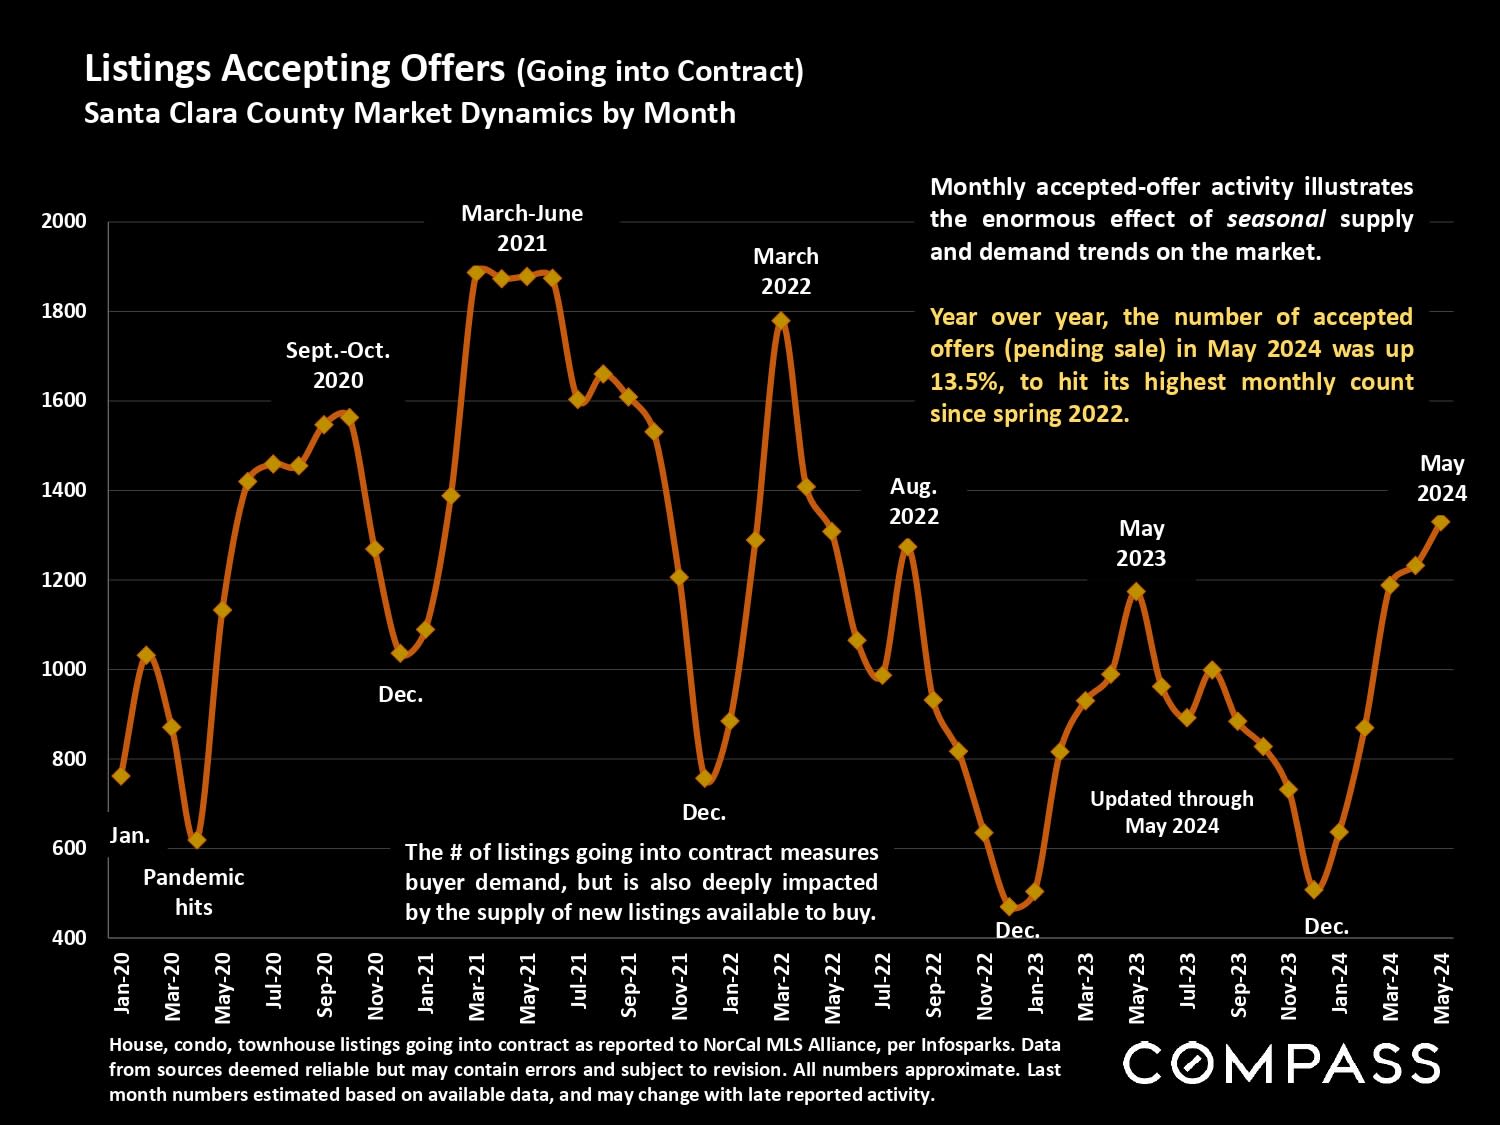
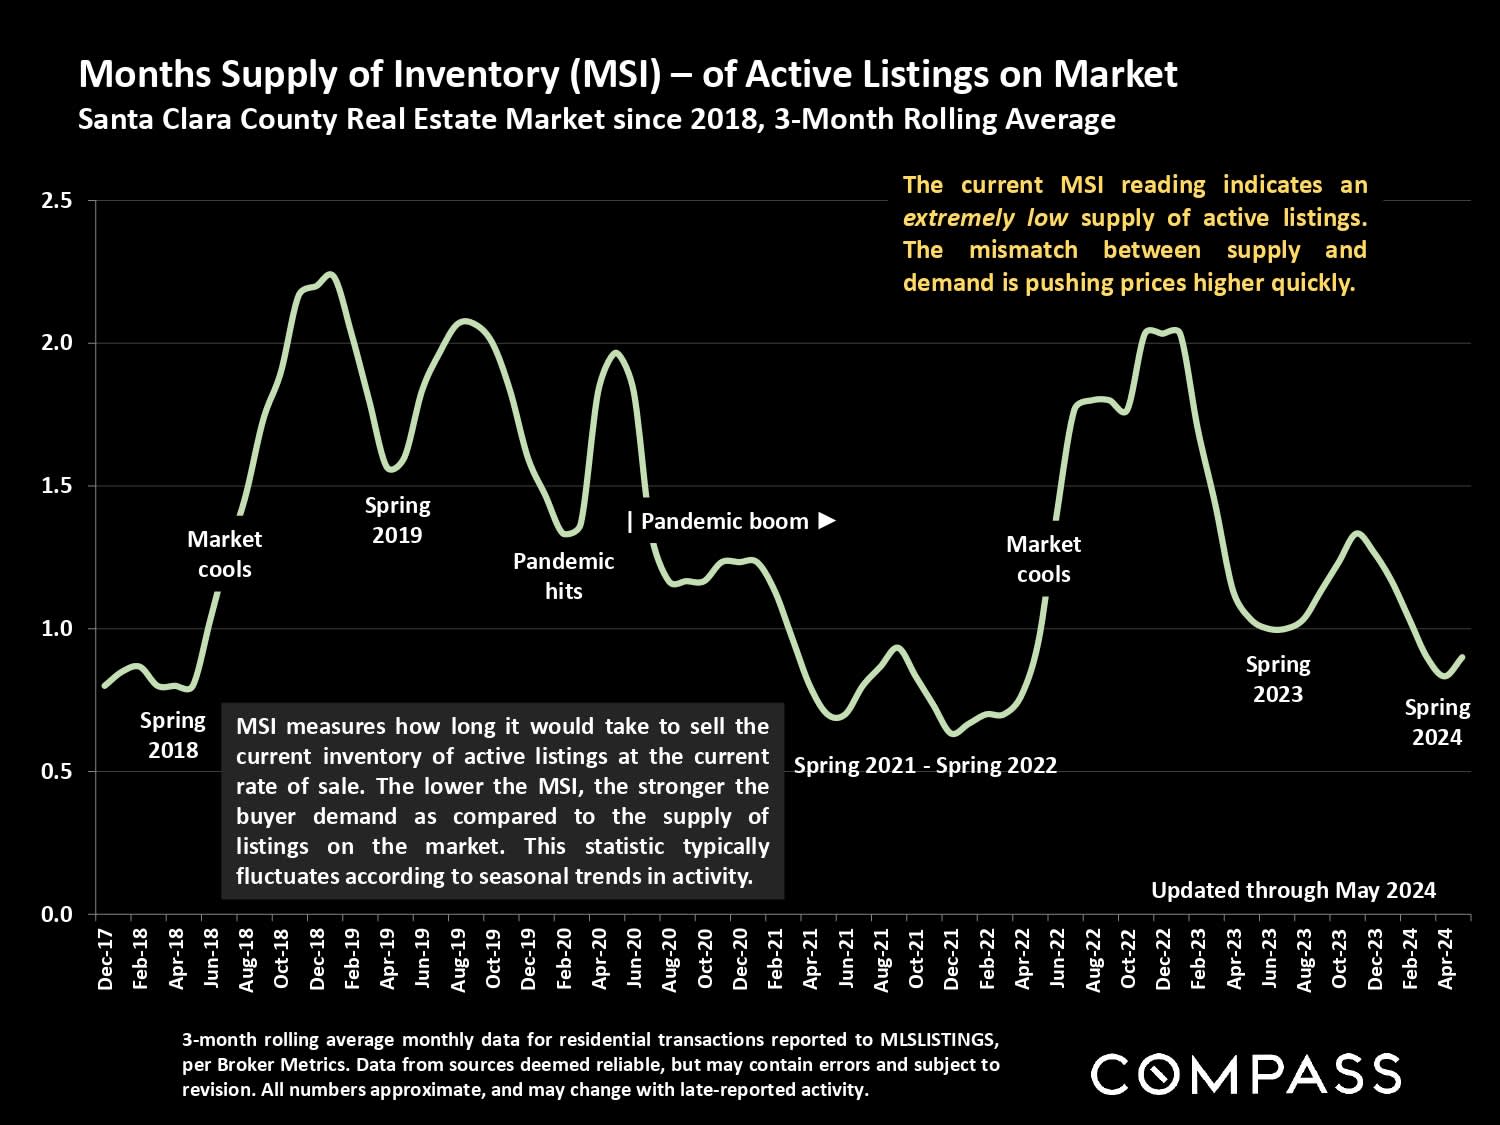
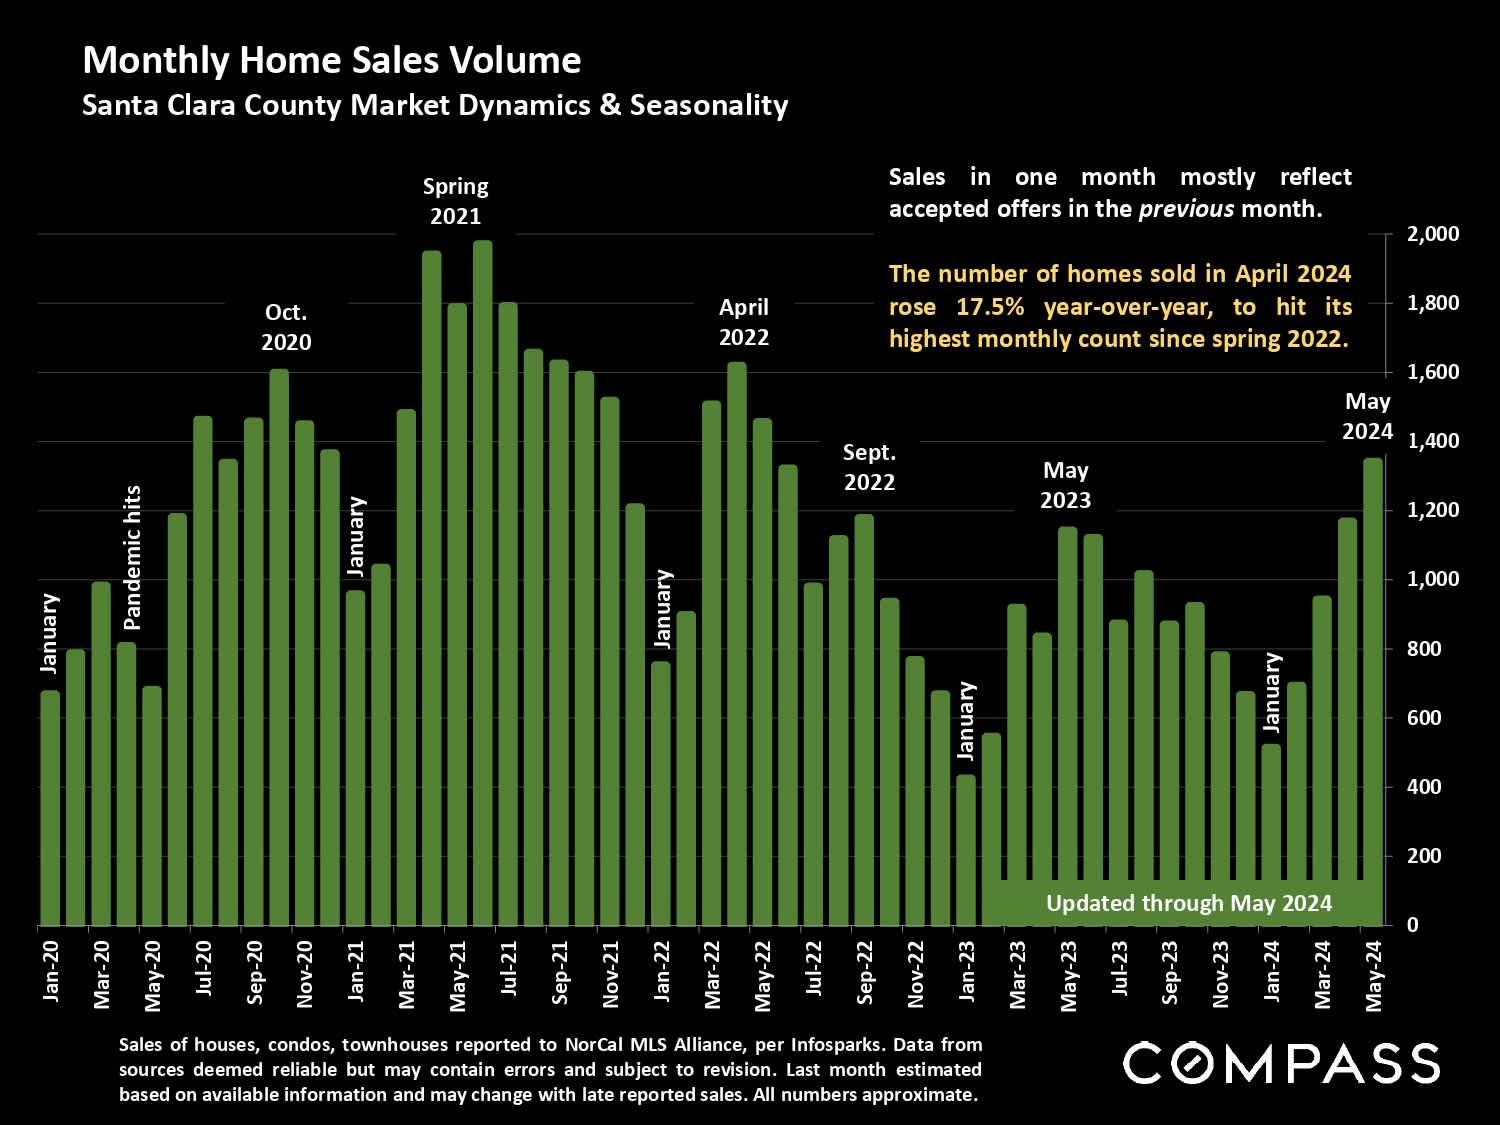
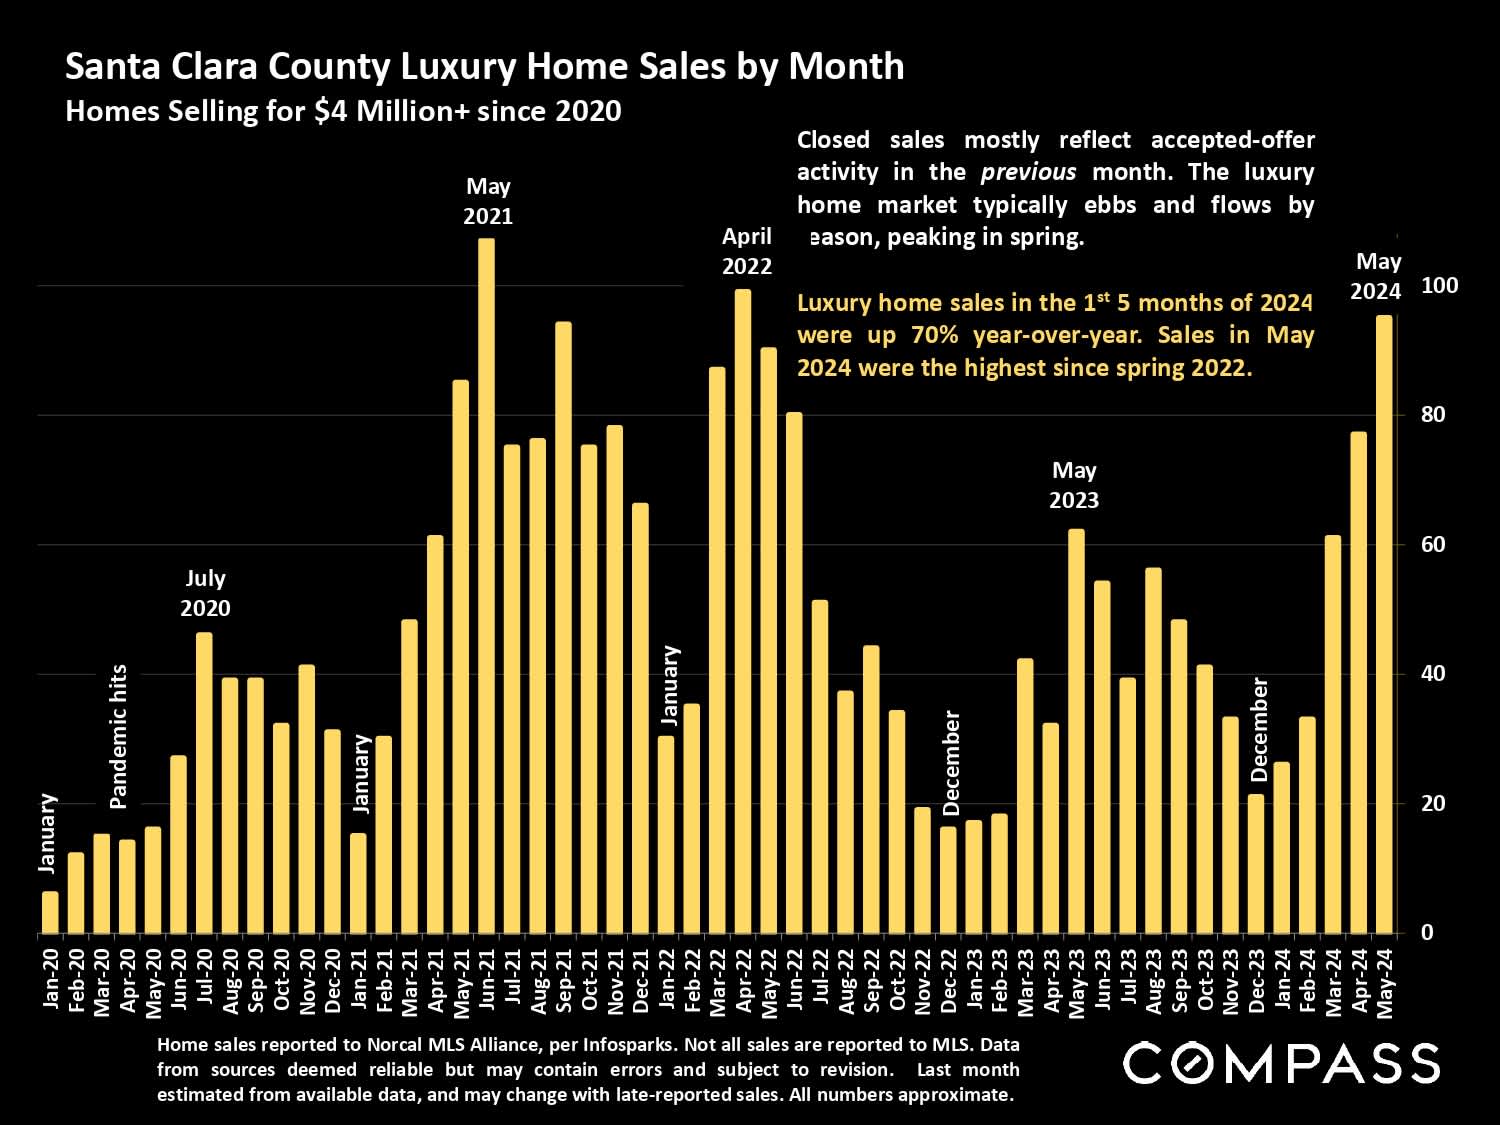
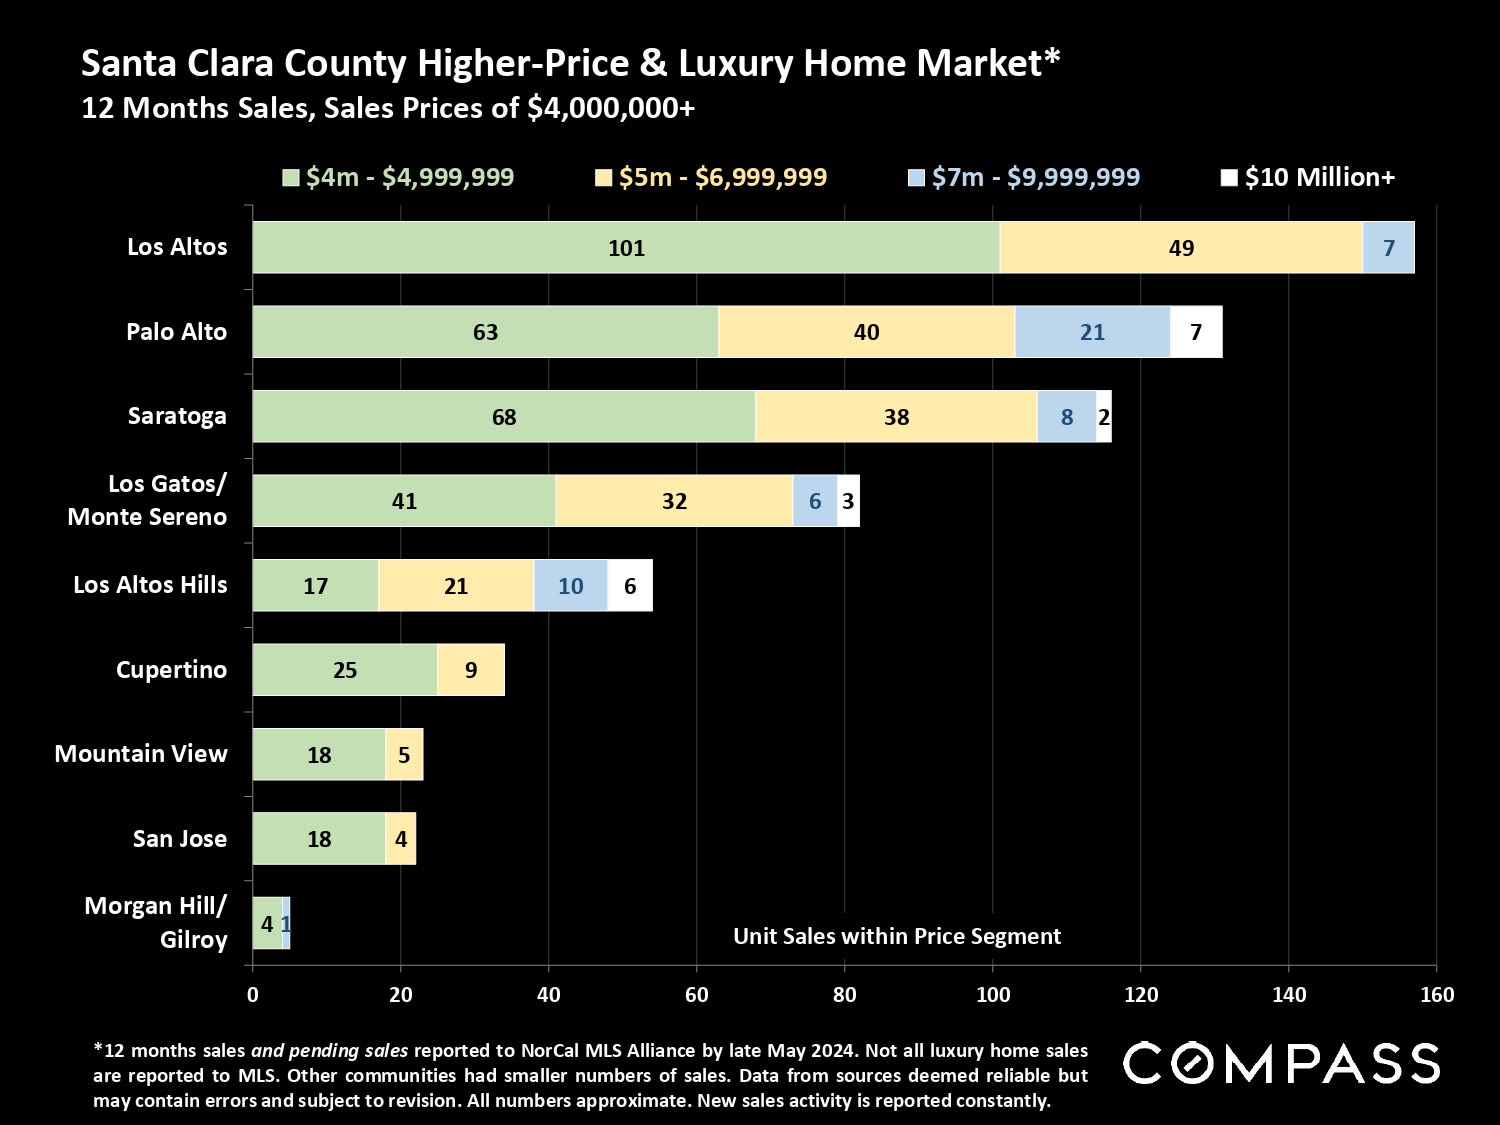
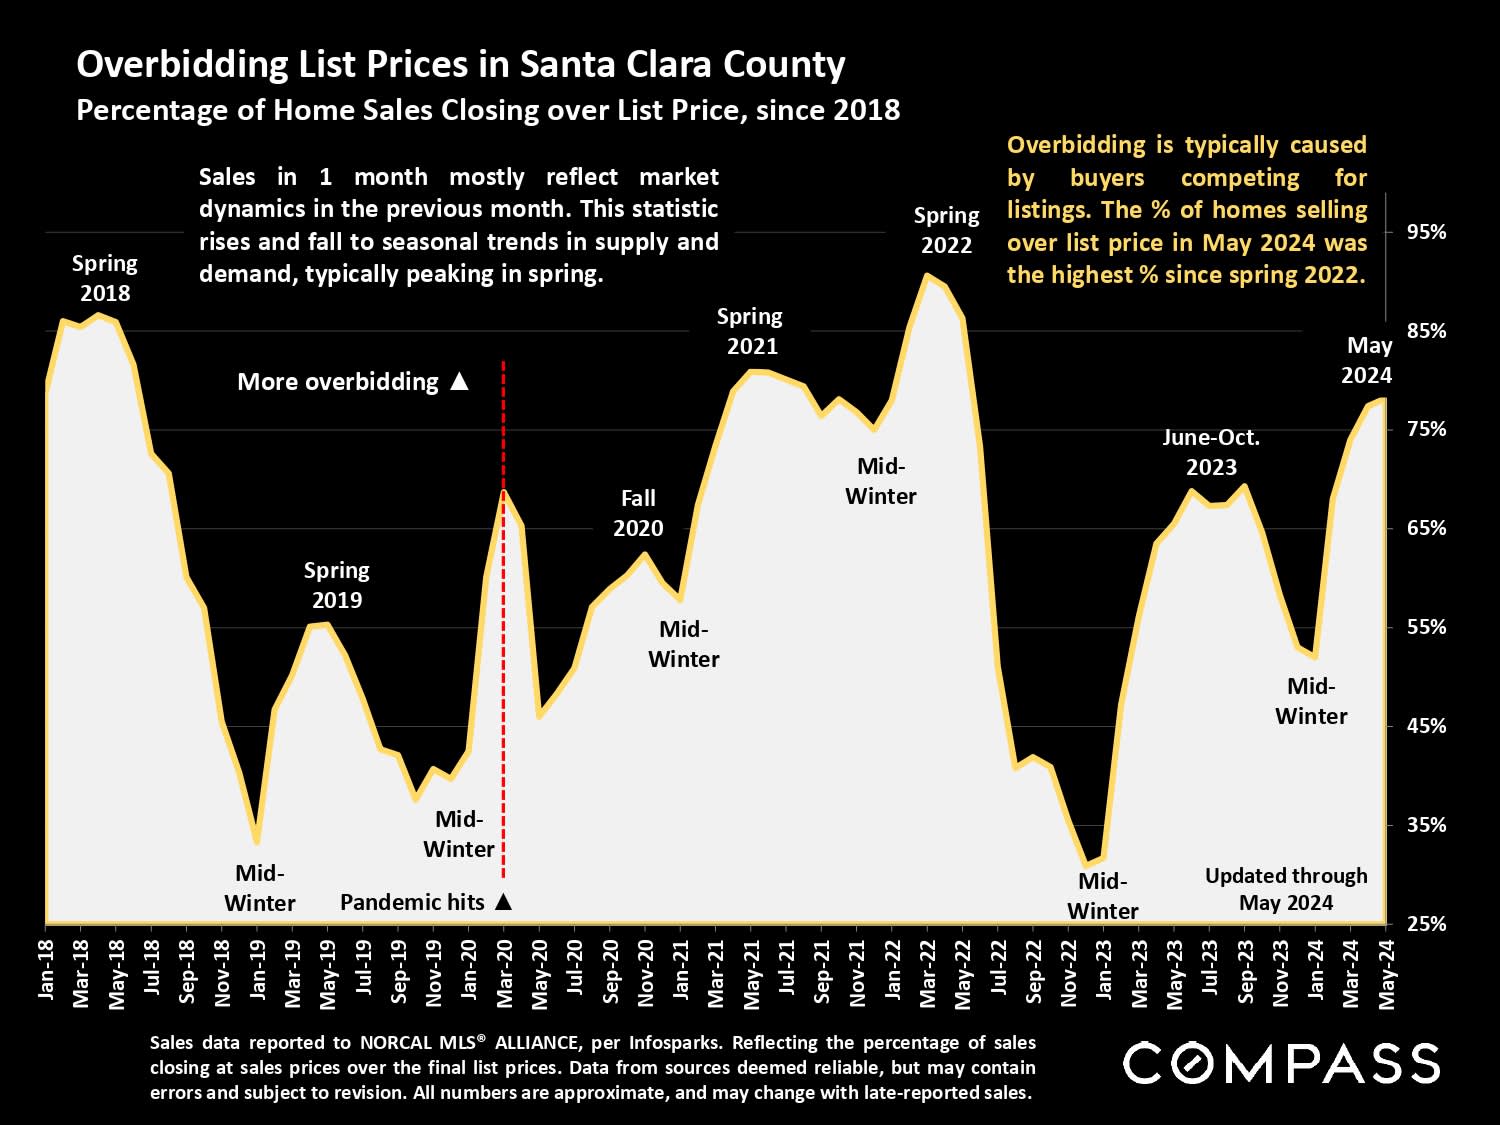
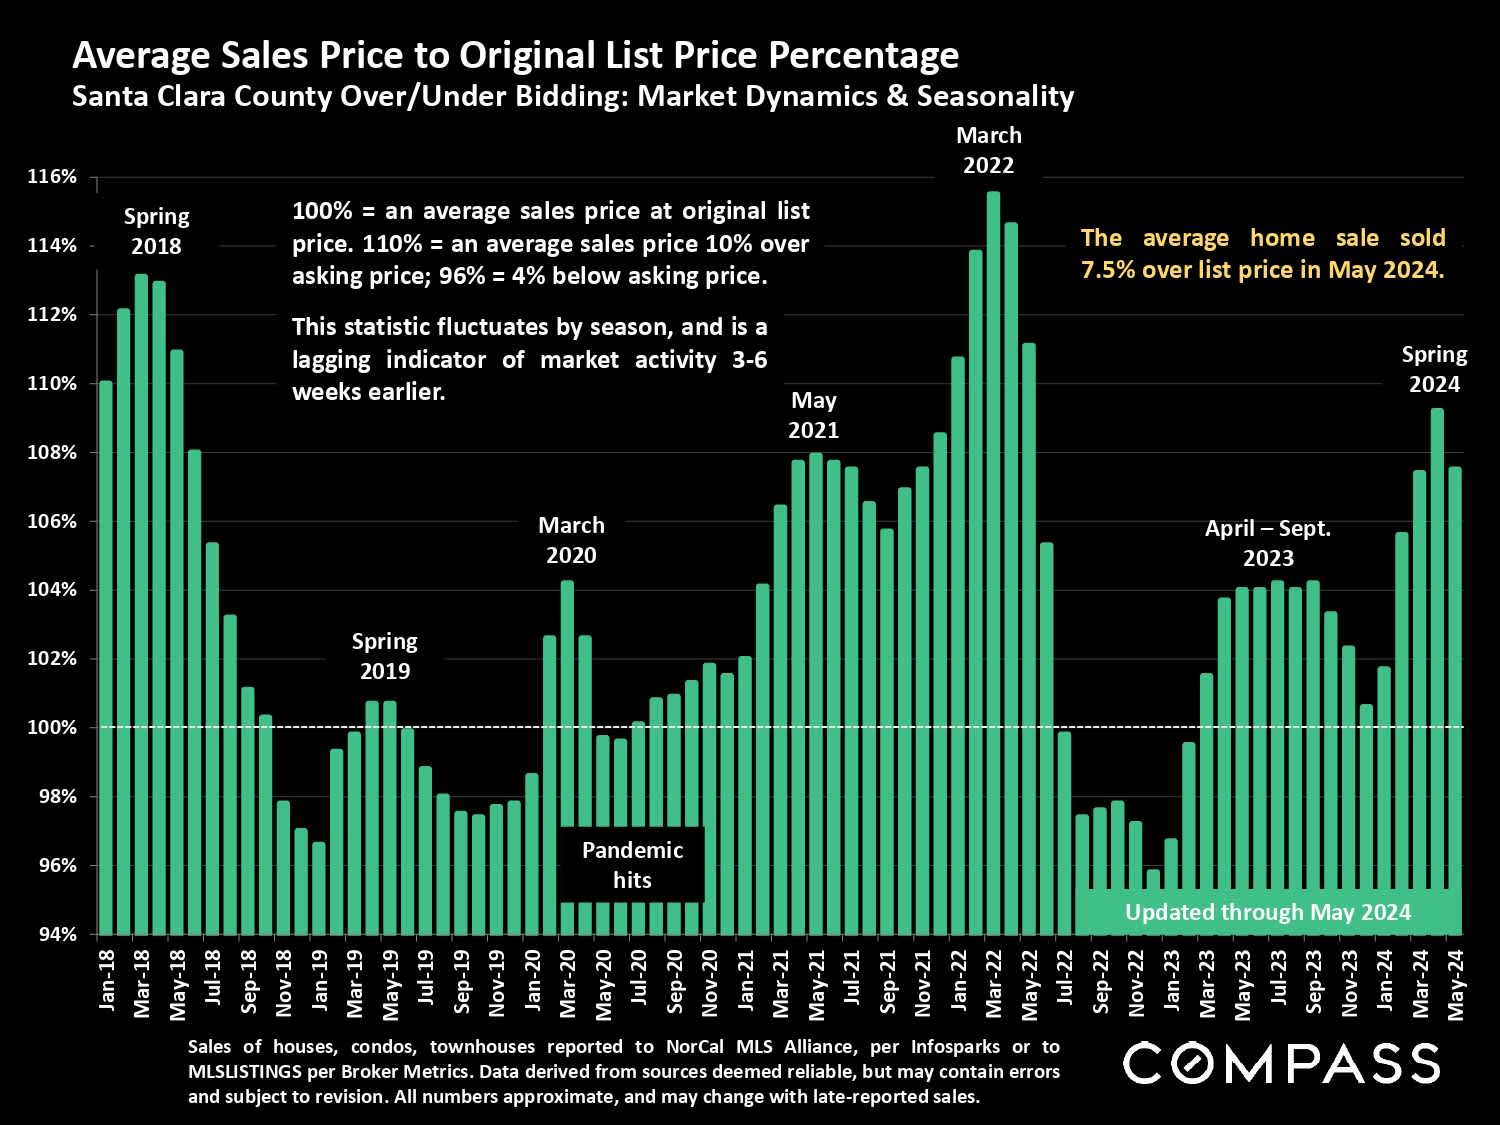
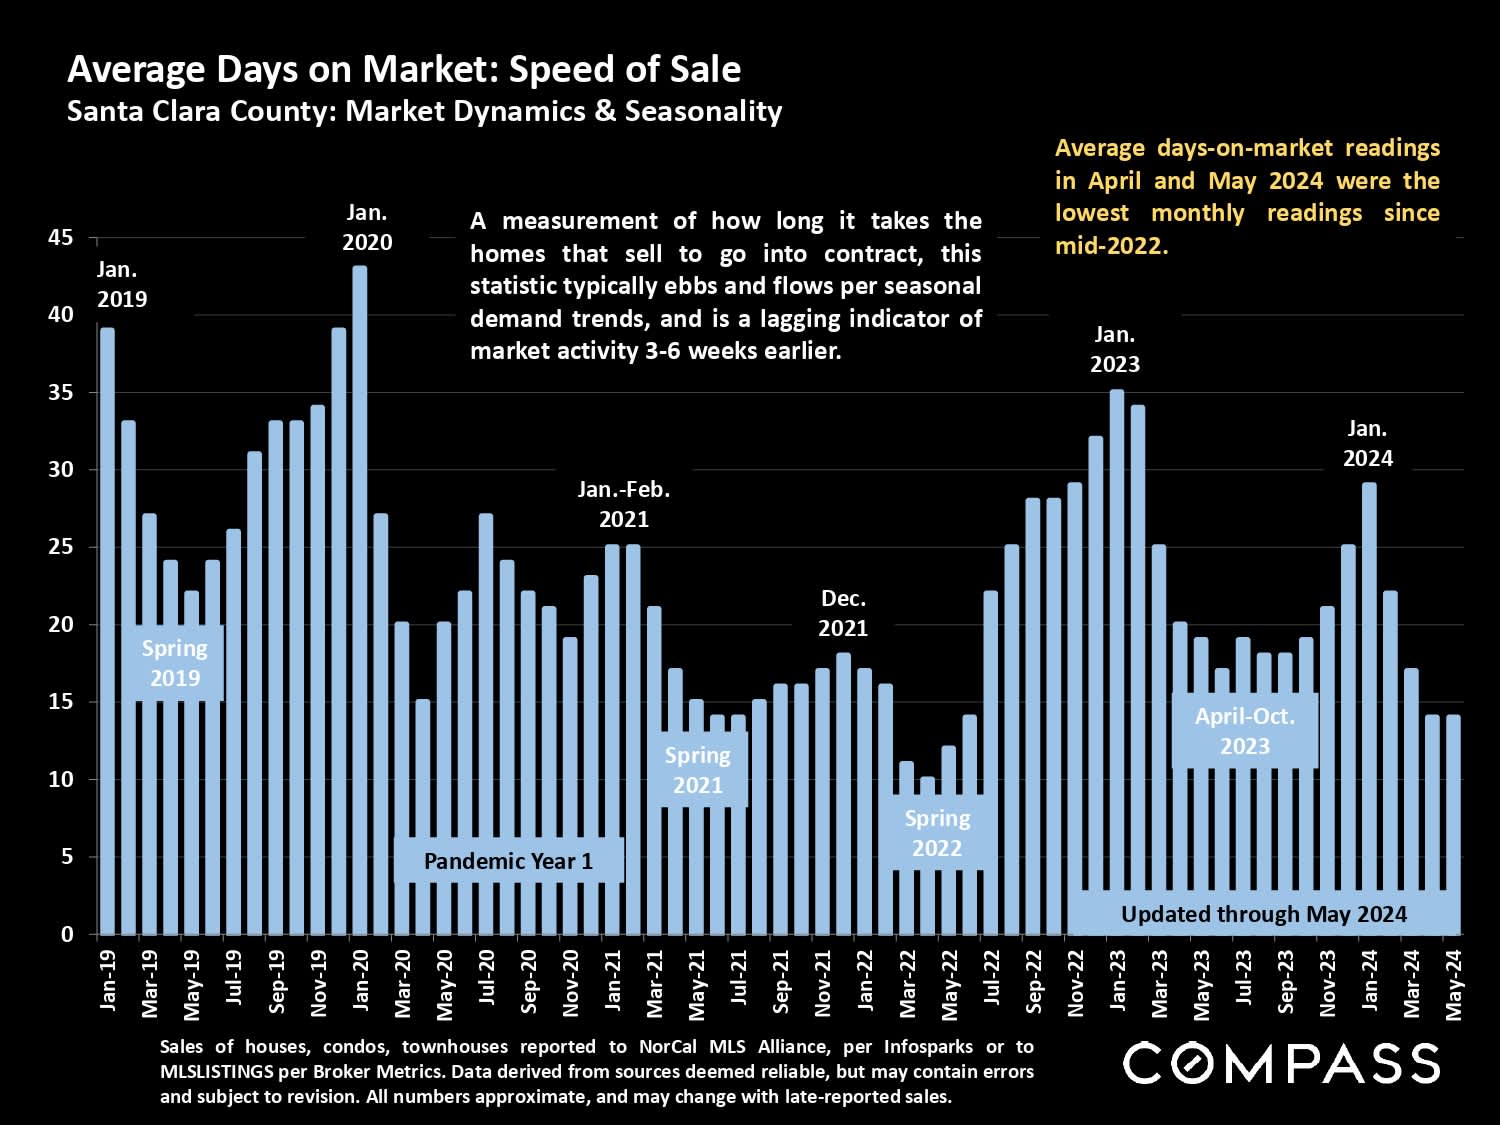
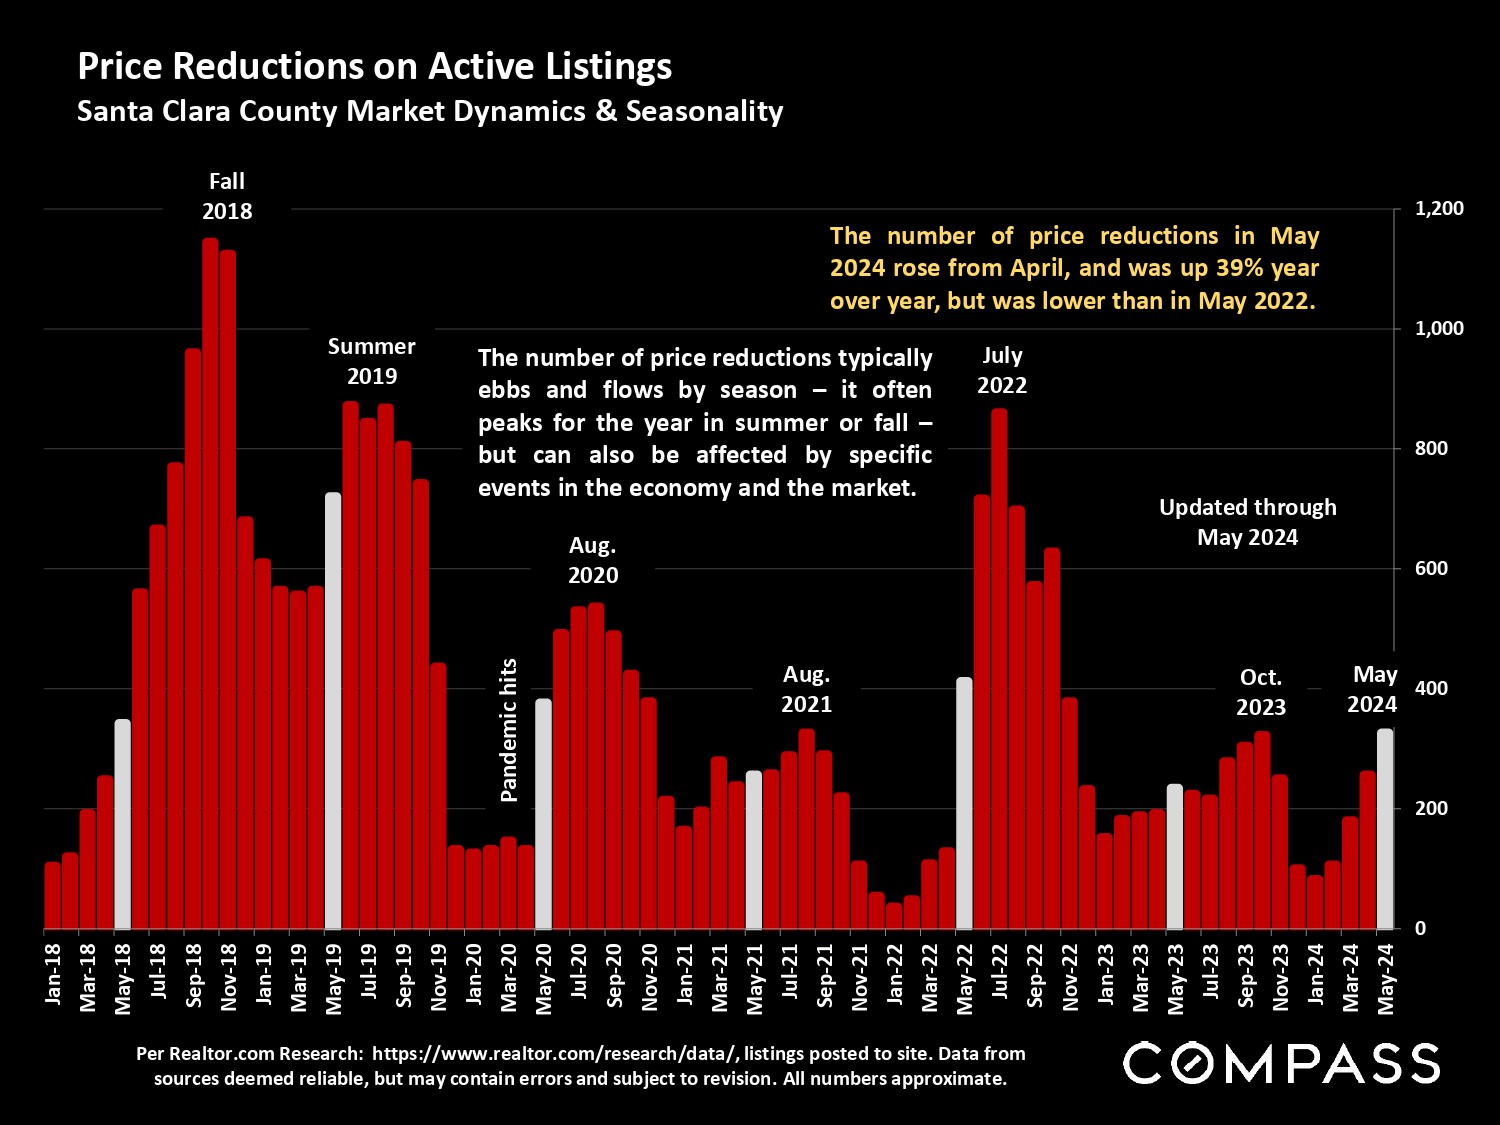
Santa Clara County real estate report cover, June 2024, with a panoramic view of a wooded ridge and valley.Santa Clara County market report highlights May 2024 housing trends, including rising prices, sales, and listings.Santa Clara County home prices chart, showing a 15.5% annual rise to nearly $2 million in May 2024.Chart of Santa Clara County condo and townhouse median prices, 2005–2024; latest year-over-year gains are 3% and 7%.Chart of Santa Clara County house, townhouse, and condo values per square foot from 2005 to May 2024.Santa Clara County home sales price chart comparing 2022–2024, with 2024 prices rebounding across most property types.Map of the San Francisco Peninsula and South Bay with a callout for the home price map.Chart of Santa Clara County new listings from December 2019 to May 2024, showing seasonal patterns and a 2024 increase.Santa Clara County active and coming-soon listings chart, February 2022–June 2024; June 2024 shows 1,709 listings.Santa Clara County active and coming-soon home listings by price segment, June 2024.Bar chart compares Santa Clara County year-to-date home sales by price segment from 2021 through 2024.Santa Clara County accepted-offer chart, January 2020–May 2024, with an orange monthly trend line and market annotations.Santa Clara County inventory-supply chart, December 2017 to April 2024, showing a low current months-supply reading.Bar chart of monthly Santa Clara County home sales, January 2020–May 2024, with a year-over-year increase noted for April 2024.Chart of Santa Clara County luxury home sales, with May 2024 reaching 100 sales, the highest since spring 2022.Chart of Santa Clara County luxury home sales by community and price segment, with Los Altos showing the most sales.Chart of Santa Clara County homes selling over list price, with May 2024 at its highest level since spring 2022.Chart of Santa Clara County sale prices versus original list prices, peaking in March 2022 and reaching 7.5% over list in May 2024.Santa Clara County average days on market, monthly from 2019 through May 2024, with seasonal and pandemic annotations.Chart of monthly Santa Clara County active-listing price reductions, January 2018 through May 2024.San Francisco Bay Area Luxury Home Market reportMarket statistics notes, metric definitions, photo-use license, and legal disclaimer for the Santa Clara County report.


WORK WITH US

We offer the highest level of service and expertise to our clients. Our team has built a reputation for consistently representing the finest real estate in San Francisco and Napa Valley. Results driven and dedicated to your success, whether buying, selling, renting or investing. Contact us today for a private consultation.

Contact Us