Santa Clara County - October 2023

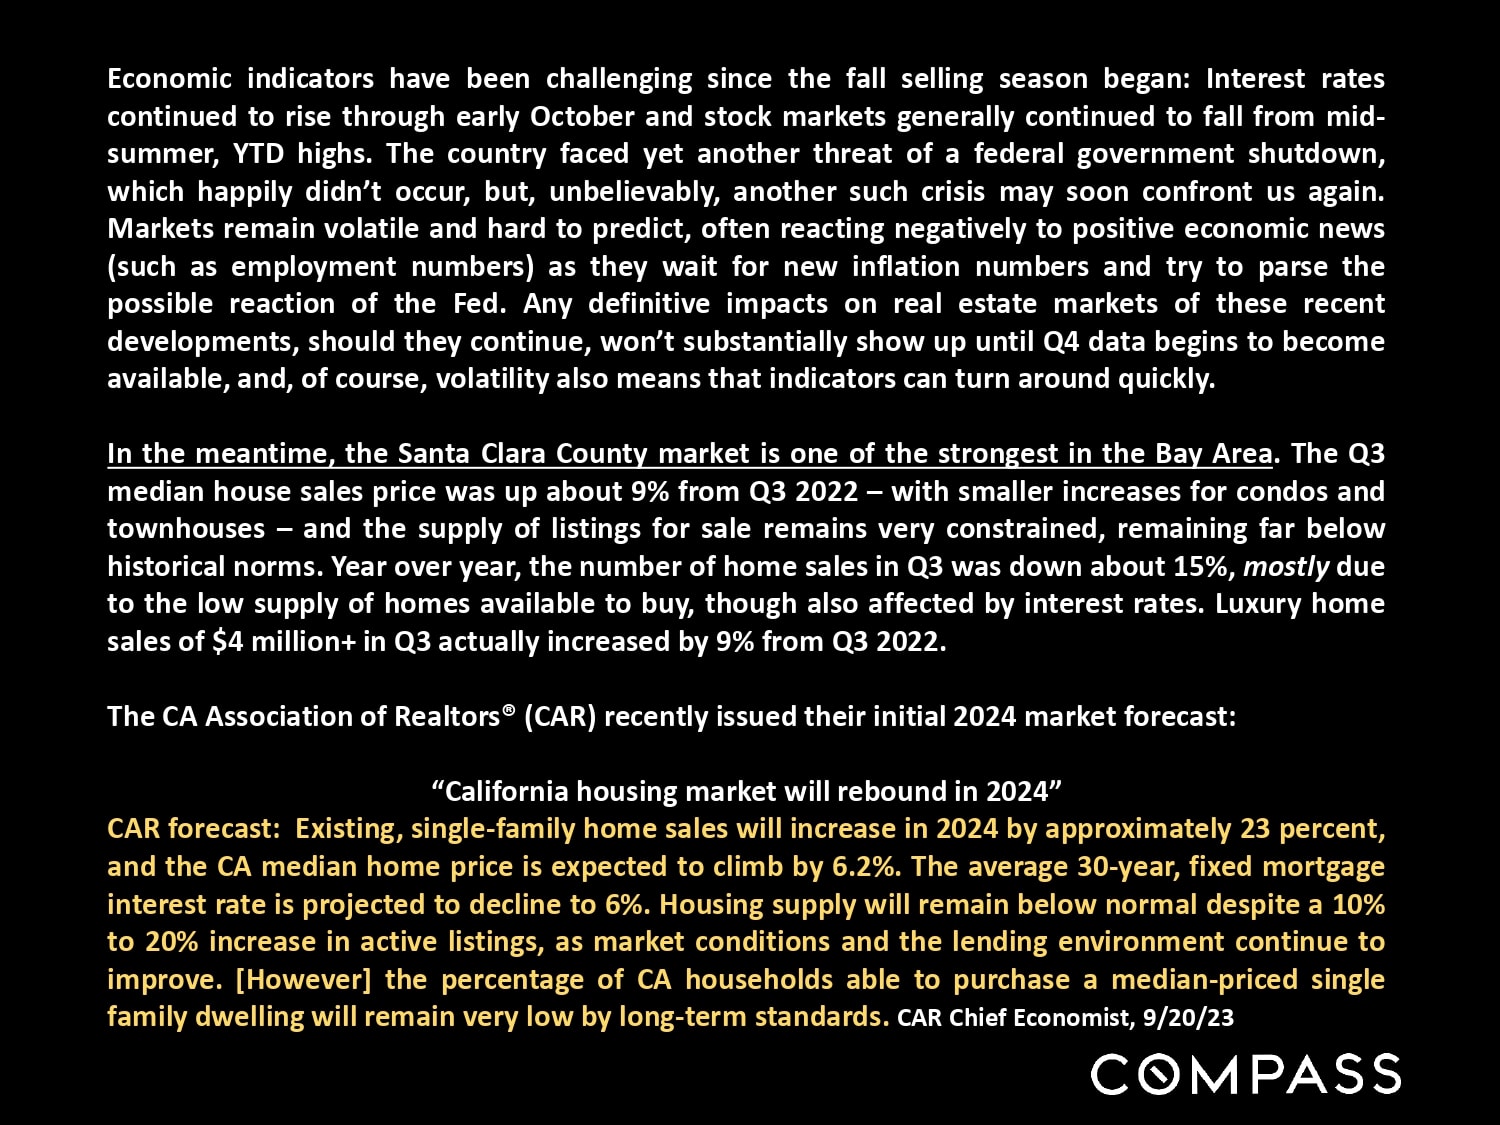
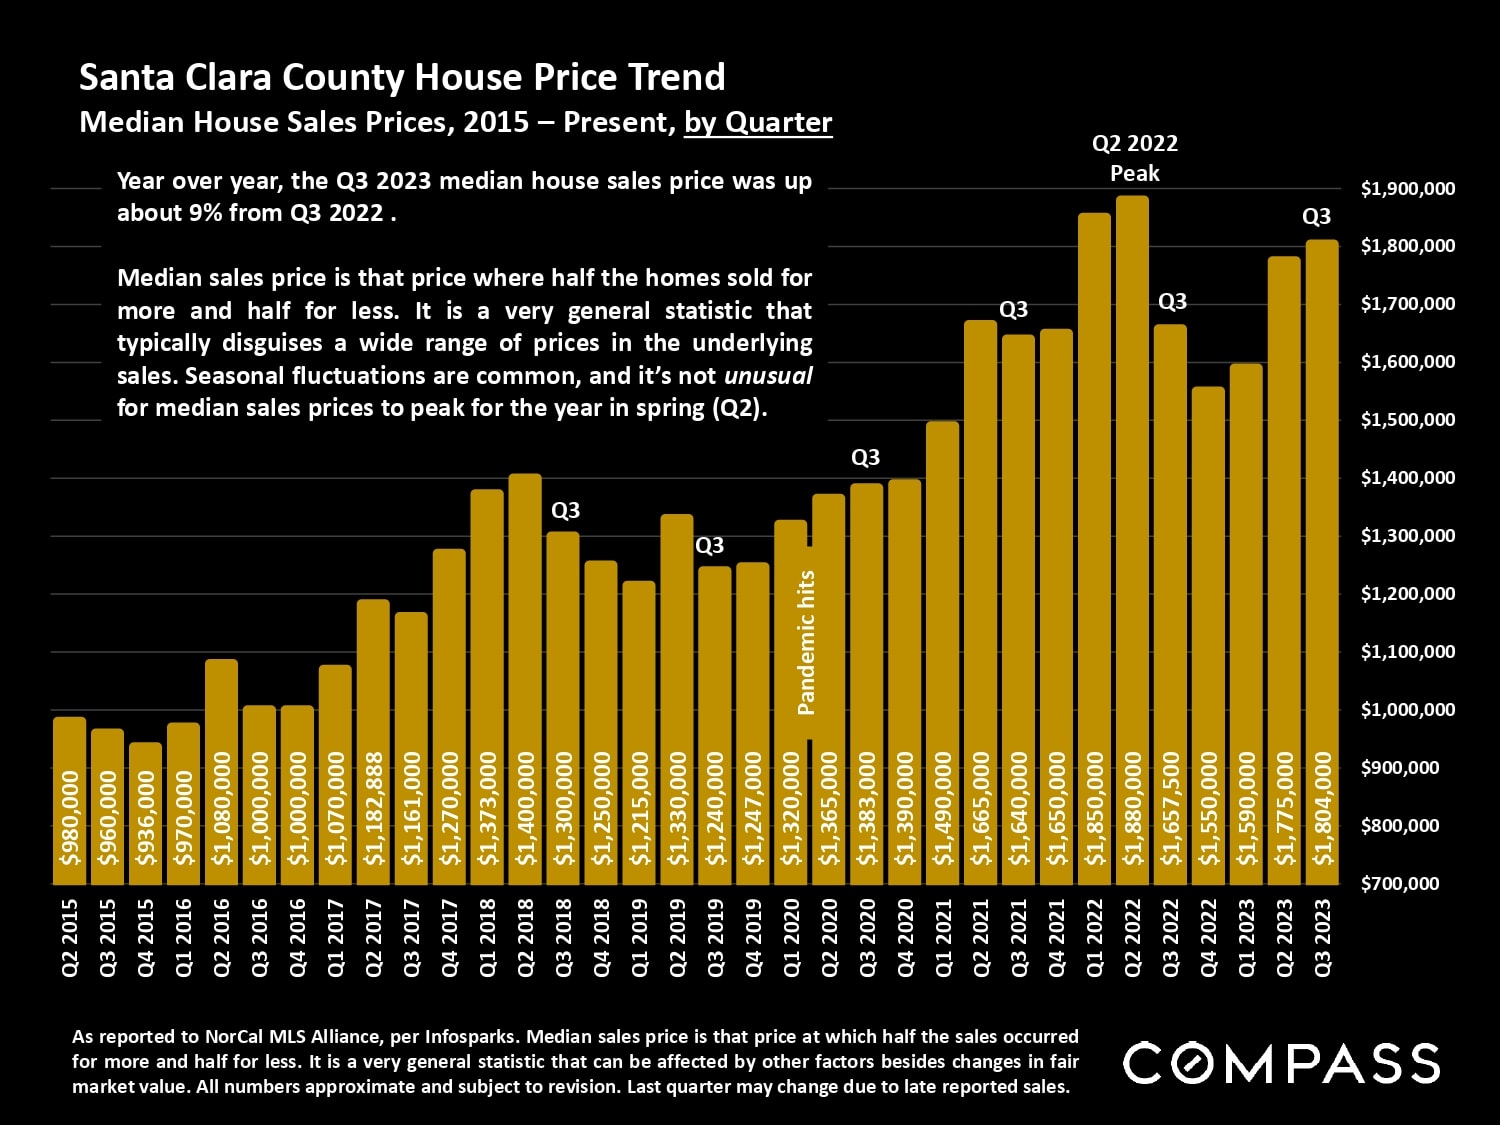
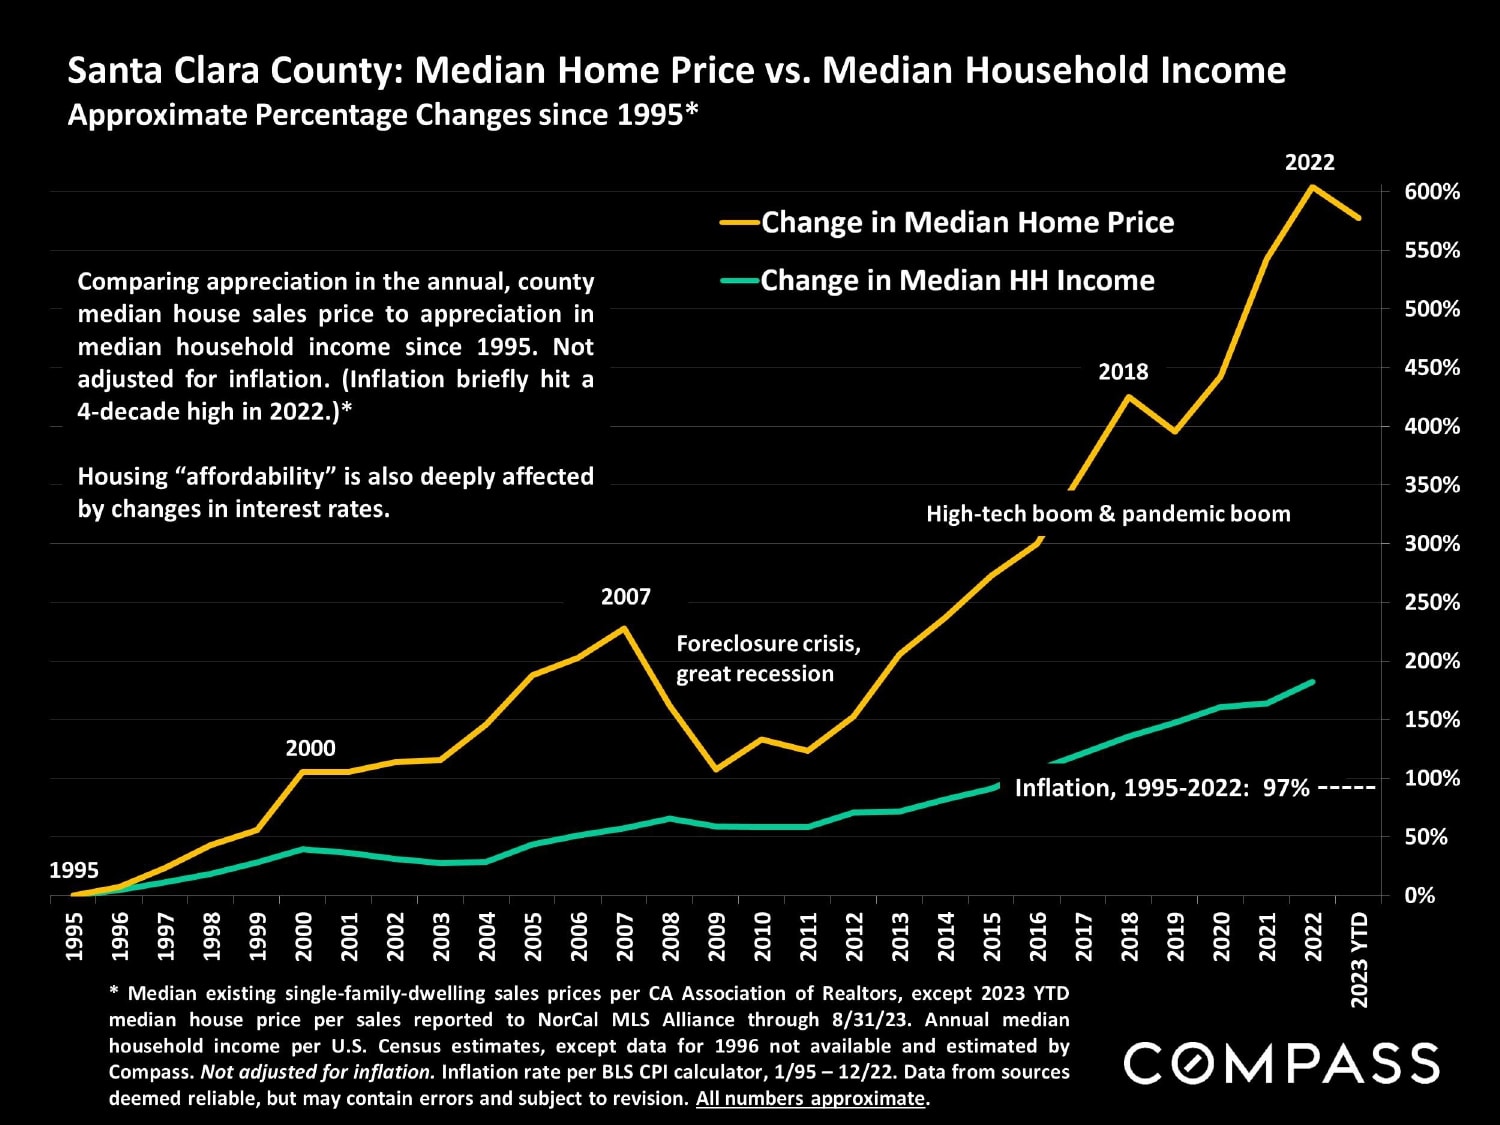
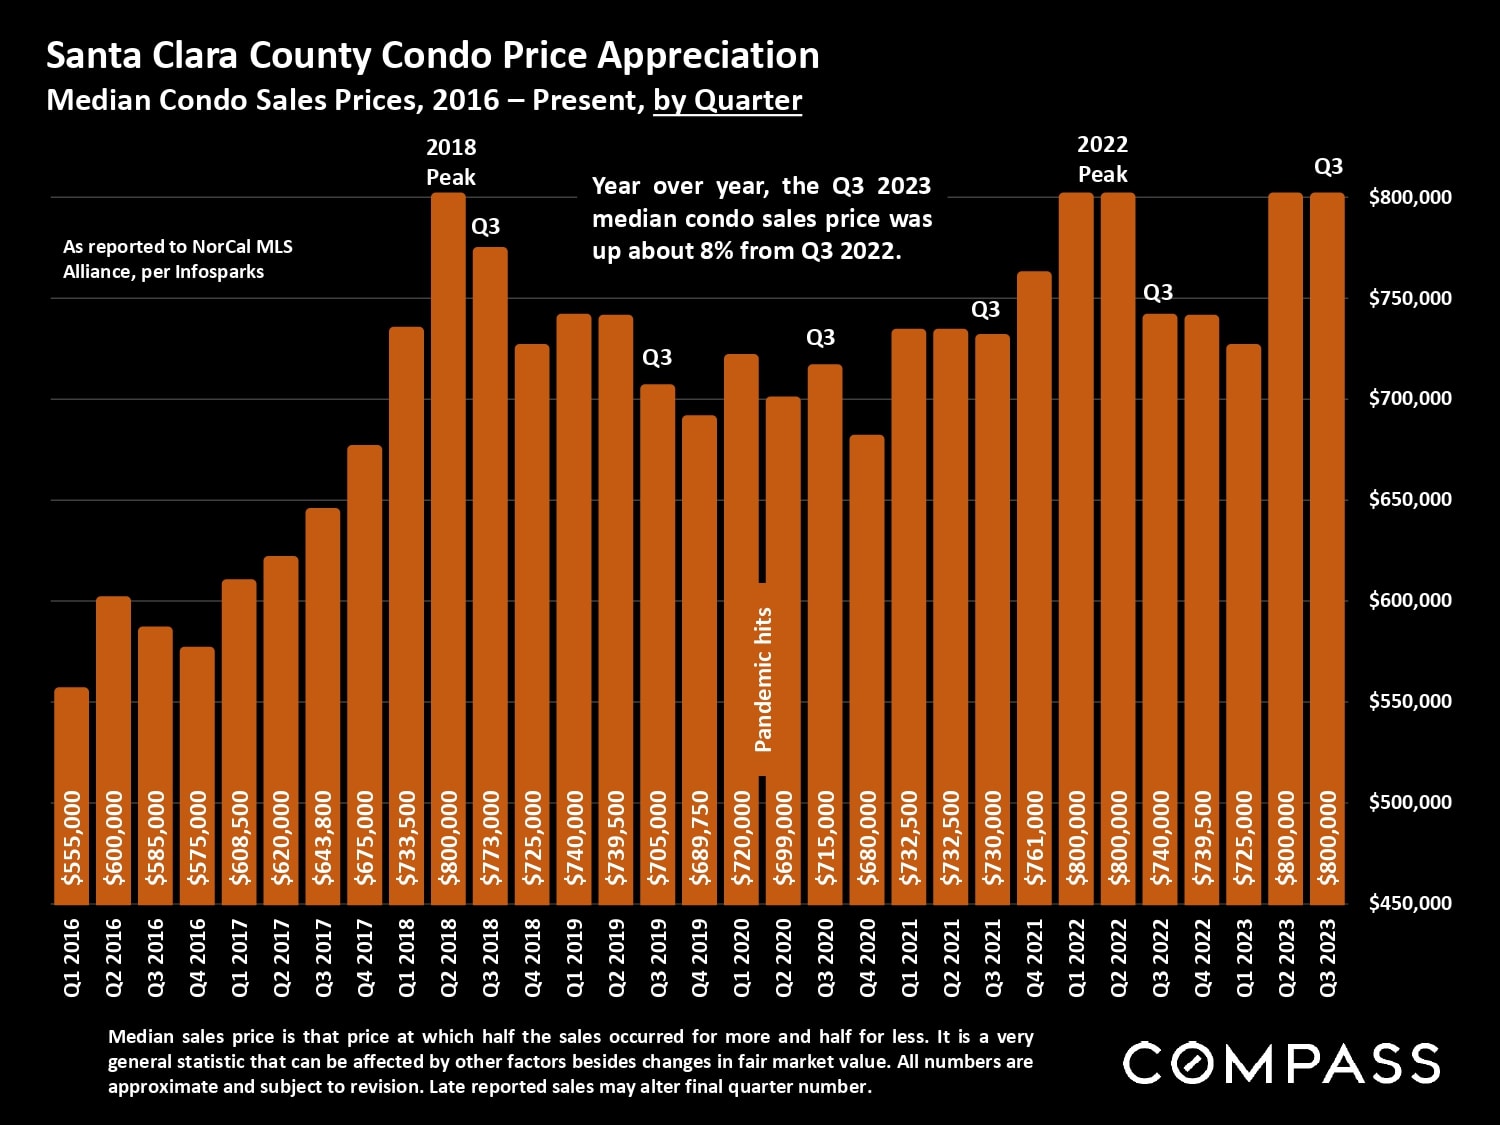
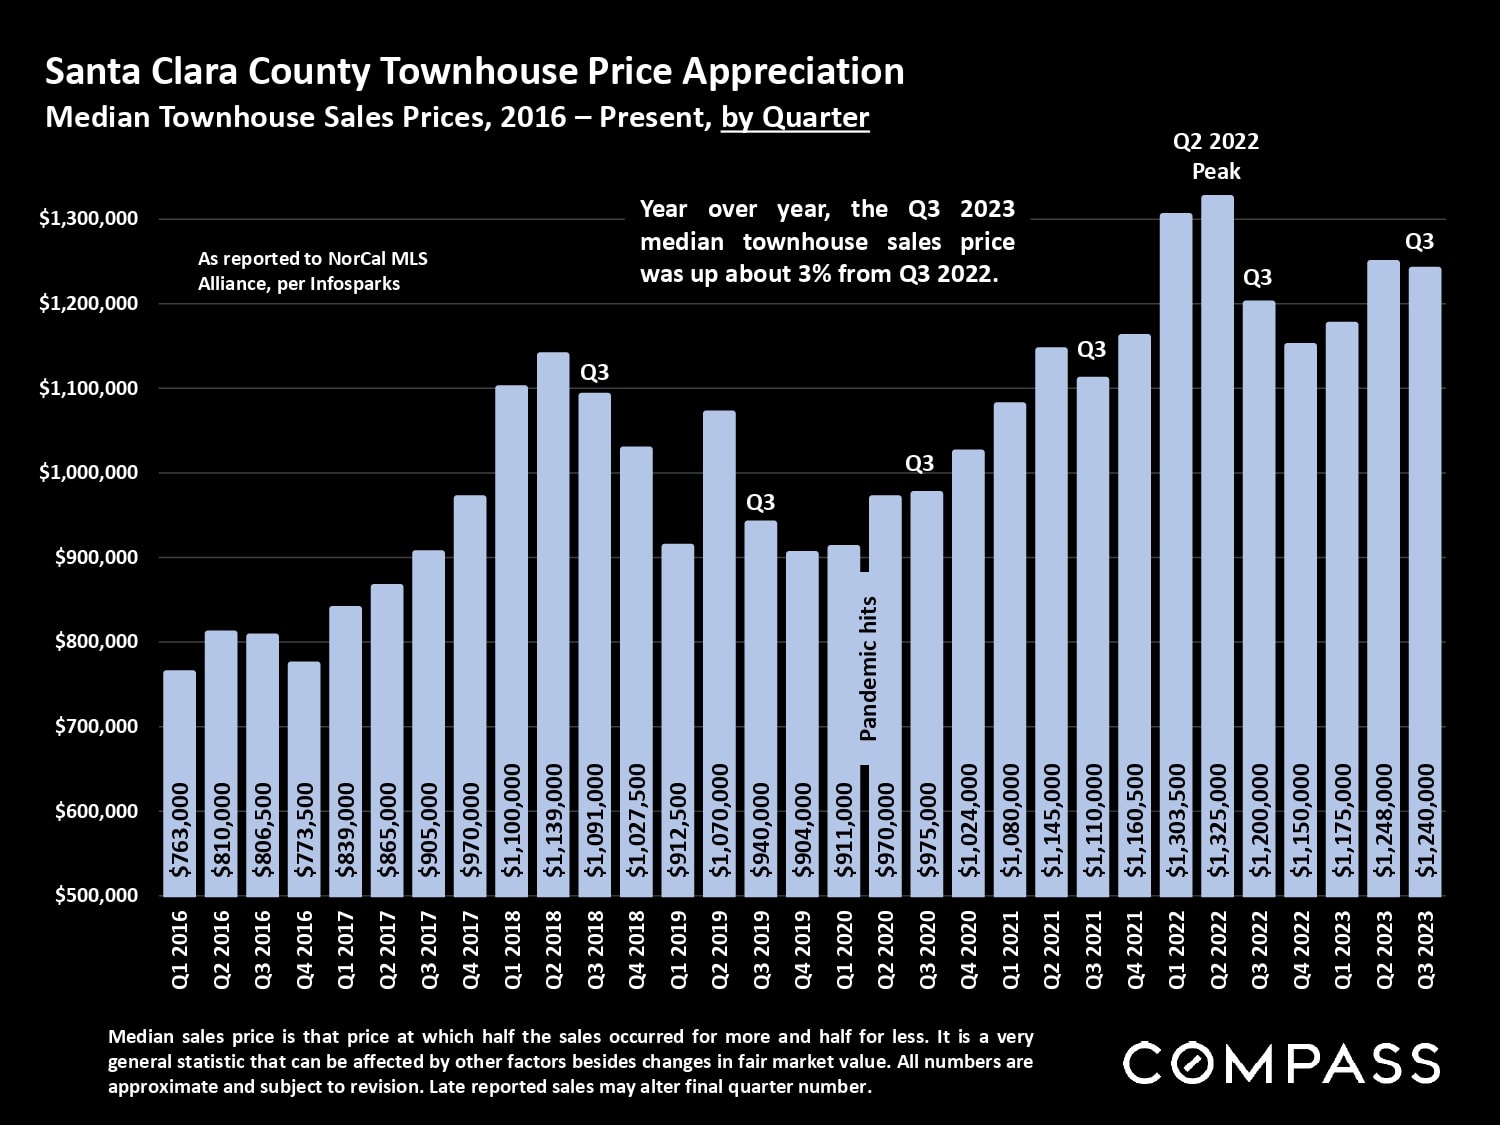
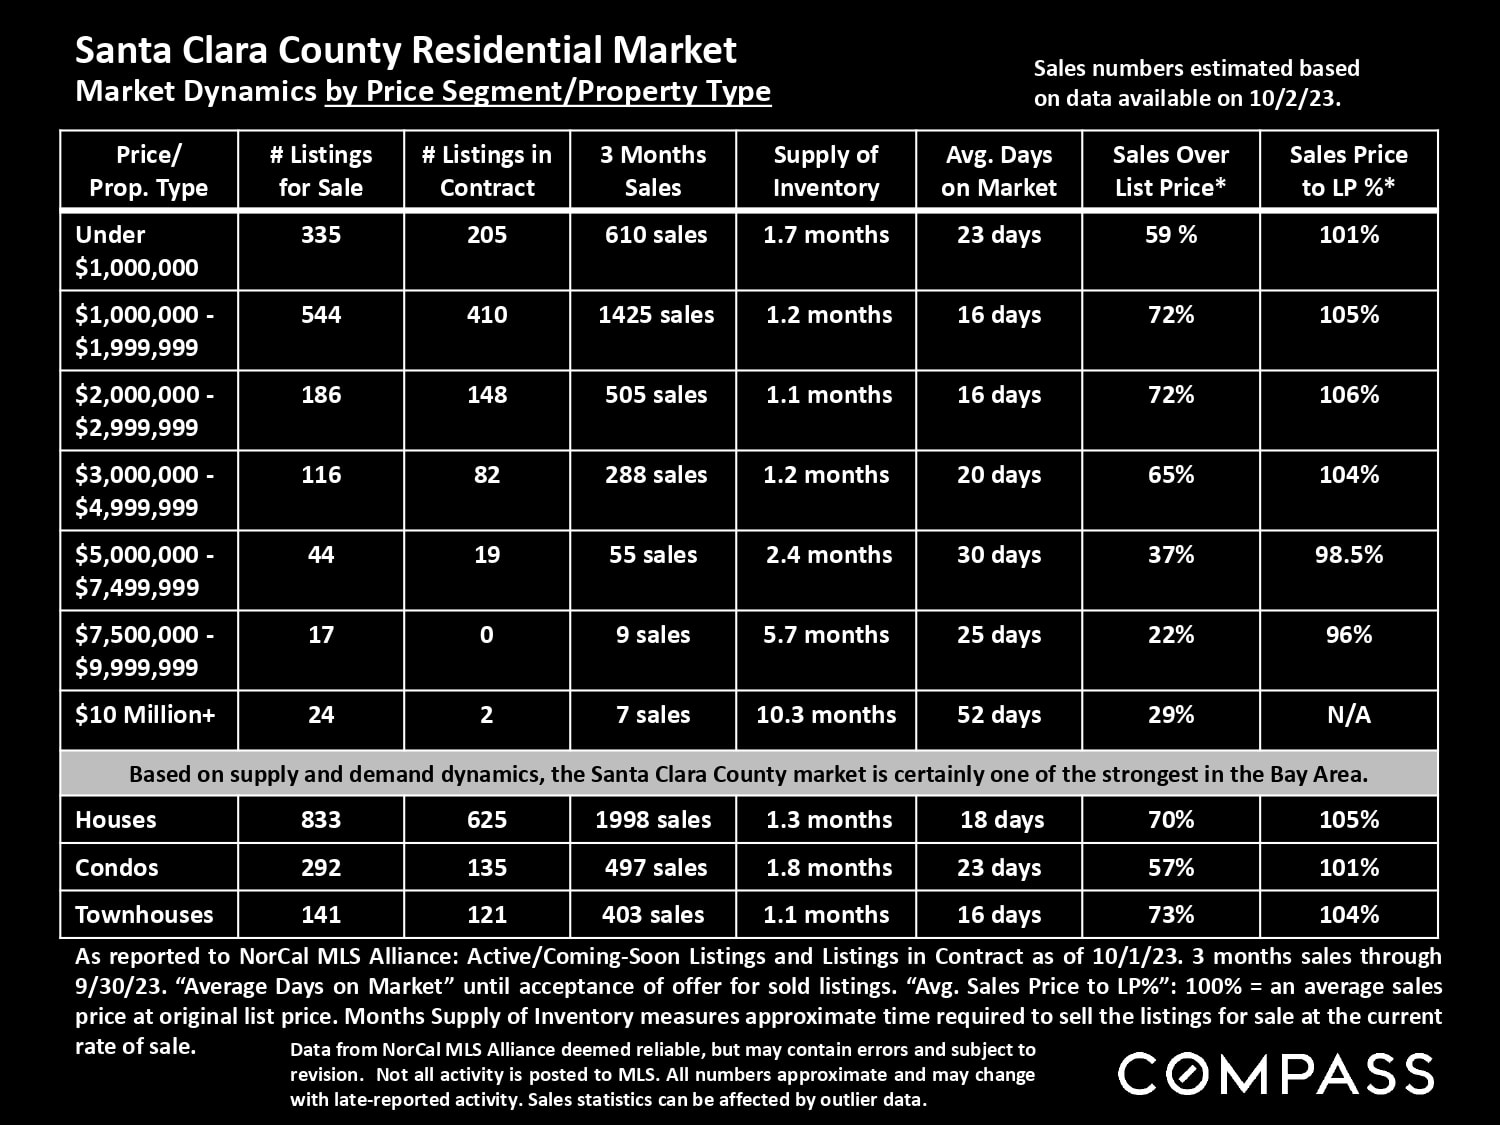
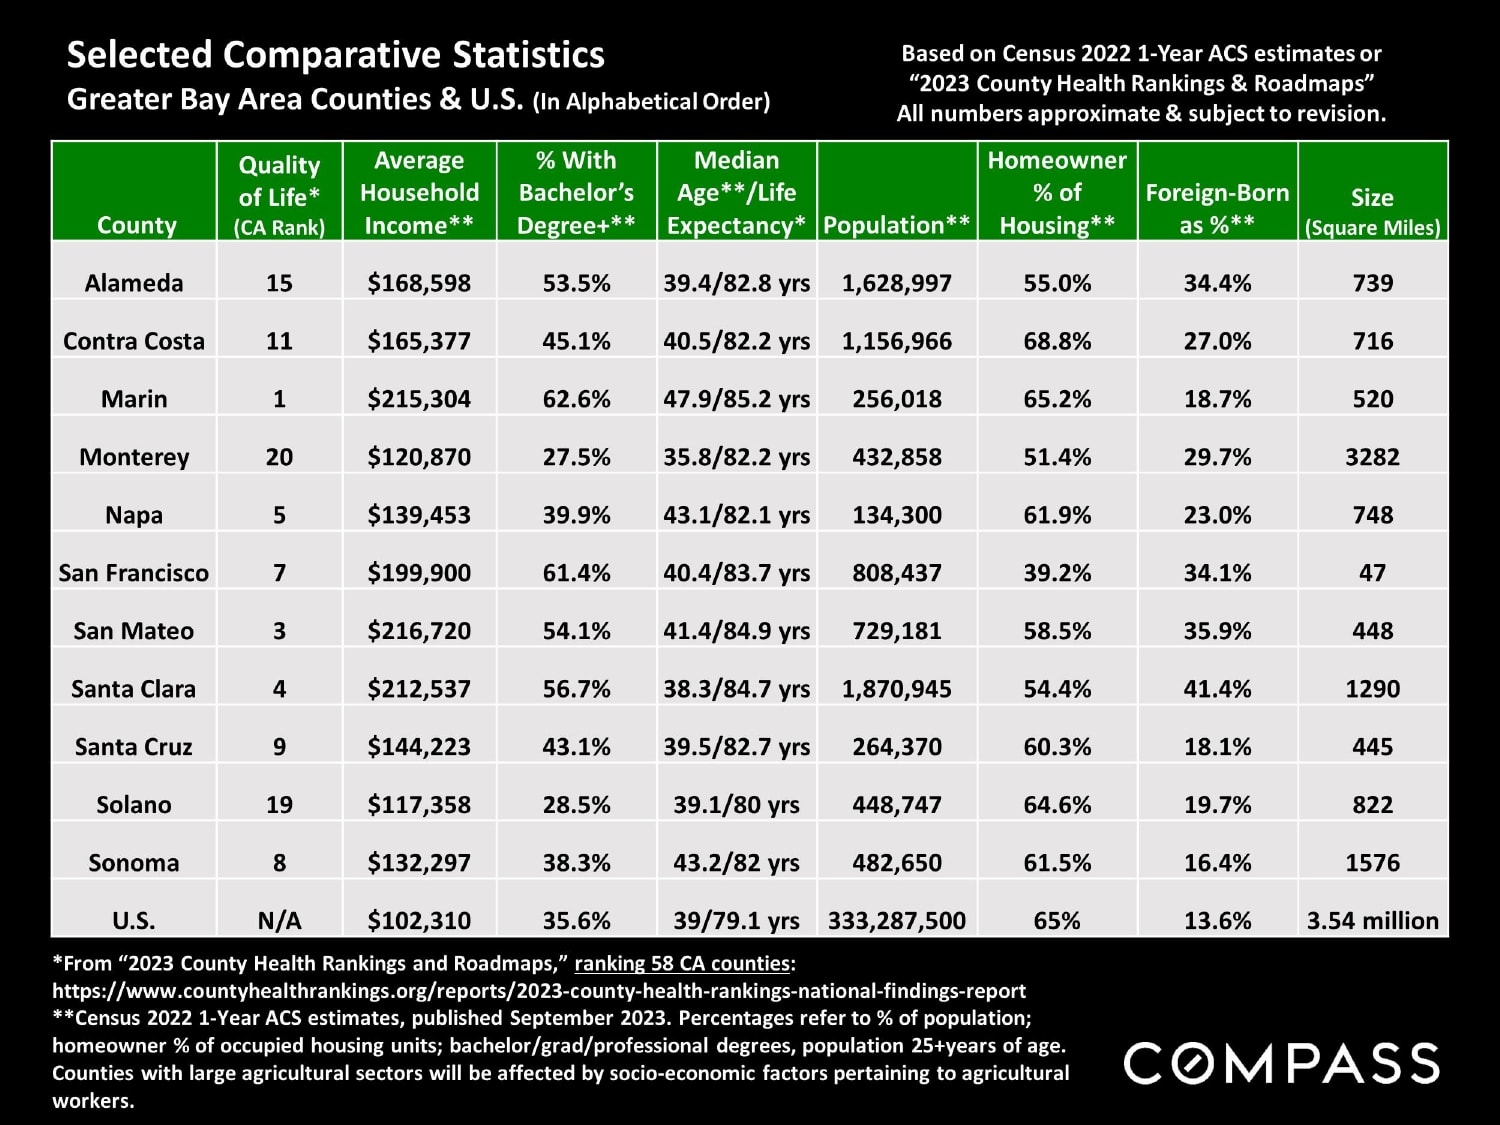
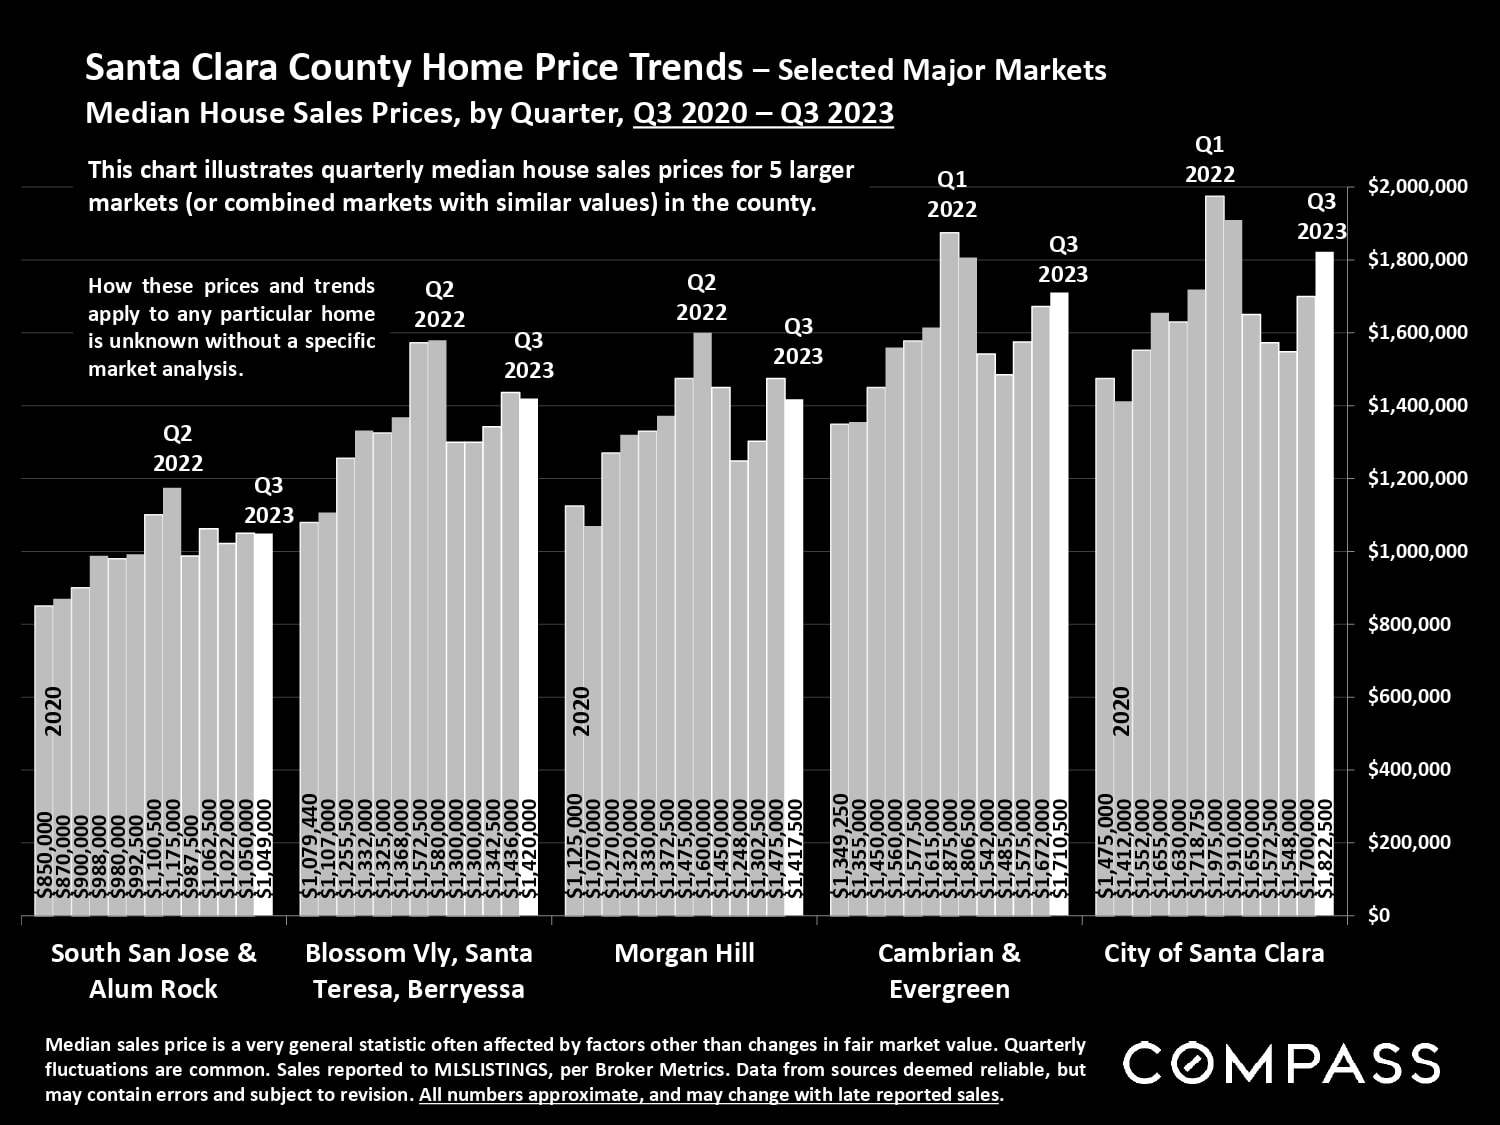
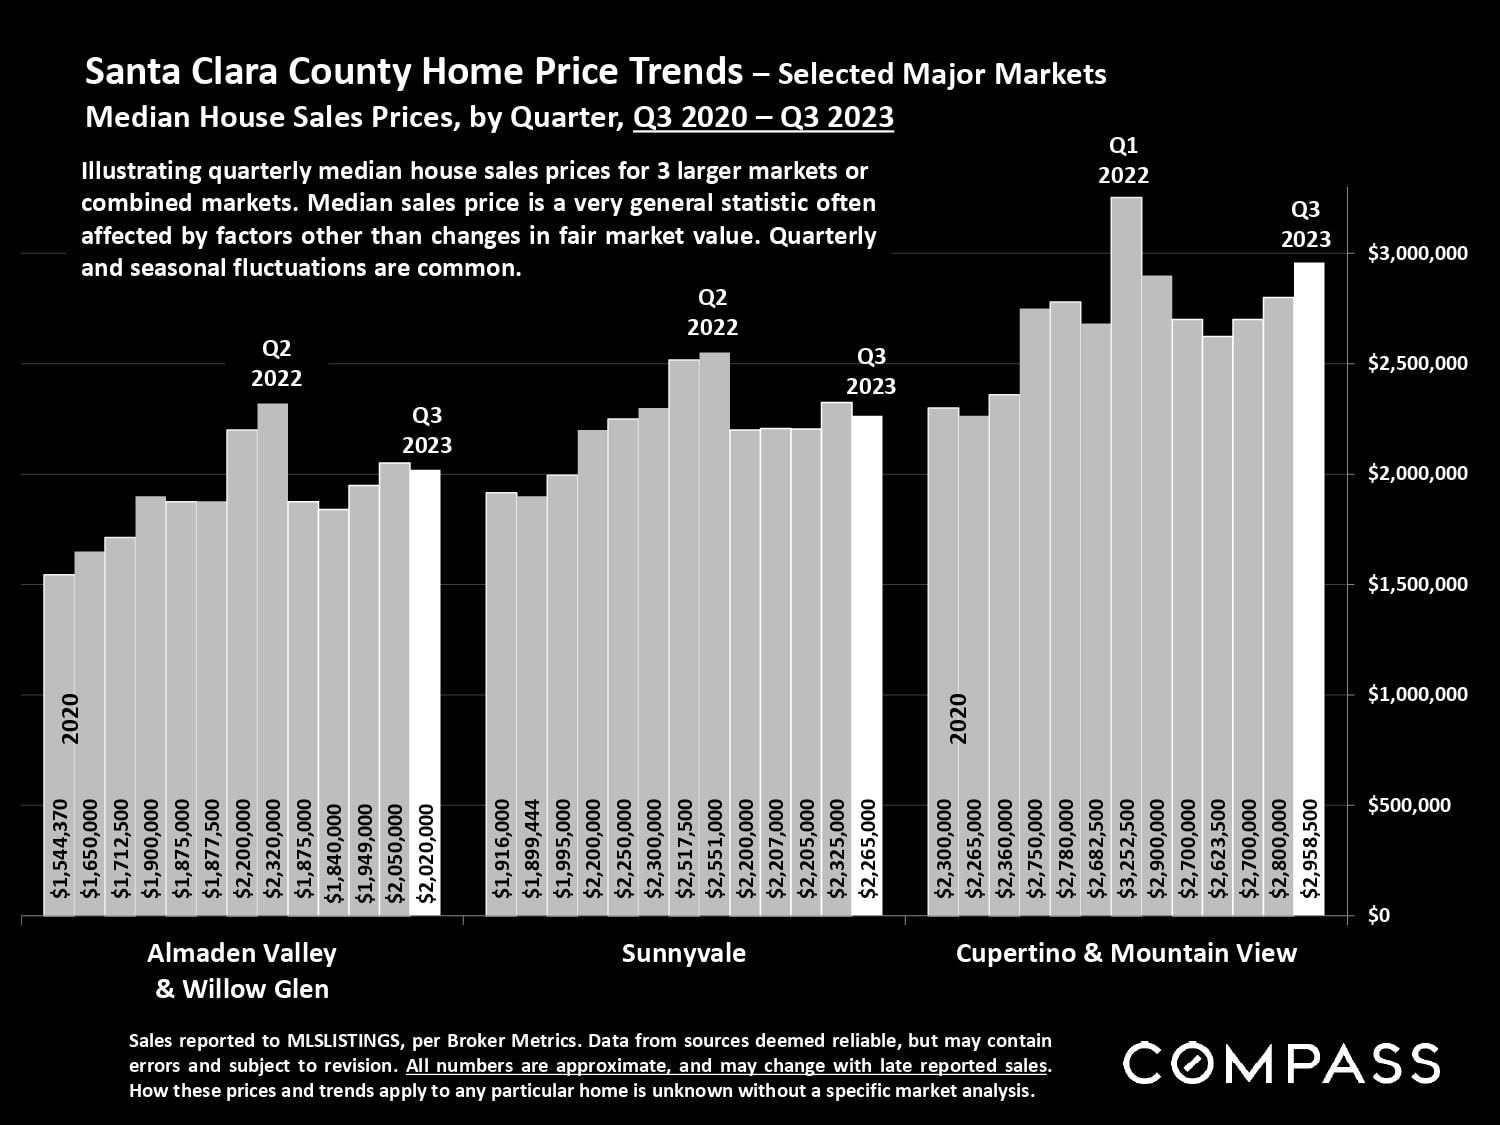
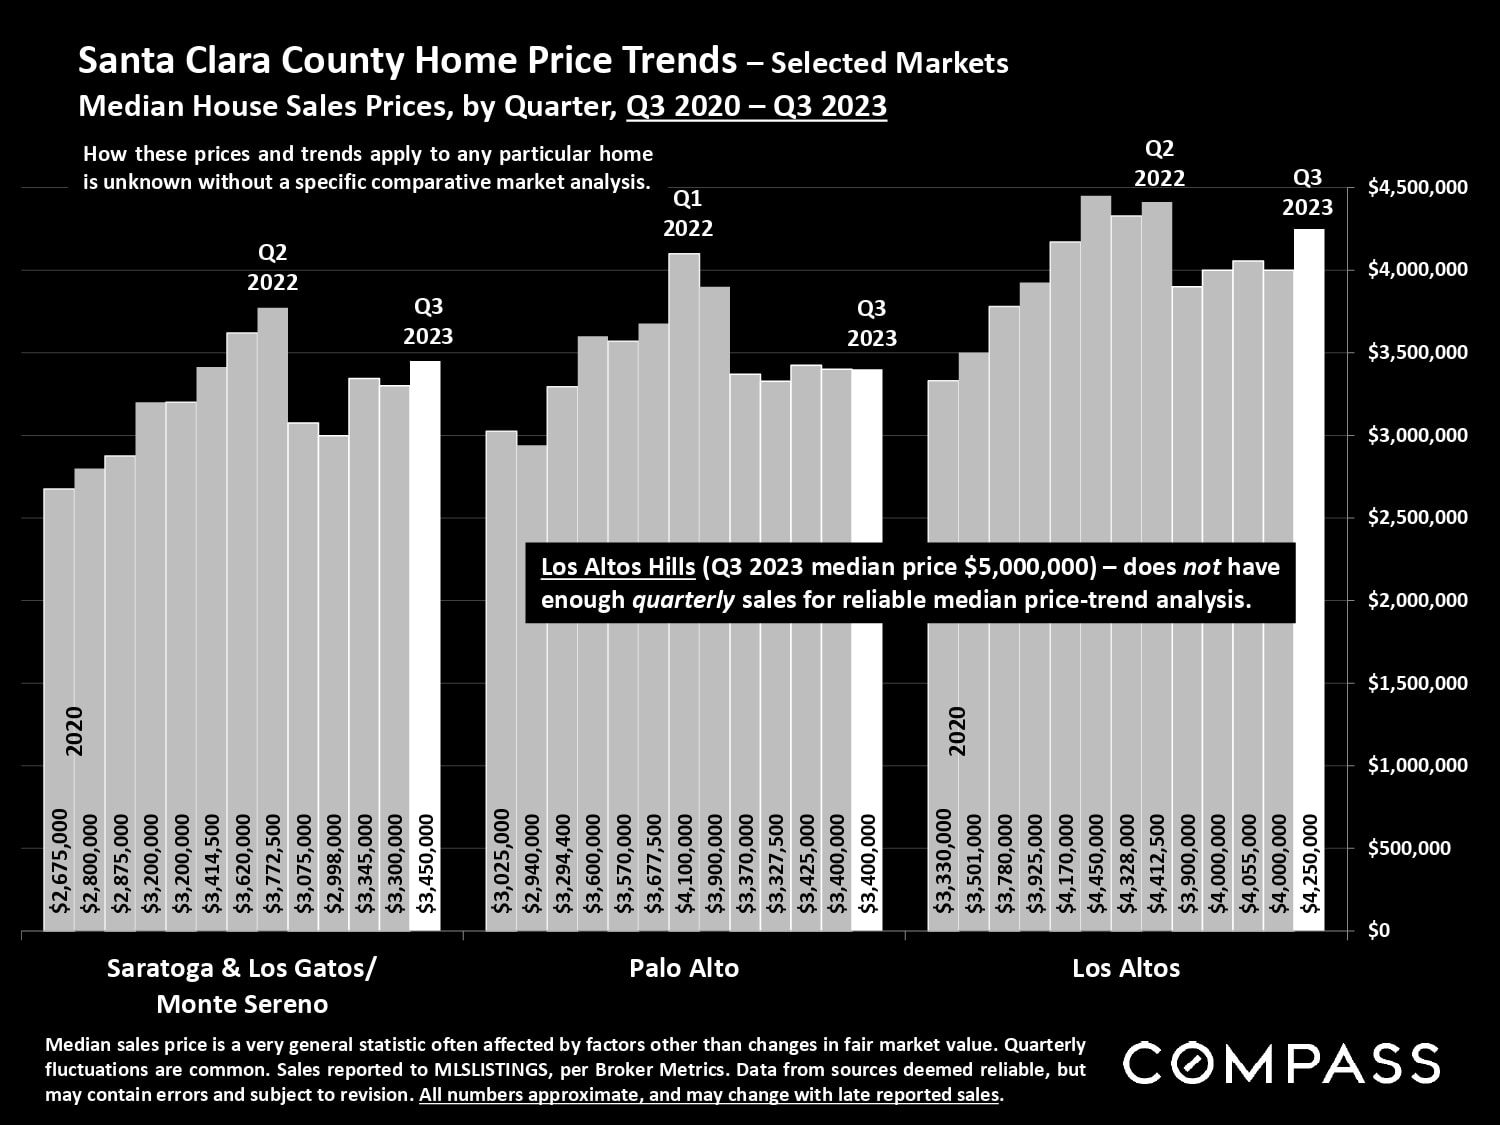
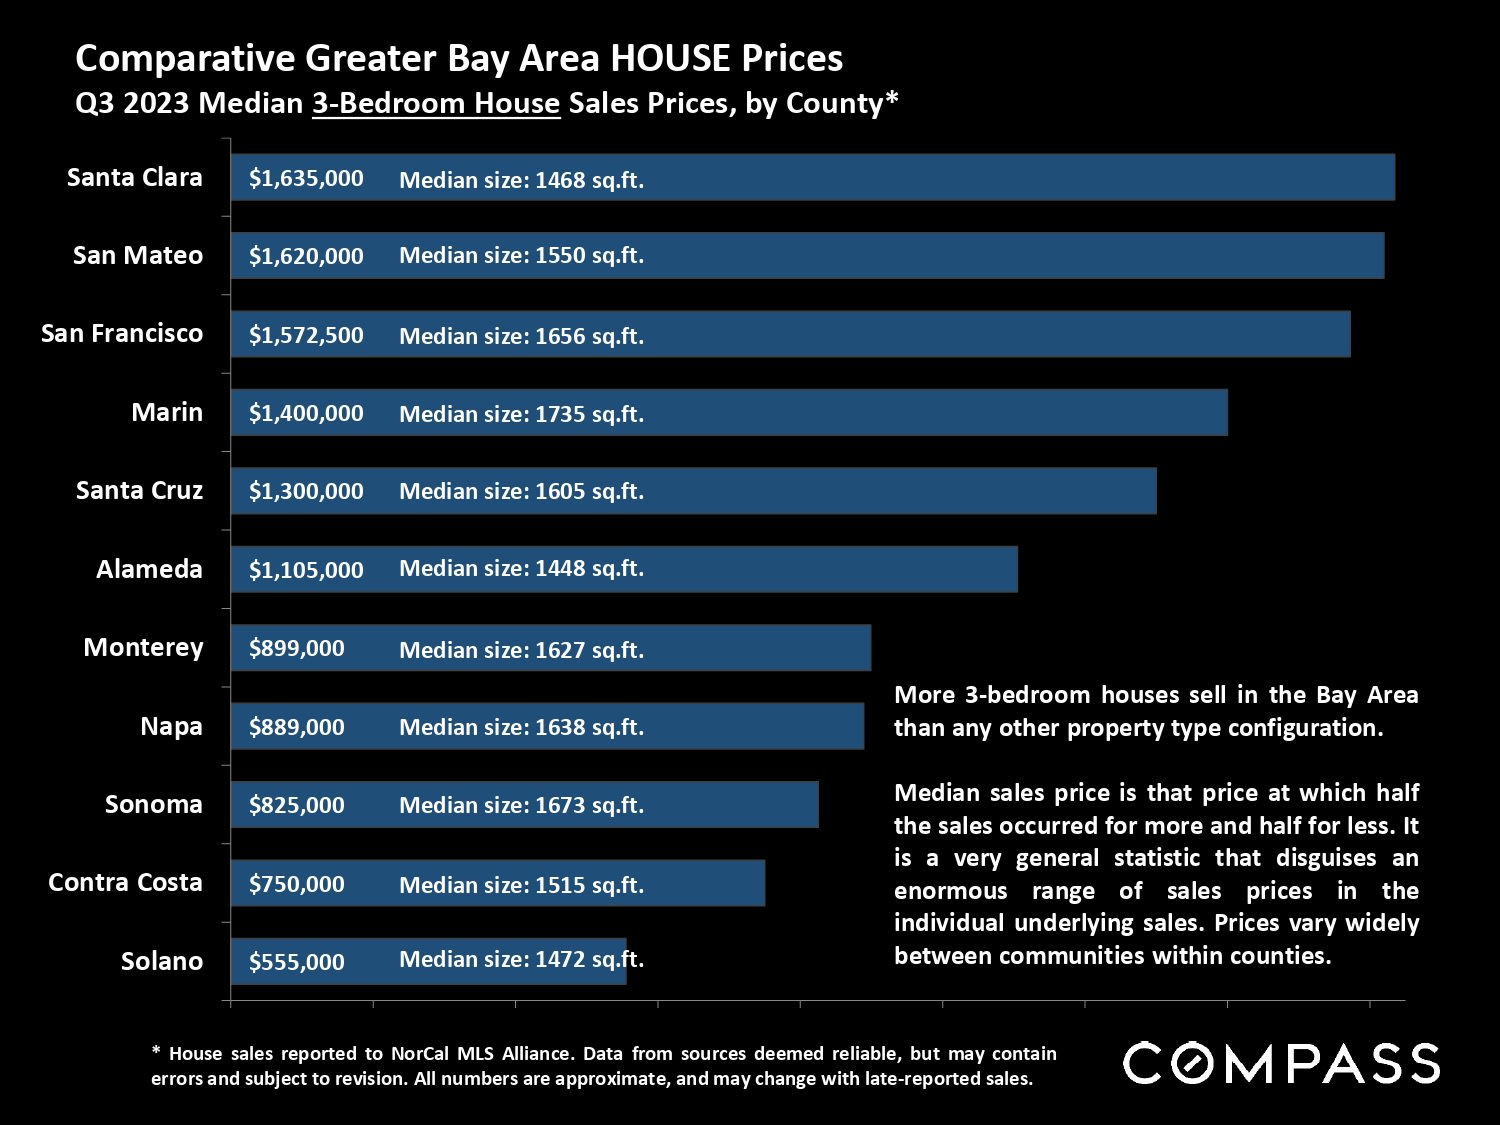
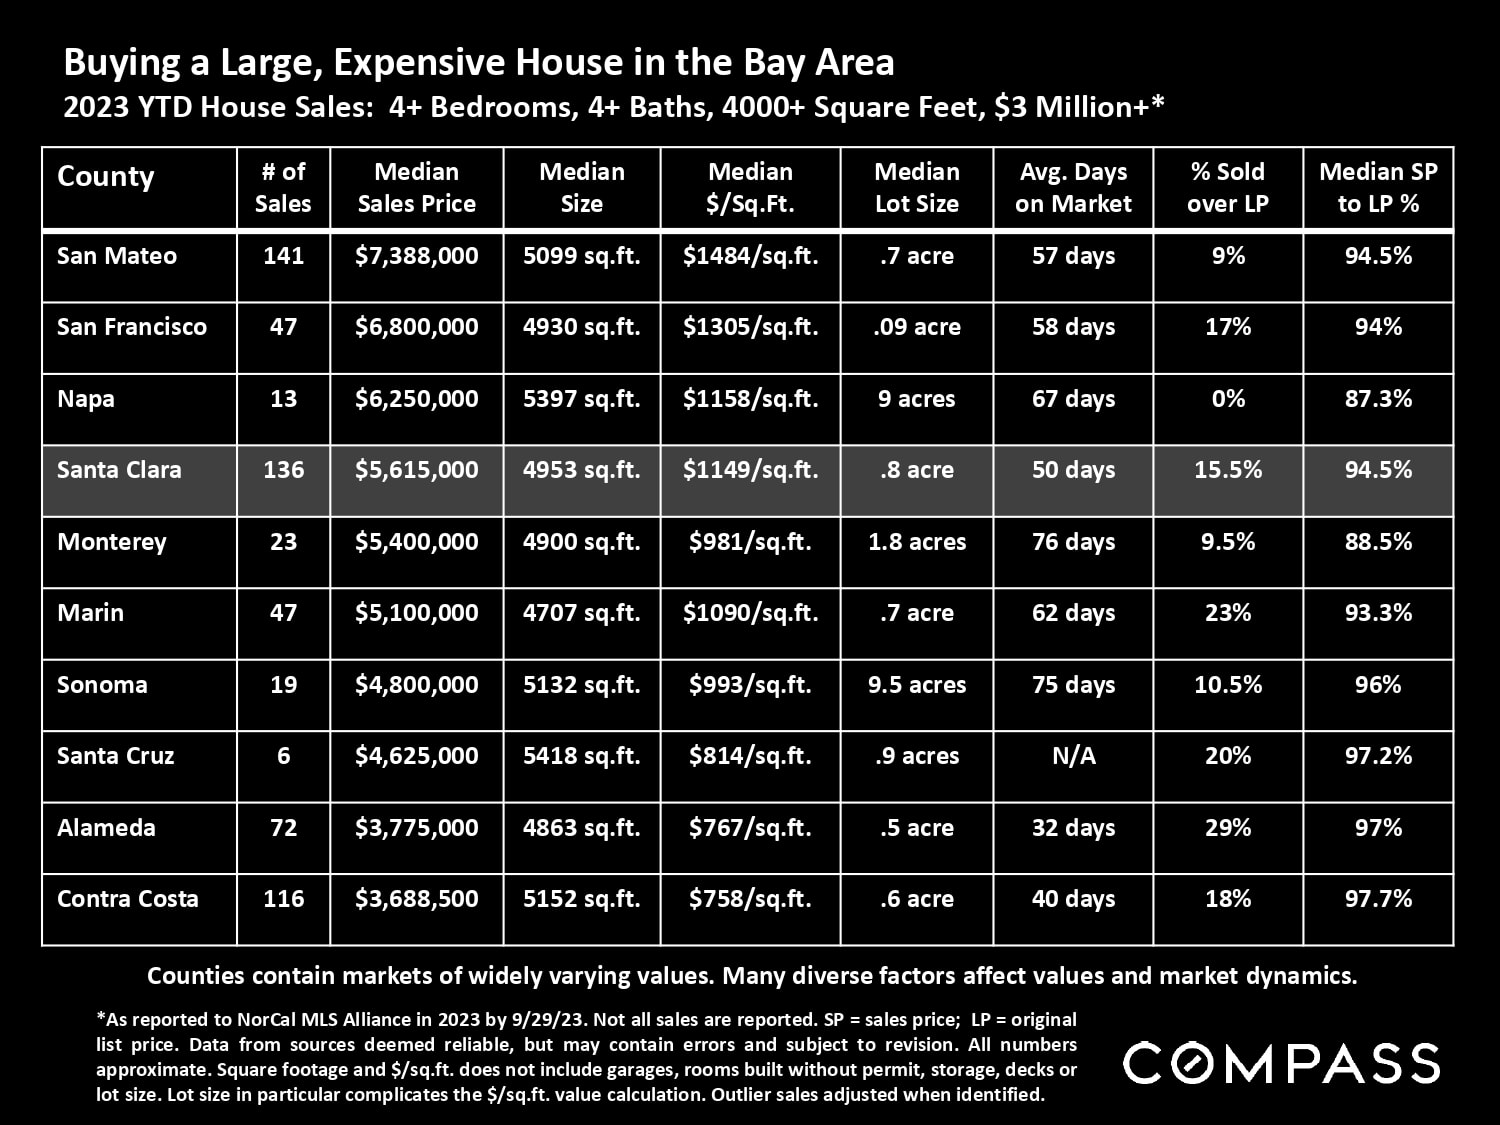
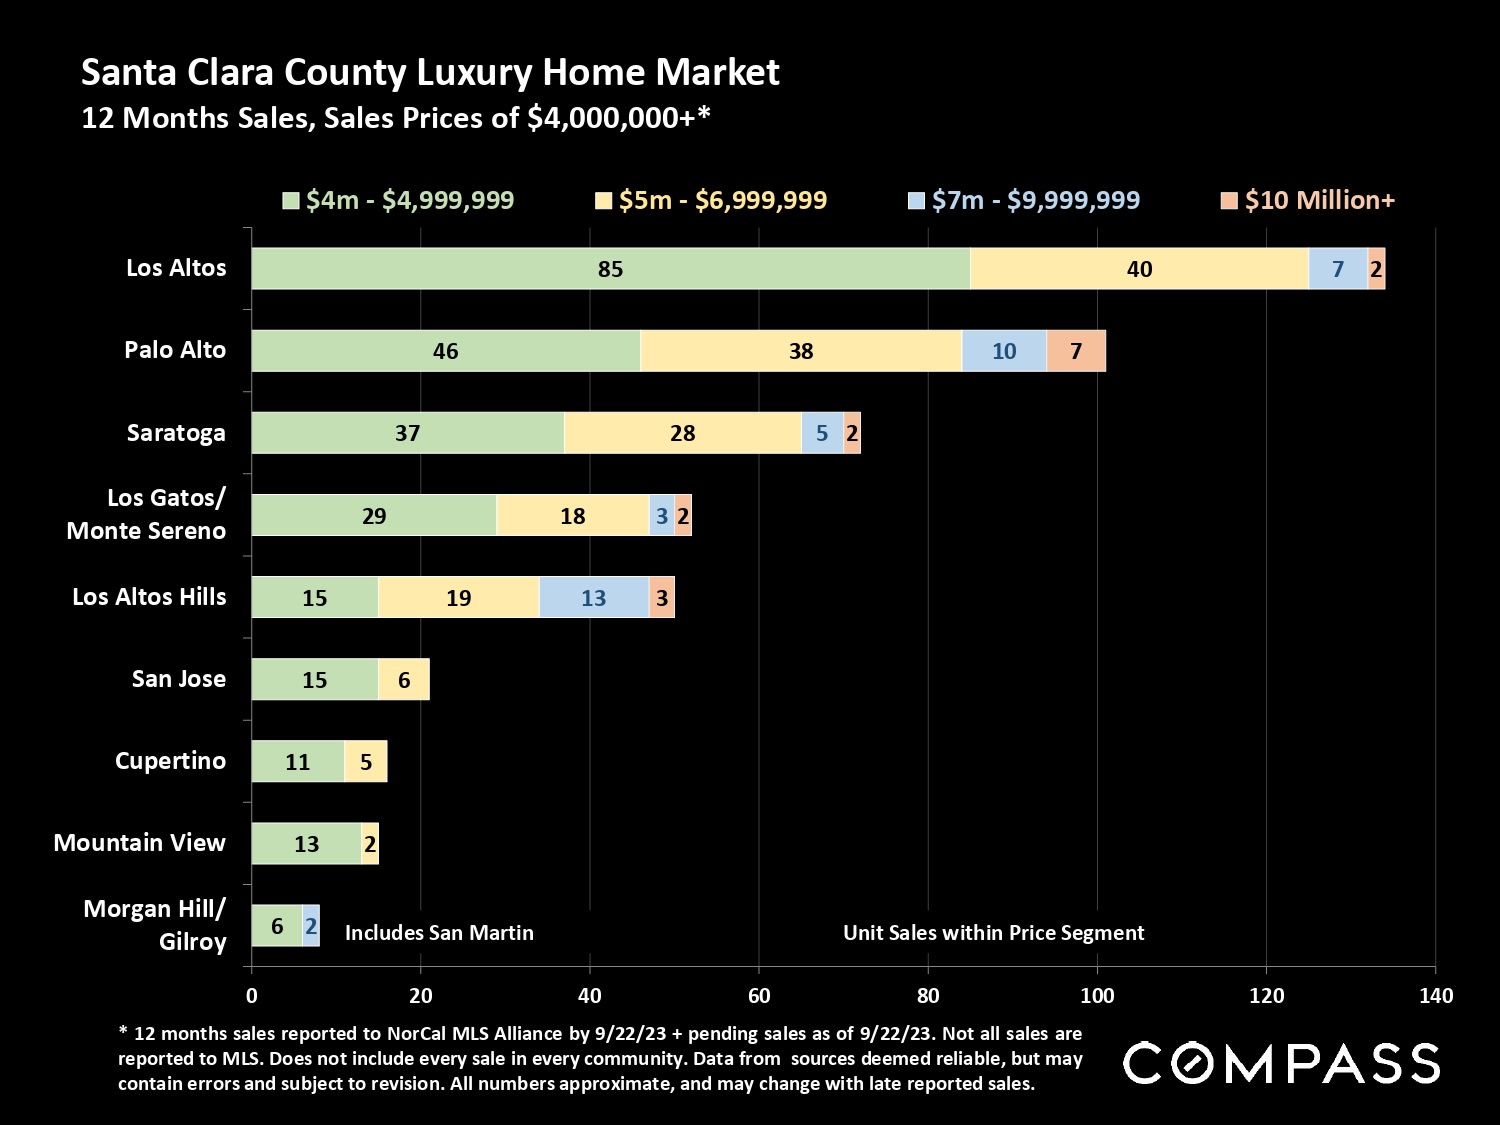
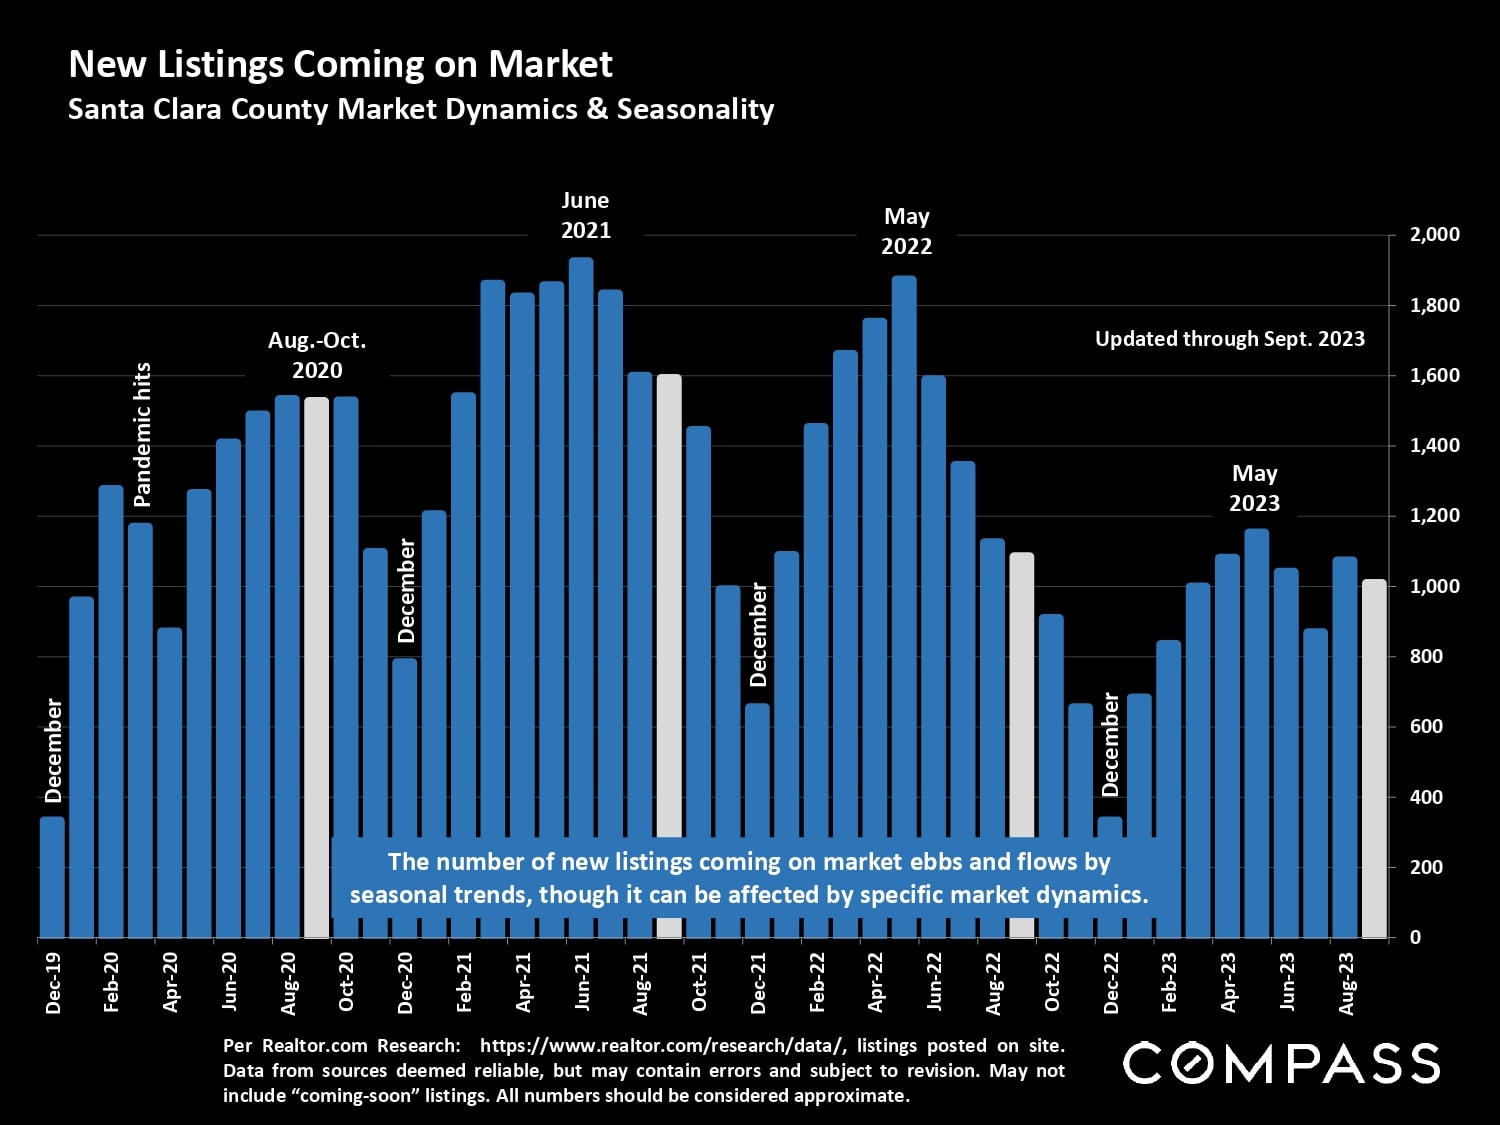
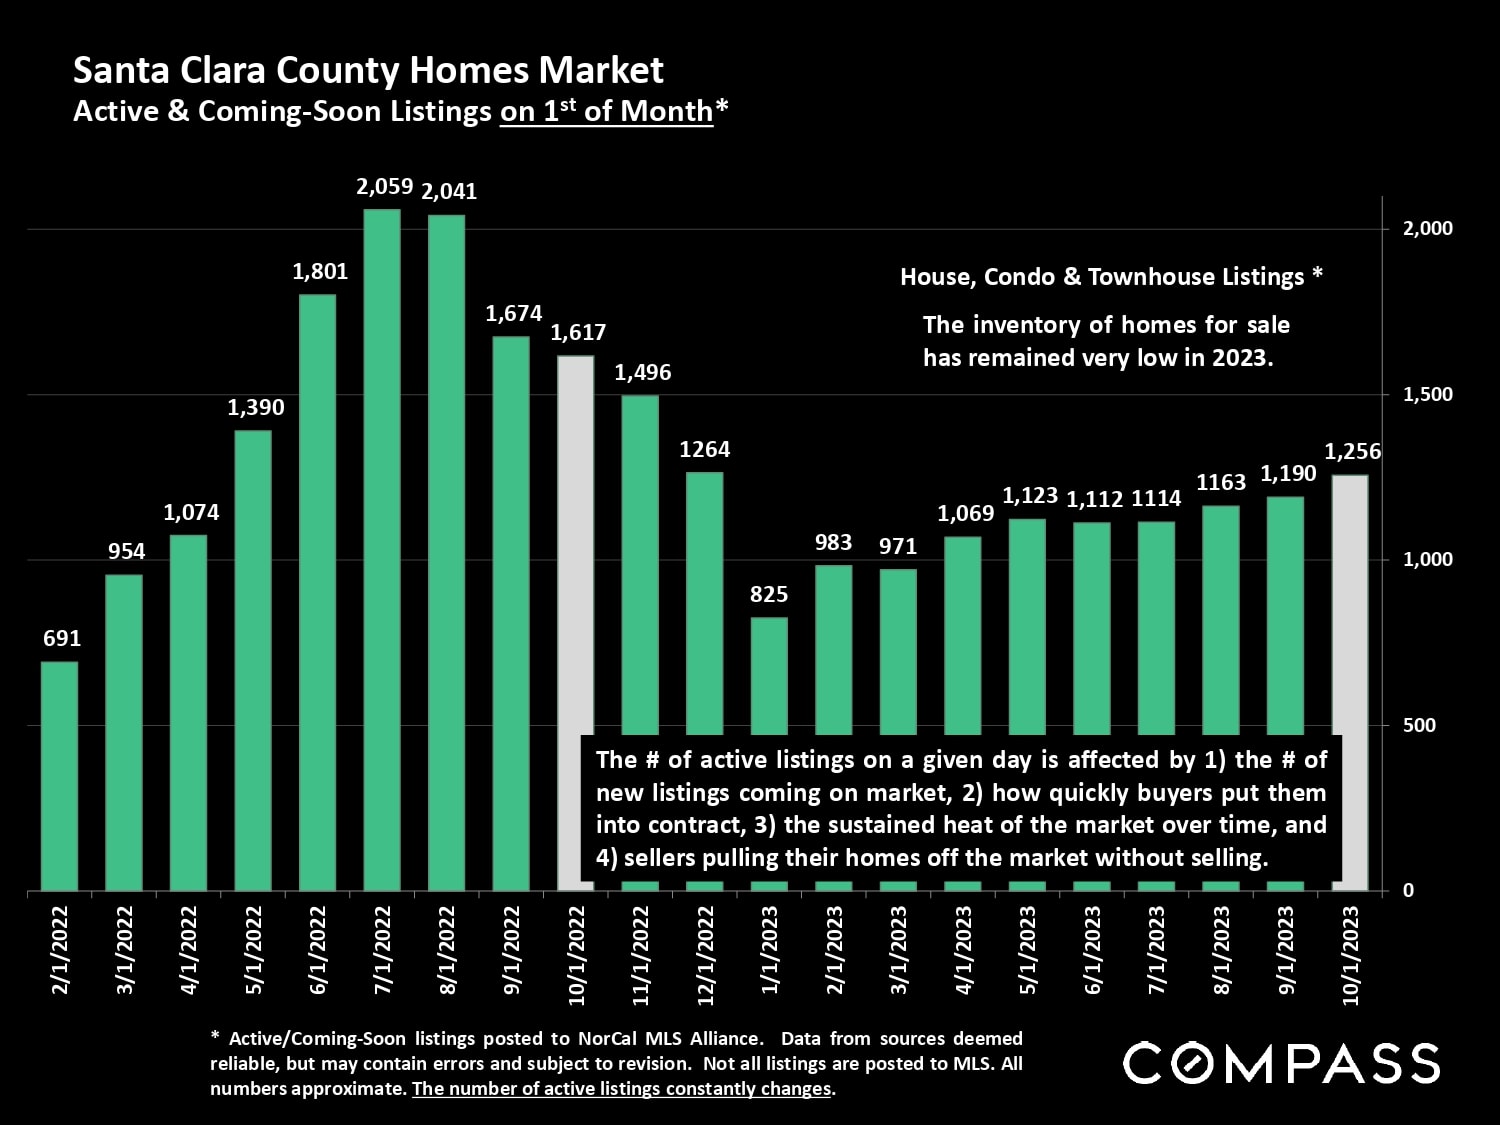
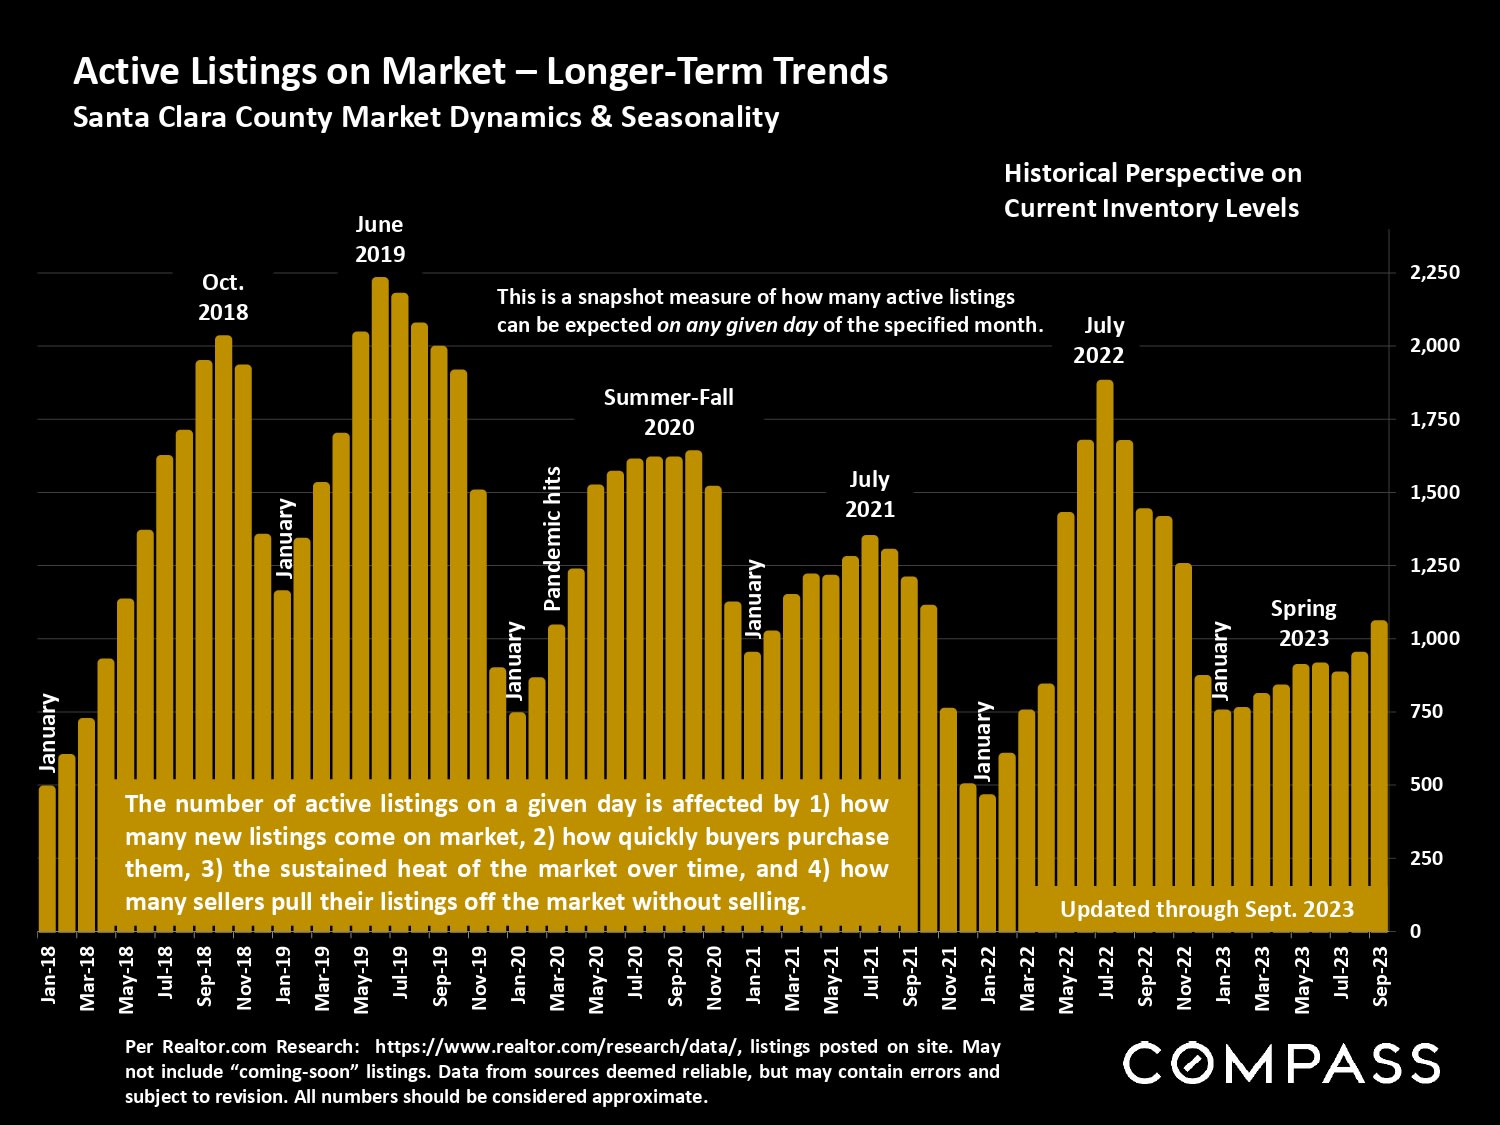
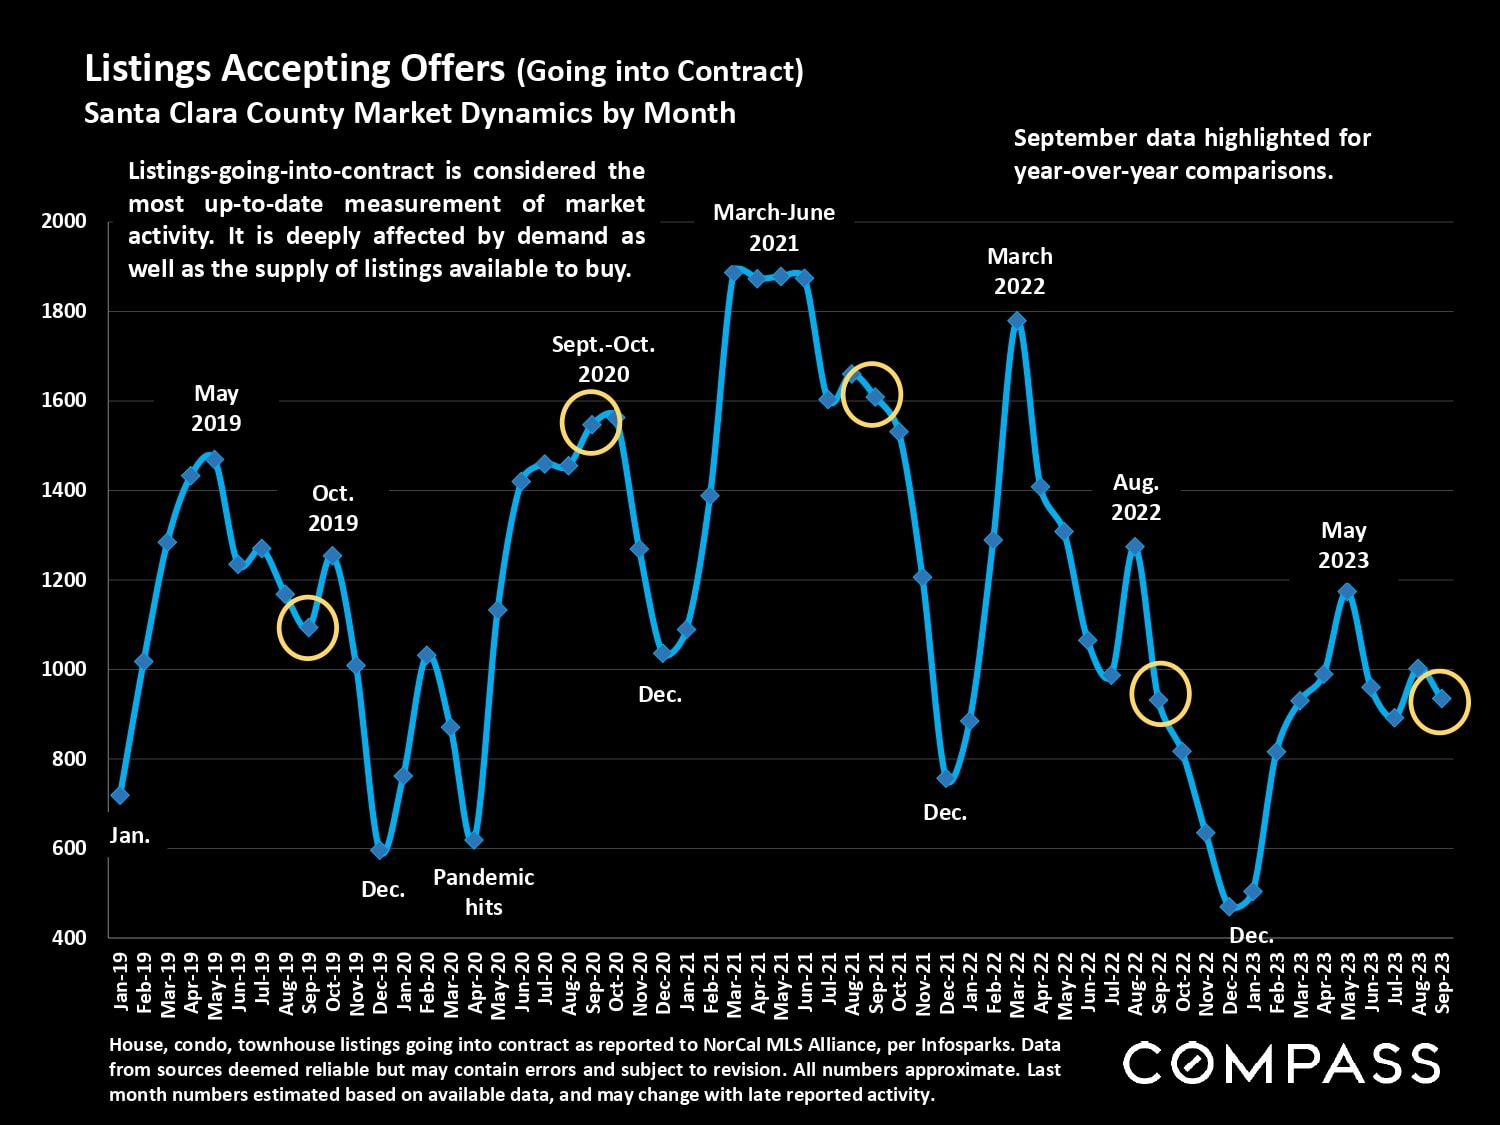
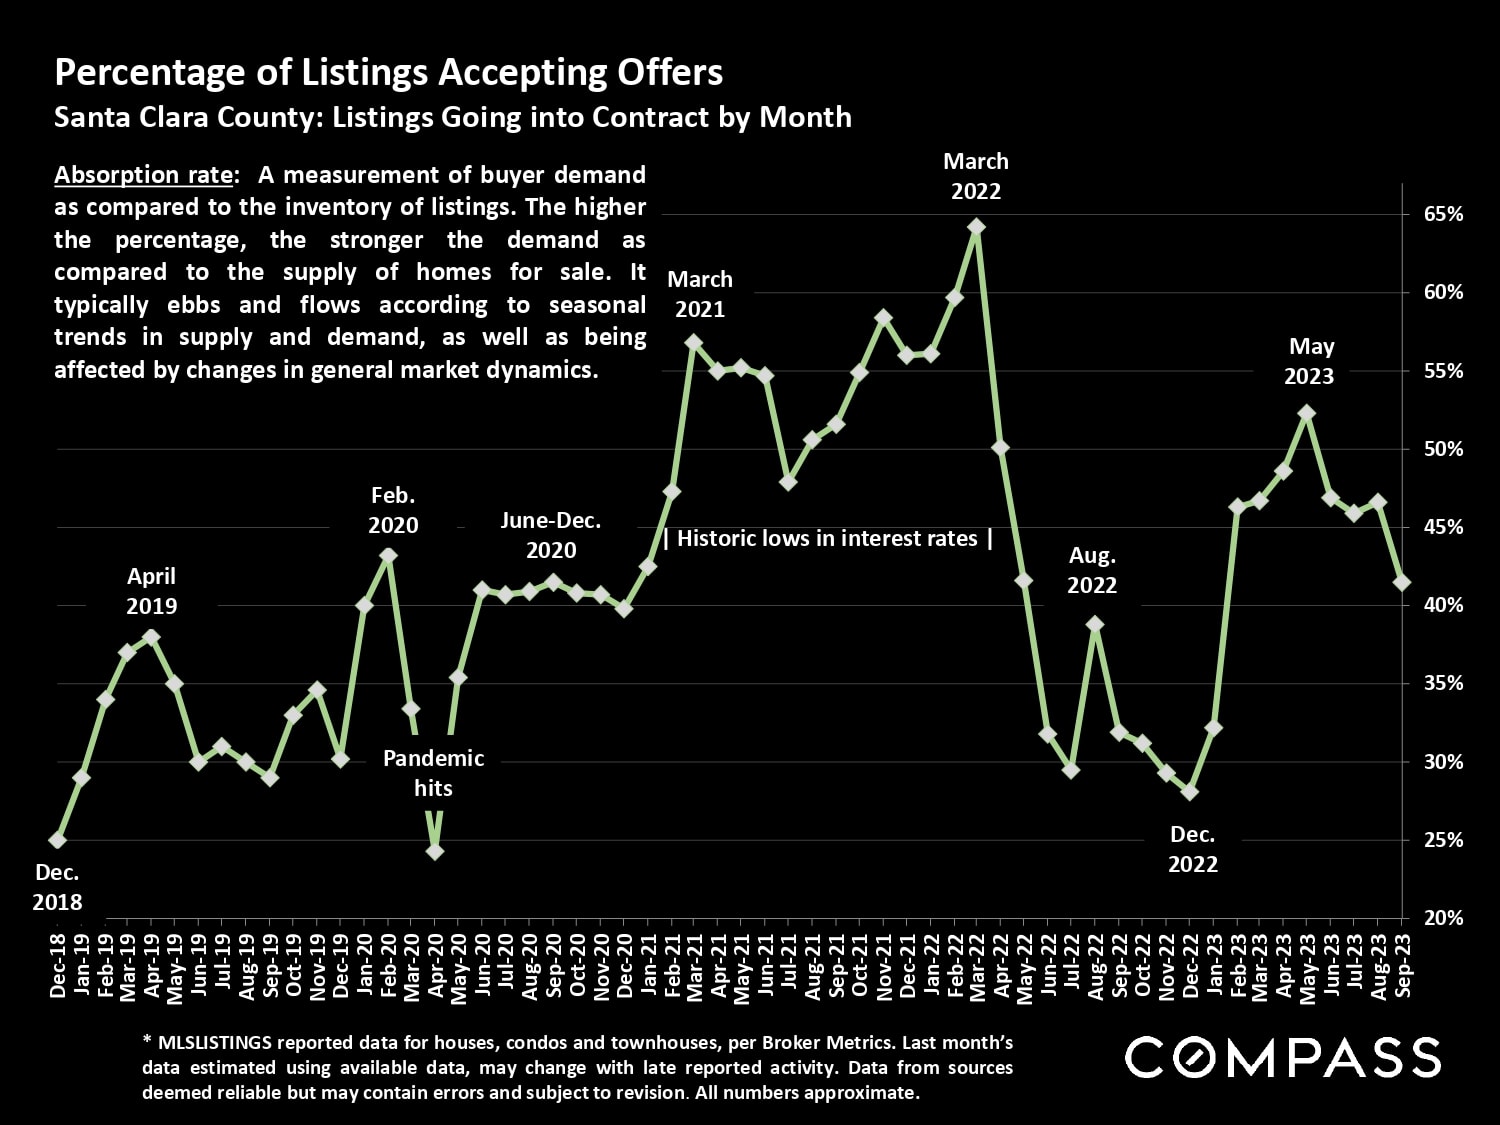
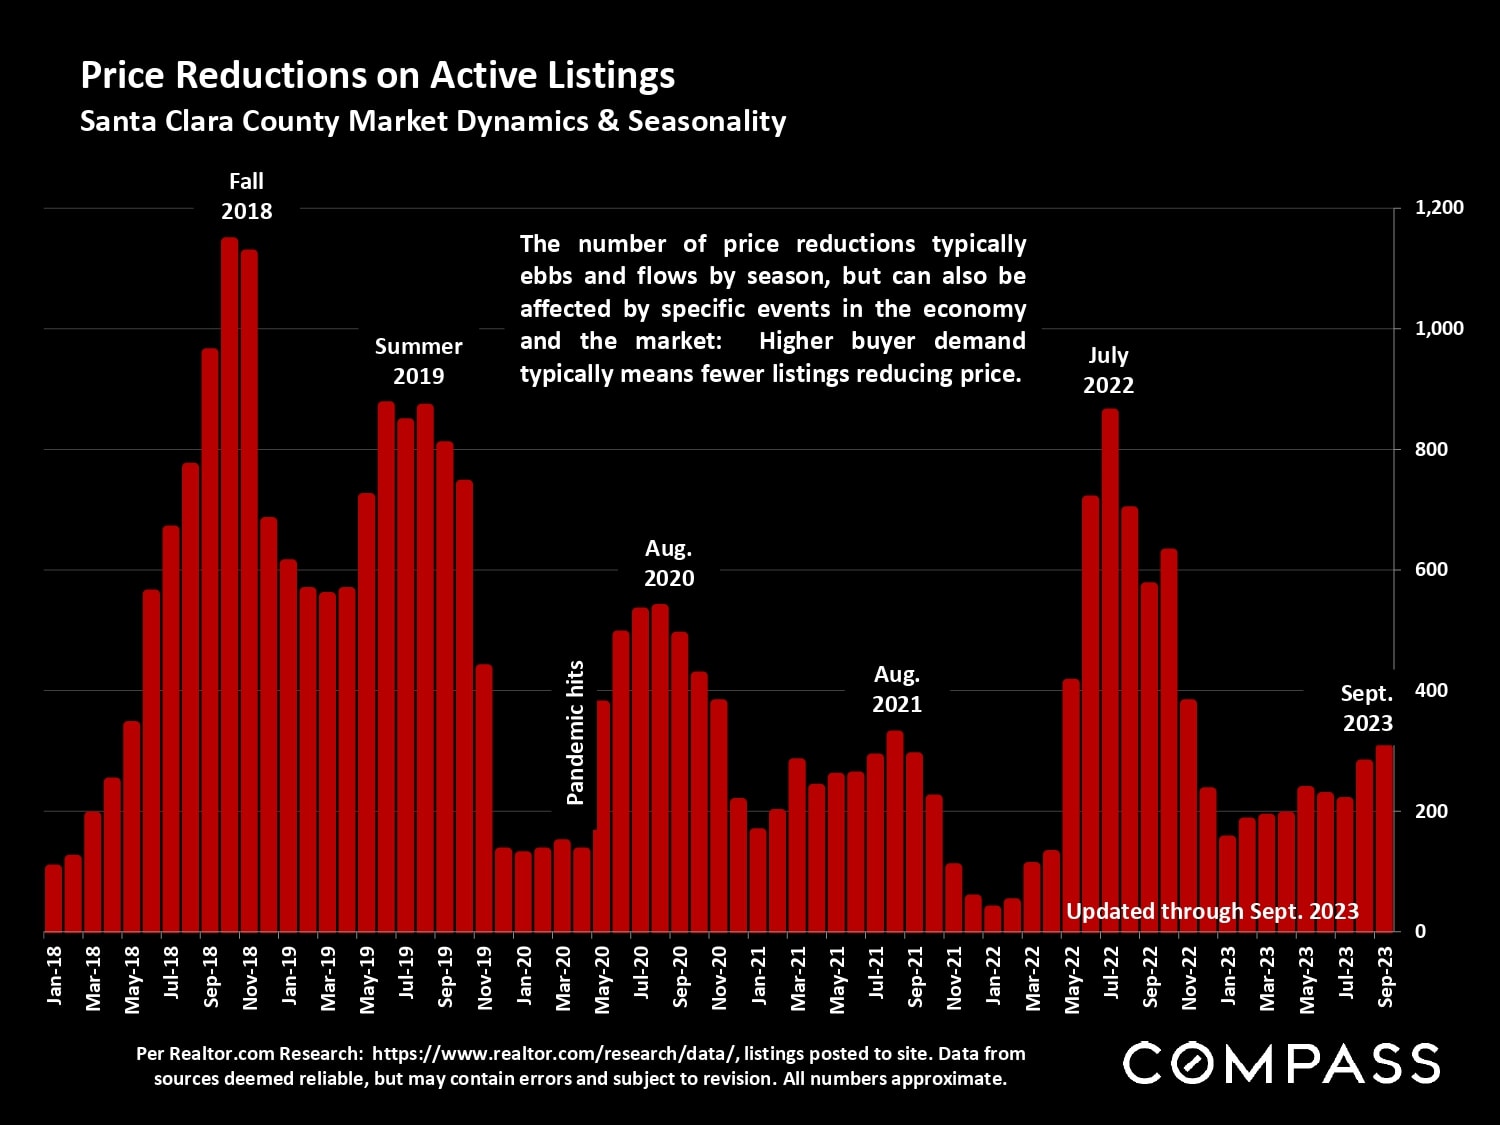
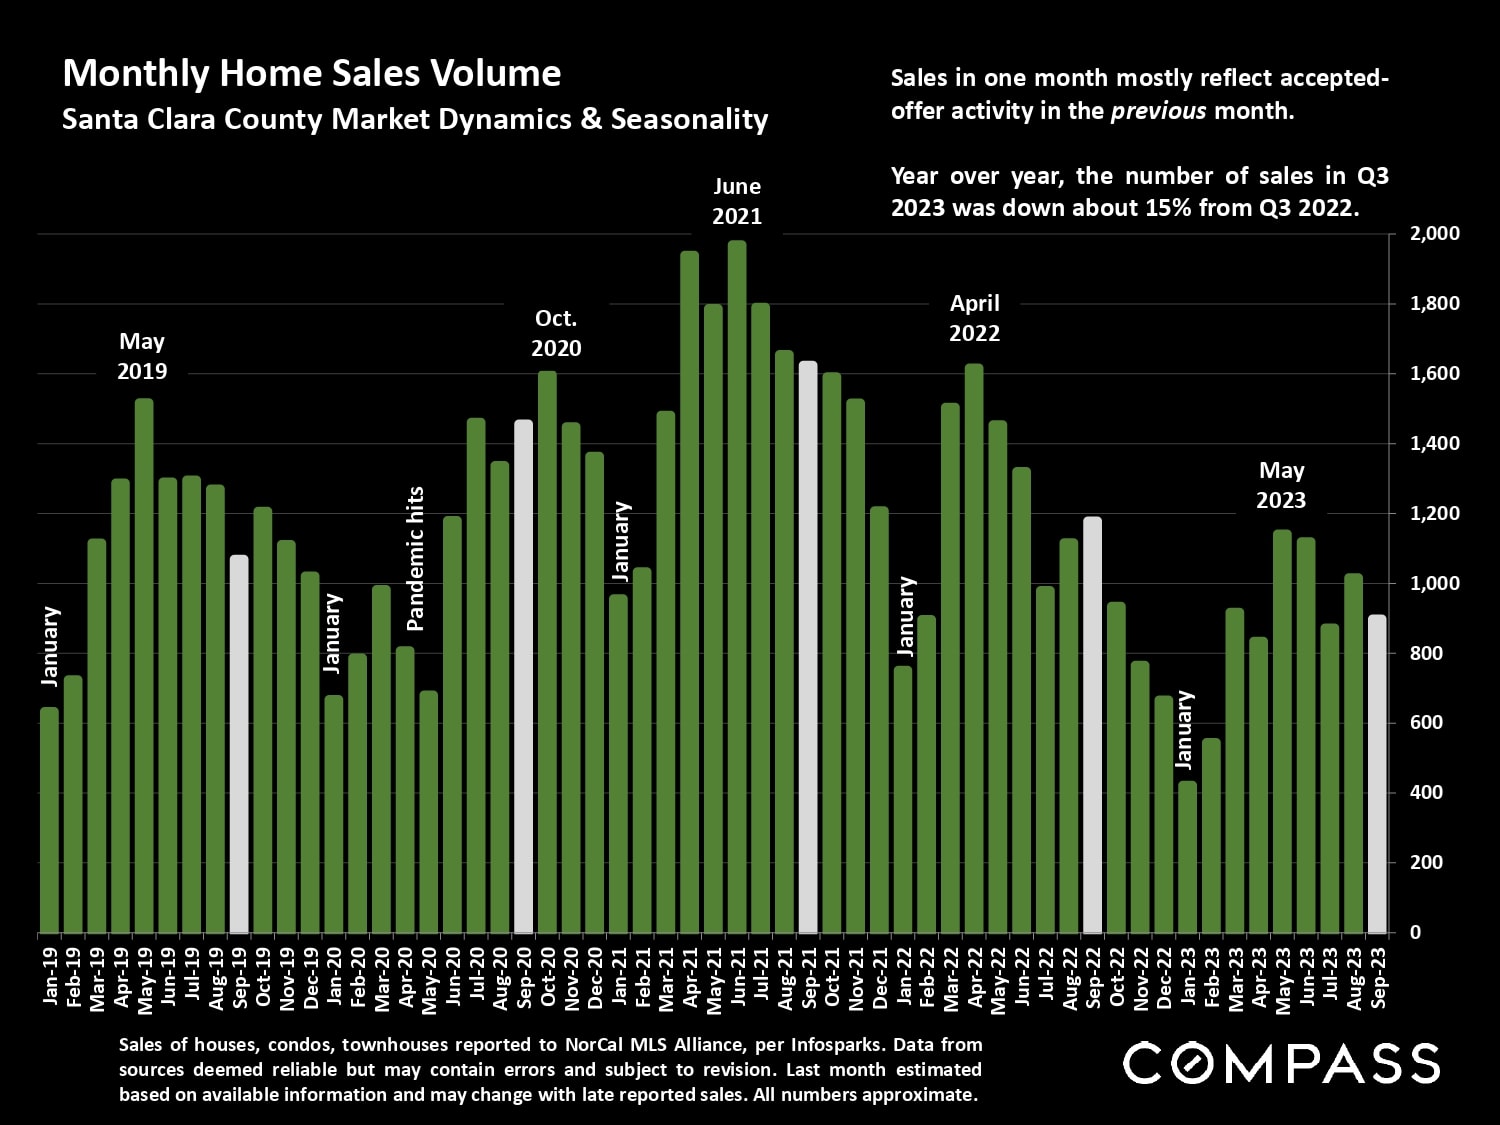
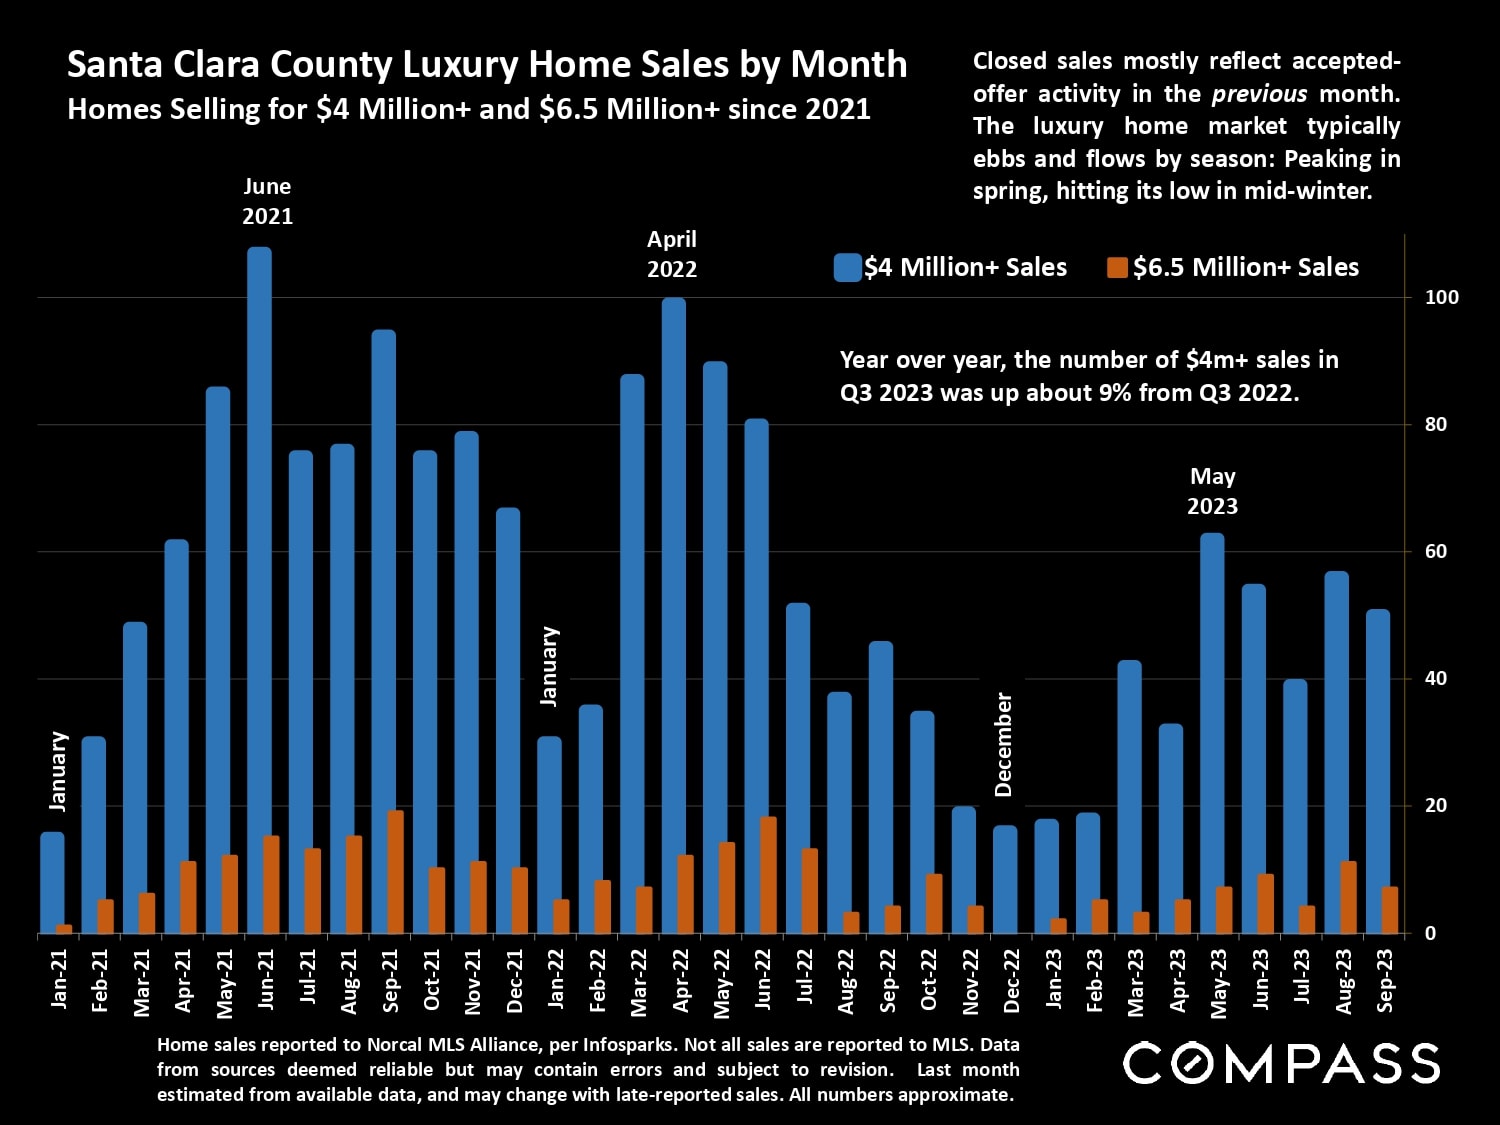
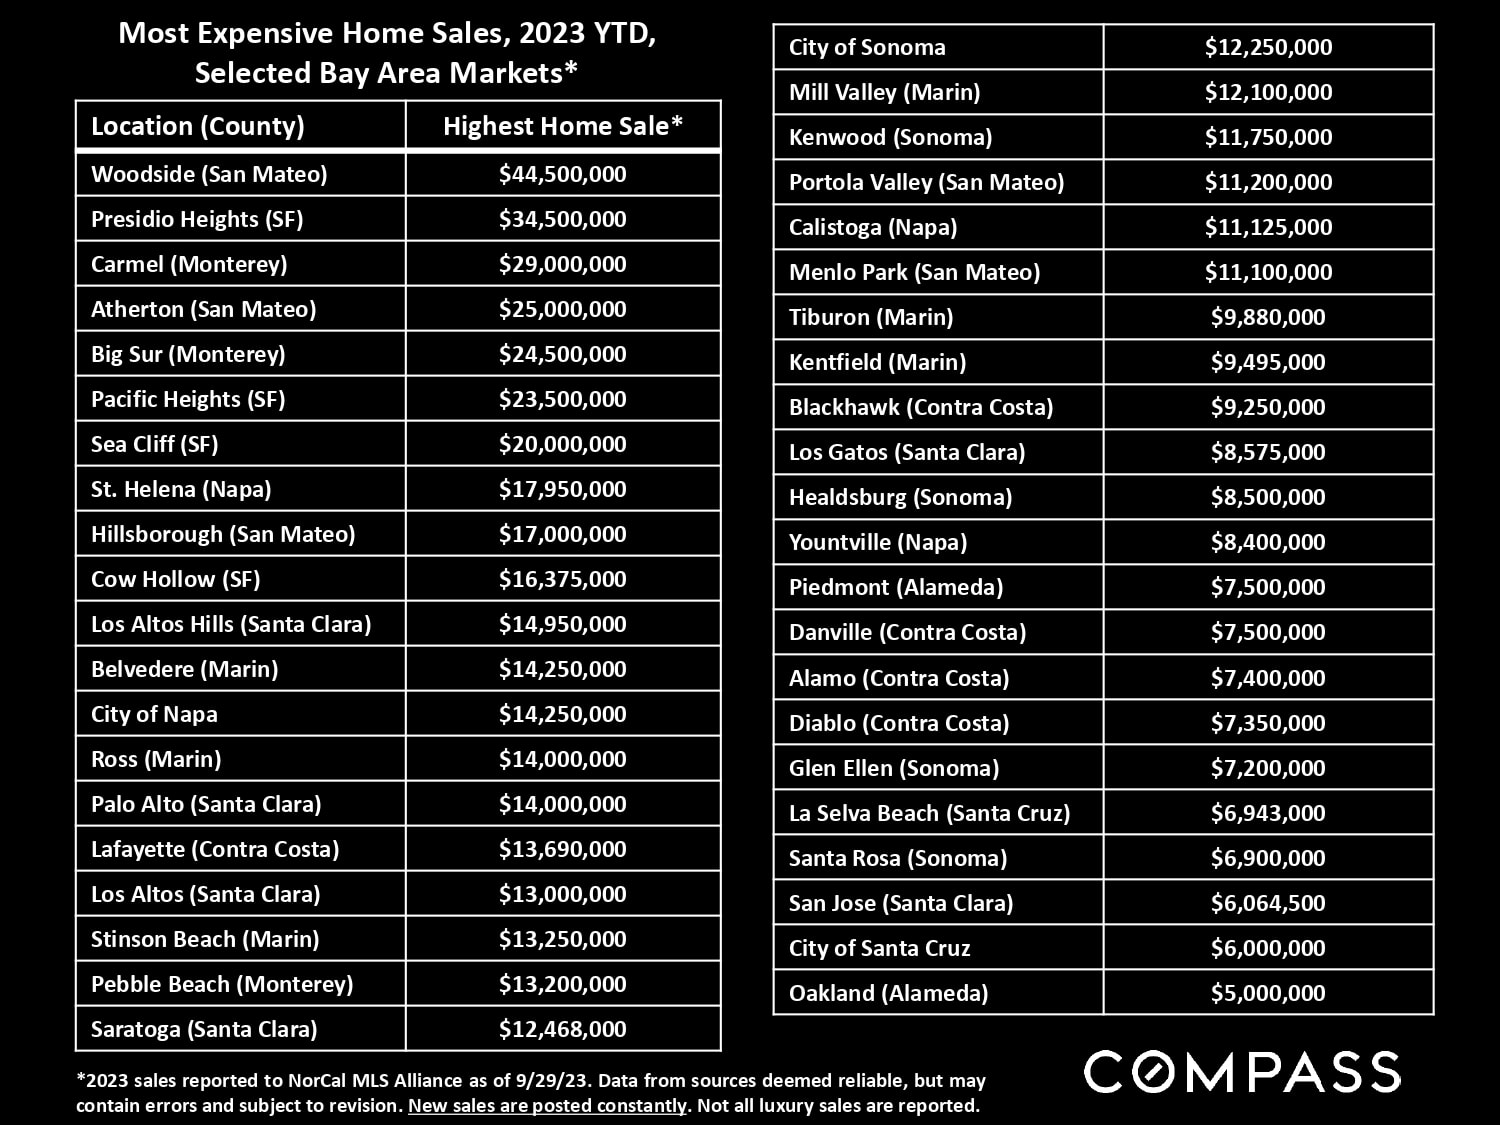
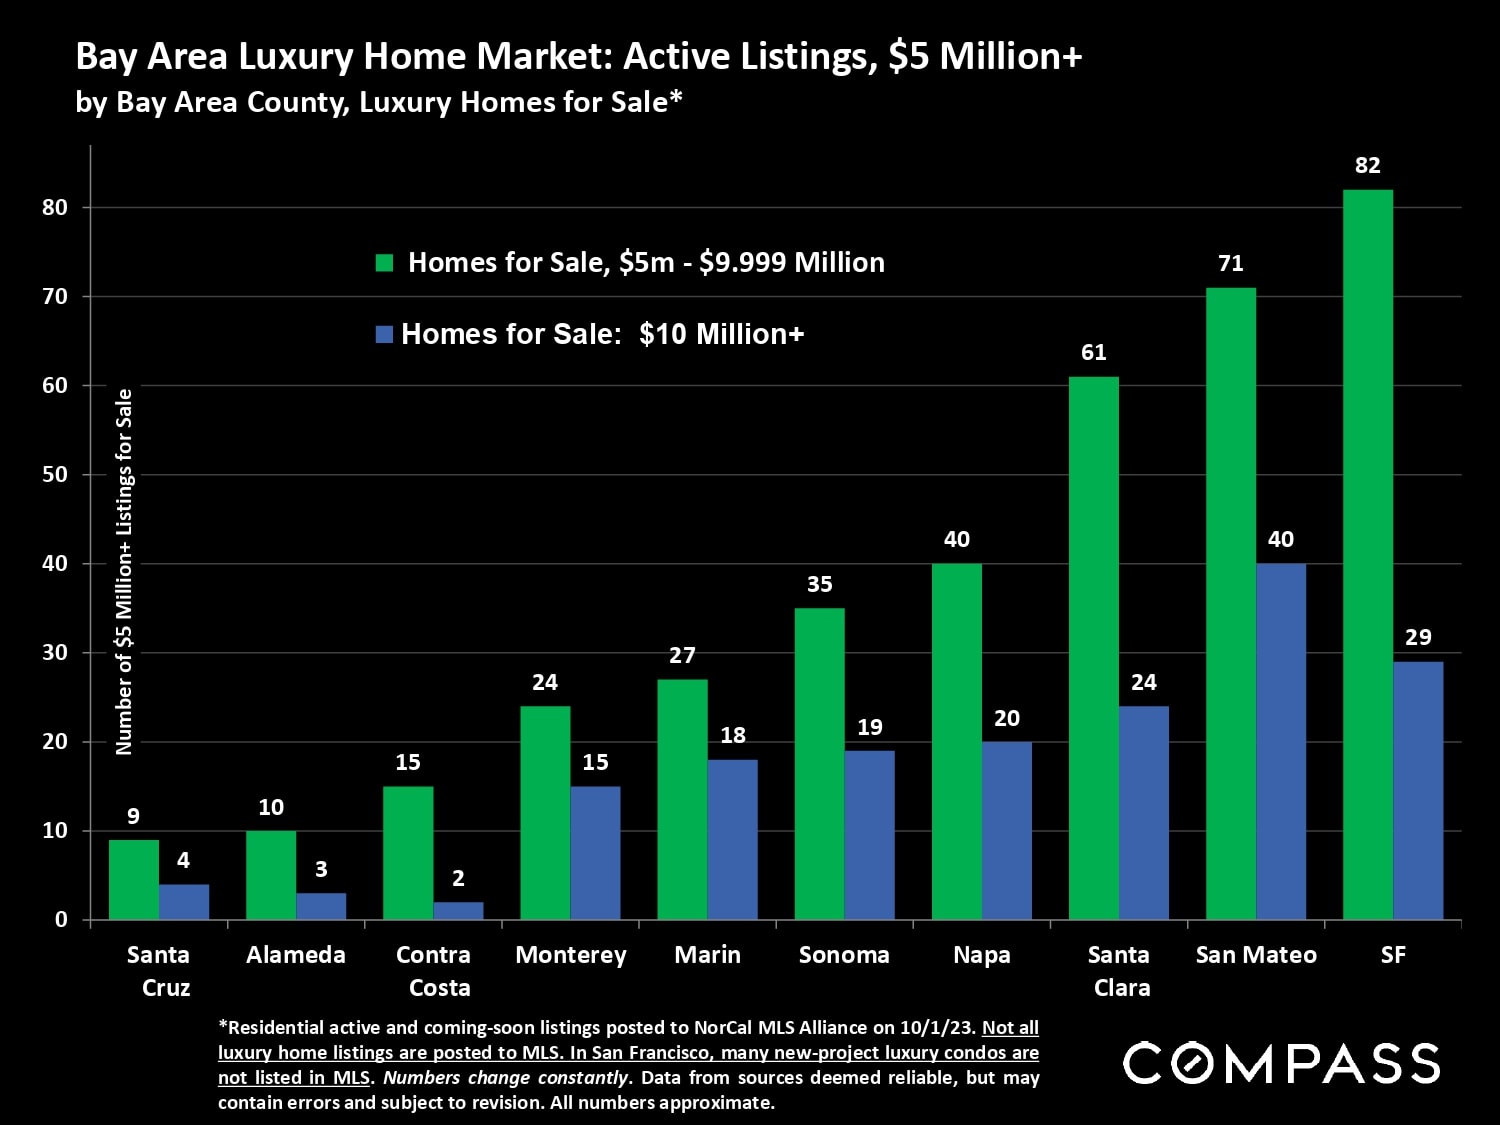
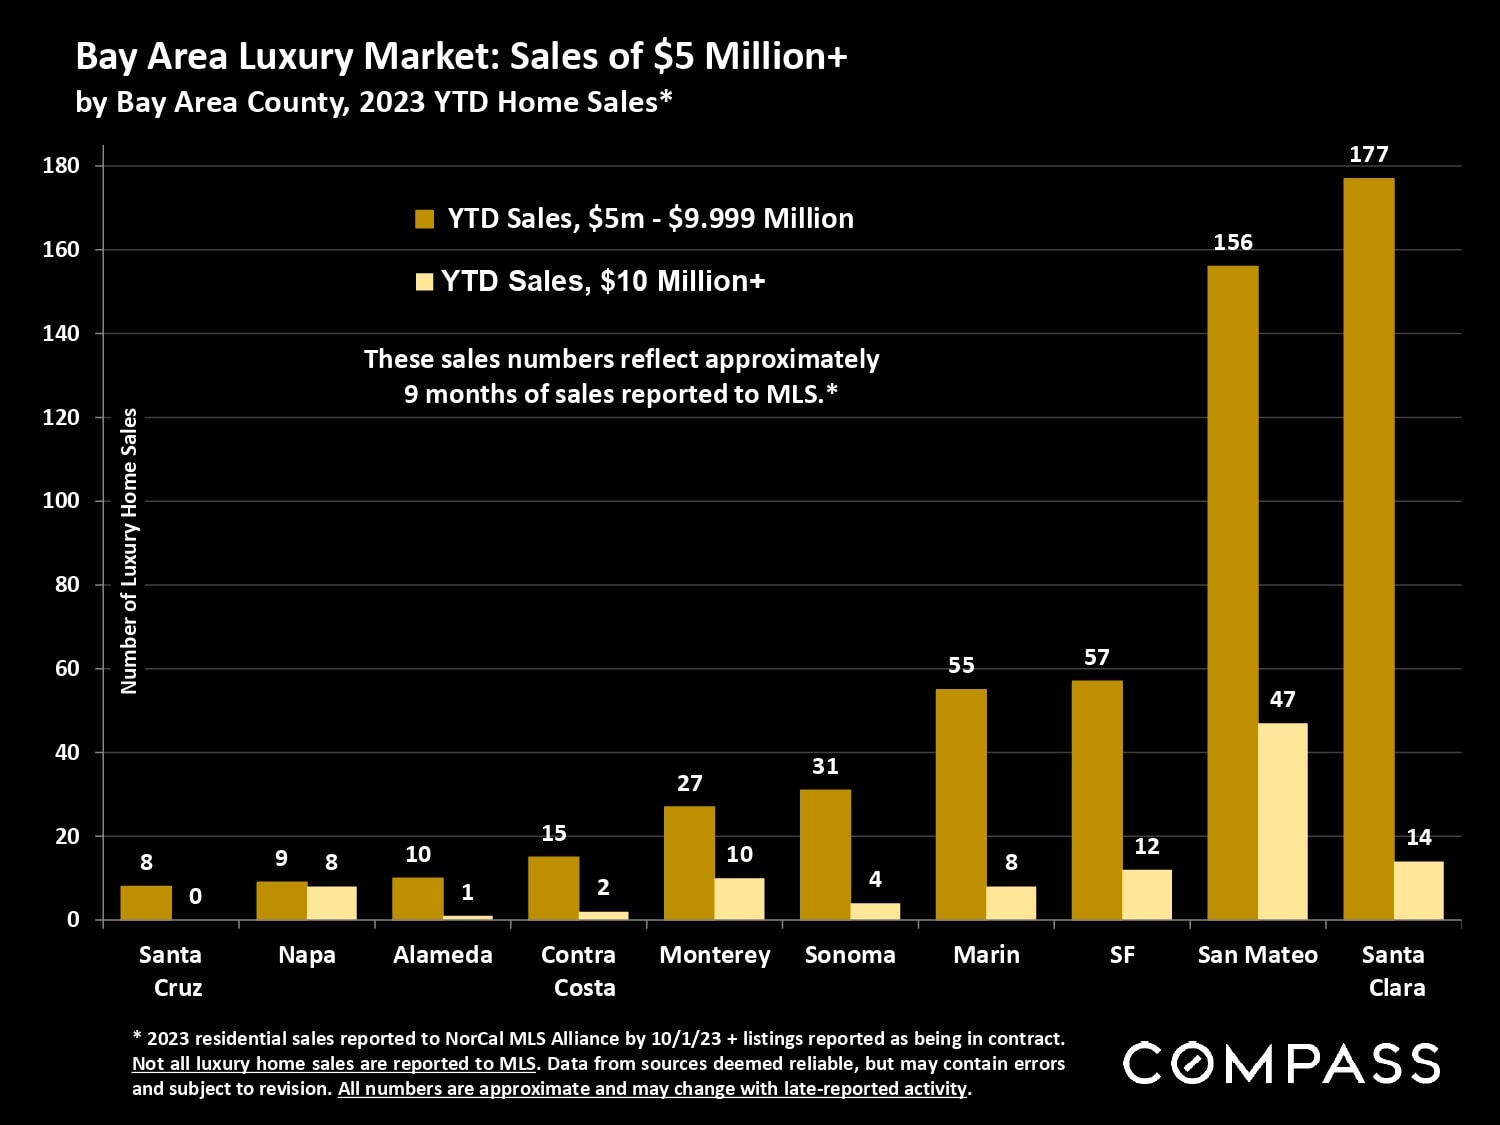
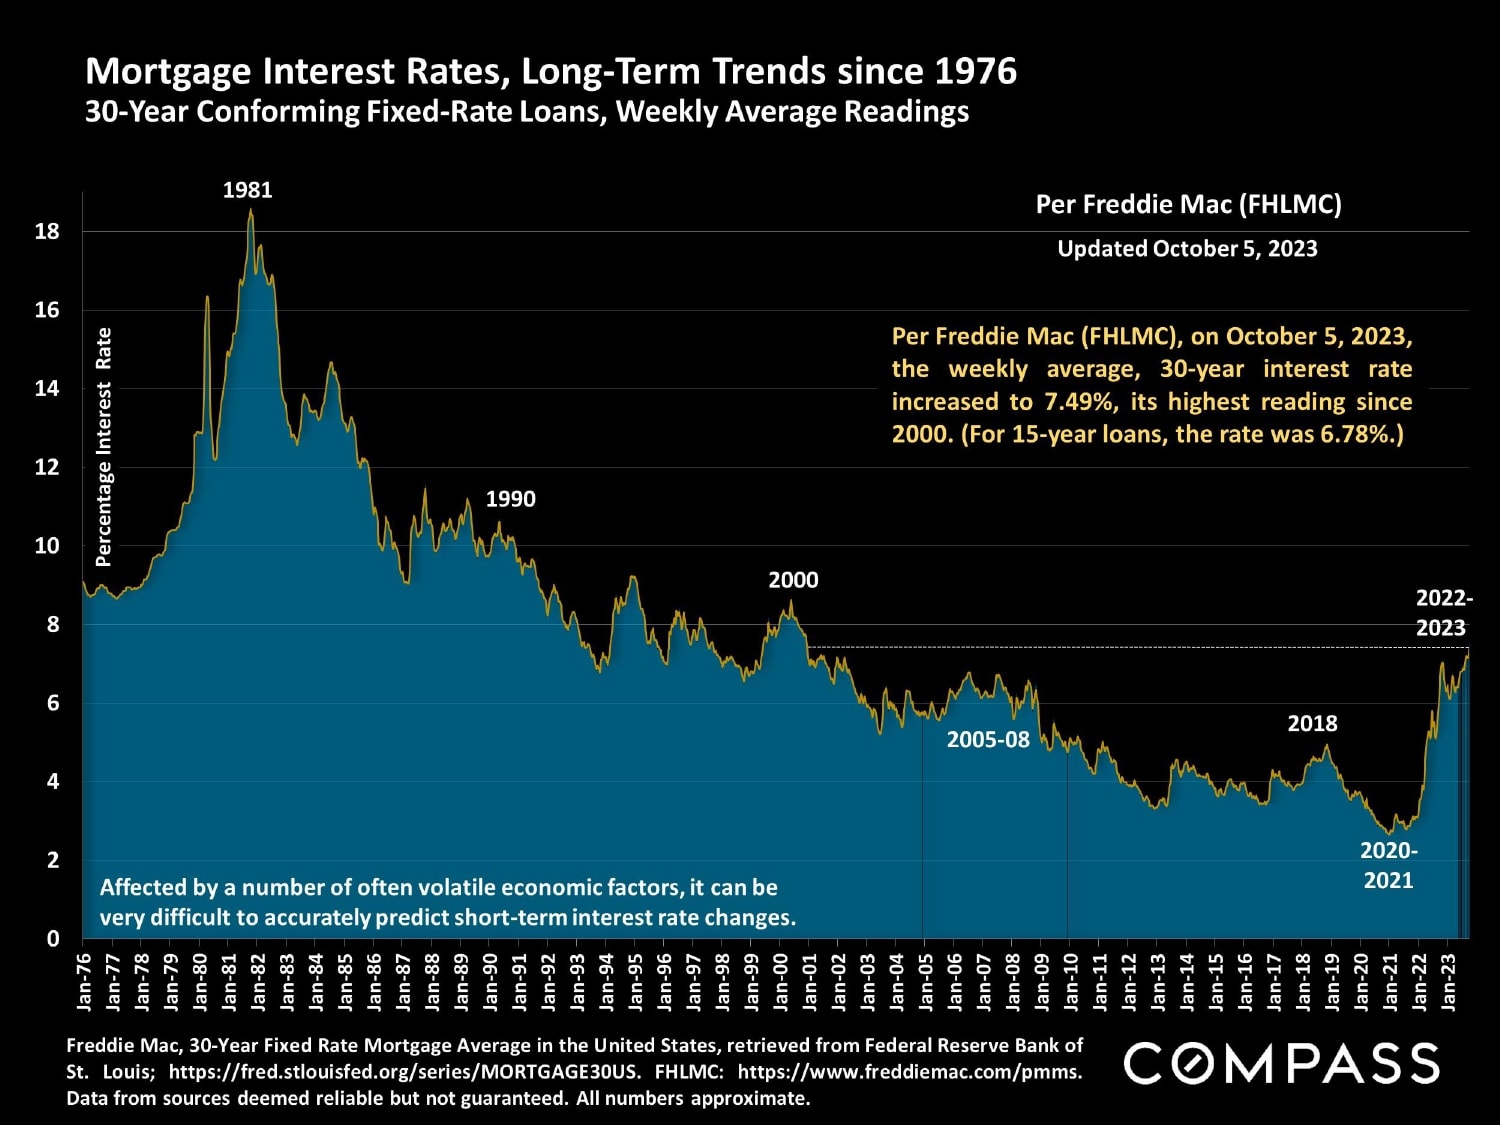
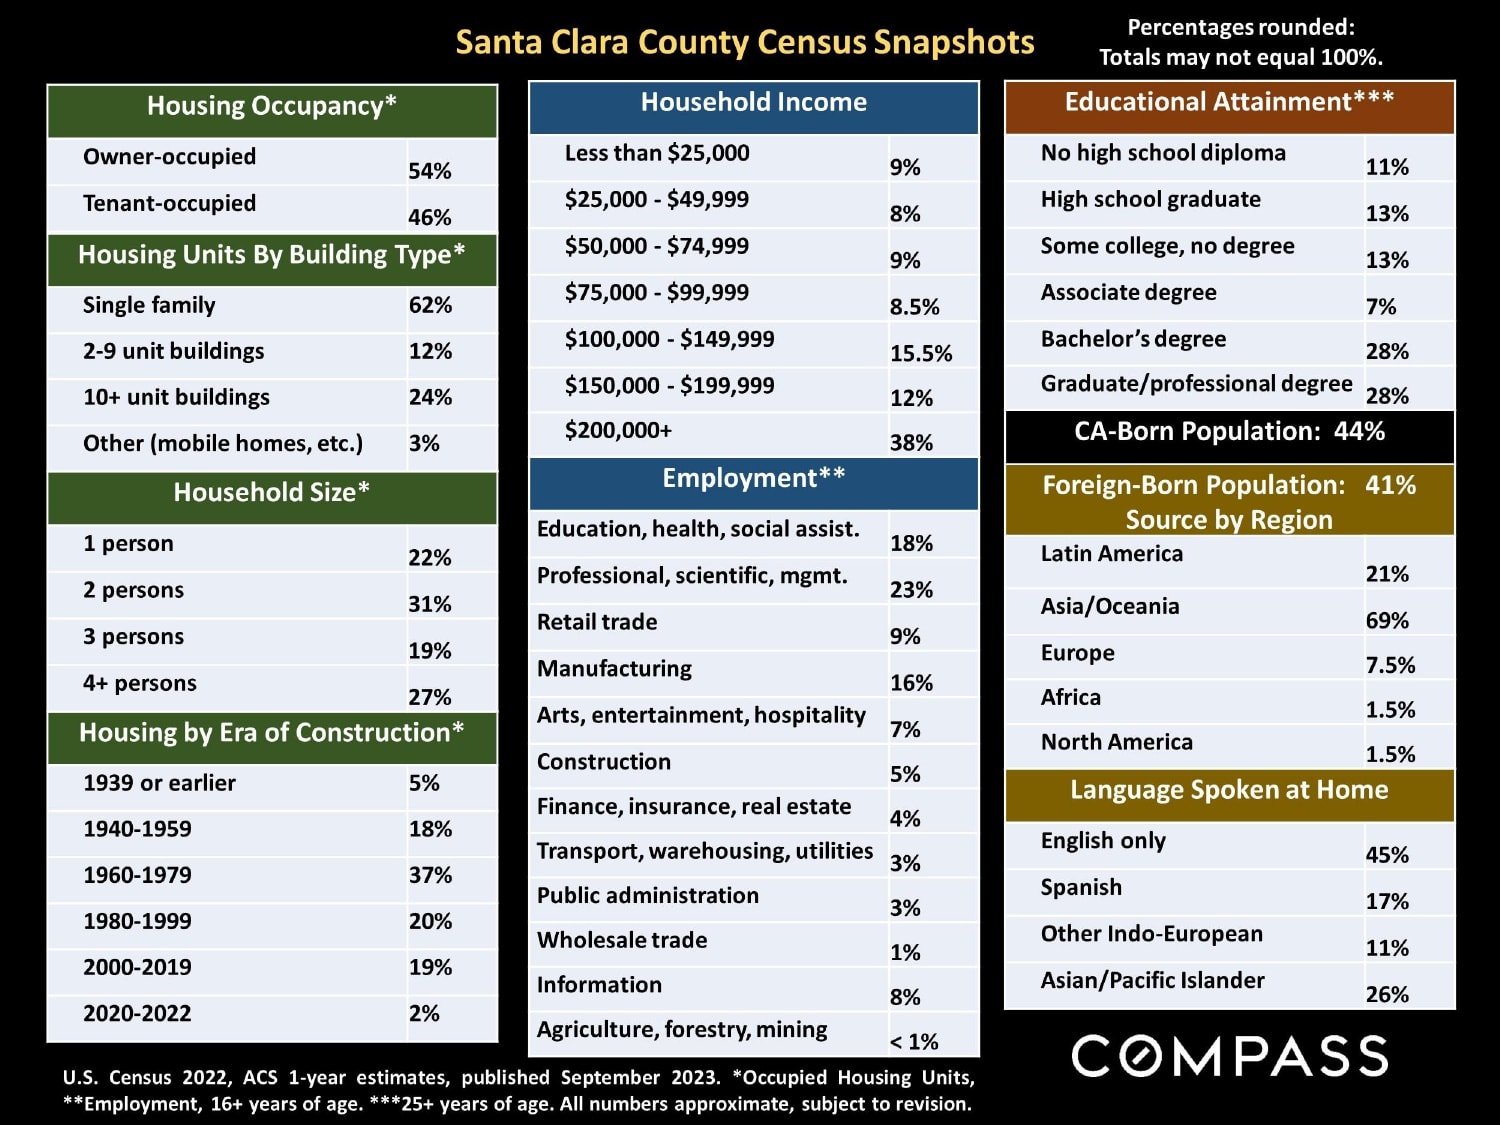
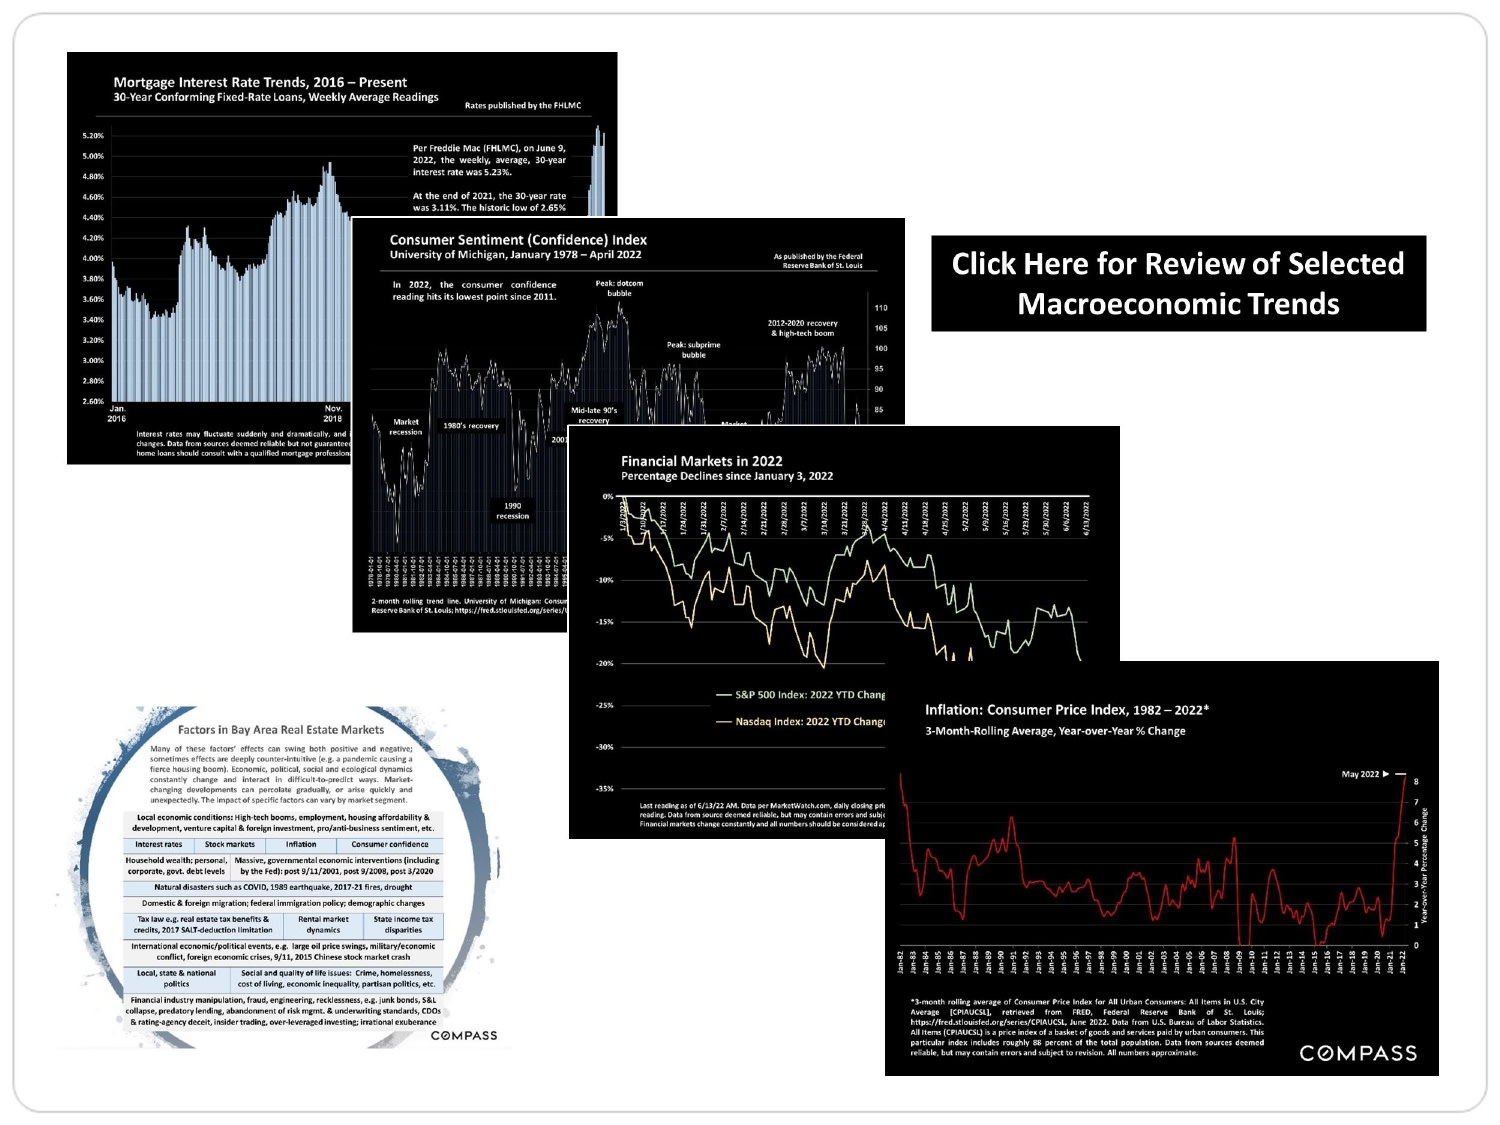
Santa Clara County Real Estate October 2023 Report, featuring a winding trail through dry grassland and distant hills. Santa Clara County October 2023 housing-market update and California 2024 forecast on a black text slide. Chart of Santa Clara County quarterly median house prices, showing a Q2 2022 peak and Q3 2023 prices. Chart comparing Santa Clara County home-price and household-income growth from 1995 to 2023. Santa Clara County quarterly condo price chart, with Q3 2023 at $800,000 and an 8% year-over-year increase. Chart of Santa Clara County townhouse median sale prices by quarter, 2016–2023, peaking at $1.325 million in Q2 2022. Santa Clara County residential market infographic comparing October 2023 sales and listings by price range and property type. Comparative statistics for Greater Bay Area counties and the U.S., including Santa Clara County. Bar chart comparing quarterly median house sale prices across five Santa Clara County markets, Q3 2020–Q3 2023. Bar chart of quarterly median home prices in three Santa Clara County markets from Q3 2020 to Q3 2023. Santa Clara County median home sale prices by quarter, 2020–2023, across three selected markets. Chart comparing Q3 2023 three-bedroom house median prices and sizes across ten Bay Area counties. Bay Area luxury home sales infographic compares prices, sizes, and market data across ten counties; Santa Clara is highlighted. Chart of 12-month Santa Clara County luxury home sales by community and price segment. Chart of Santa Clara County new listings from December 2019 to September 2023, showing seasonal fluctuations. Chart of Santa Clara County home listings, rising from 825 in January 2023 to 1,256 in October 2023. Santa Clara County active-listings chart from 2018 to 2023, showing seasonal inventory trends and historical peaks. Line chart of Santa Clara County listings going into contract, January 2019–September 2023, with September comparisons highlighted. Chart of Santa Clara County listings accepting offers, peaking near 65% in March 2022 before declining and rebounding. Santa Clara County price reductions chart, with monthly red bars from 2018 to 2023 and peaks in fall 2018 and July 2022. Bar chart of monthly Santa Clara County home sales from 2019 to 2023, peaking in mid-2021. Chart of monthly Santa Clara County luxury home sales, comparing $4 million-plus and $6.5 million-plus properties since 2021. Chart of 2023 year-to-date highest home sales across selected Bay Area markets, led by Woodside at $44.5 million. Bar chart of Bay Area $5 million-plus listings by county, with Santa Clara at 61 listings under $10 million and 24 at $10 million-plus. Chart comparing 2023 luxury home sales by Bay Area county, with Santa Clara and San Mateo leading. Chart of 30-year U.S. mortgage rates since 1976, showing a sharp rise to 7.49% in October 2023. Santa Clara County Census Snapshots infographic with housing, income, employment, education, and demographic statistics. Macroeconomic trends collage with charts on mortgage rates, consumer sentiment, financial markets, inflation, and Bay Area real estate factors. Real estate market report disclaimer explaining statistics, data limitations, and Compass disclosures.


WORK WITH US

We offer the highest level of service and expertise to our clients. Our team has built a reputation for consistently representing the finest real estate in San Francisco and Napa Valley. Results driven and dedicated to your success, whether buying, selling, renting or investing. Contact us today for a private consultation.

Contact Us