
Santa Clara County Real Estate February 2025 Report

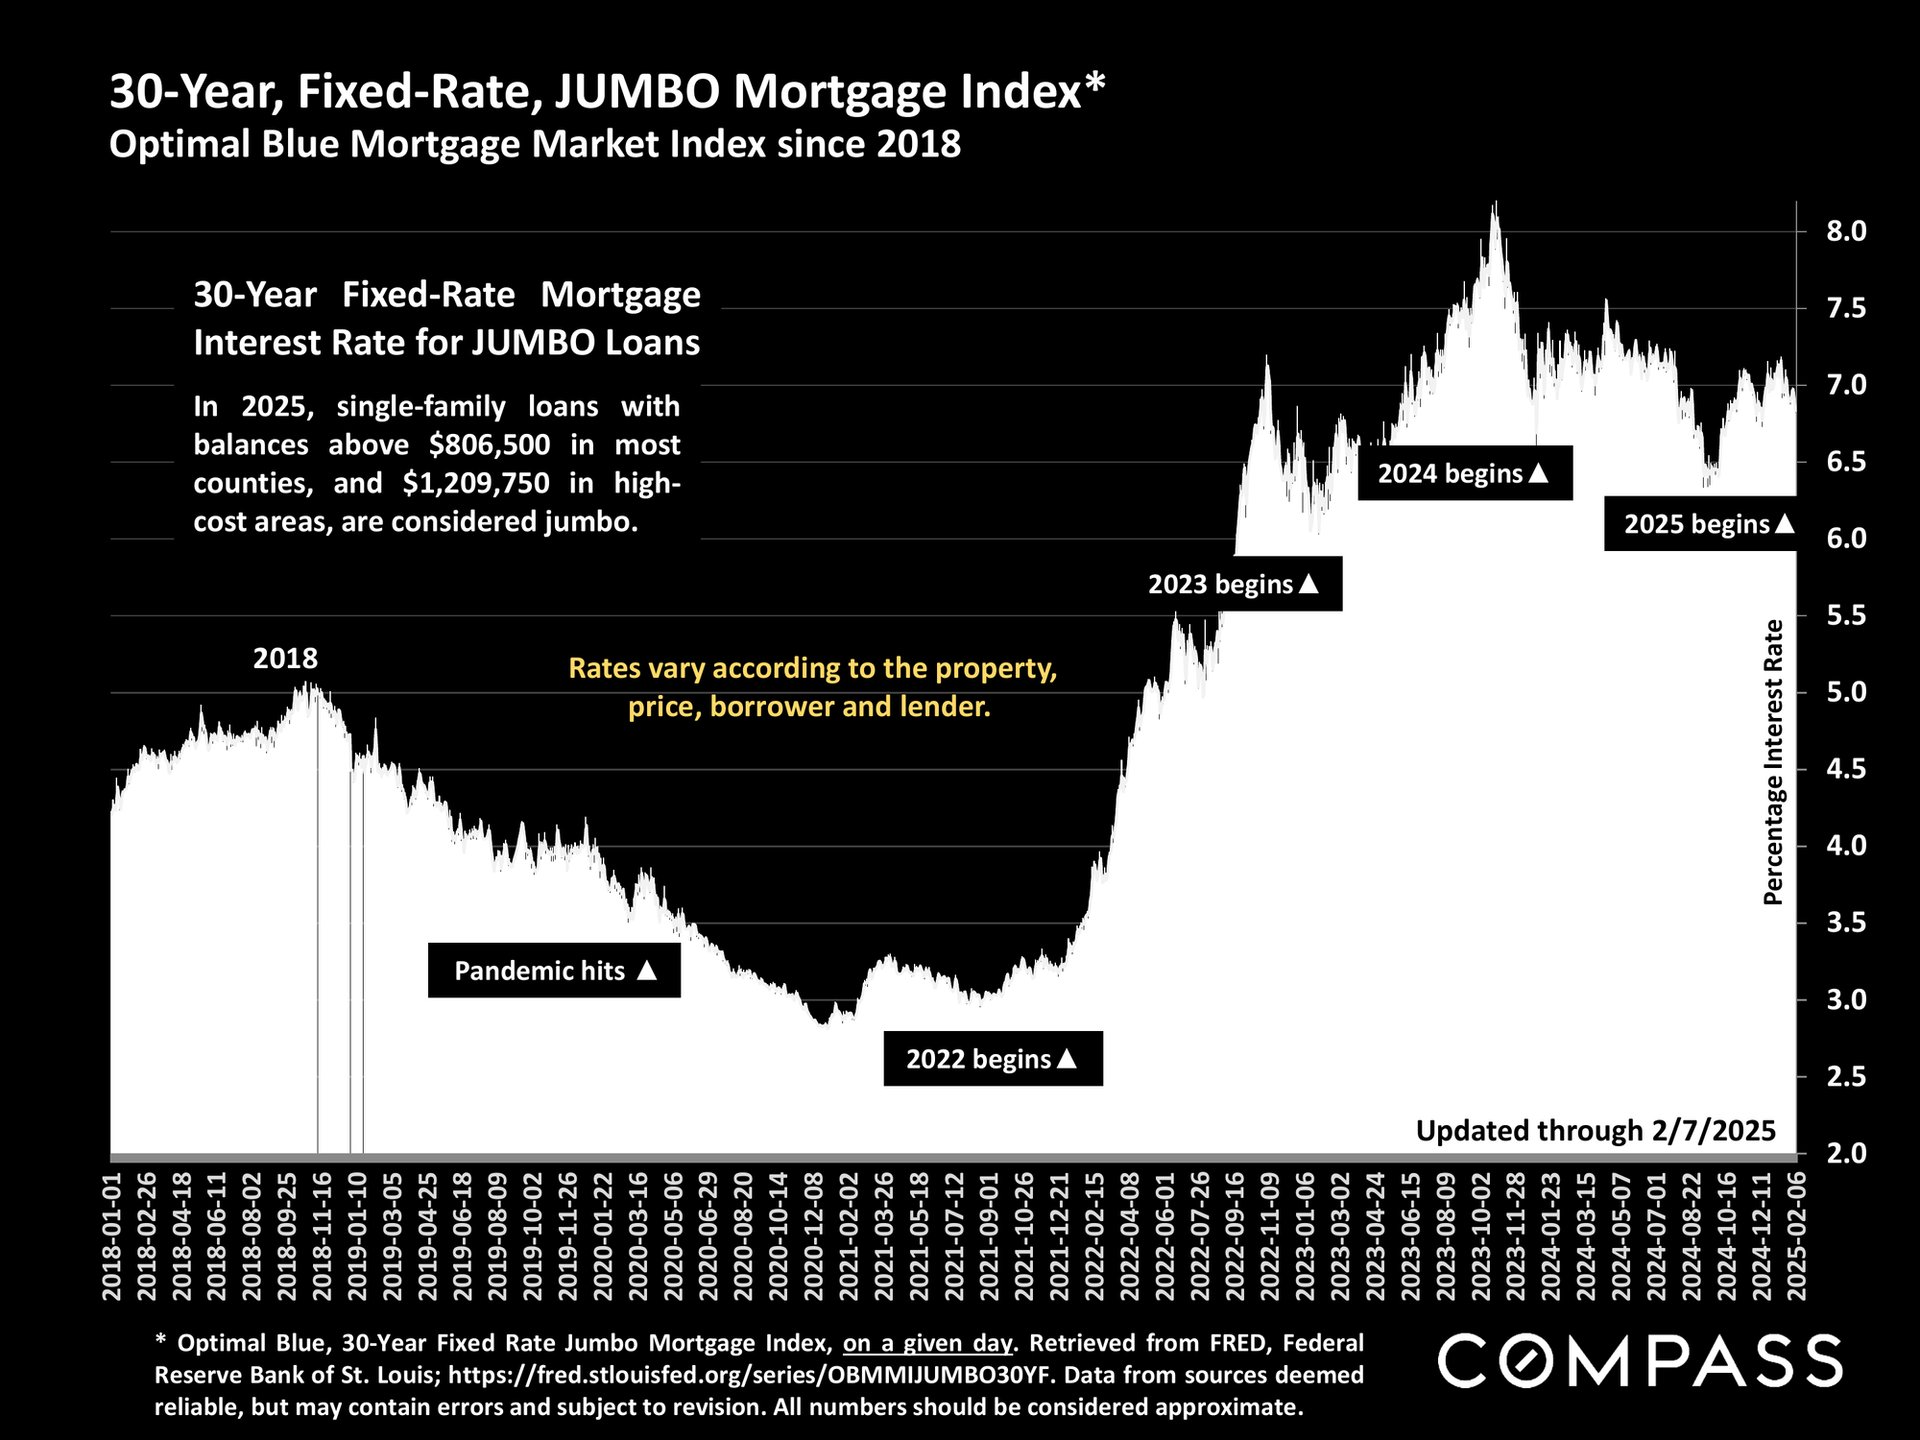
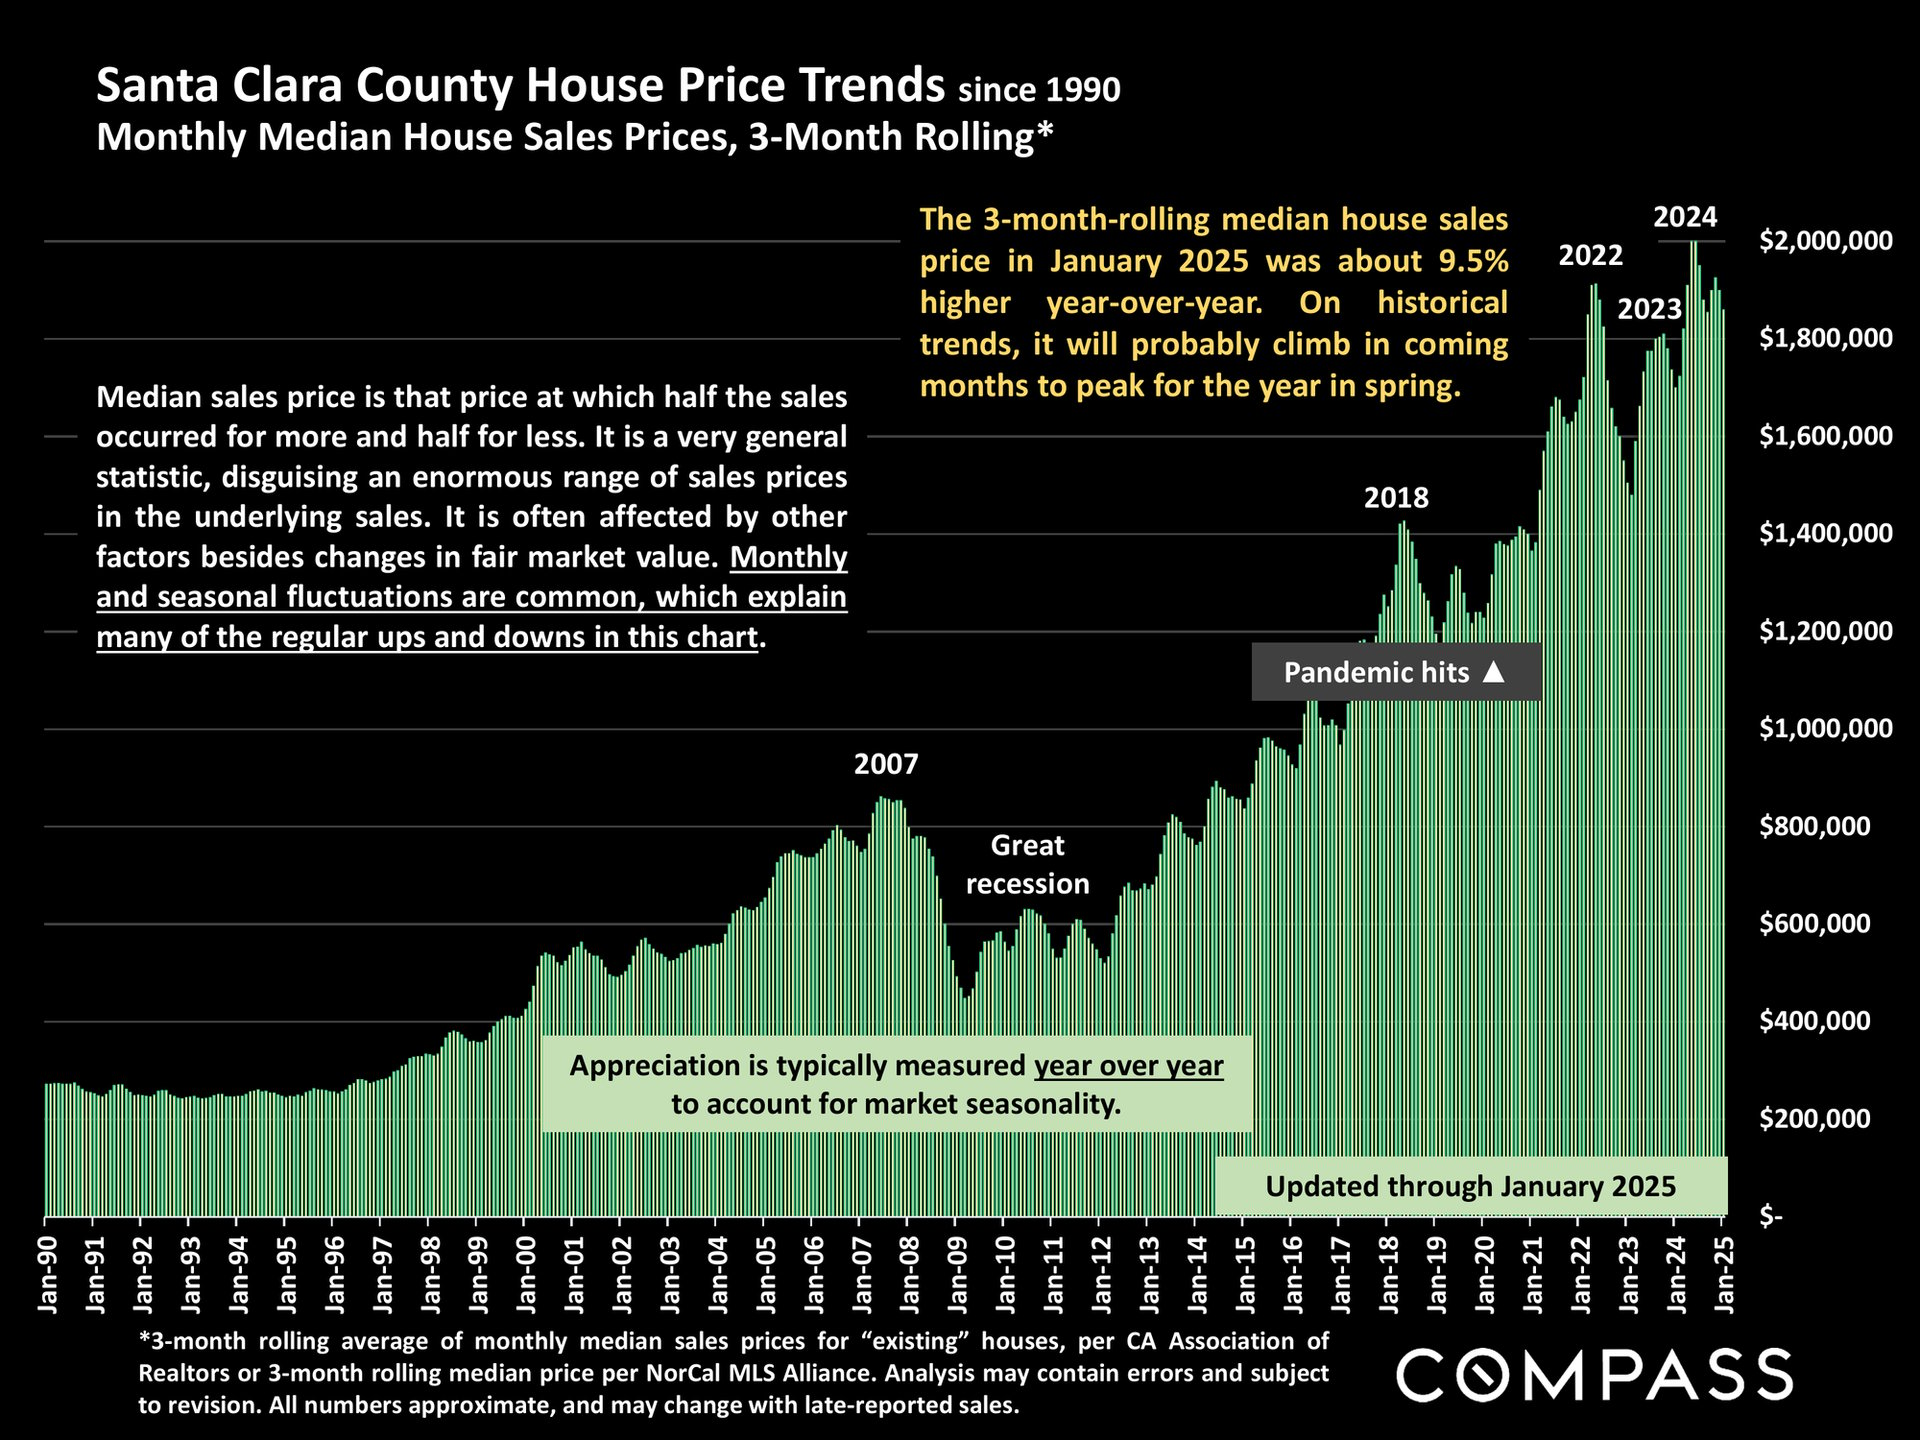
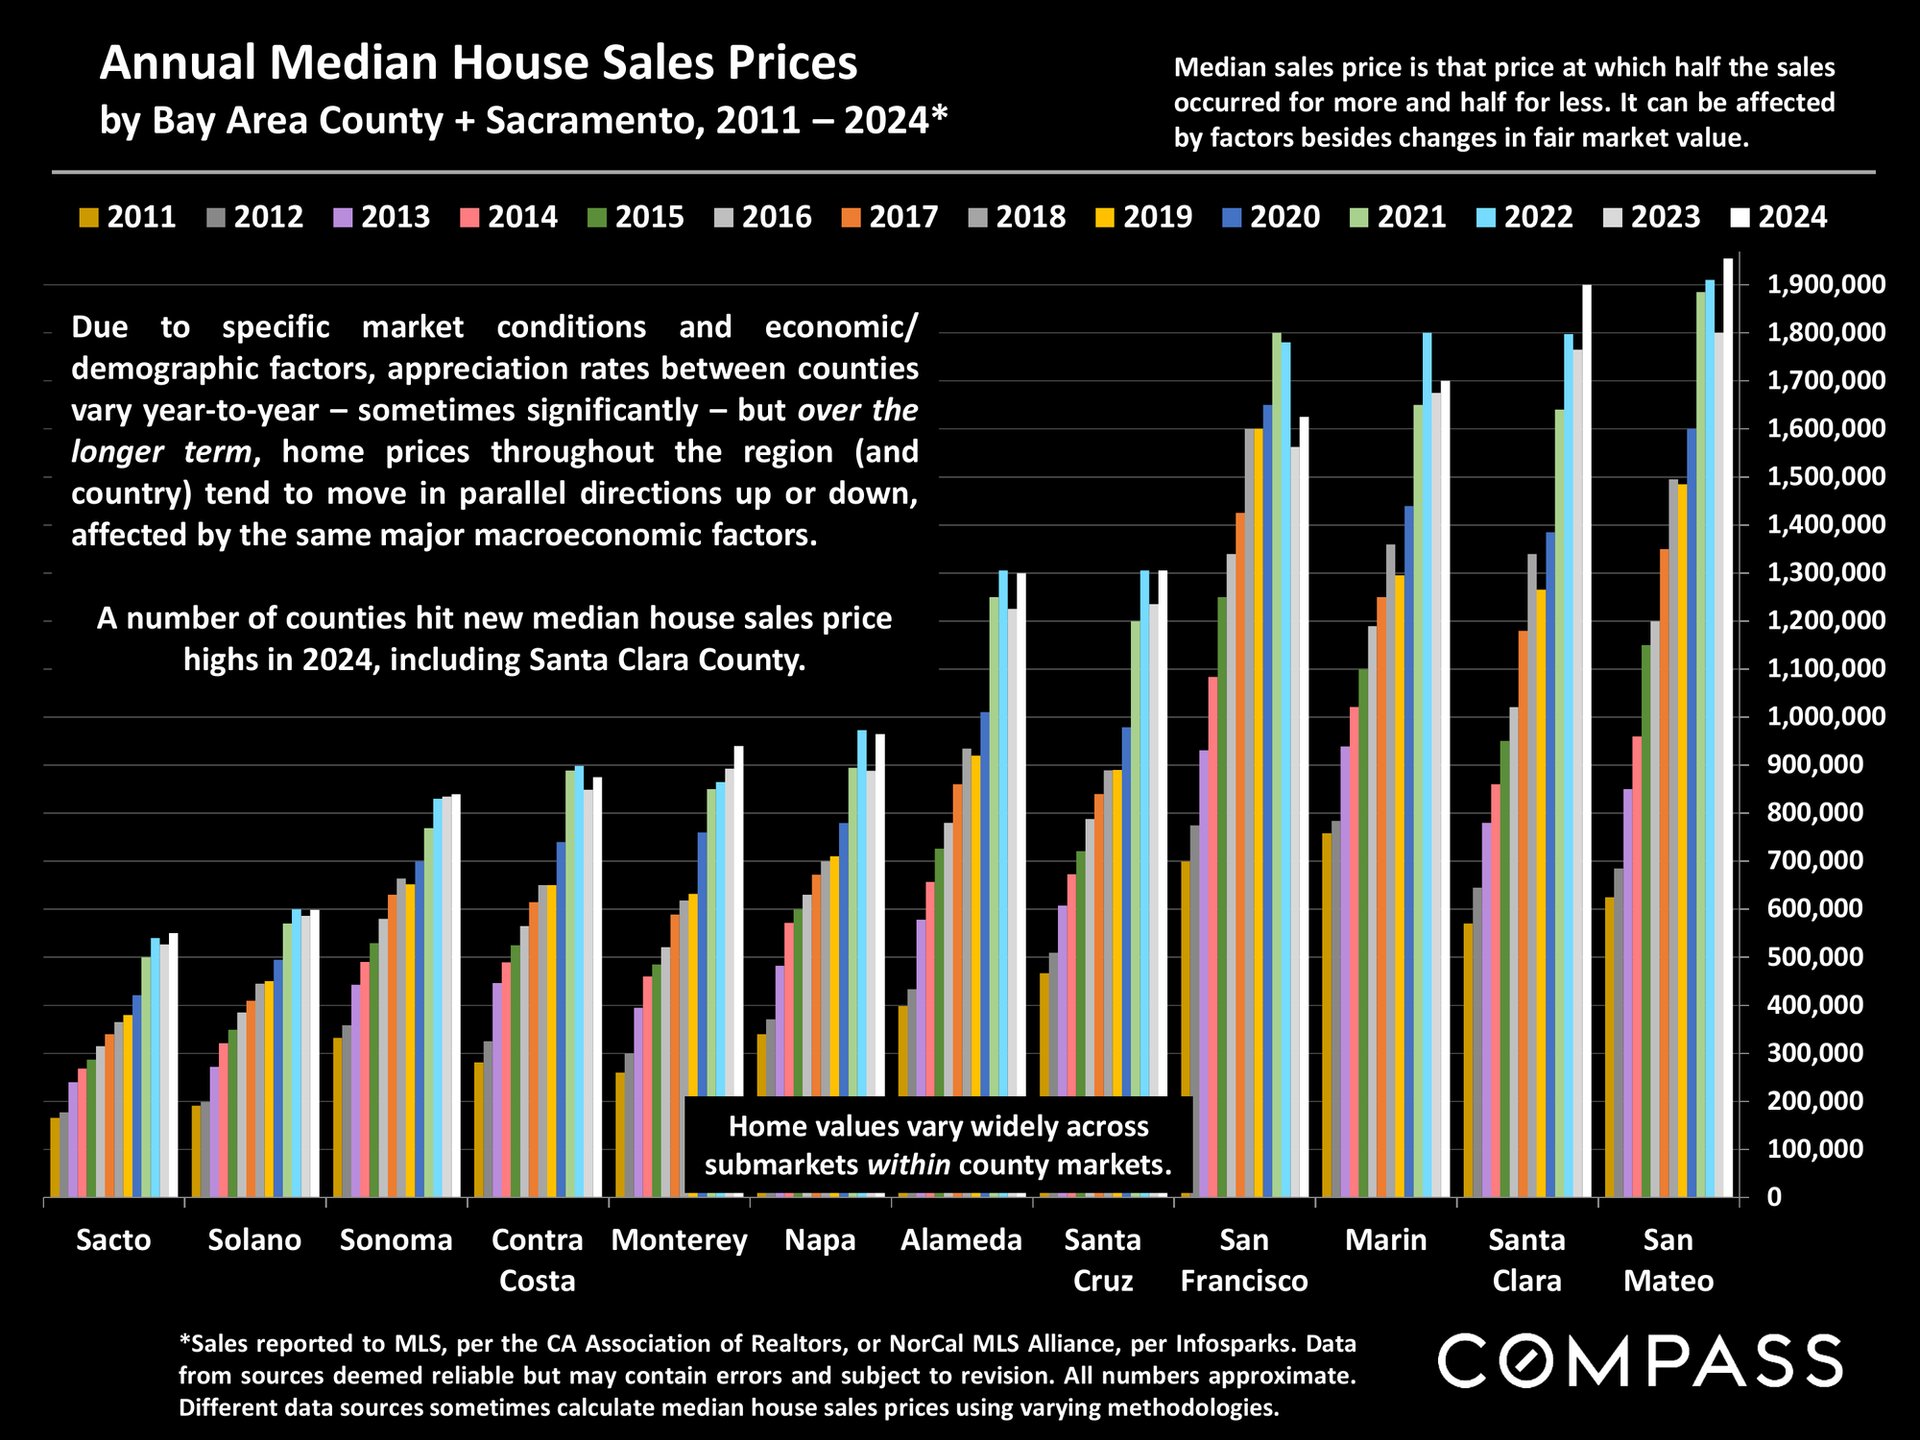
Santa Clara County Real Estate February 2025 Report, featuring a lake and green hills.Real estate report summarizing the 2025 market outlook, Bay Area listing rebound, and a Freddie Mac economic forecast.Chart of jumbo mortgage rates from 2018 to 2025, falling below 3% in 2021 before rising above 8% in 2023.Chart of Santa Clara County house prices since 1990, with green bars showing monthly median prices through January 2025.Bar chart of 2011–2024 median home prices across Bay Area counties; Santa Clara County reached a new high in 2024.
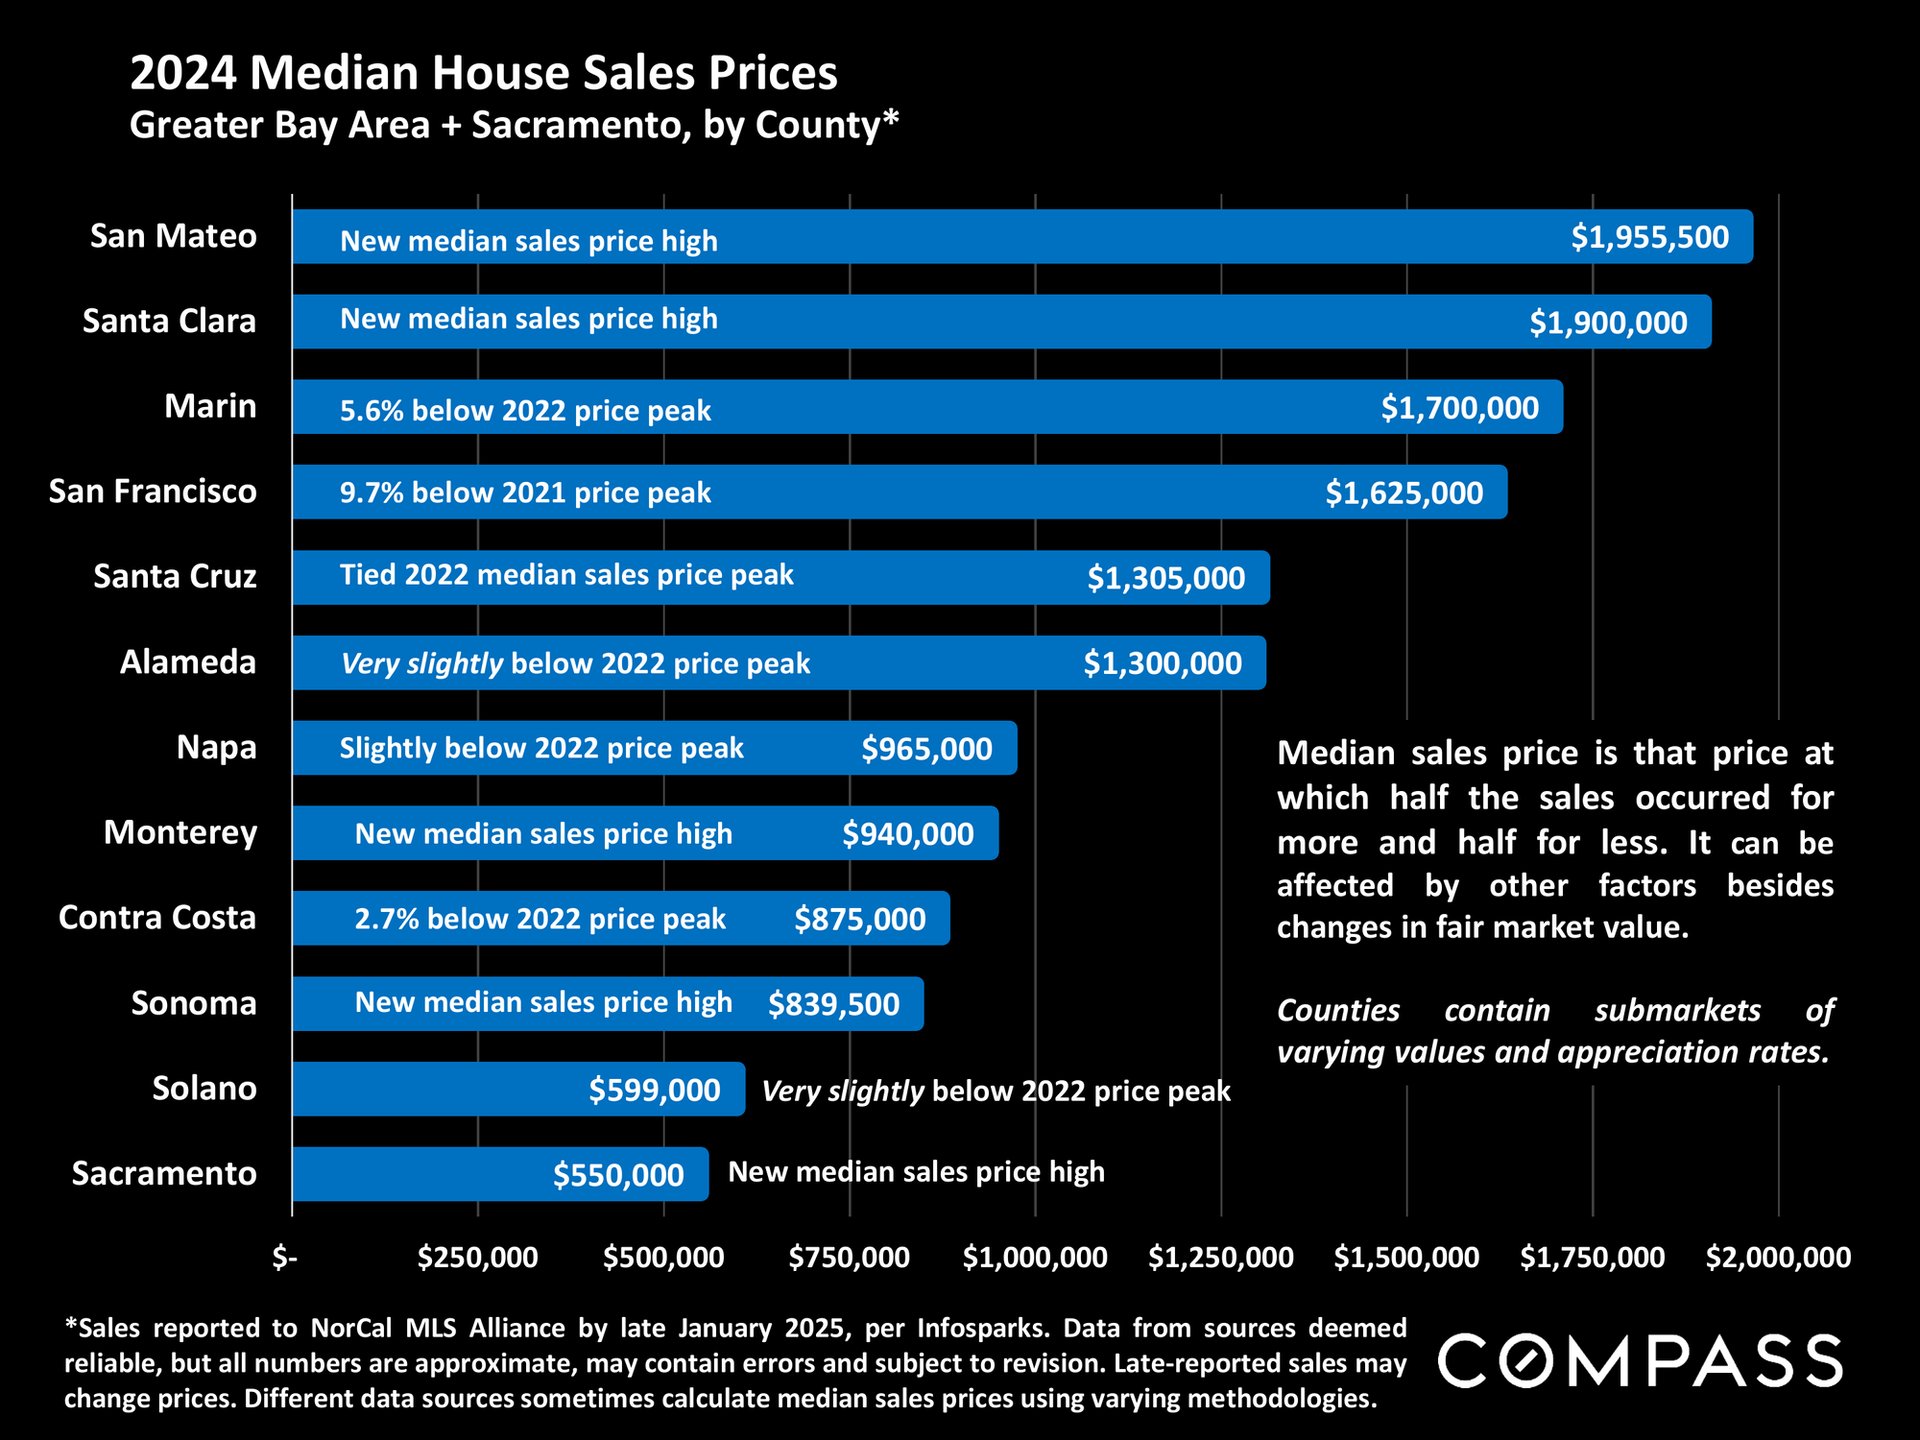
Chart of 2024 median home sale prices by county, led by San Mateo at $1,955,500 and Santa Clara at $1,900,000.
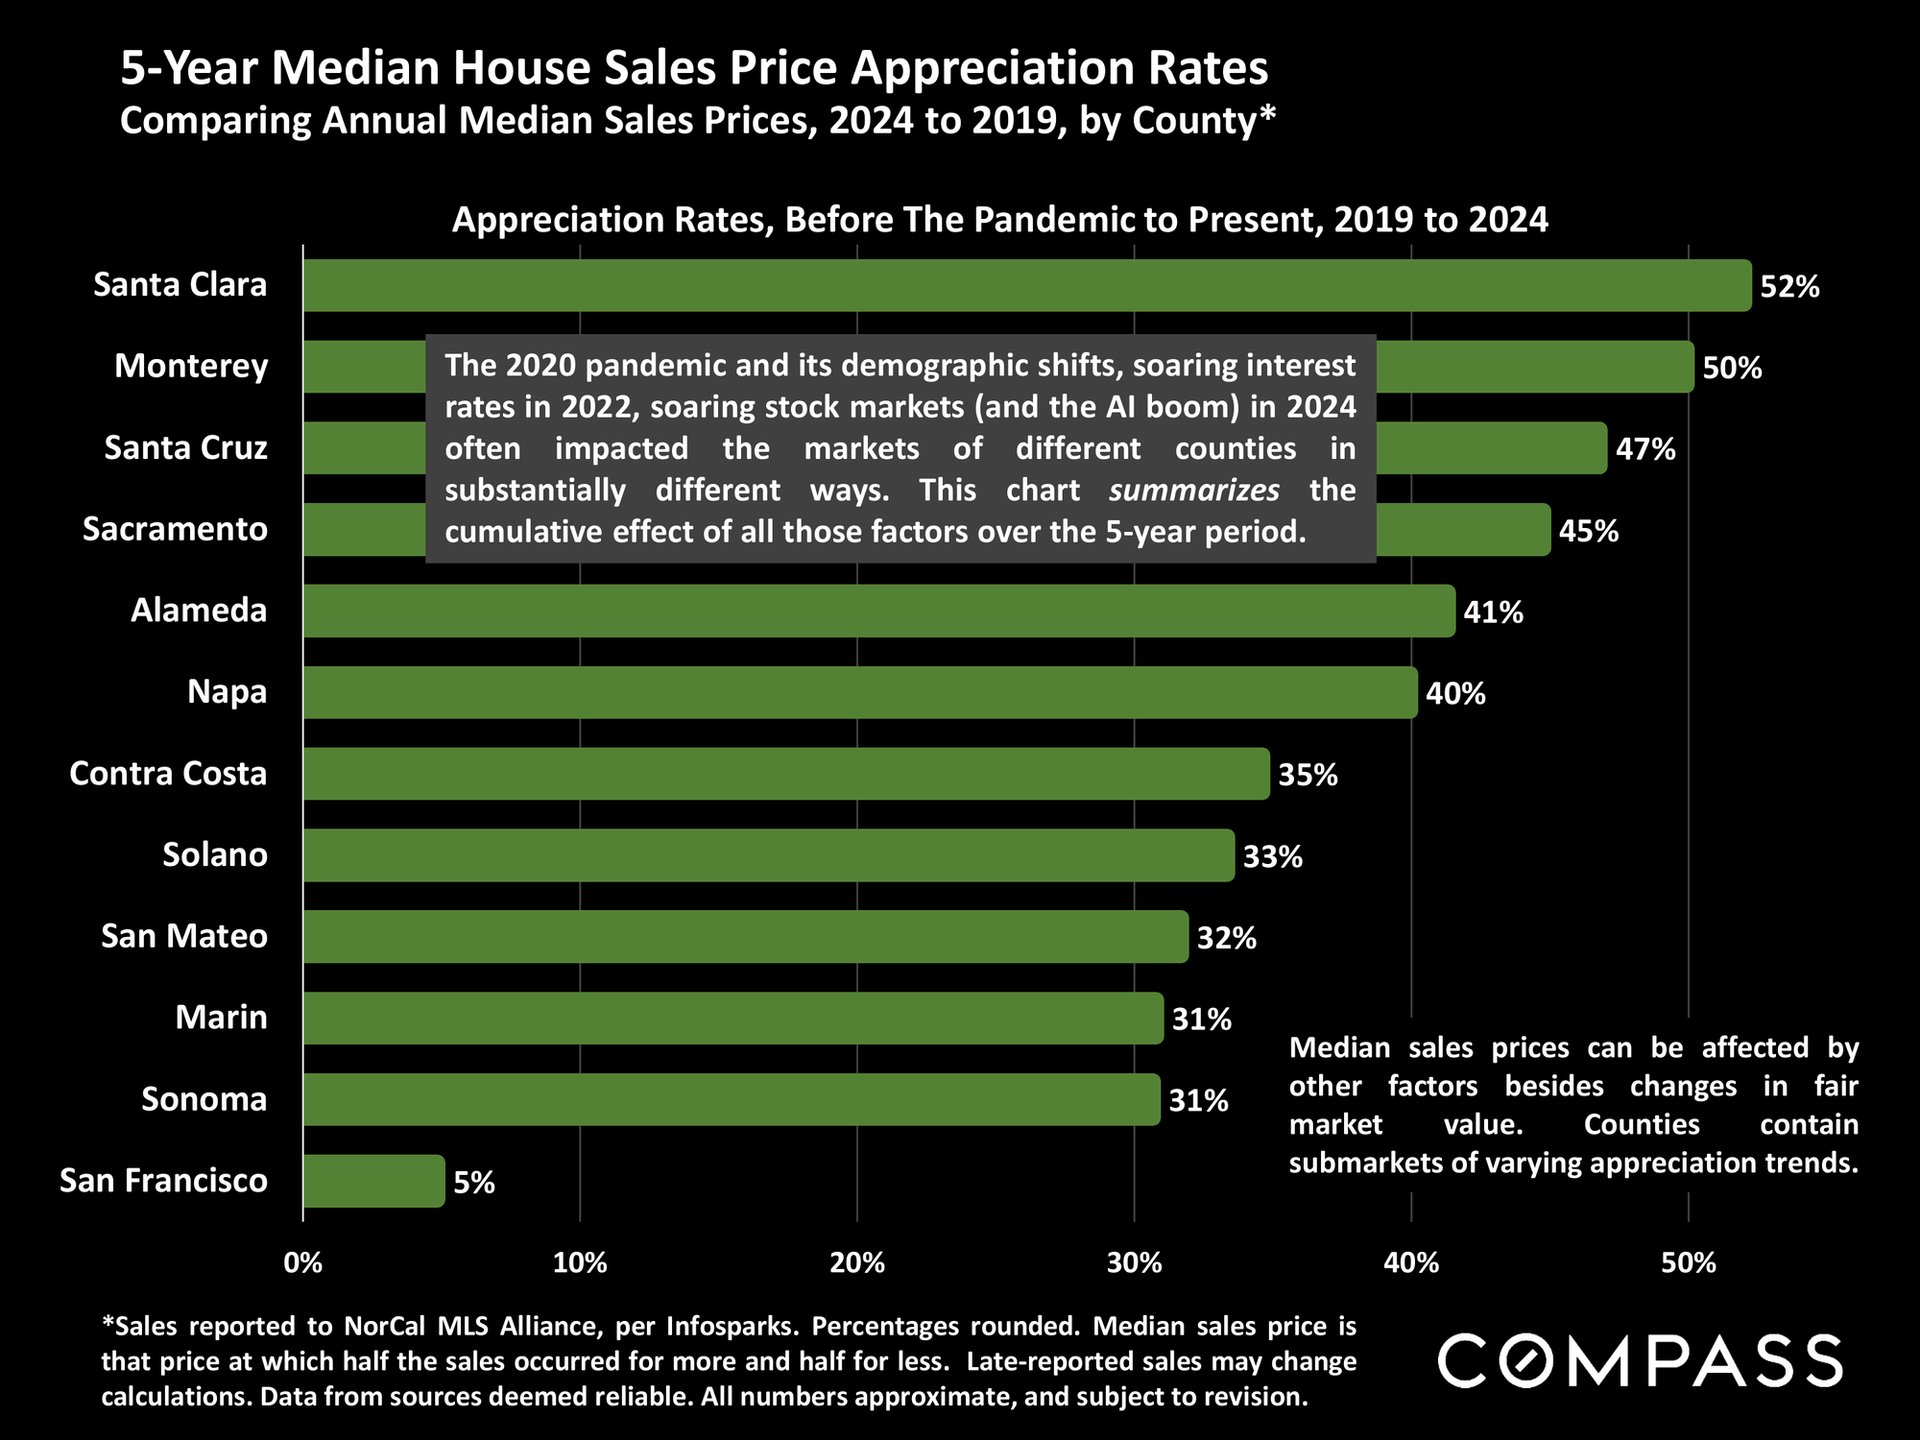
Chart of 2019–2024 home price appreciation by Northern California county, led by Santa Clara at 52%.
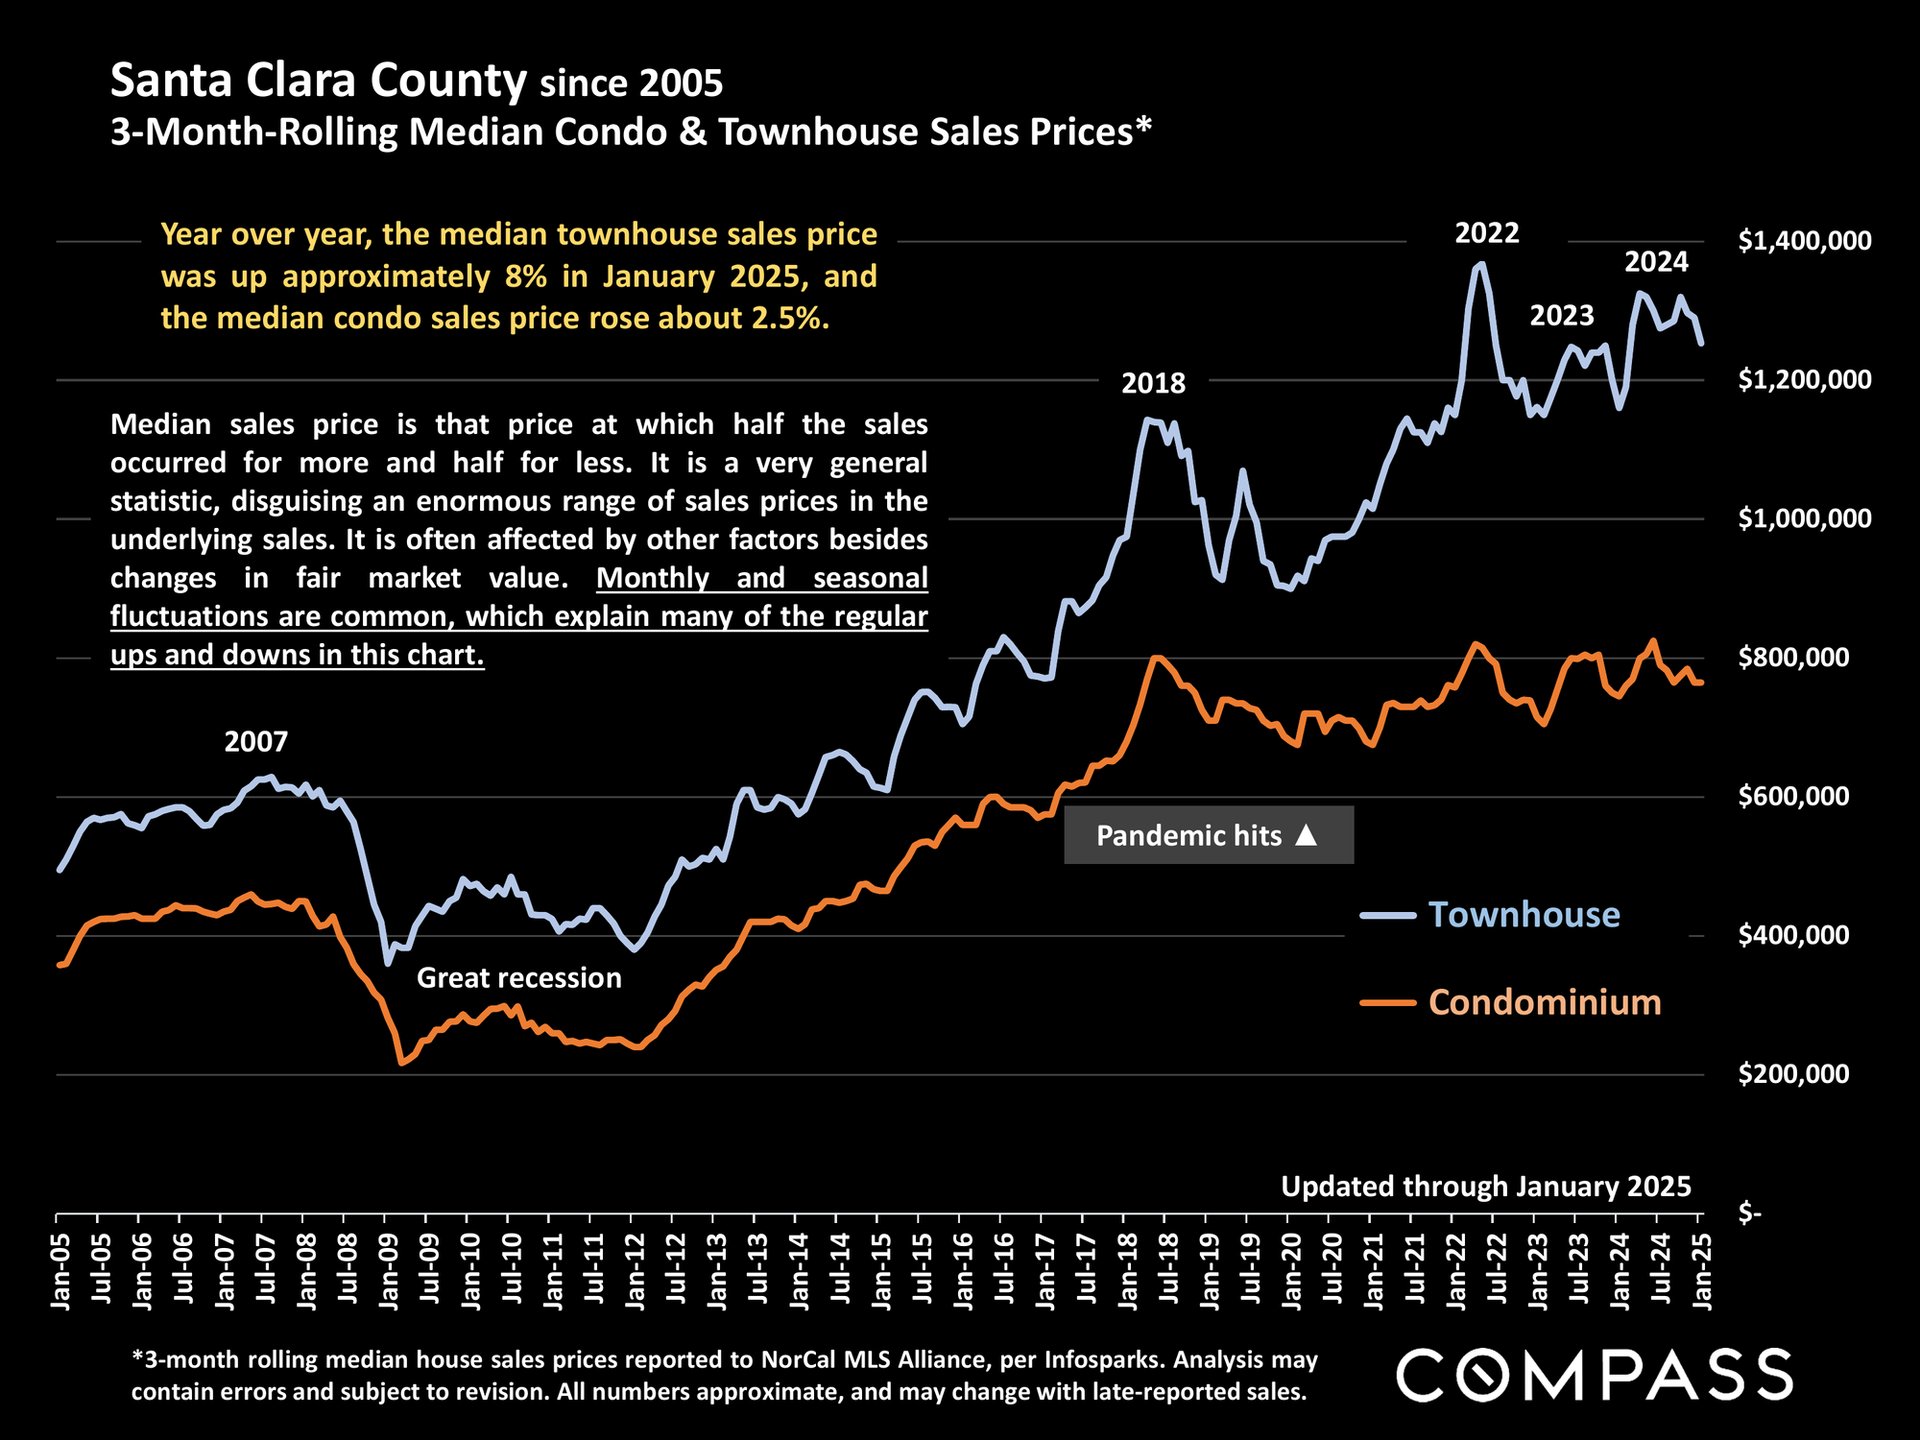
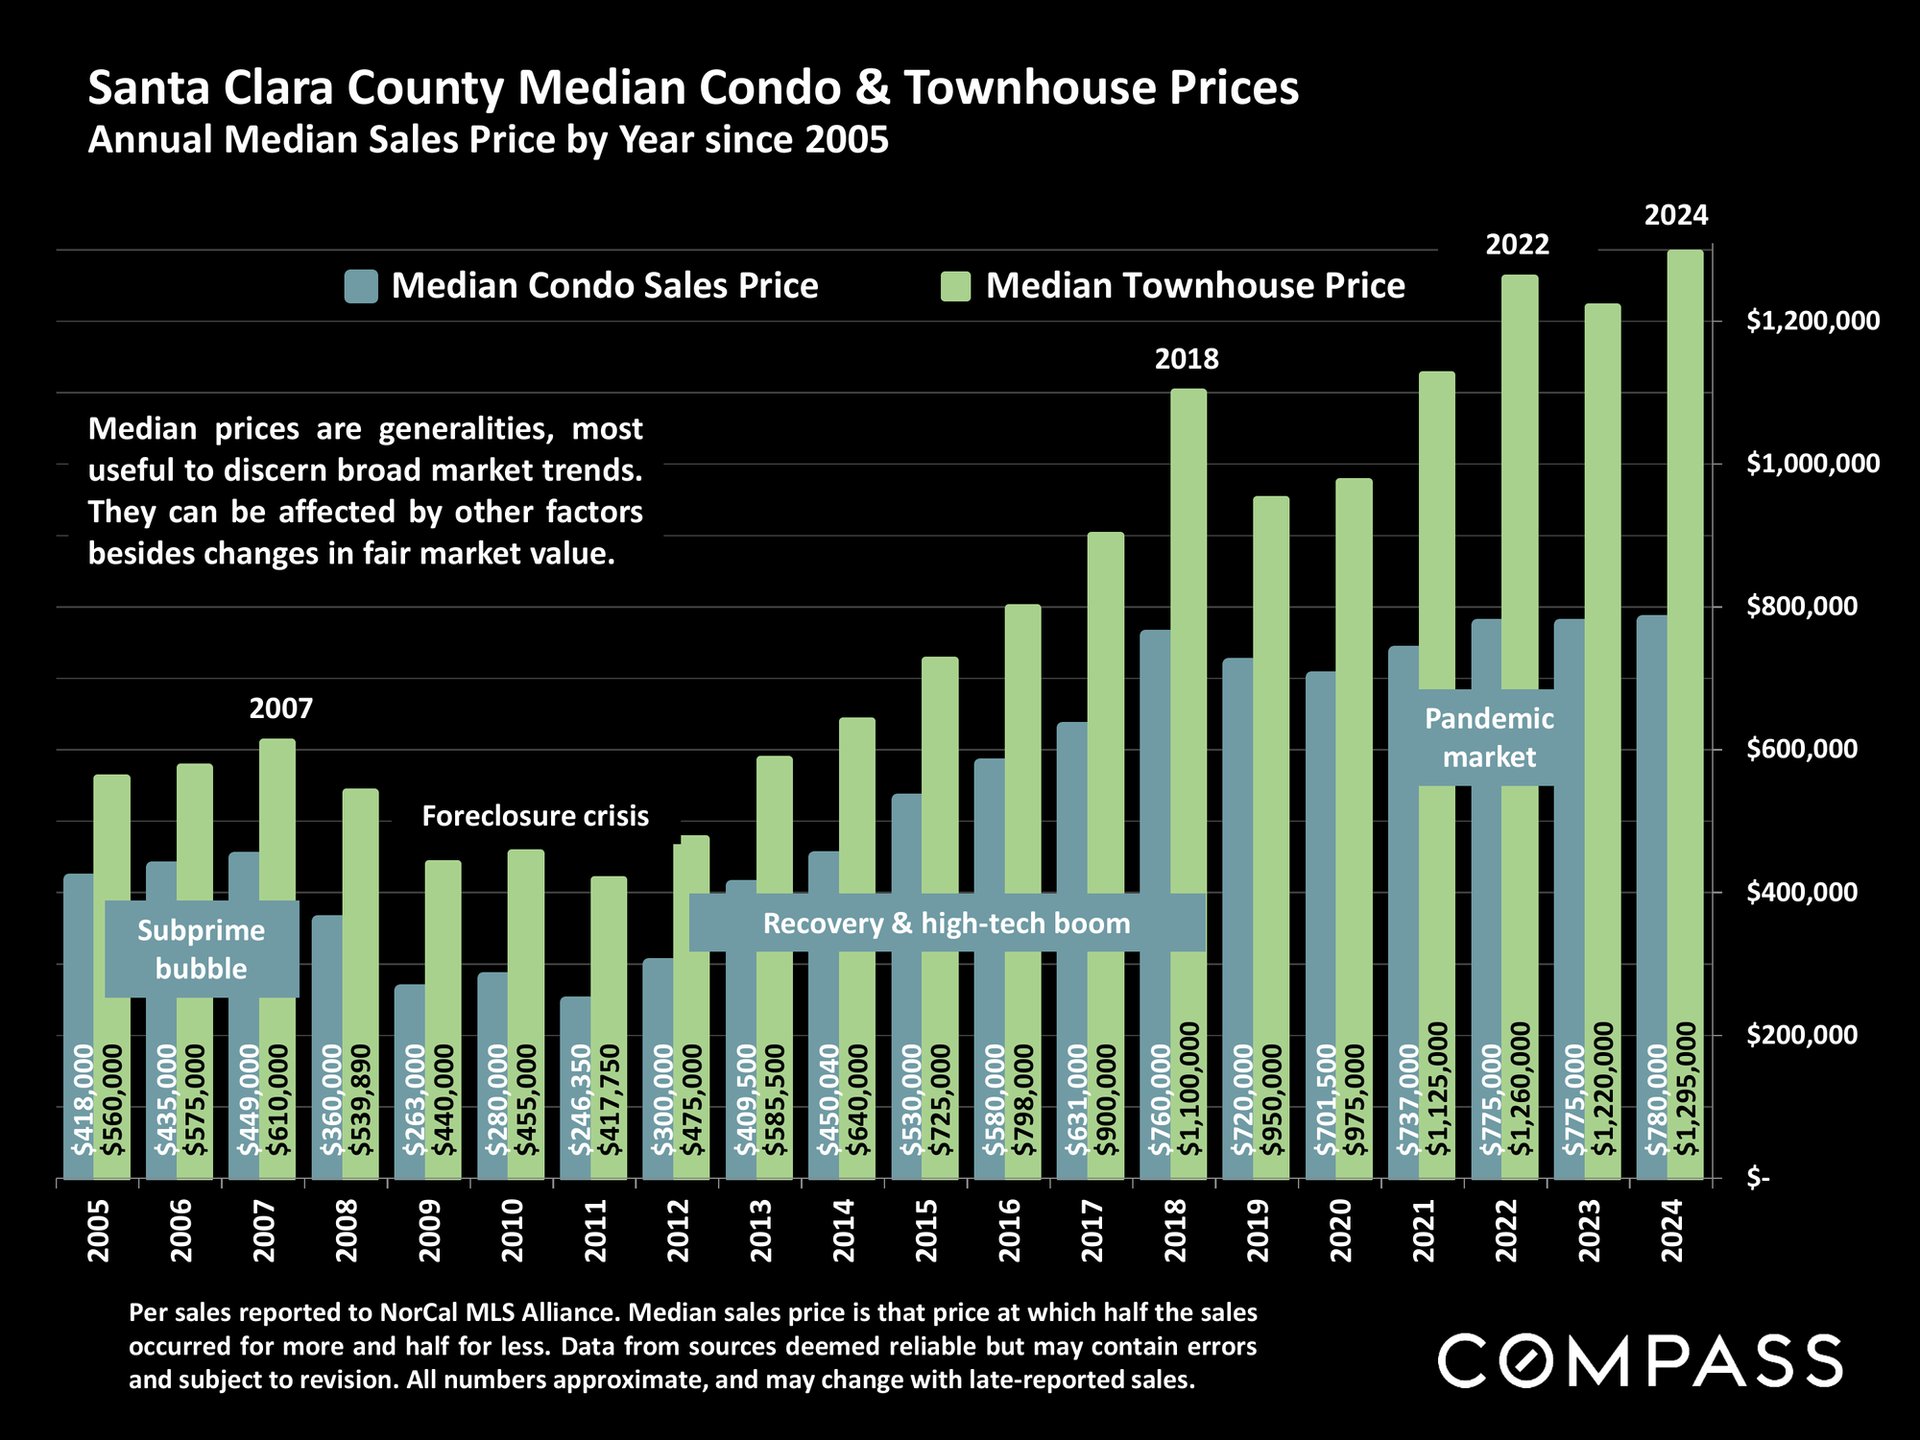
Chart comparing Santa Clara County townhouse and condominium median sale prices from 2005 through January 2025.
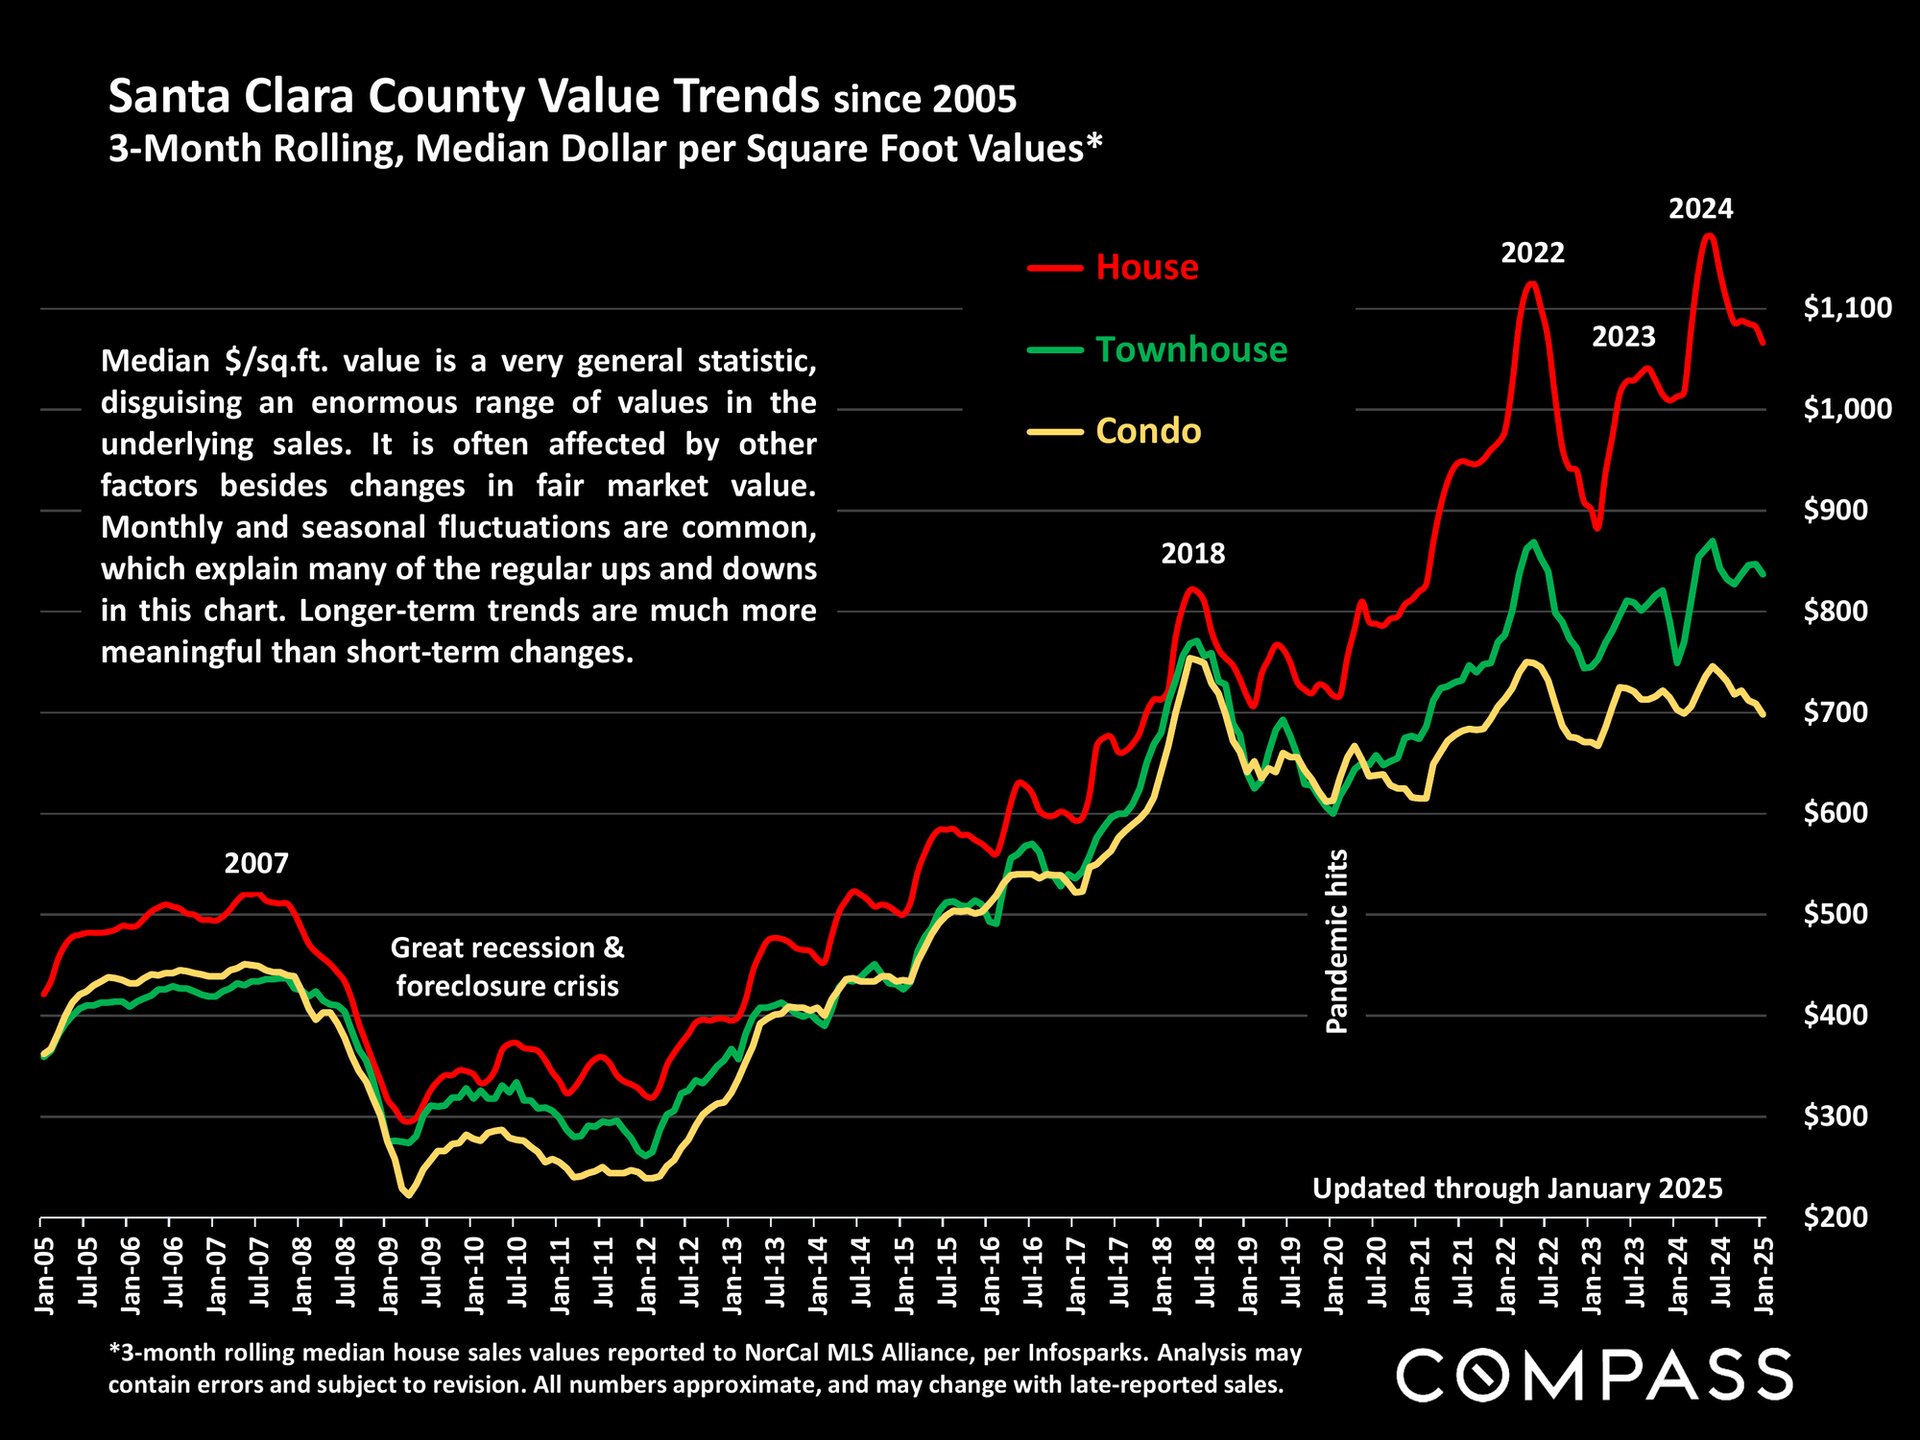
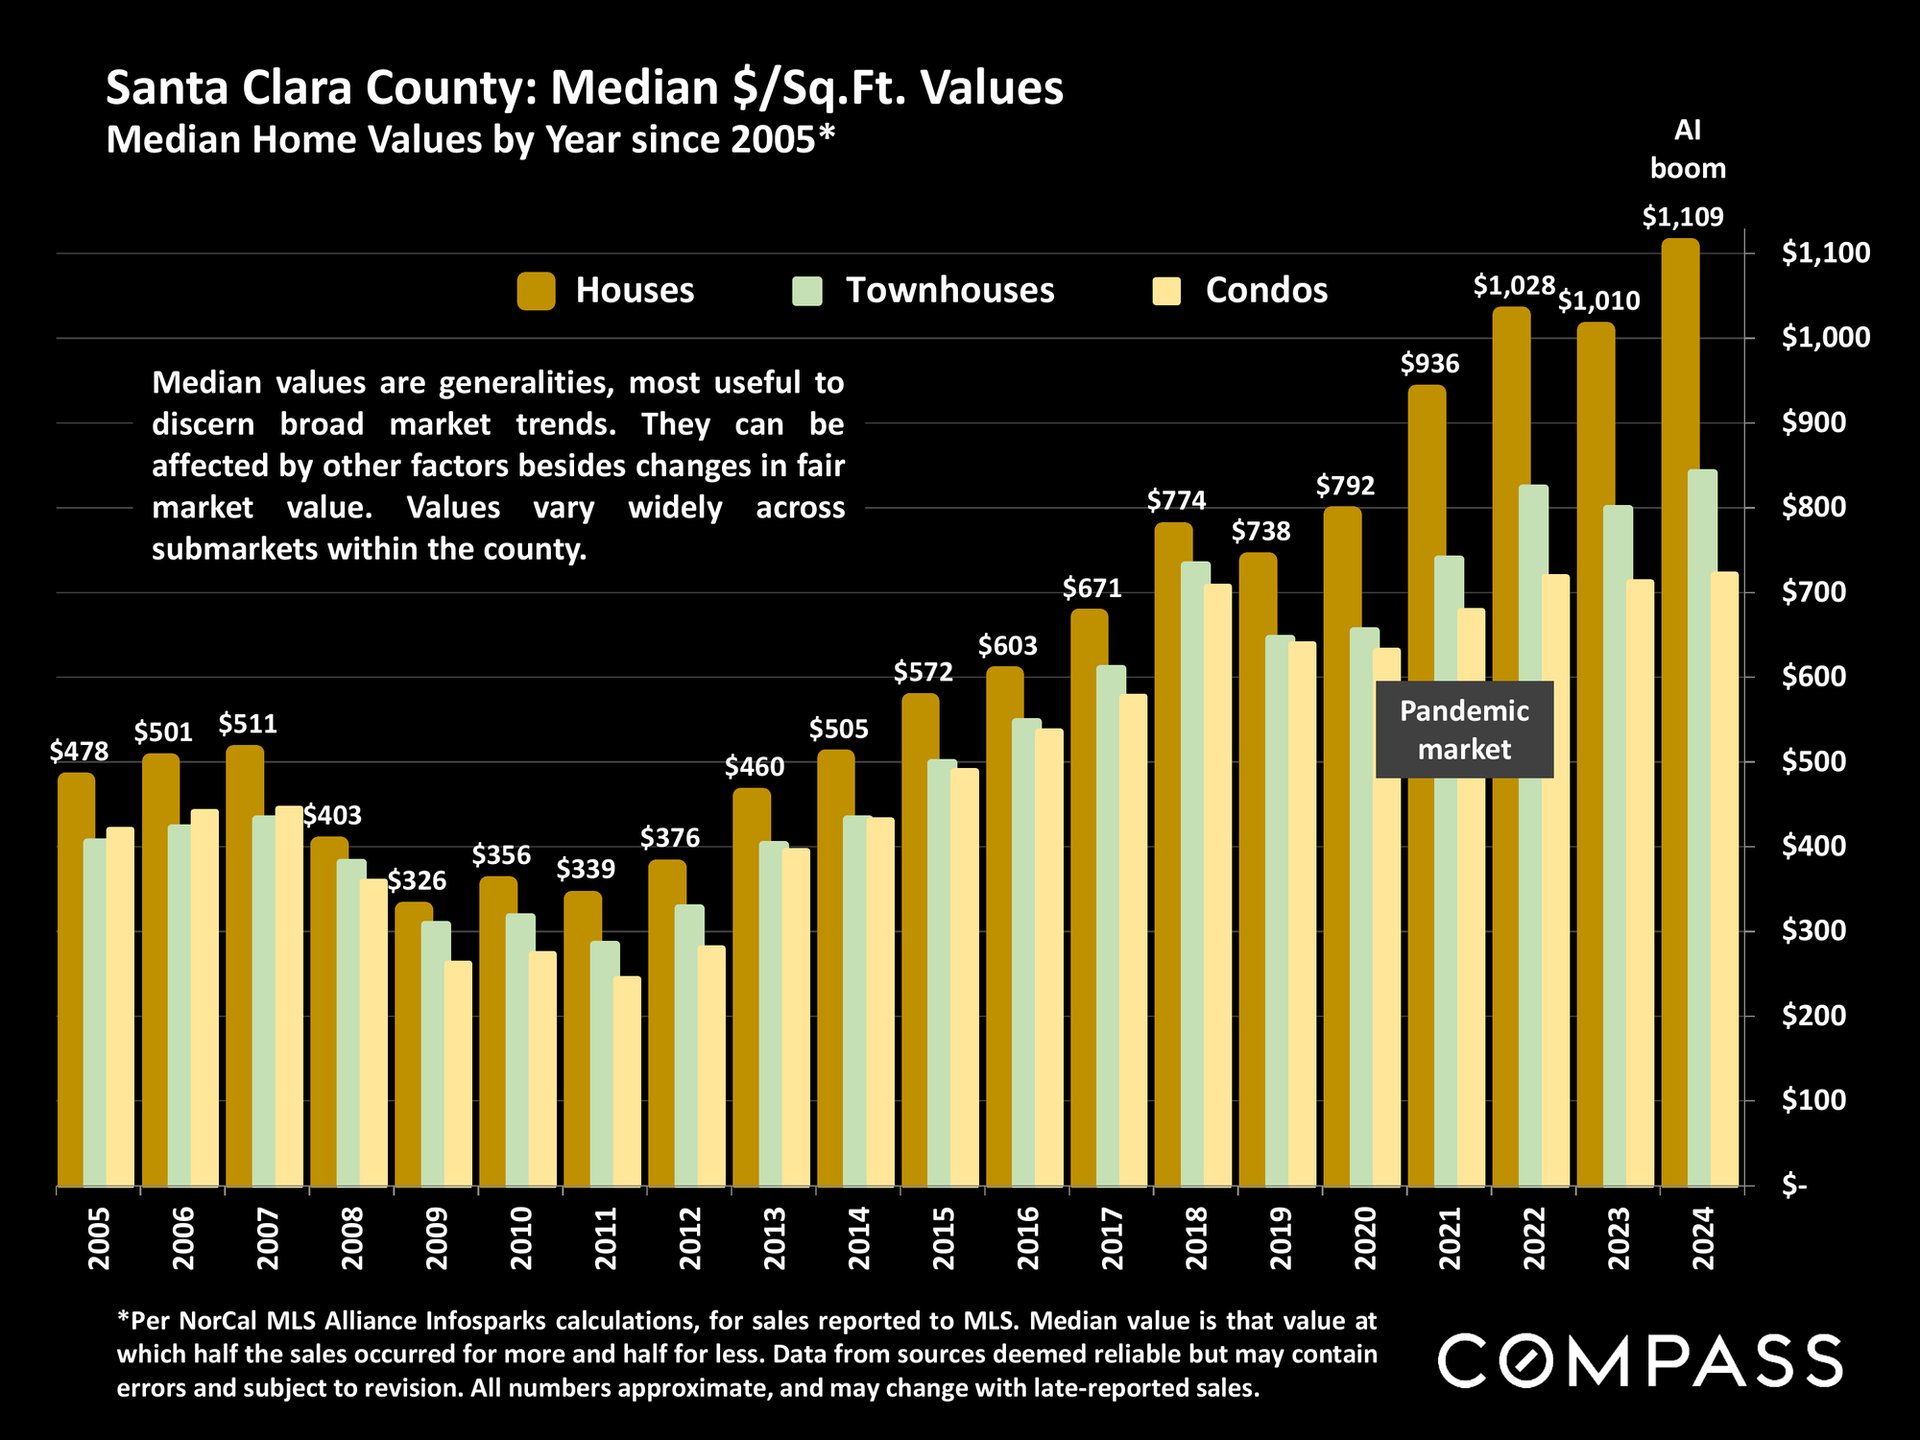
Santa Clara County home-value trends chart, with house, townhouse, and condo values from 2005 to January 2025.
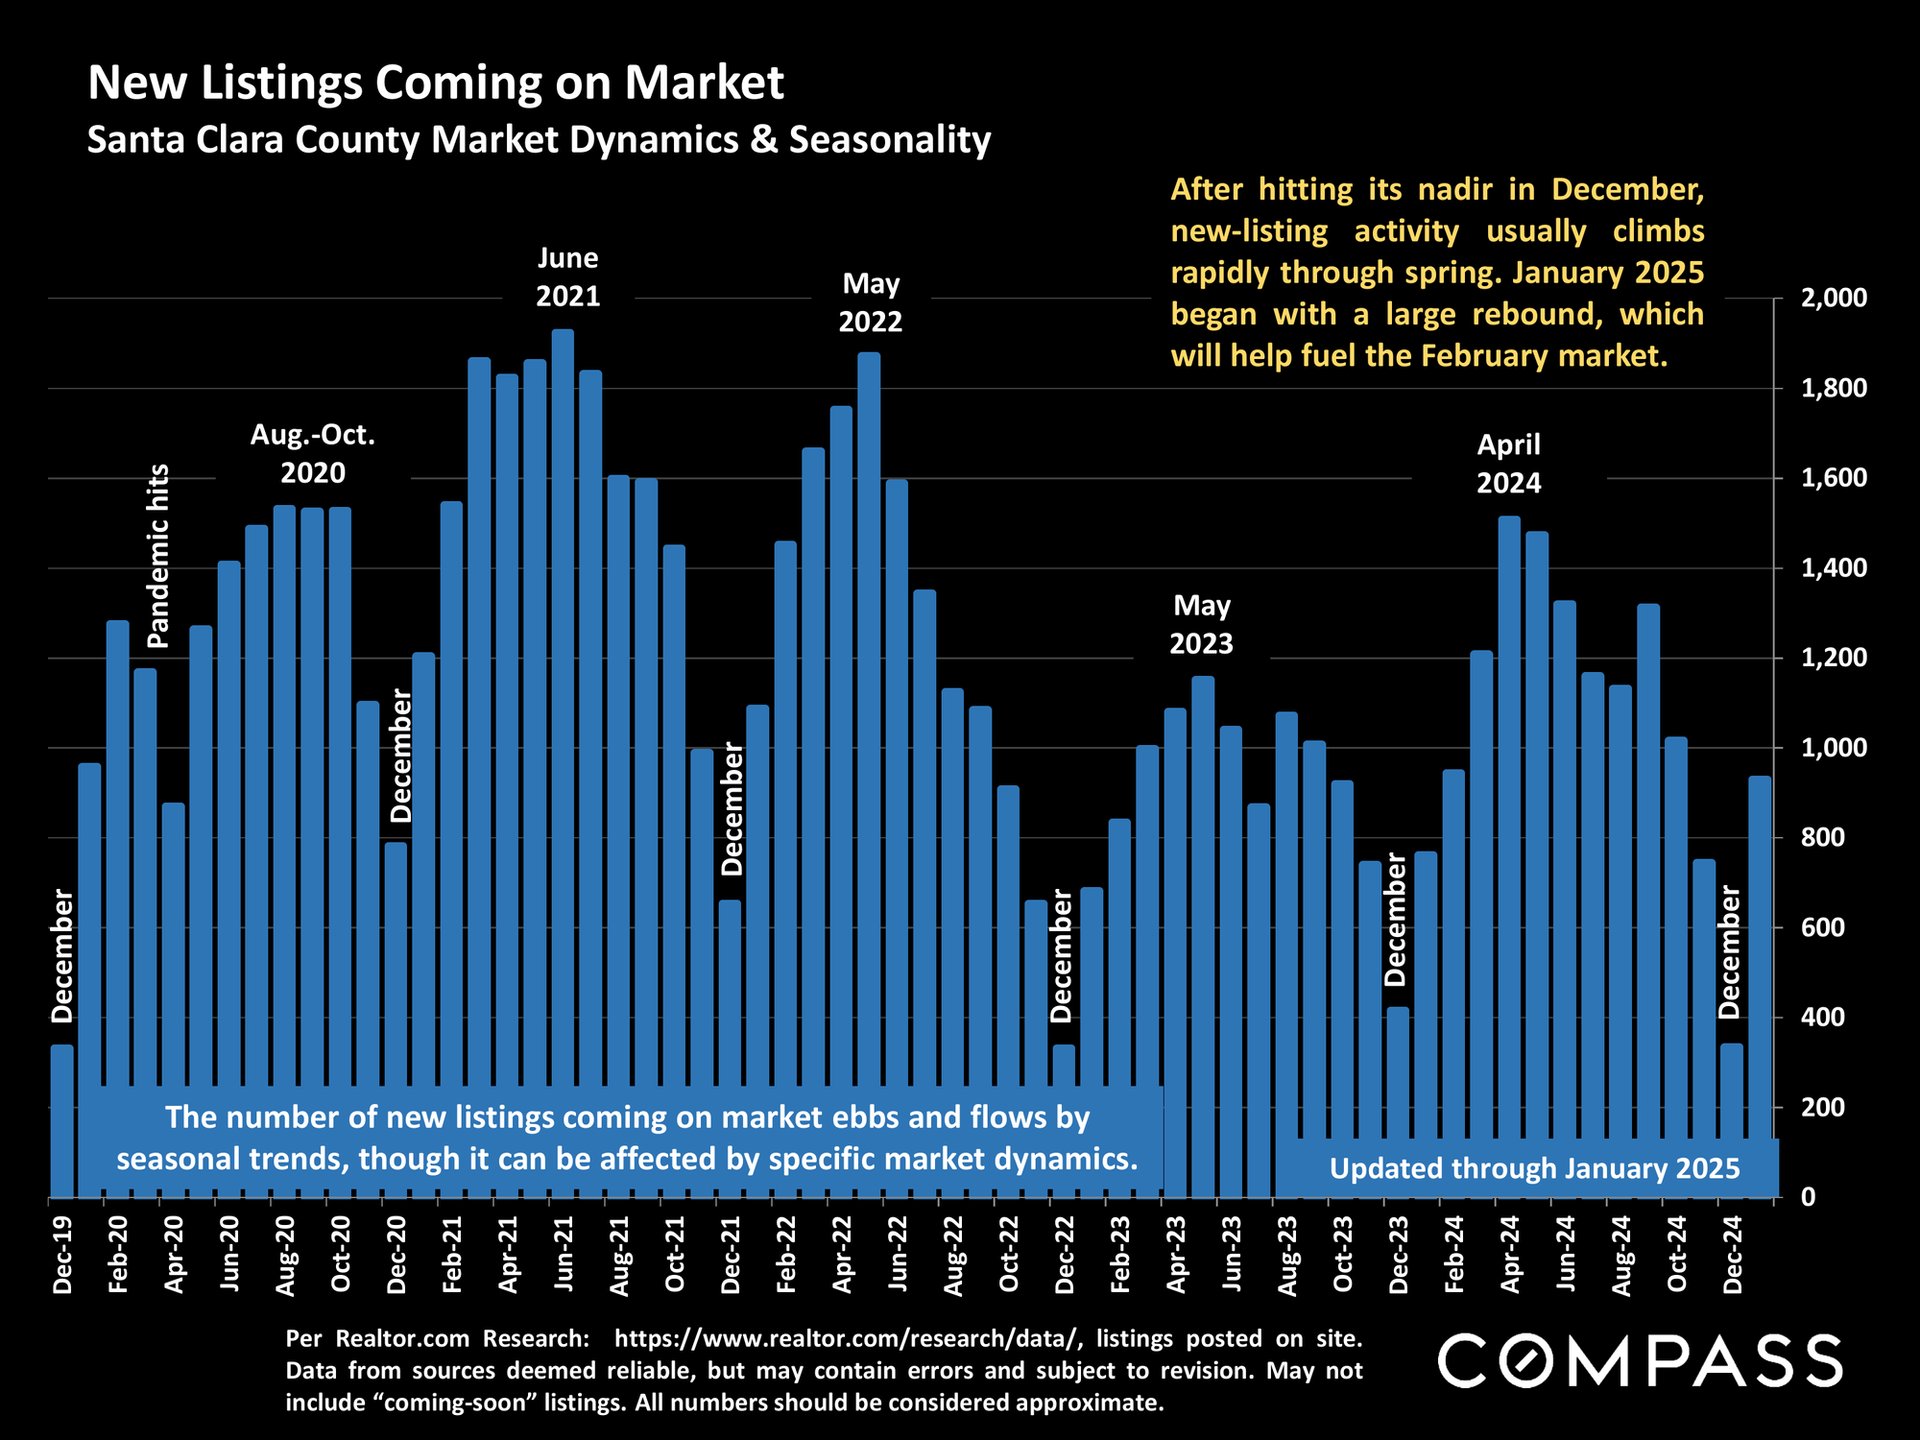
Santa Clara County new-listings chart showing monthly seasonal patterns from December 2019 through December 2024.
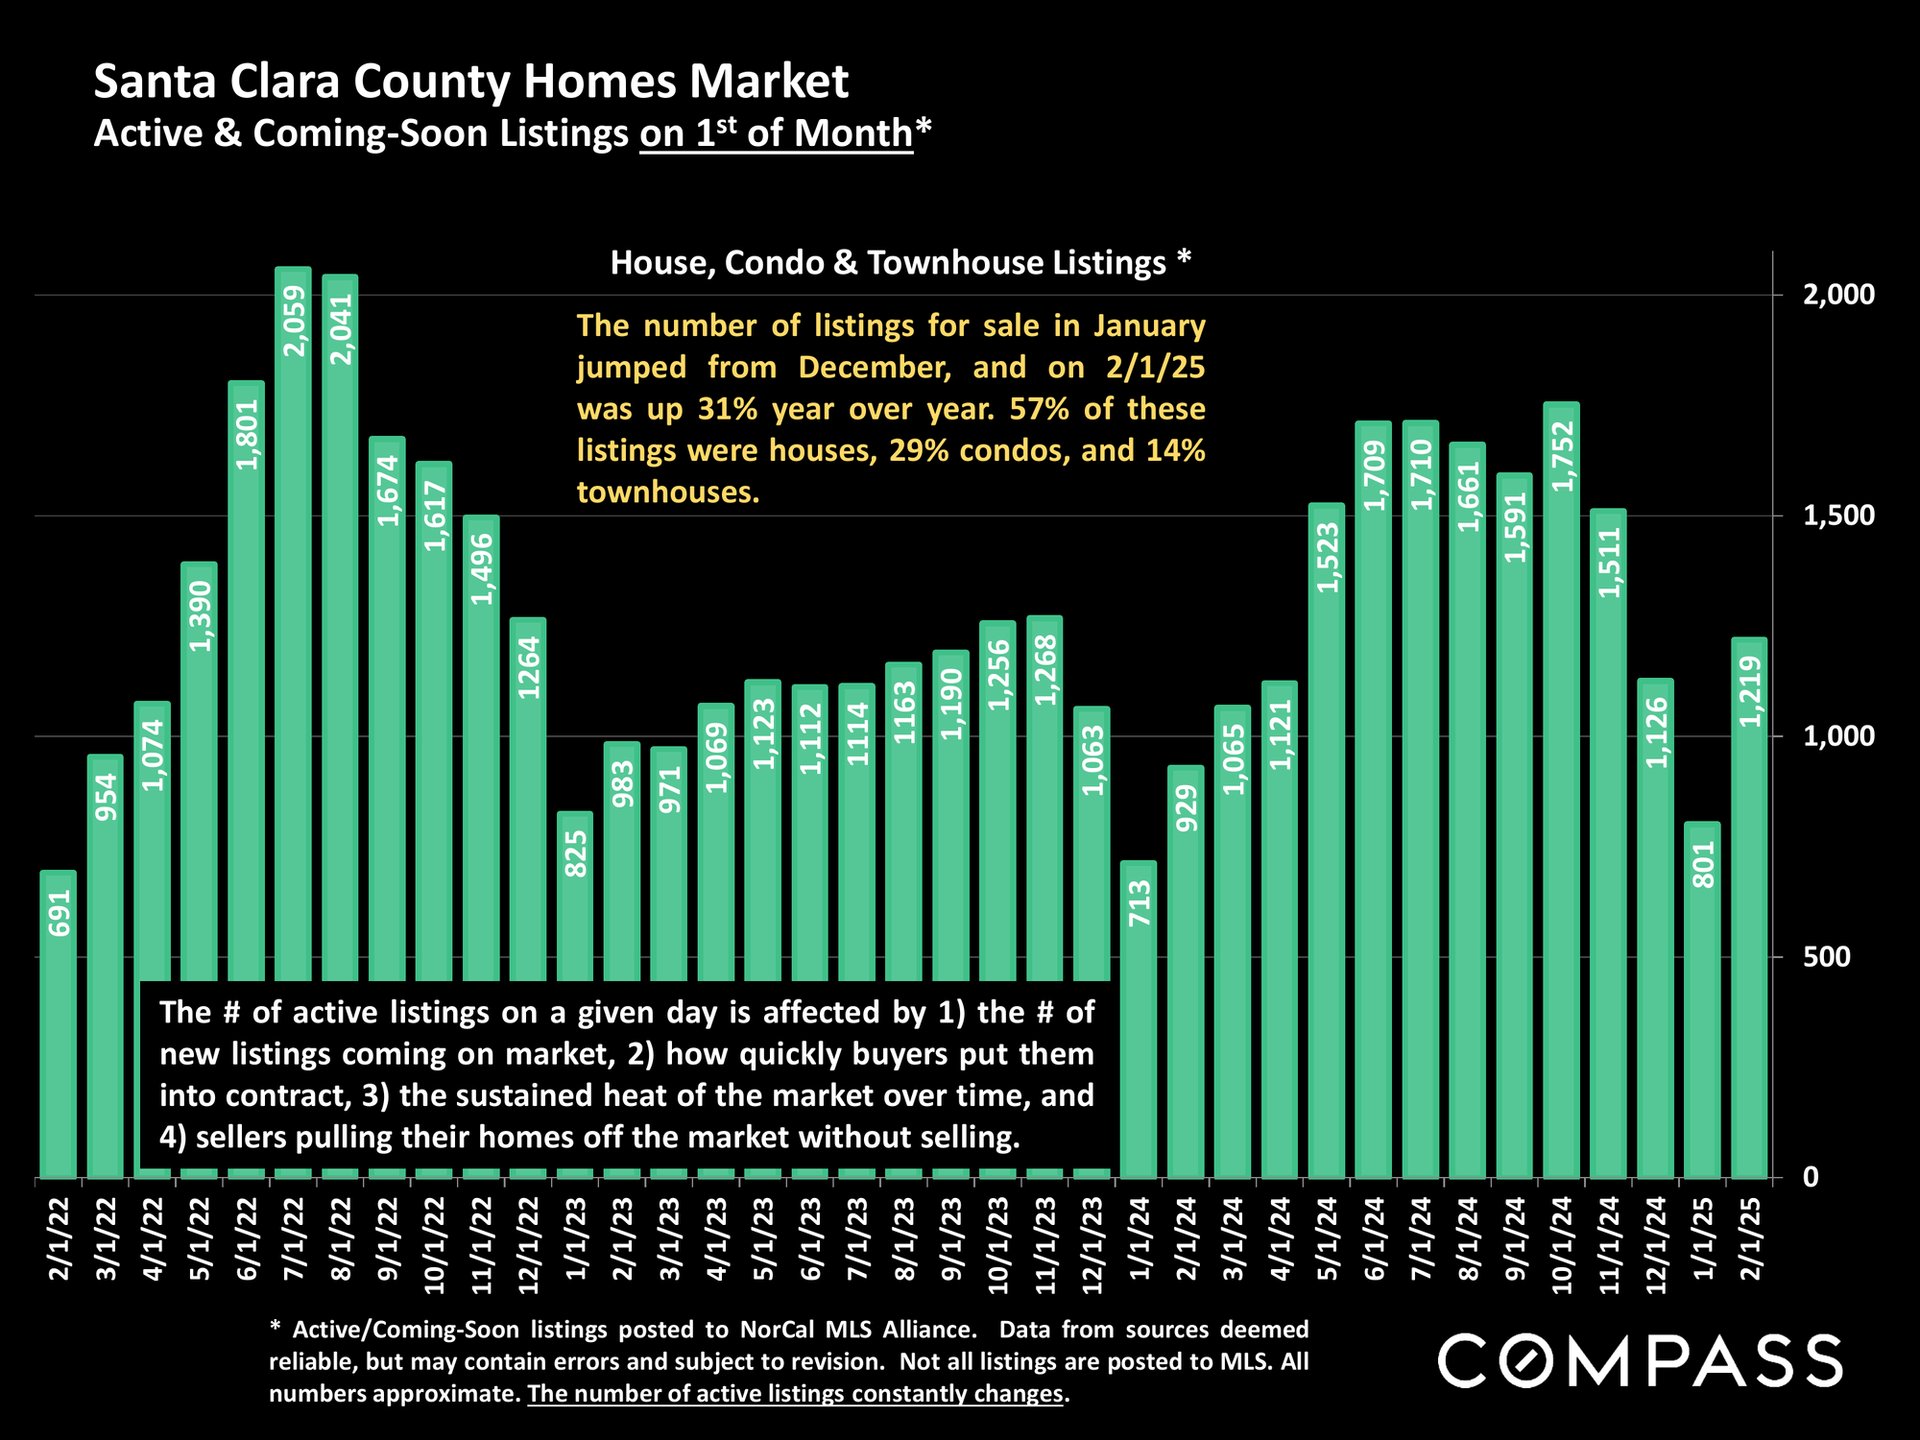
Chart of Santa Clara County active and coming-soon listings, with monthly totals from February 2022 to February 2025.
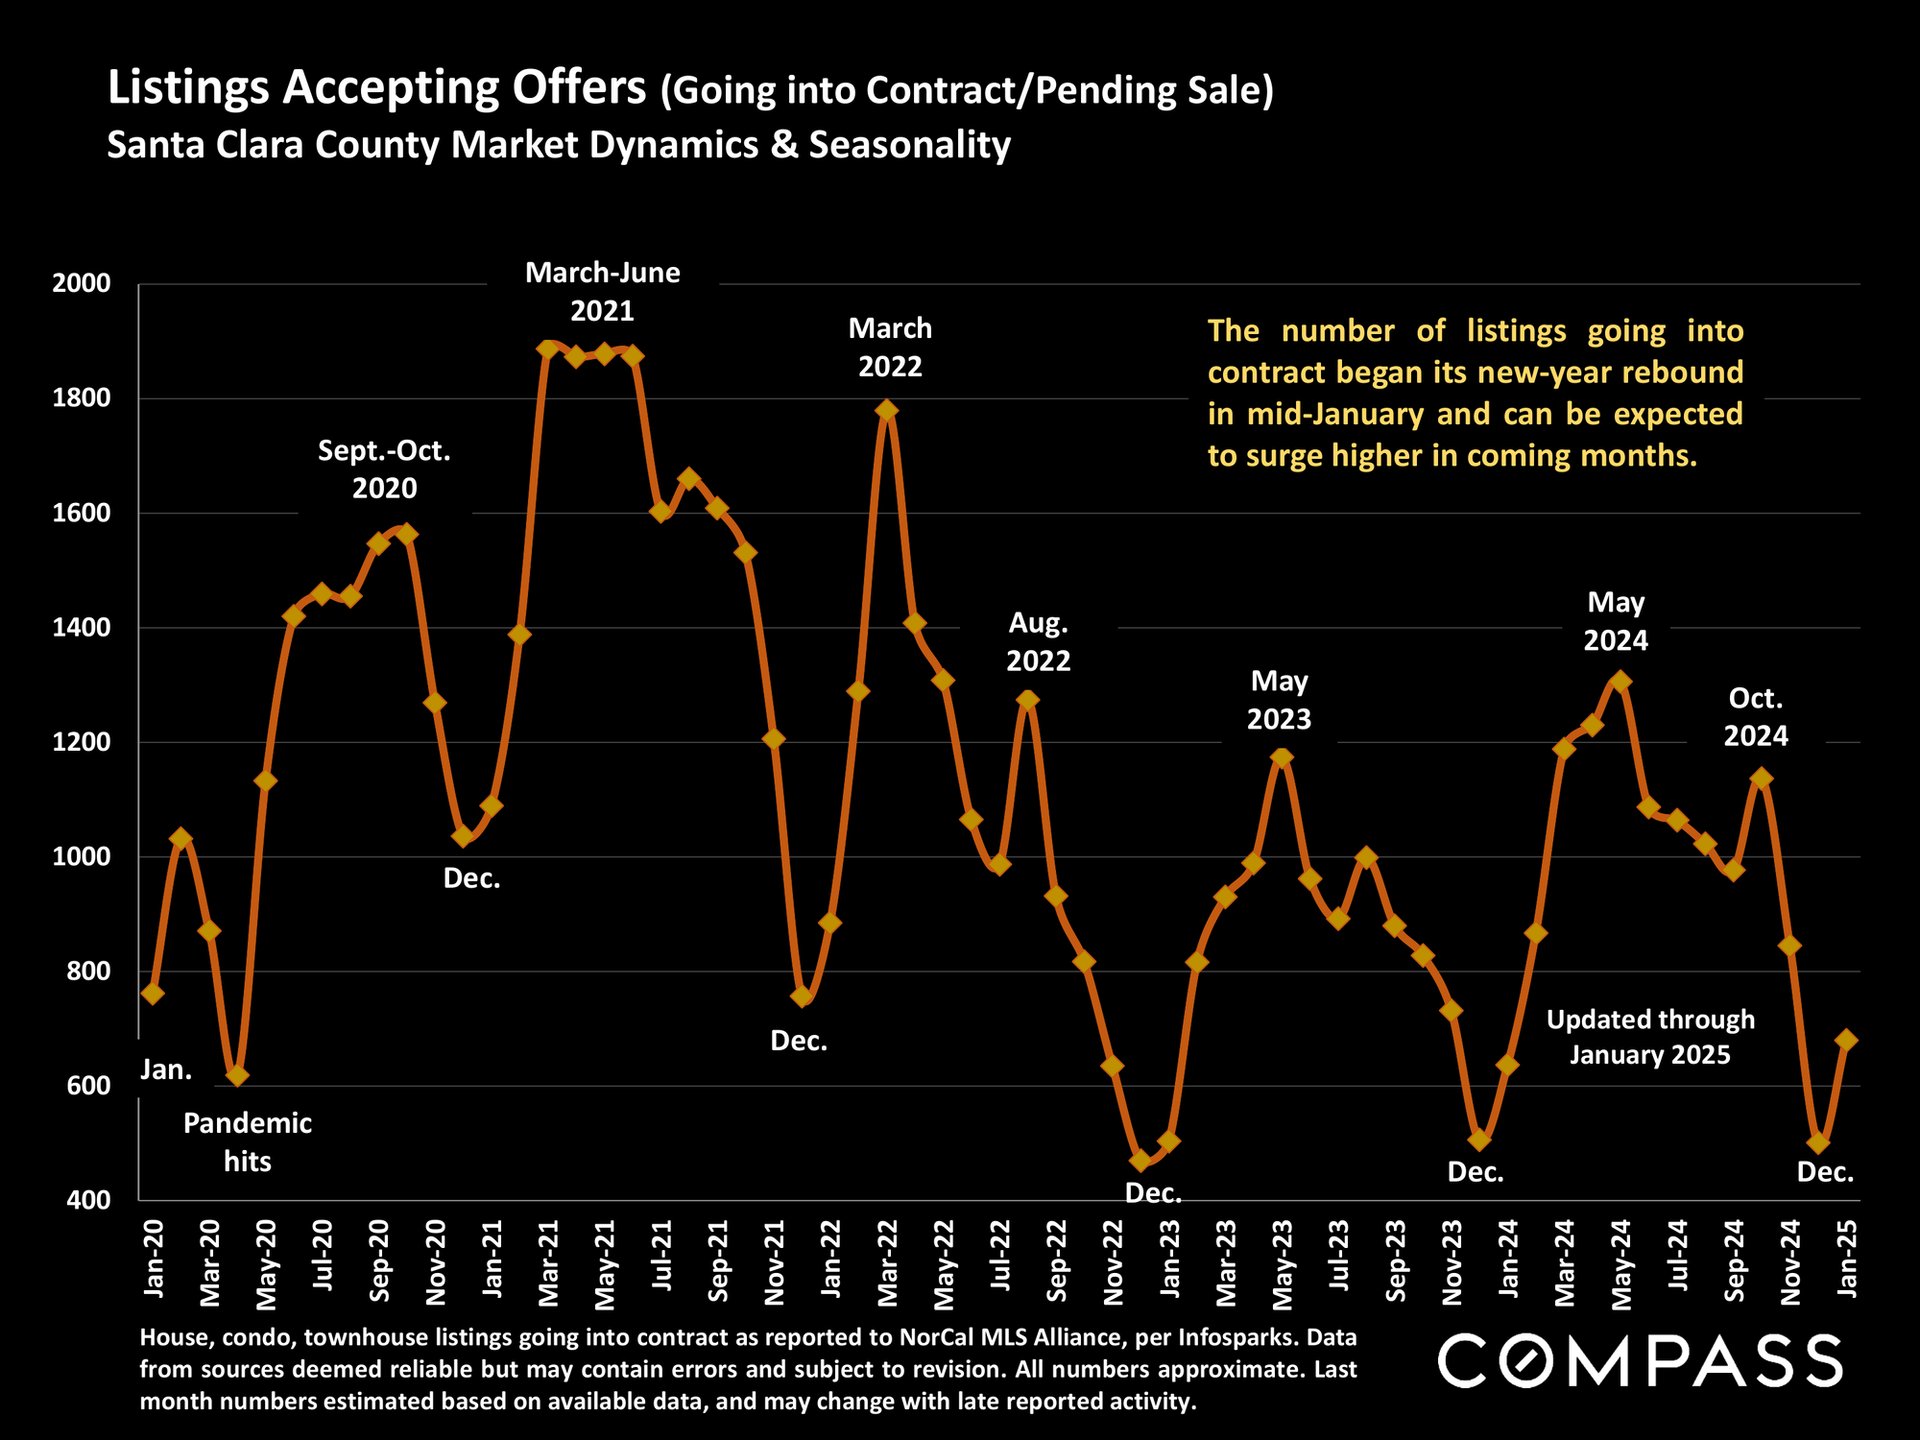
Santa Clara County listings going into contract, charted monthly from 2020 to January 2025.
Santa Clara County monthly absorption-rate bar chart, January 2019–January 2025, with market milestones and percentage scale.
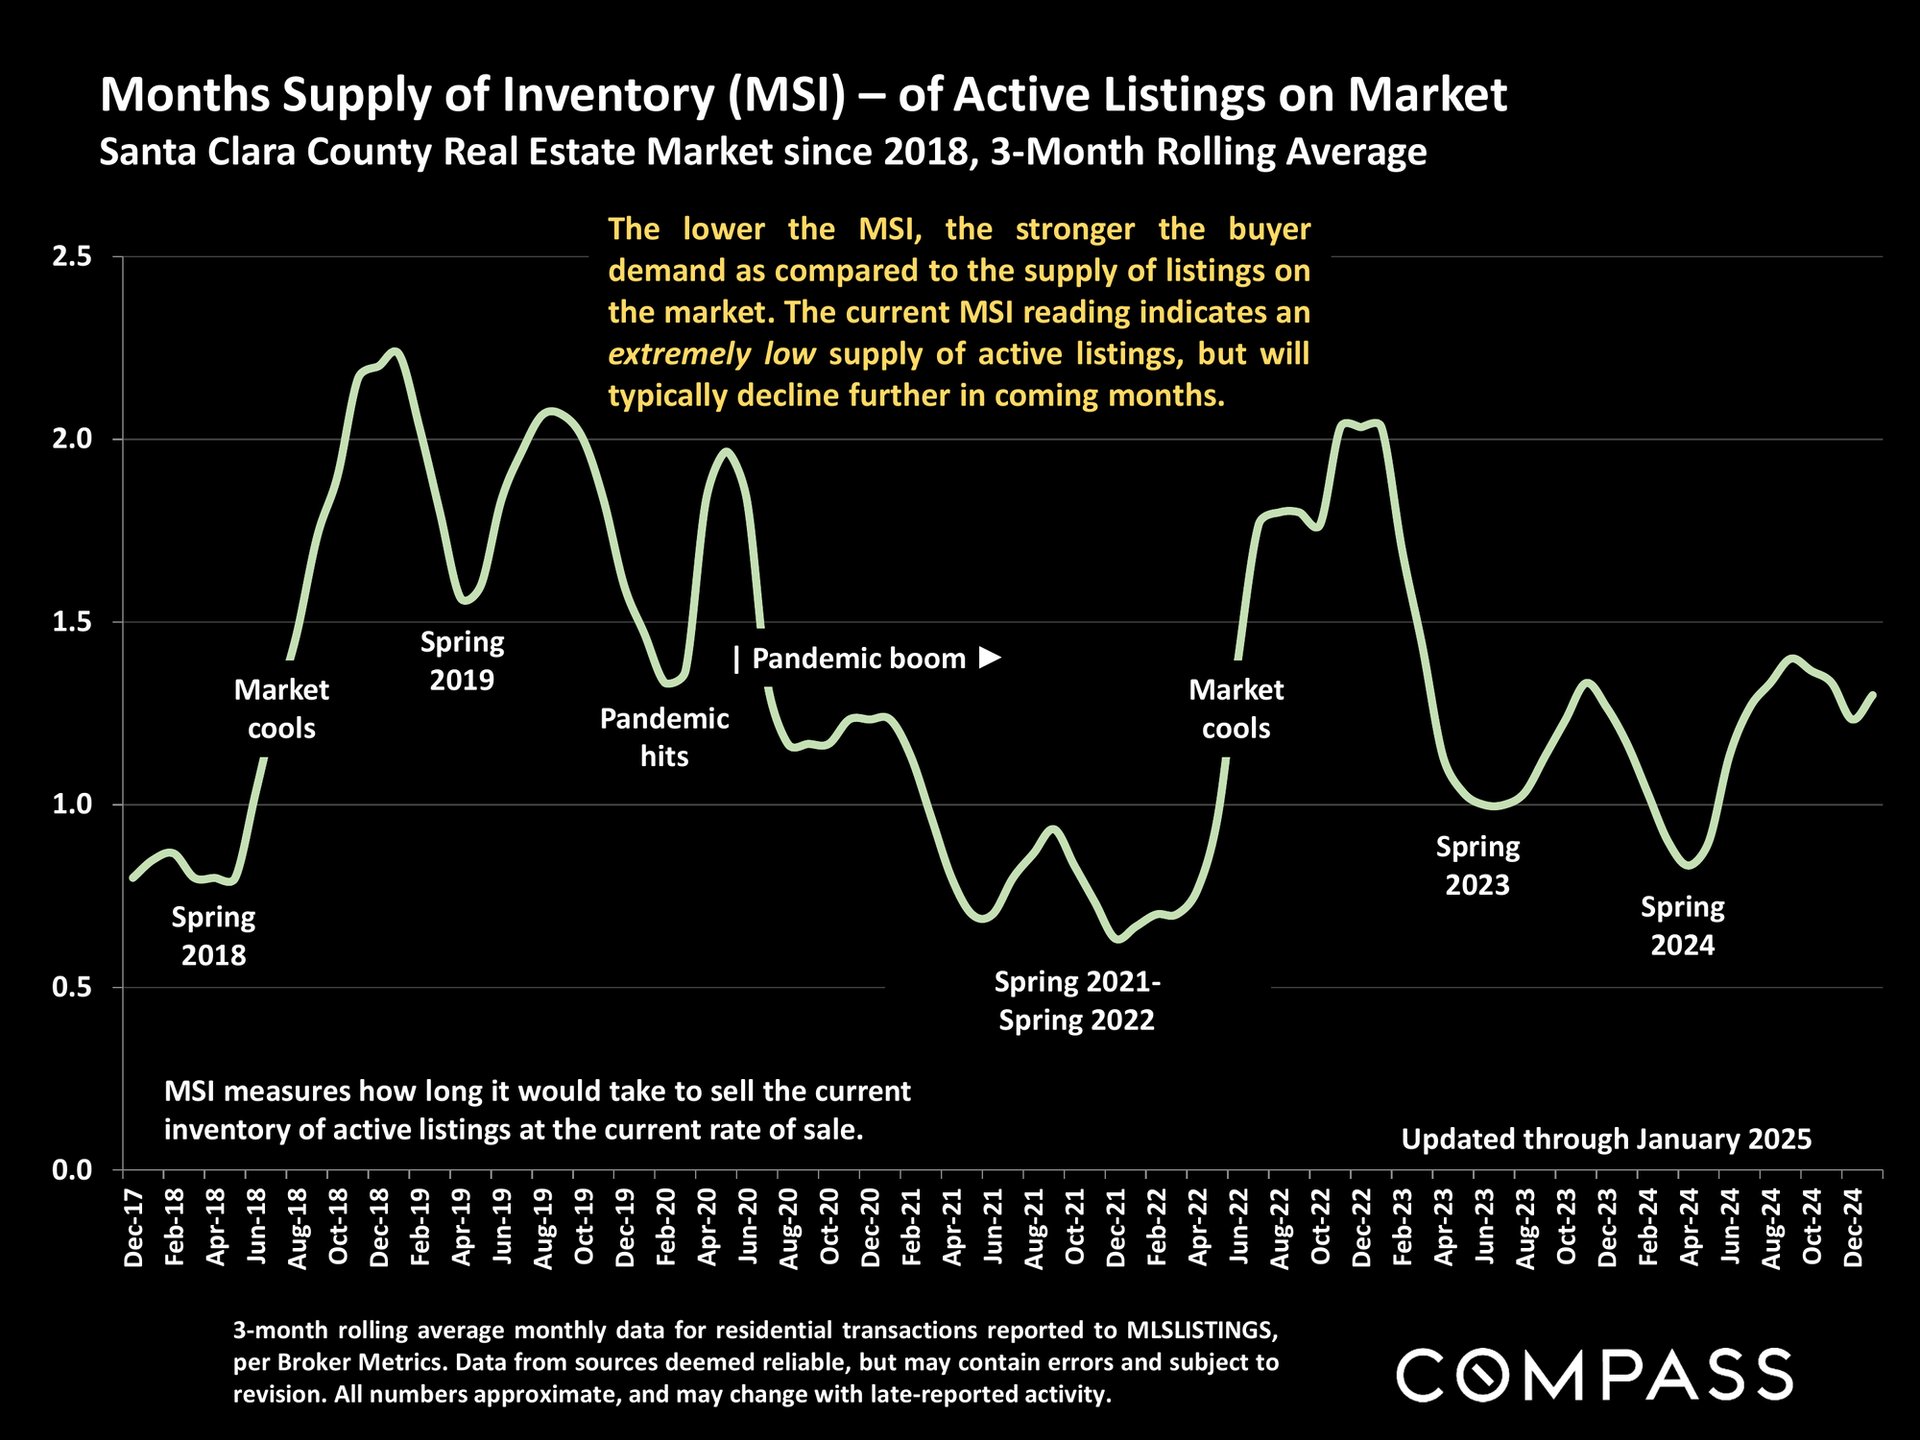
Santa Clara County active-listing inventory chart, with monthly supply trends from 2017 to 2024 and pandemic-era annotations.
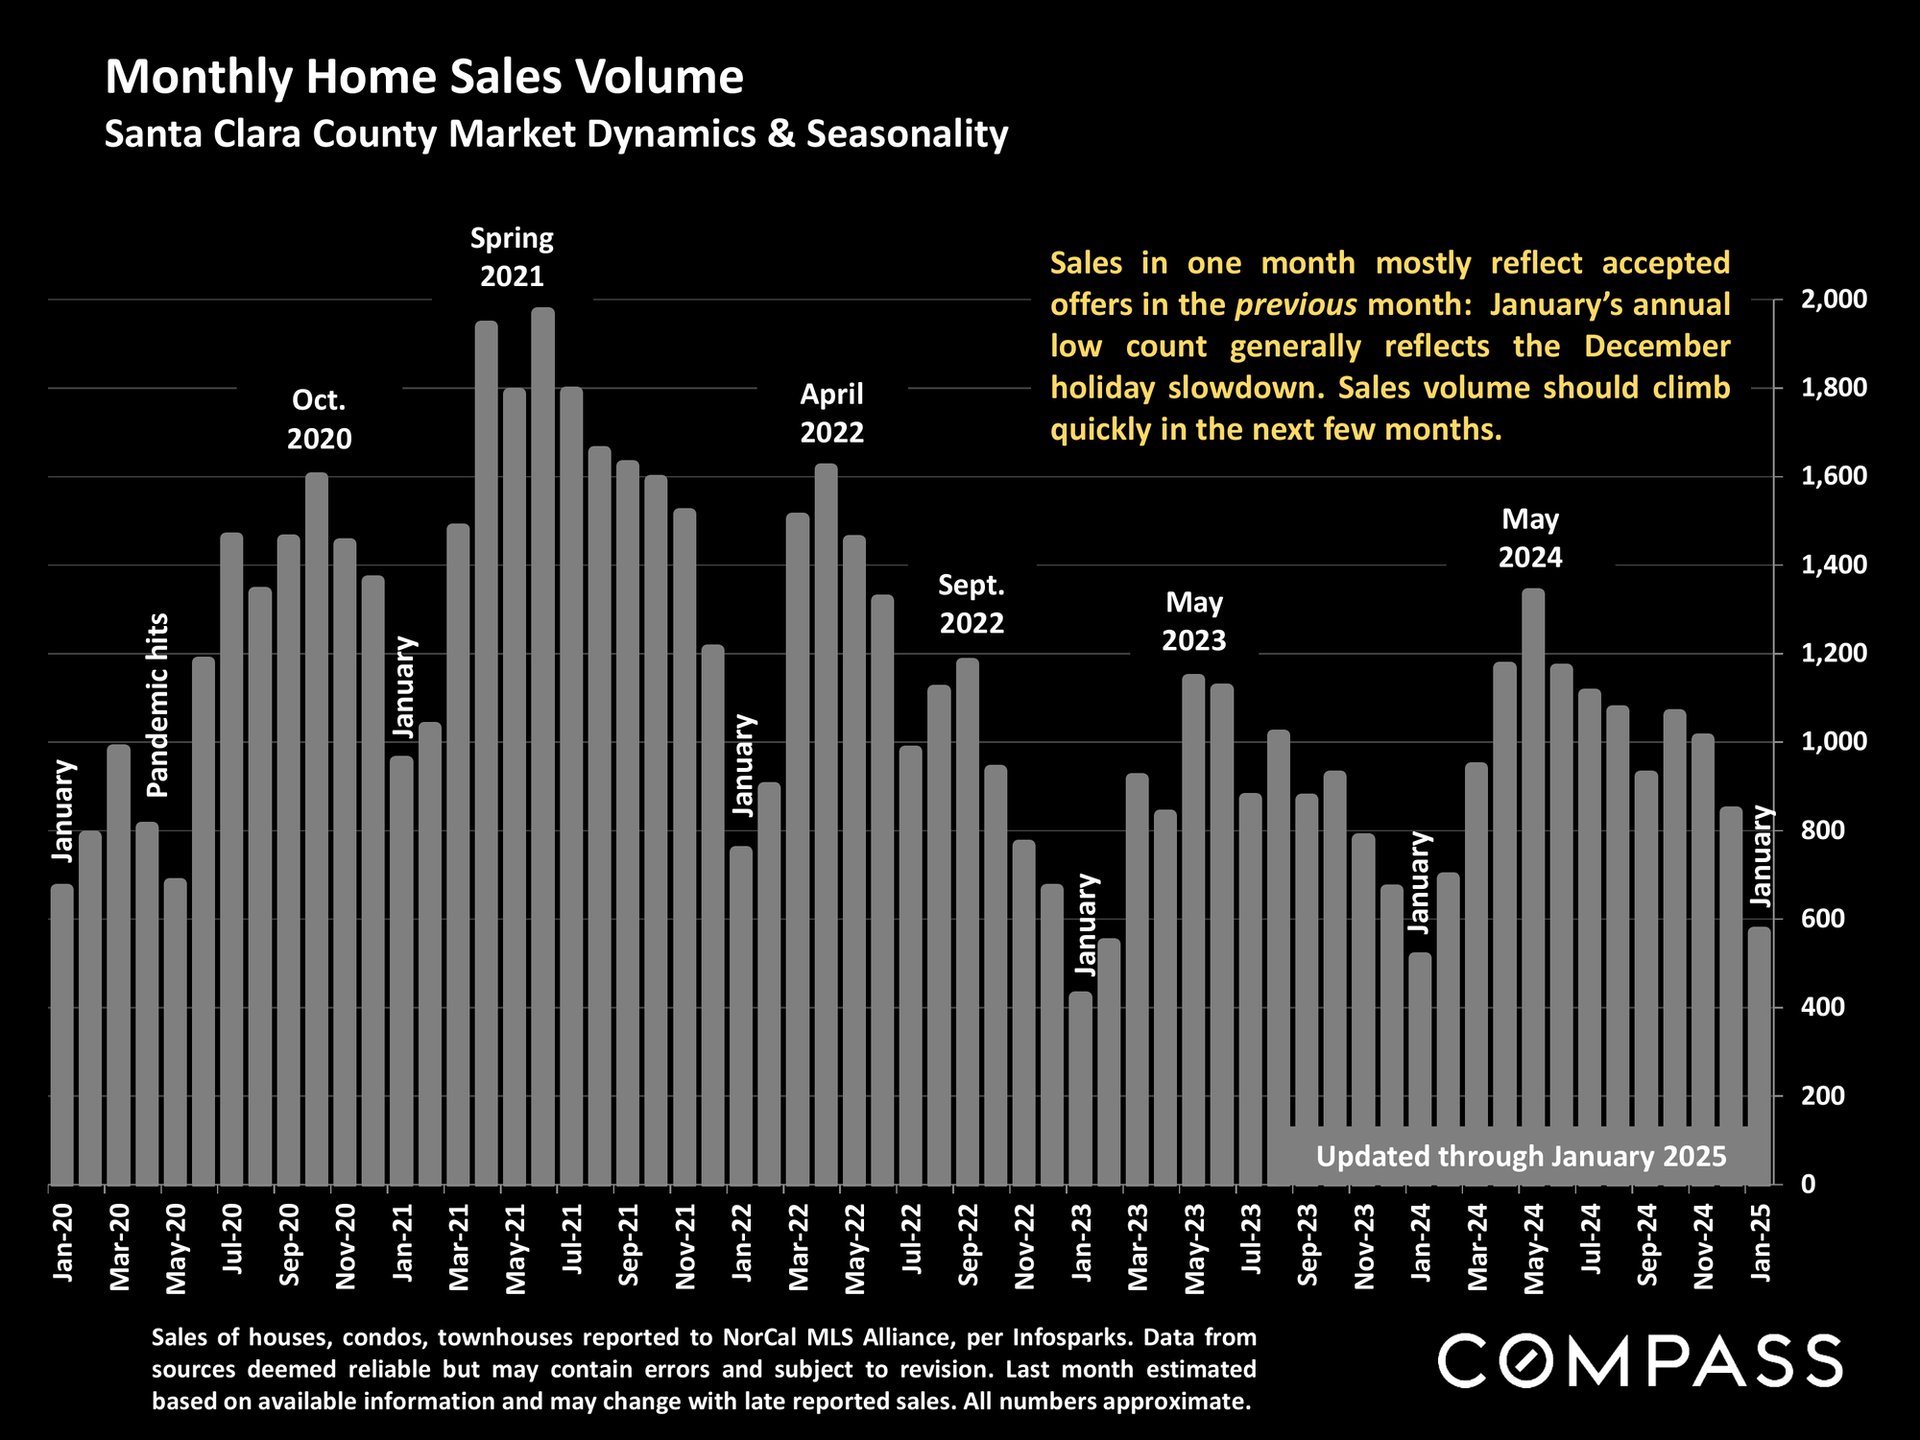
Bar chart of Santa Clara County monthly home sales, January 2020–January 2025, with seasonal peaks and January lows.
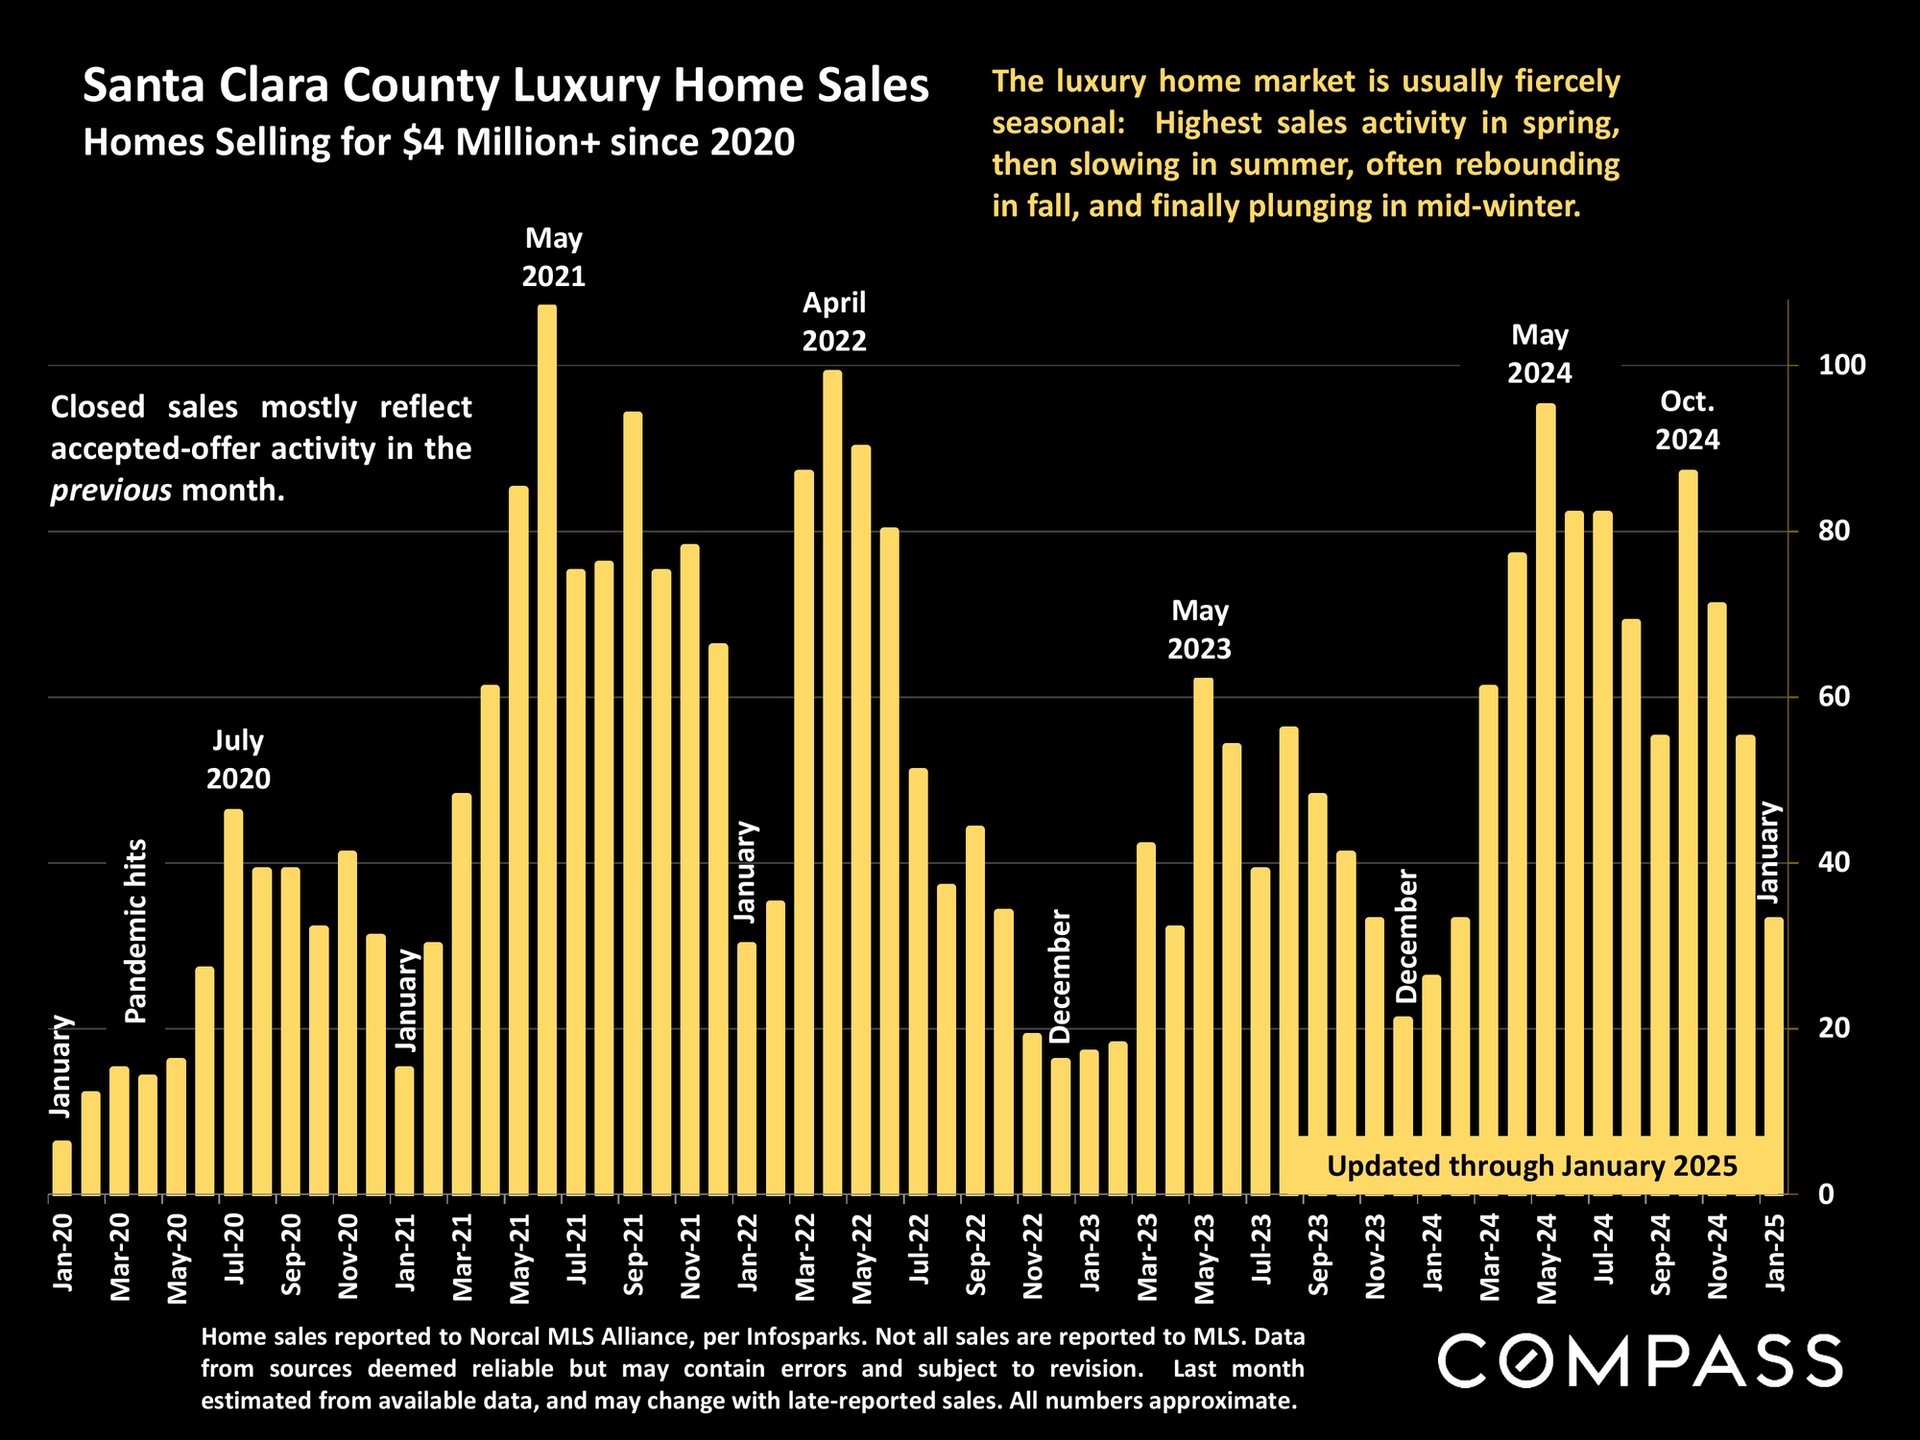
Bar chart of Santa Clara County luxury home sales from 2020 through January 2025, with seasonal peaks labeled.
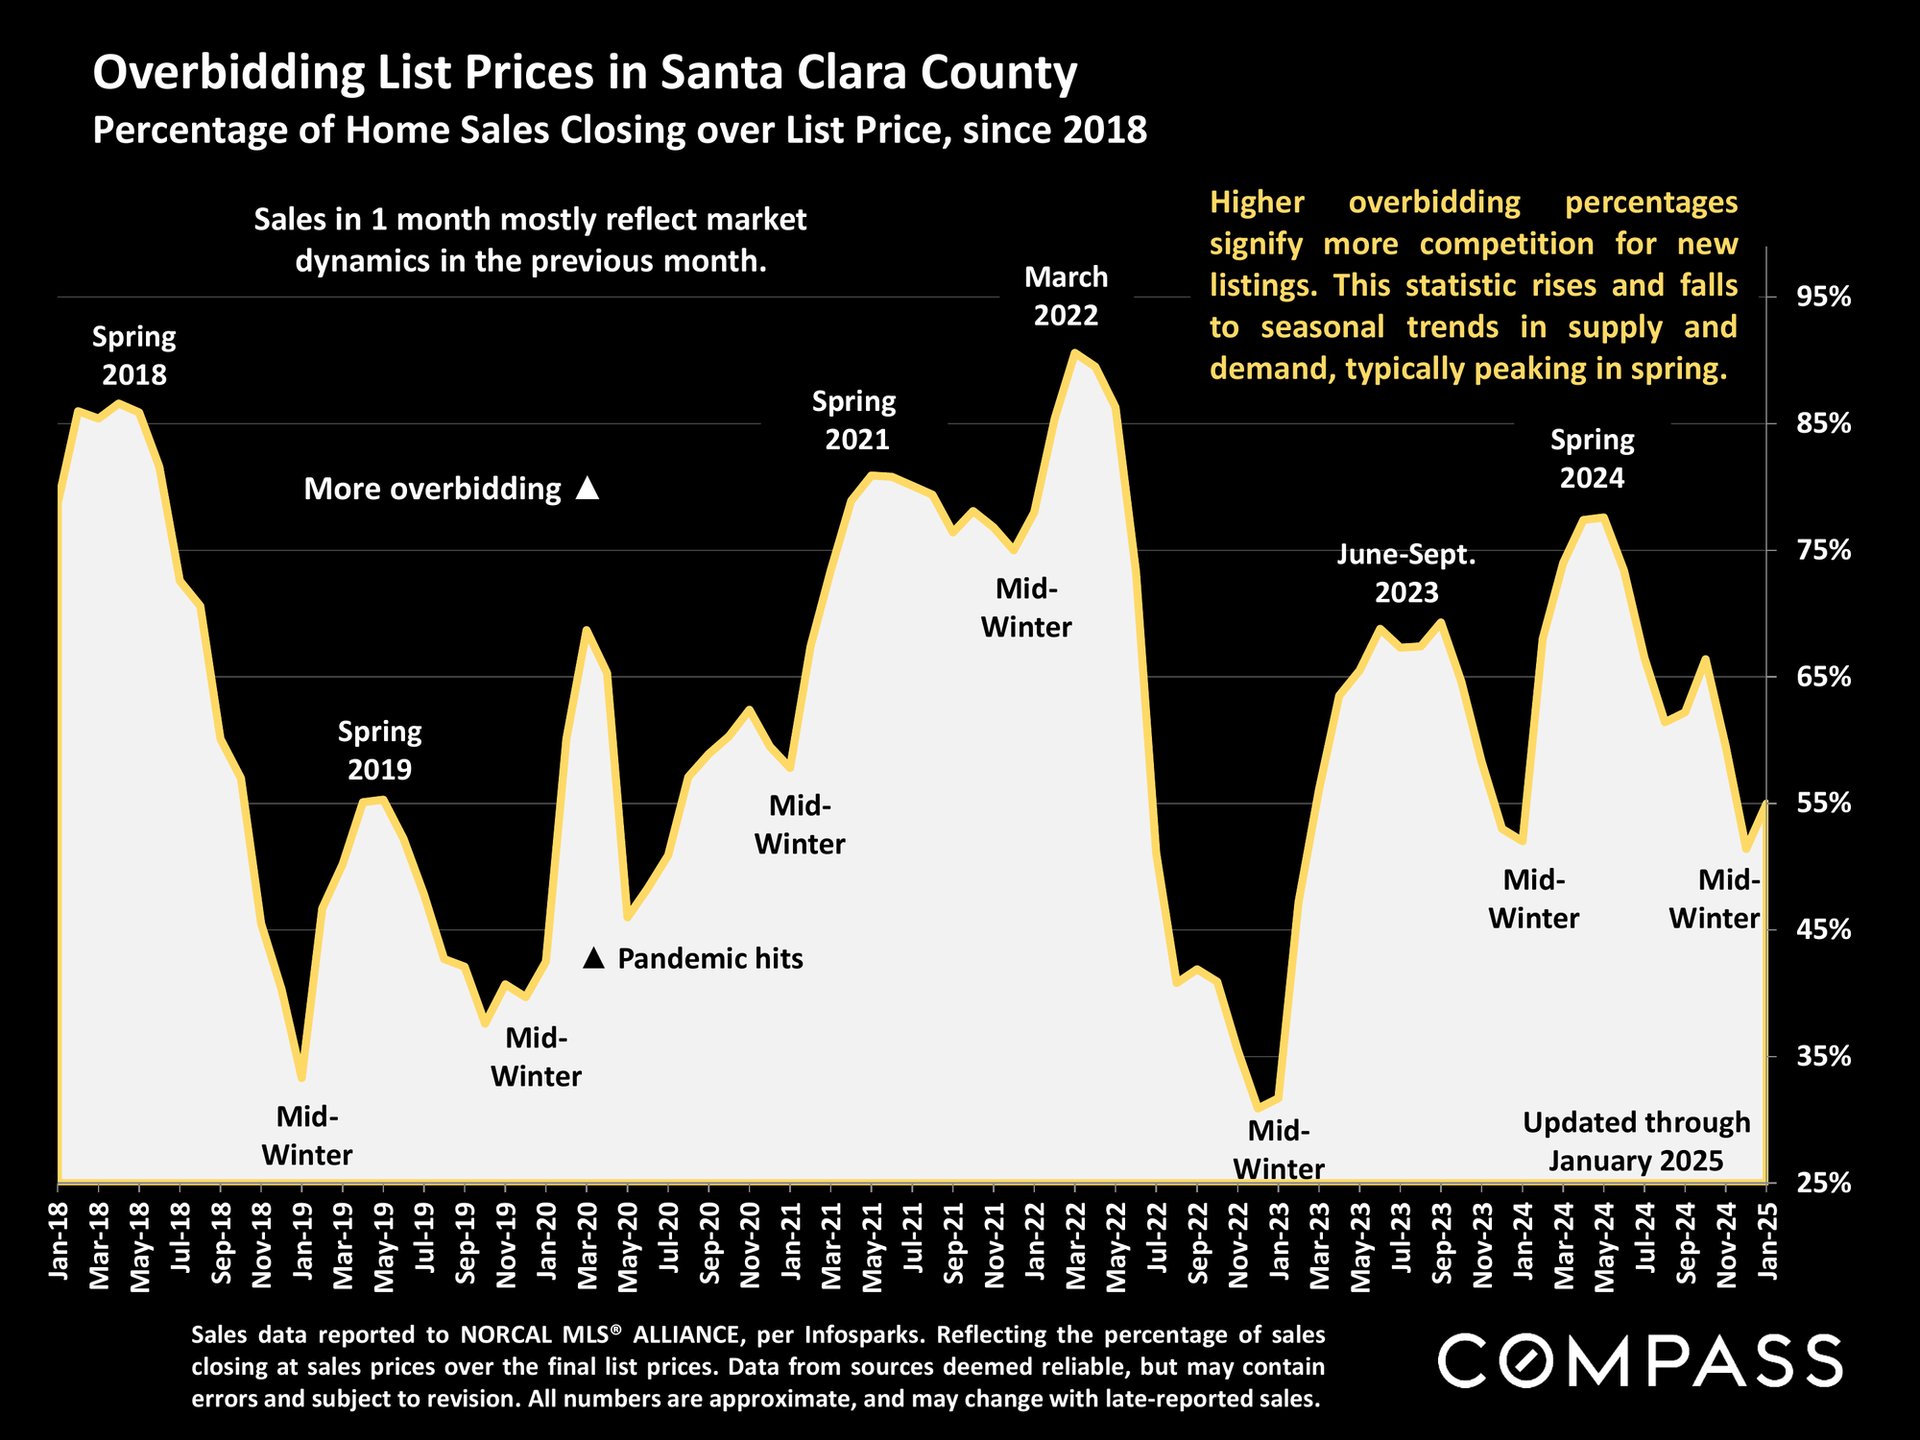
Santa Clara County overbidding chart, showing monthly home sales closing above list price from 2018 through January 2025.
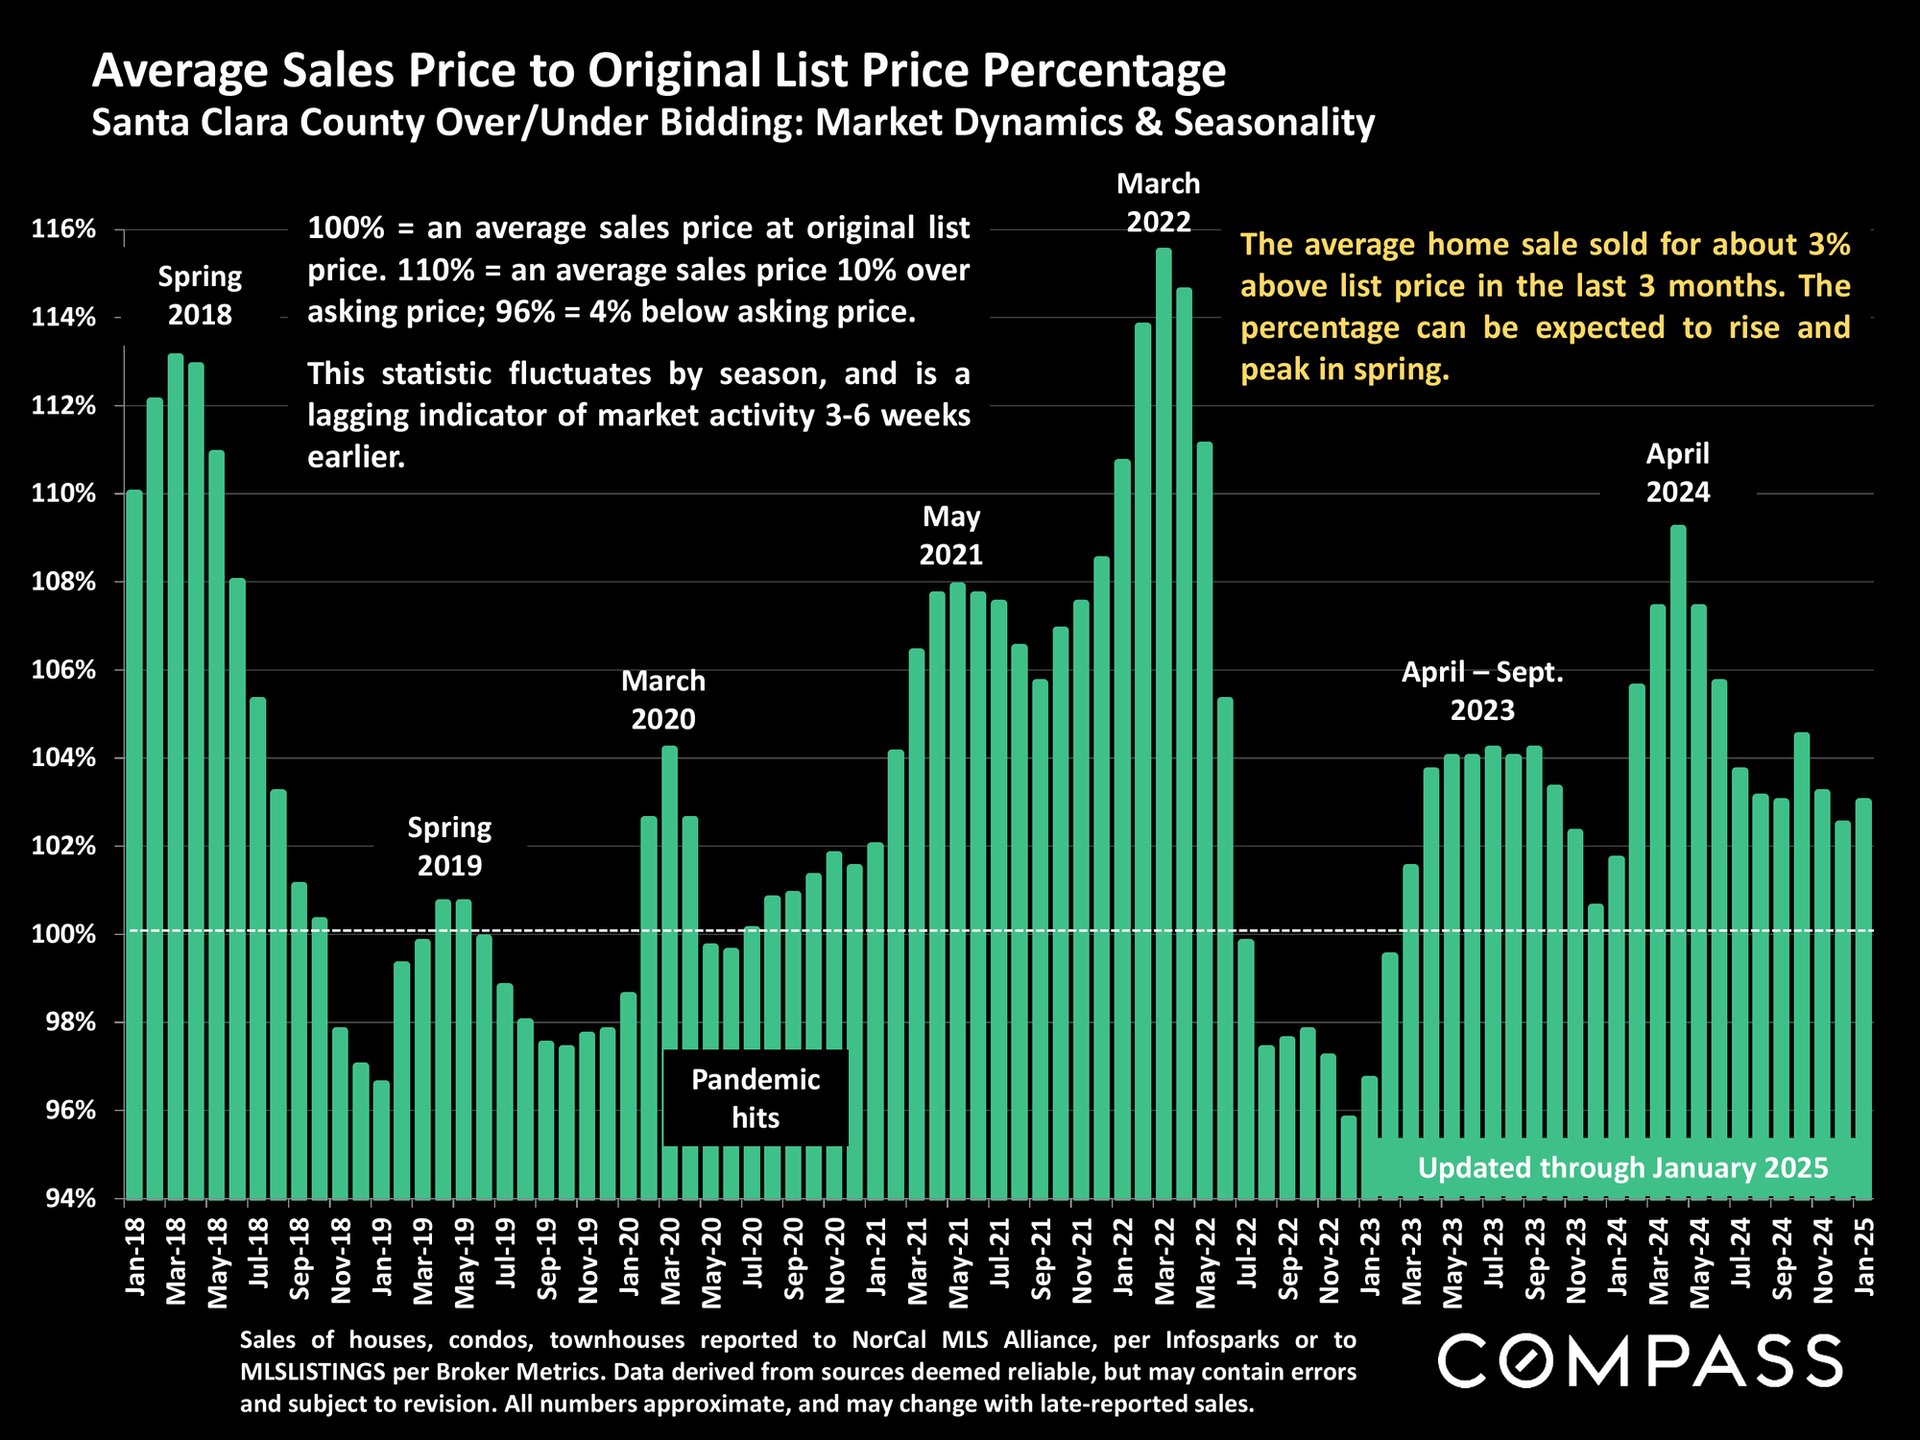
Chart of Santa Clara County sale prices versus list prices, January 2018–January 2025, with seasonal trends.
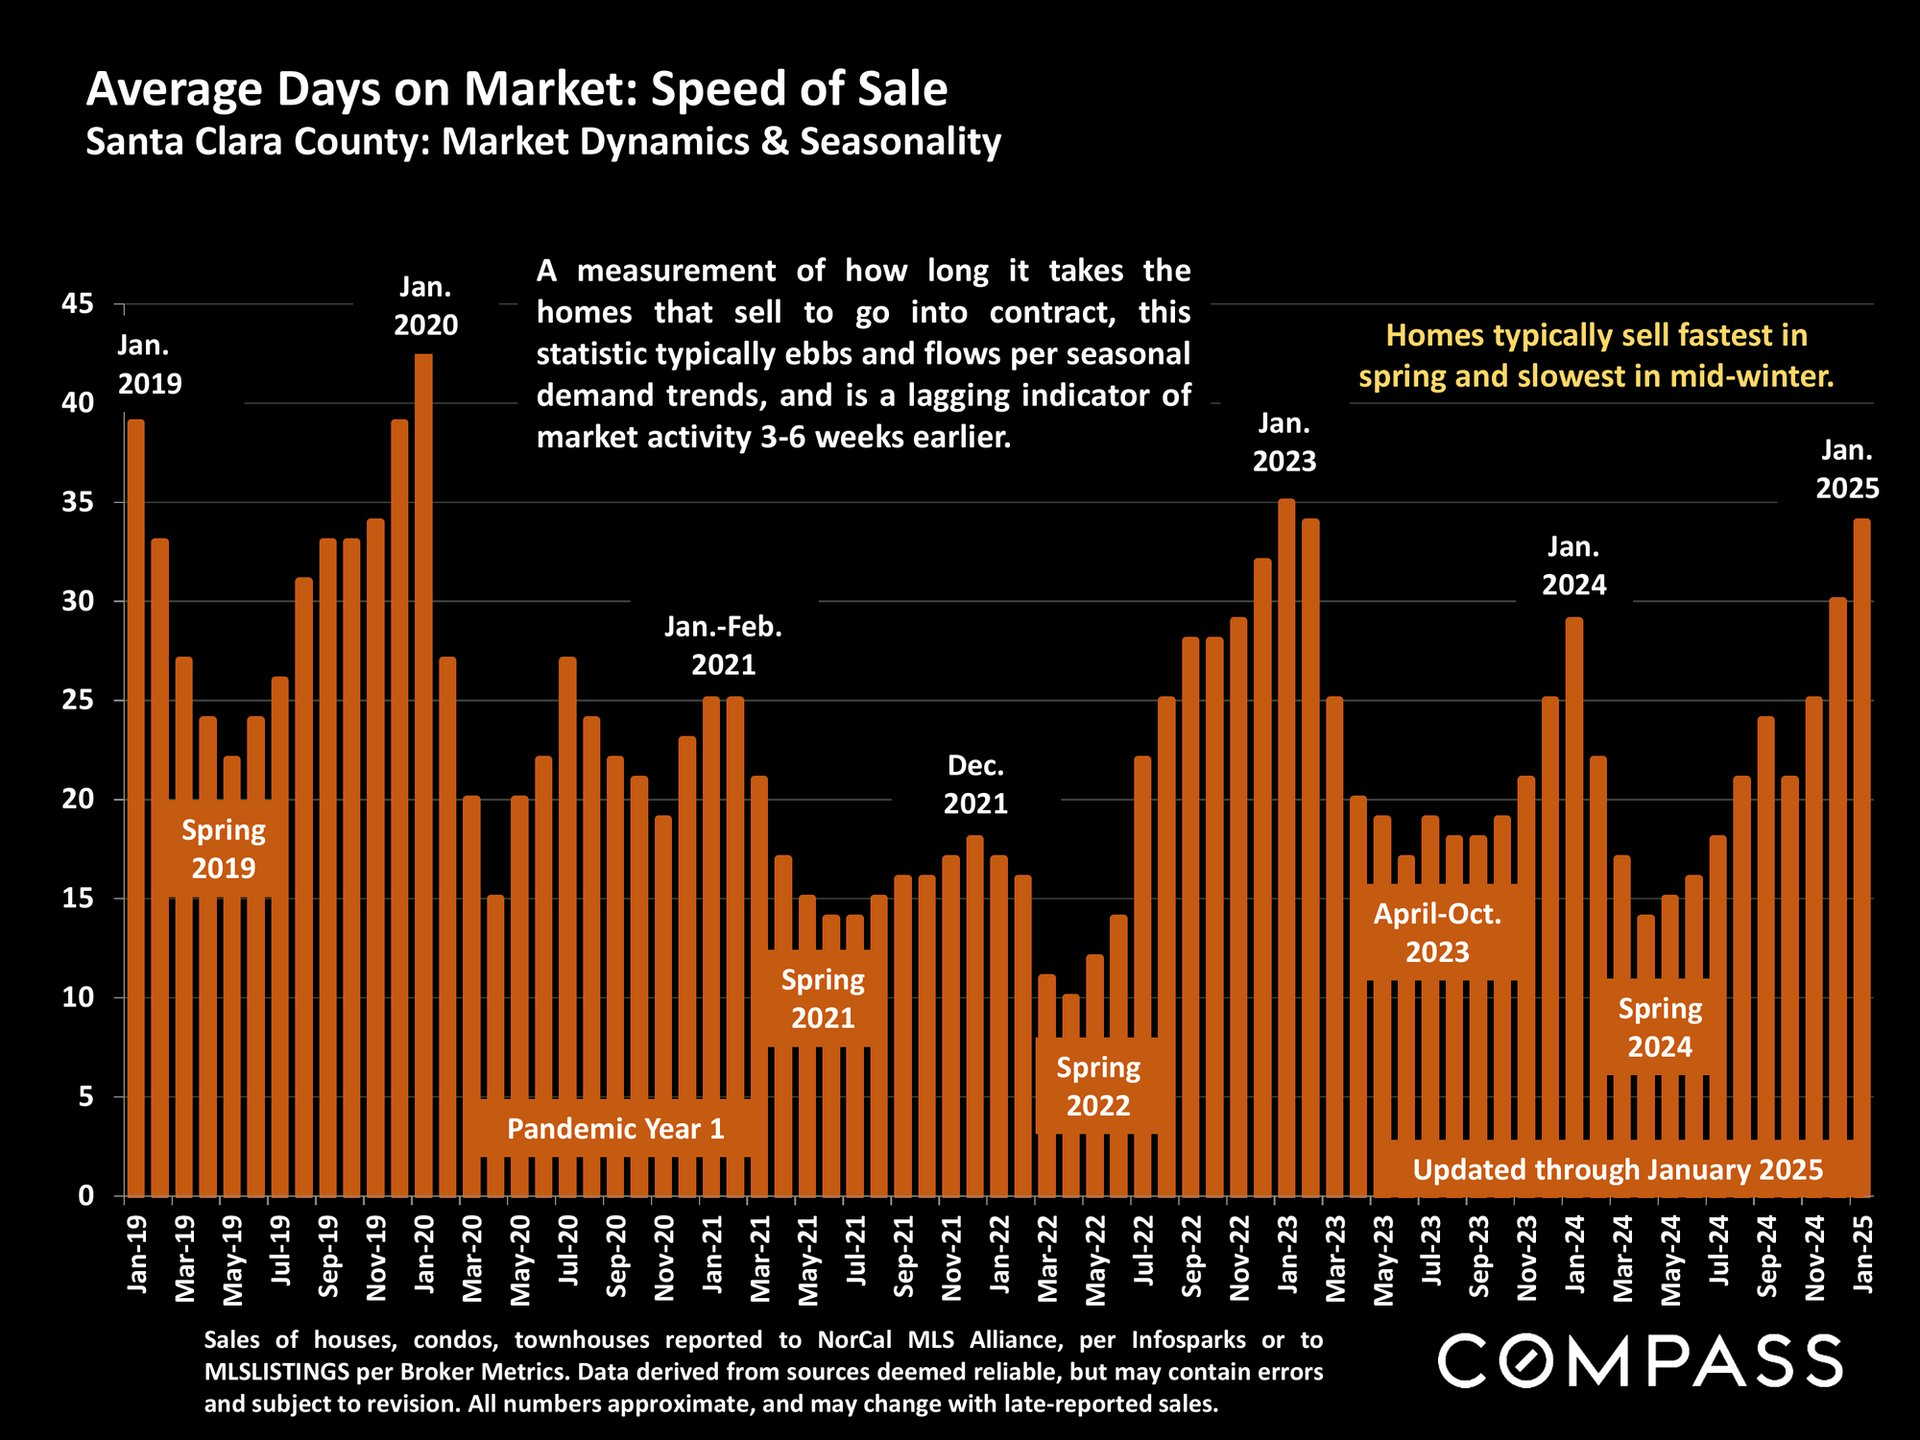
Santa Clara County average days on market chart from 2019 to January 2025, with orange monthly bars and seasonal annotations.
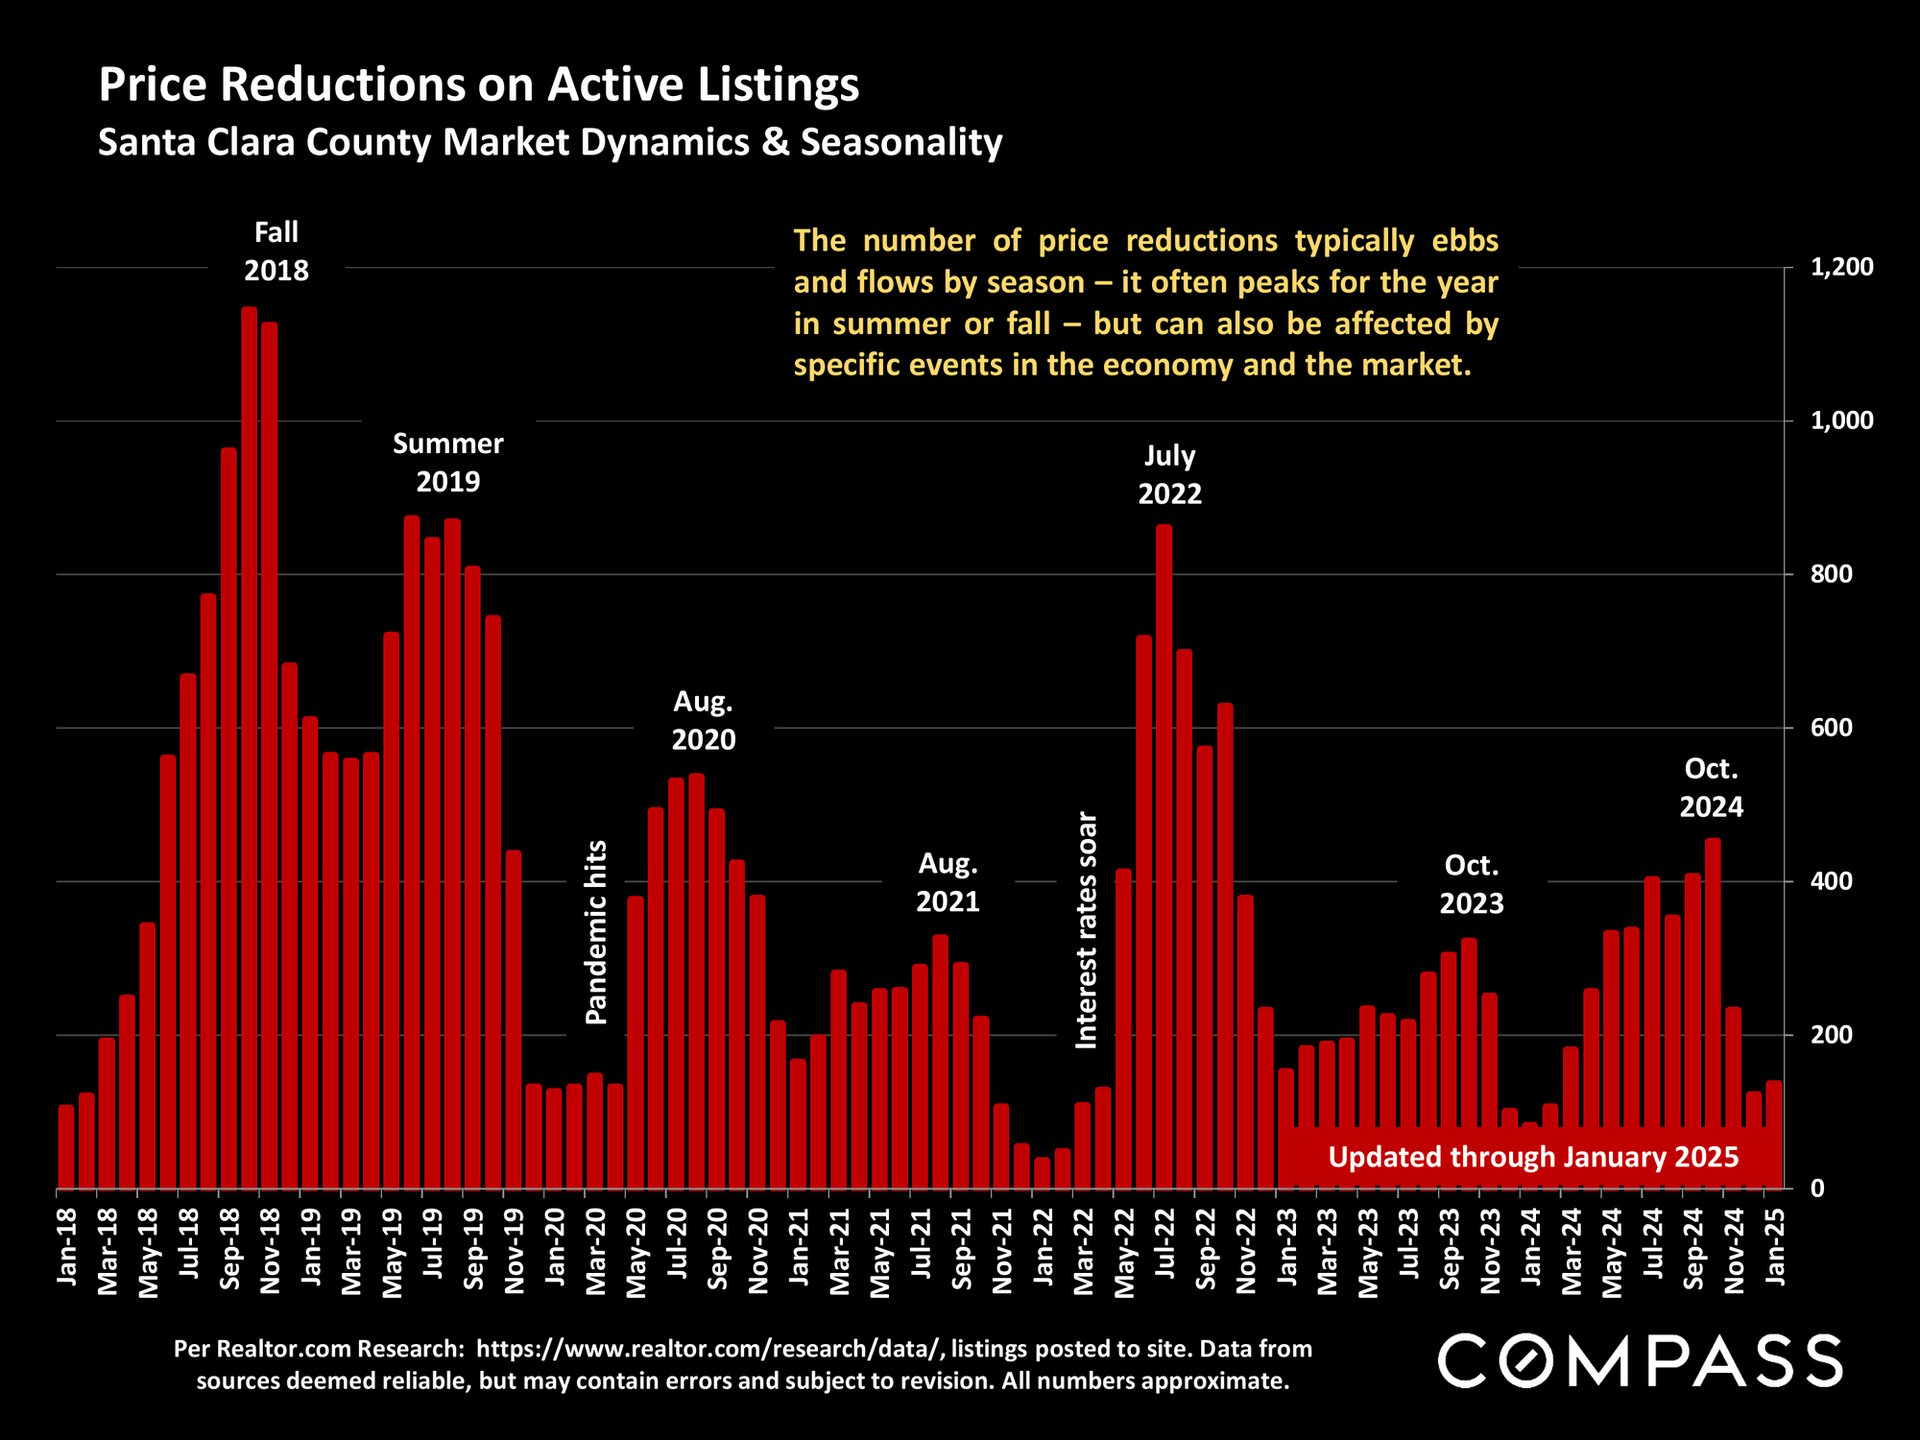
Bar chart of Santa Clara County listing price reductions, with peaks in fall 2018, summer 2019, and July 2022.
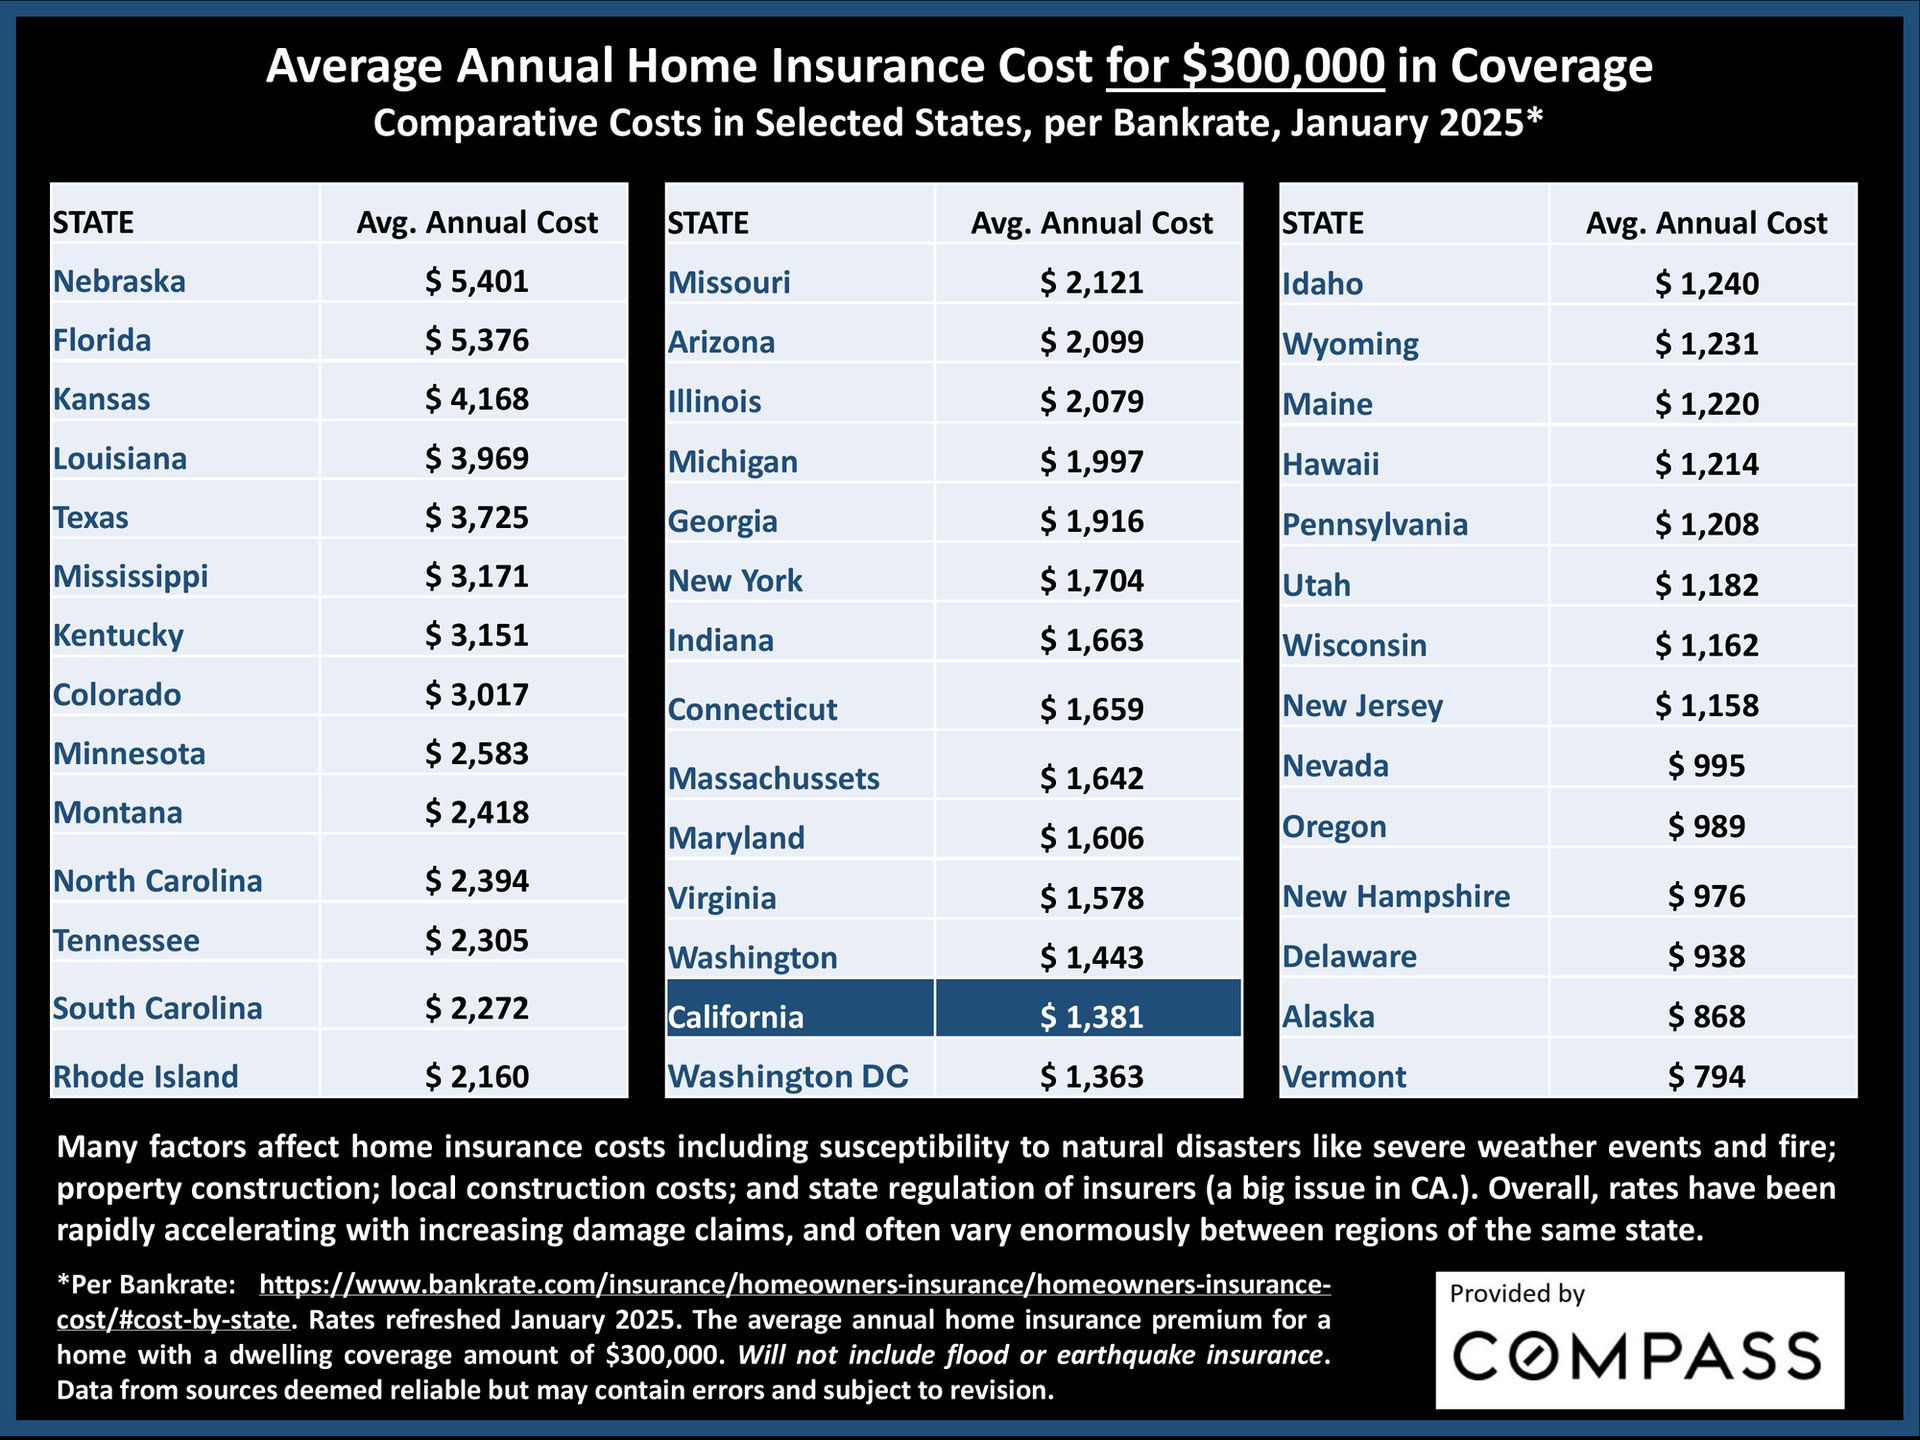
Home insurance cost comparison by state, with California averaging $1,381 annually for $300,000 coverage.
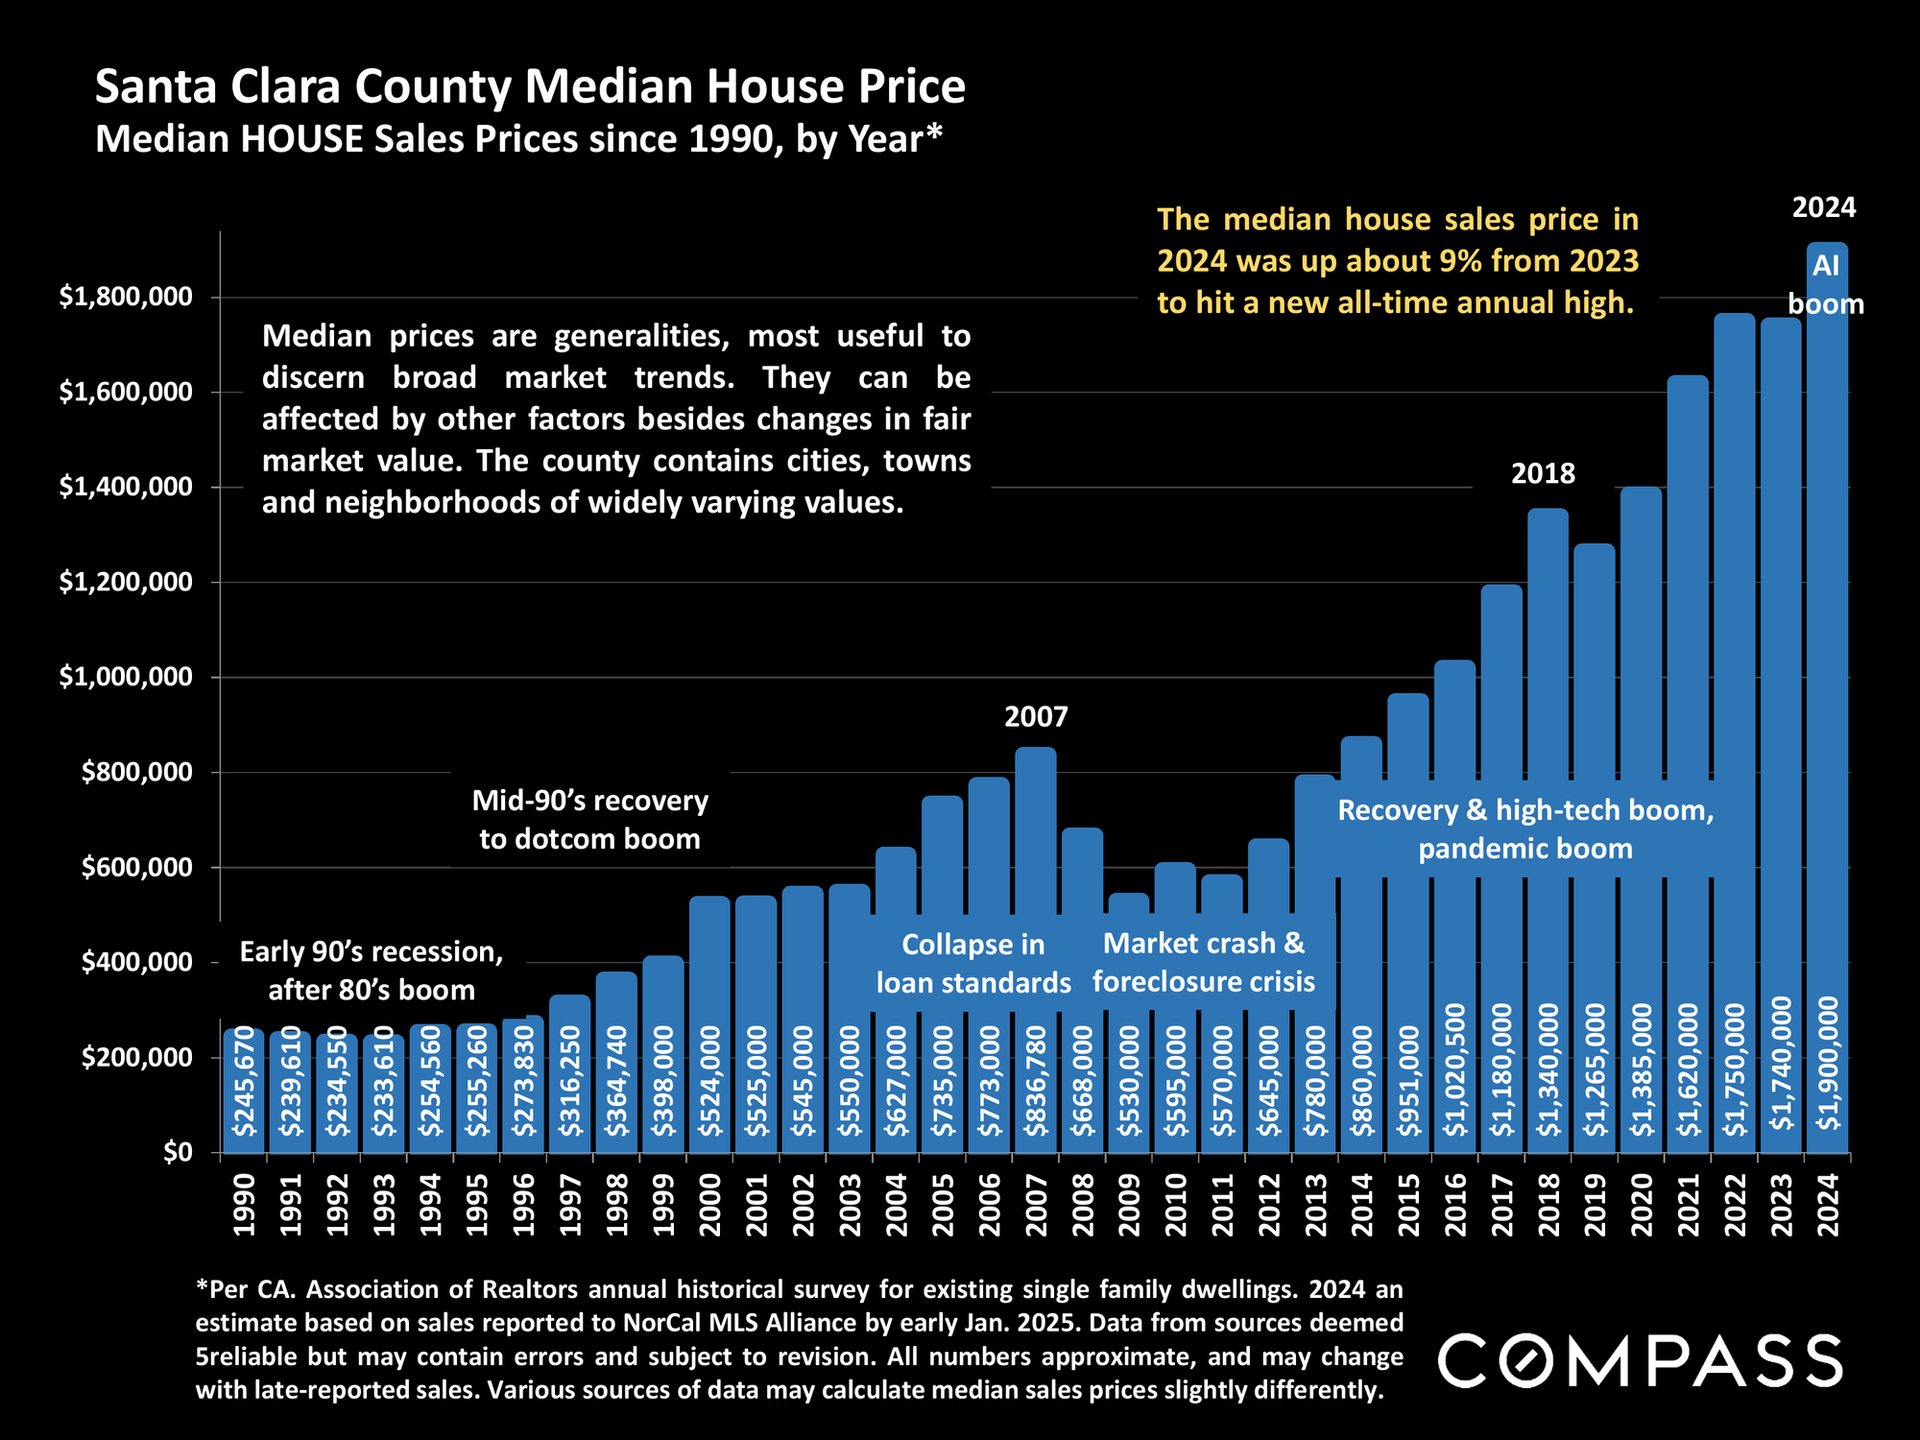
Bar chart of Santa Clara County median home prices, 1990–2024, reaching $1.9 million in 2024.
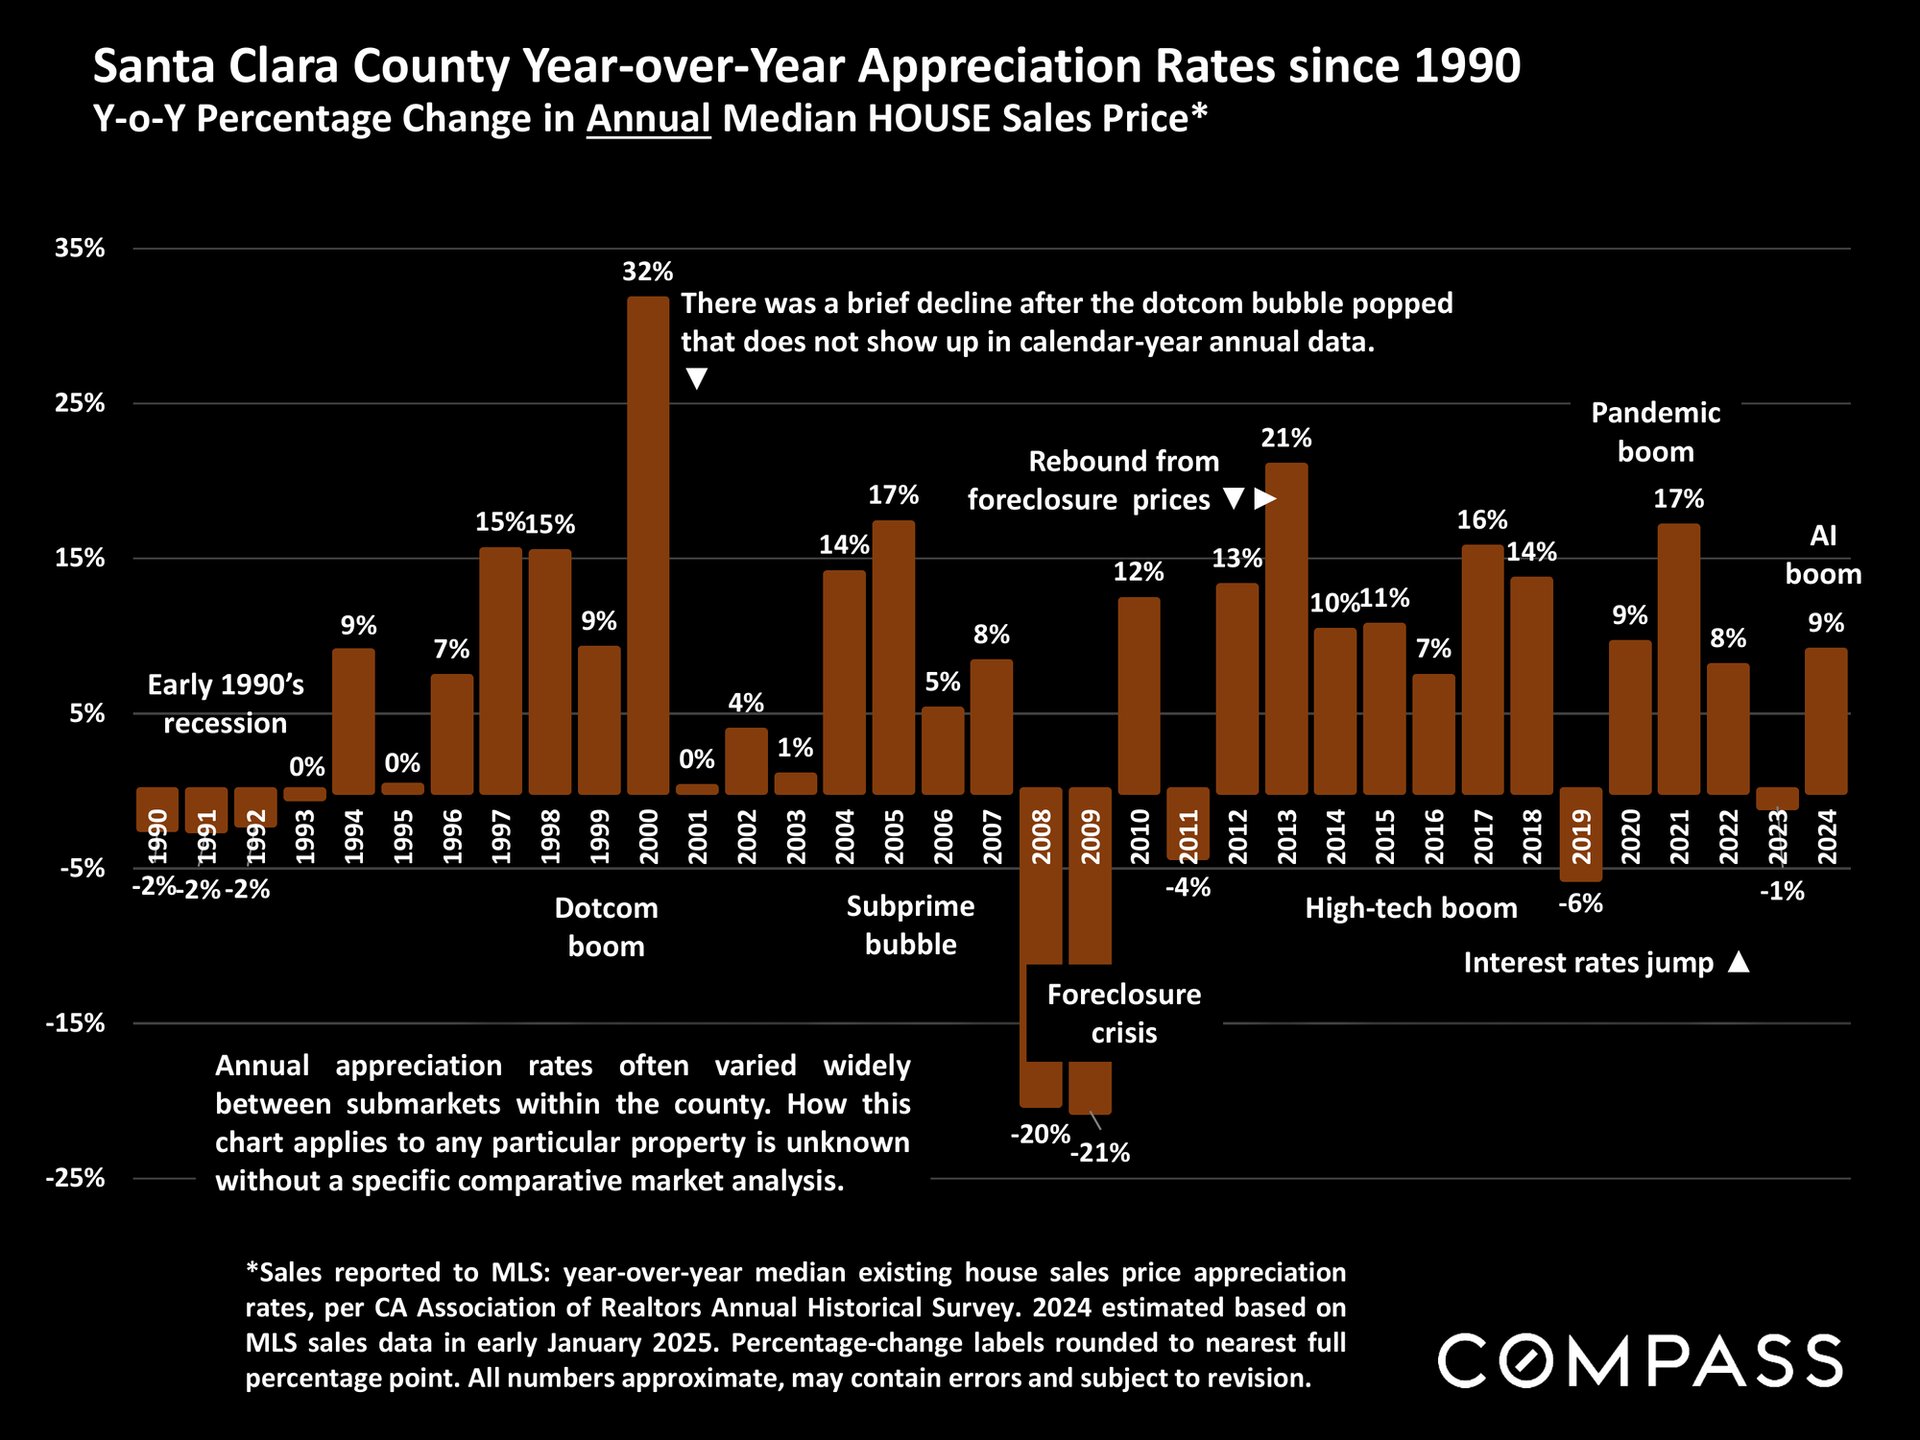
Chart of Santa Clara County annual home price appreciation rates from 1990 to 2024, with historical market annotations.
Chart comparing Santa Clara County median condo and townhouse prices from 2005 to 2024, with market-period annotations.
Santa Clara County chart of median home values per square foot by property type, 2005–2024.
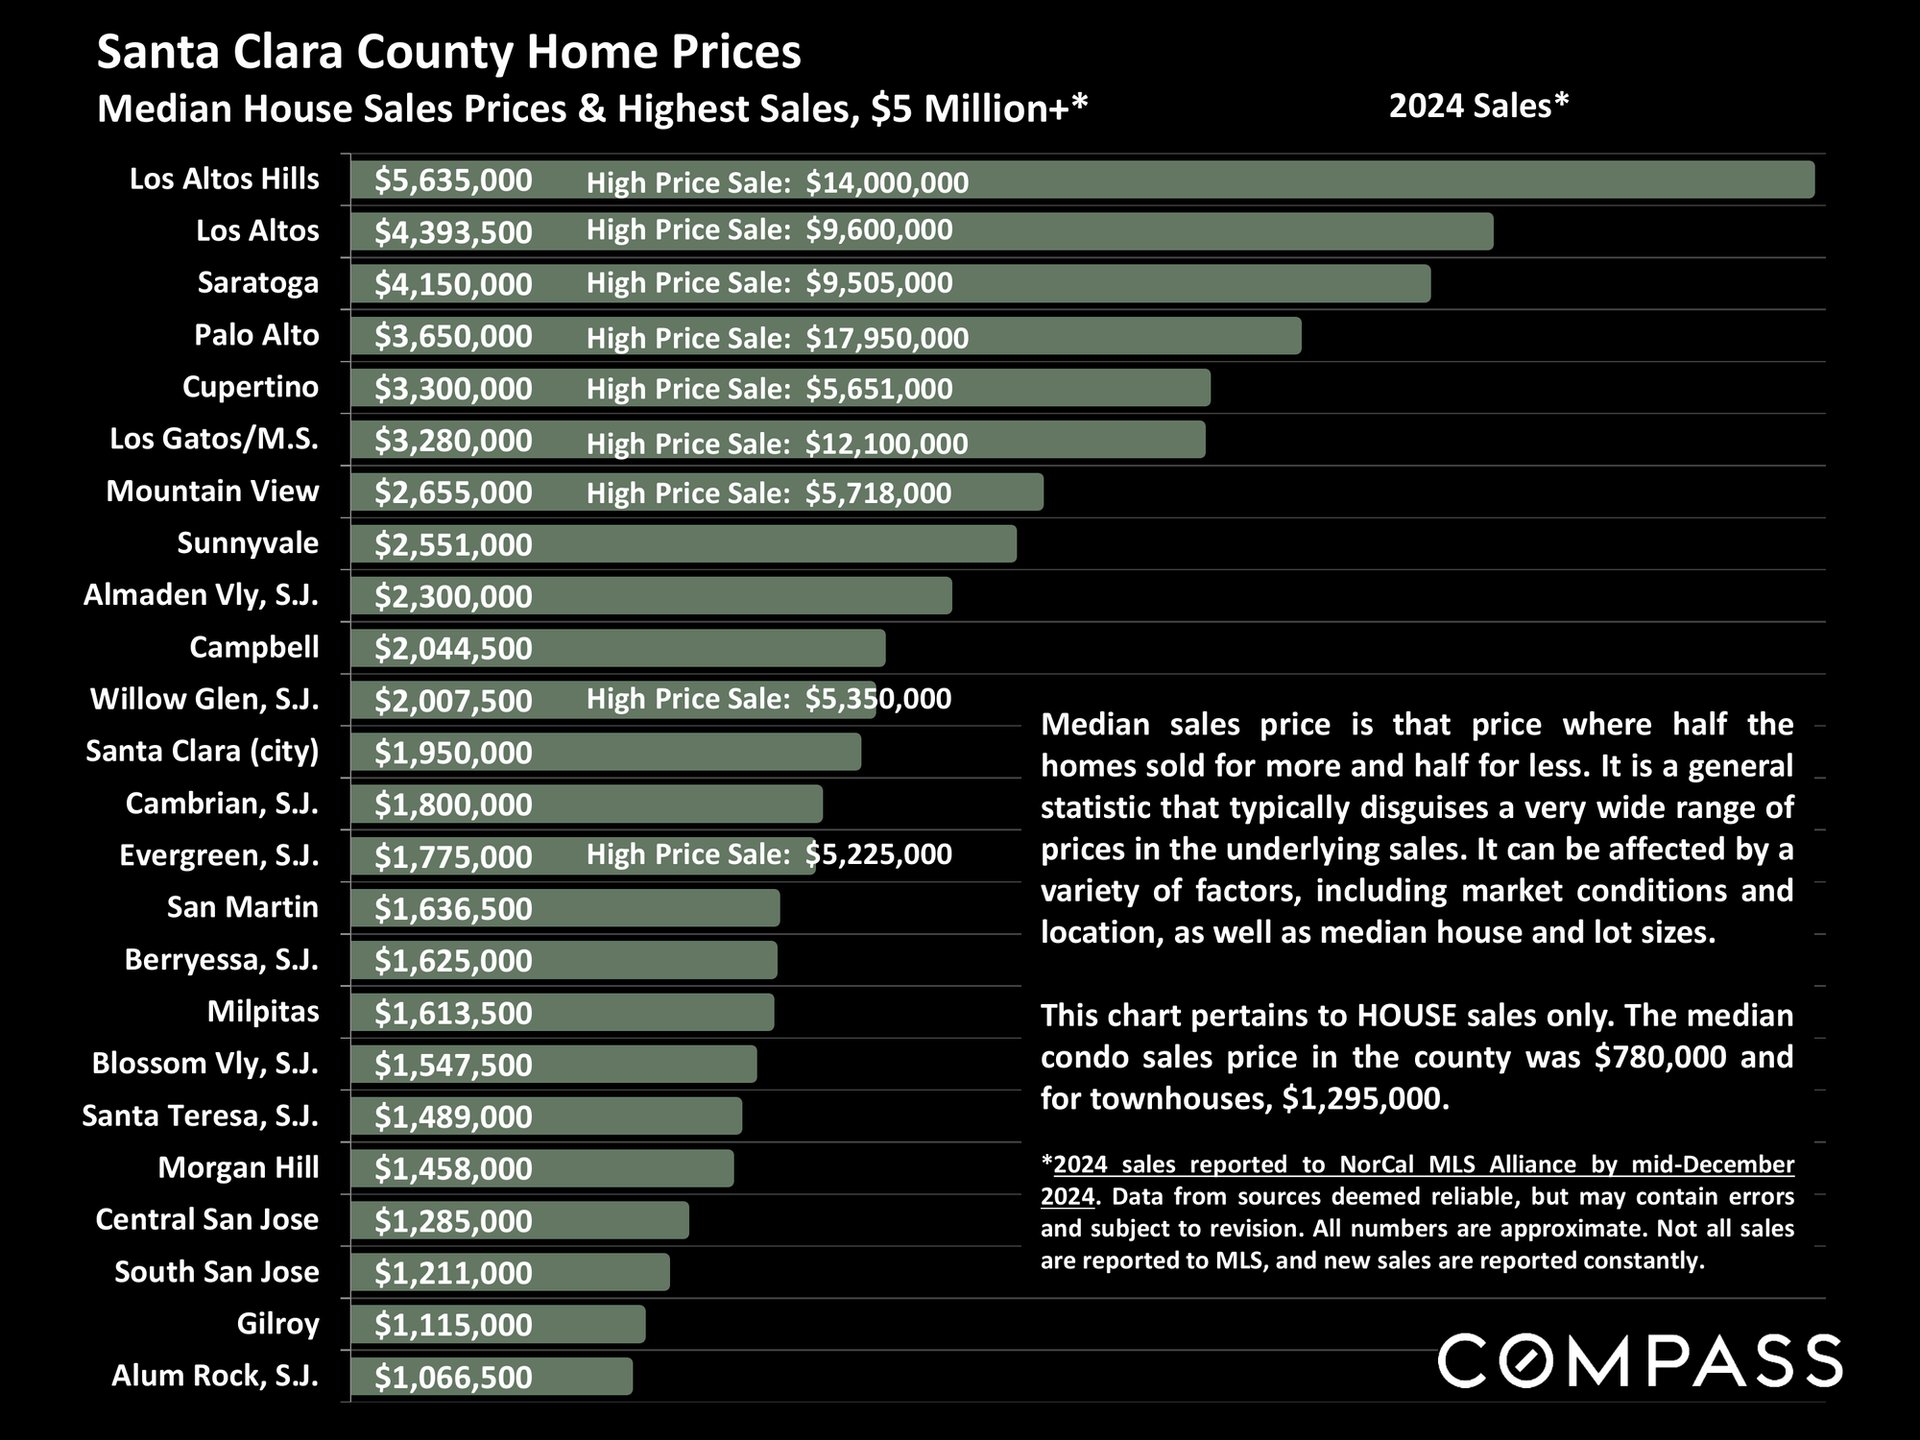
Santa Clara County home prices chart comparing 2024 median house prices and selected high sales by community.
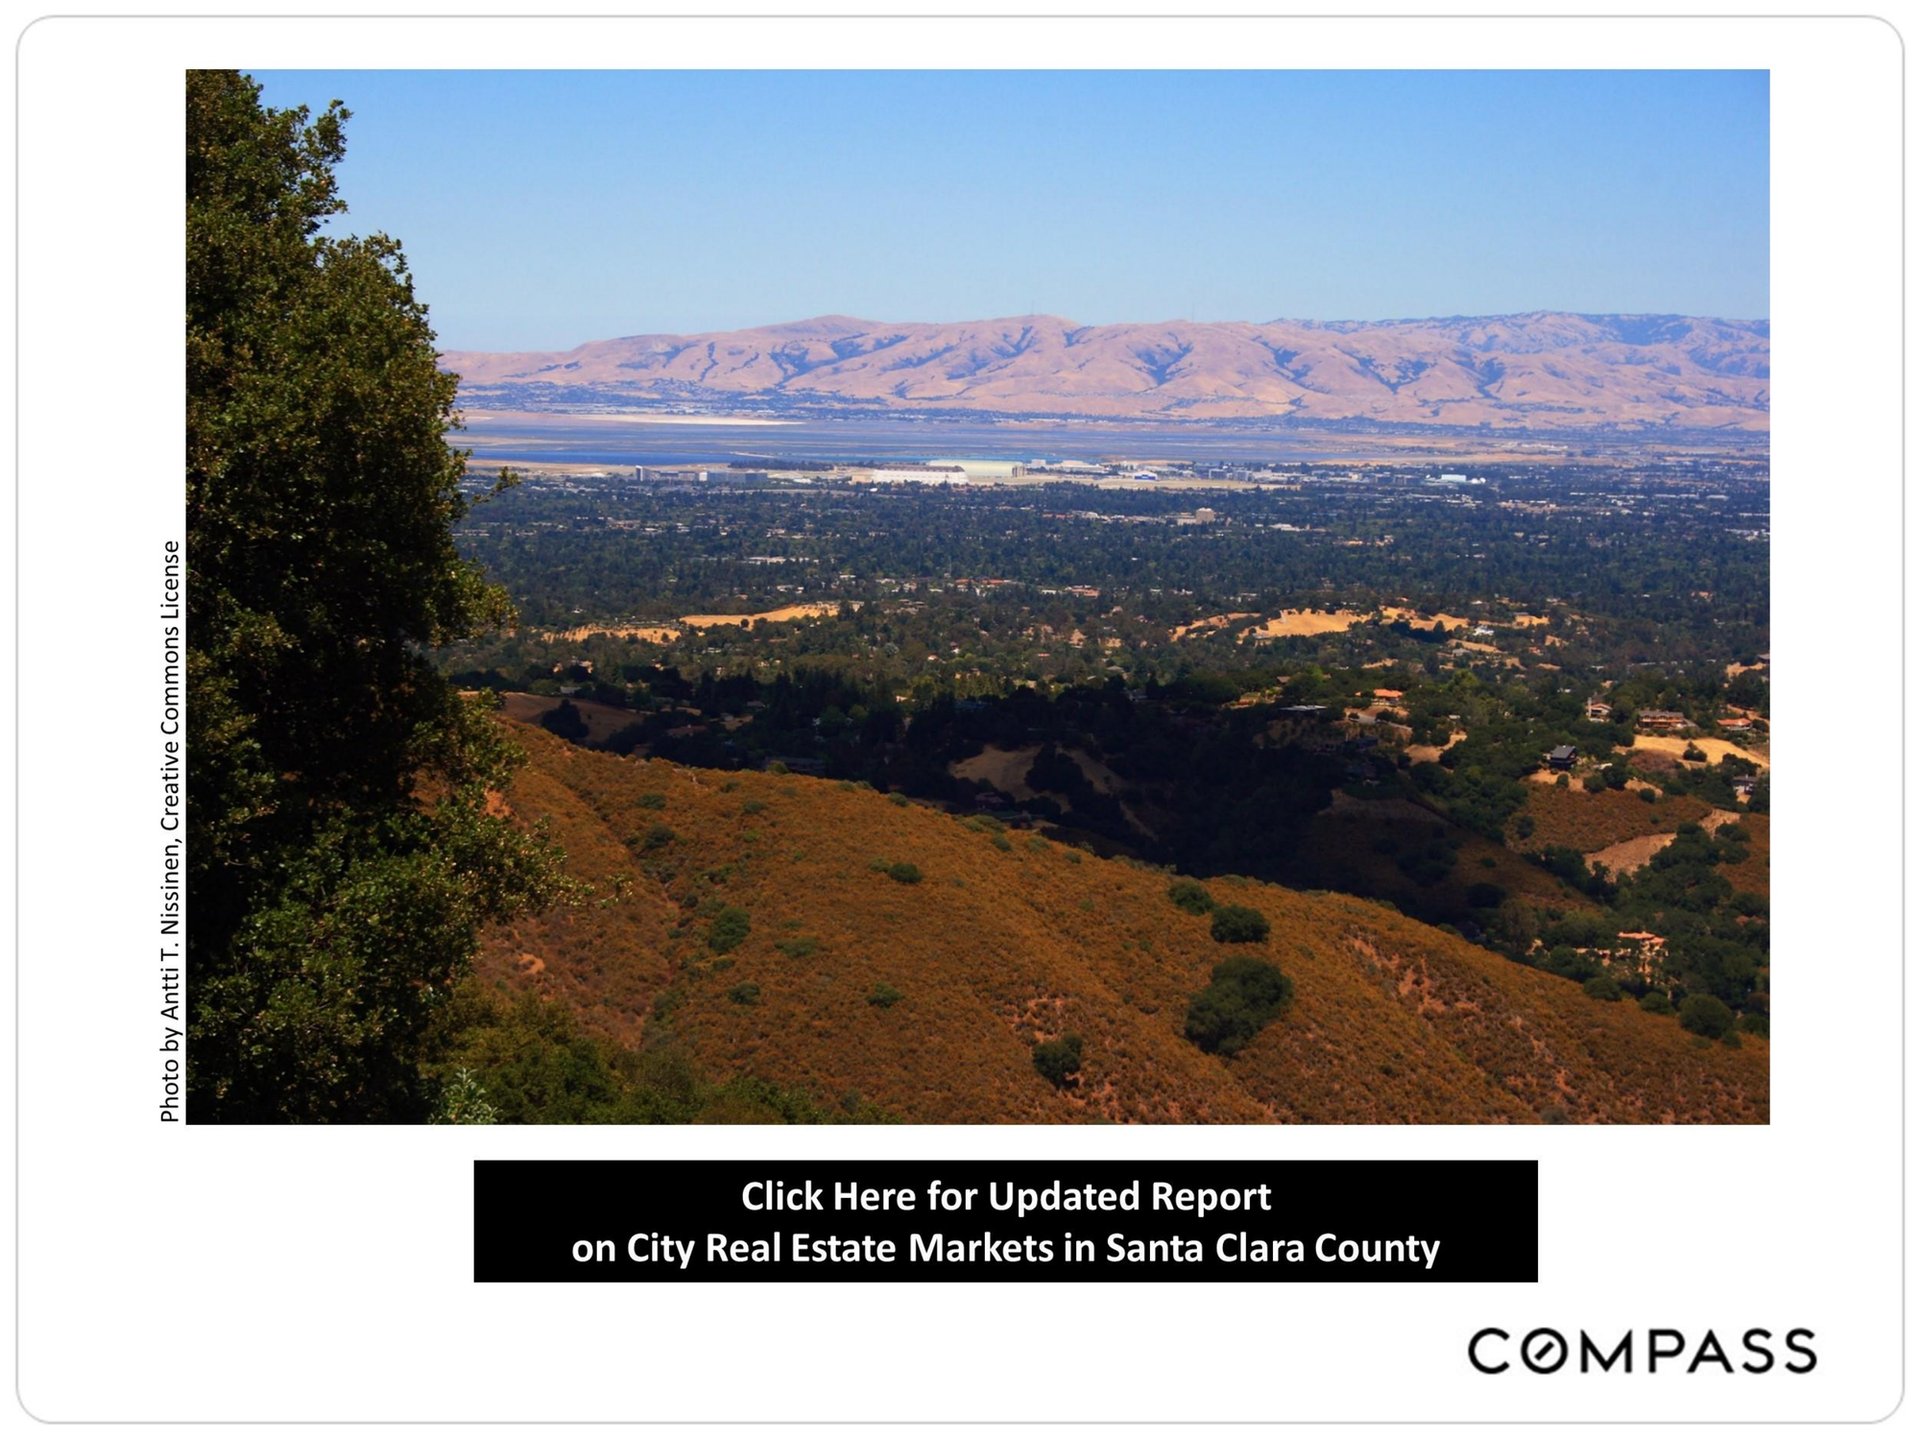
Santa Clara County real estate report promotion with a panoramic valley view and a link to the updated city markets report.
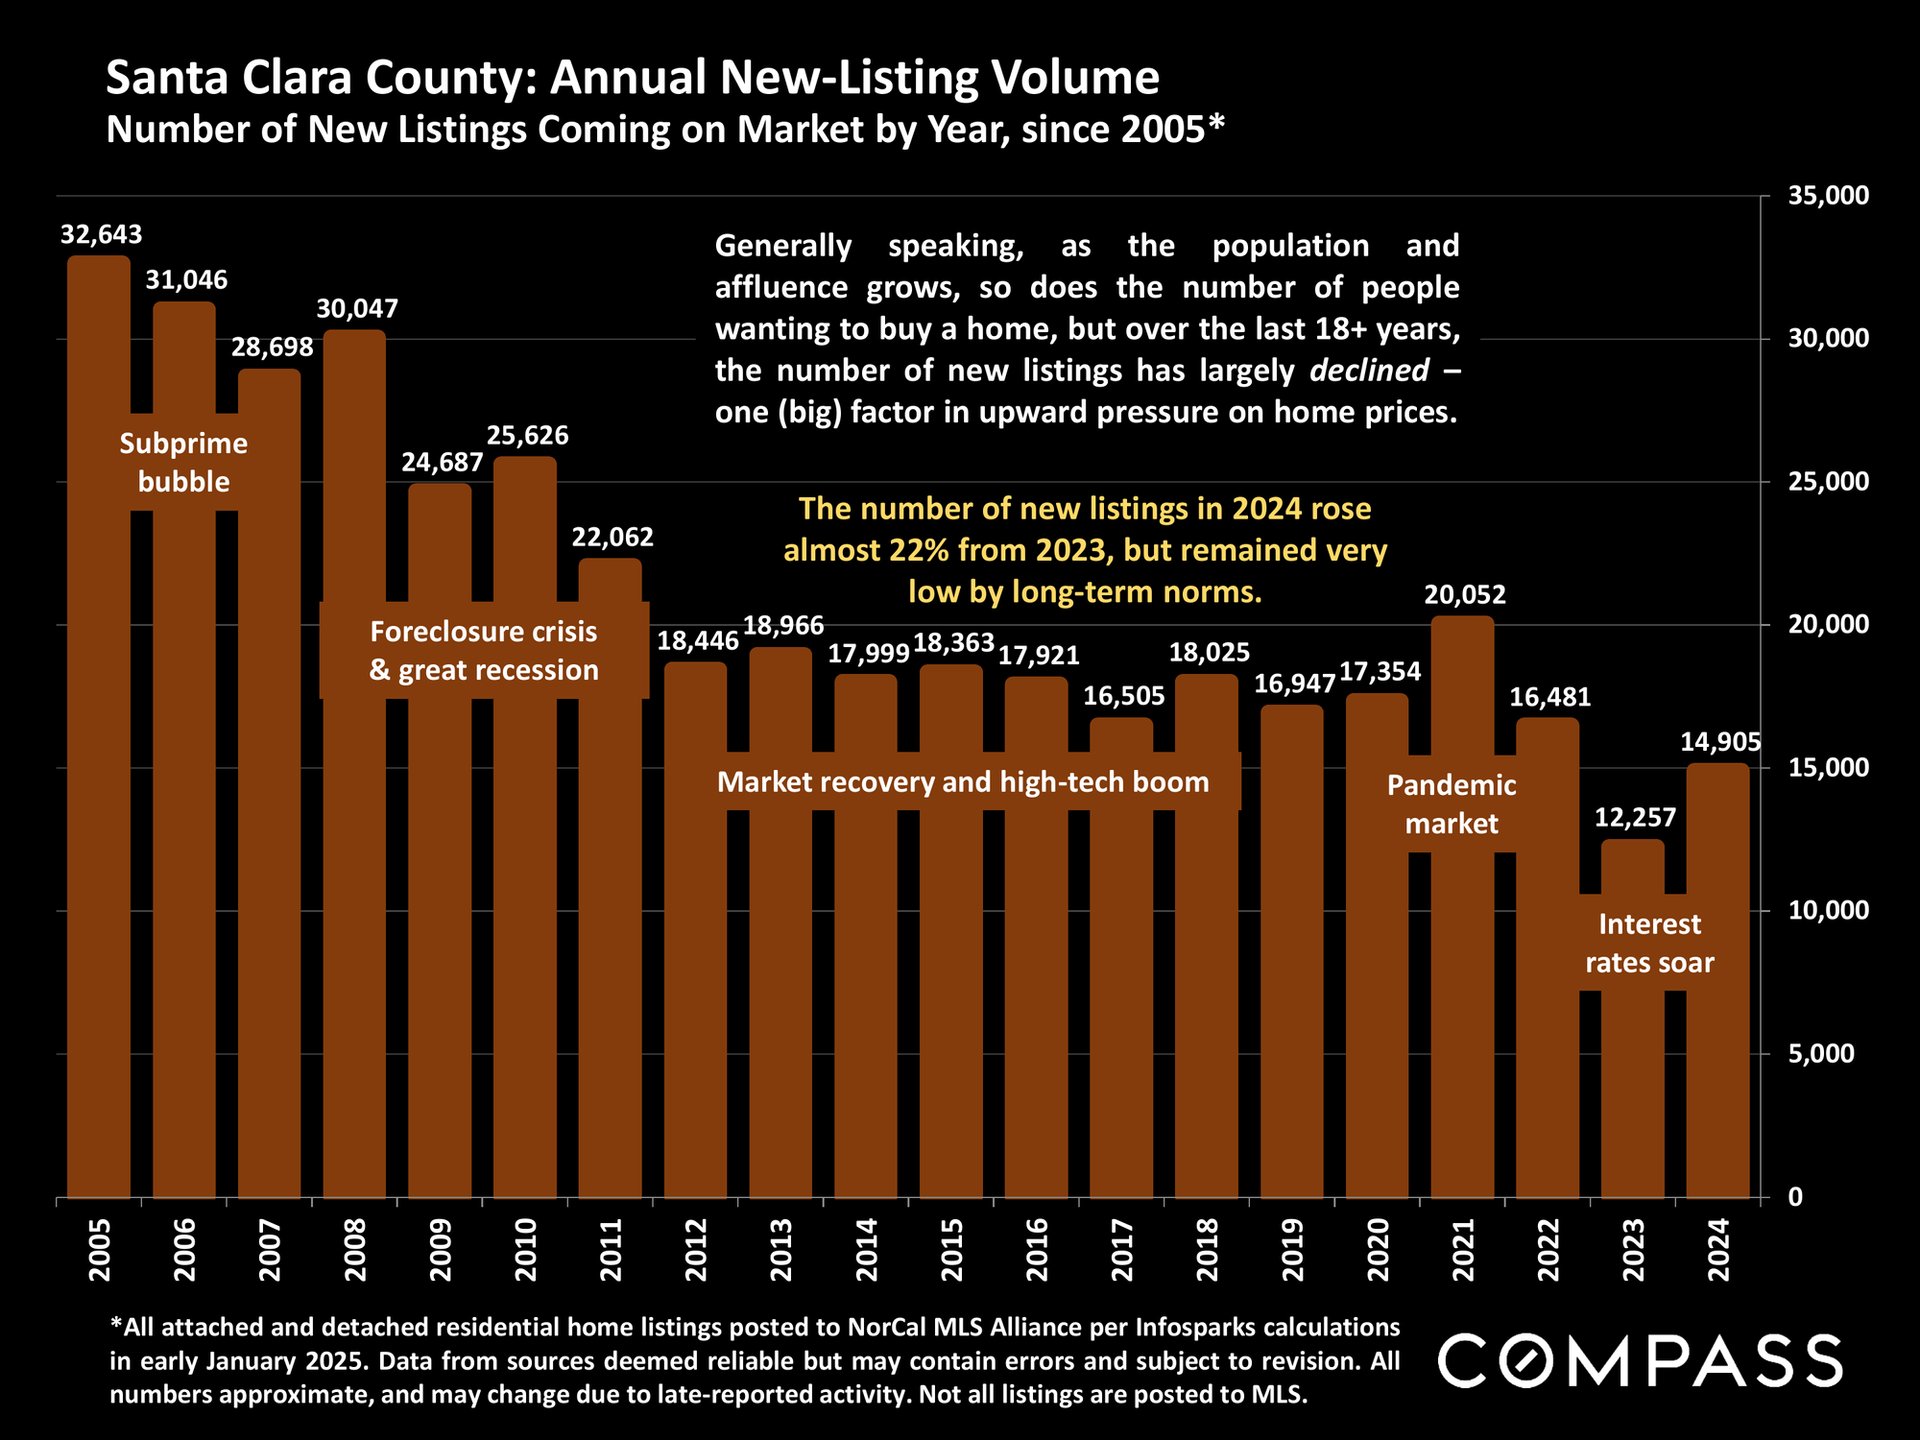
Bar chart of Santa Clara County new listings, 2005–2024, rising from 12,257 in 2023 to 14,905 in 2024.
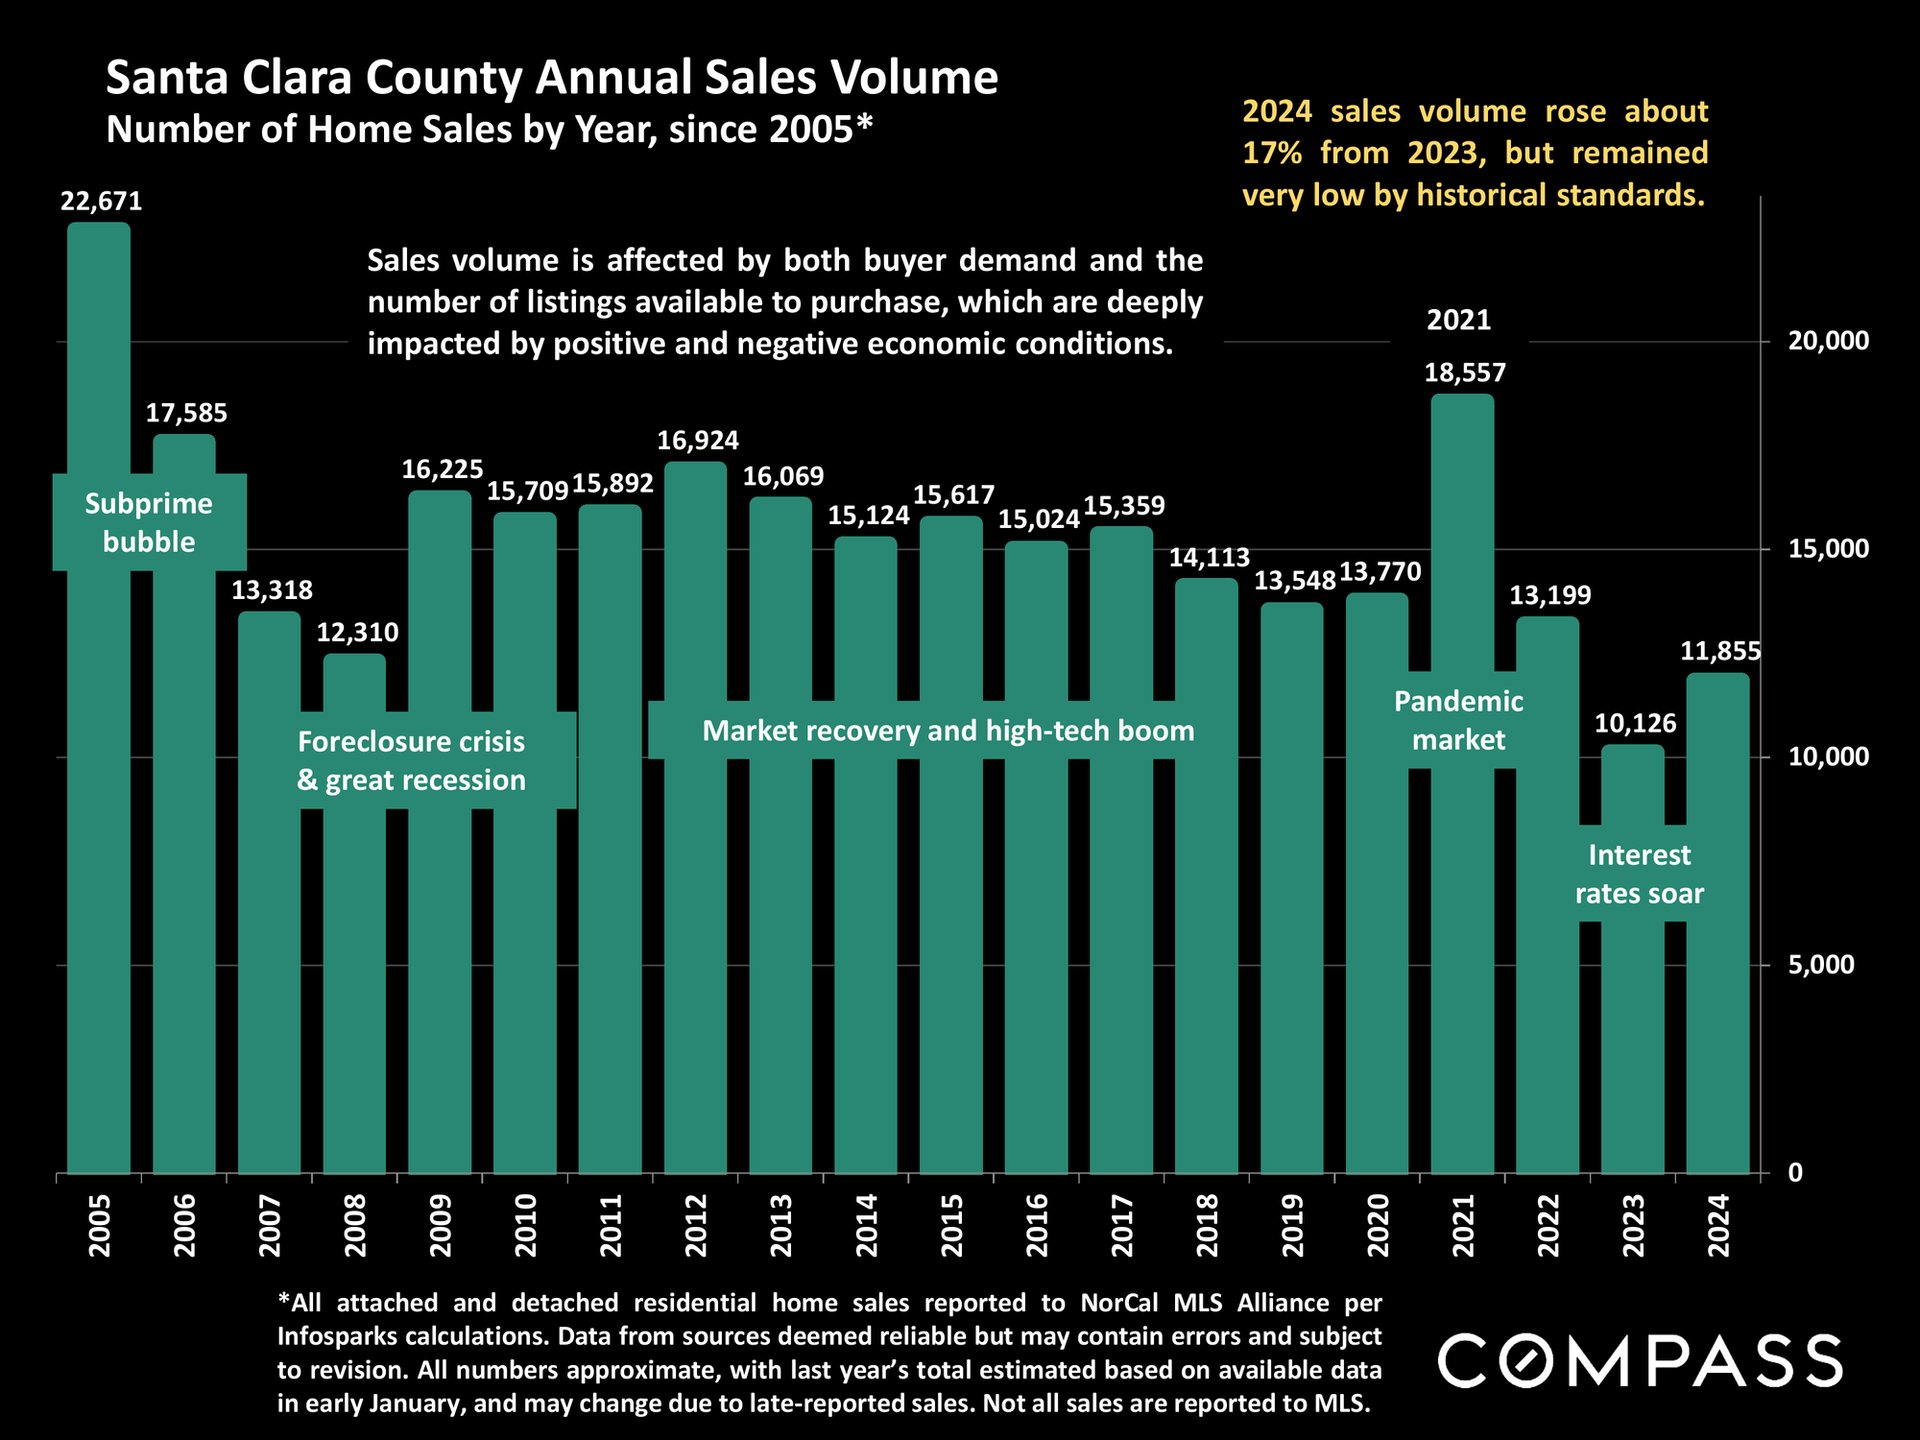
Santa Clara County home sales chart, 2005–2024; 2024 sales rose 17% from 2023.
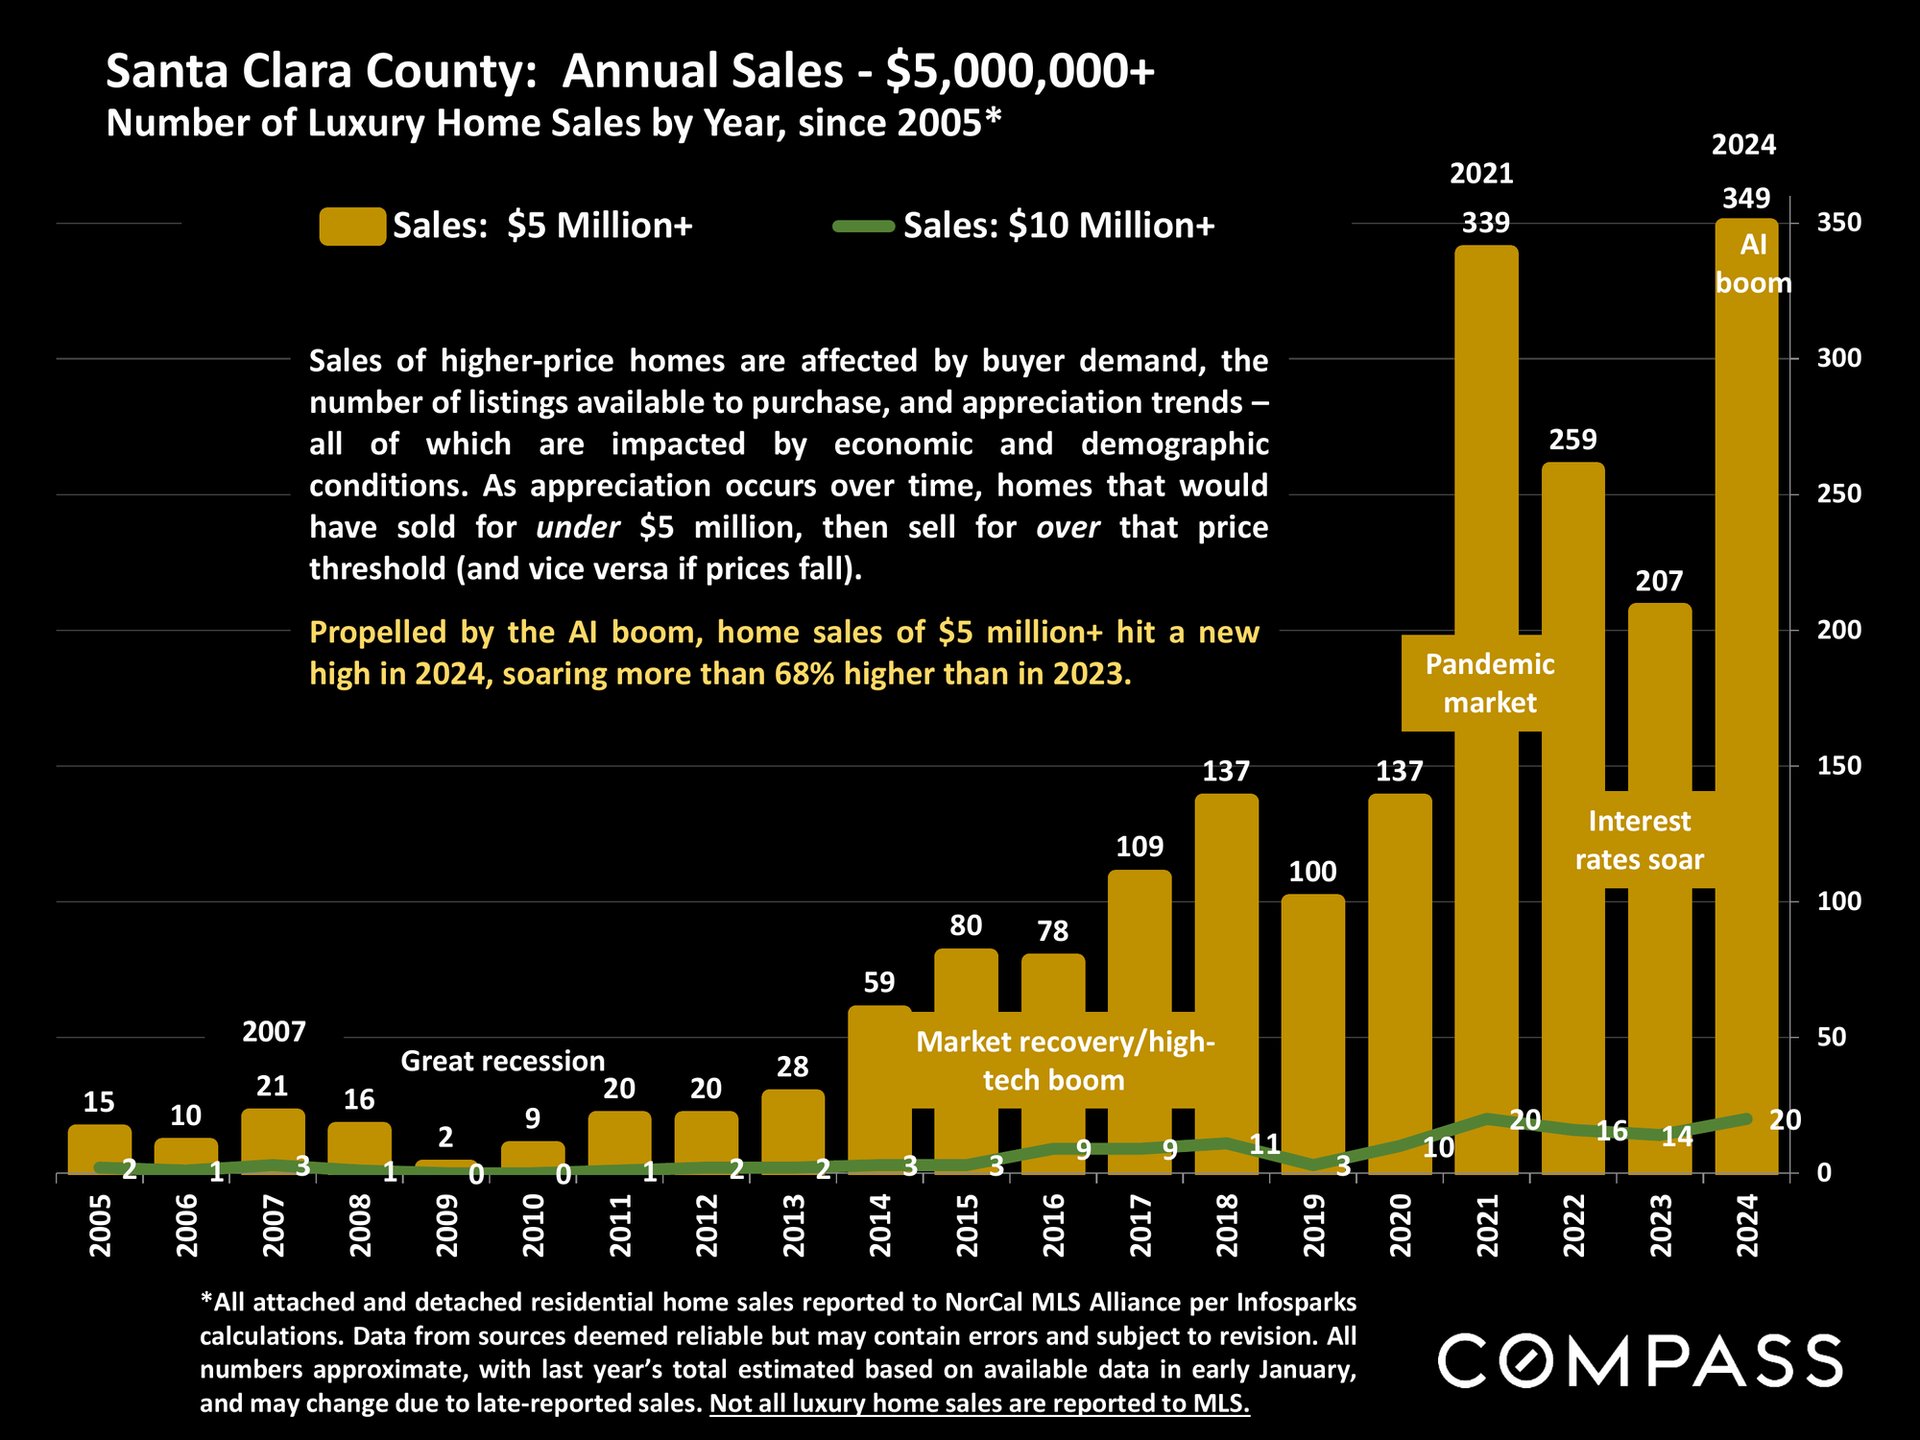
Santa Clara County luxury home sales chart, 2005–2024, with a record 349 sales over $5 million in 2024.
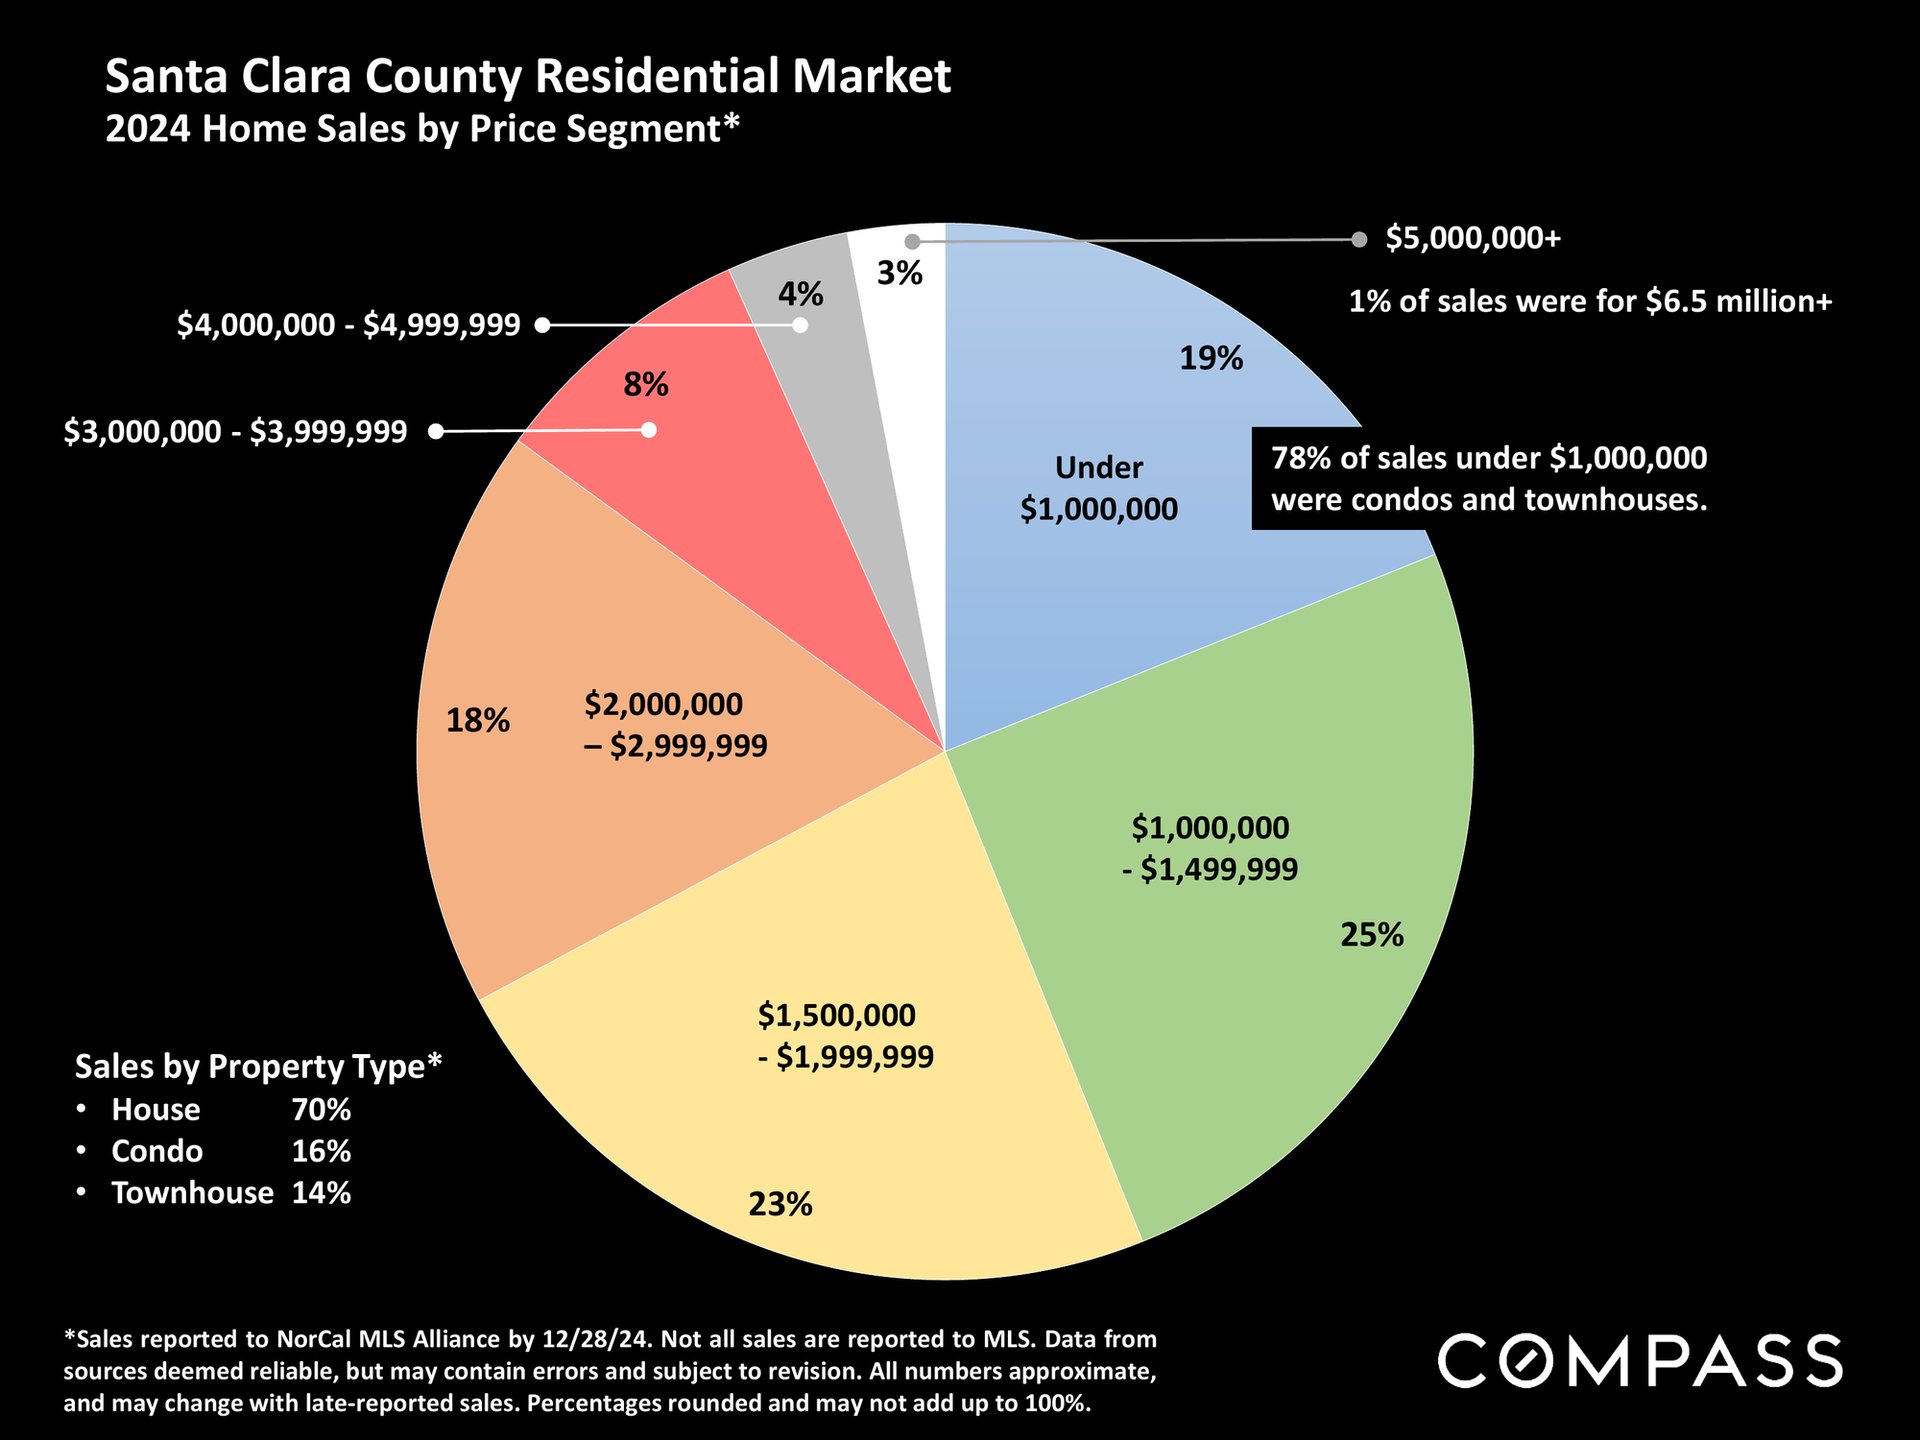
Pie chart of Santa Clara County 2024 home sales by price range, with property-type shares and notes on lower-priced sales.
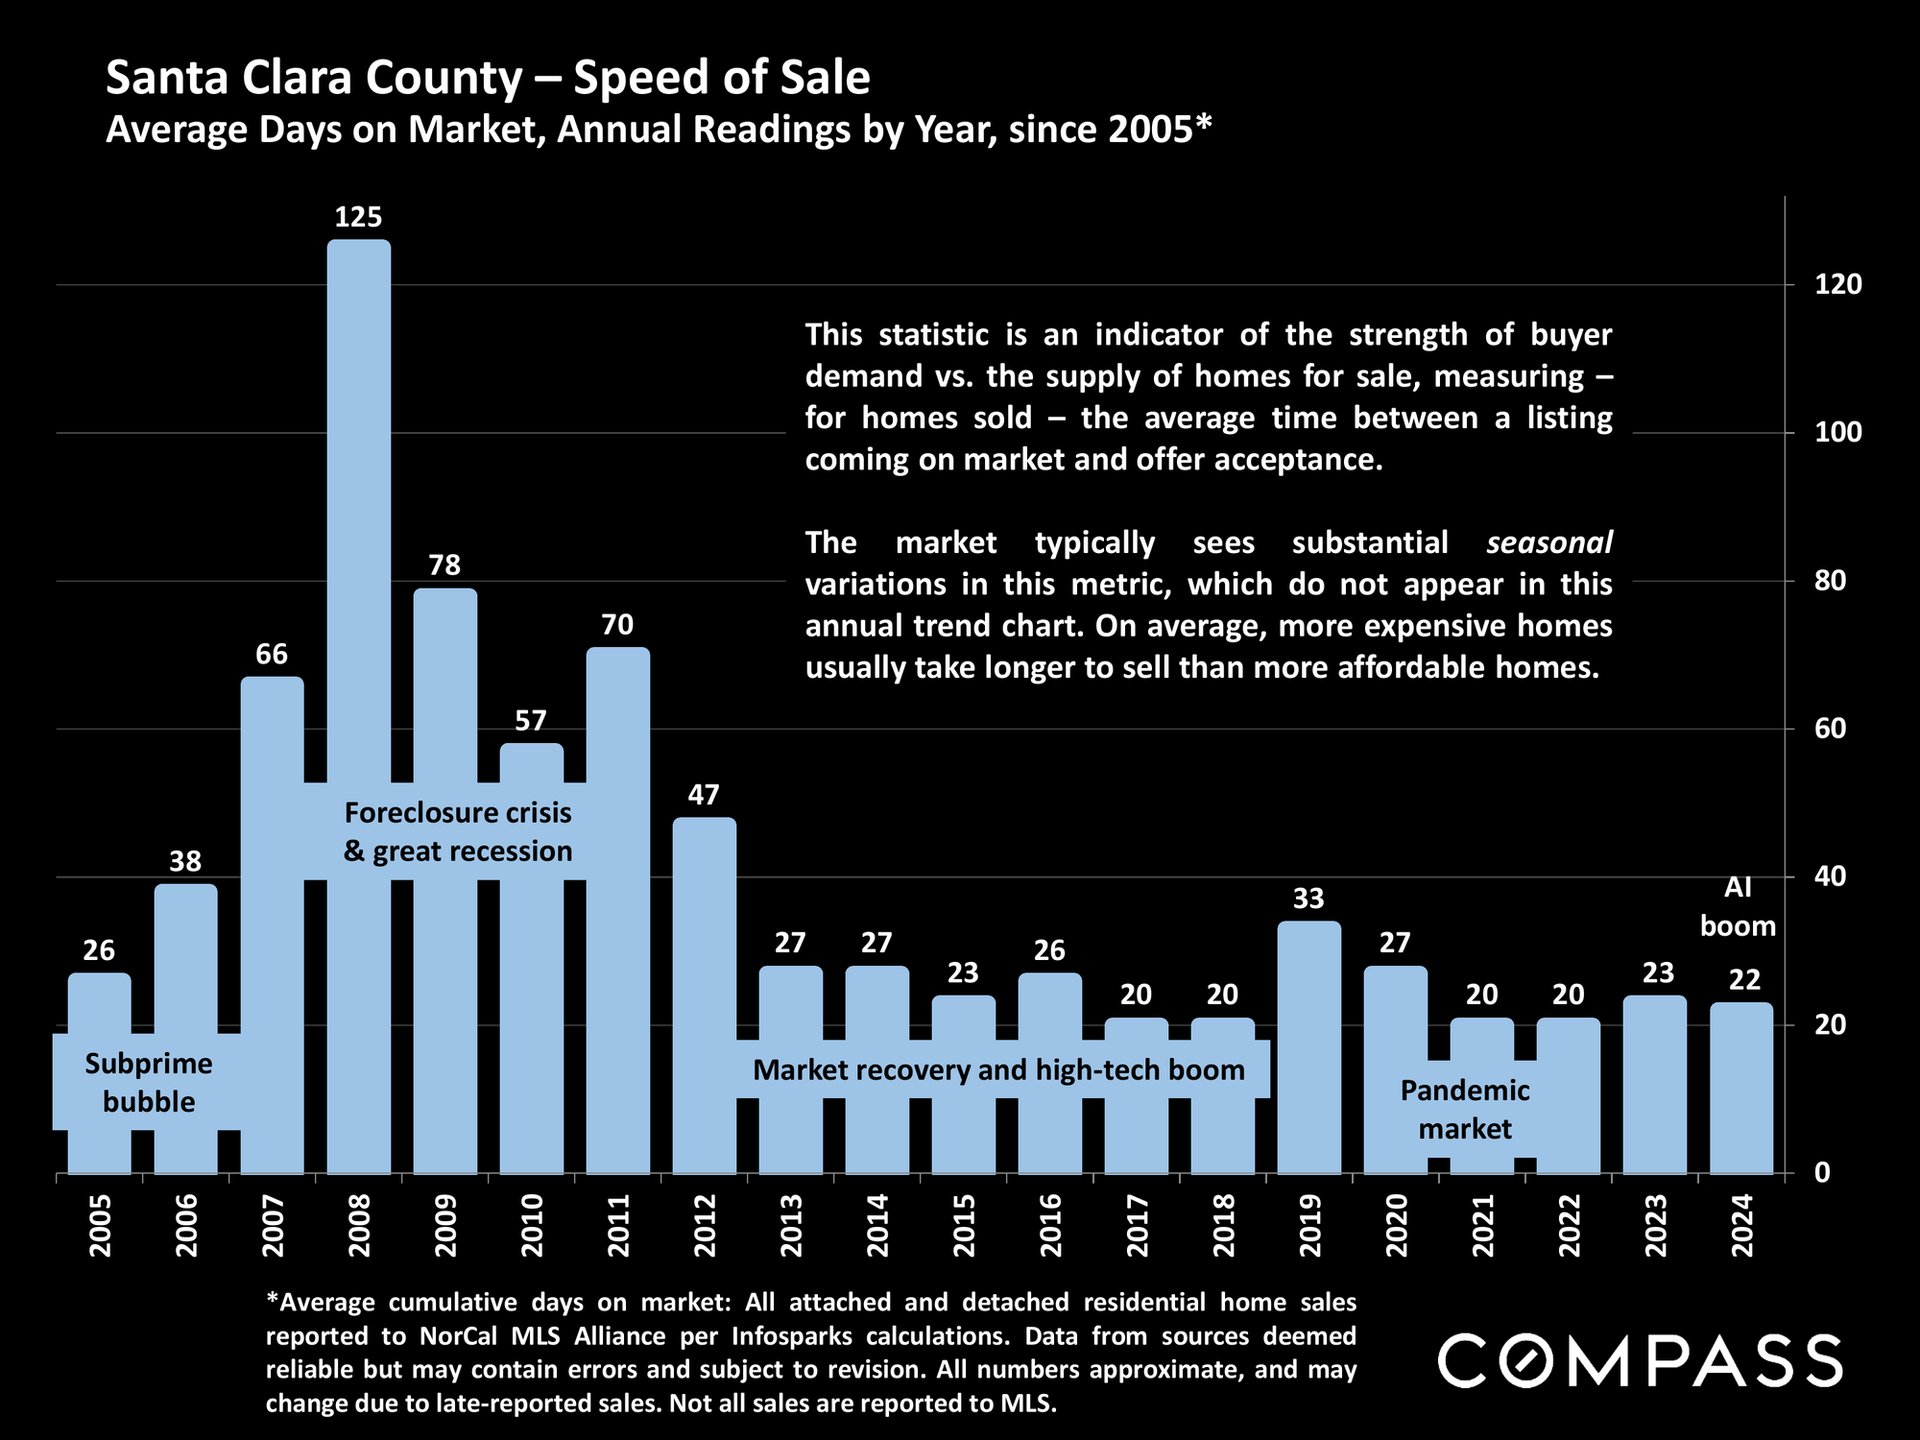
Bar chart of Santa Clara County days on market, peaking at 125 days in 2008.
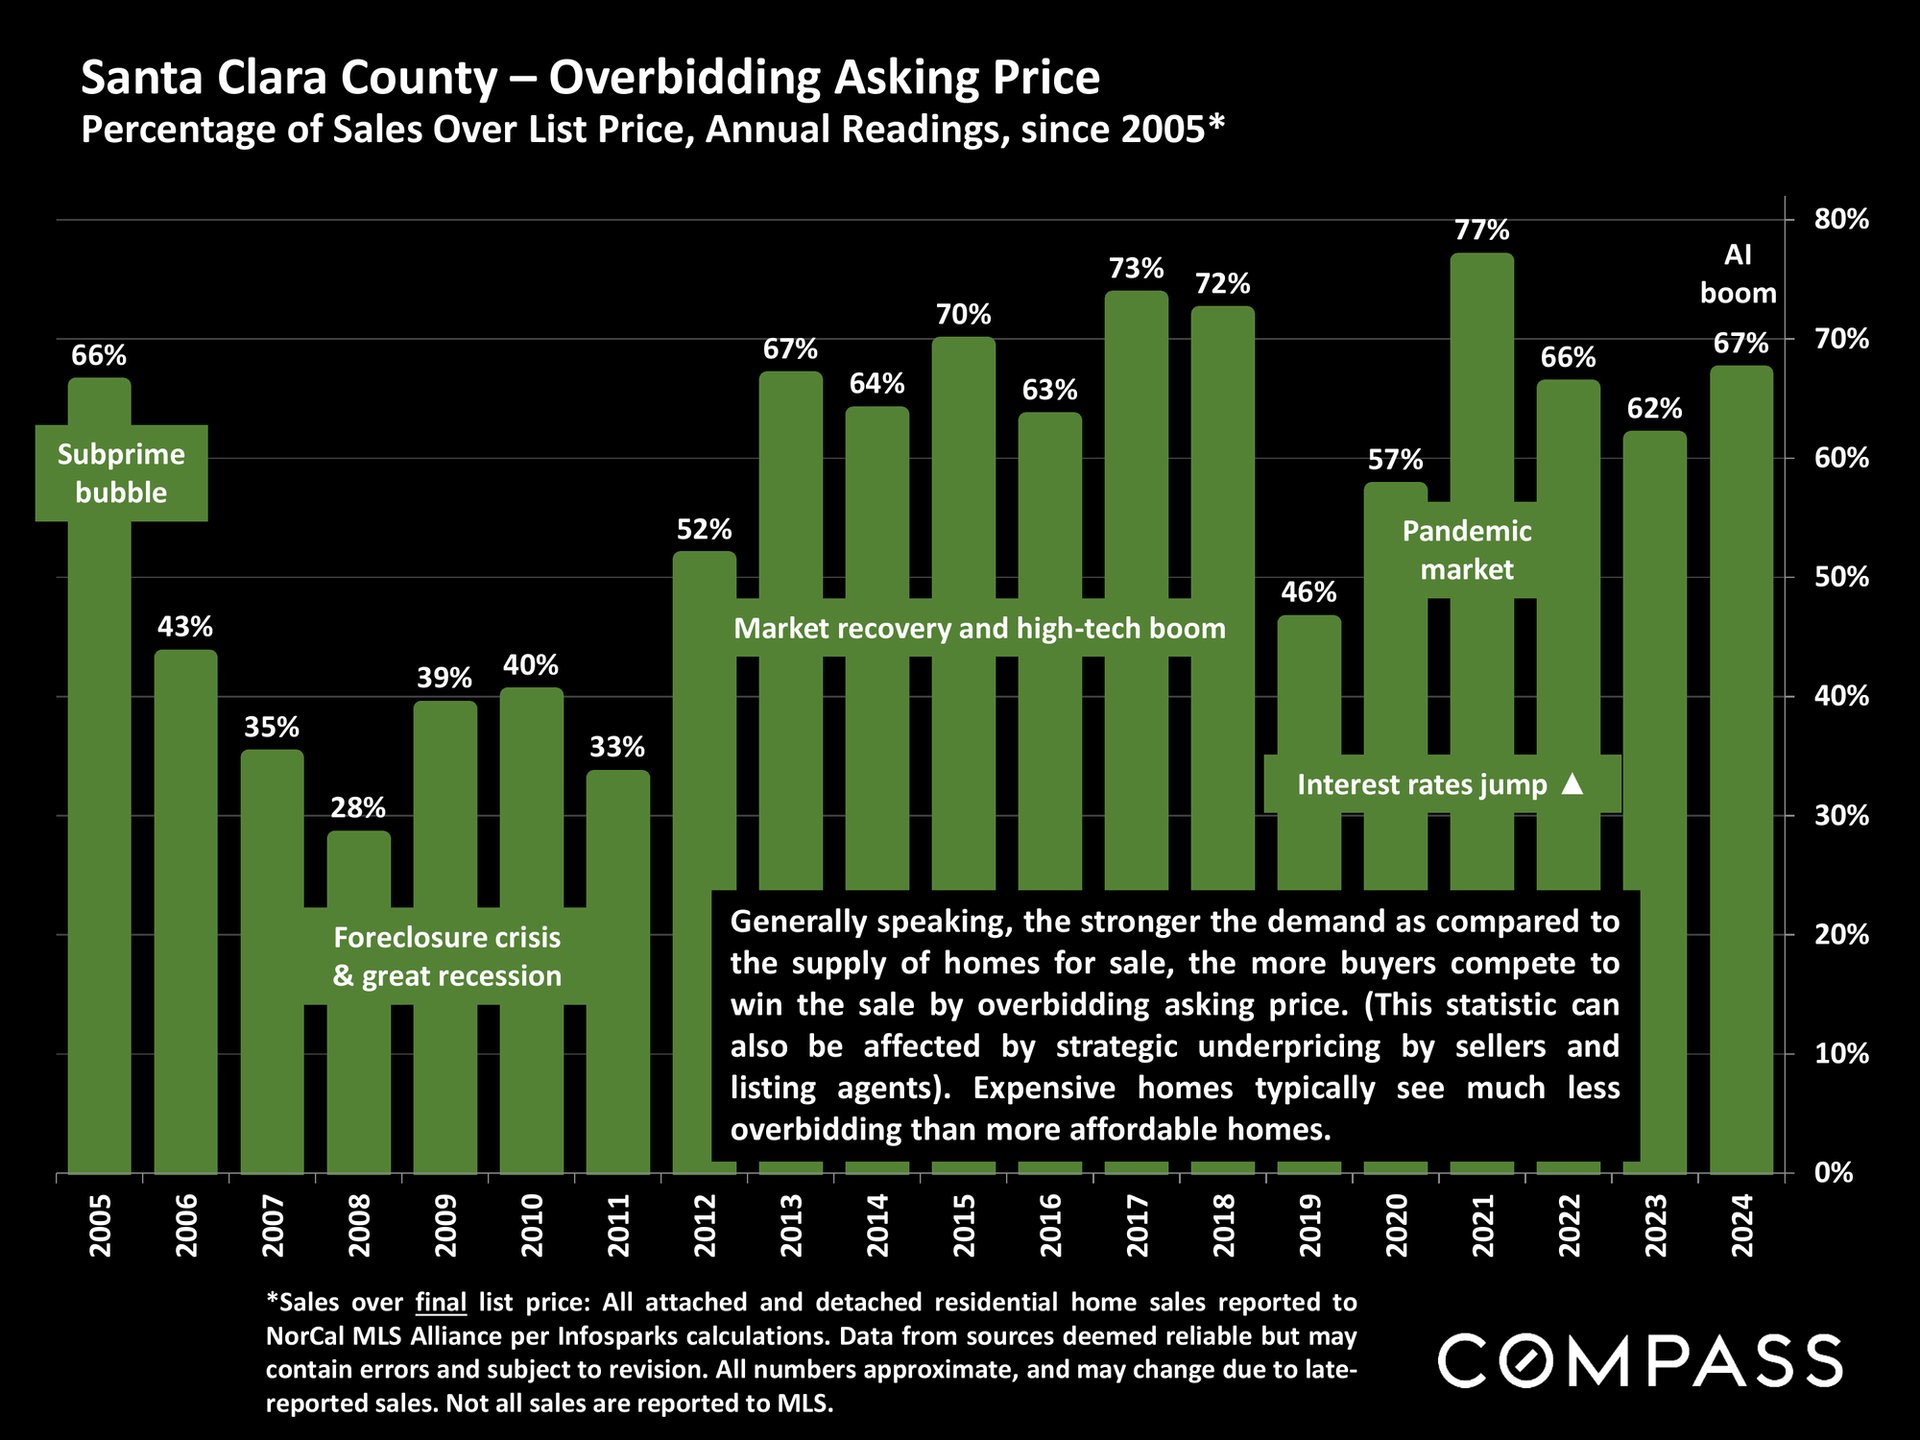
Santa Clara County chart of annual home sales over list price, 2005–2024, with market-period annotations.
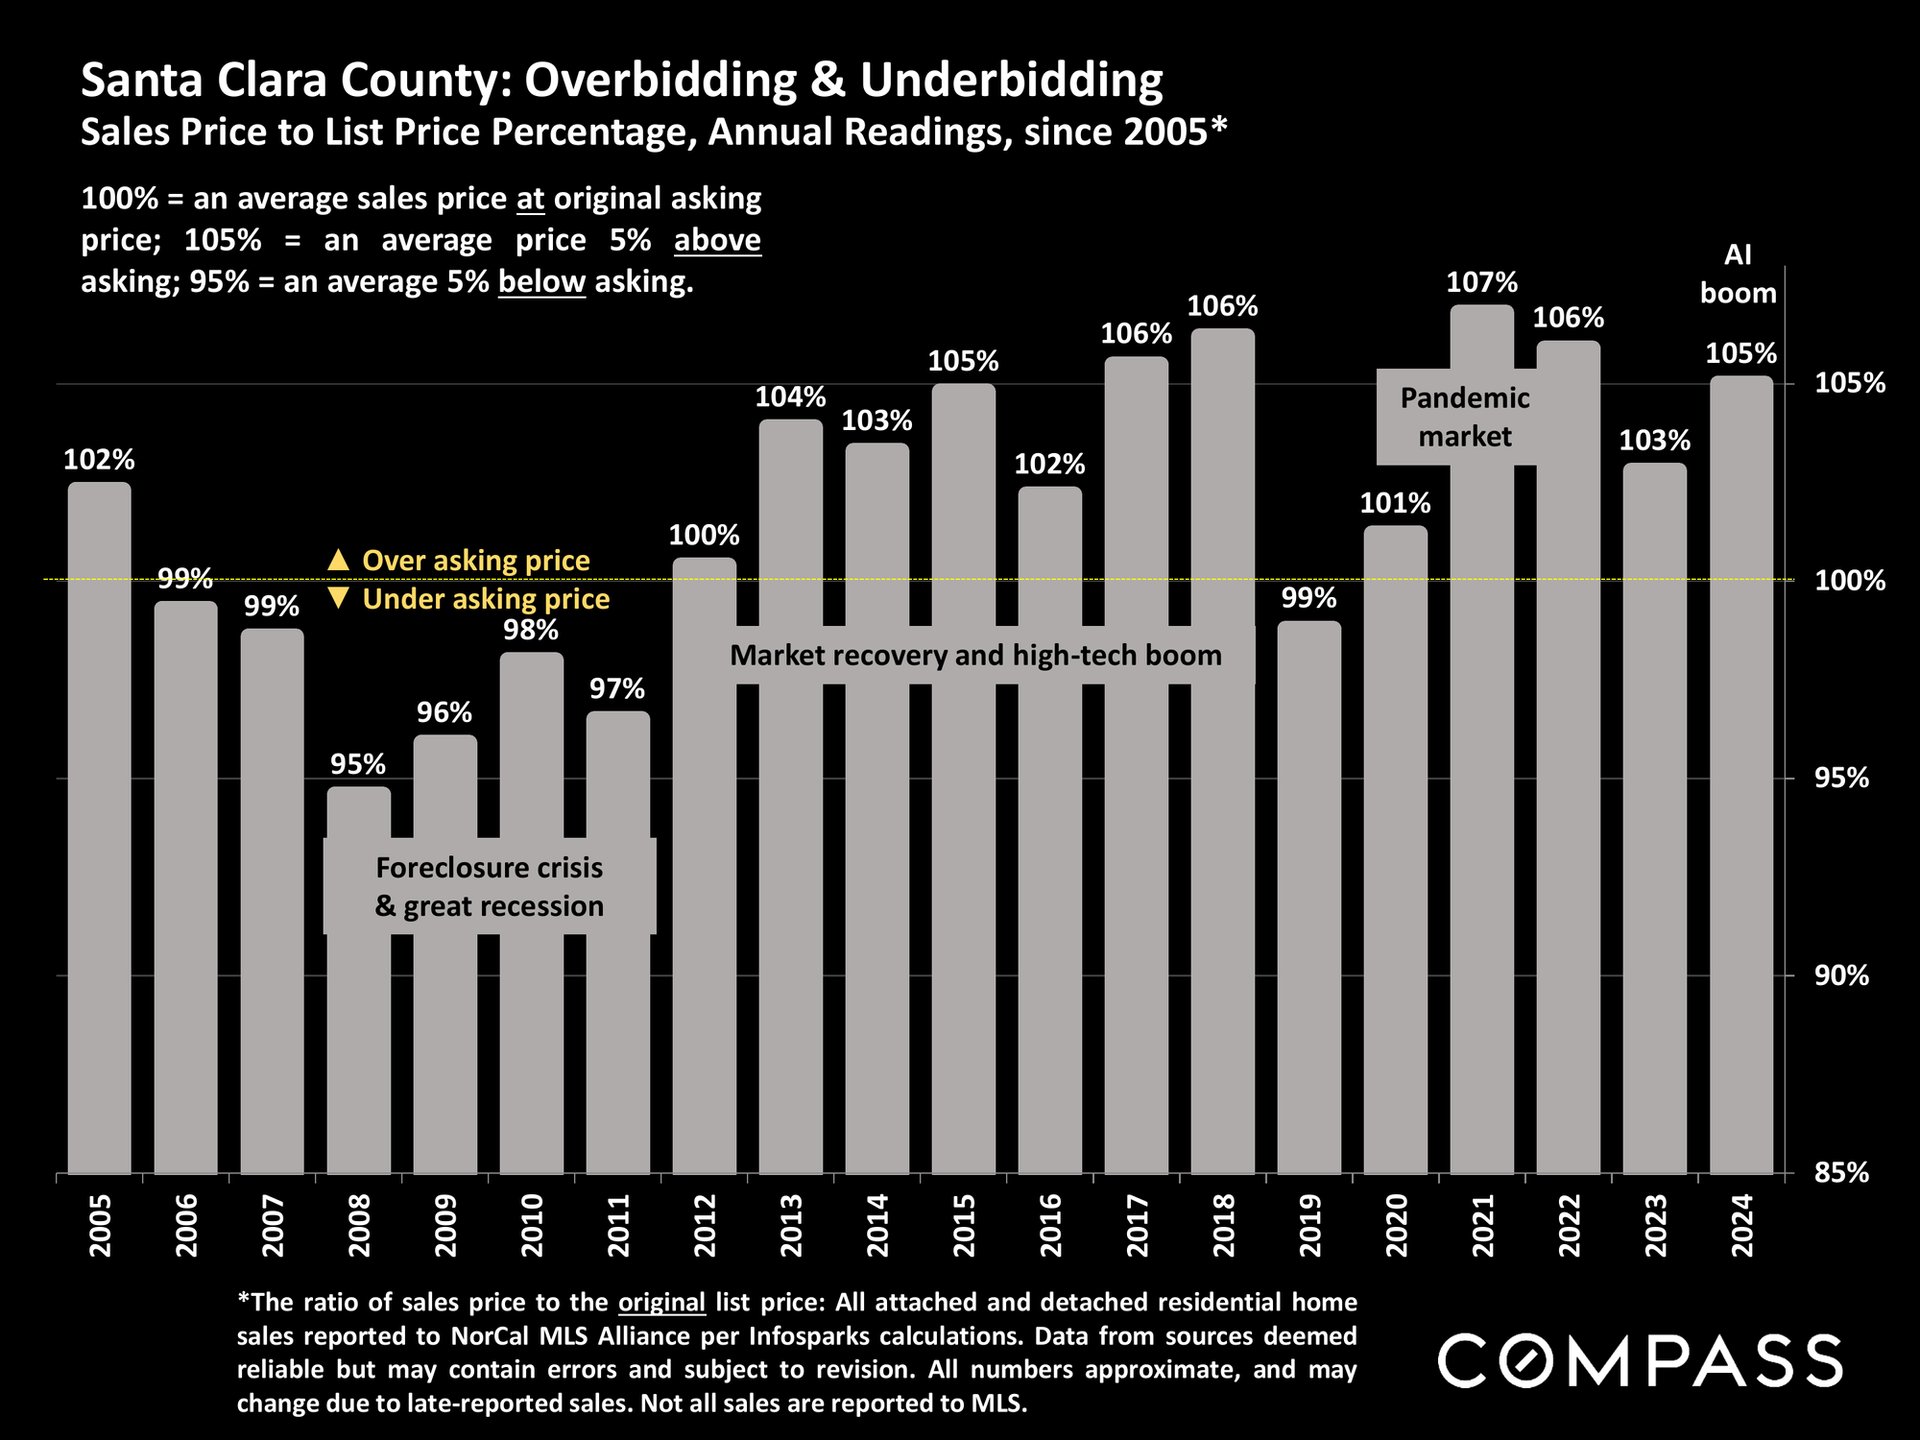
Santa Clara County annual sale-to-list price percentages, 2005–2024, peaking at 107% in 2021.
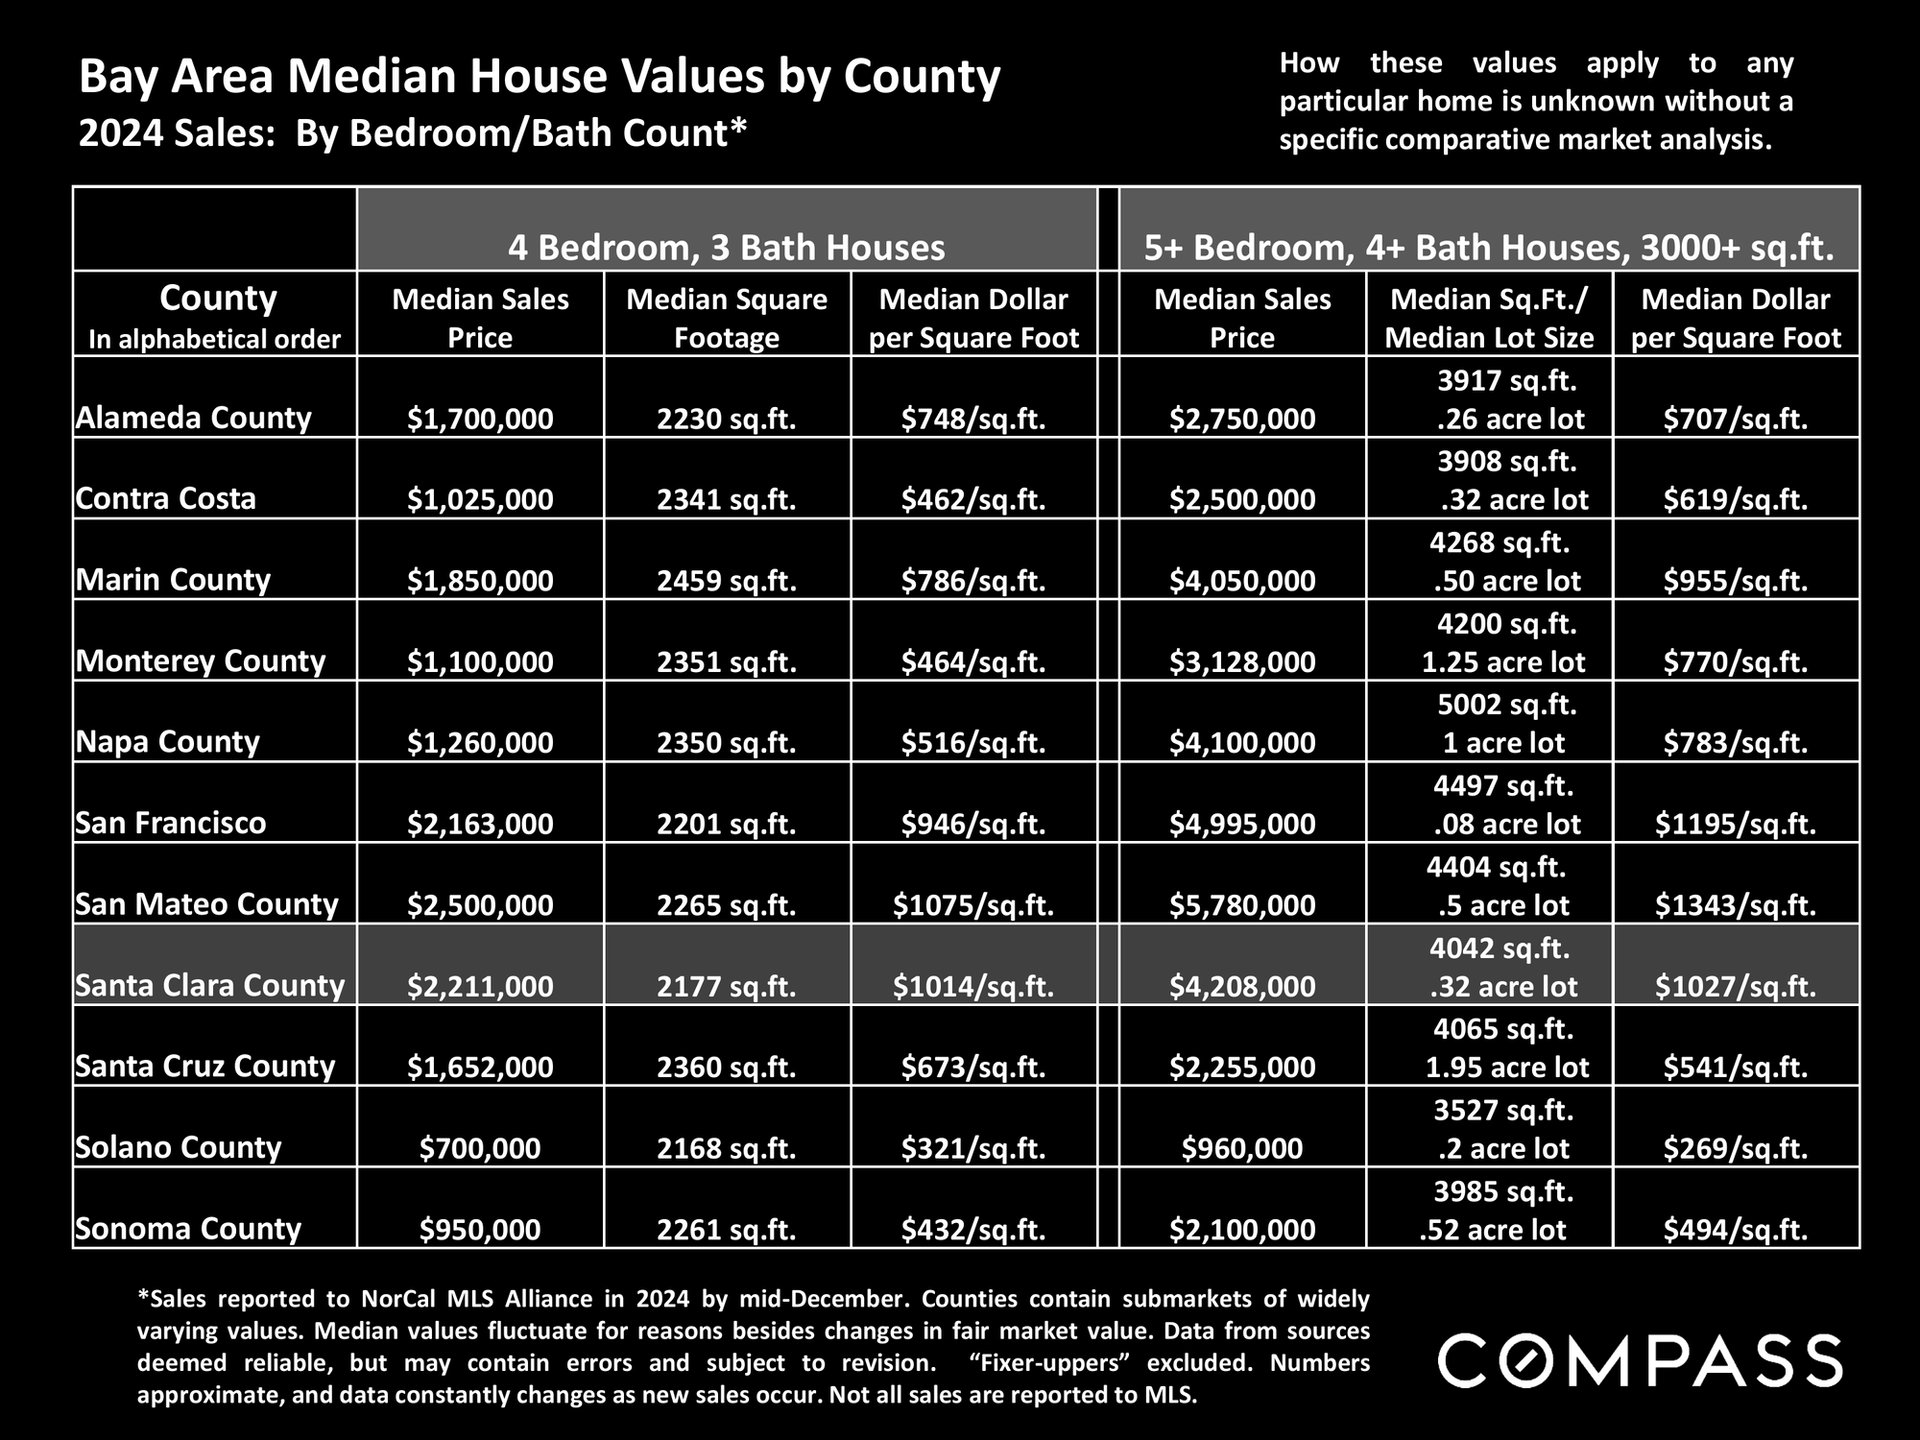
Table of 2024 Bay Area median home values by county and bedroom count, with Santa Clara County highlighted.
Bay Area county home-value table for 2024, with Santa Clara County highlighted.
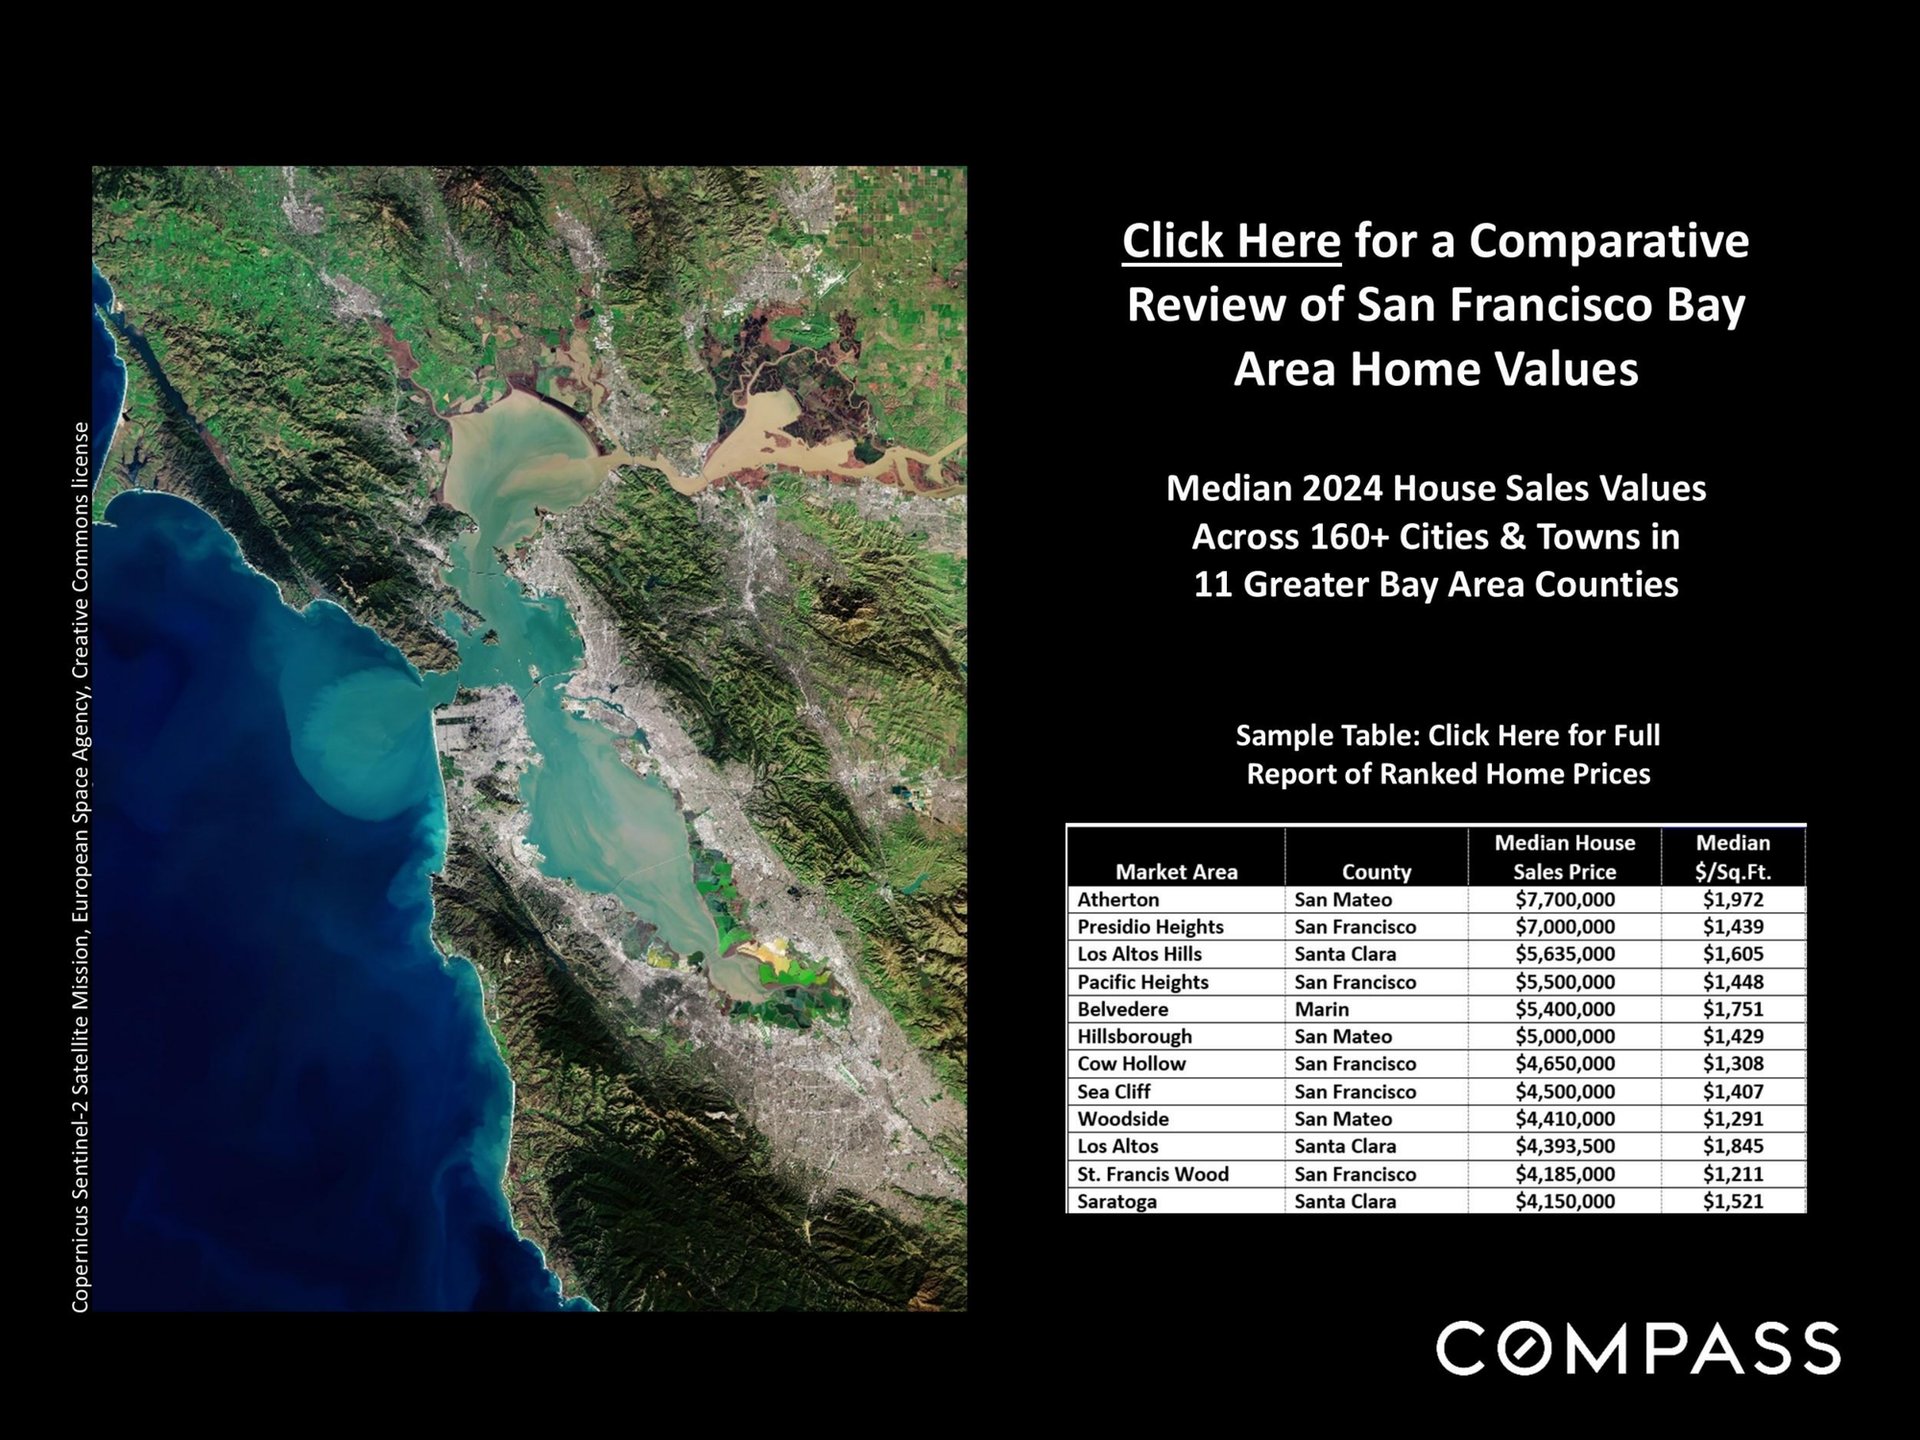
Bay Area home values infographic with a satellite map and sample table of 2024 median sale prices.
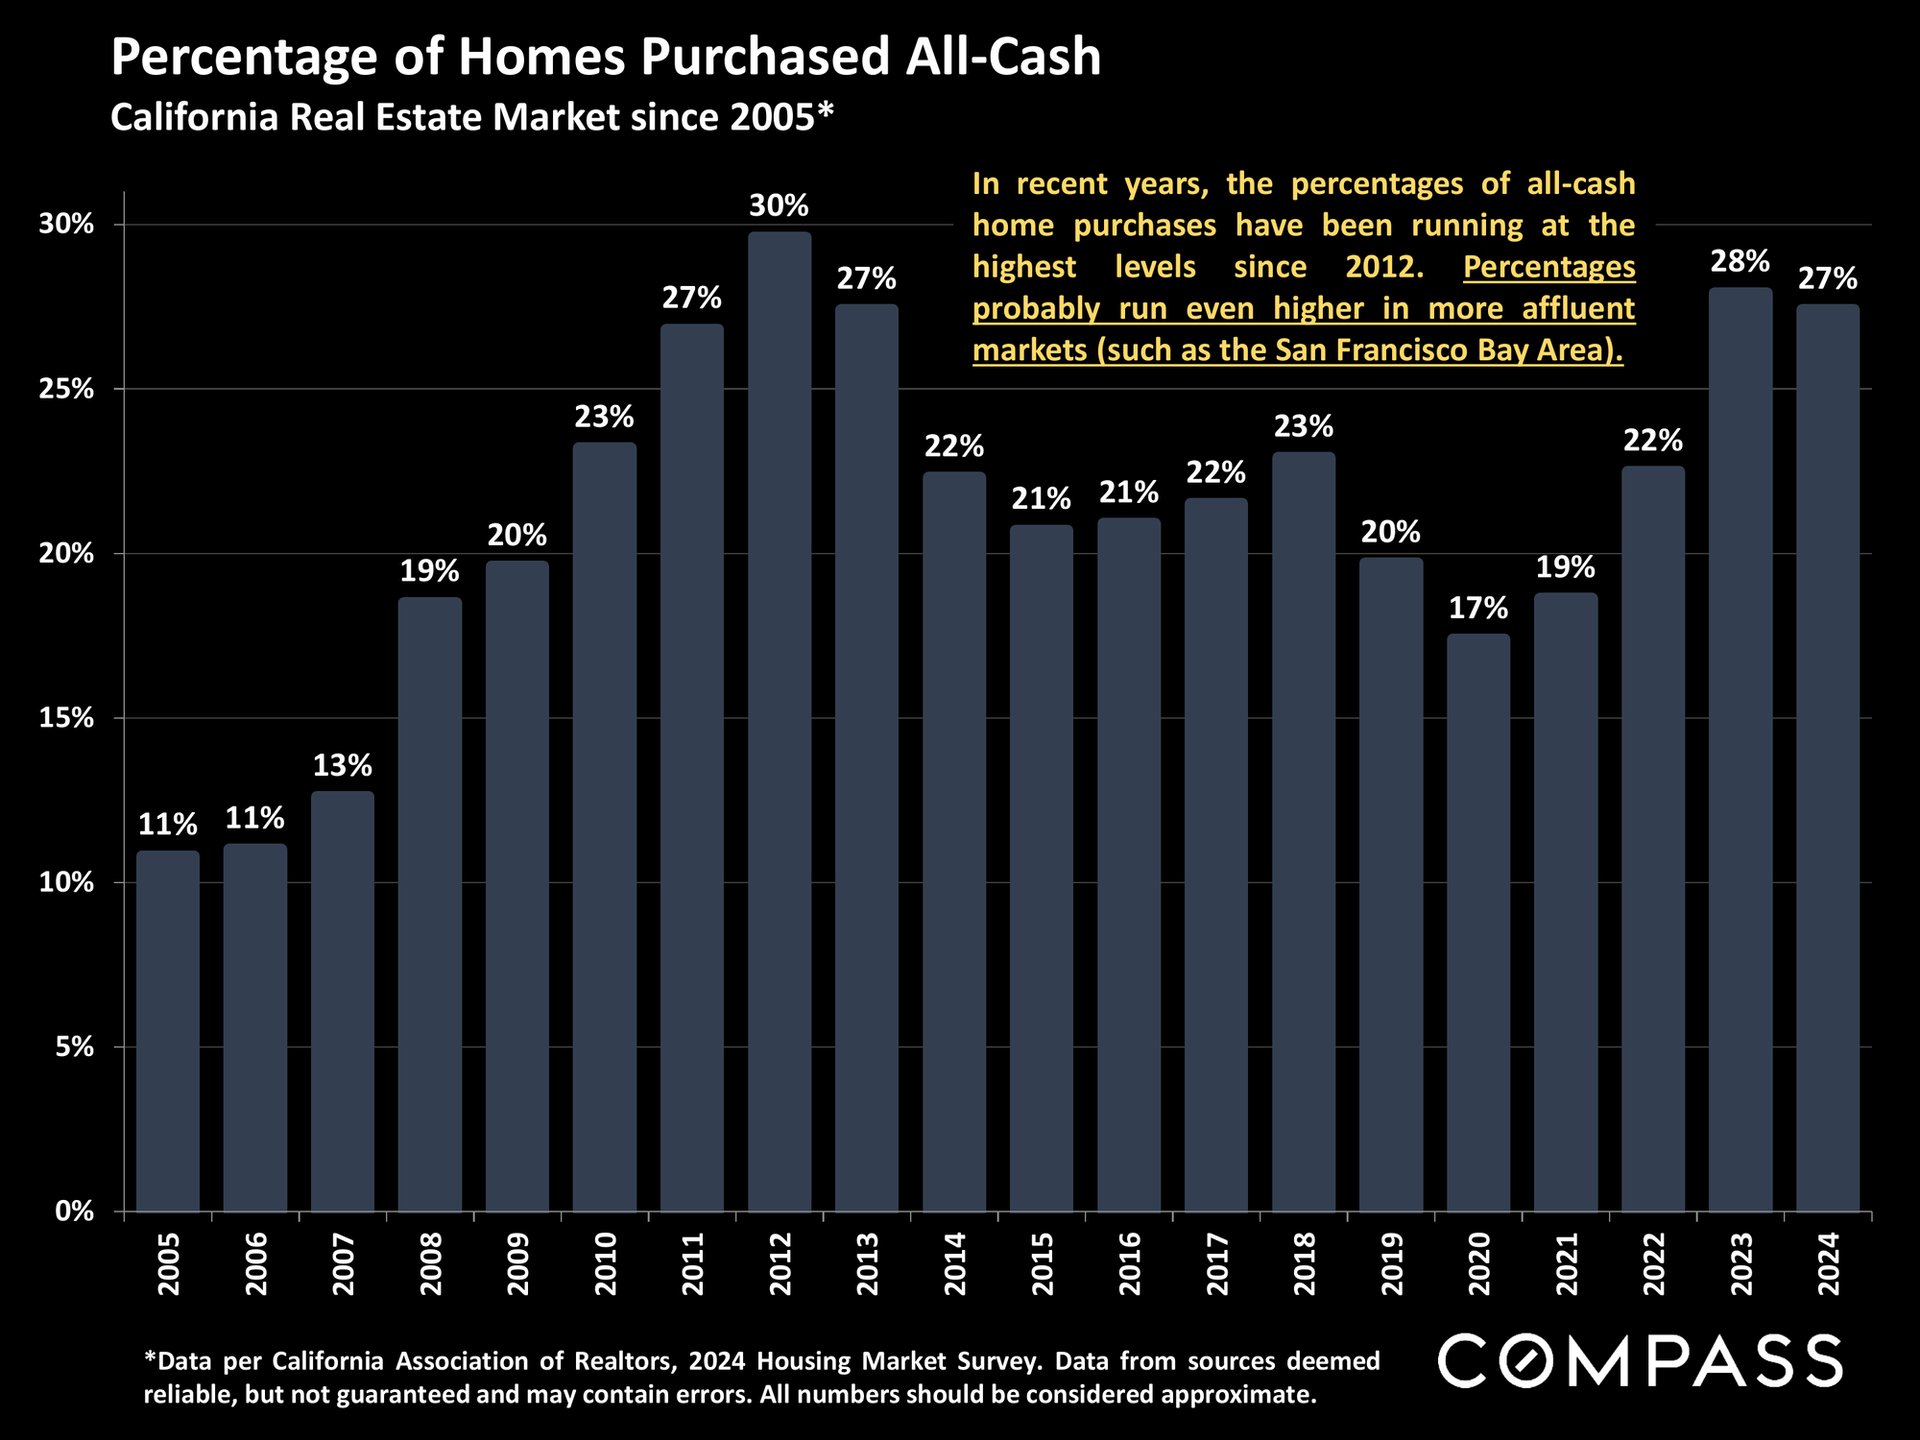
Bar chart of California all-cash home purchases, rising to 30% in 2012 and reaching 27% in 2024.
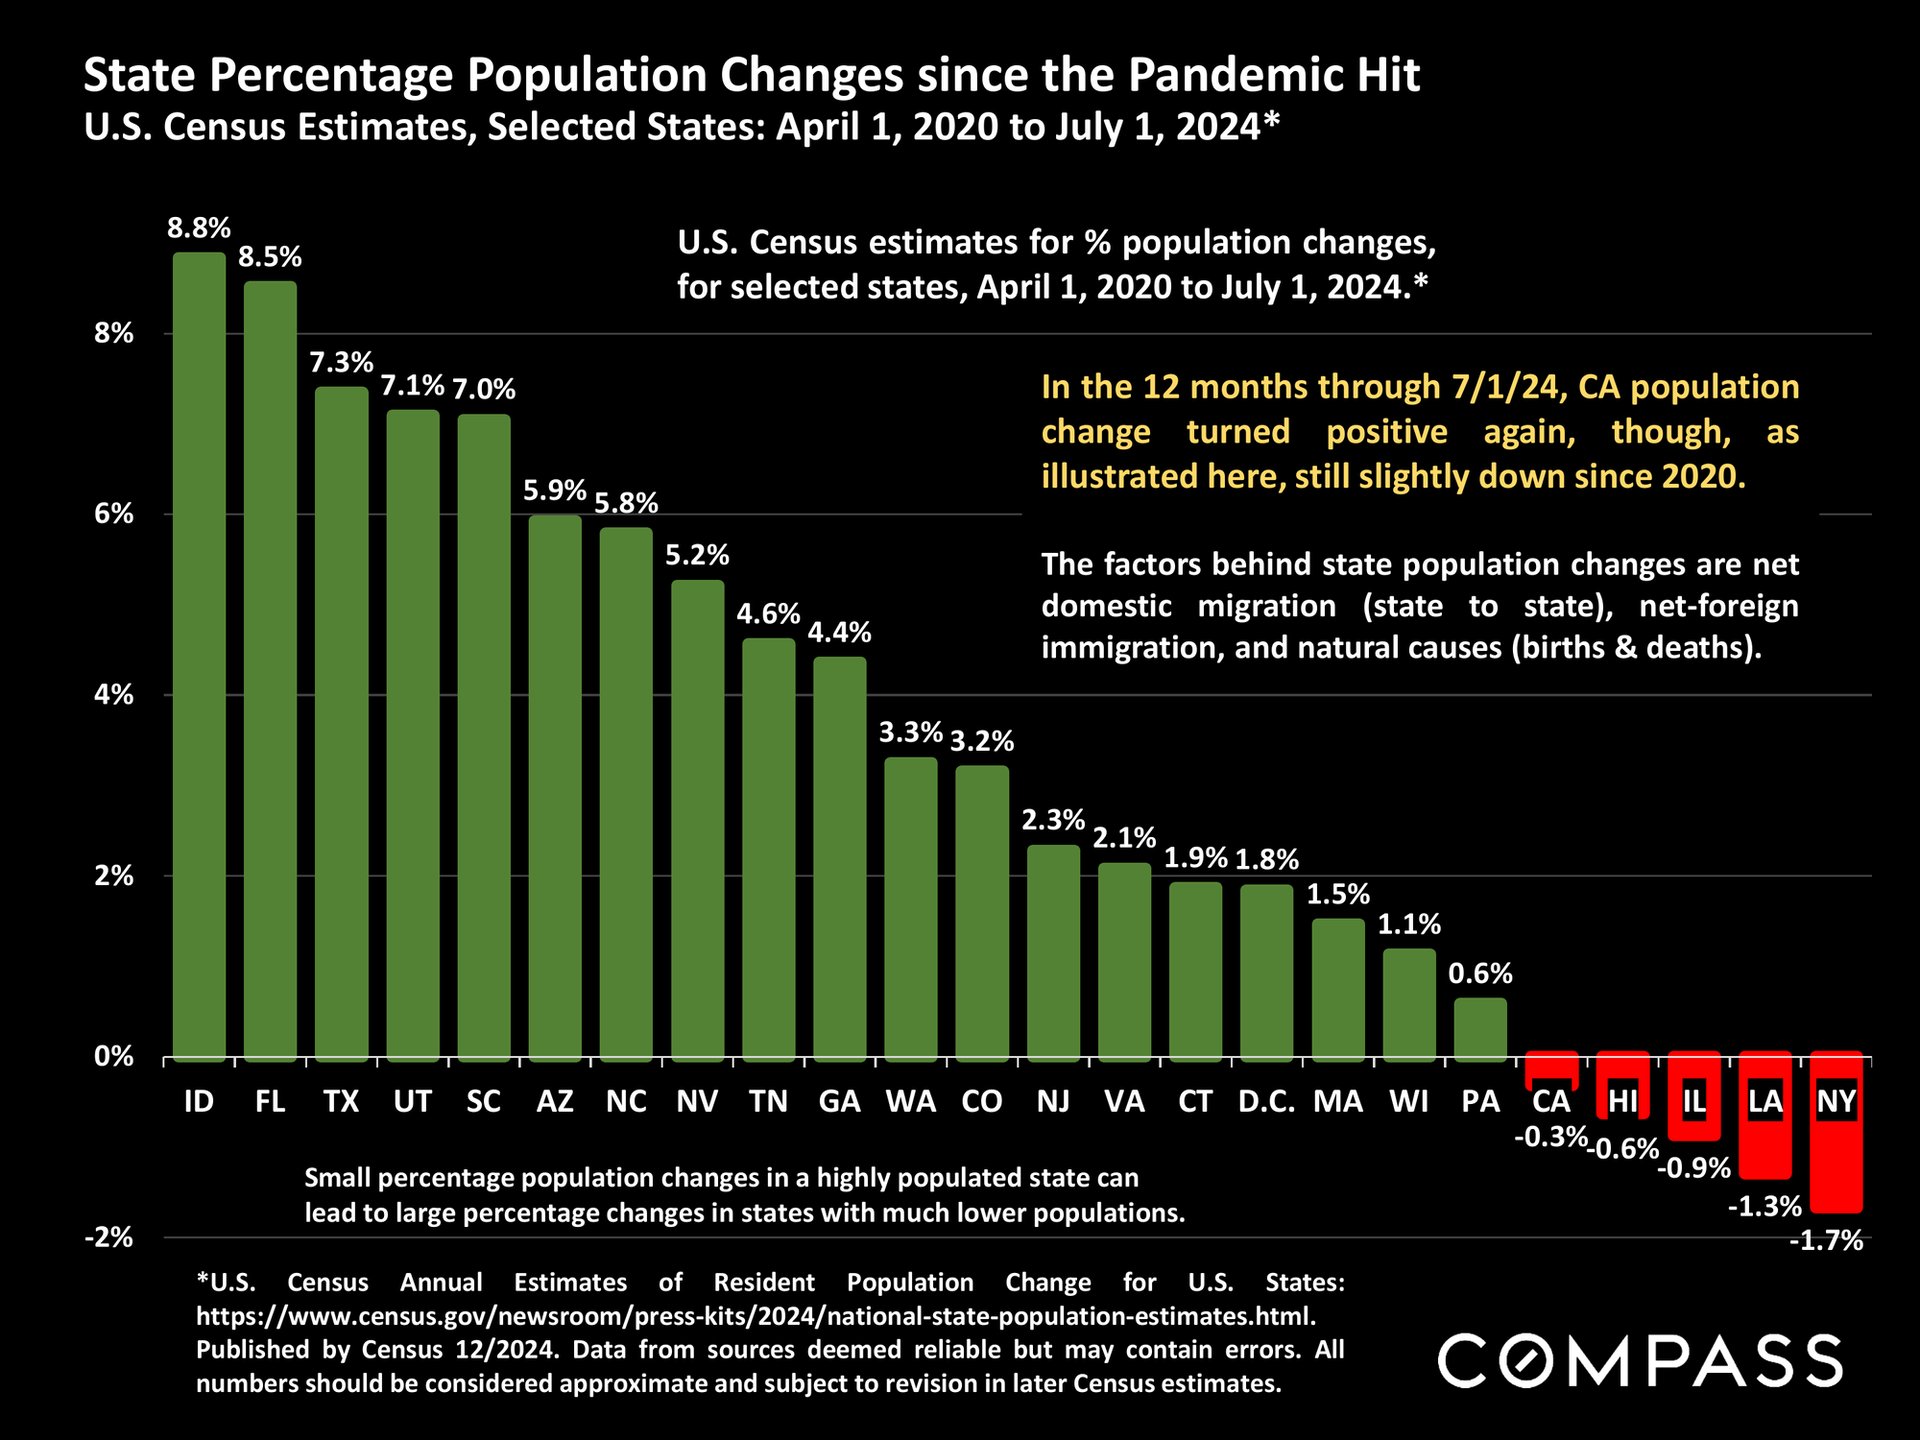
Chart comparing state population changes since 2020; Idaho leads at 8.8%, while New York declines 1.7%.
Bar chart shows insurance difficulties rose from 2023 to 2024 across five California property locations, highest for second homes.
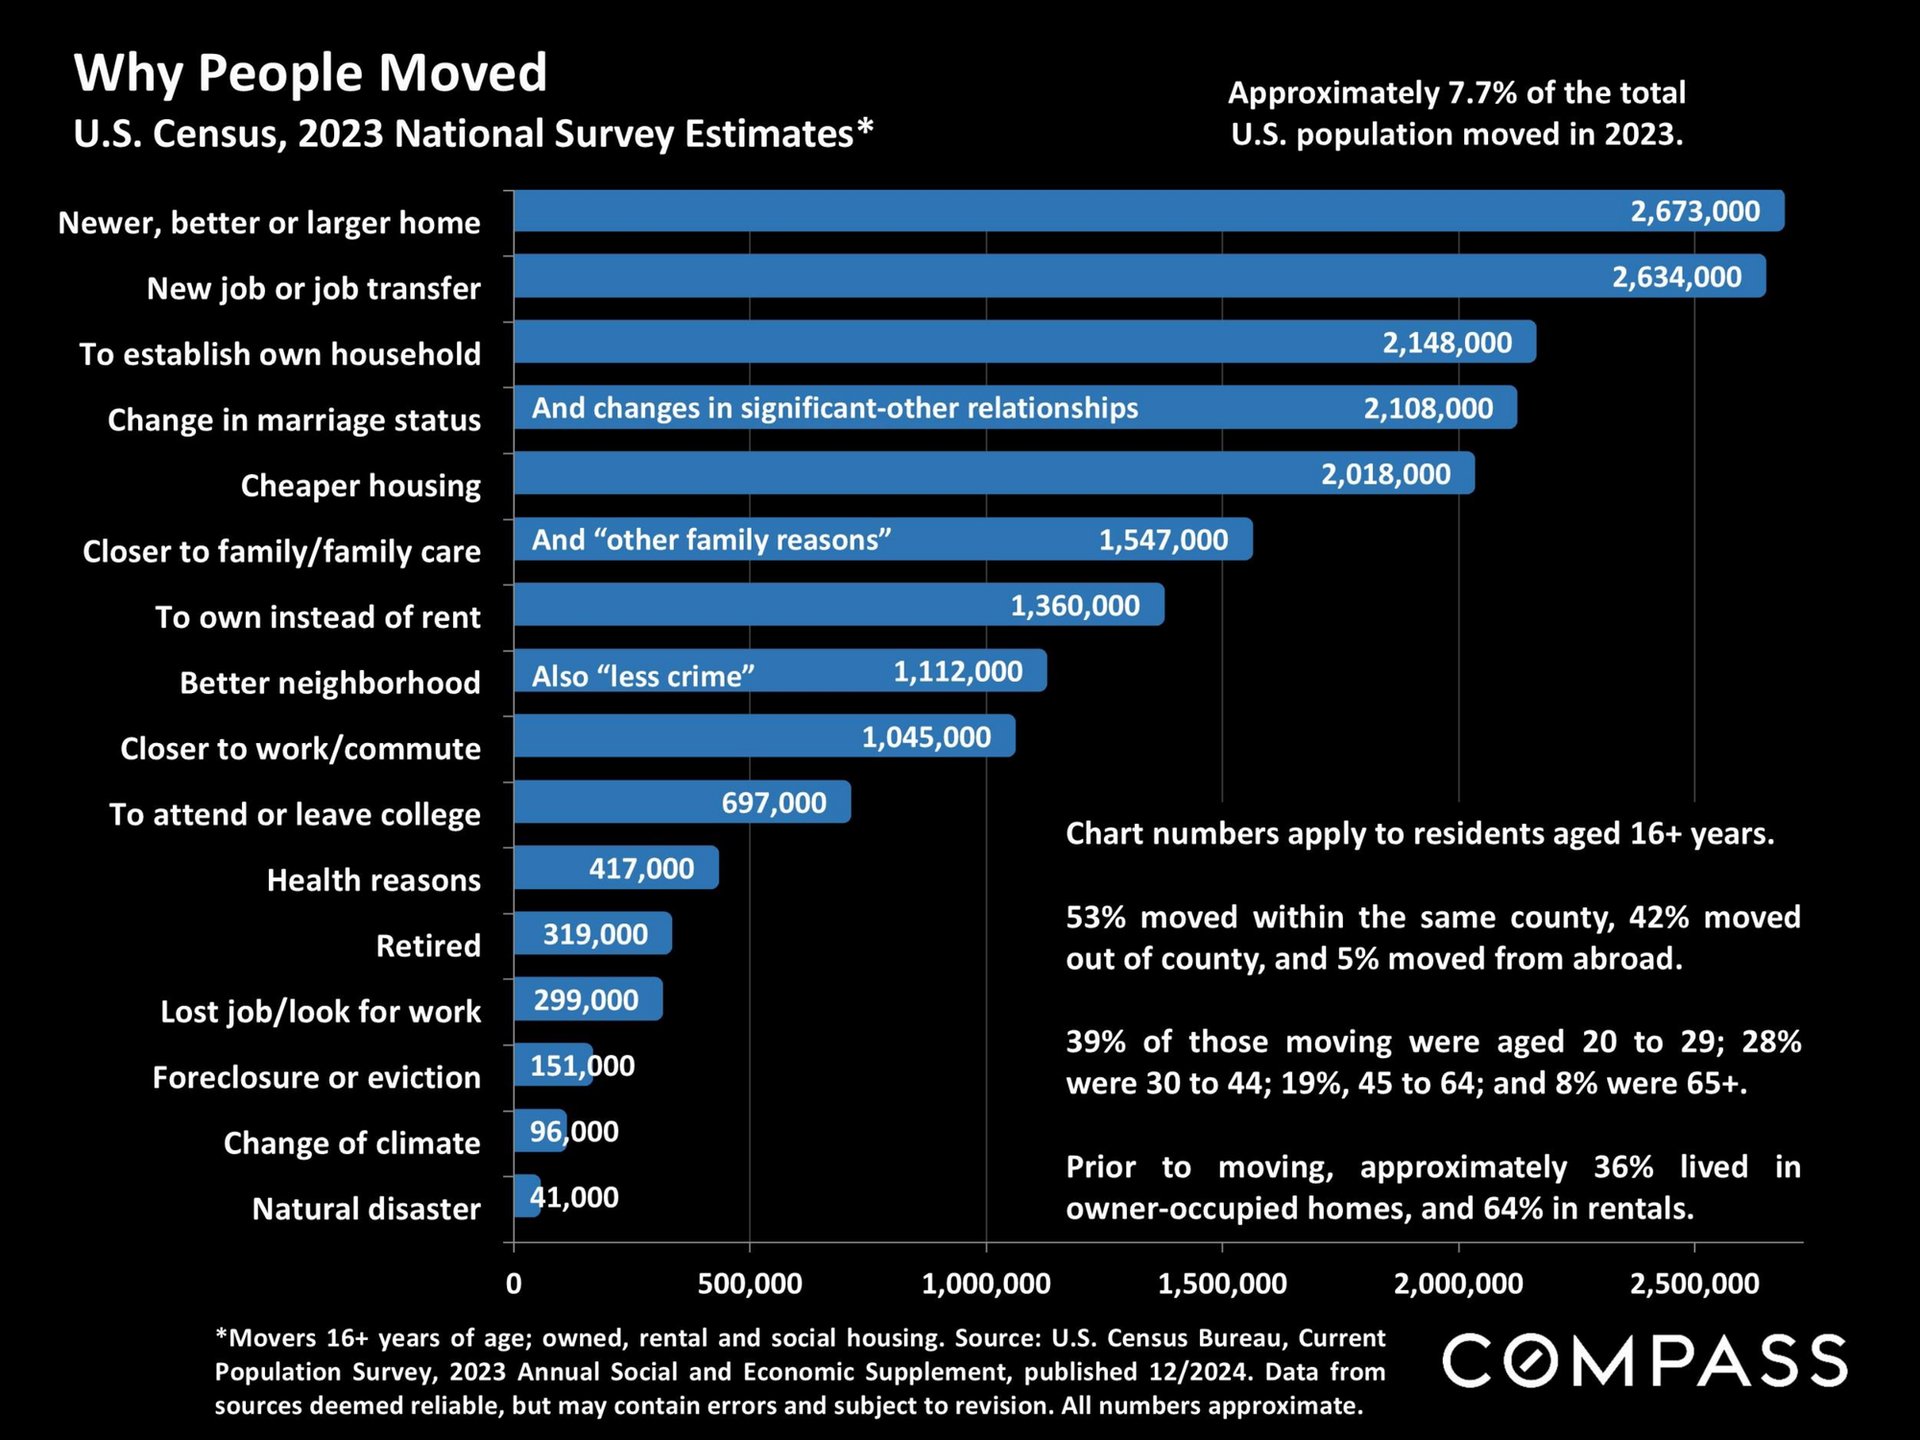
Chart of U.S. residents’ reasons for moving in 2023, led by seeking a newer or larger home and a new job.Real estate report notes explain statistics, home values, price per square foot, photo credit, and legal disclaimers.
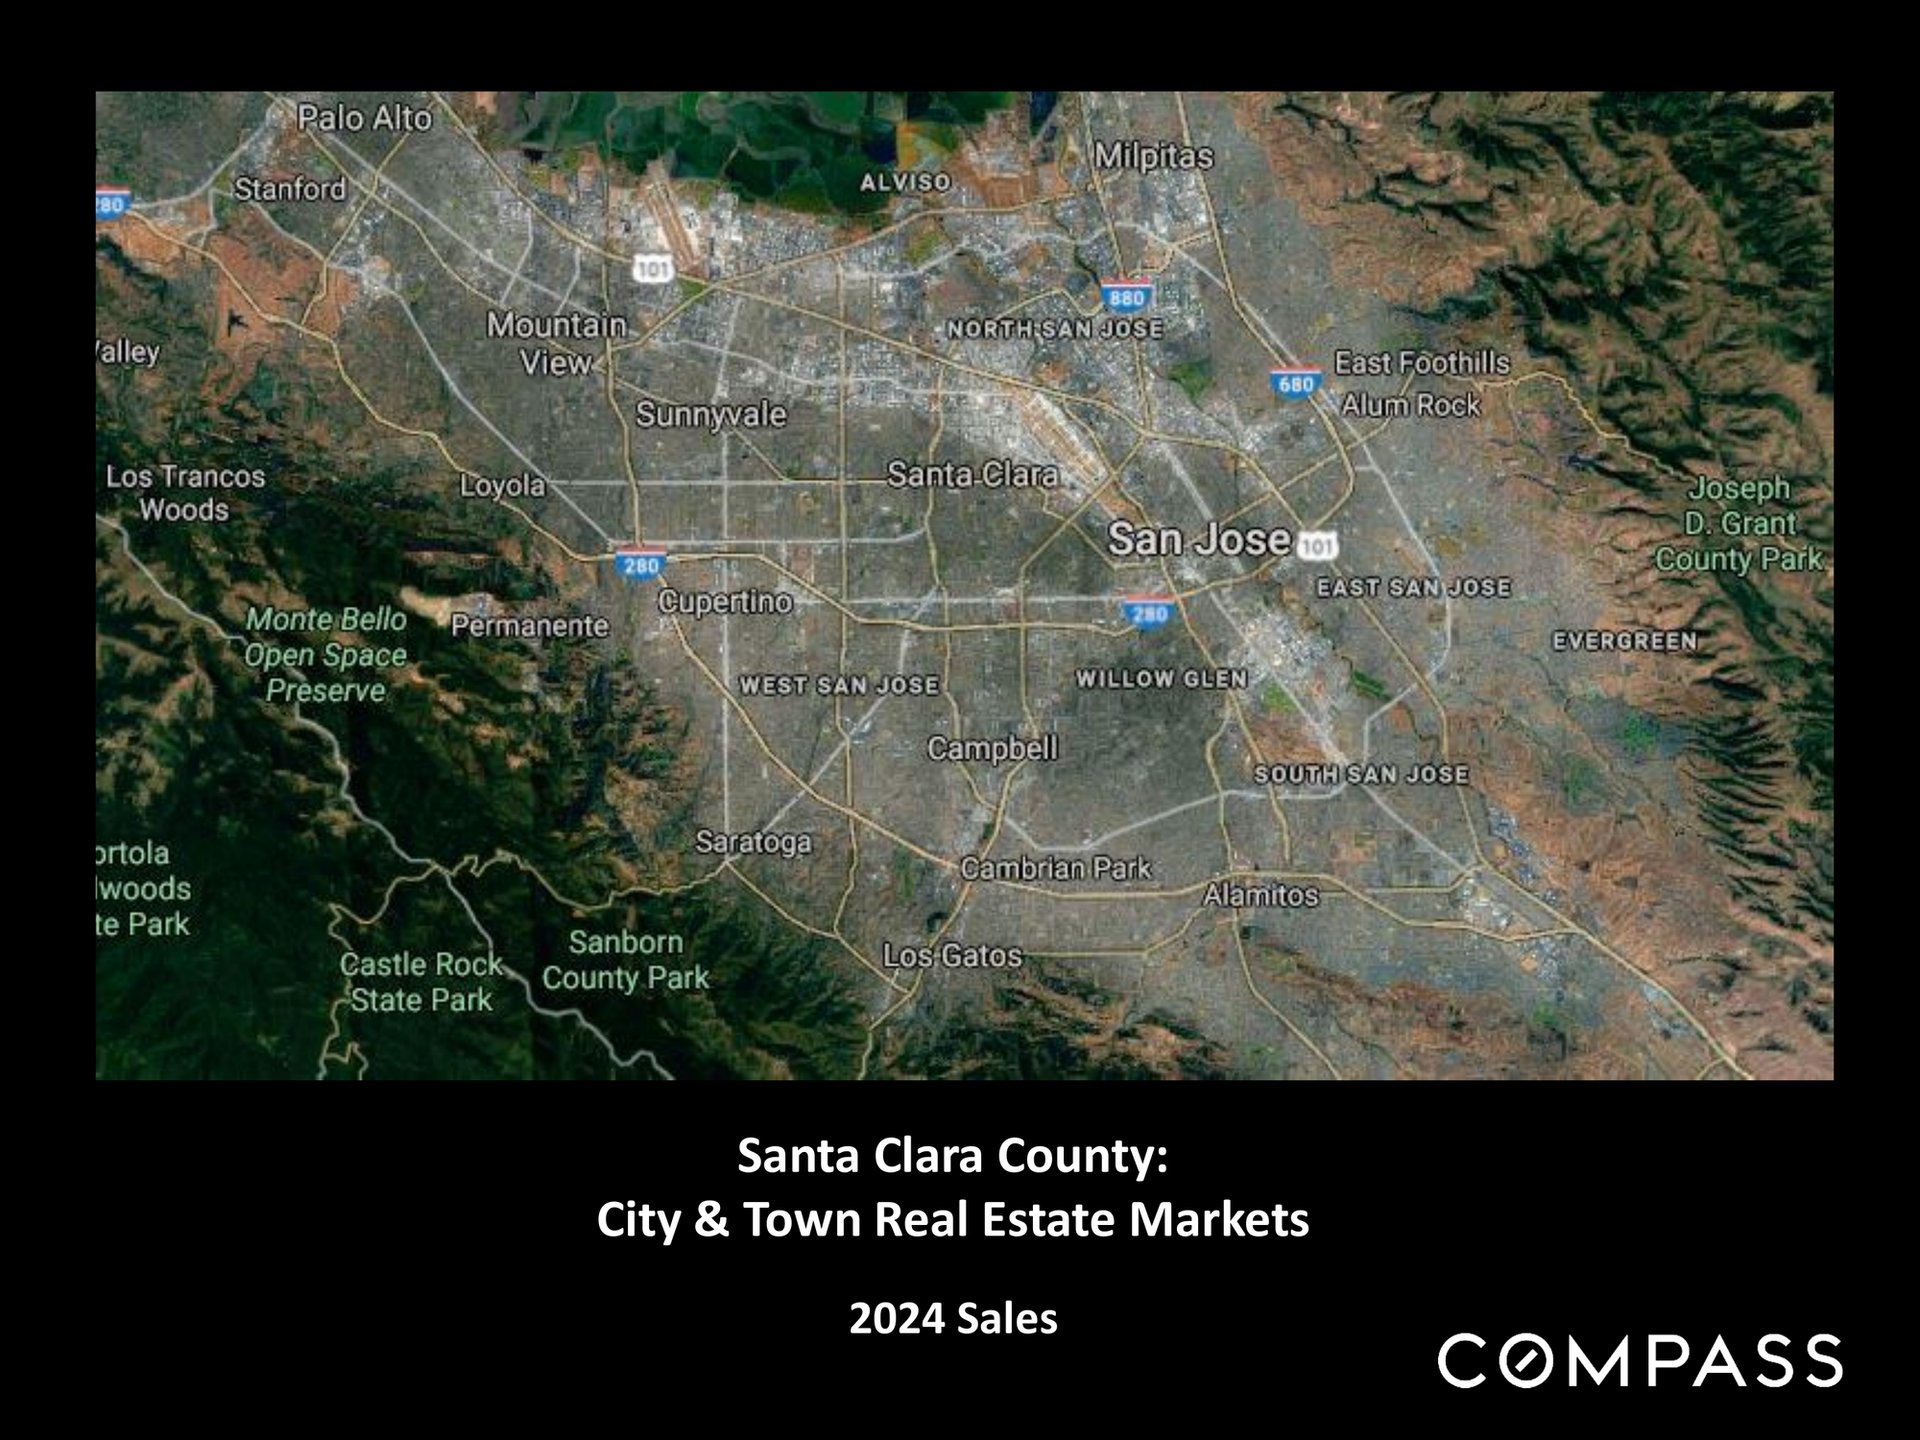
Map of Santa Clara County cities and towns, titled “City & Town Real Estate Markets: 2024 Sales.”
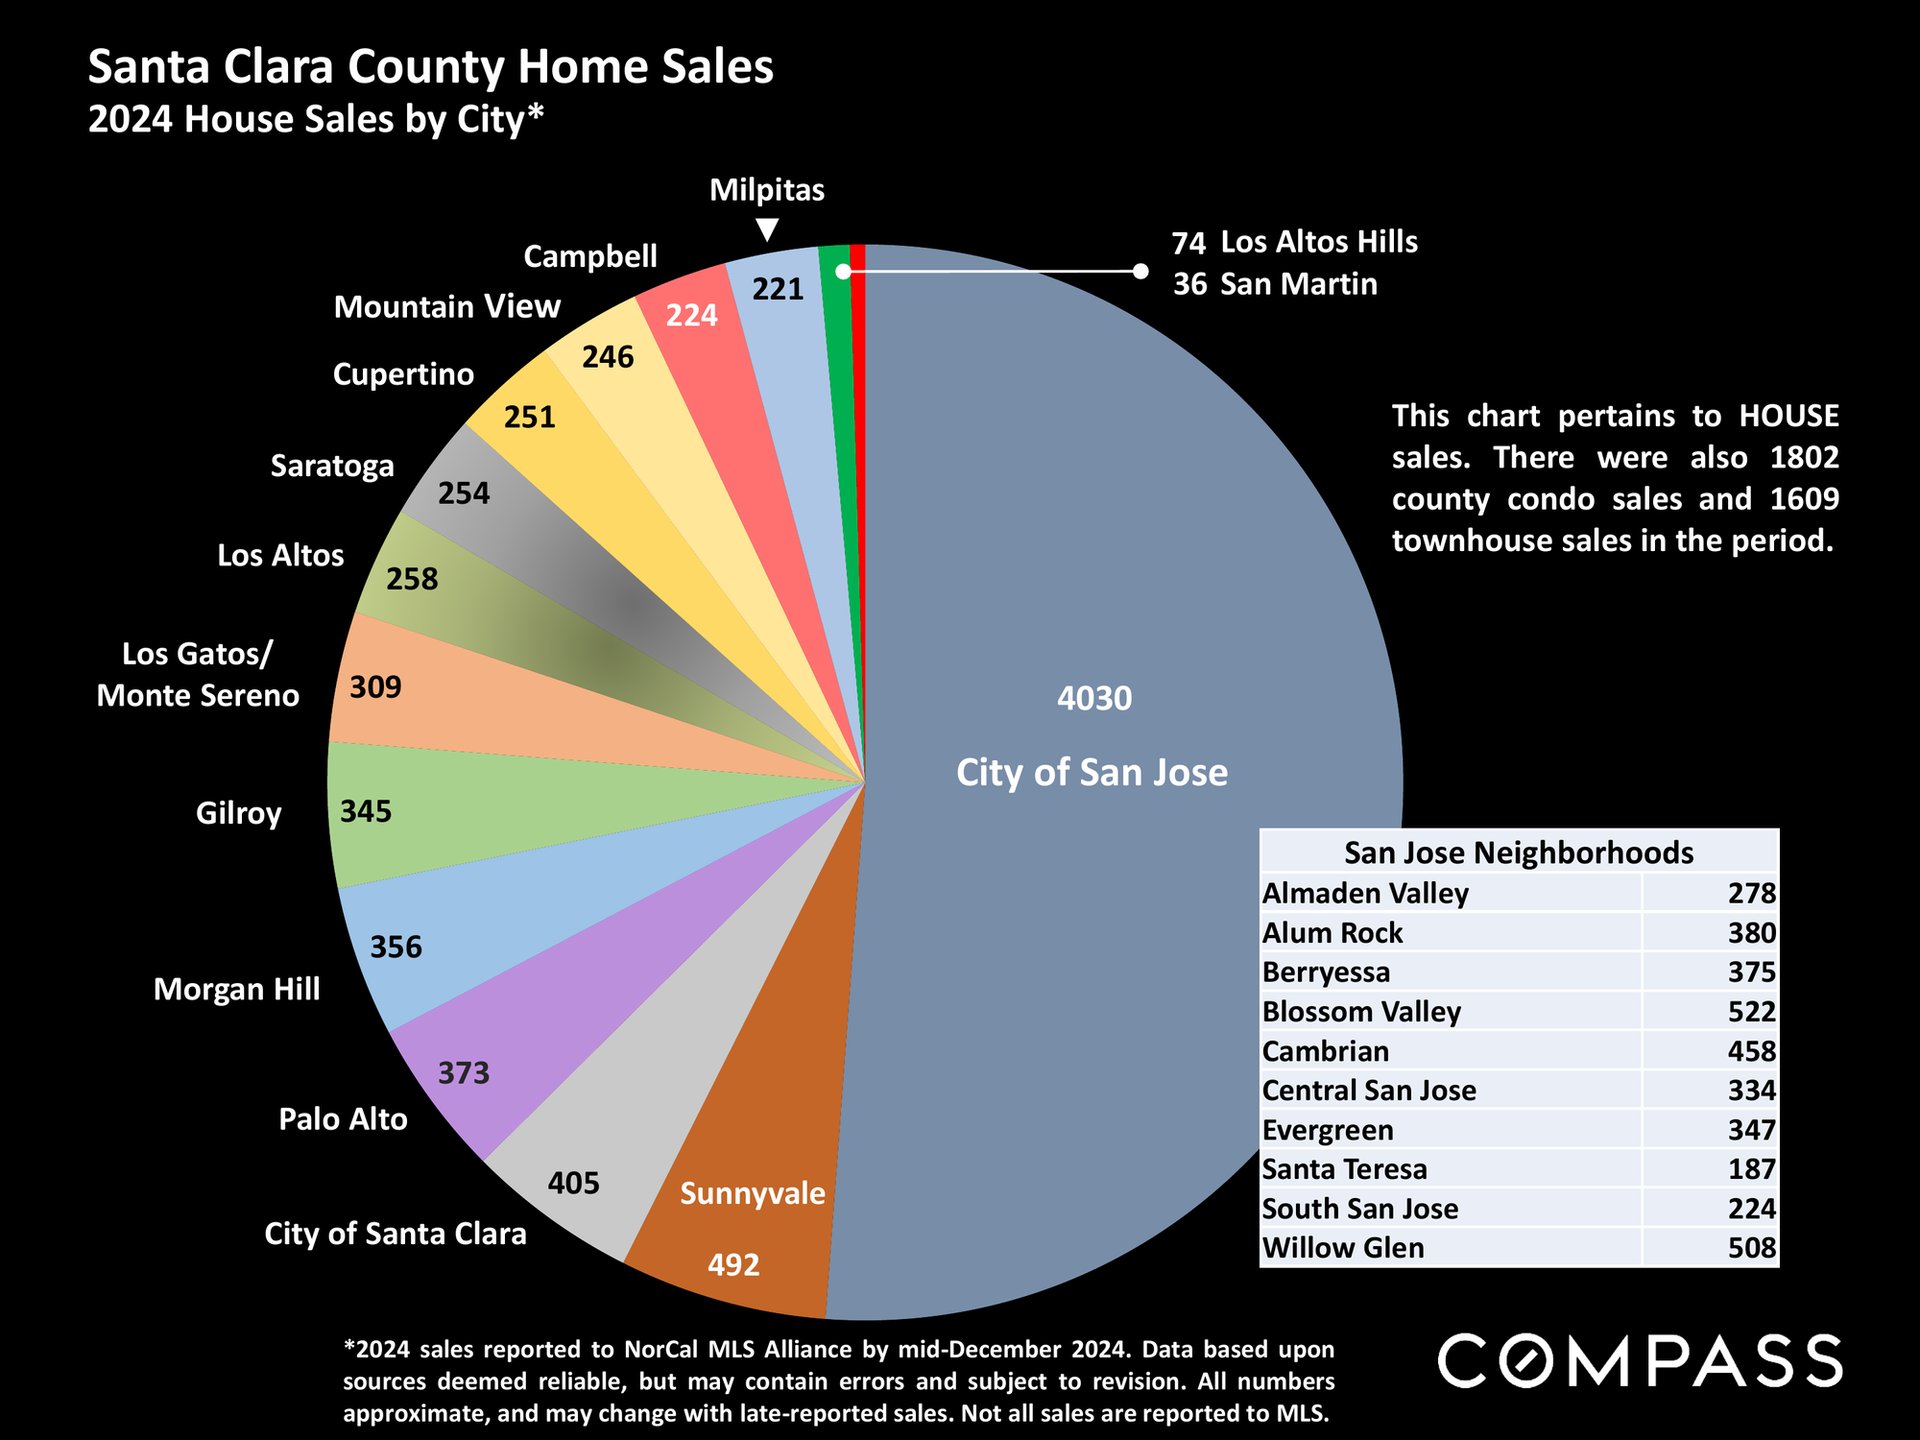
Chart of 2024 Santa Clara County home sales by city, dominated by San Jose, with a table of neighborhood counts.
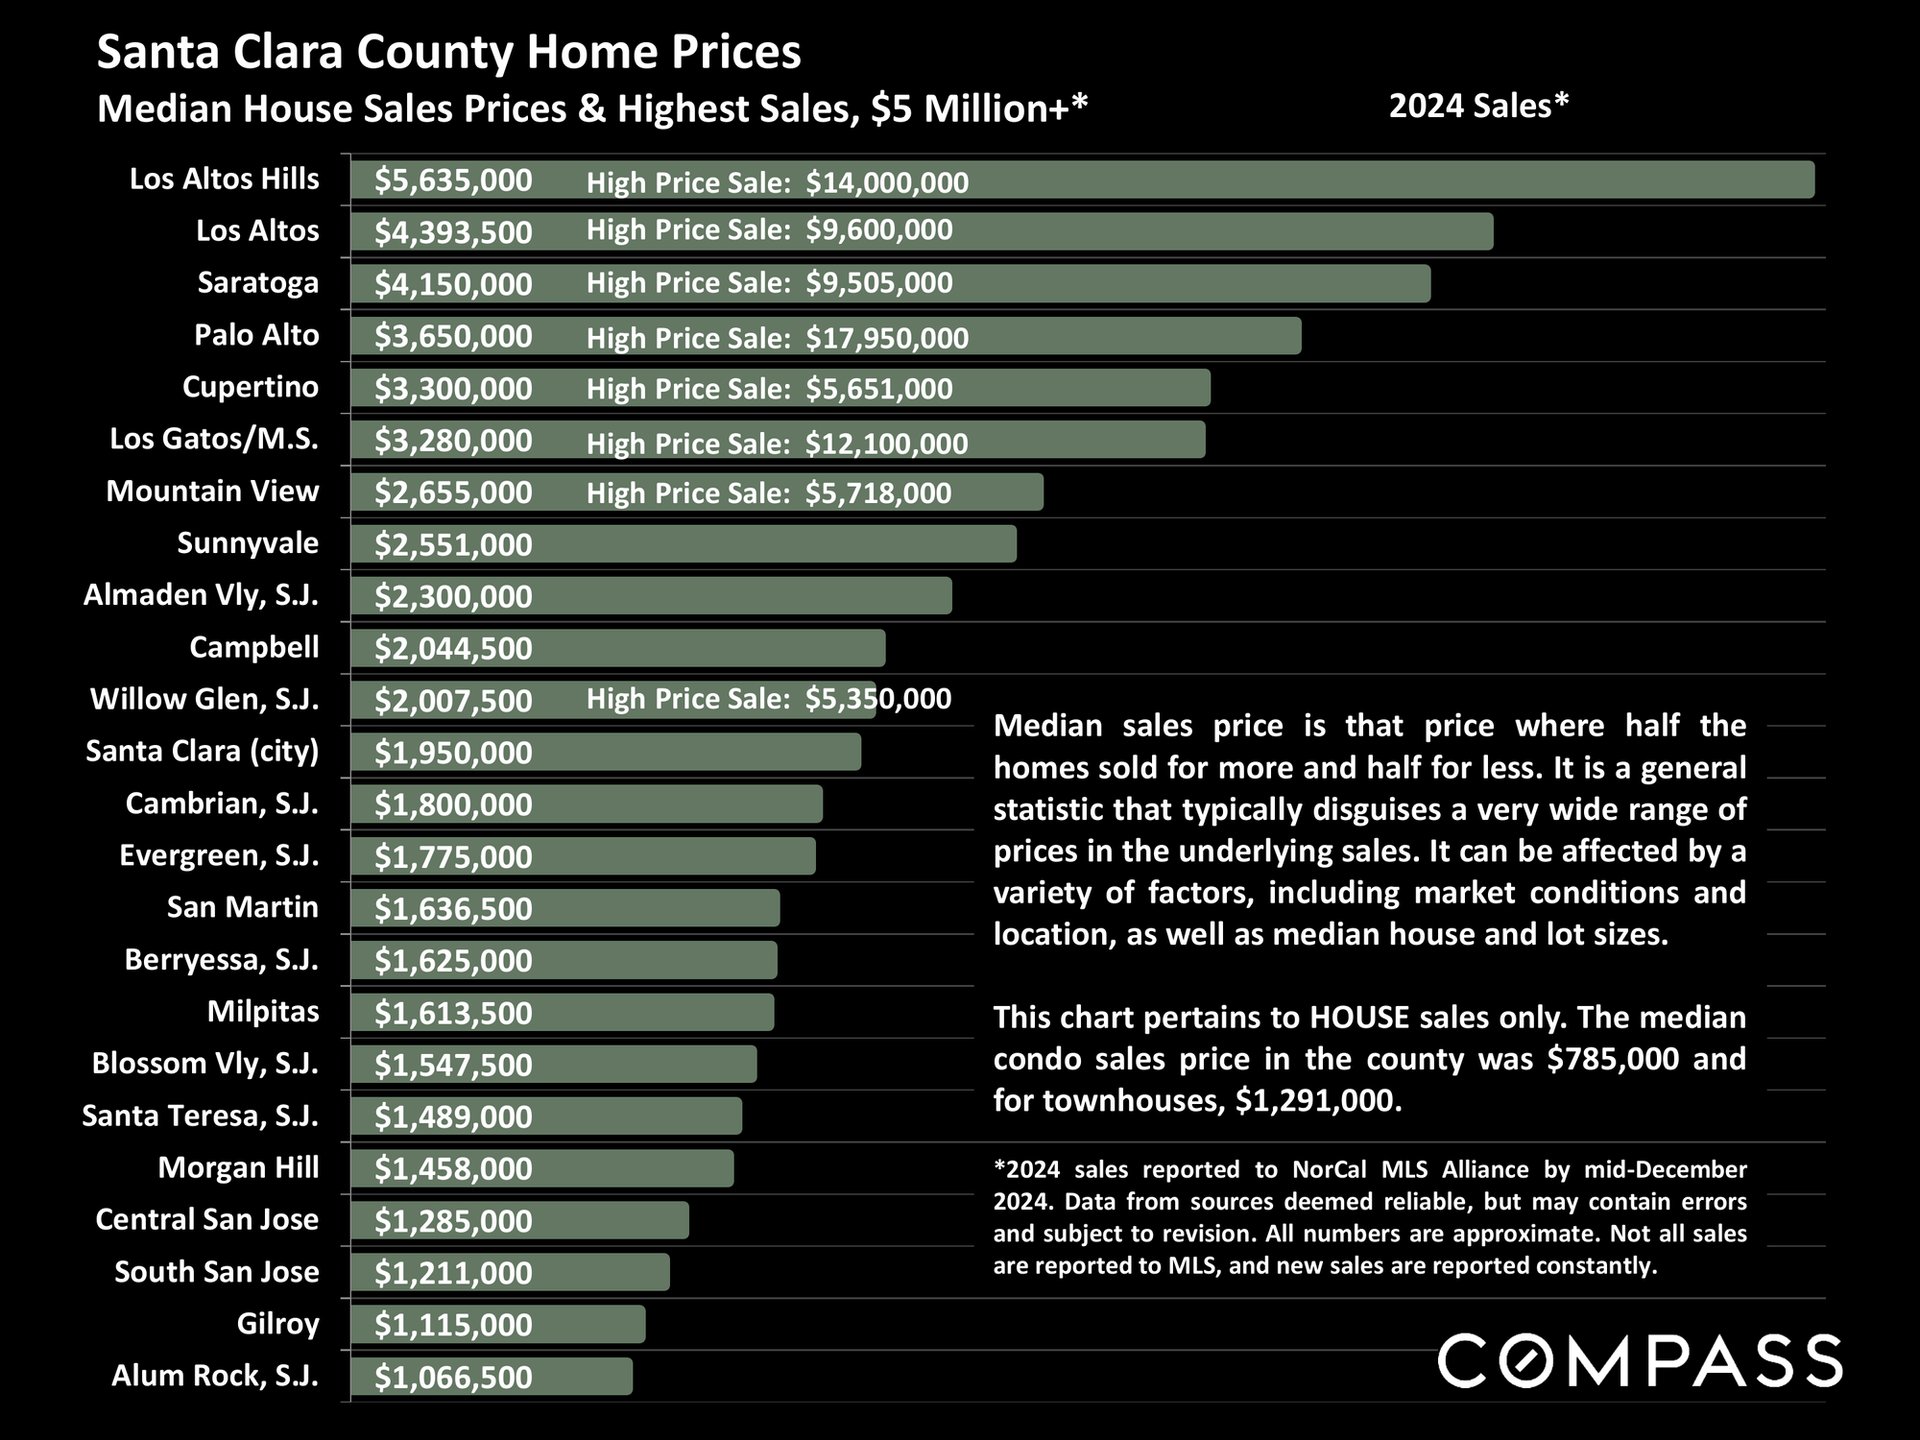
Santa Clara County 2024 median house prices by community, with highest sales listed for selected areas.
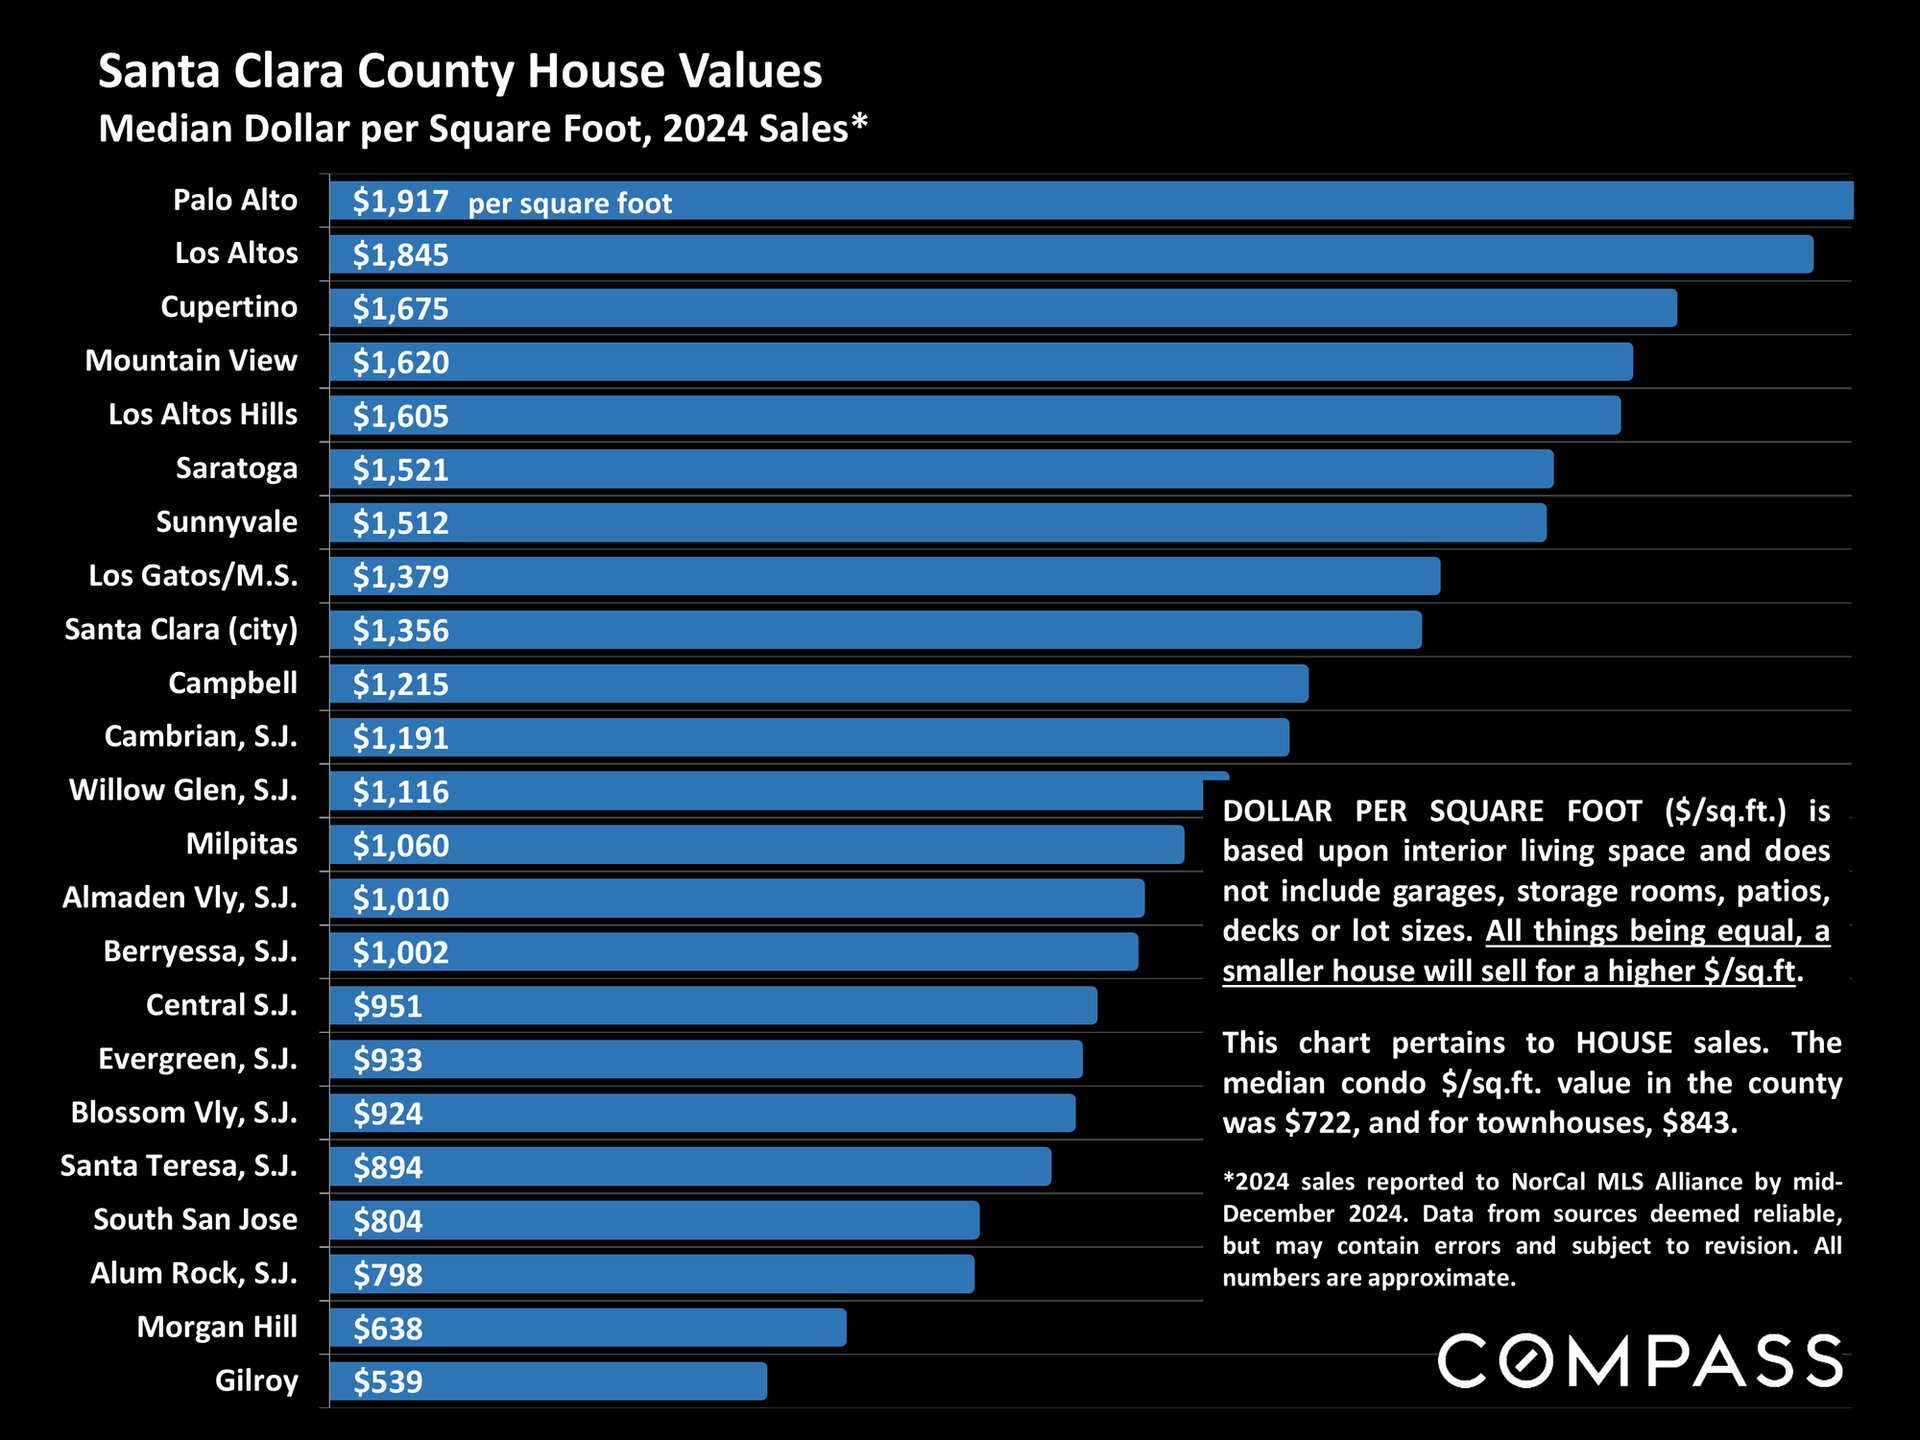
Chart of 2024 median house sale prices per square foot across Santa Clara County cities, from Palo Alto to Gilroy.
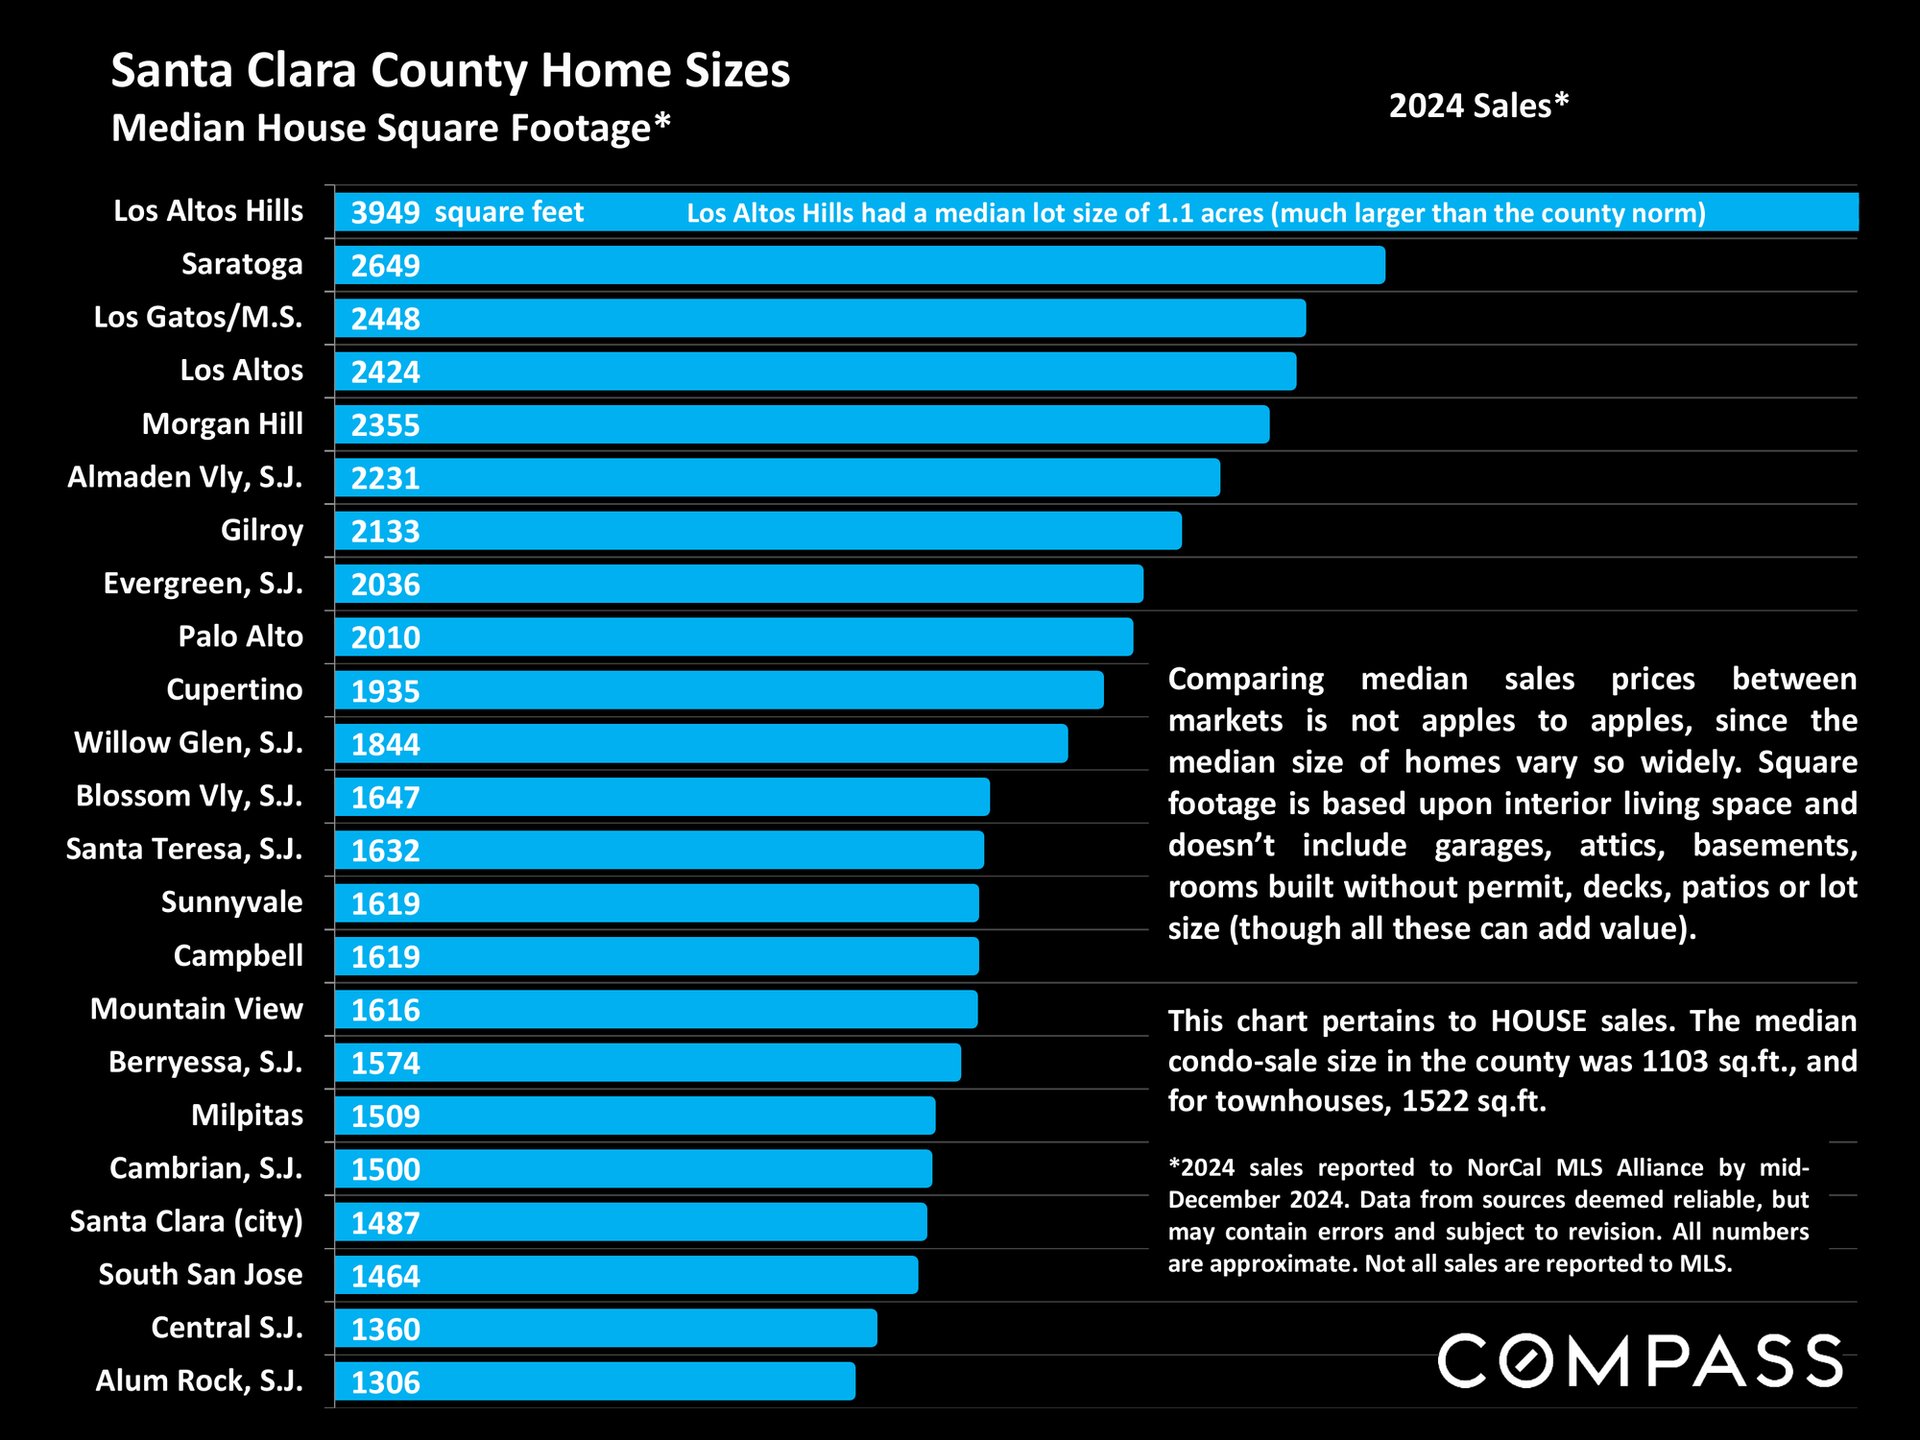
Chart comparing median house square footage across Santa Clara County communities; Los Altos Hills leads at 3,949 square feet.
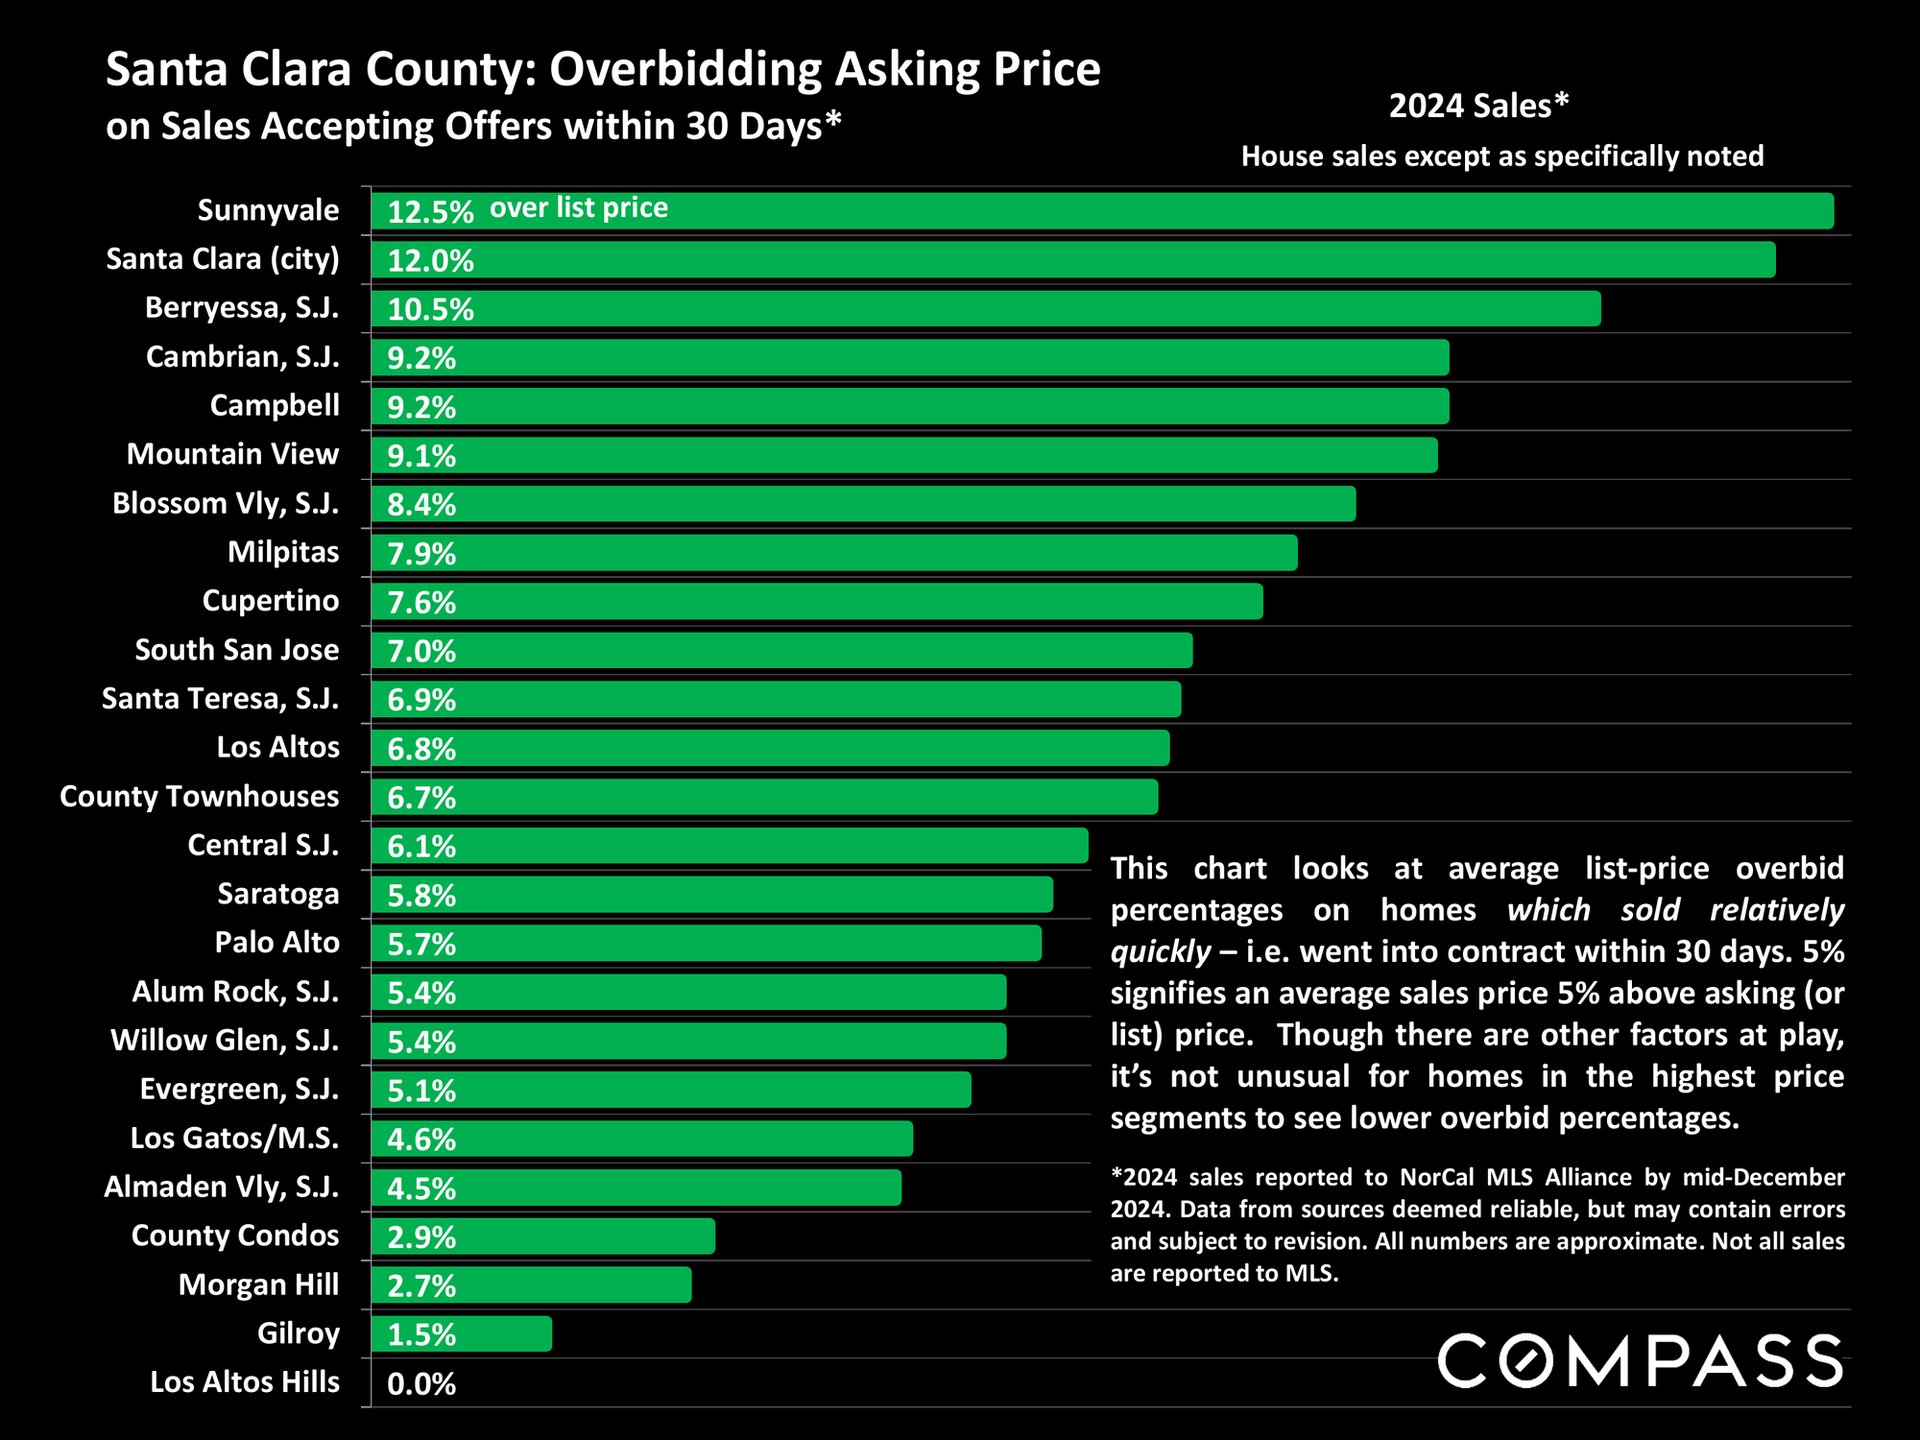
Bar chart of 2024 Santa Clara County home-sale overbids, led by Sunnyvale at 12.5%.
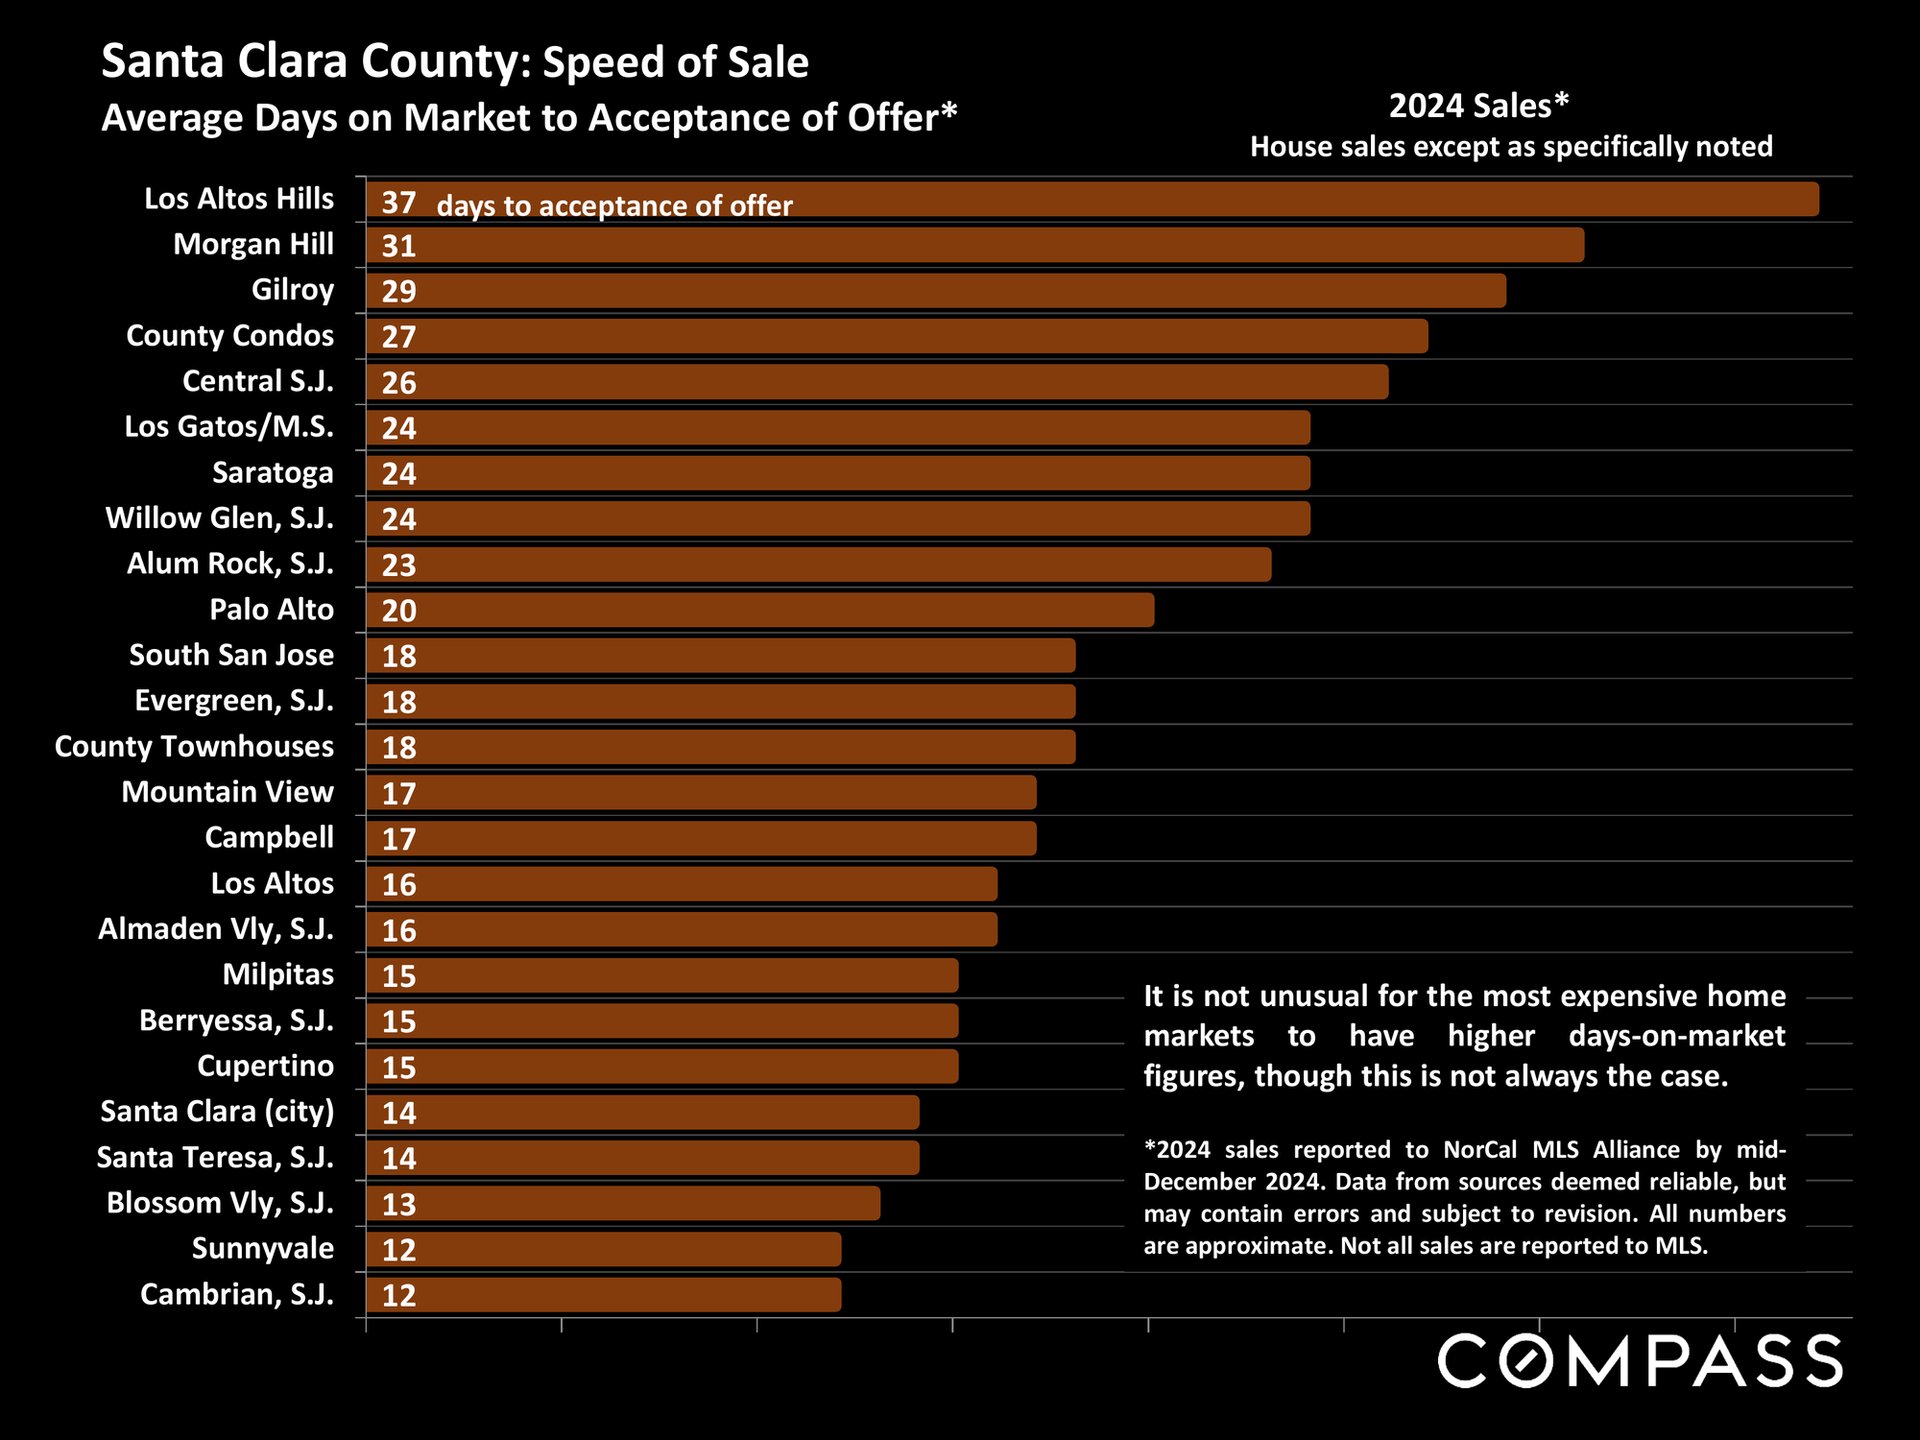
Santa Clara County home-sale speed chart, with Los Altos Hills at 37 days and Cambrian at 12.


WORK WITH US

We offer the highest level of service and expertise to our clients. Our team has built a reputation for consistently representing the finest real estate in San Francisco and Napa Valley. Results driven and dedicated to your success, whether buying, selling, renting or investing. Contact us today for a private consultation.

Contact Us