Santa Clara County Real Estate March 2025 Report

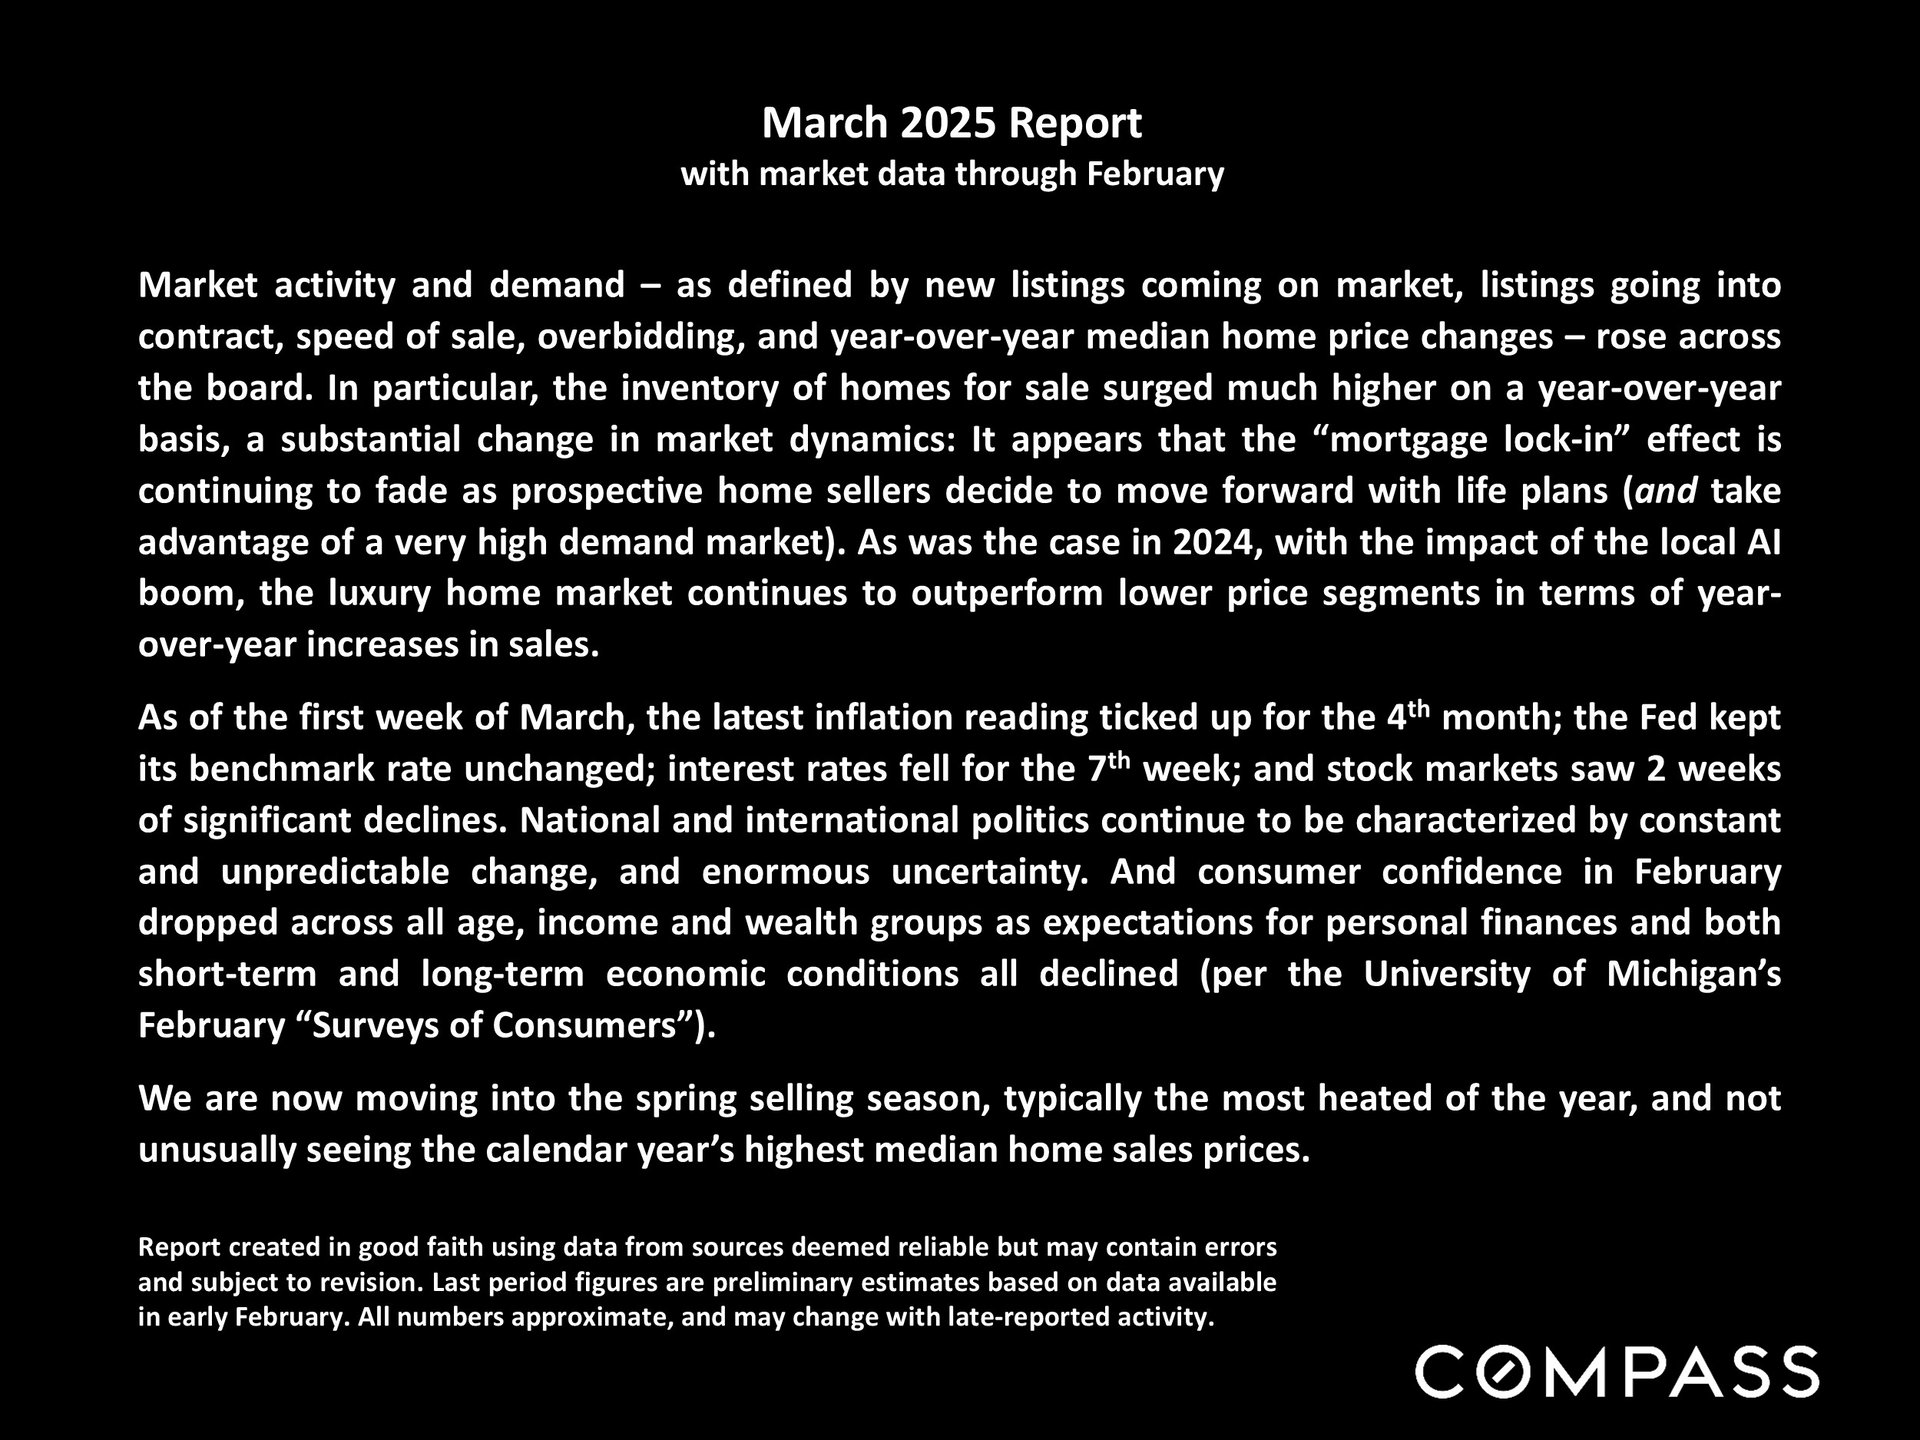
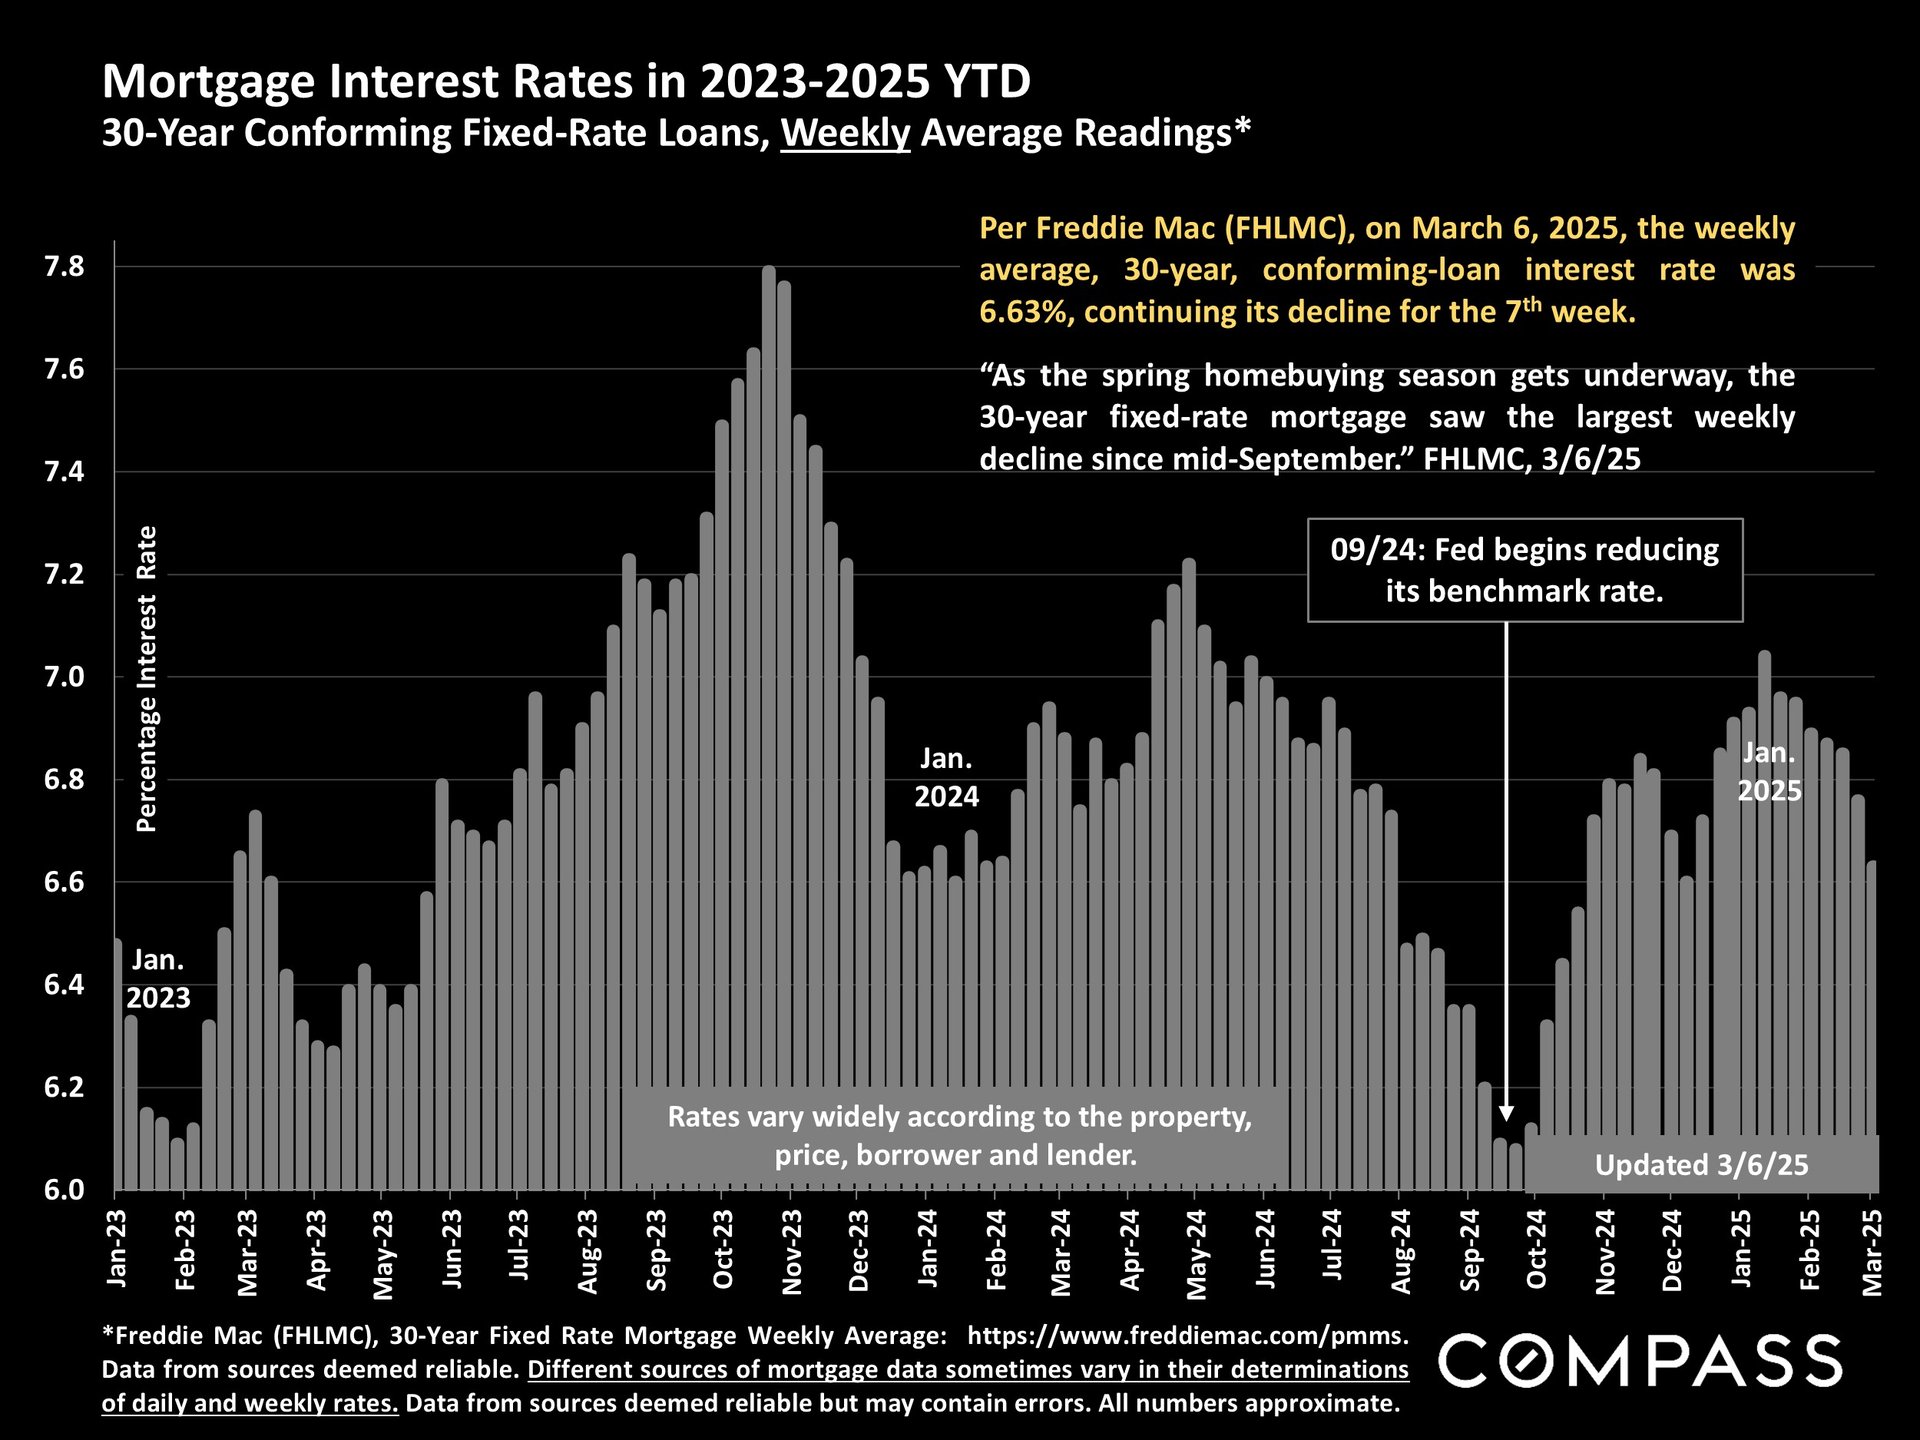
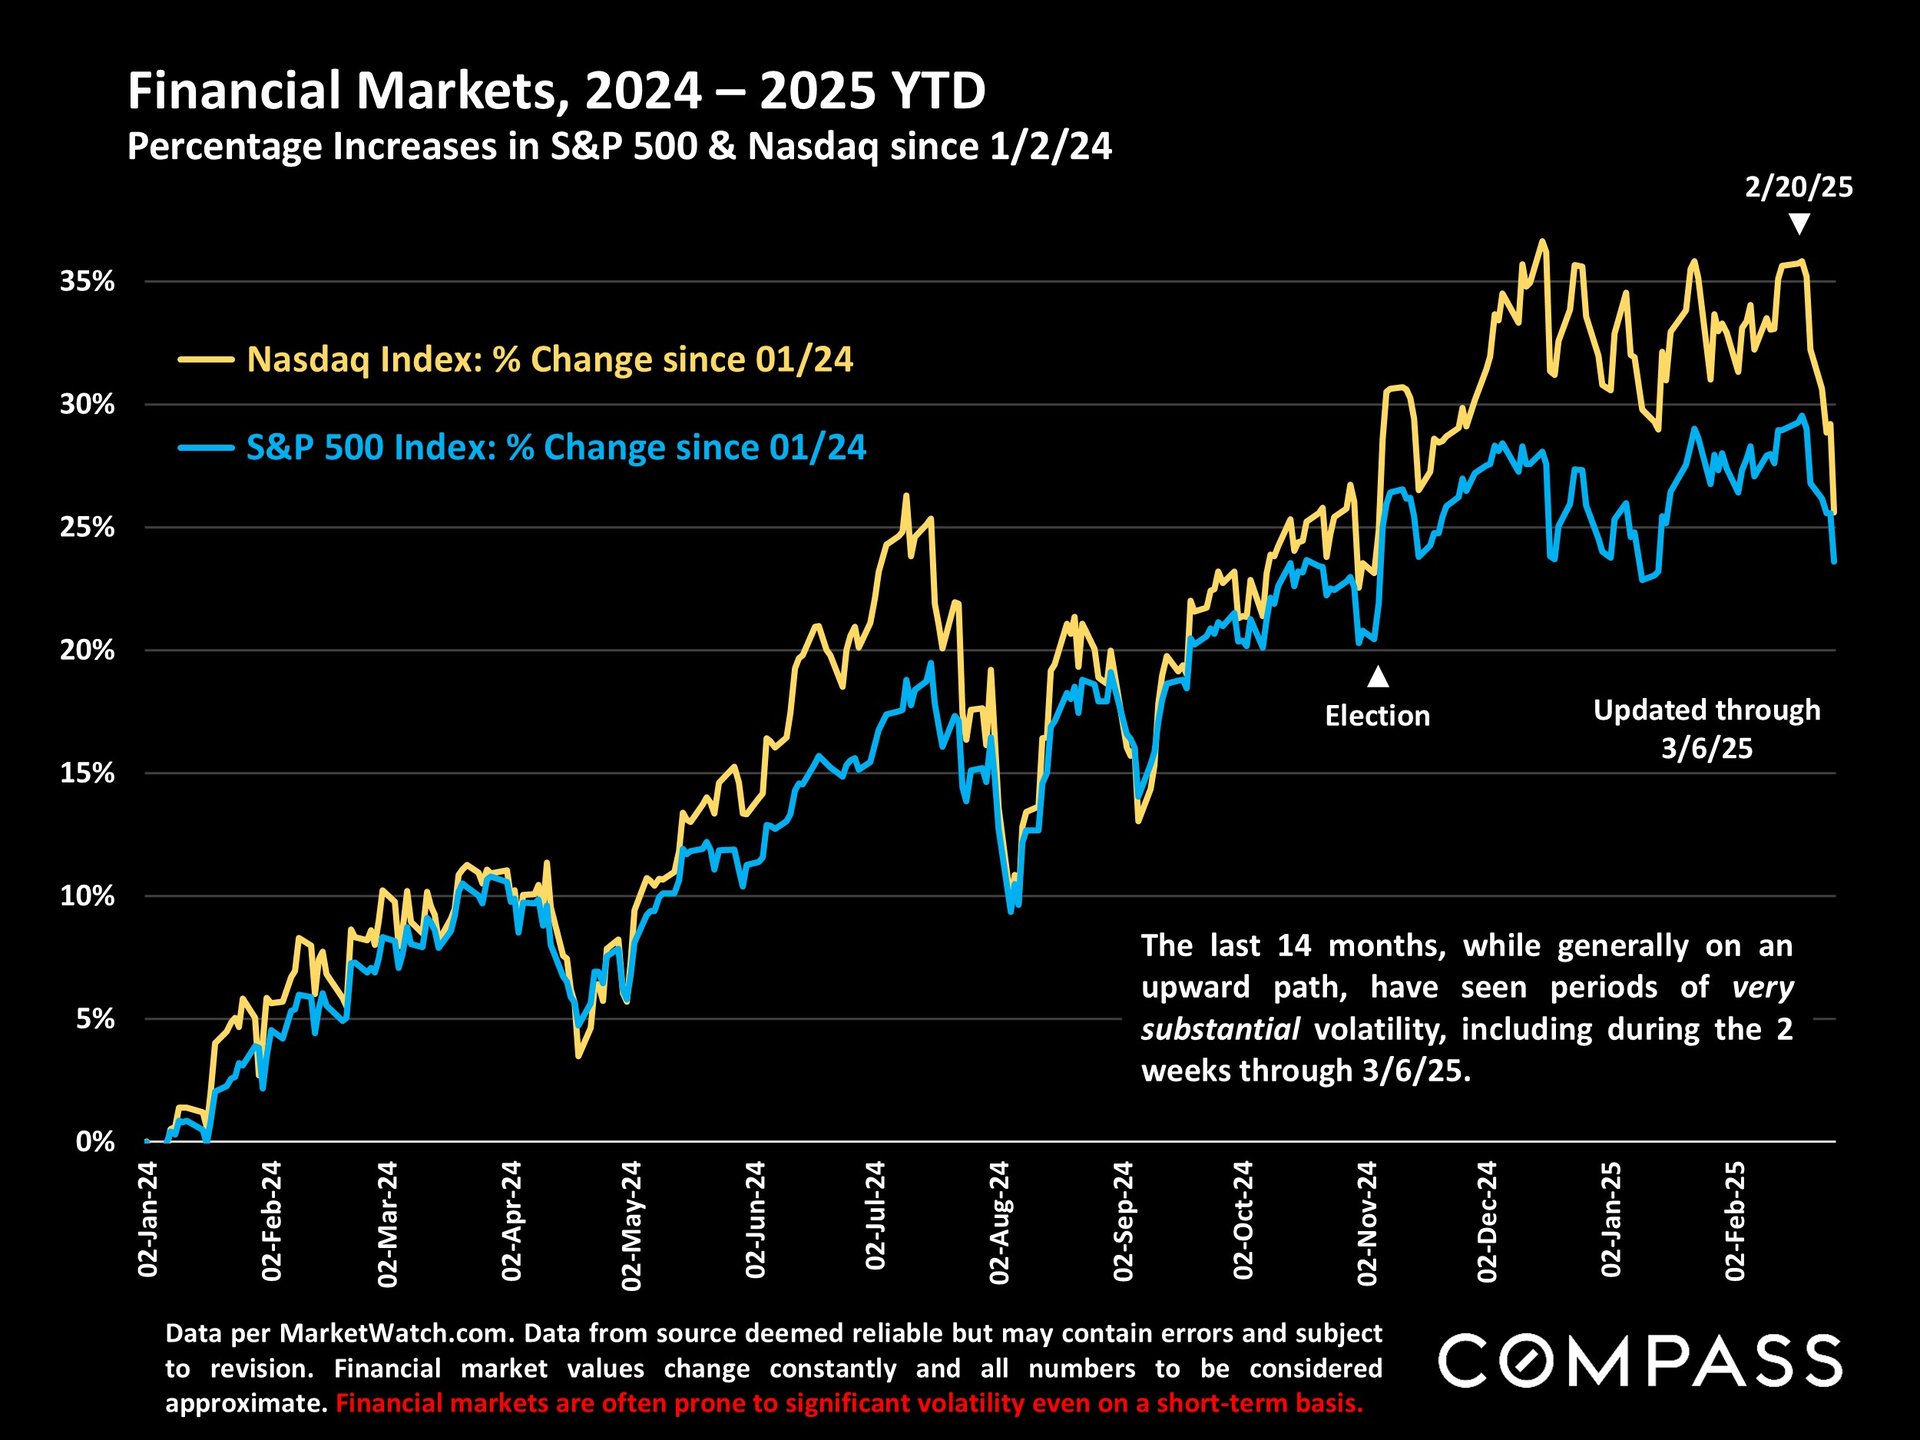
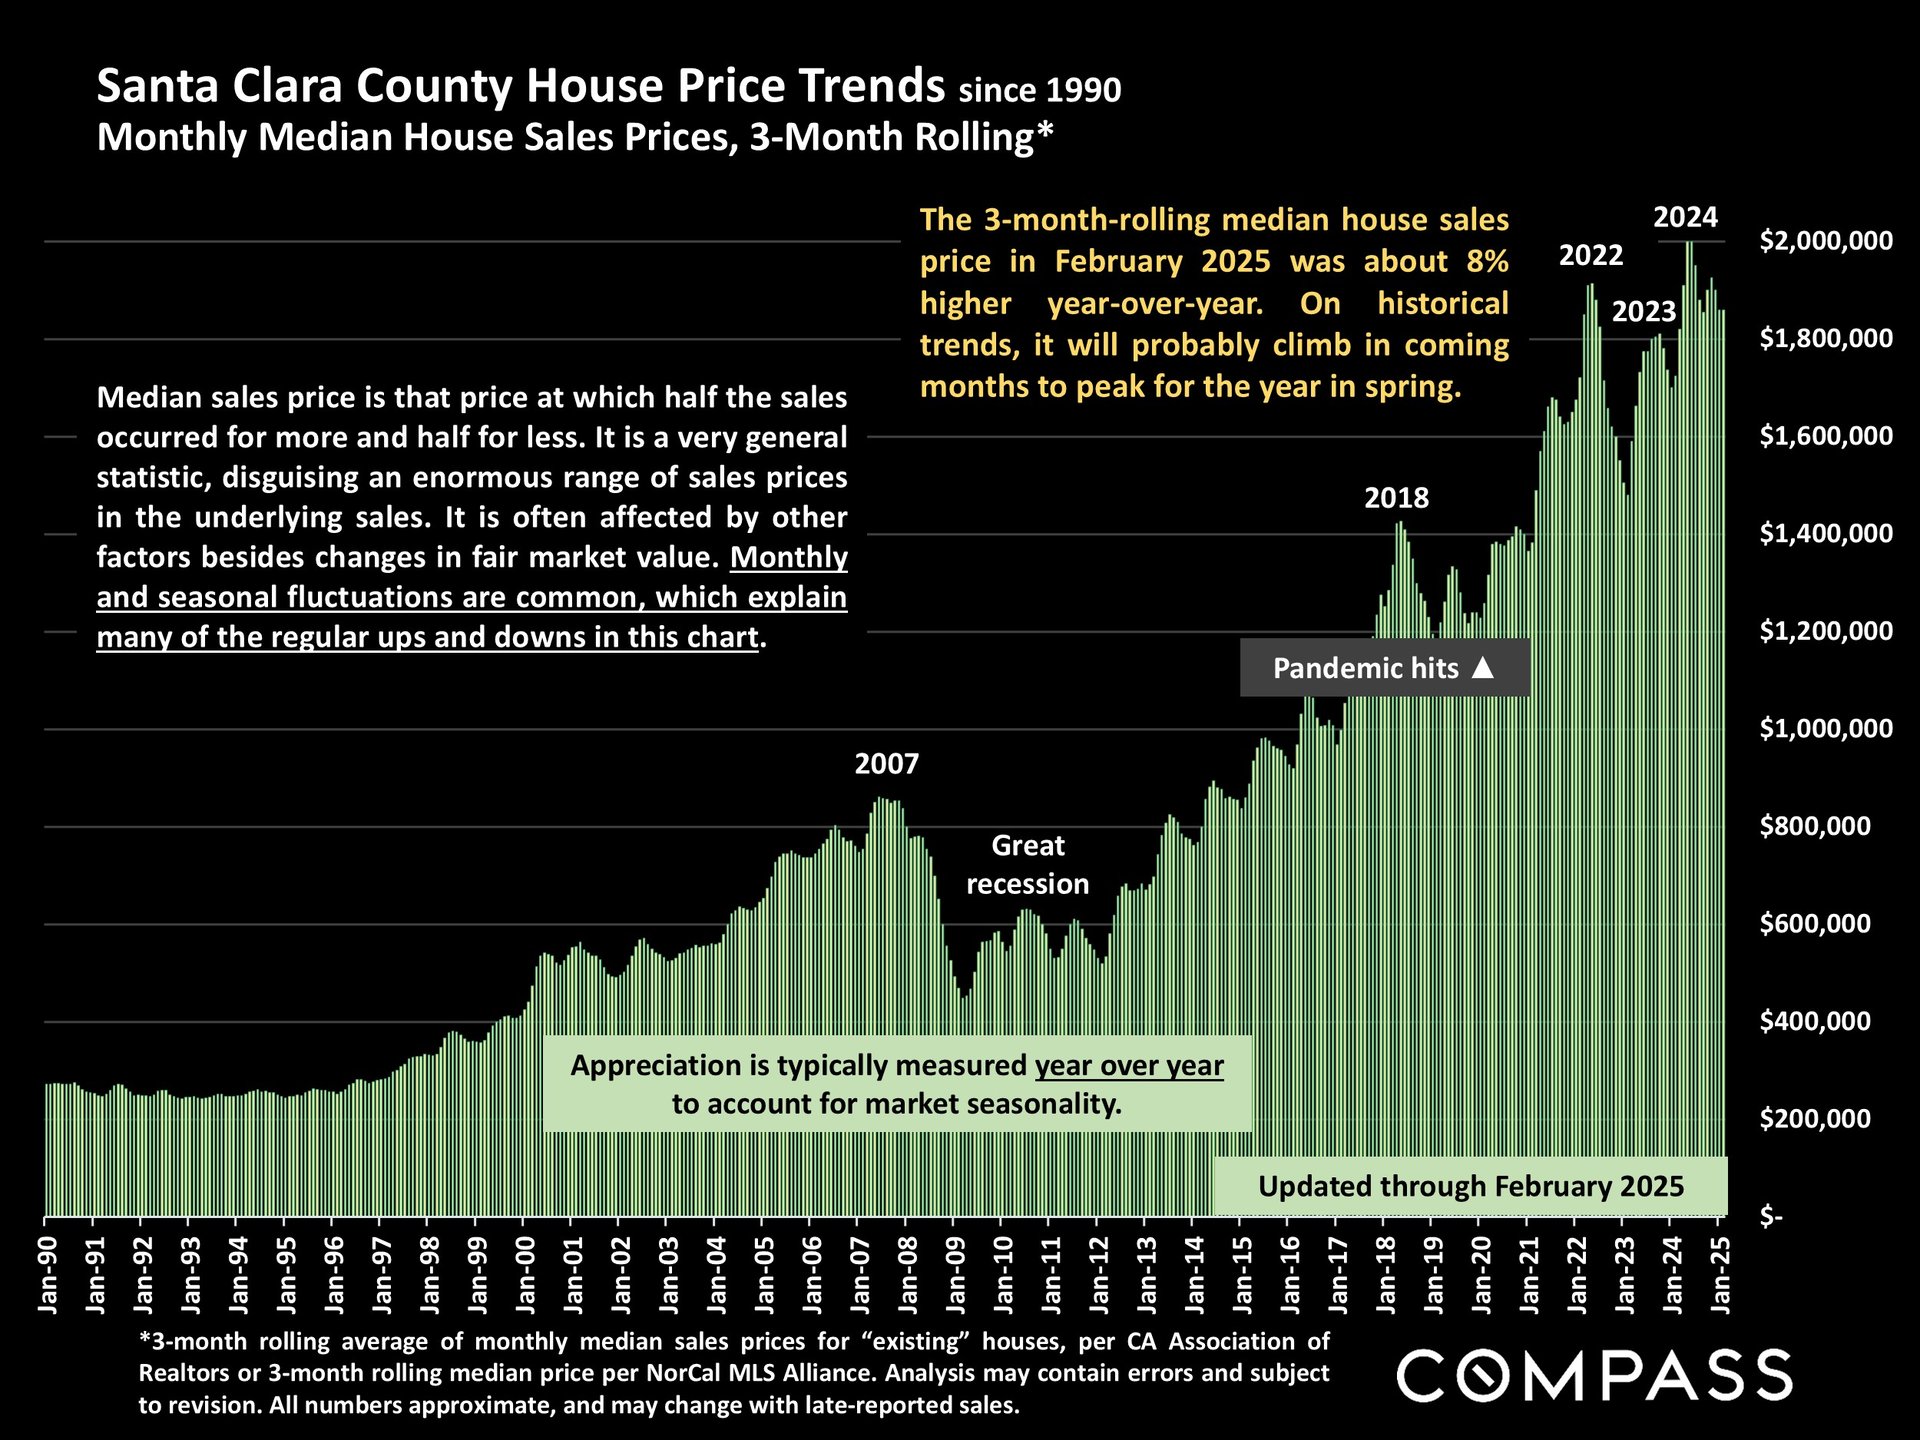
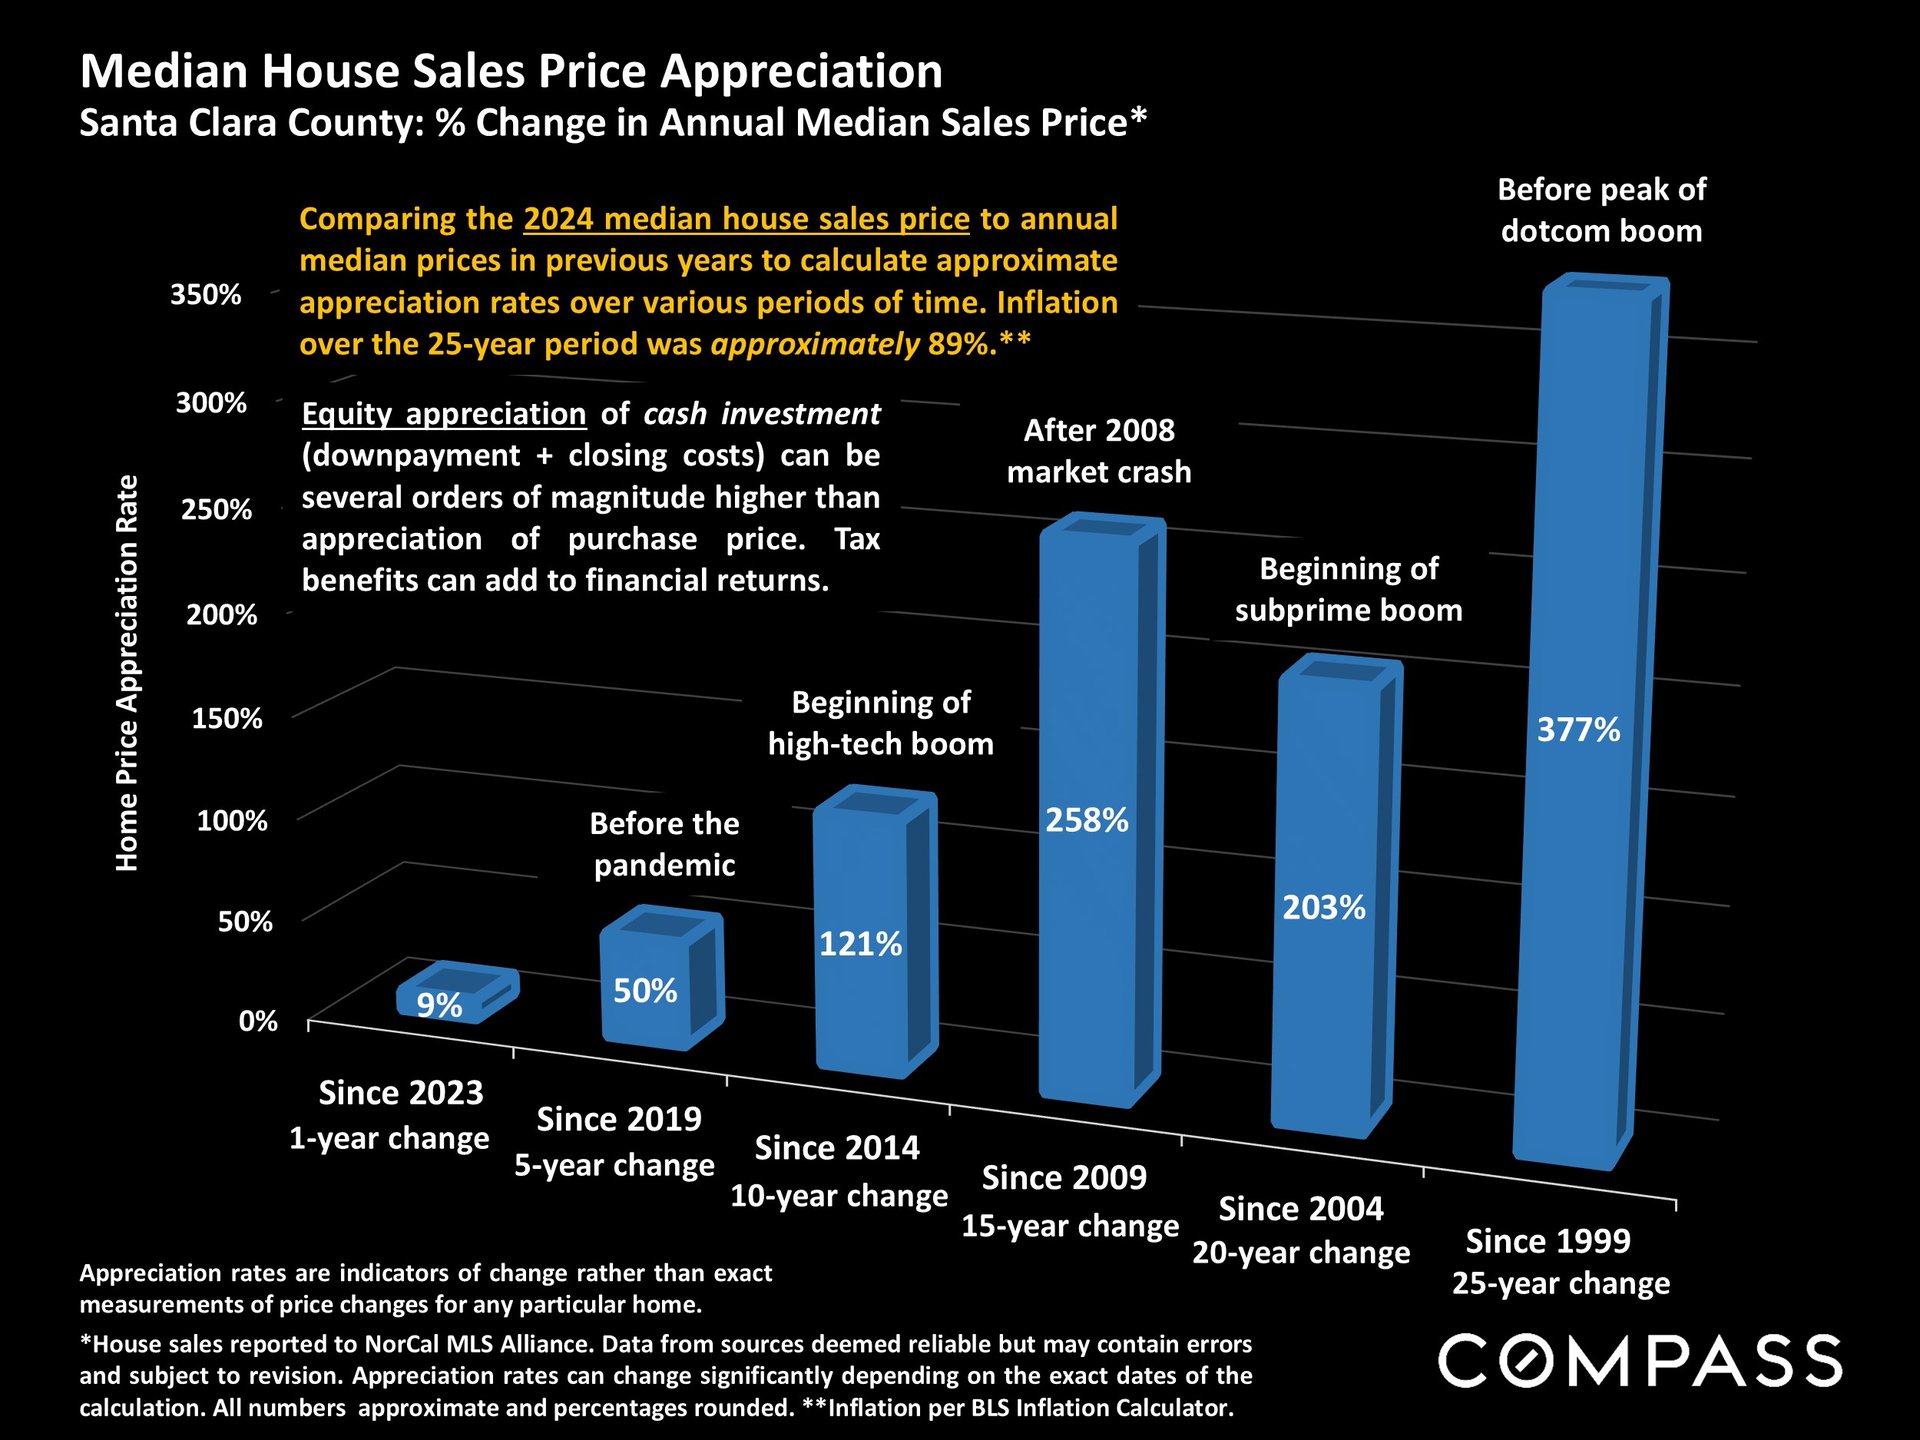
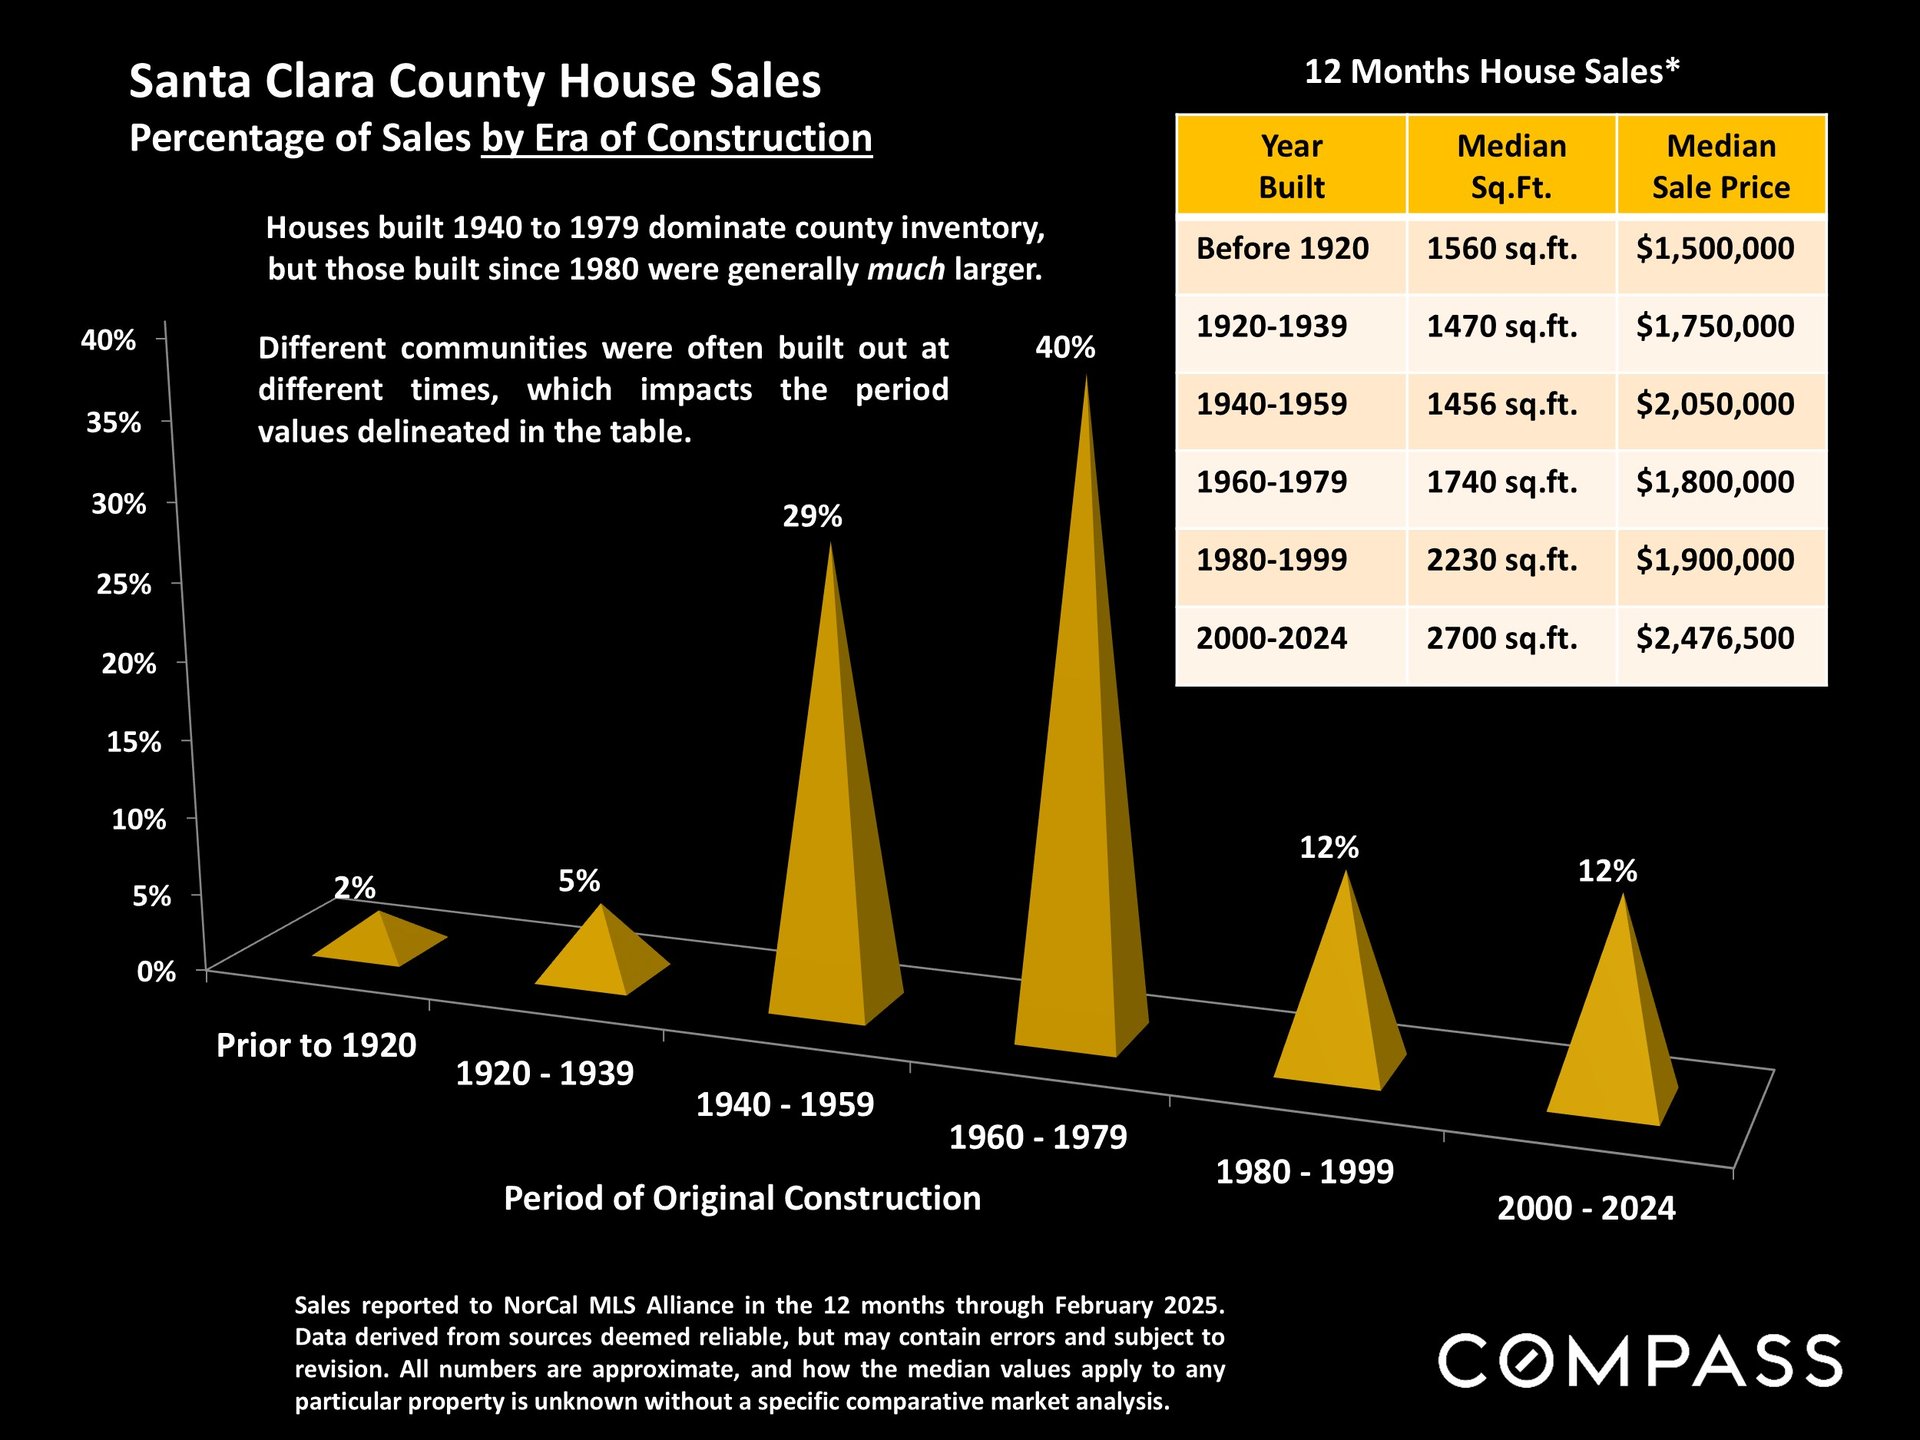
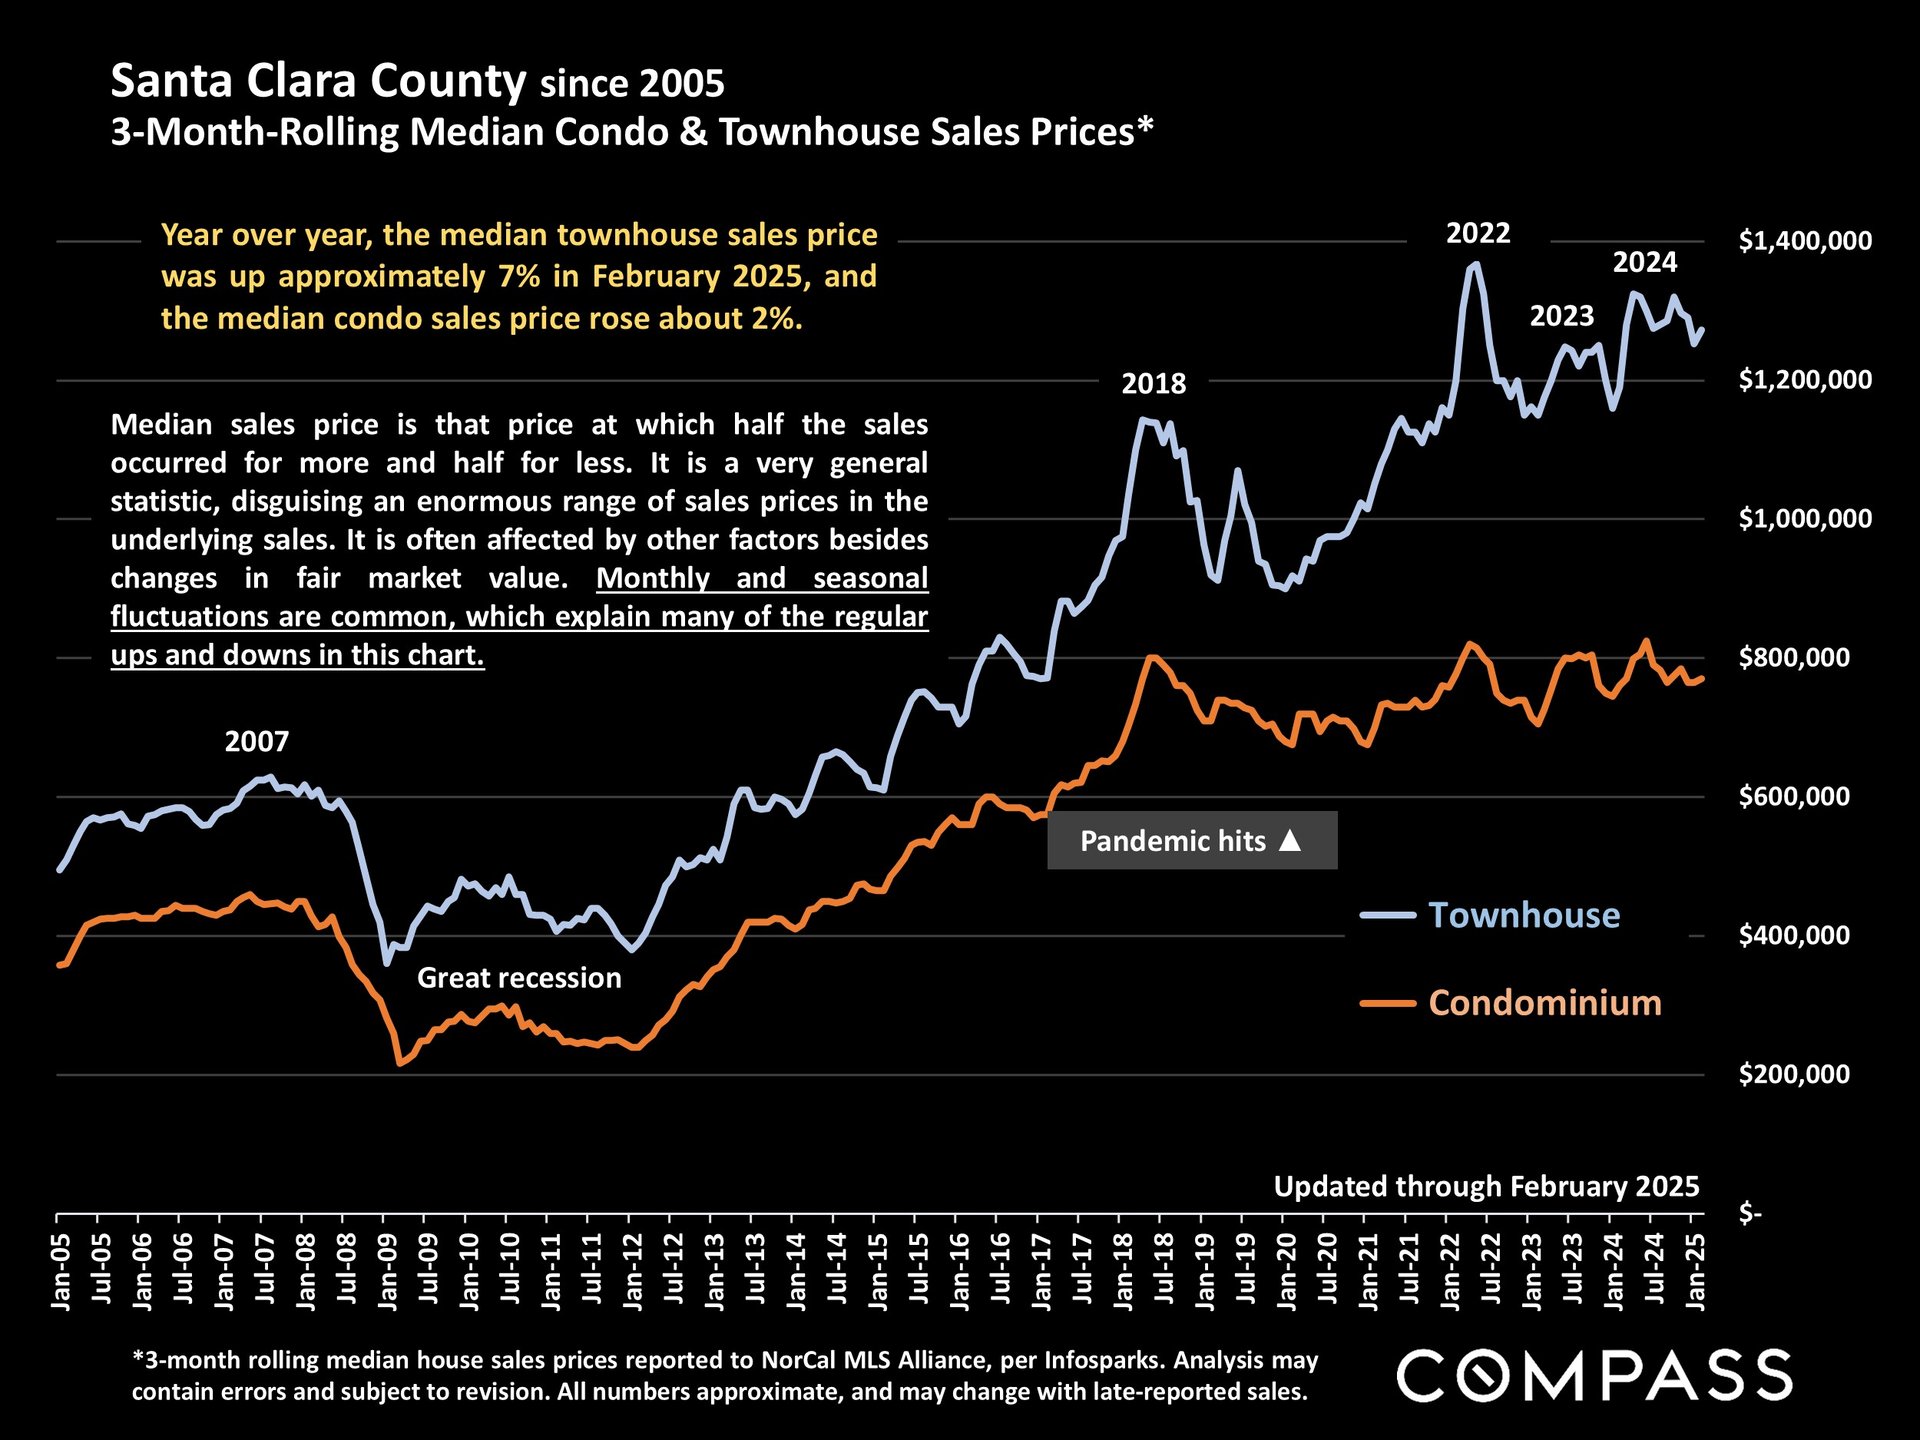
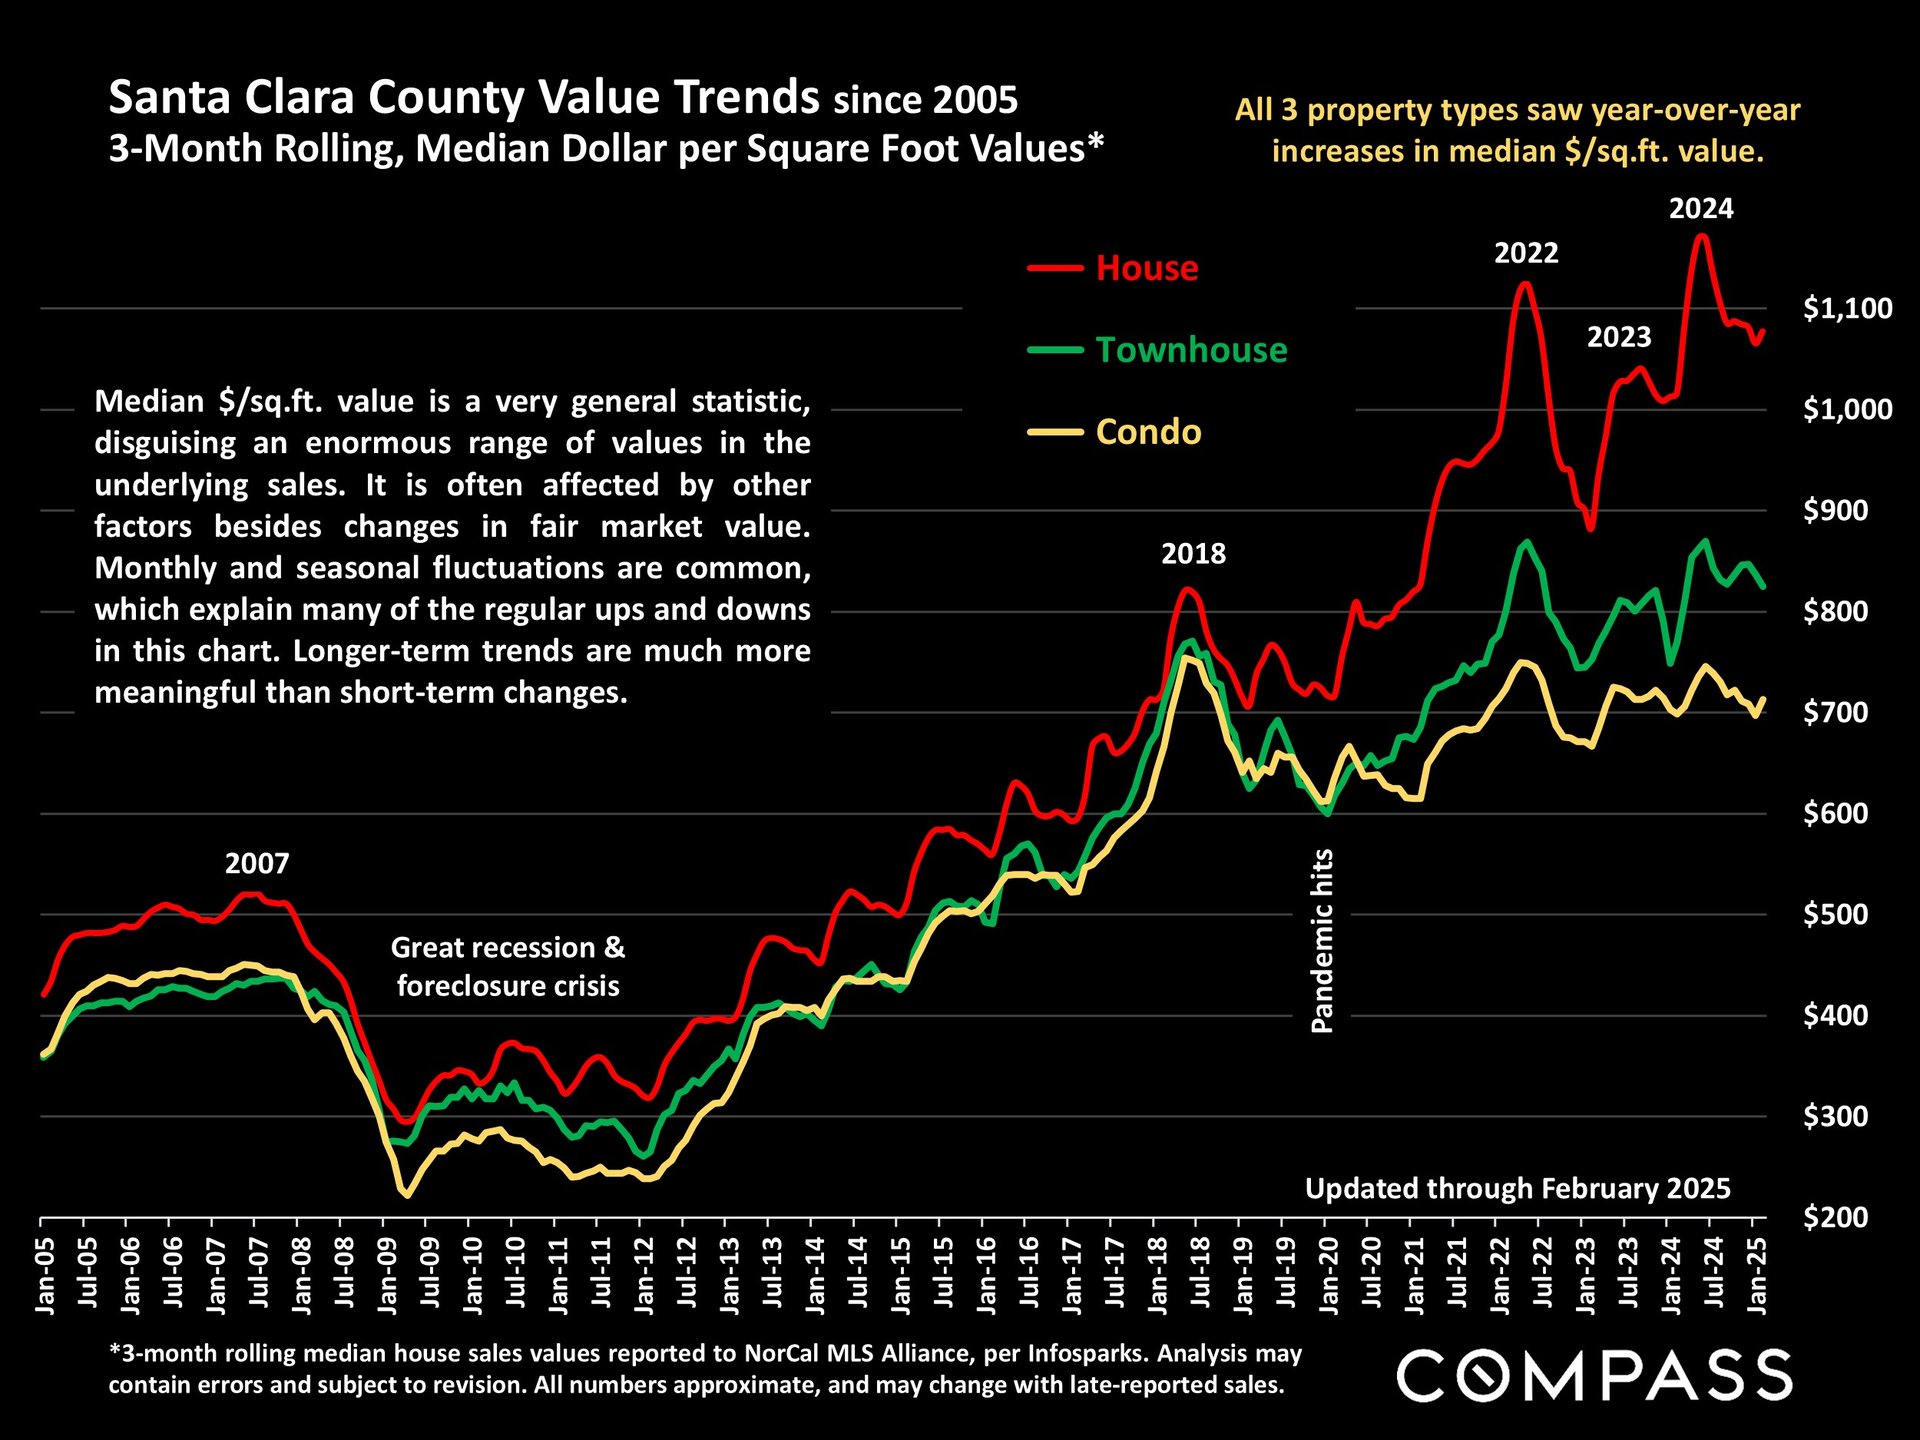
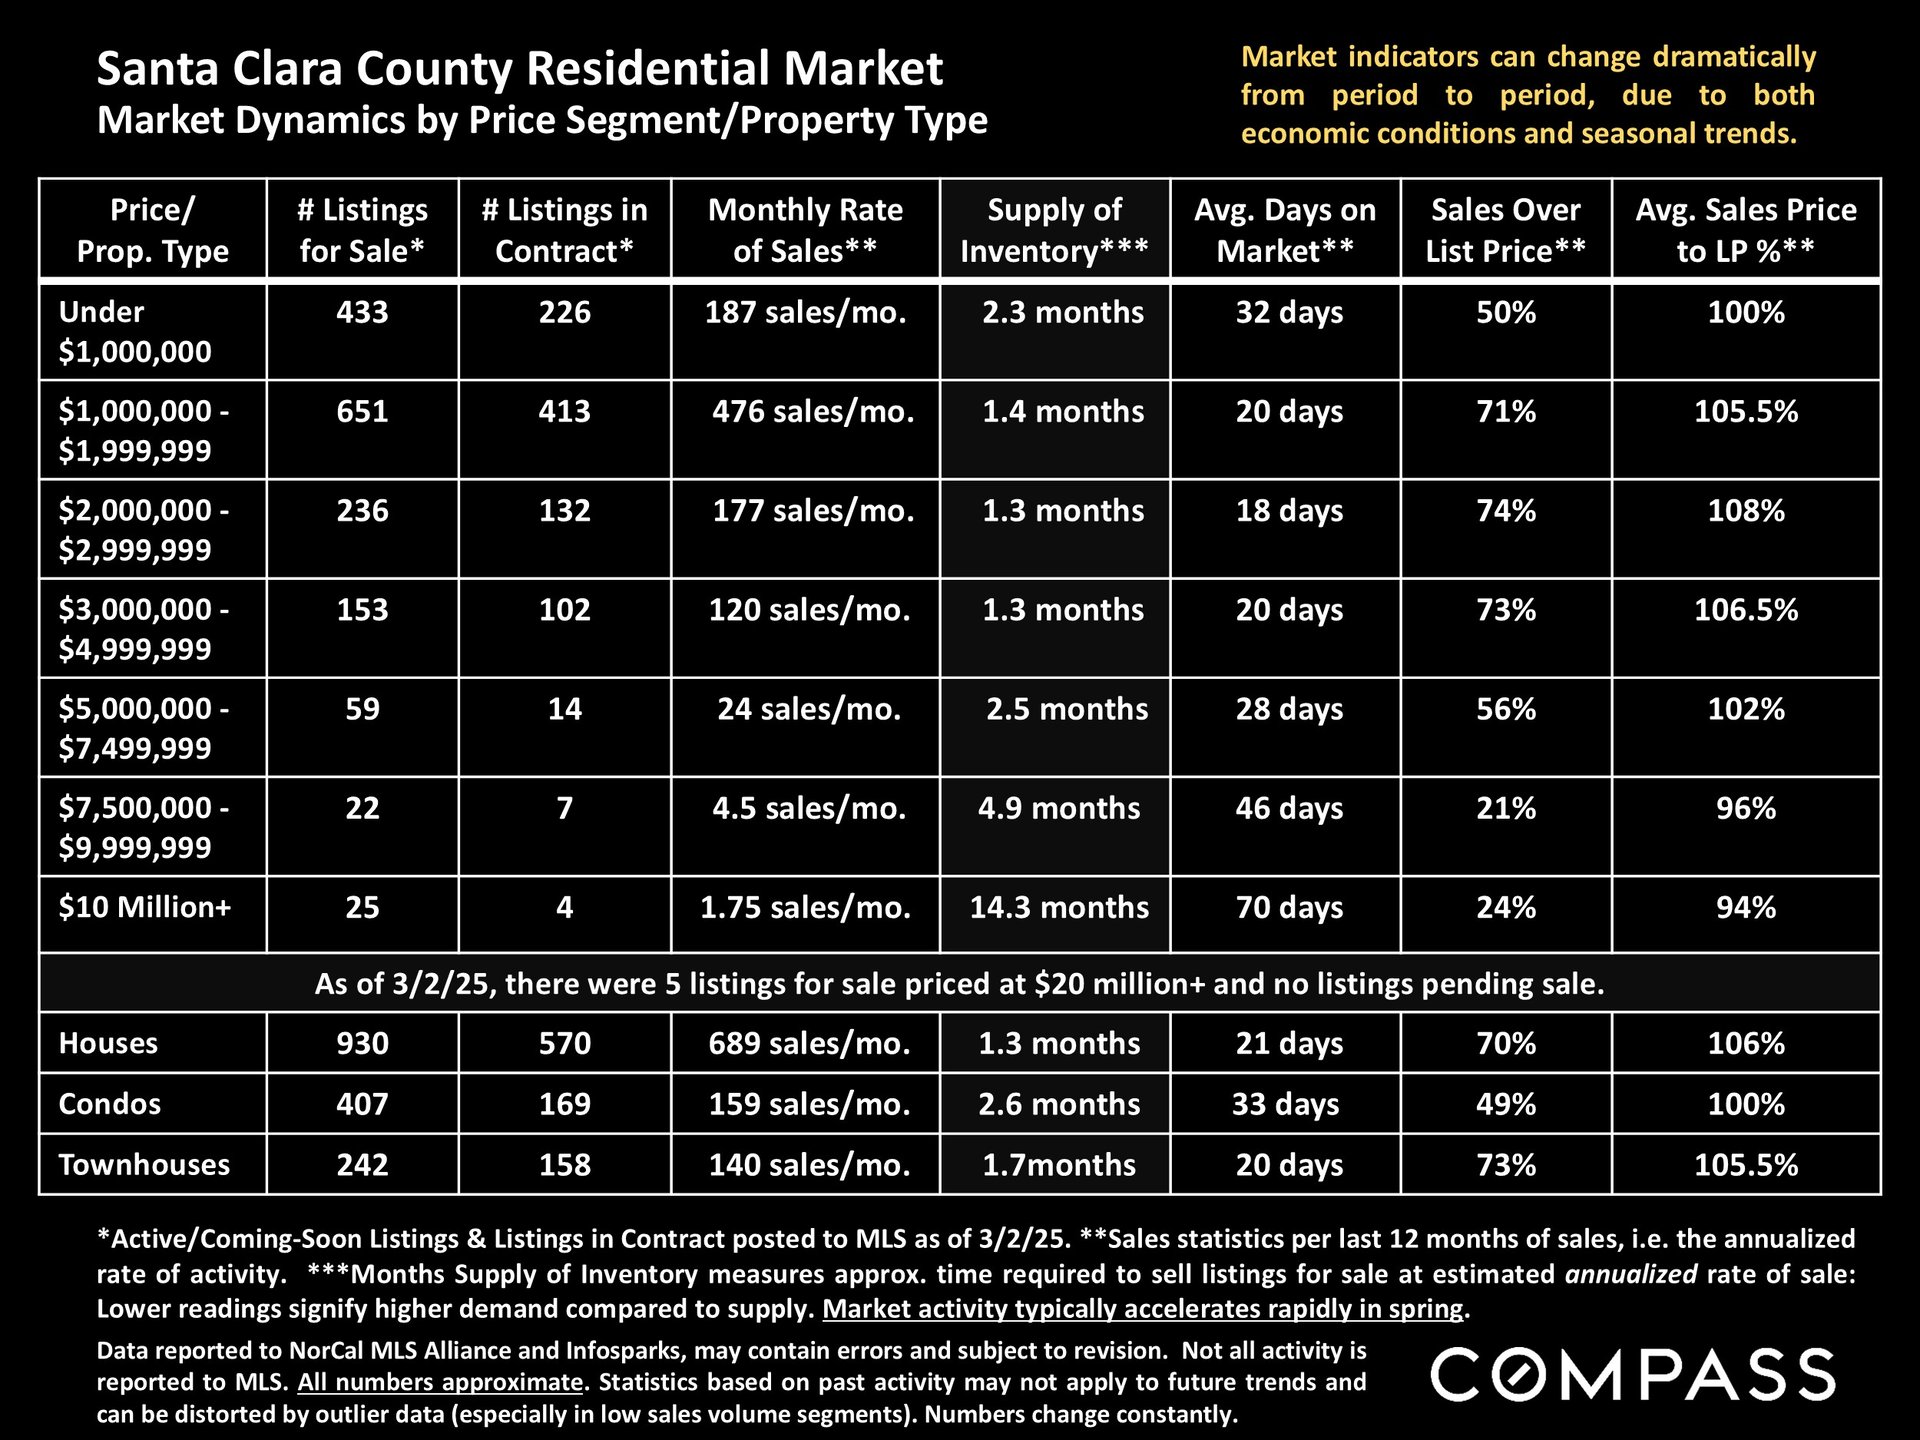
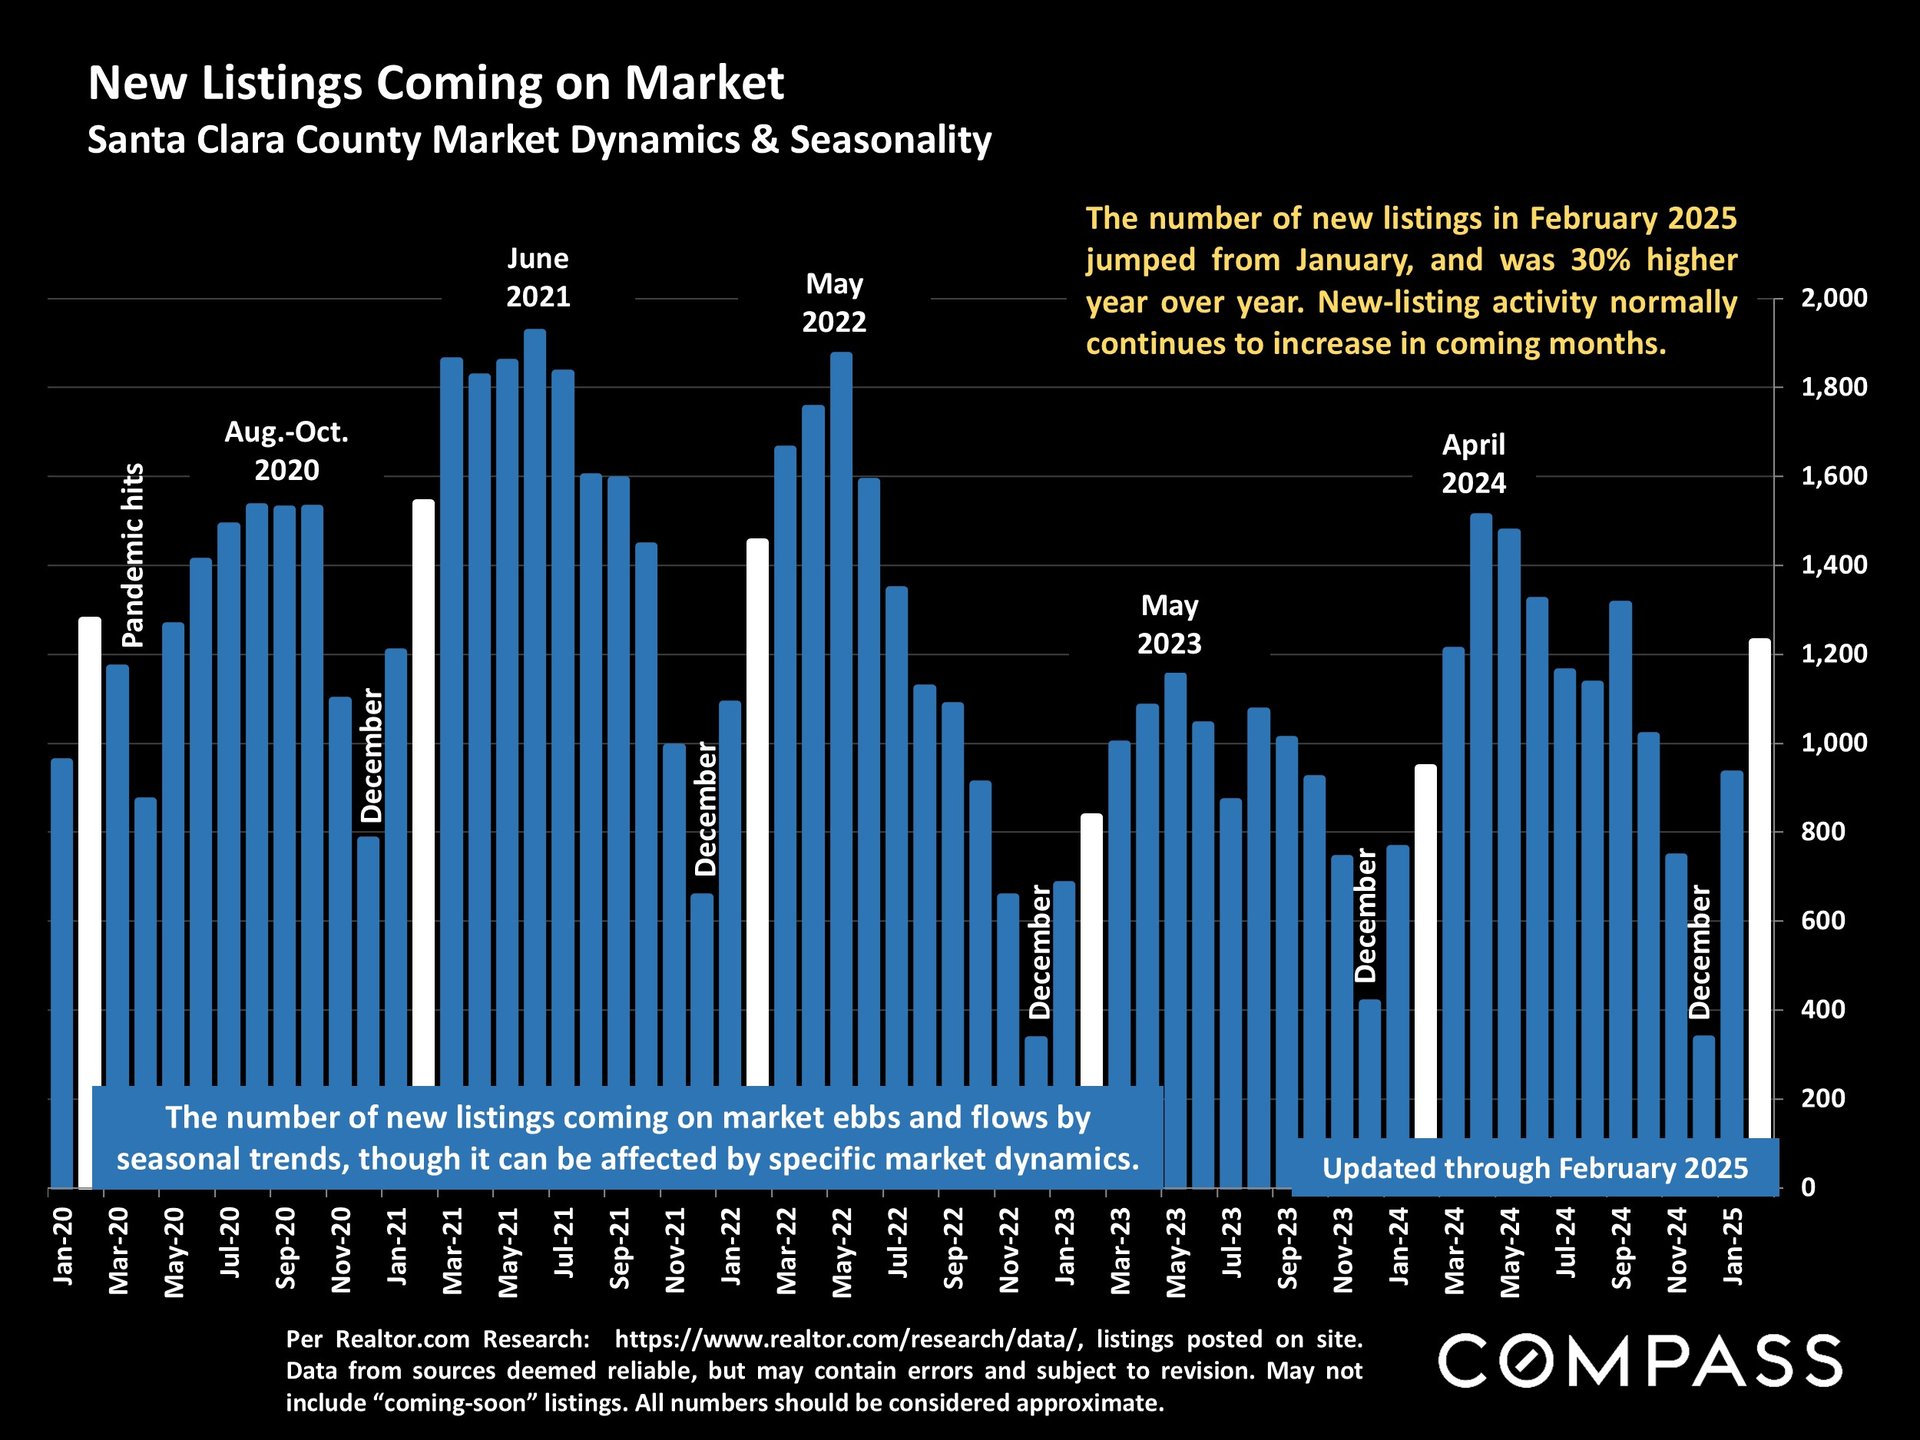
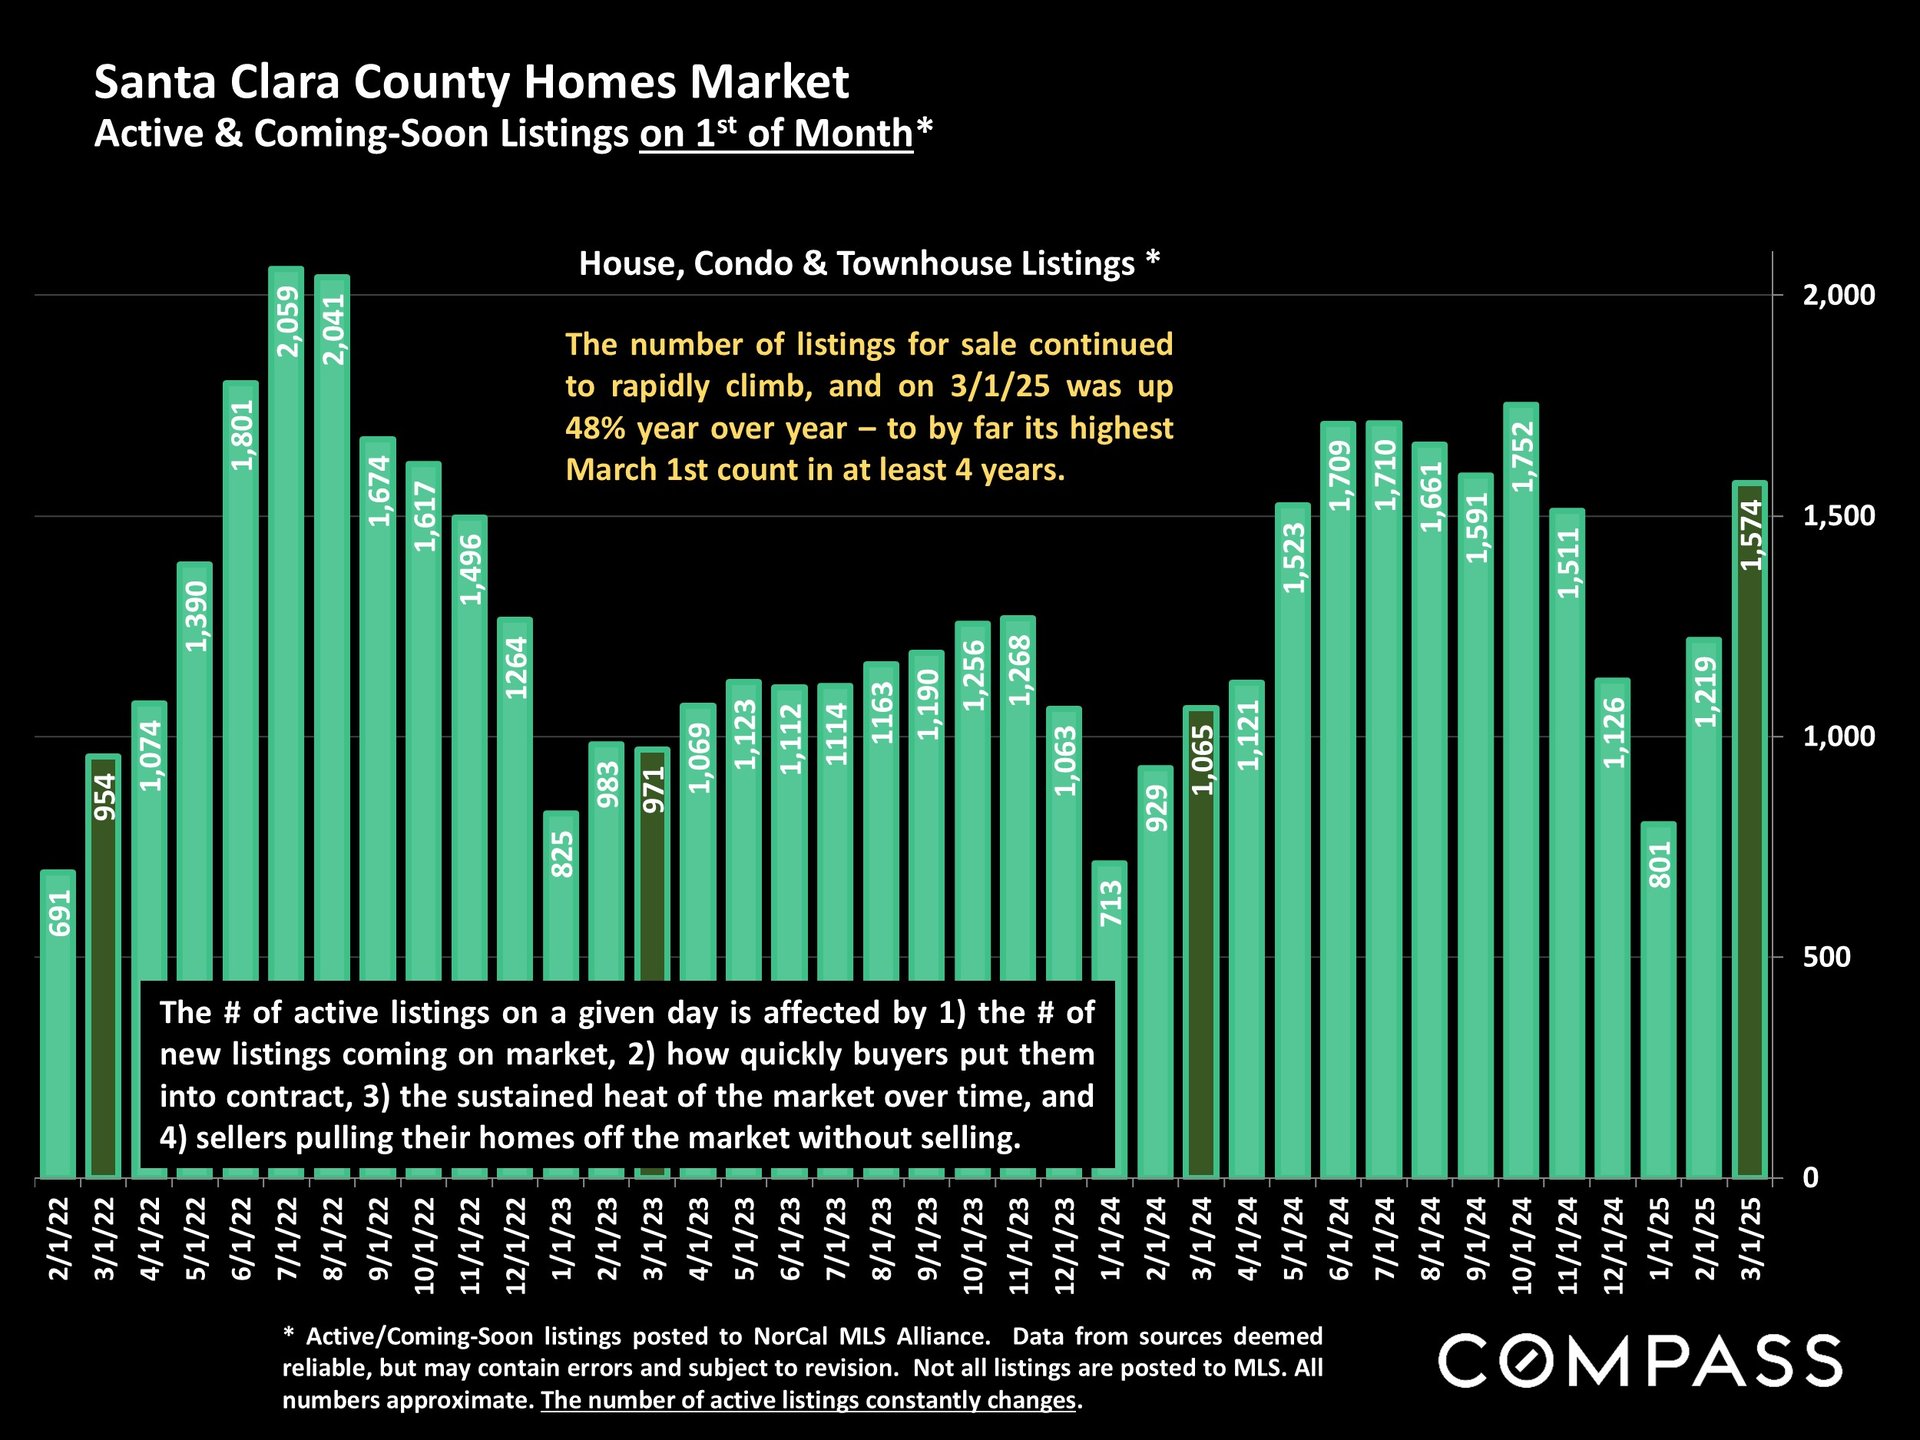
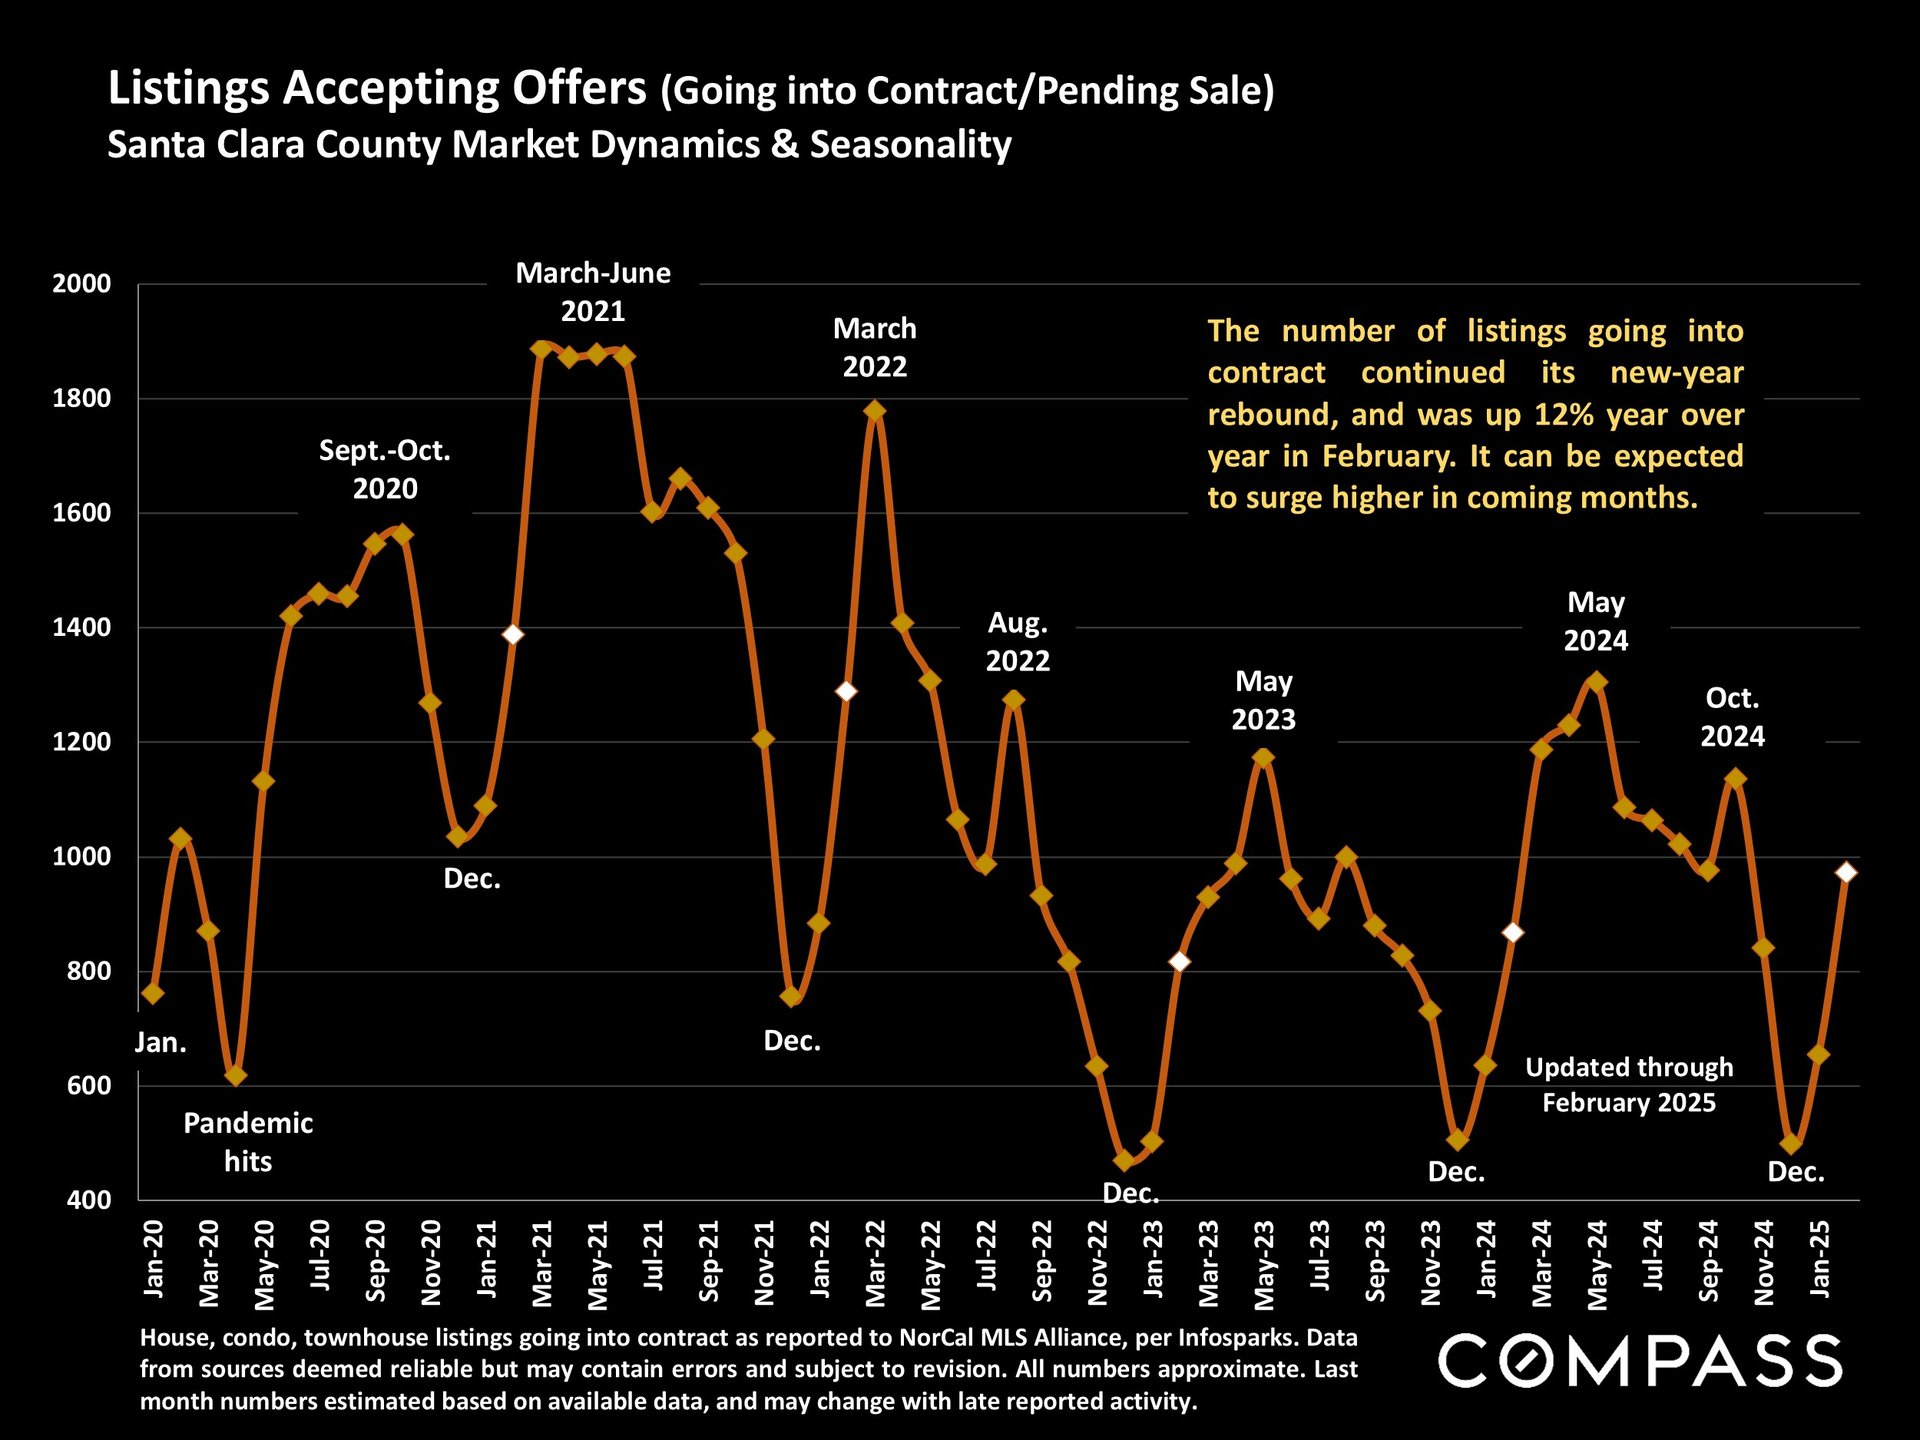
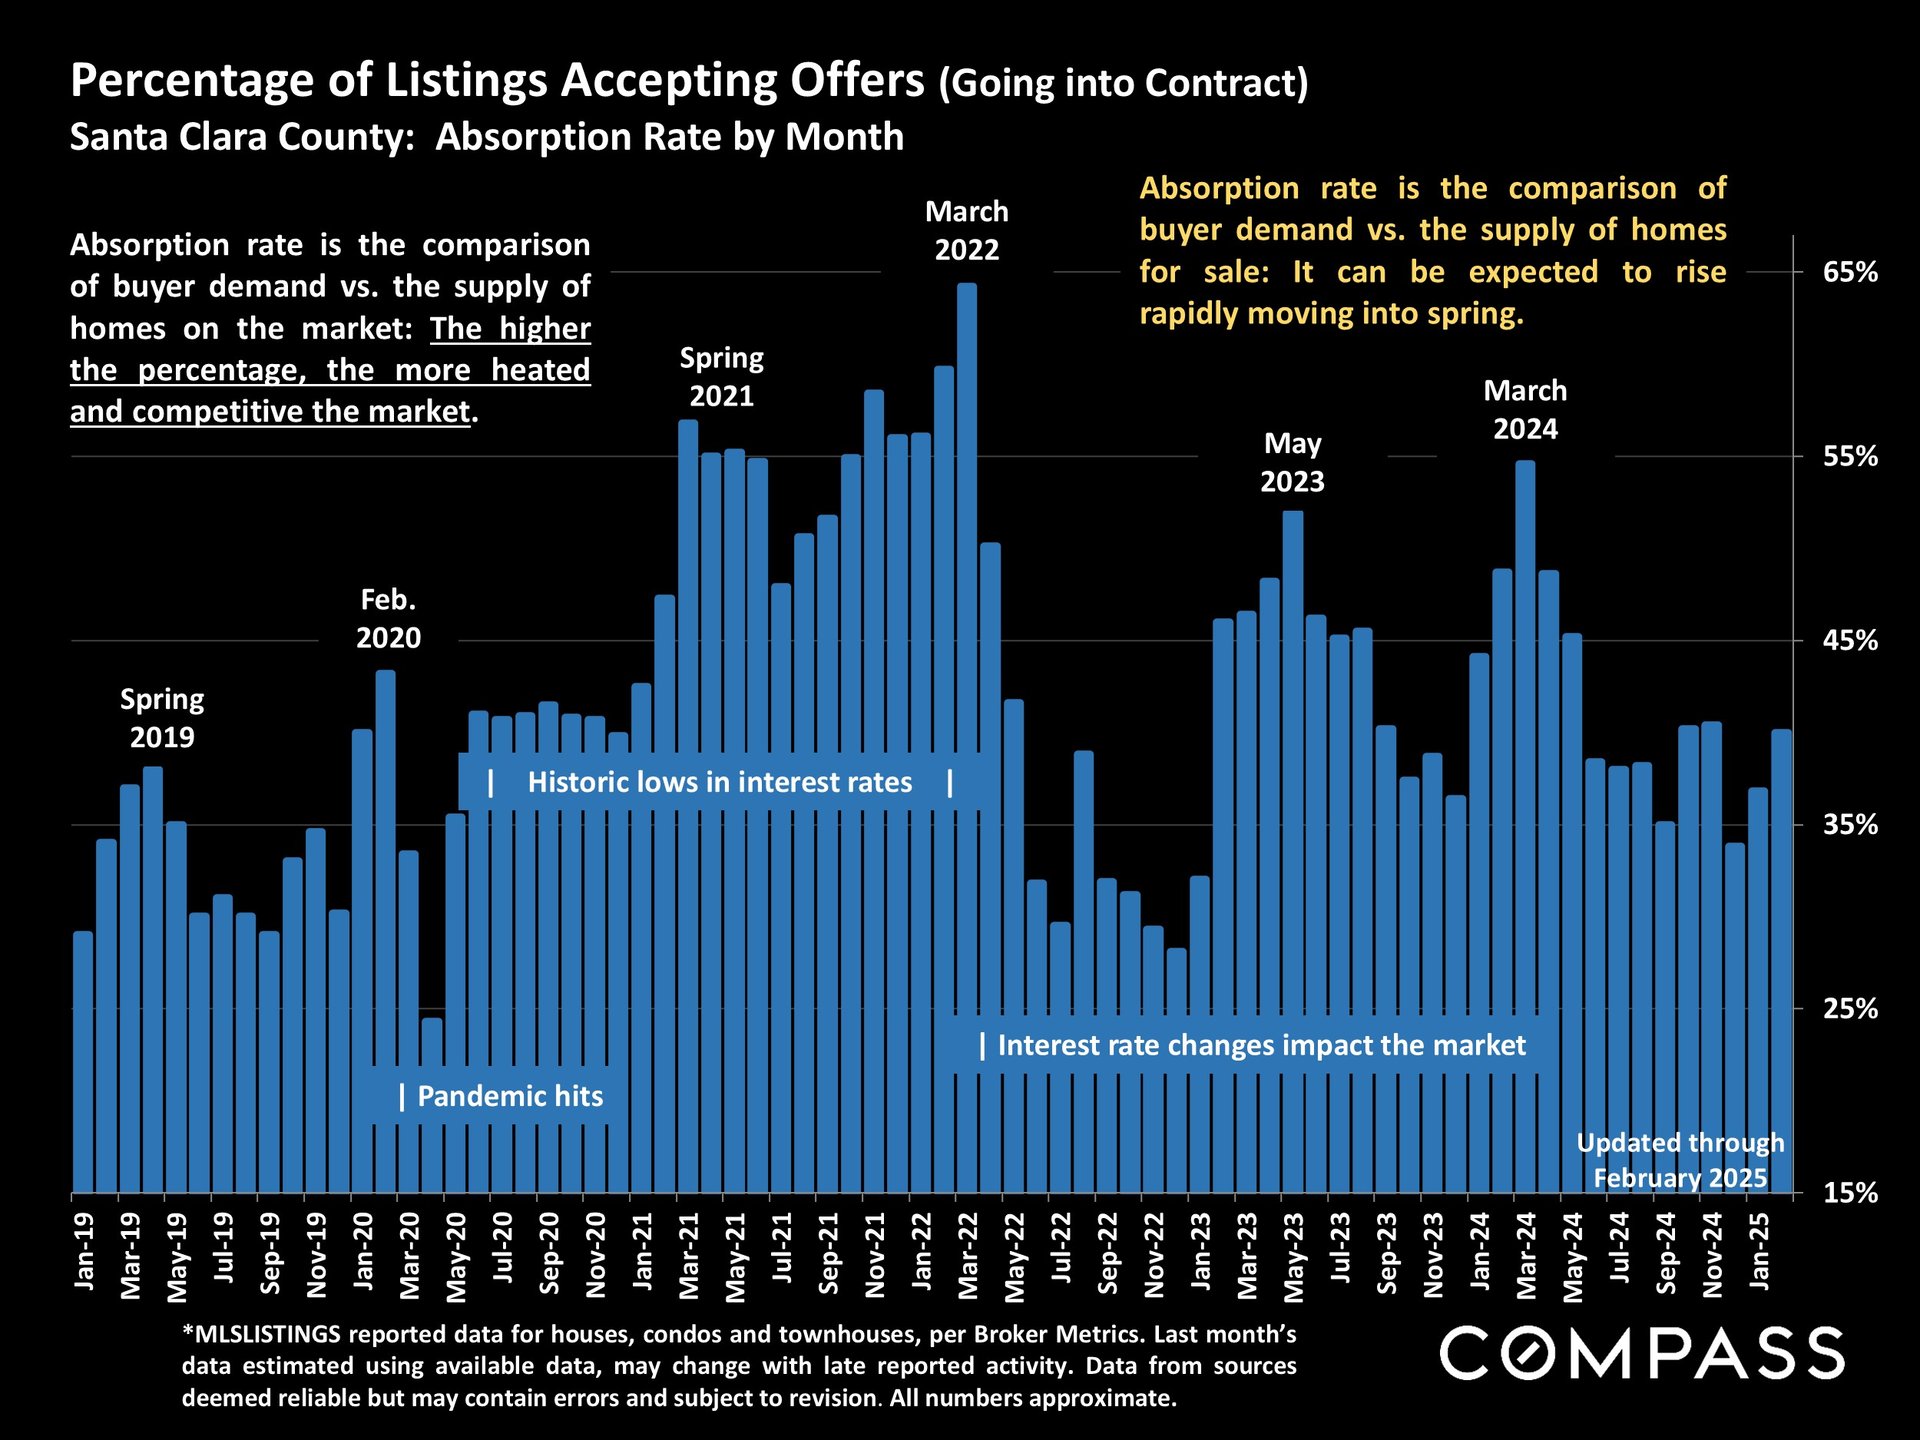
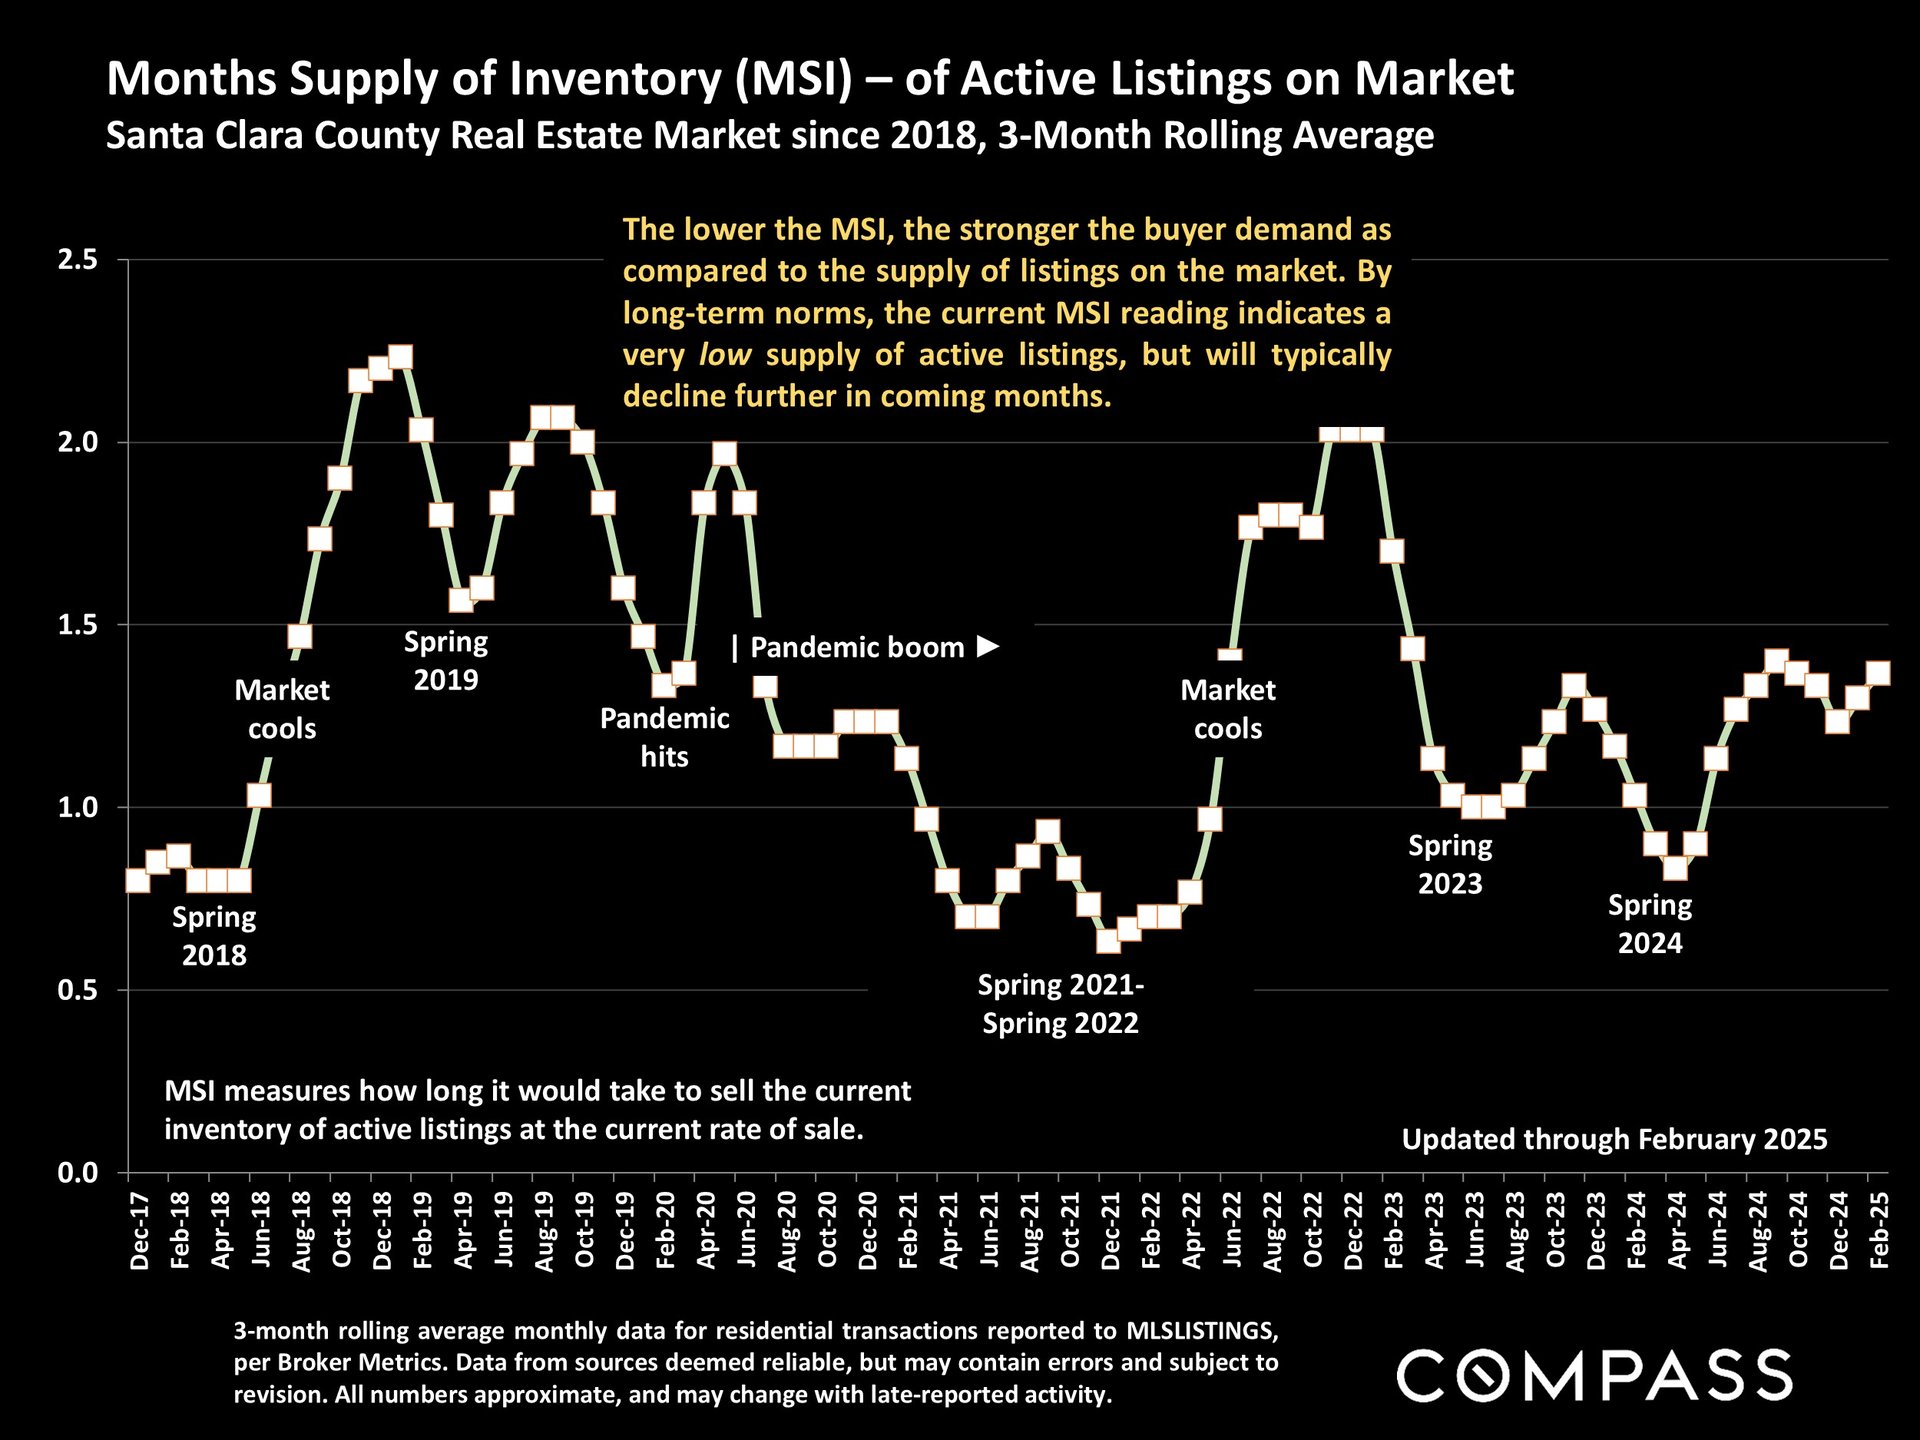
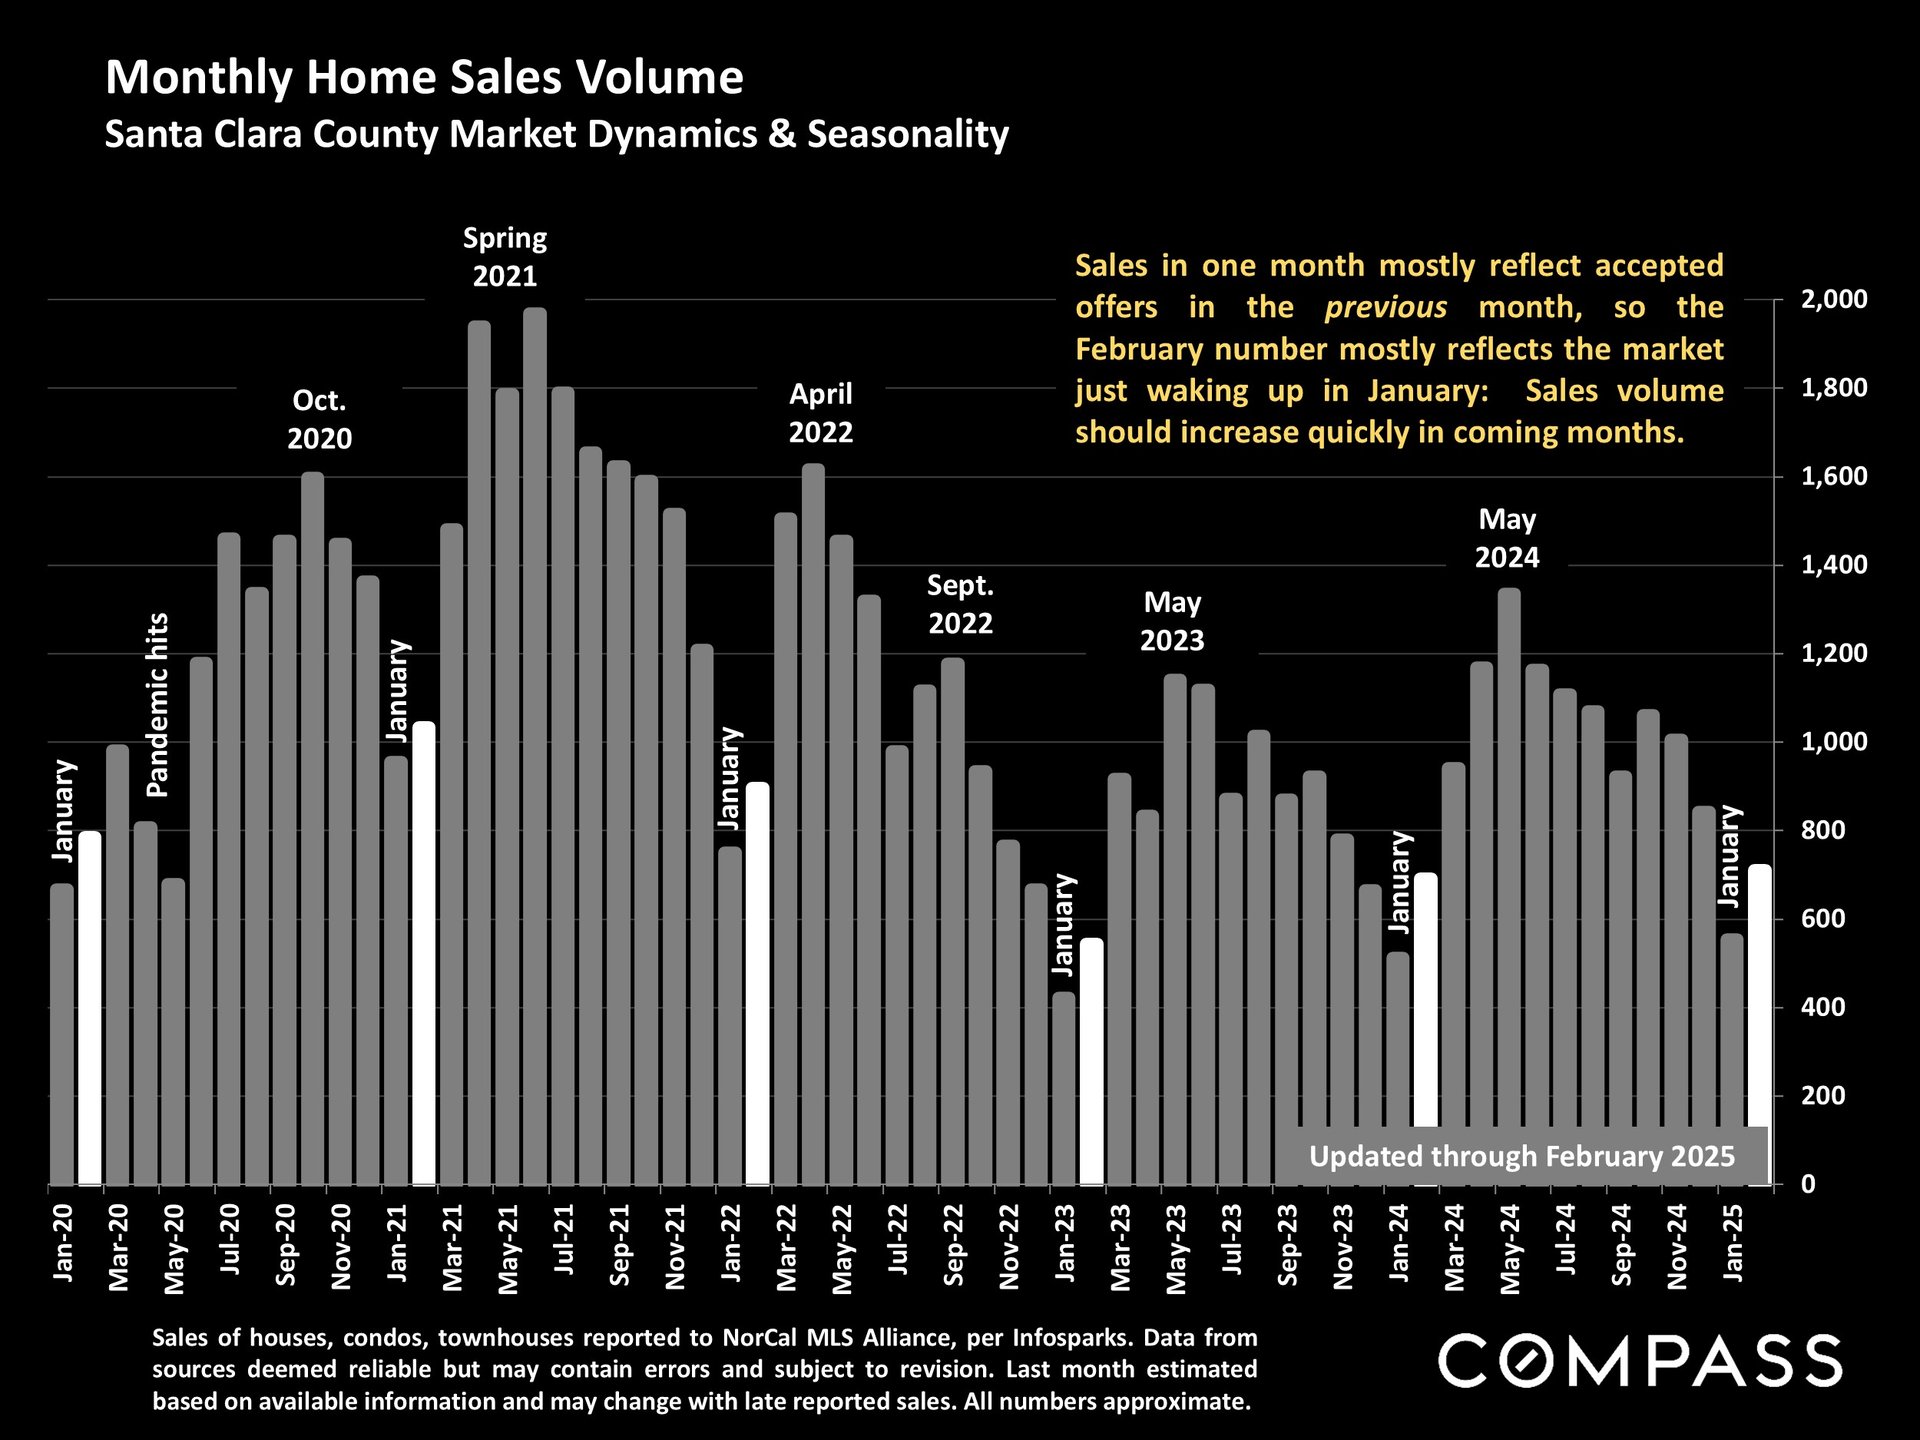
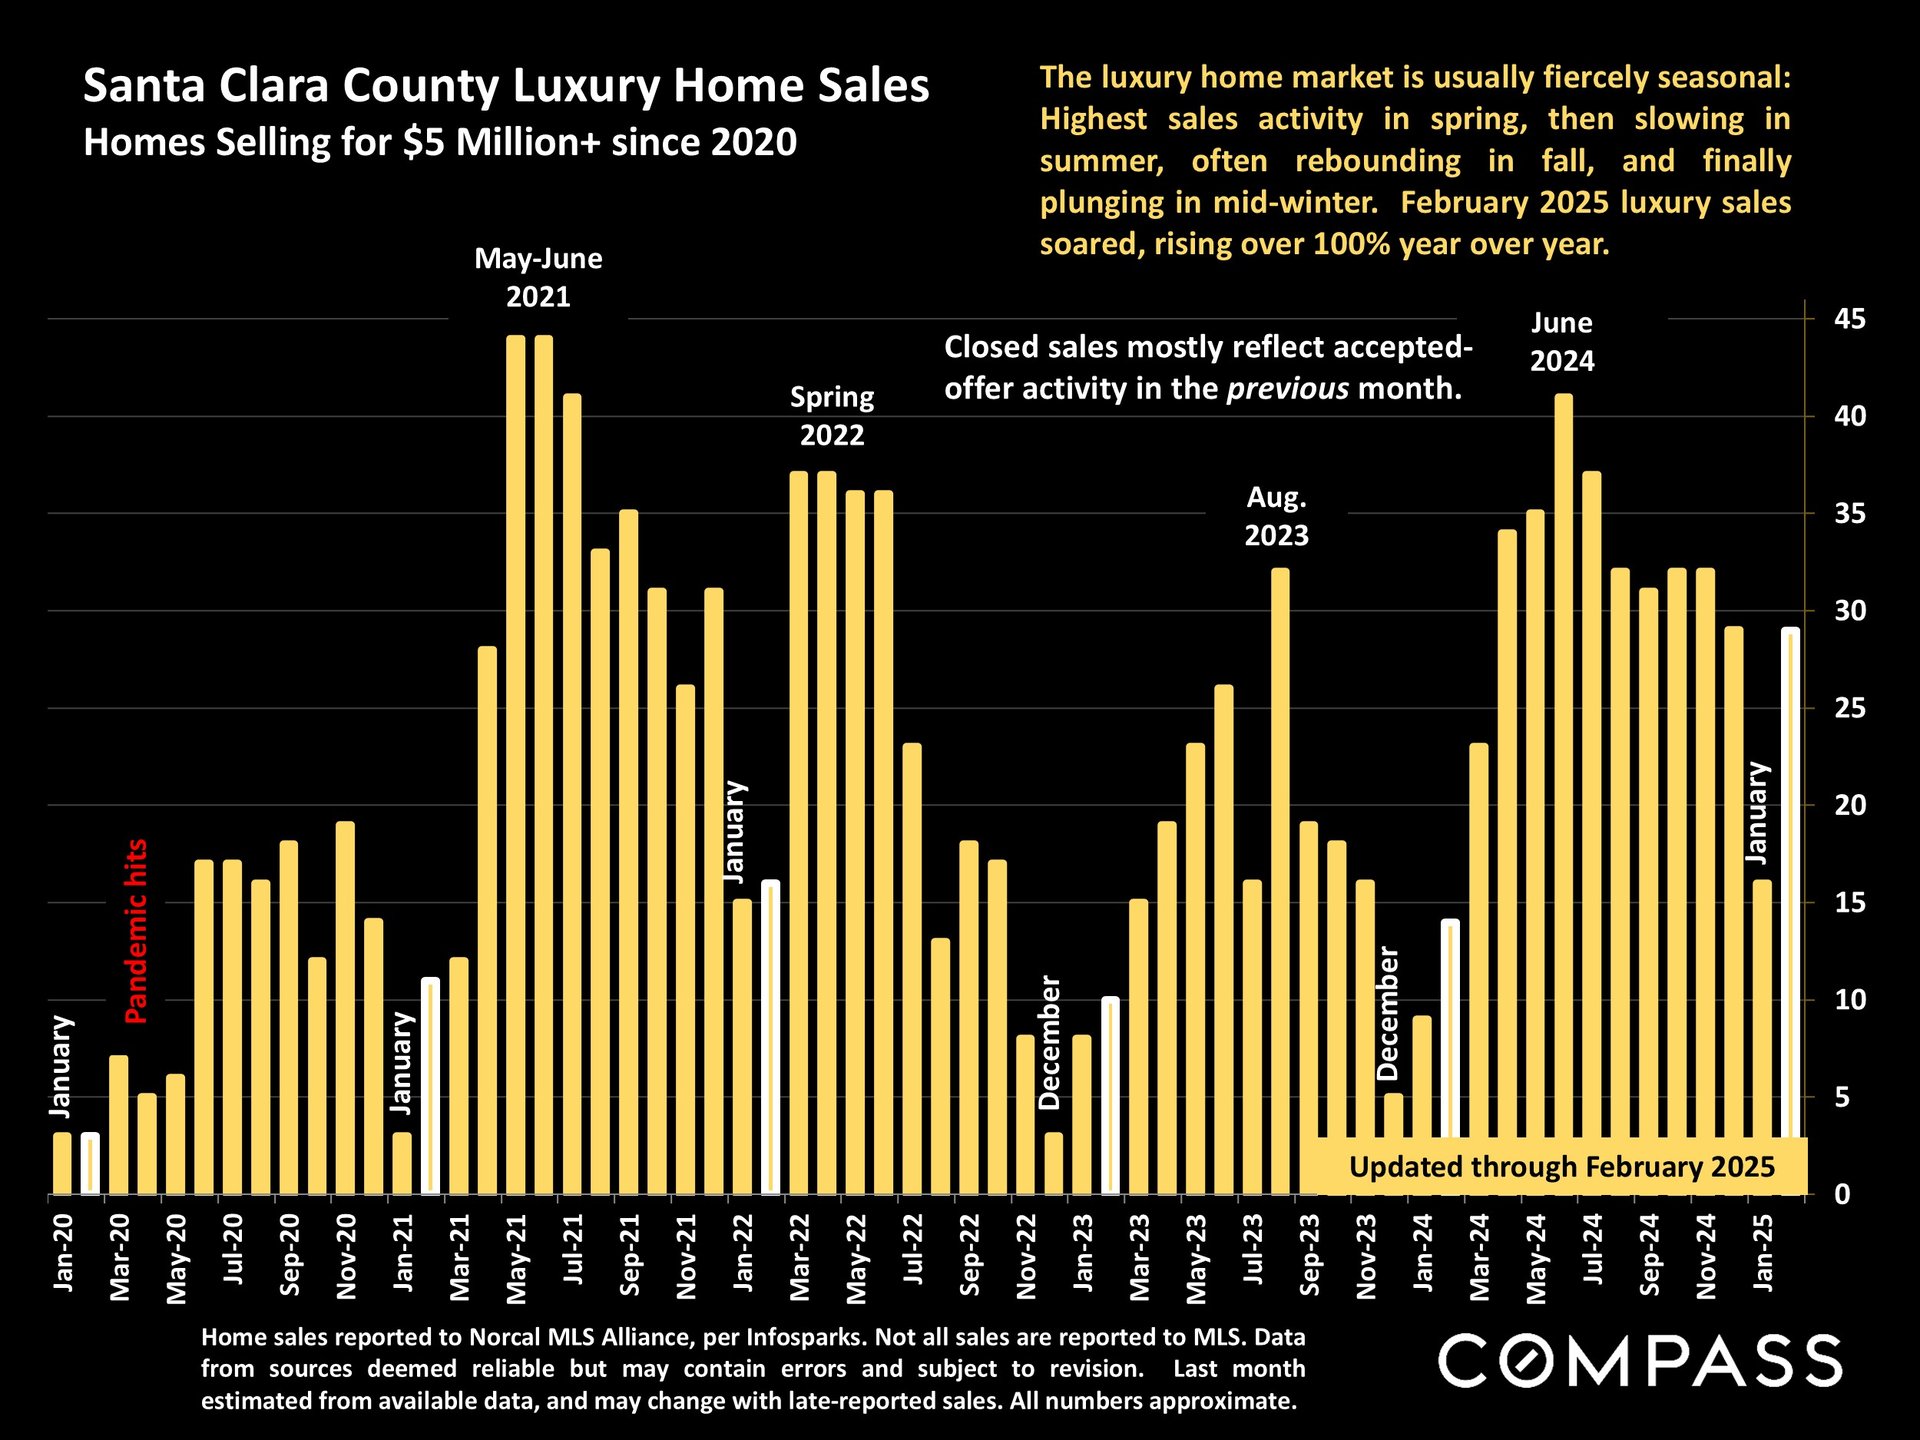
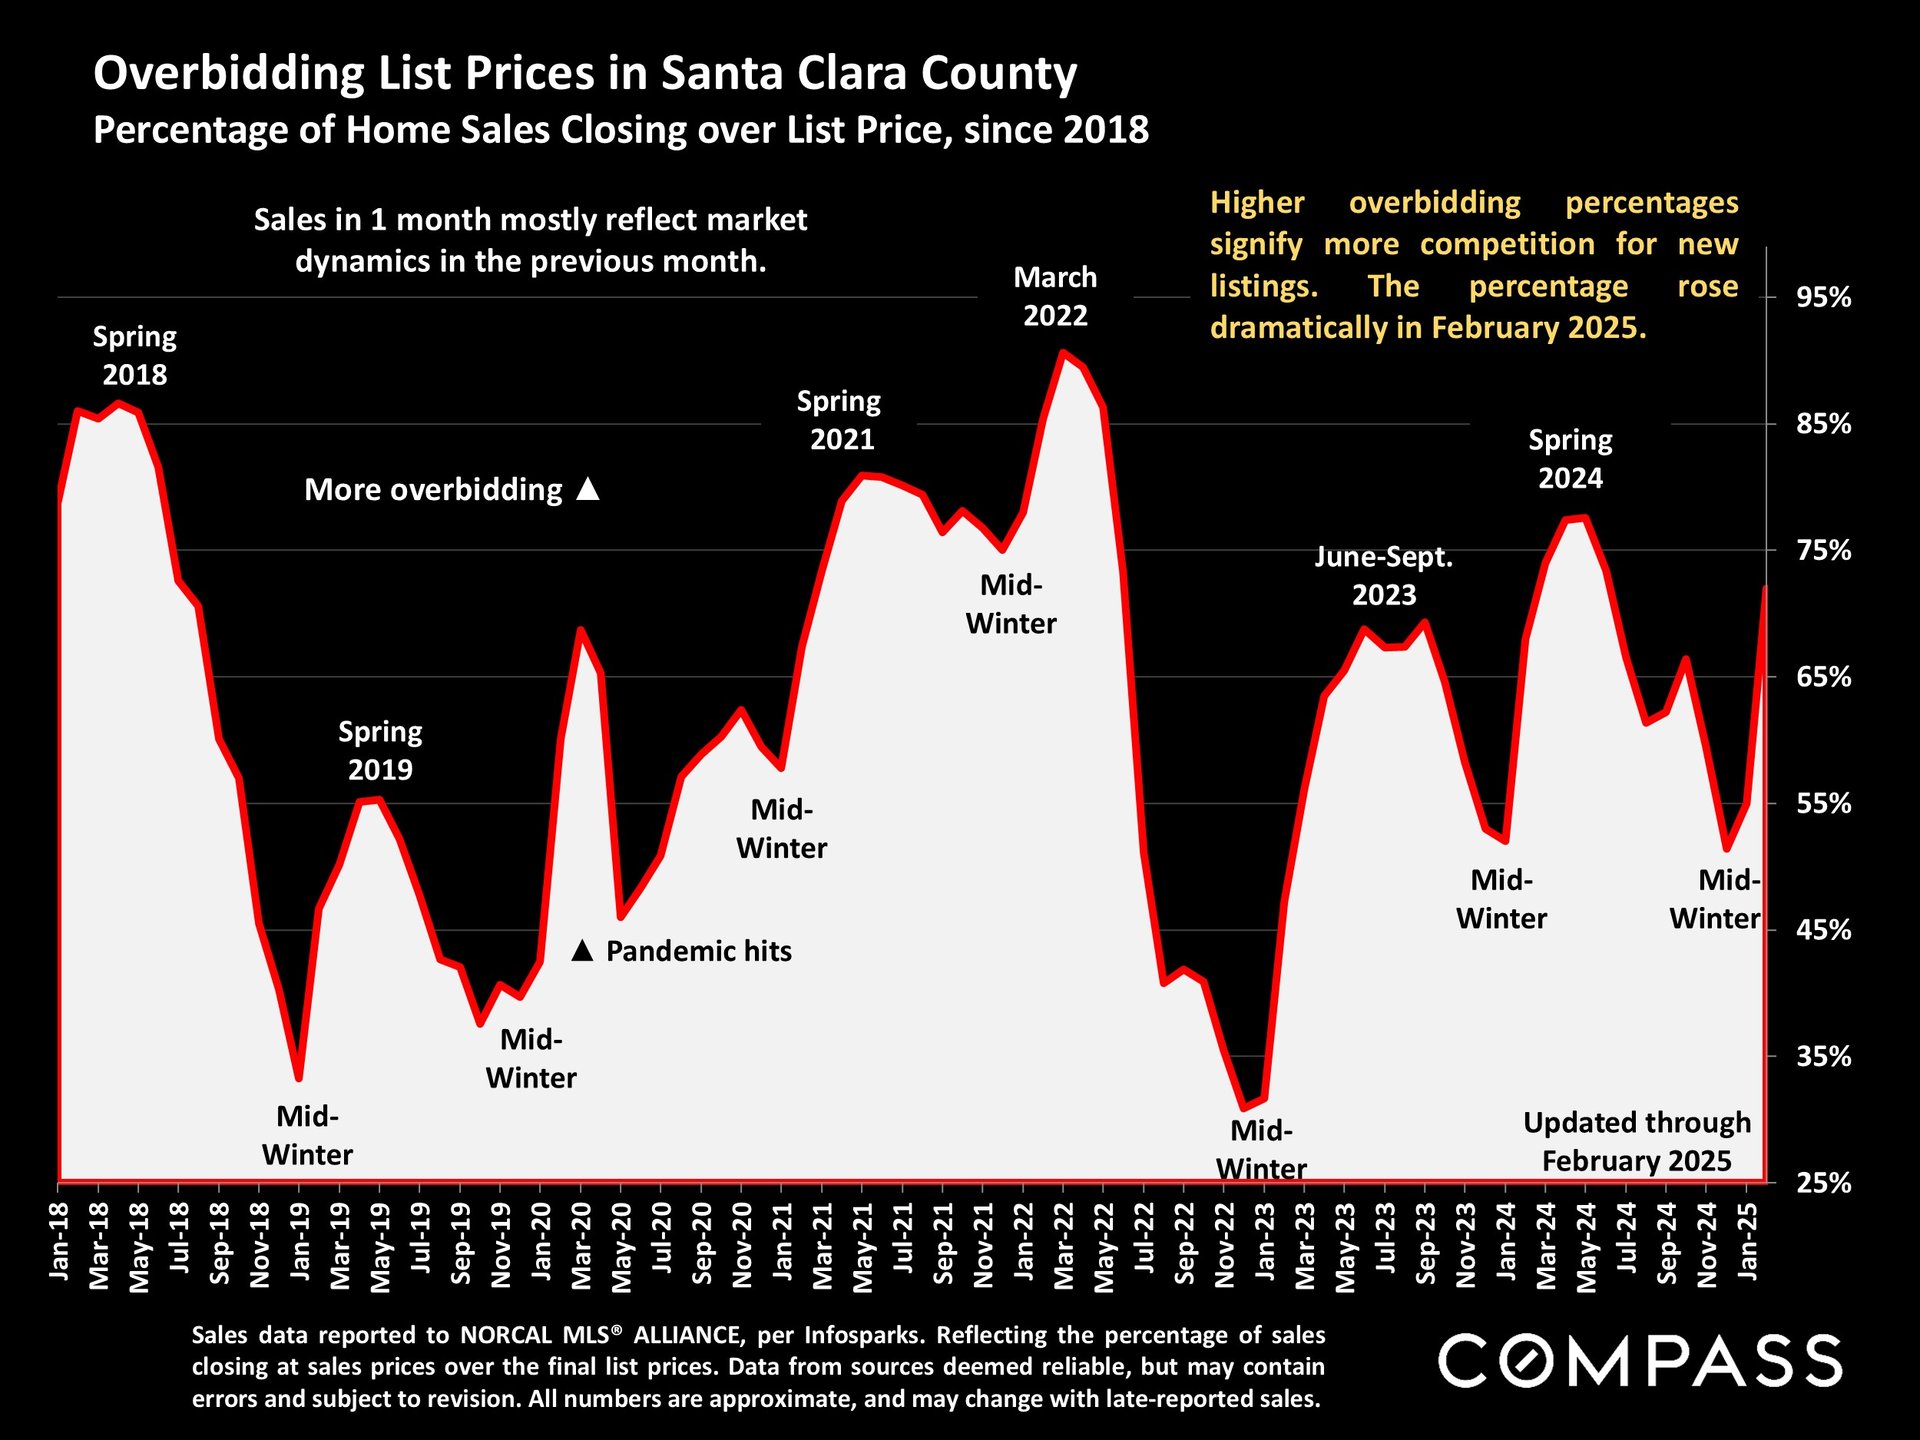
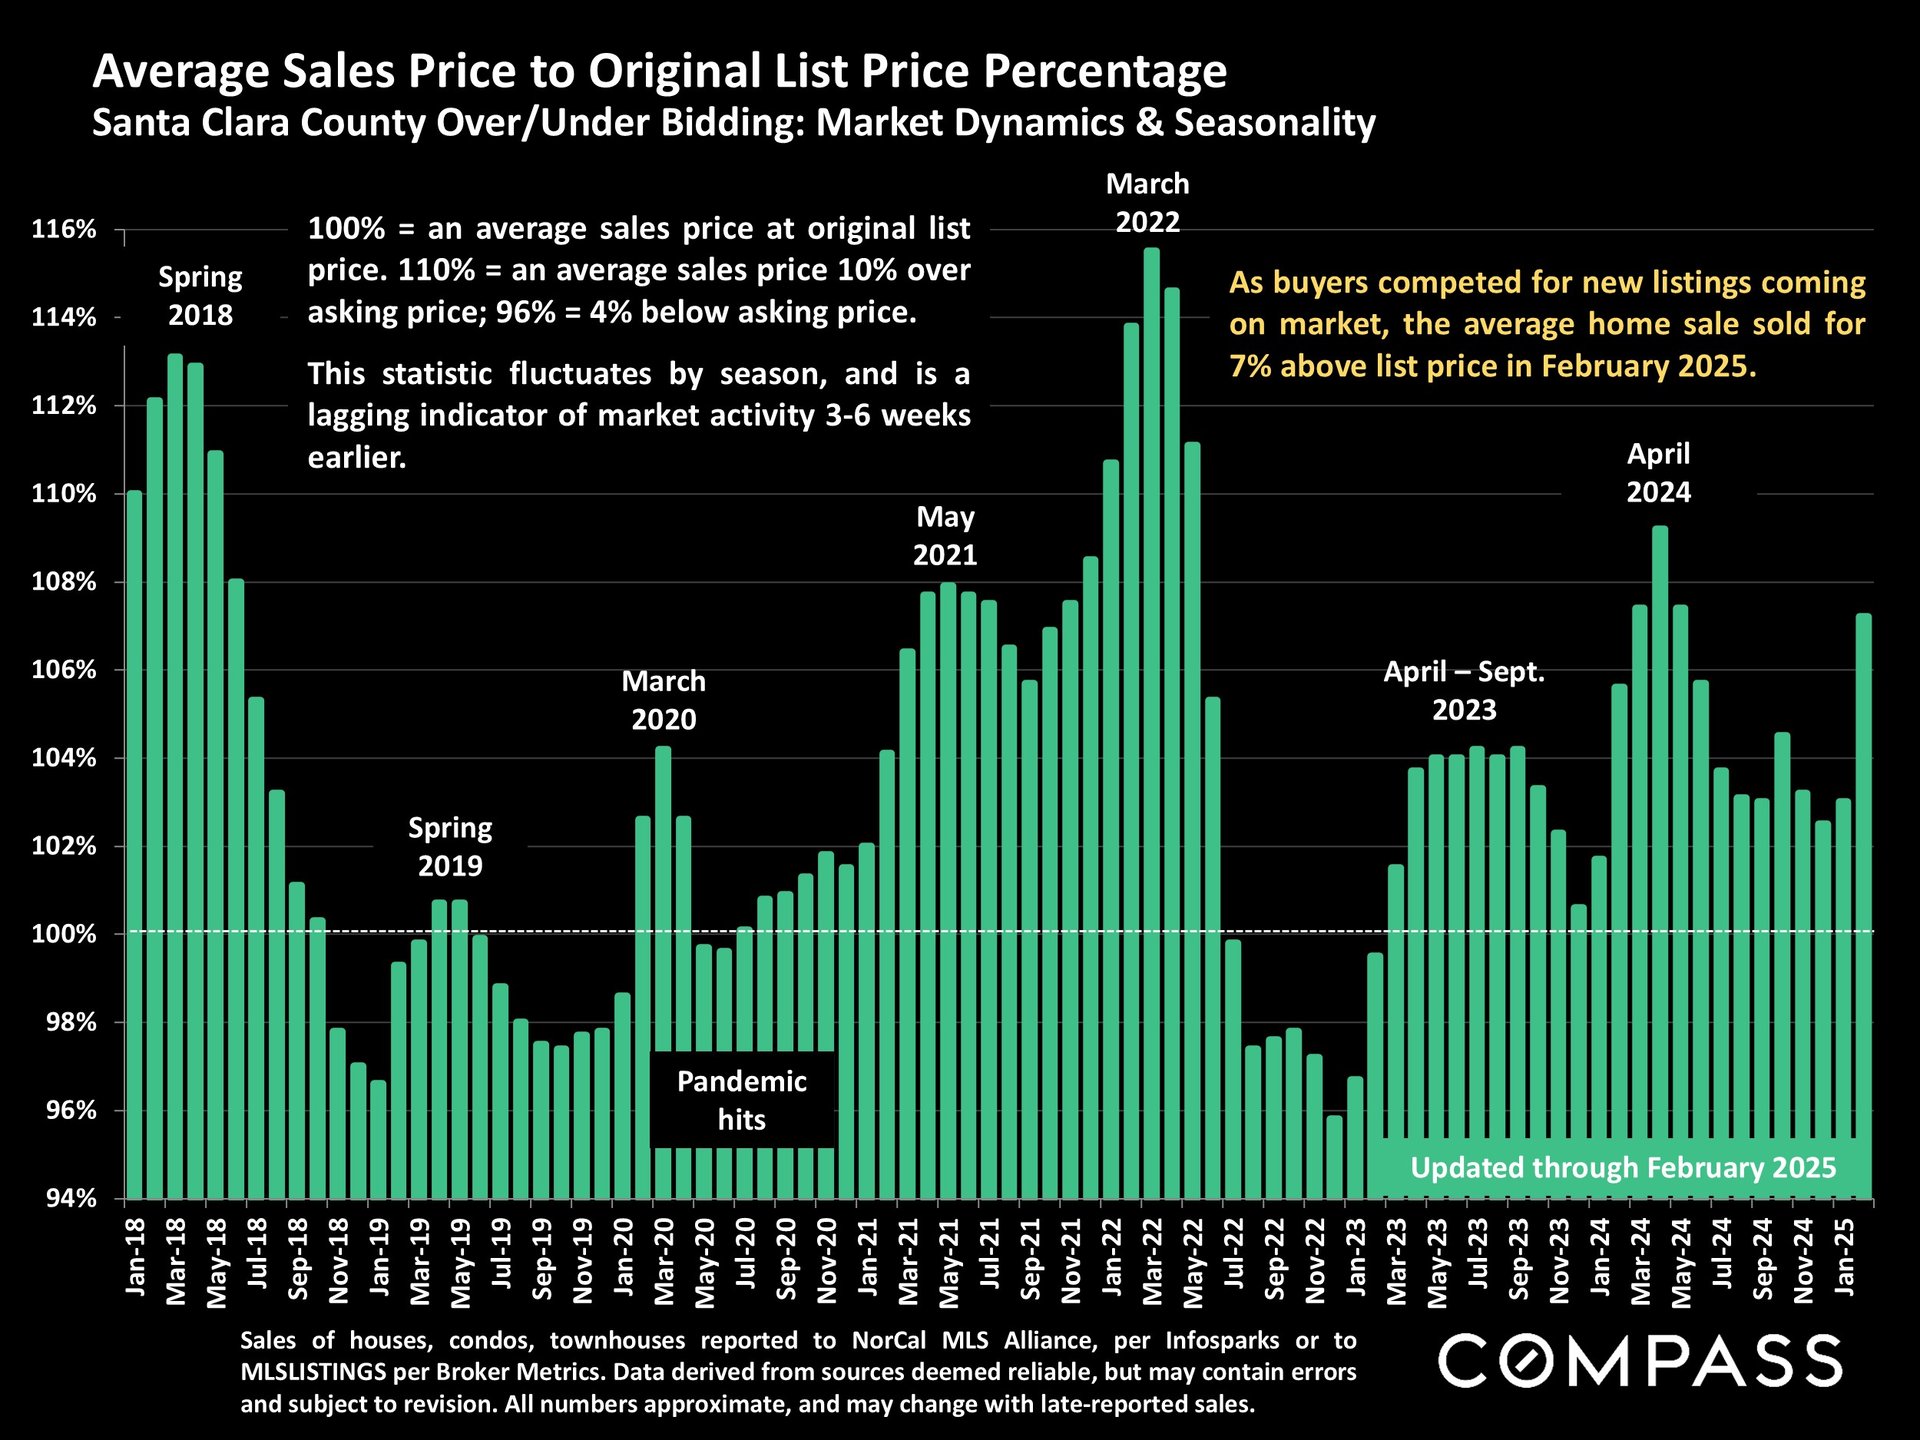
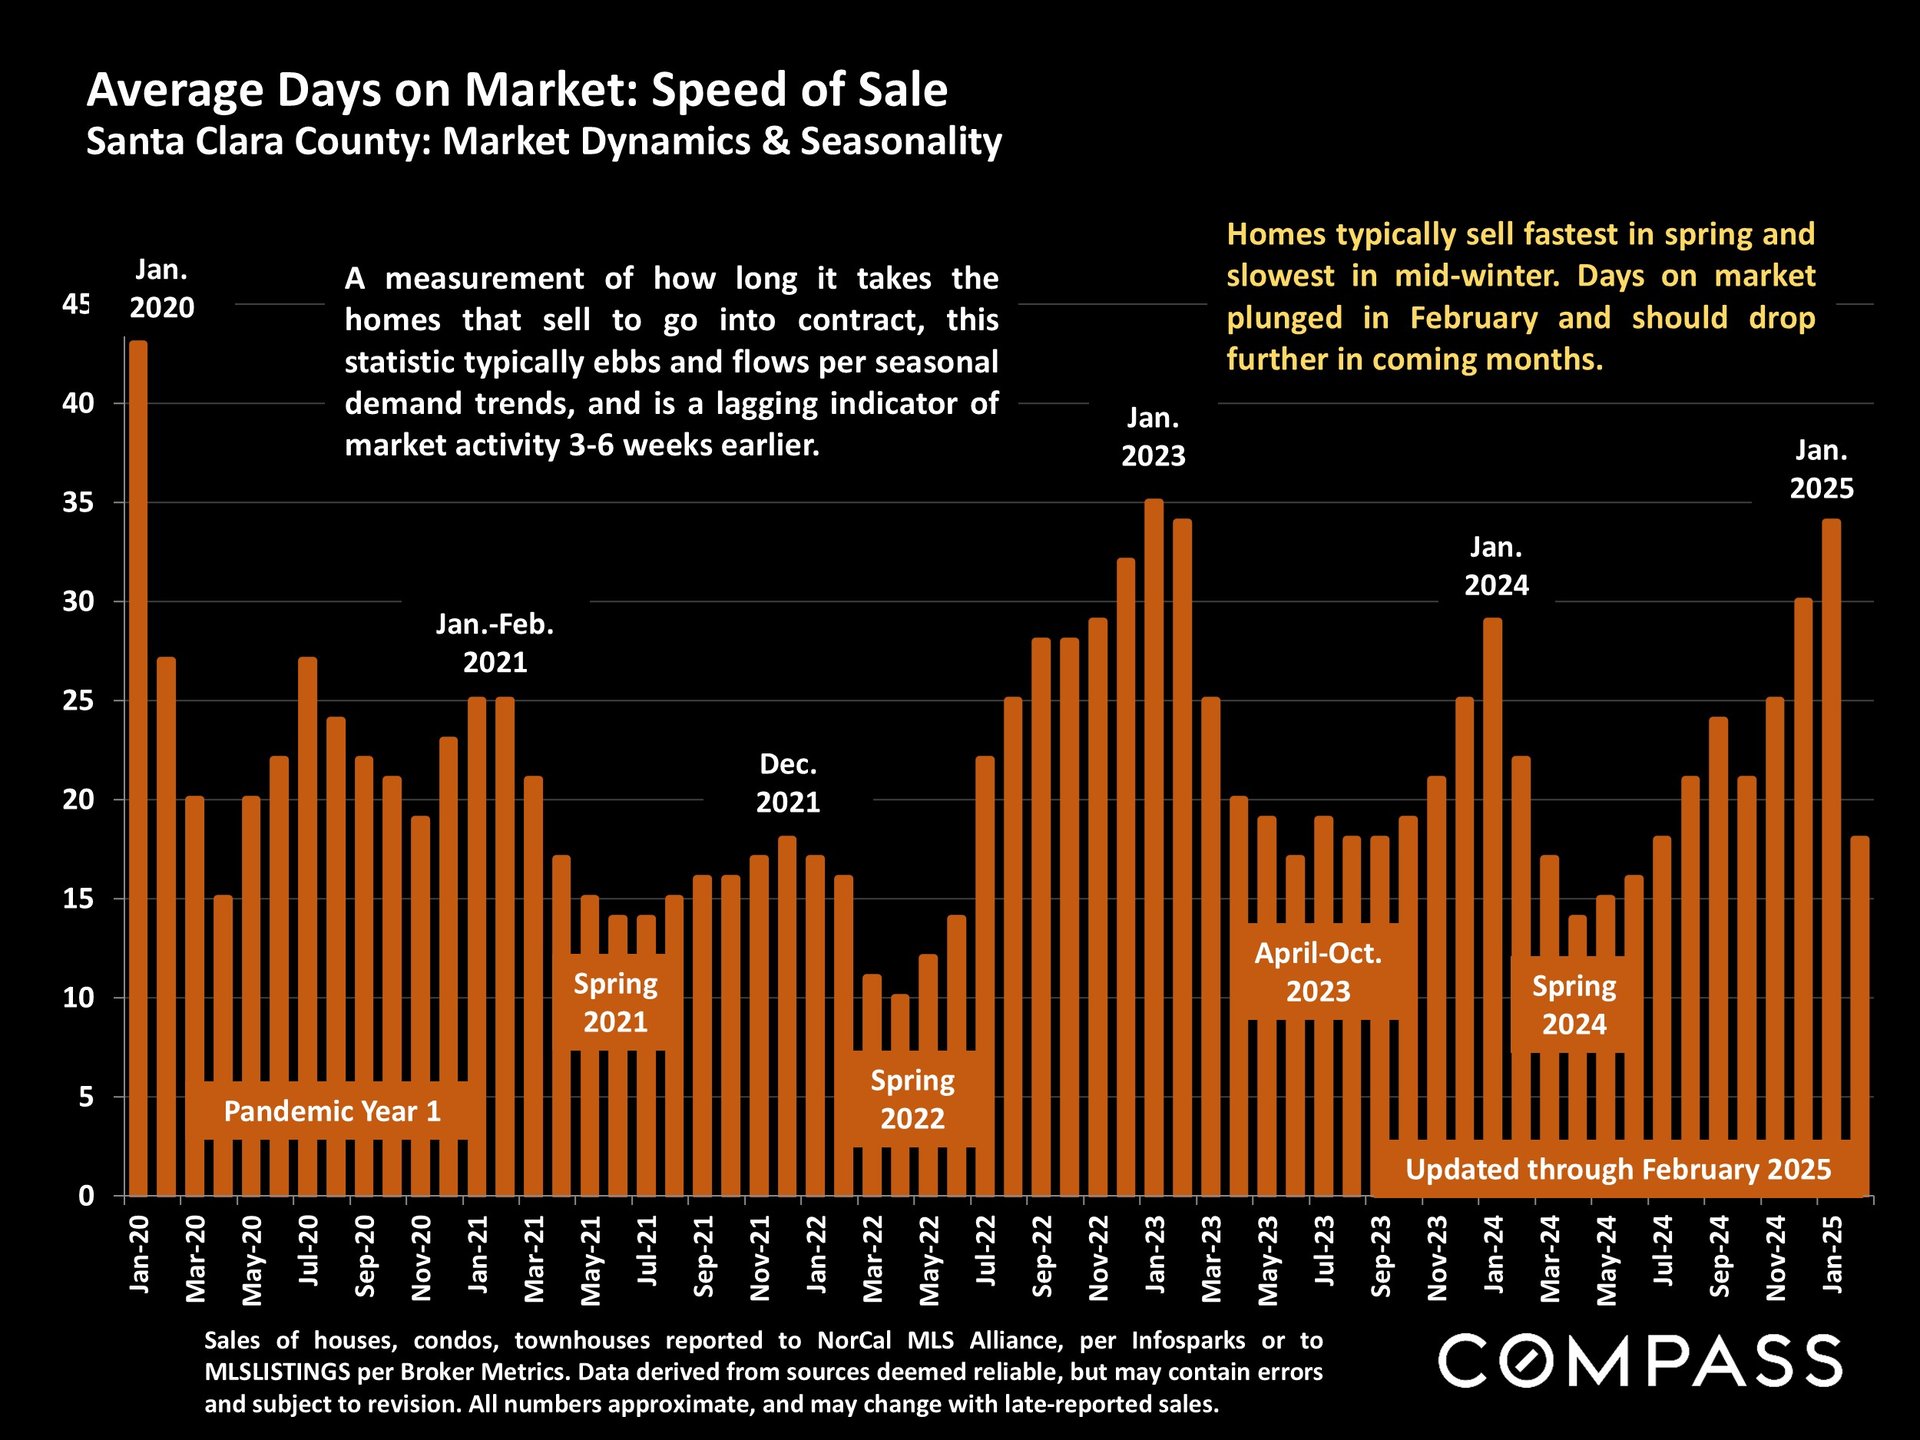
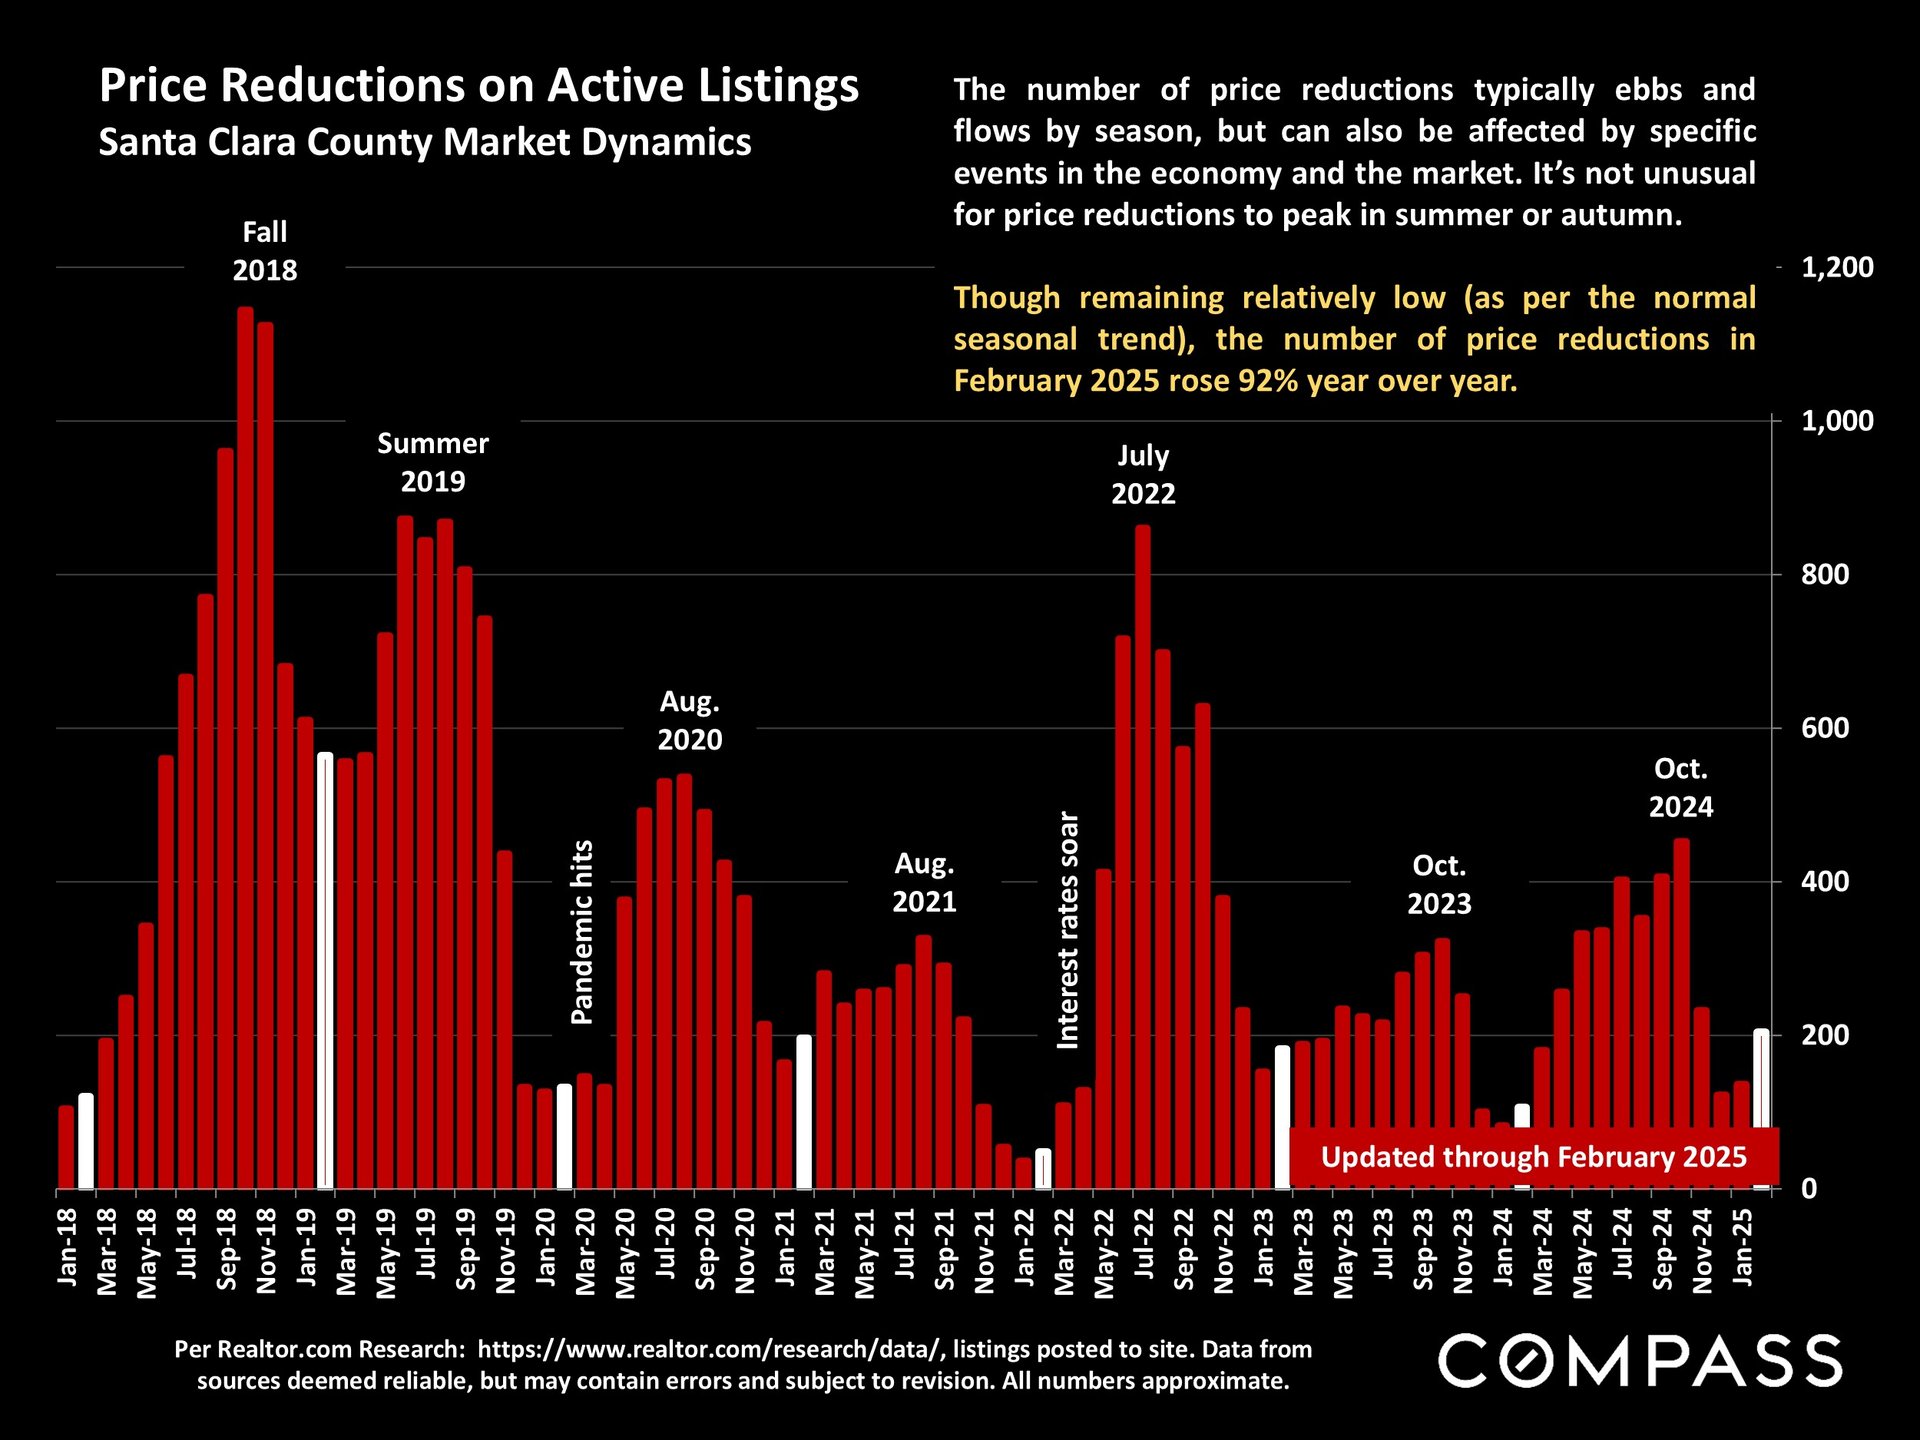
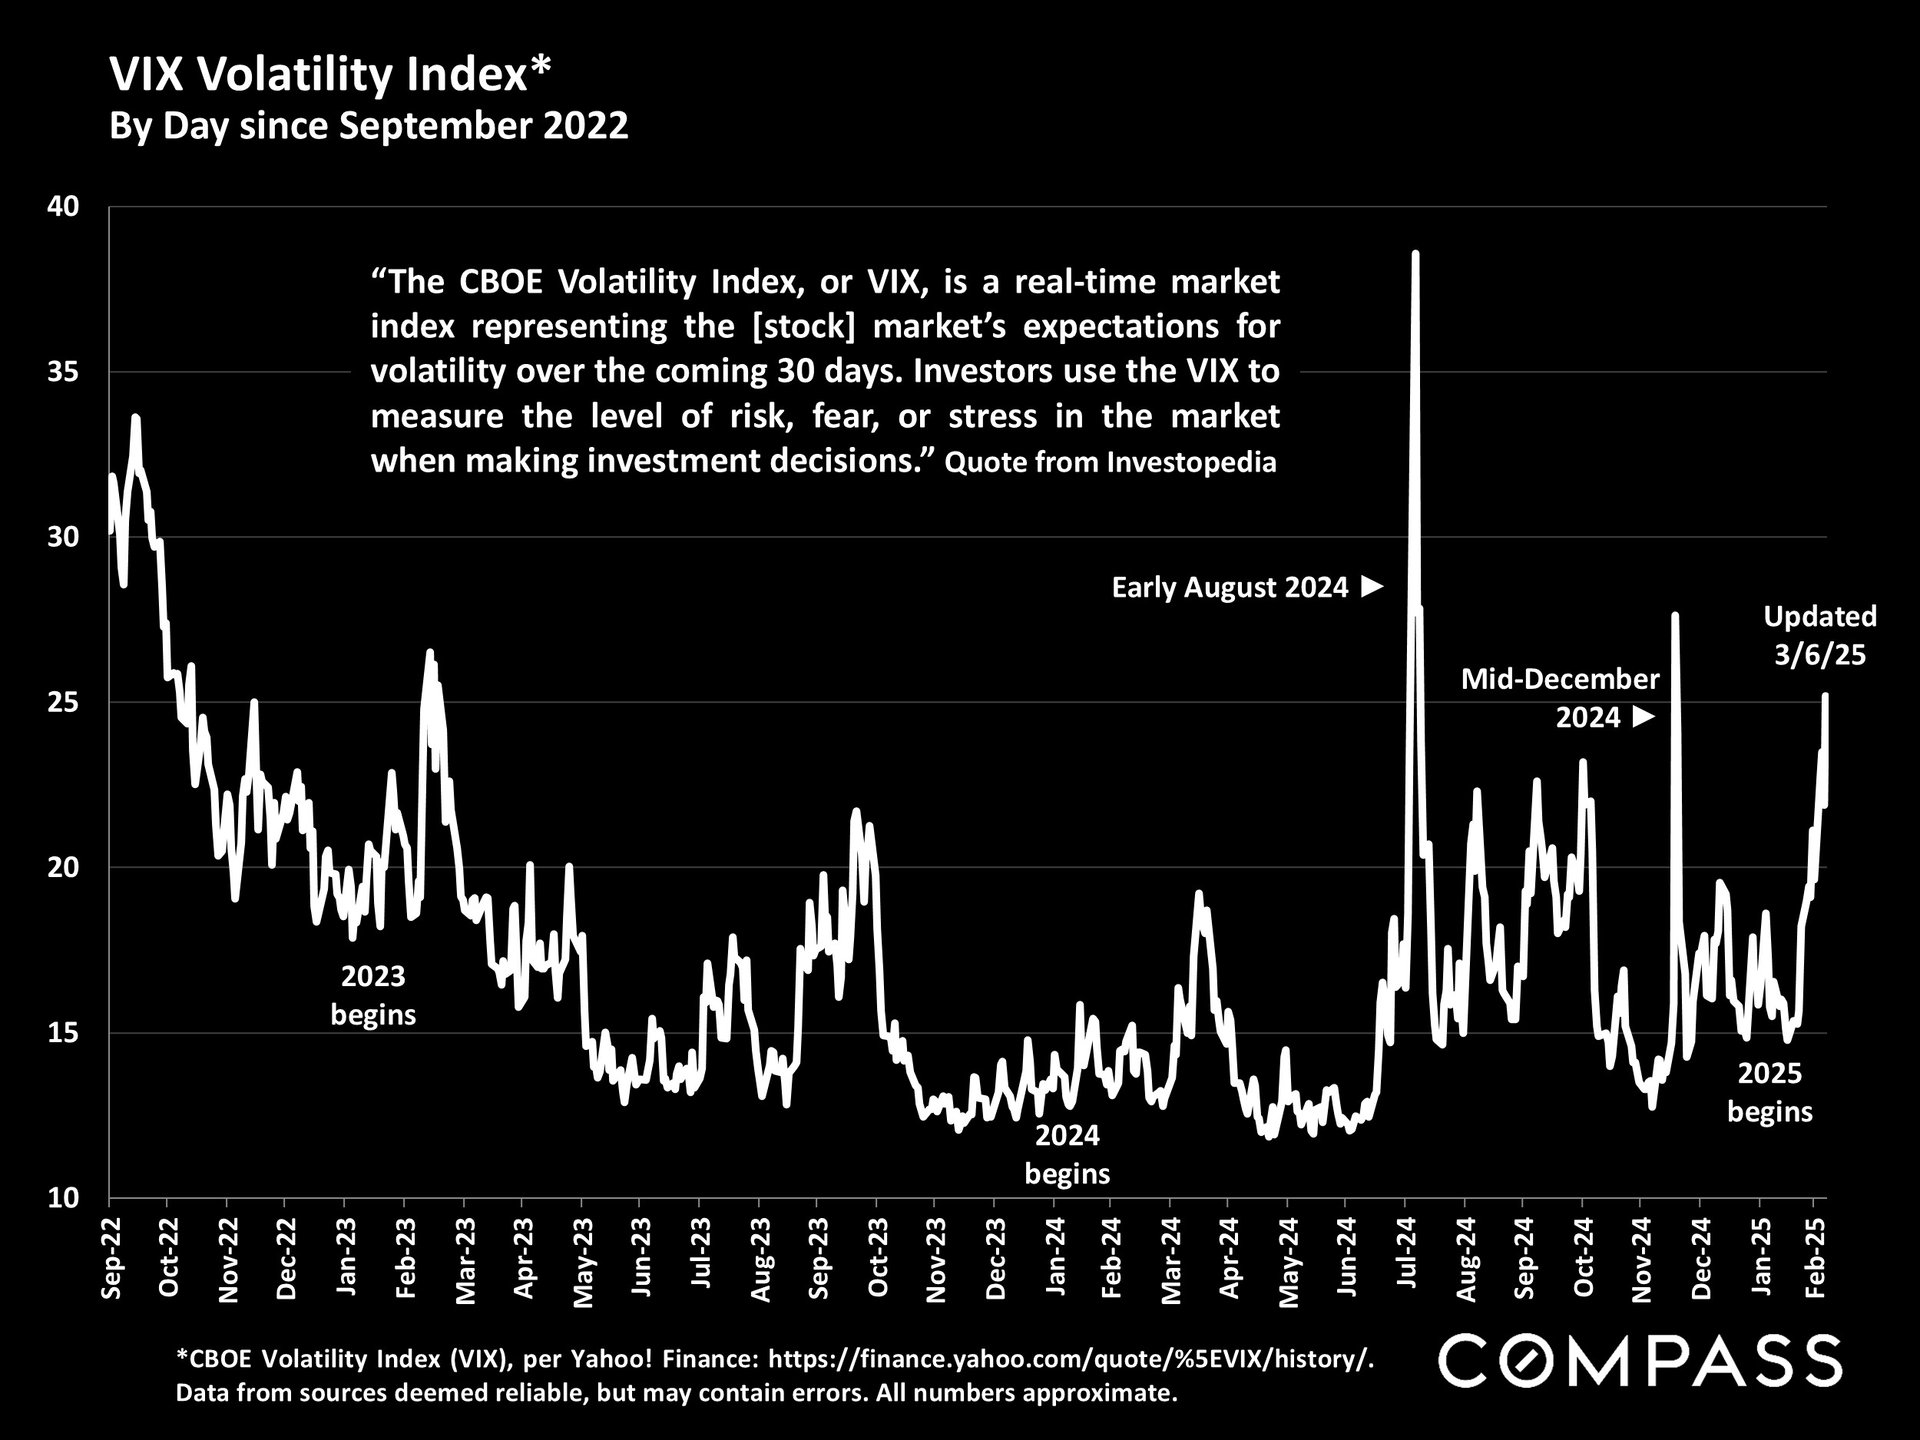
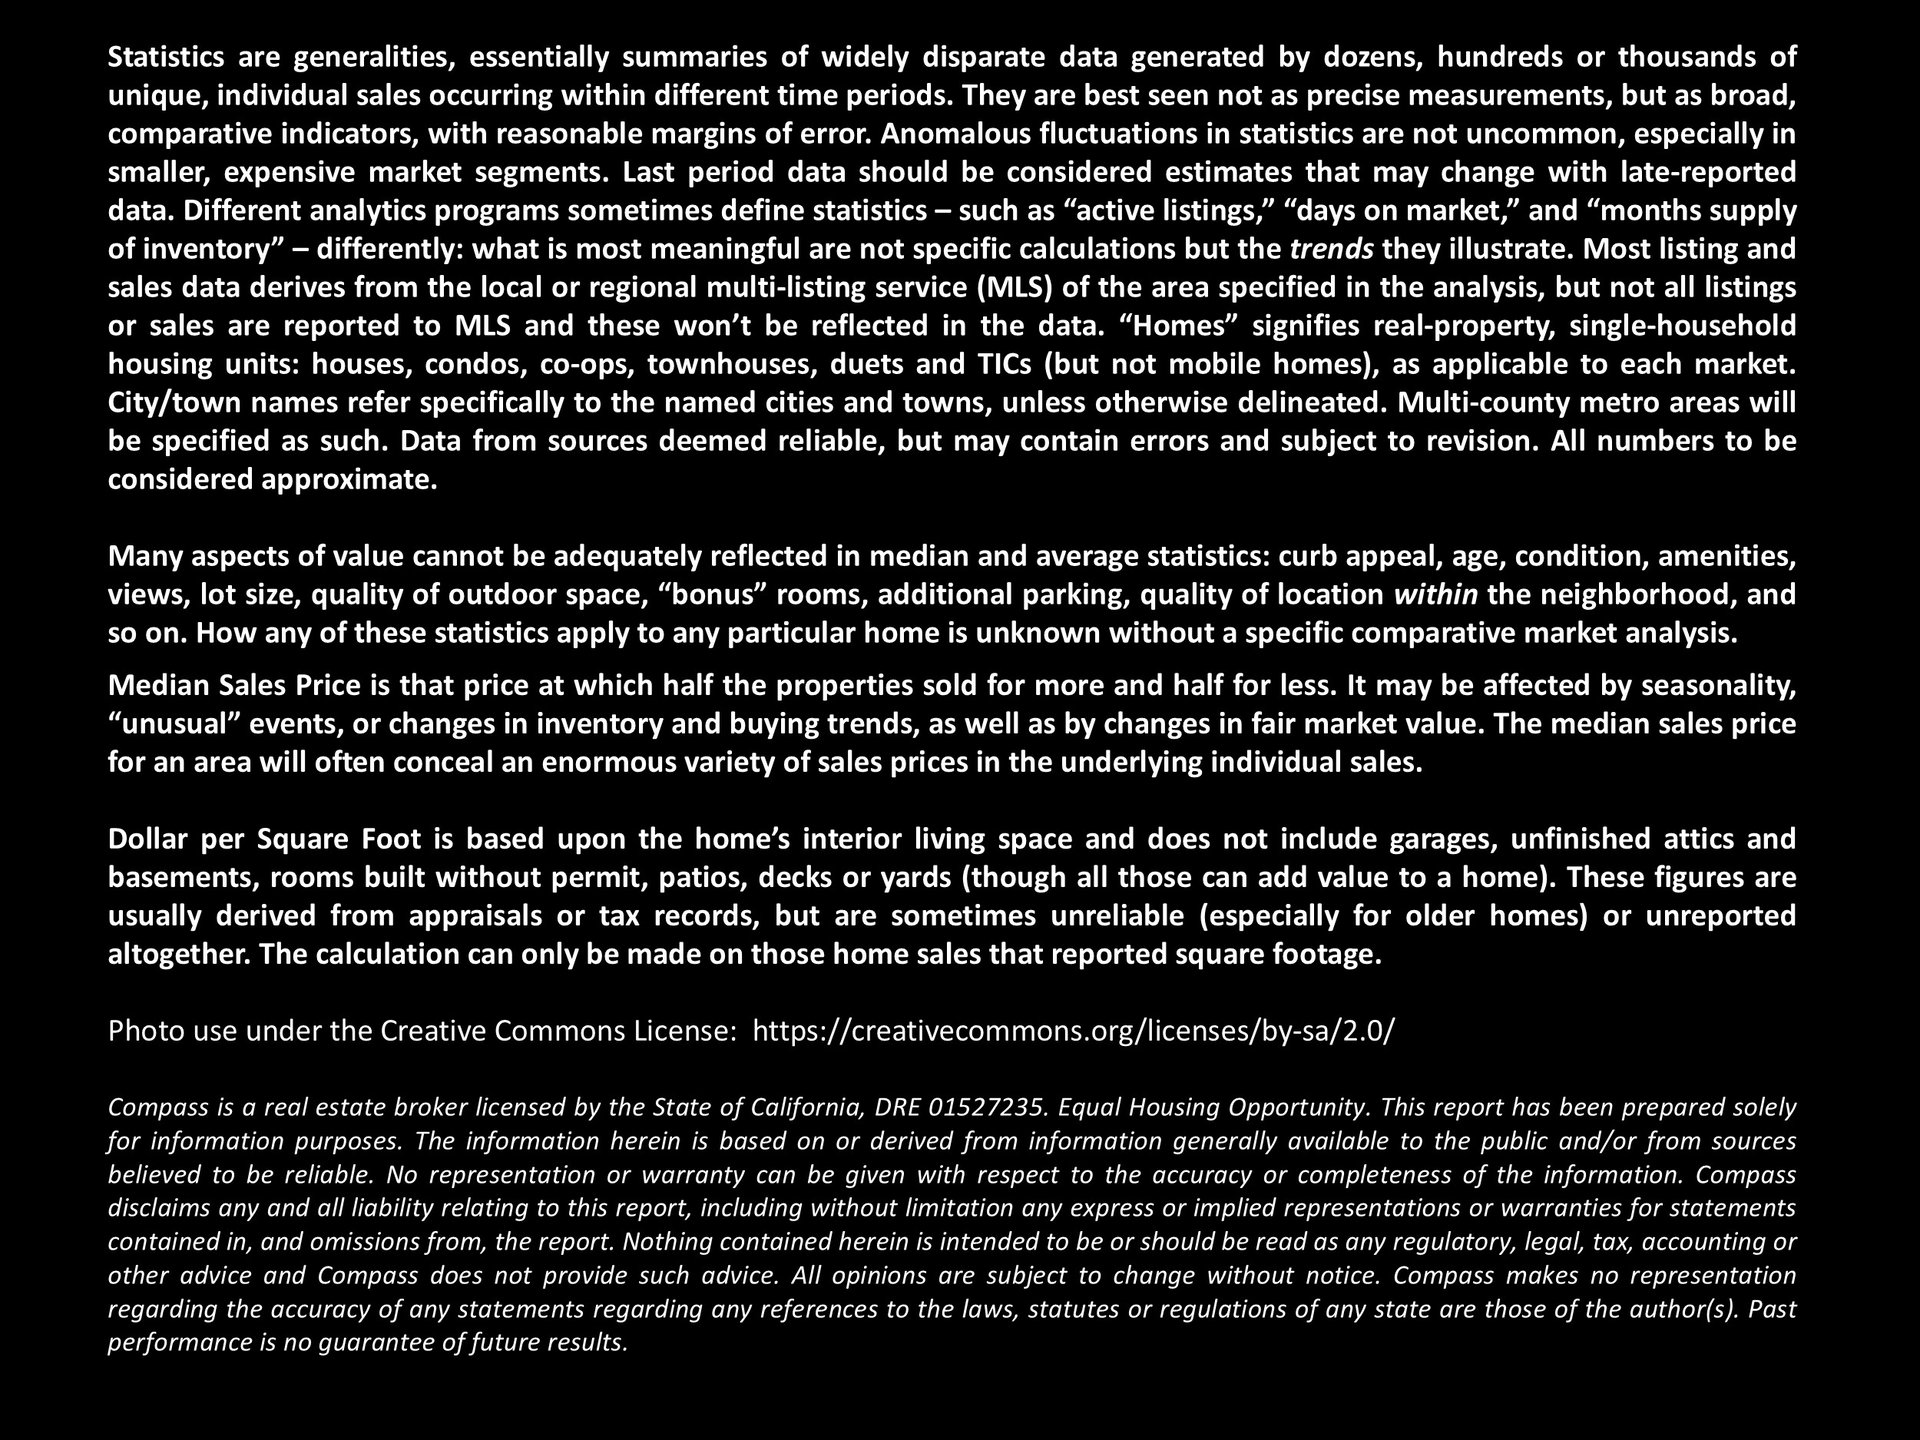
Santa Clara County real estate March 2025 report cover, featuring a panoramic valley view and Compass branding.Santa Clara County March 2025 real estate report summarizing market activity, rising inventory, and spring selling season.Chart of weekly 30-year mortgage rates from January 2023 to March 2025, with a March 6, 2025 rate of 6.63%.Chart compares Nasdaq and S&P 500 gains from January 2024 through March 6, 2025, showing volatile upward trends.Santa Clara County house price trends chart from 1990 to 2025, with peaks and downturns marked.Chart of Santa Clara County home price appreciation, showing 9% over one year and 377% over 25 years.Santa Clara County home sales chart by construction era, with sale percentages and median size and price table.Santa Clara County condo and townhouse median sale prices, 2005–2025; townhouse prices rose about 7% and condo prices 2% year over year.Line chart of Santa Clara County median prices per square foot for houses, townhouses, and condos, 2005–2025.Santa Clara County residential market table comparing activity by price range and property type.Chart of Santa Clara County monthly new listings from 2020 to January 2025, with February 2025 market commentary.Chart of Santa Clara County listings by month, showing 1,574 active and coming-soon listings on March 1, 2025.Chart of Santa Clara County listings going into contract, January 2020–January 2025, with seasonal peaks and a 2021 high.Santa Clara County monthly absorption-rate bar chart, January 2019–January 2025, with a 2022 peak and market annotations.Santa Clara County inventory-supply chart from 2017 to February 2025, with seasonal and pandemic-era market annotations.Bar chart of monthly Santa Clara County home sales from January 2020 through January 2025, updated through February 2025.Bar chart of Santa Clara County homes selling for $5 million or more, by month from 2020 through January 2025.Chart comparing five-year Bay Area home price appreciation by size: 60%, 46%, 42%, and 20%.Chart tracking Santa Clara County home sales closing above list price, with a red trend line and seasonal annotations.Santa Clara County chart of sale prices versus list prices, with monthly green bars from 2018 to 2025.Santa Clara County average days-on-market chart, January 2020 to January 2025, with seasonal annotations.Chart of Santa Clara County listing price reductions, with monthly bars from 2018 to February 2025 and major peaks labeled.Line chart of the VIX from September 2022 to February 2025, with sharp spikes in August 2024 and February 2025.Real estate report notes on statistical limitations, pricing measures, data sources, and legal disclaimers.

WORK WITH US

We offer the highest level of service and expertise to our clients. Our team has built a reputation for consistently representing the finest real estate in San Francisco and Napa Valley. Results driven and dedicated to your success, whether buying, selling, renting or investing. Contact us today for a private consultation.

Contact Us