
Santa Cruz County Real Estate February 2025 Report

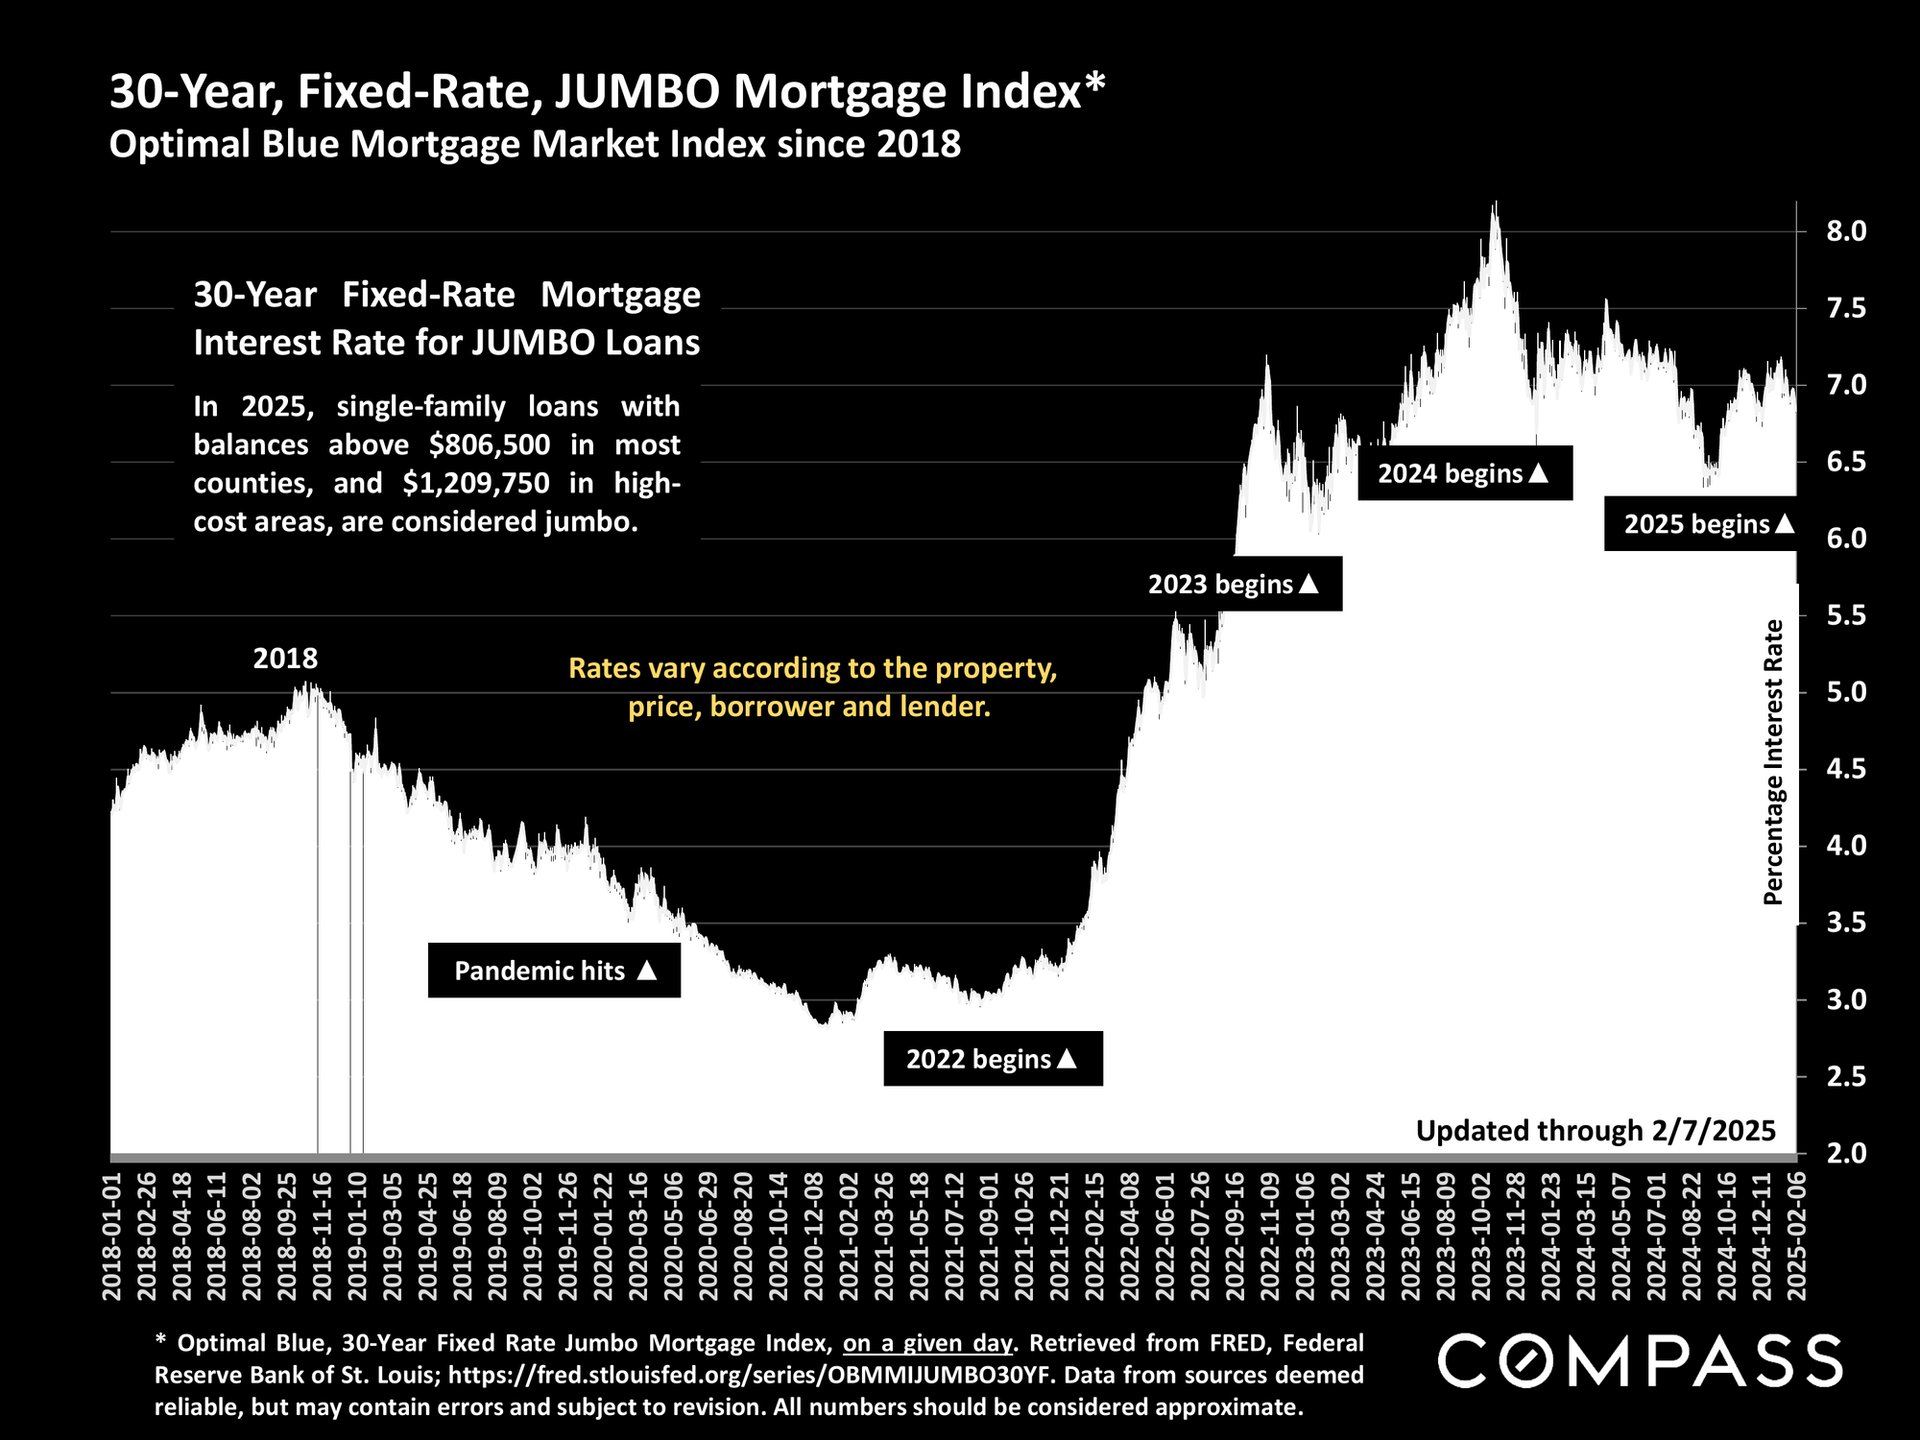
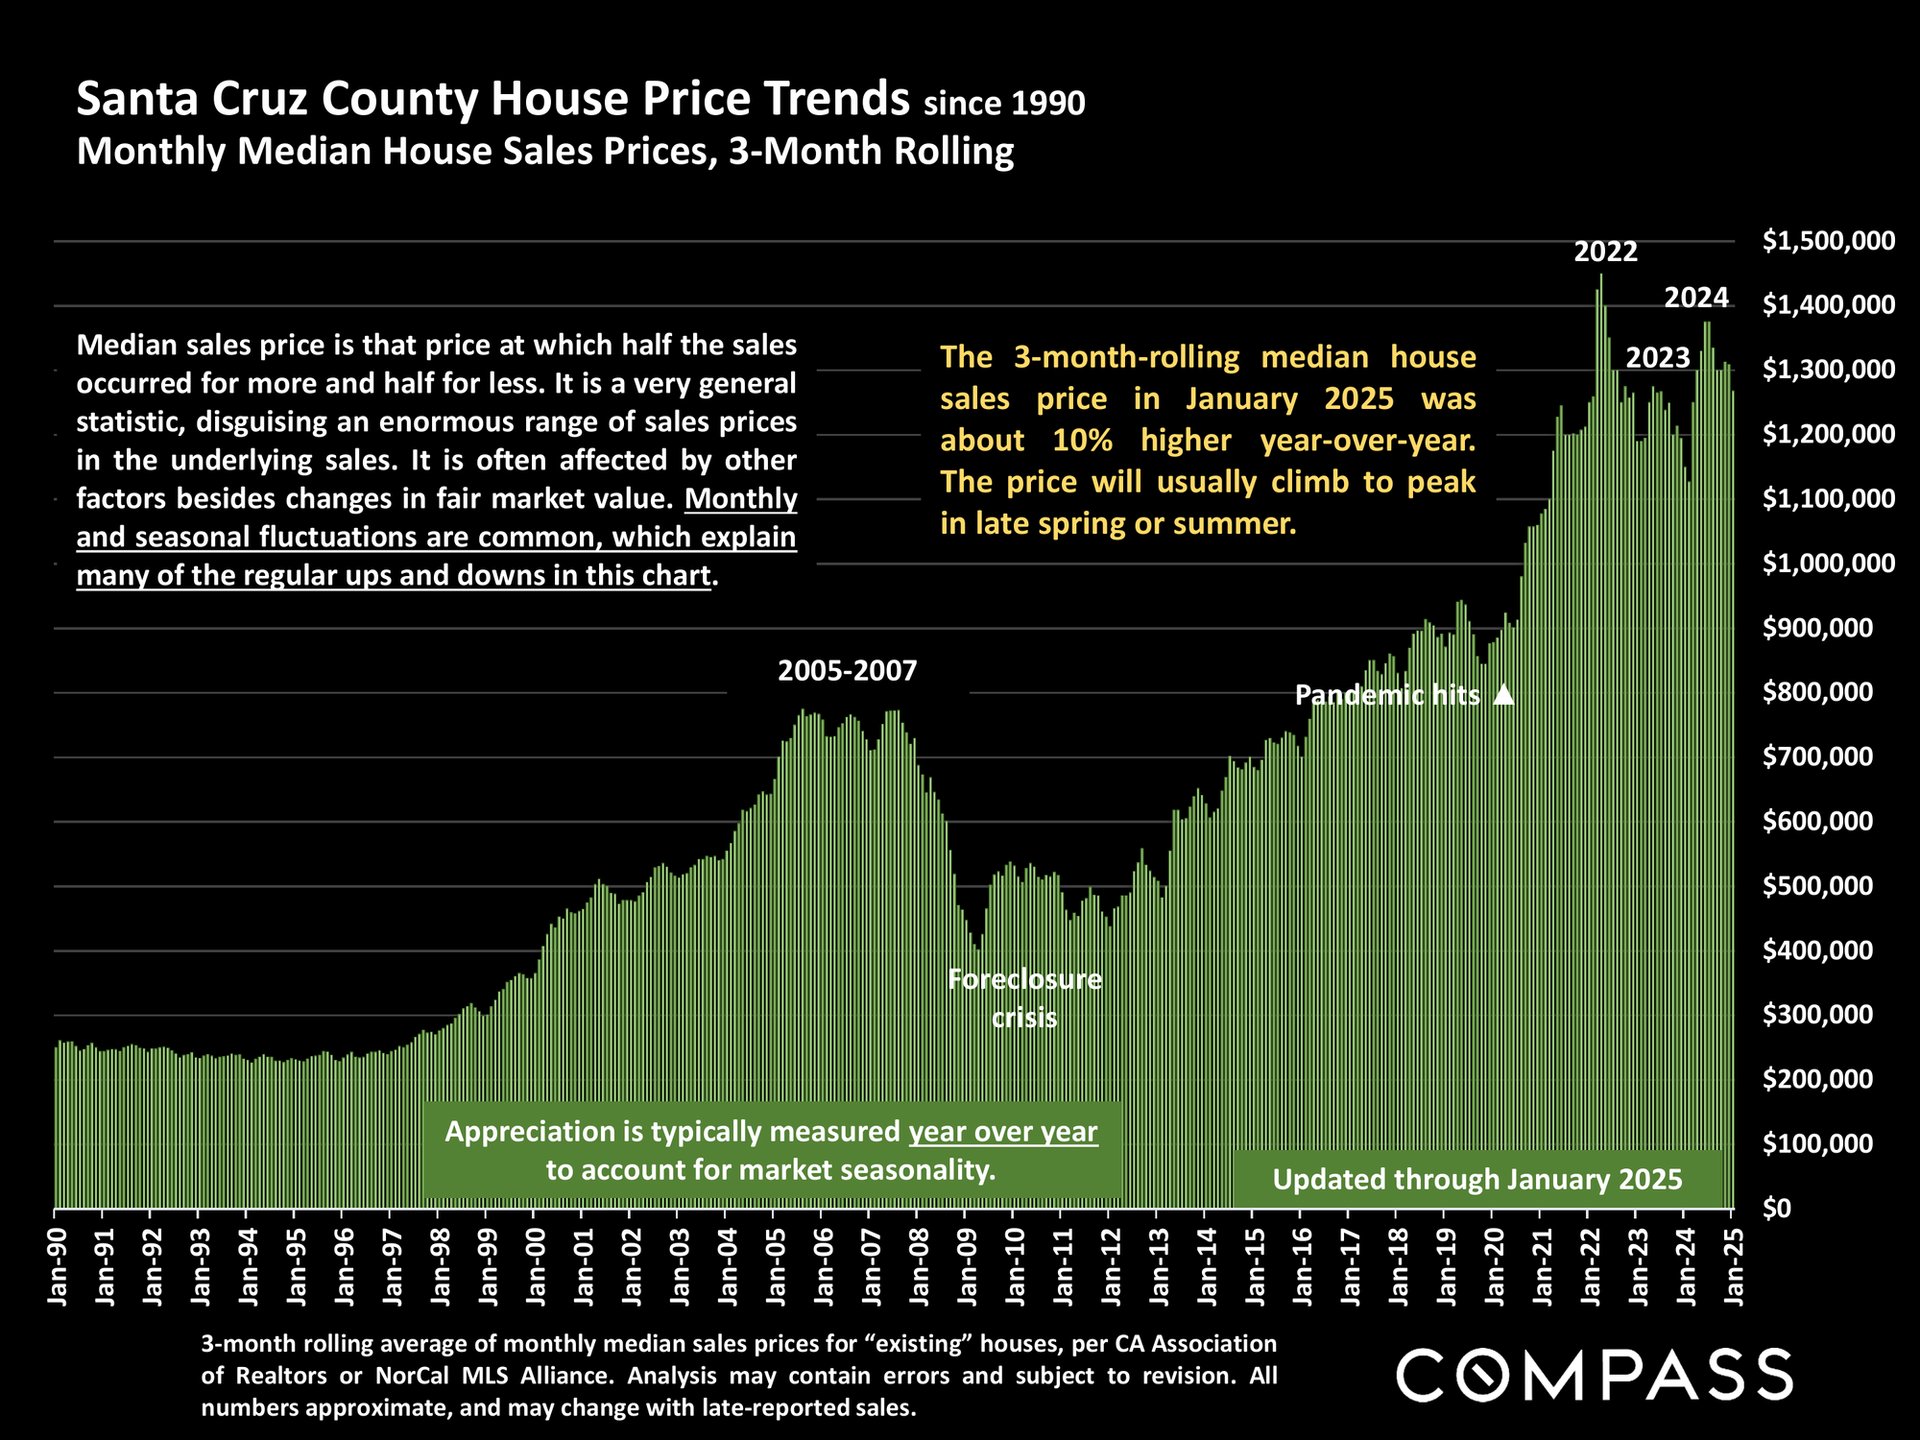
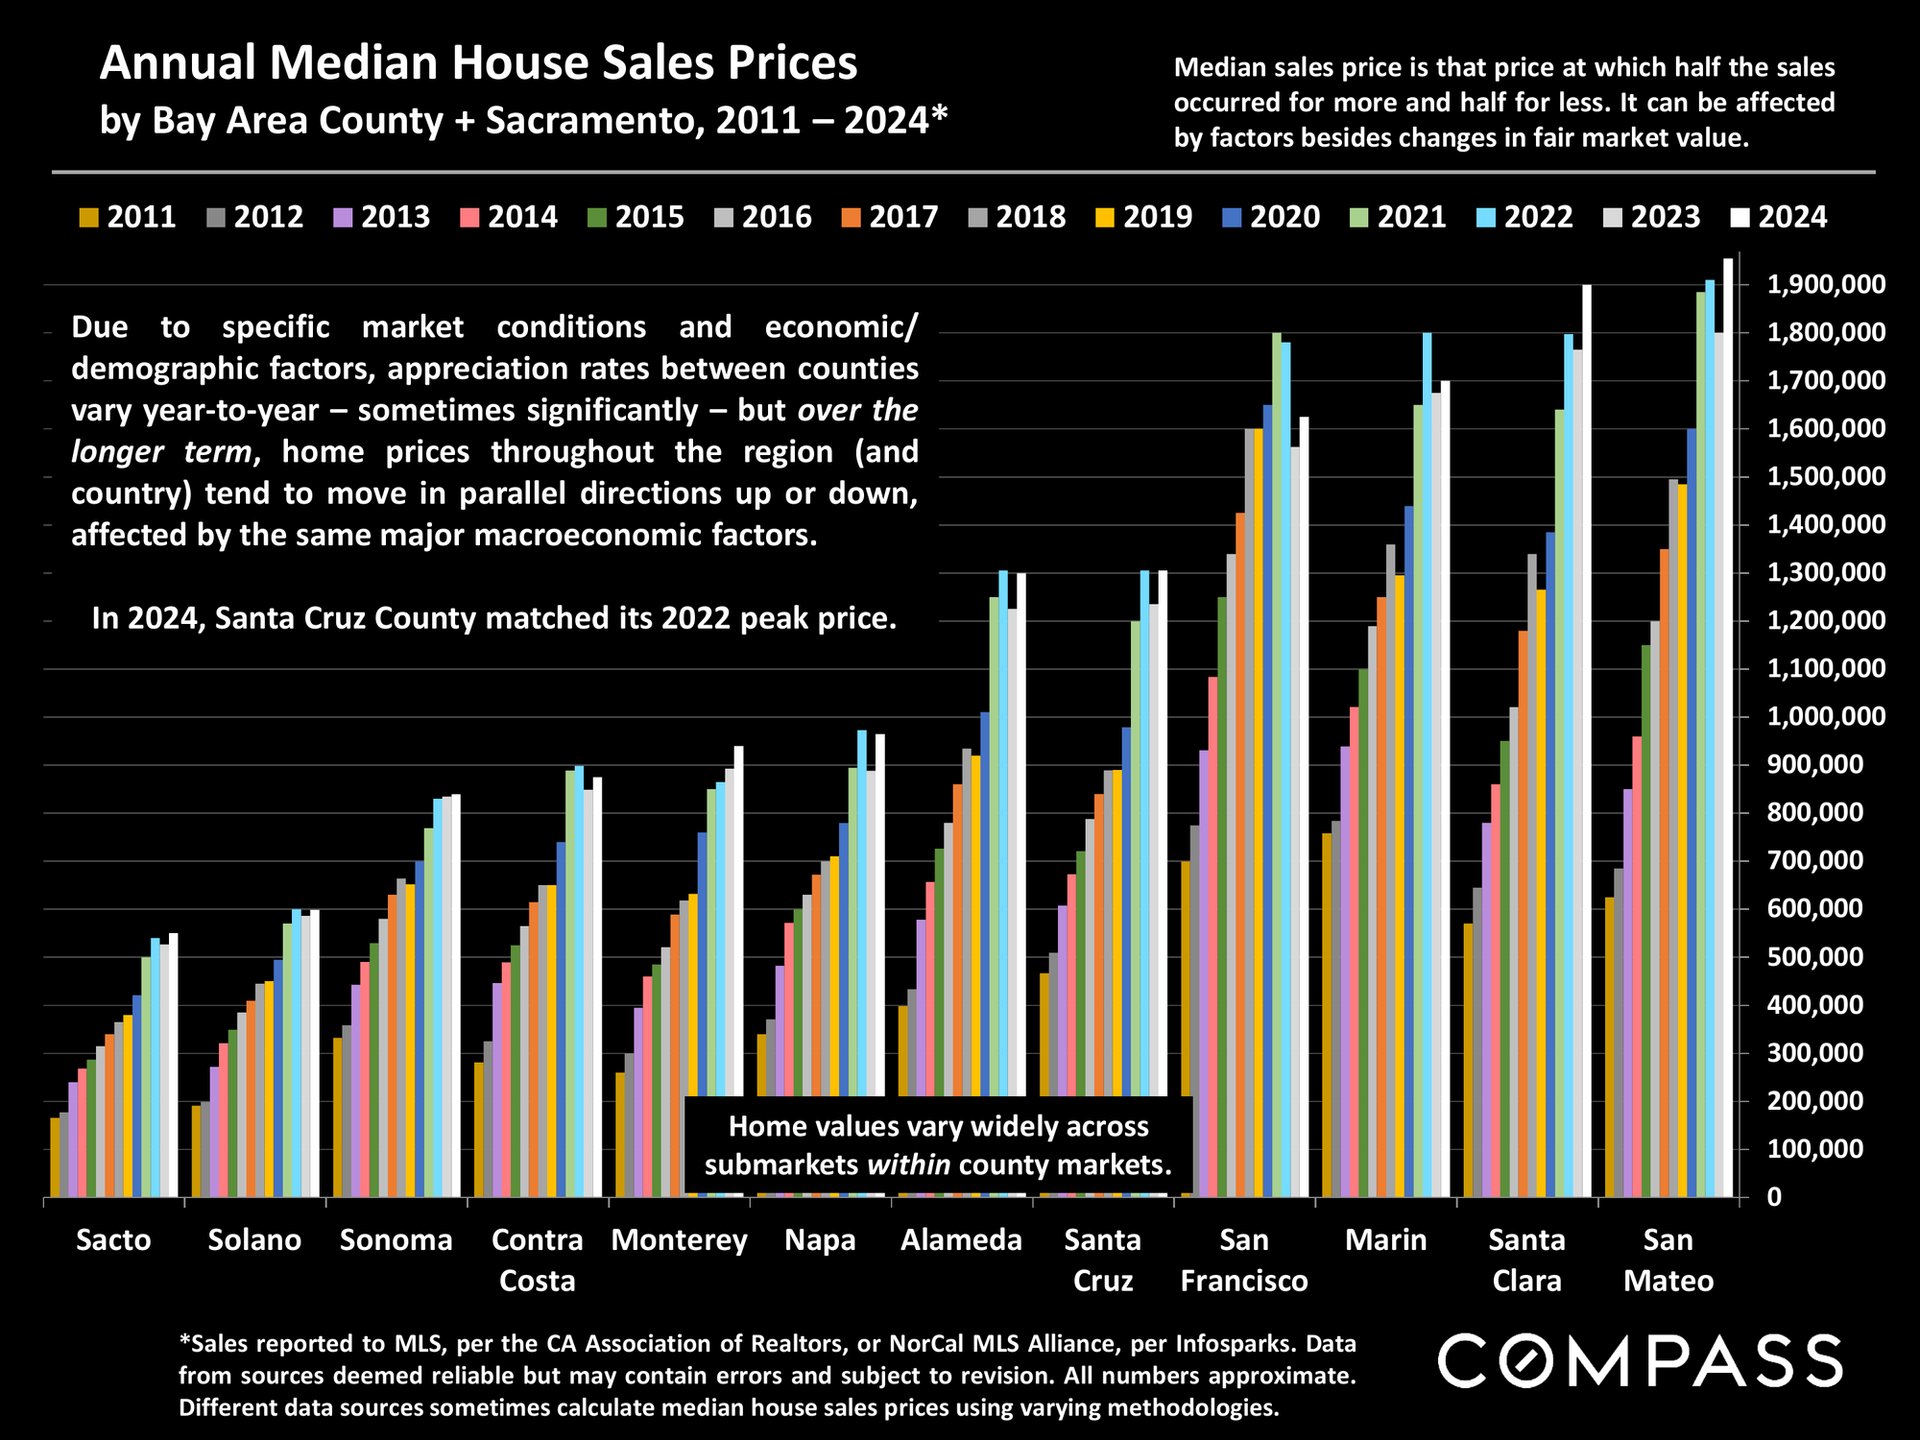
Santa Cruz County Real Estate February 2025 Report cover featuring Berry Creek Falls and COMPASS branding.February 2025 real estate update on economic conditions, local listings, housing market trends, and a Freddie Mac outlook.Chart of jumbo mortgage rates from 2018 to February 2025, peaking above 8% in 2023.Chart of Santa Cruz County median house prices from 1990 to January 2025, with prices about 10% higher year over year.Bar chart comparing annual median house sale prices across Bay Area counties and Sacramento from 2011 to 2024.
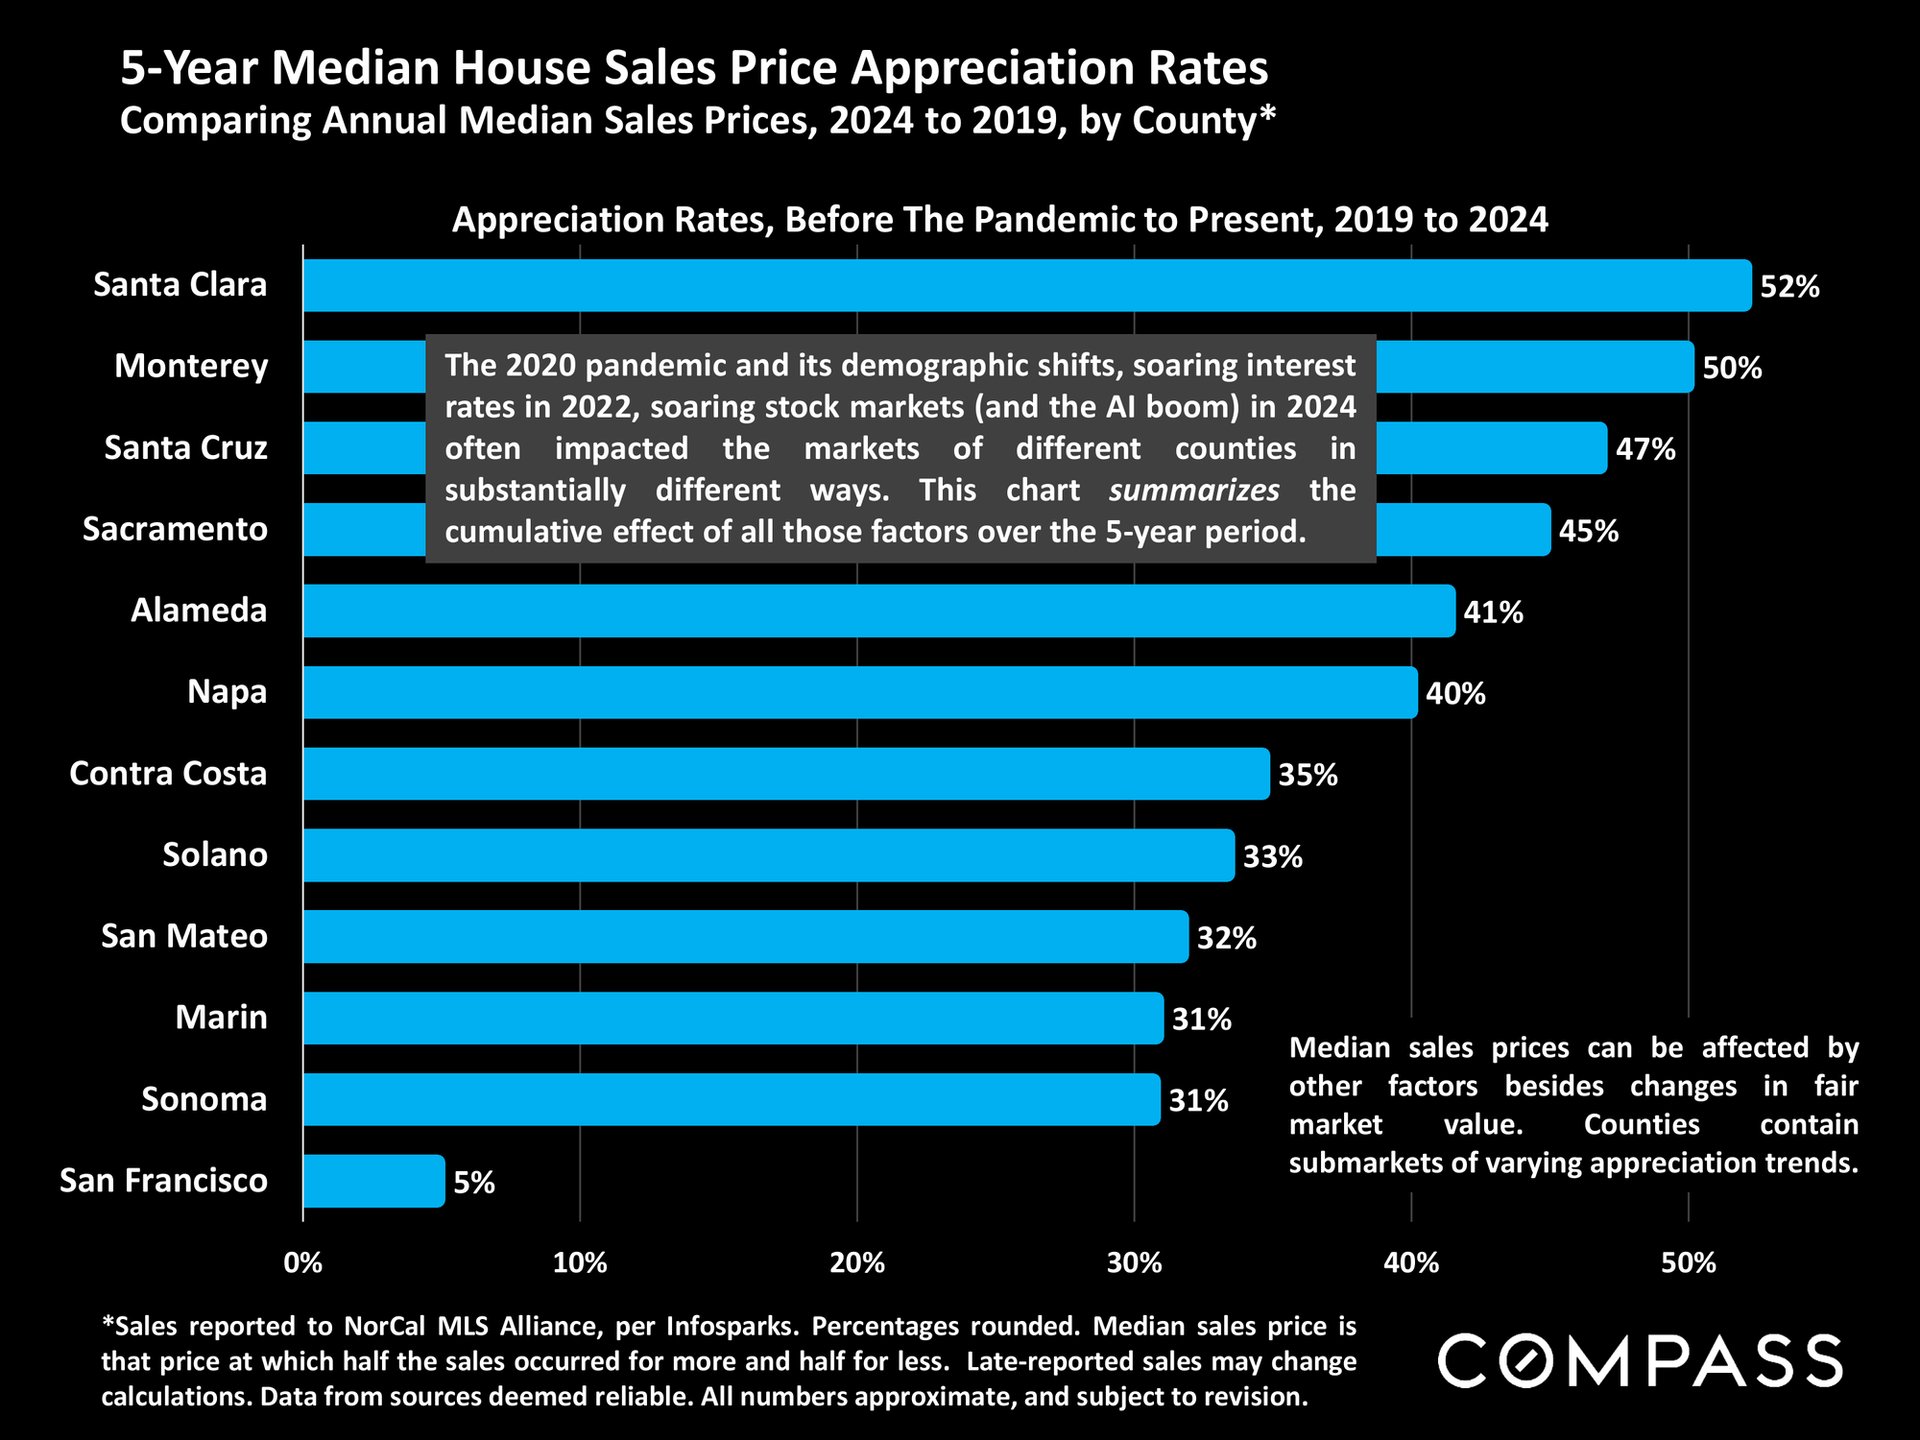
Bar chart of five-year home price appreciation by county: Santa Cruz 47%, among 12 Northern California counties.
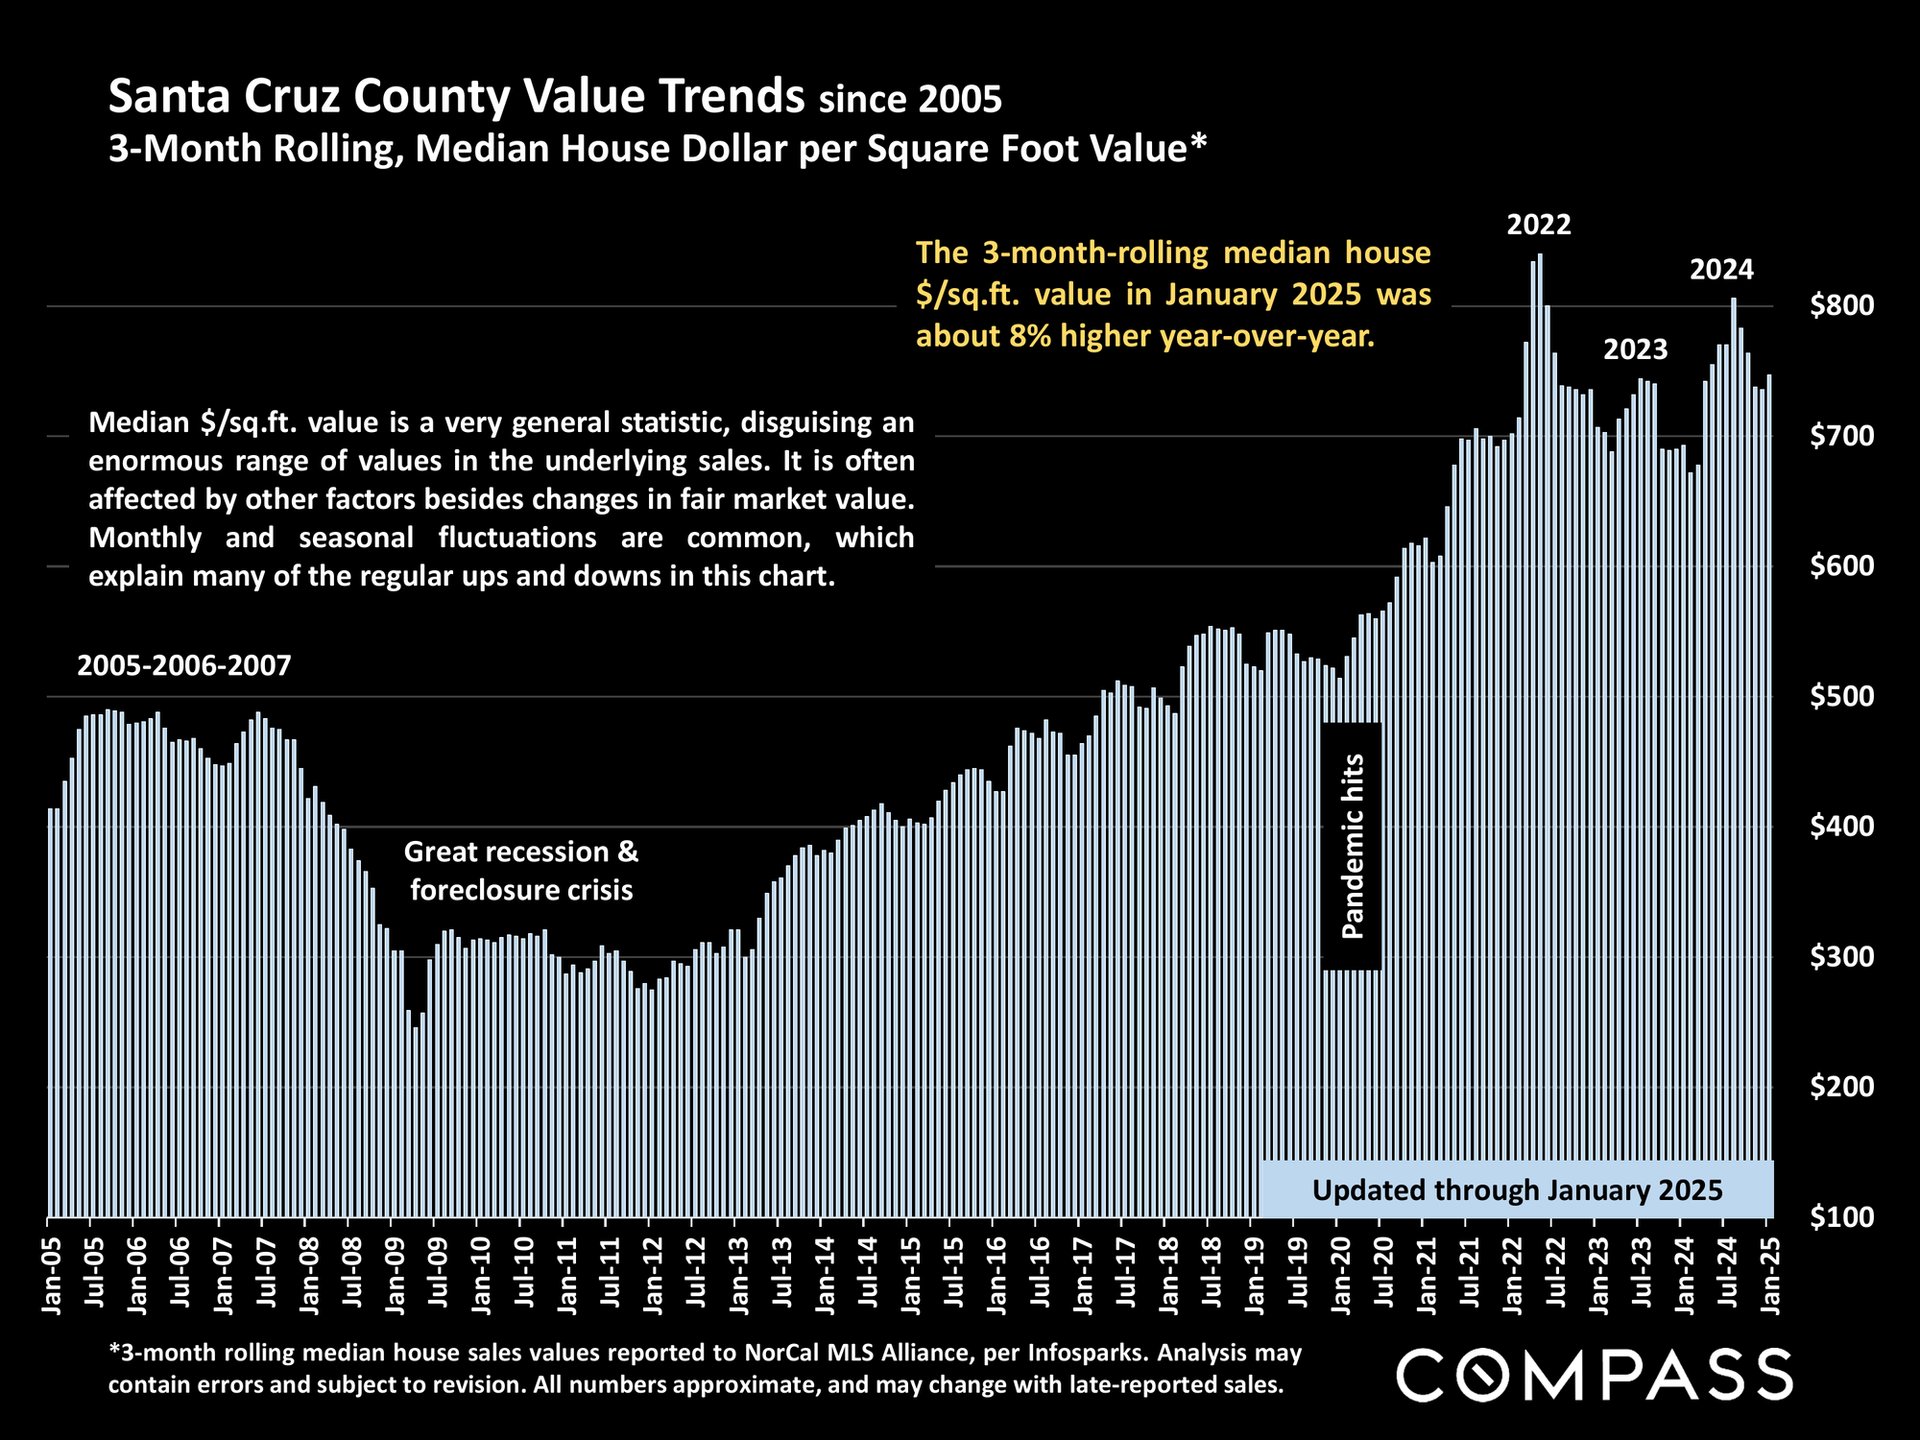
Santa Cruz County median house value per square foot, charted from 2005 to January 2025 with an 8% year-over-year increase.
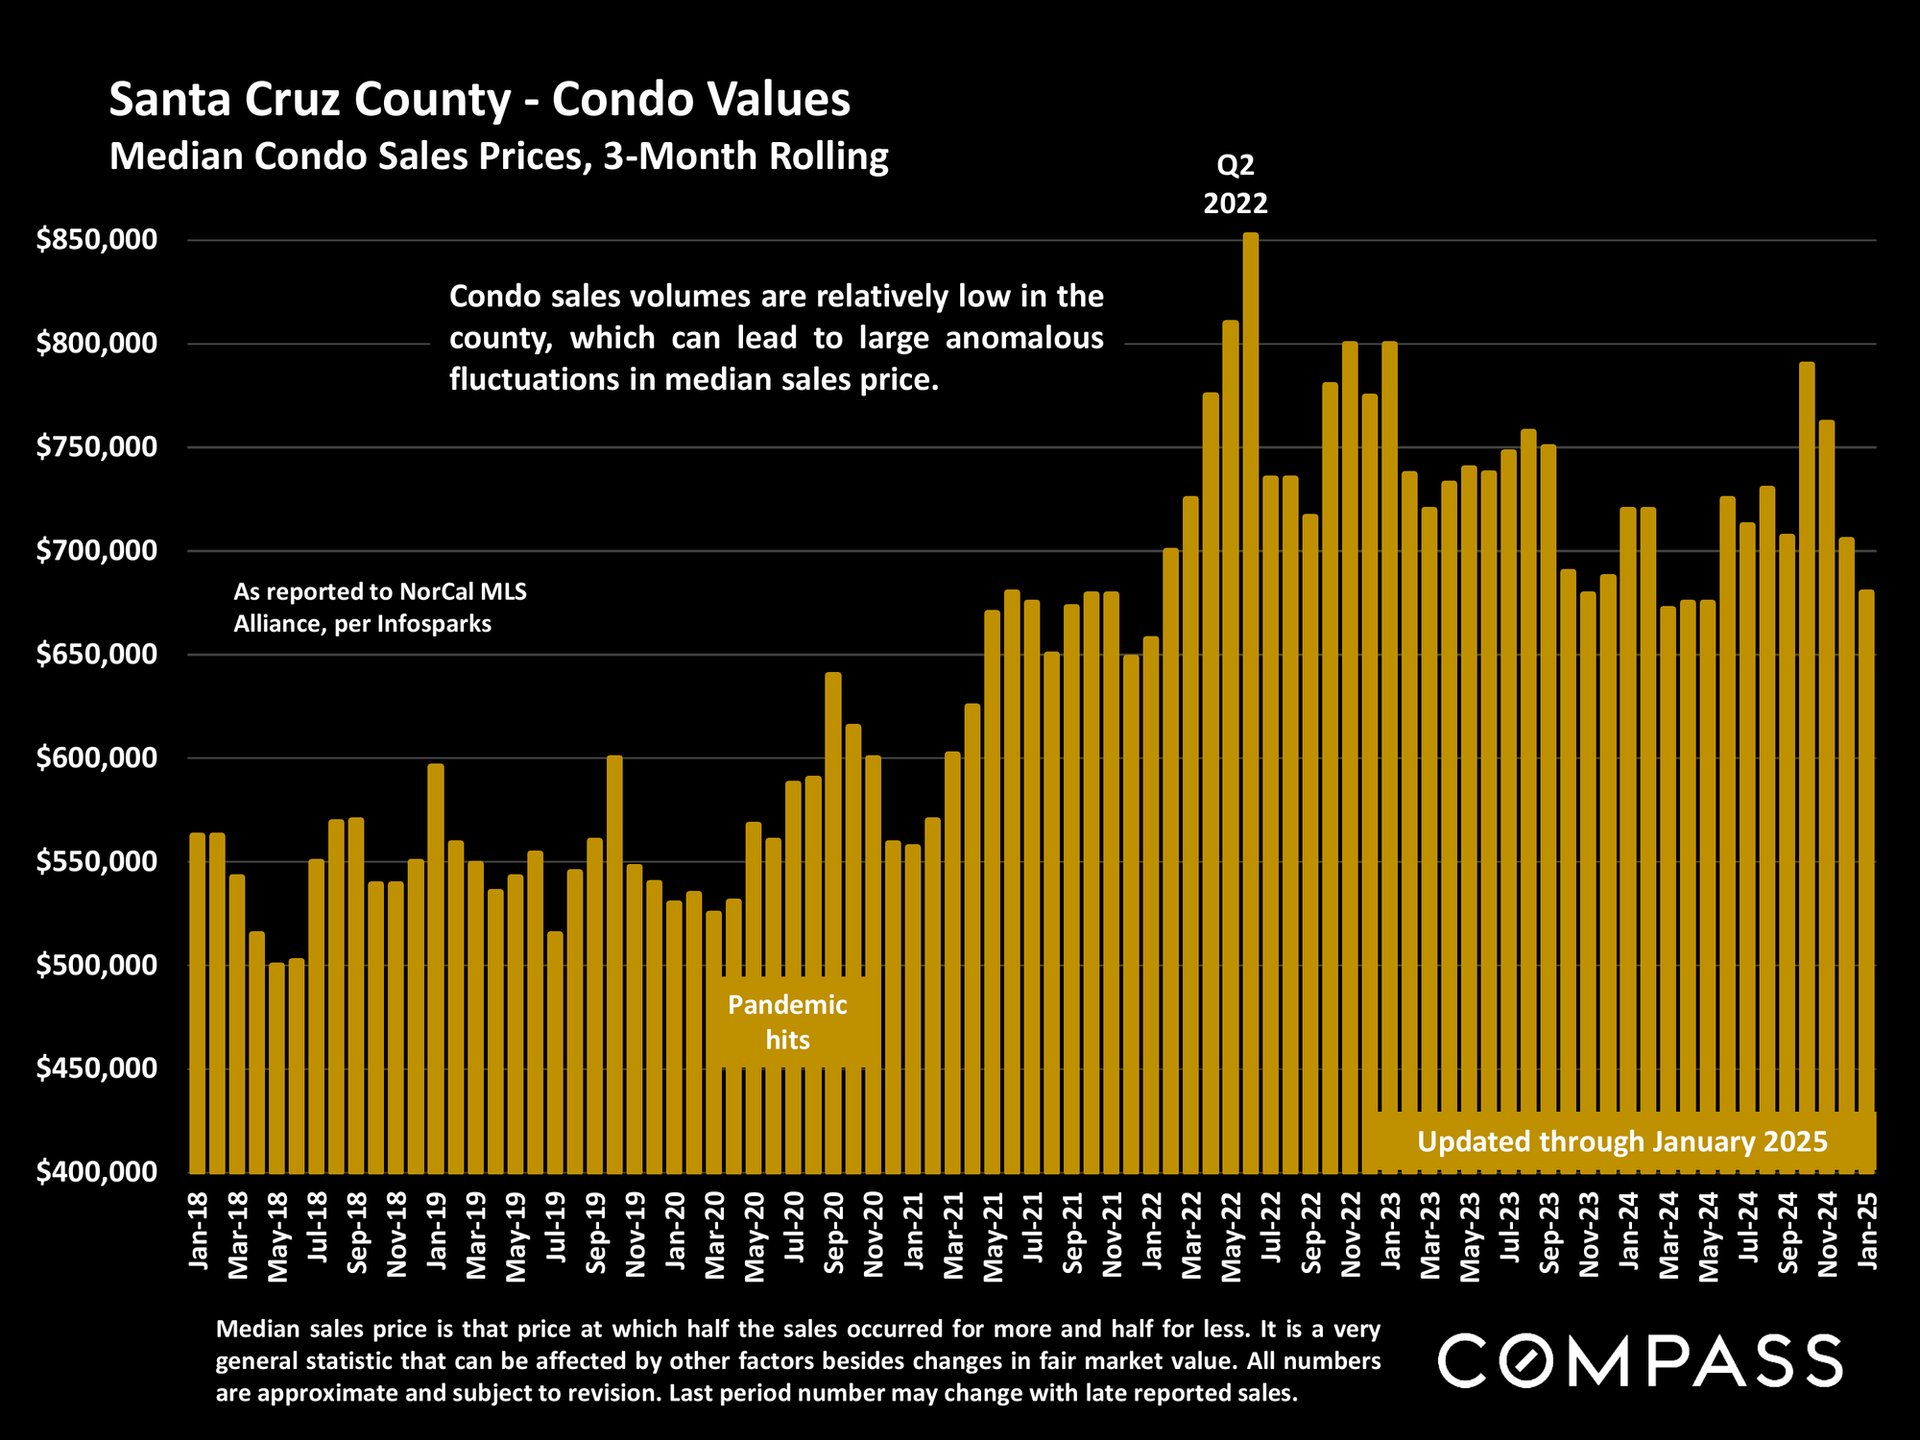
Chart of Santa Cruz County median condo sales prices, January 2018–January 2025, peaking near $850,000 in Q2 2022.
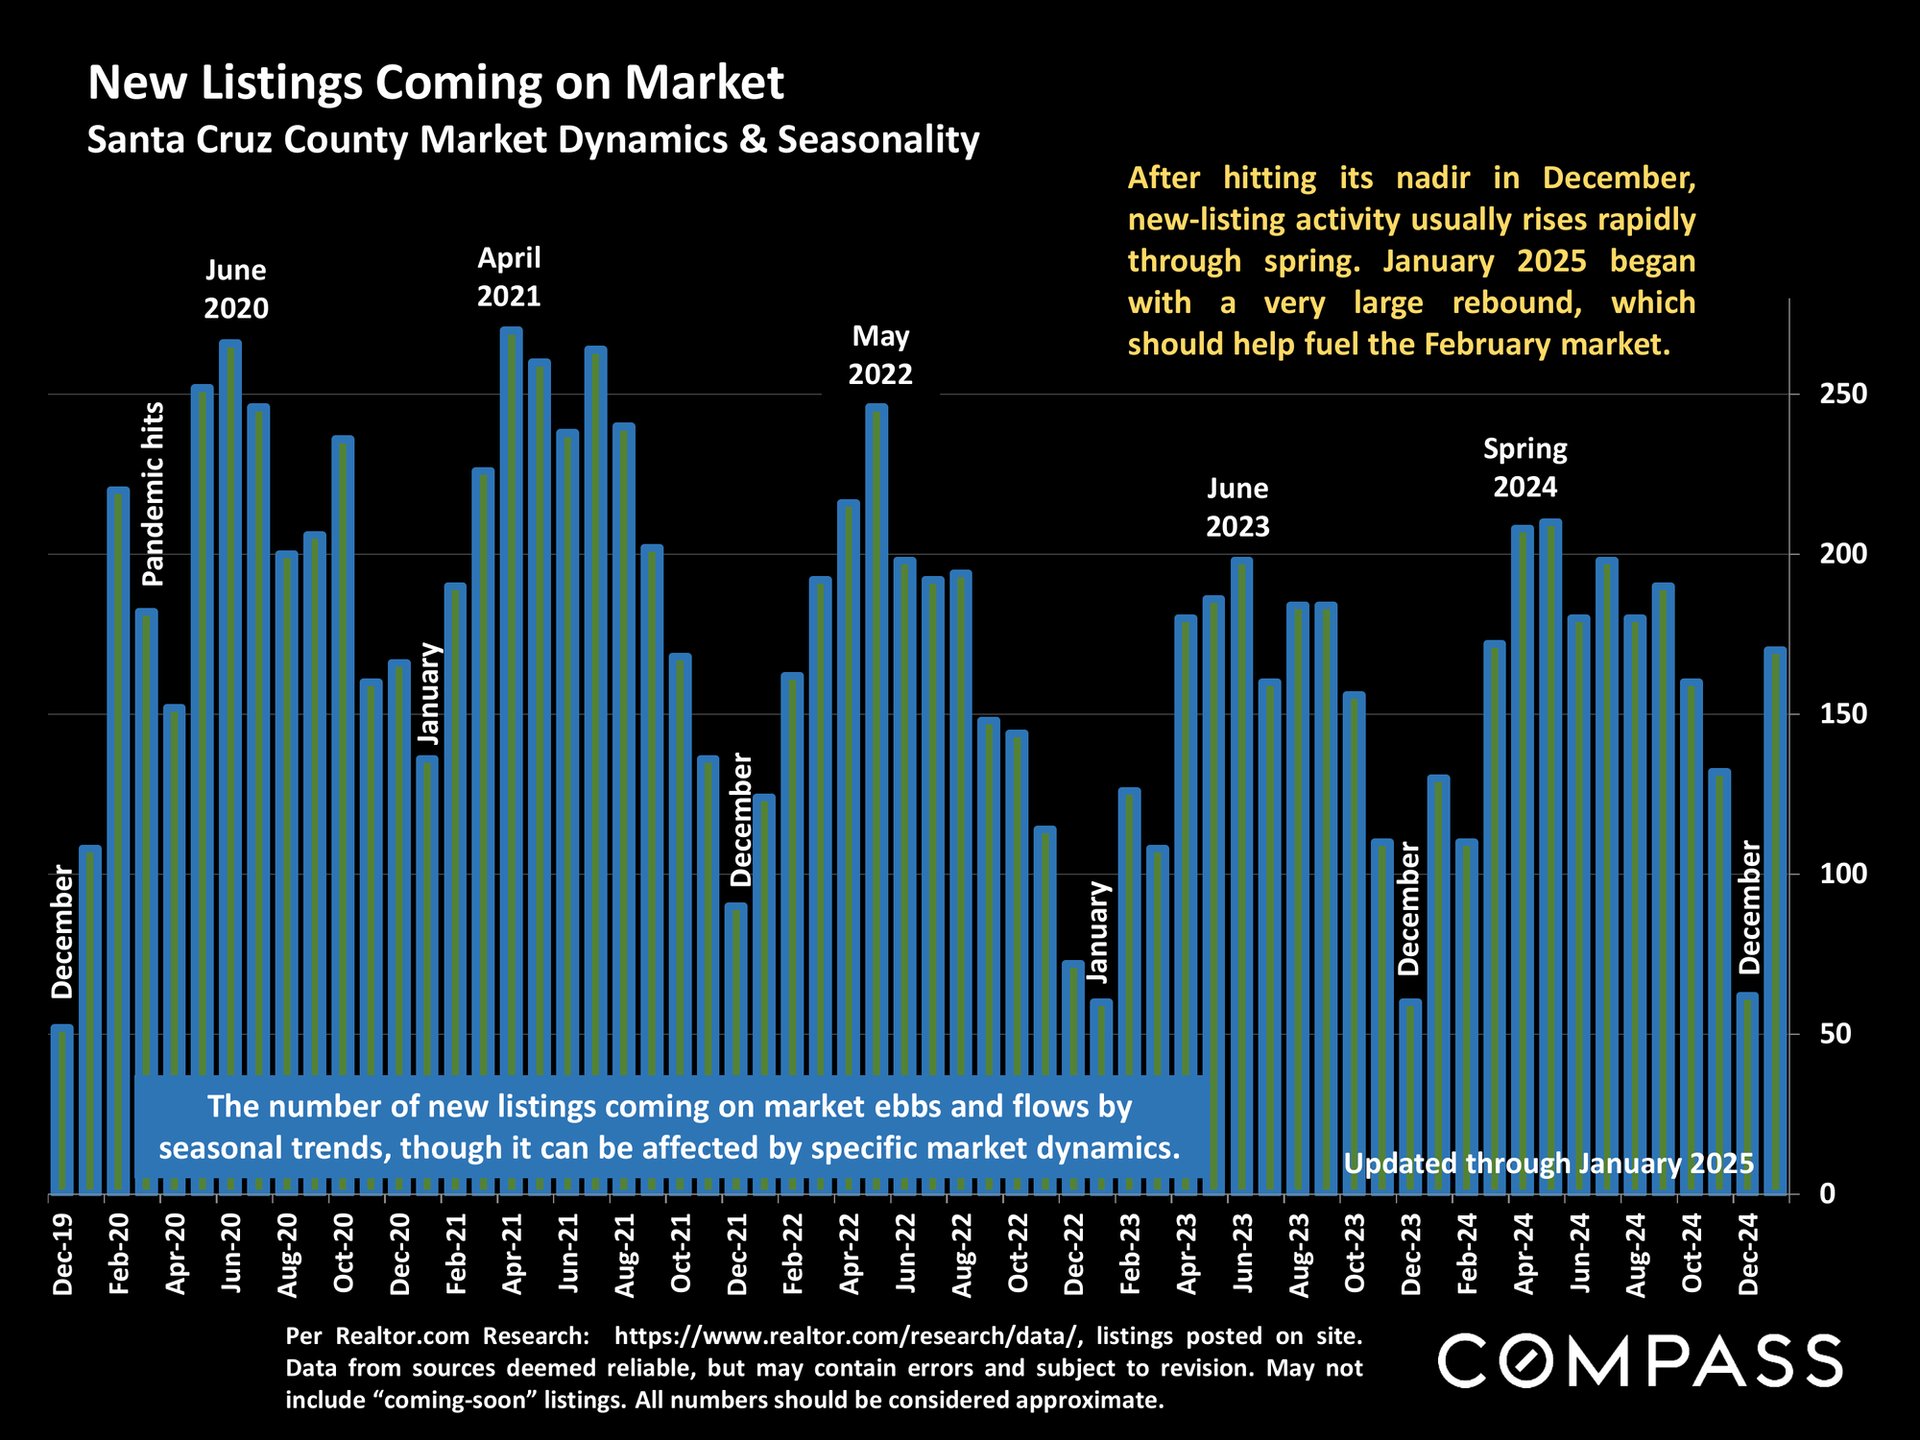
Chart of monthly Santa Cruz County new listings from December 2019 to December 2024, showing seasonal fluctuations.
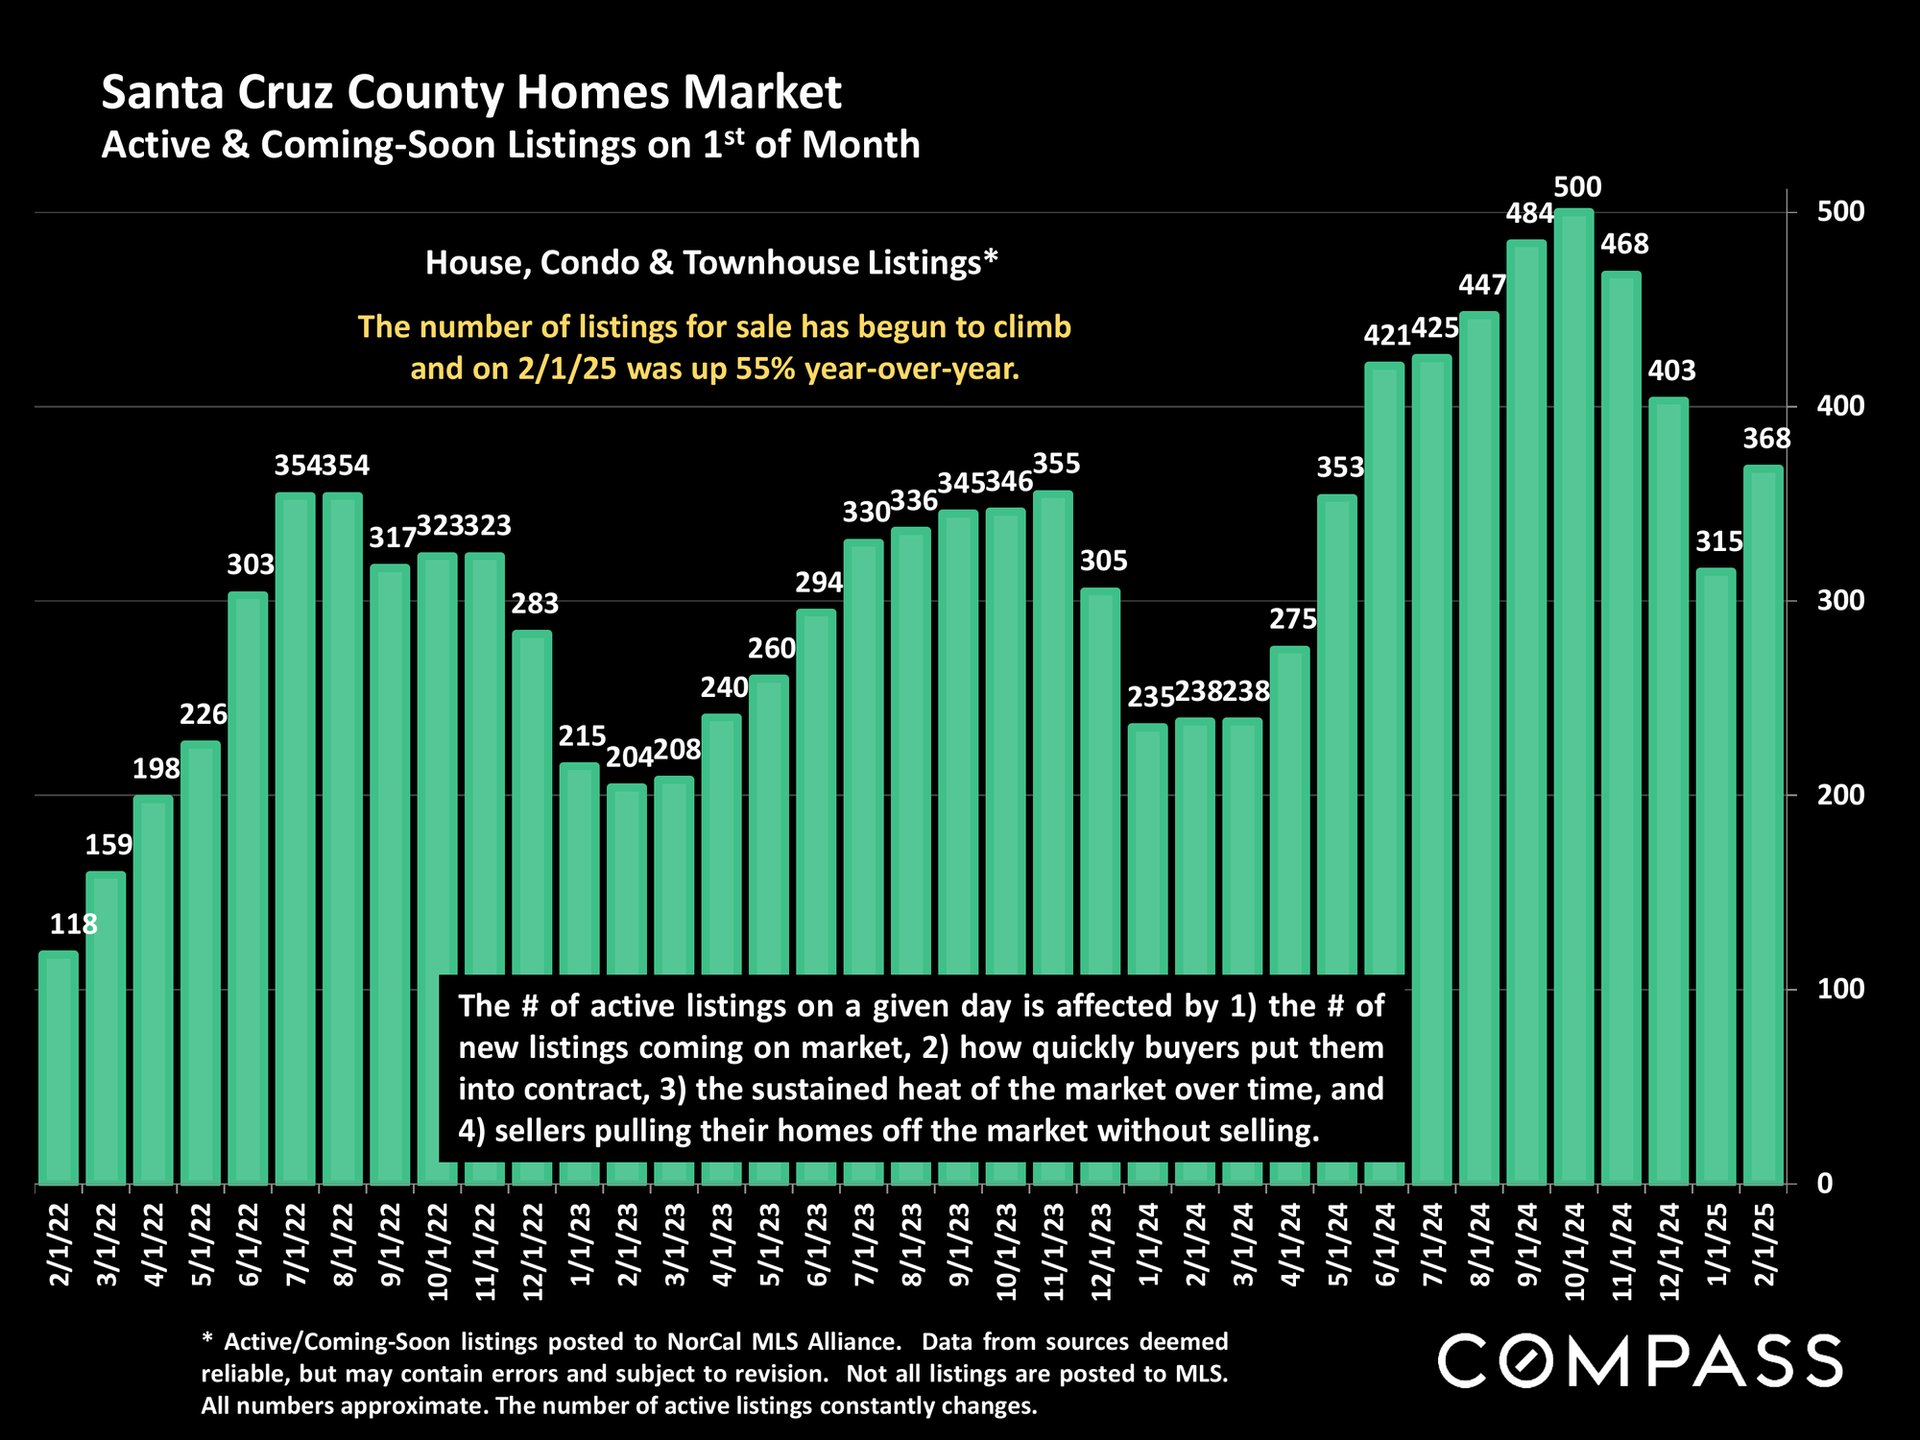
Santa Cruz County real estate listings bar chart, showing monthly counts from February 2022 to February 2025.
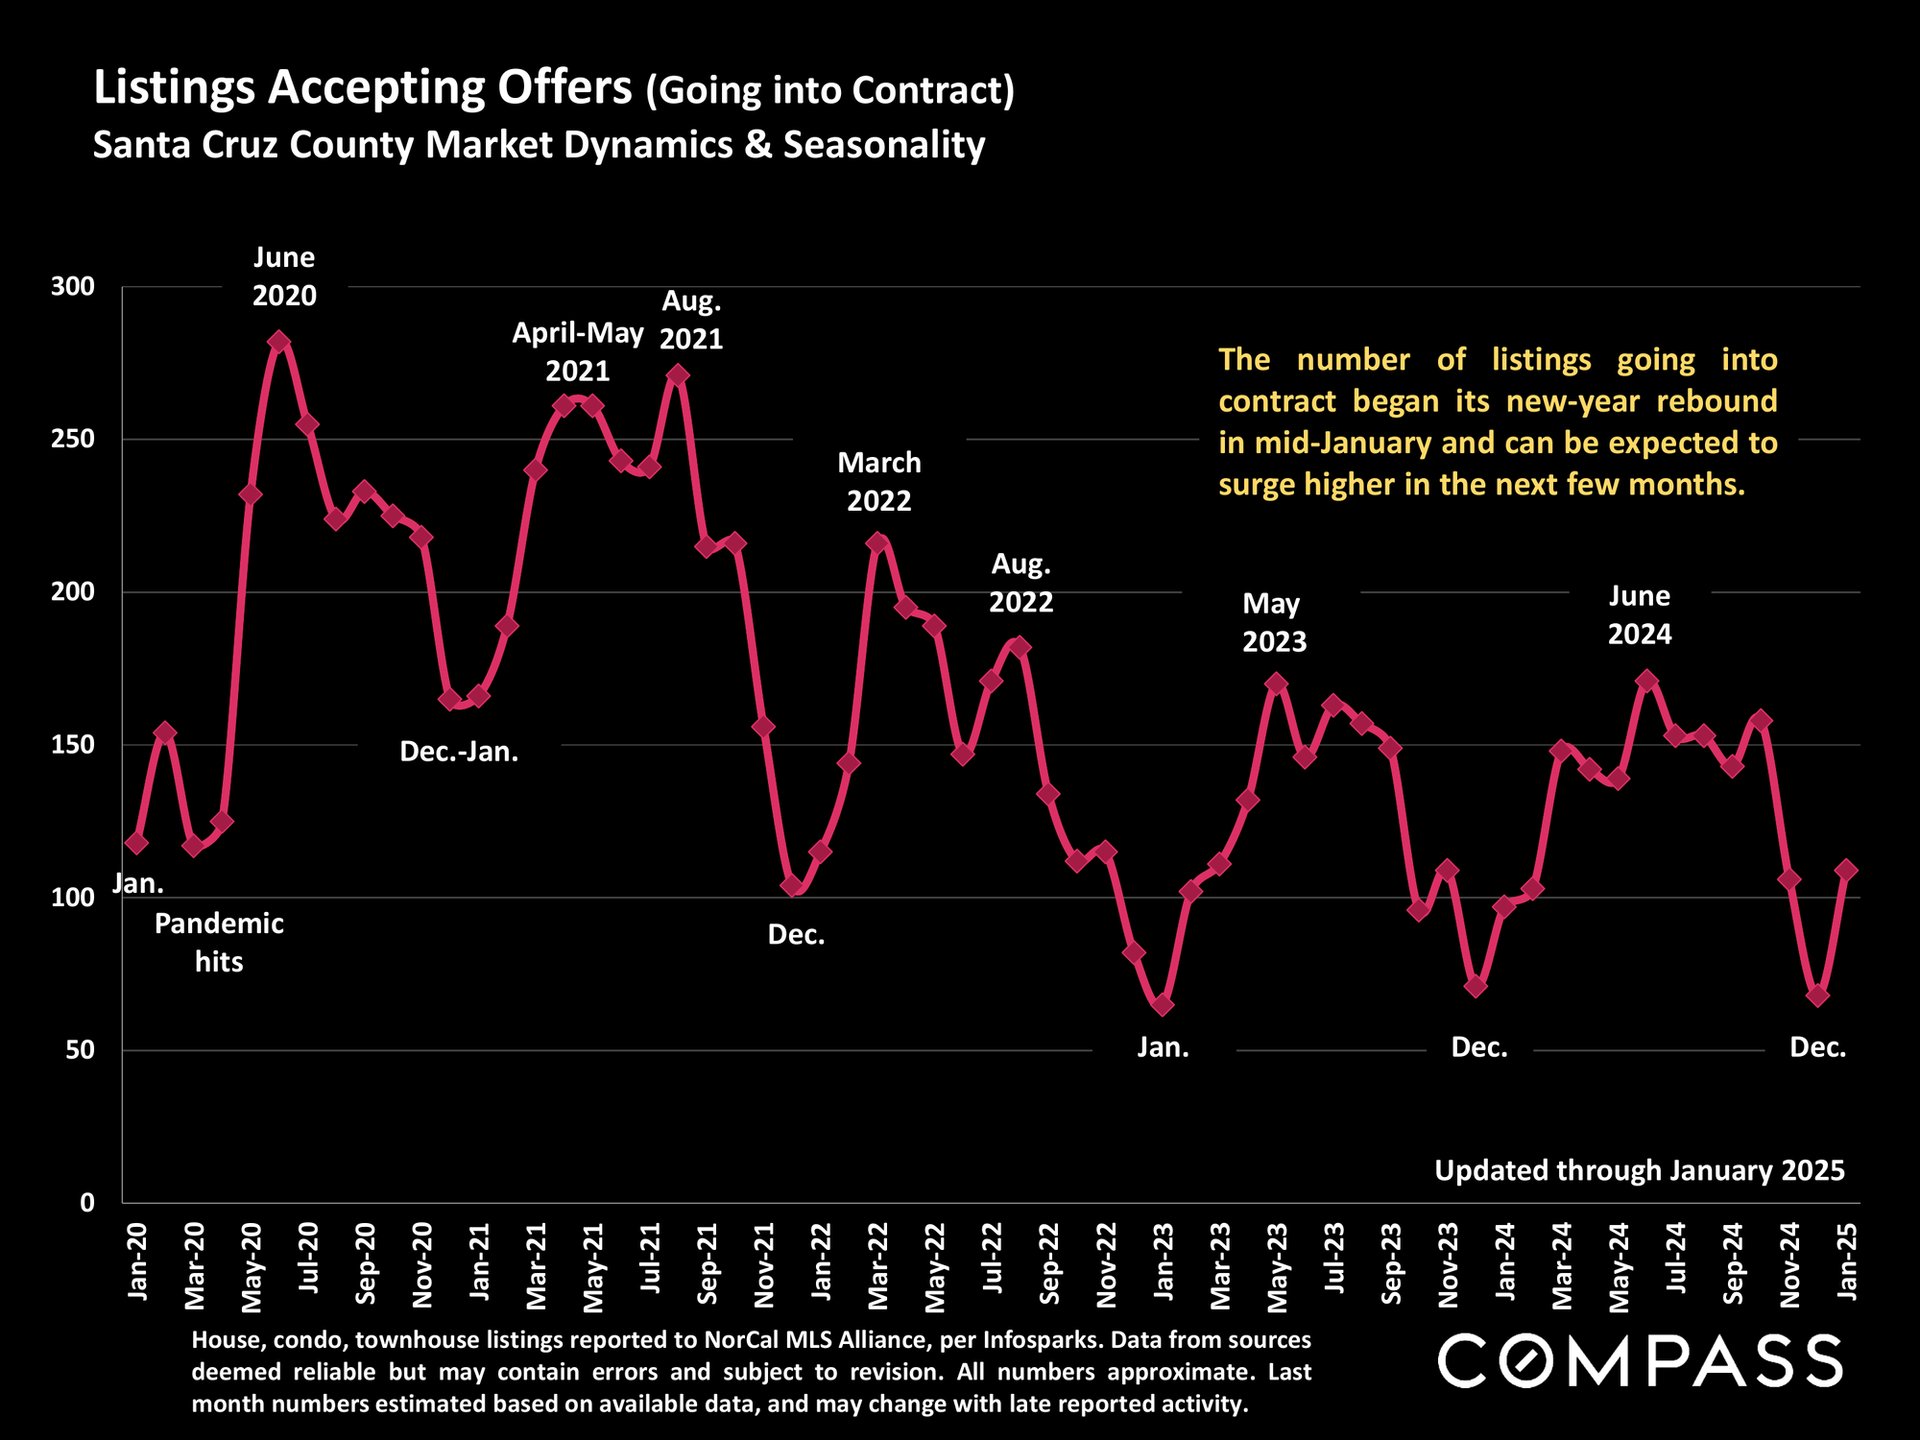
Santa Cruz County chart of listings going into contract, January 2020–January 2025, with a magenta seasonal trend line.
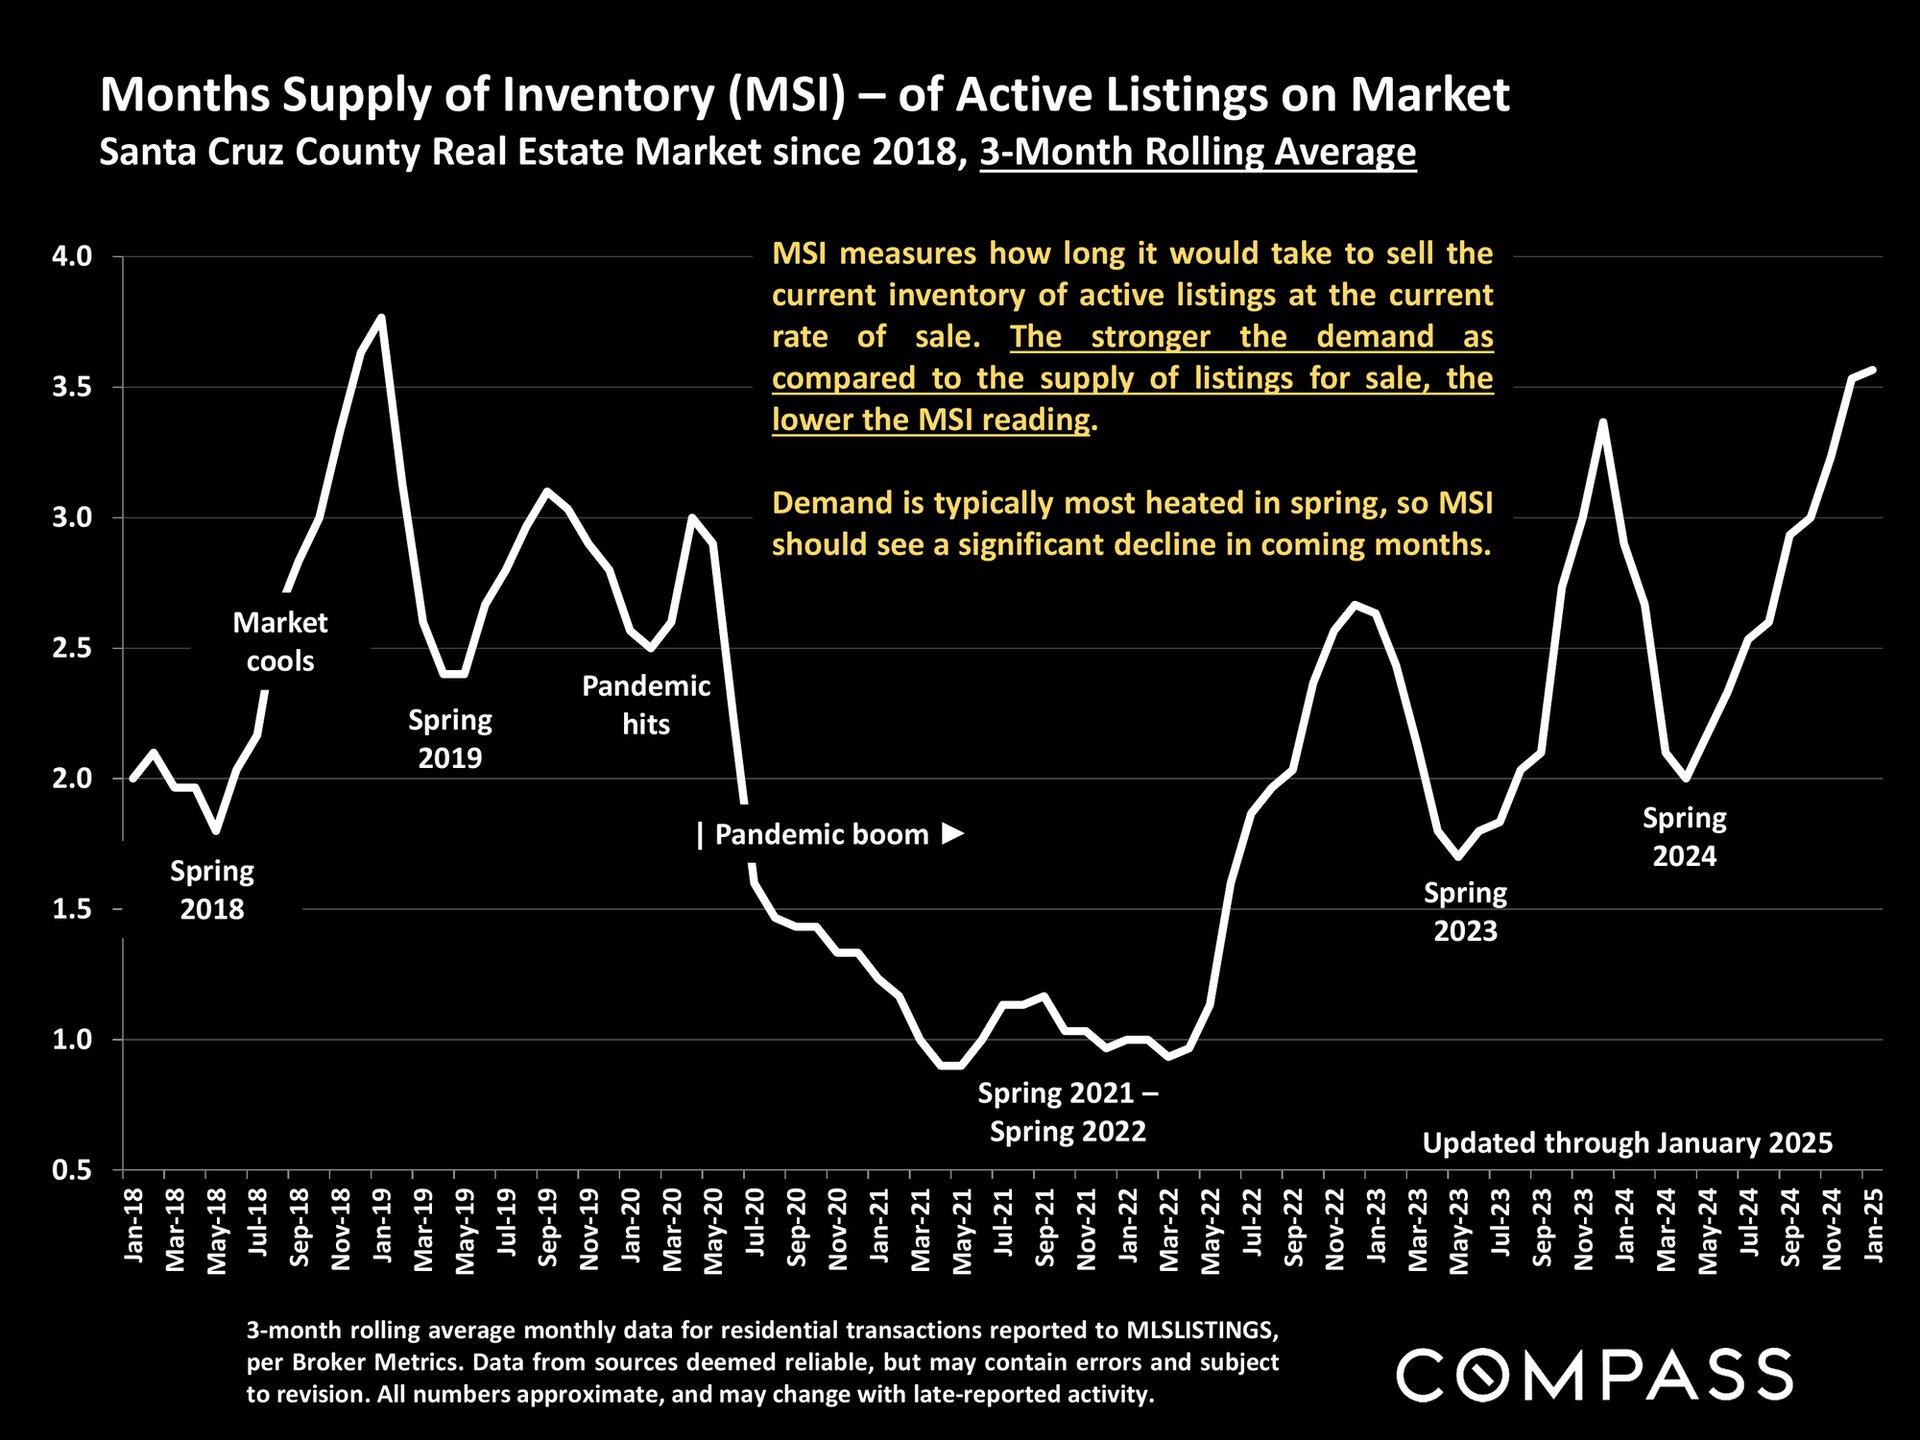
Chart of Santa Cruz County months of inventory, 2018–January 2025, with a low in 2021–2022 and a sharp rise by 2025.
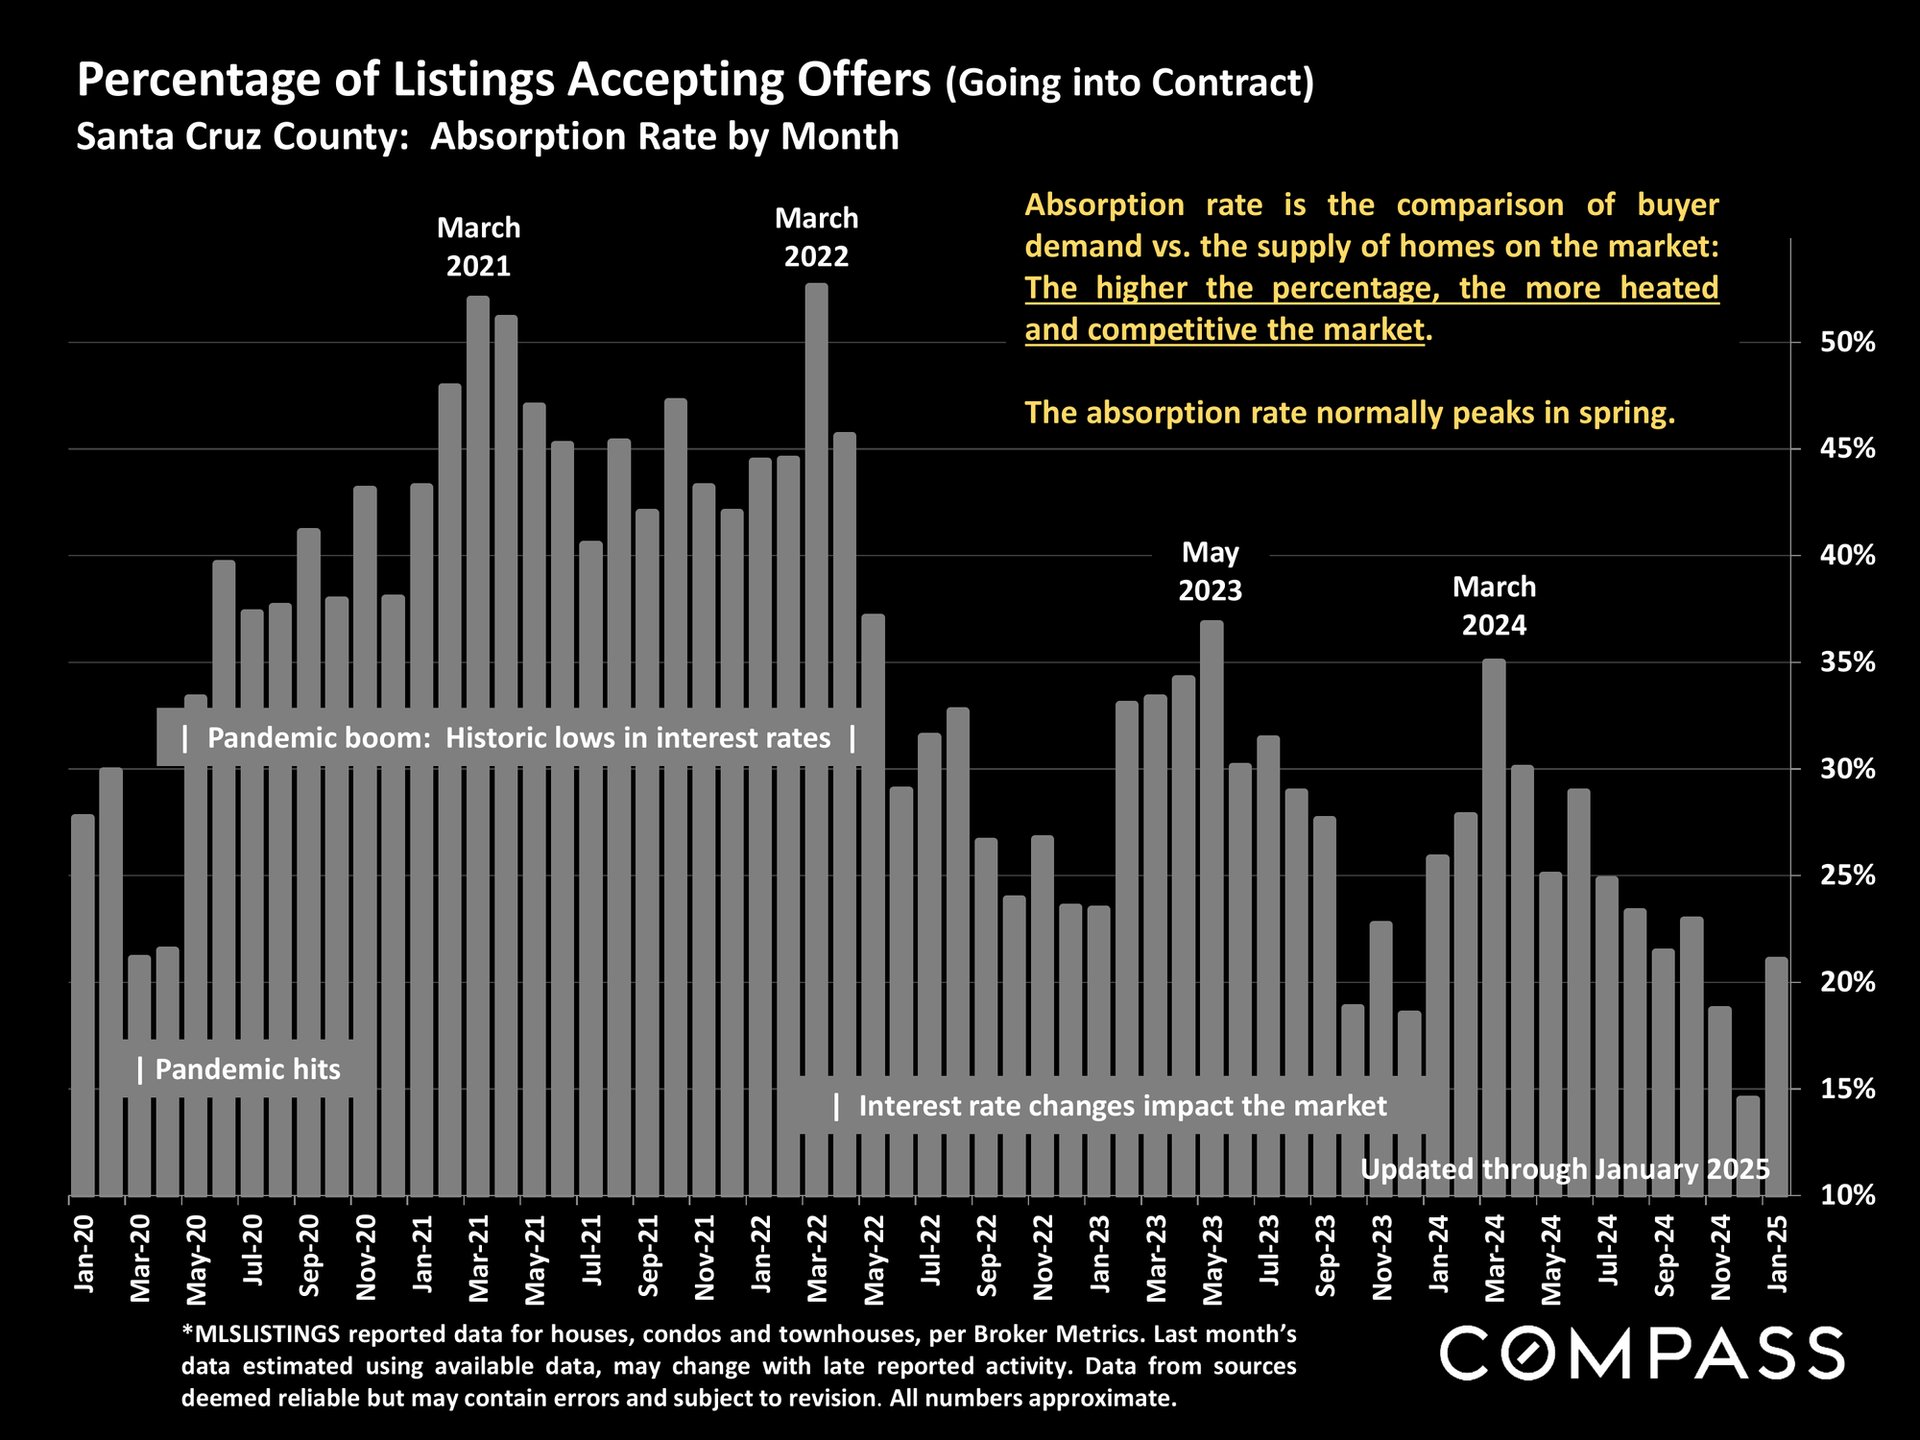
Chart showing Santa Cruz County listing absorption rates from January 2020 through January 2025.
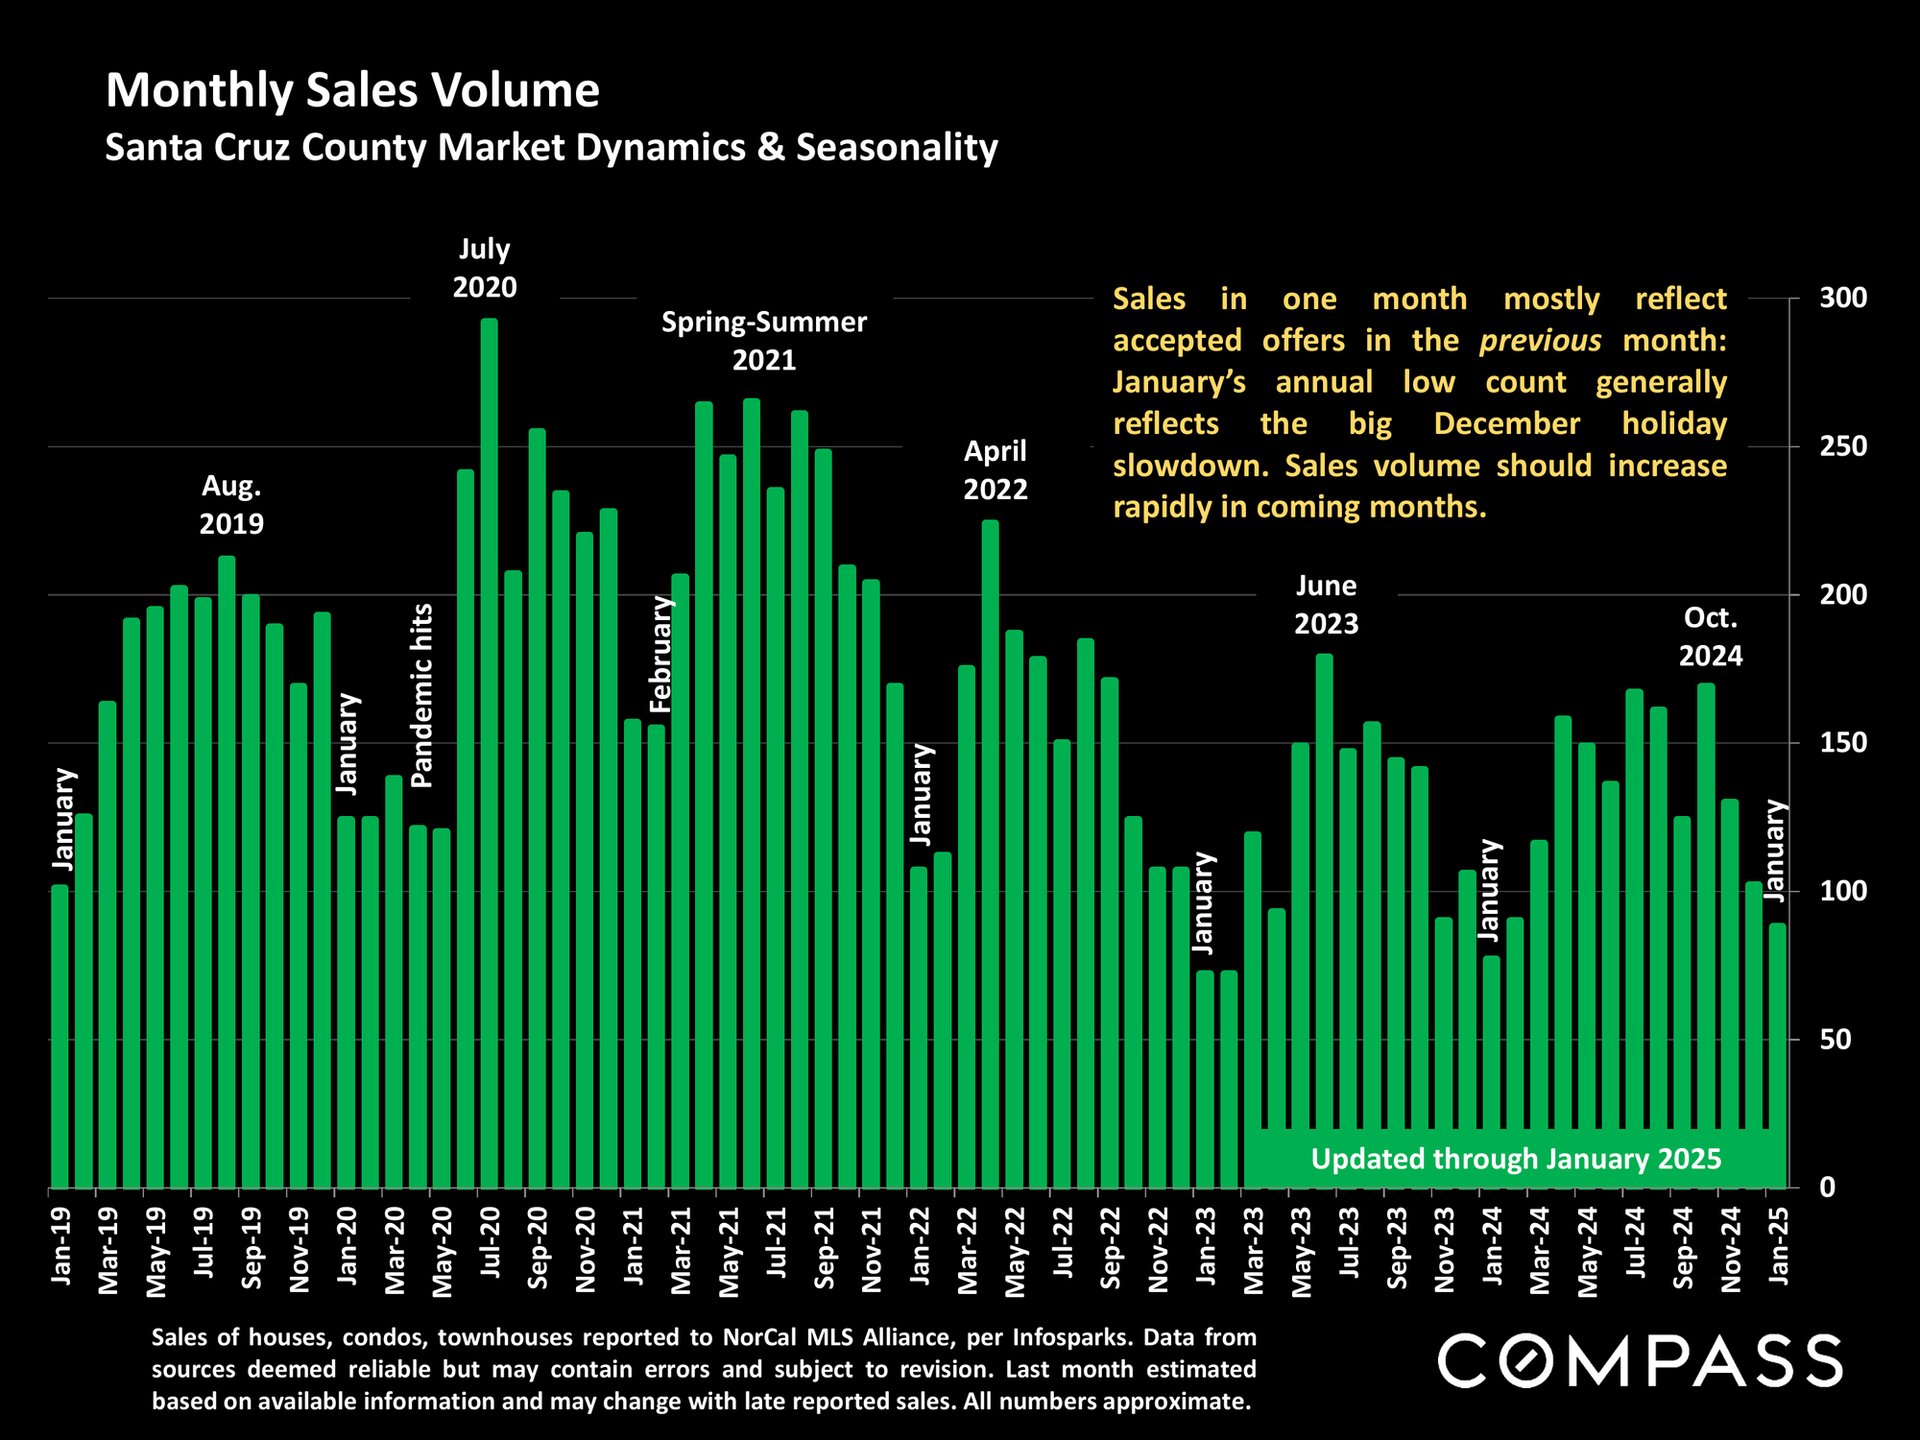
Santa Cruz County monthly home sales chart, with green bars from 2019 to January 2025 and seasonal annotations.
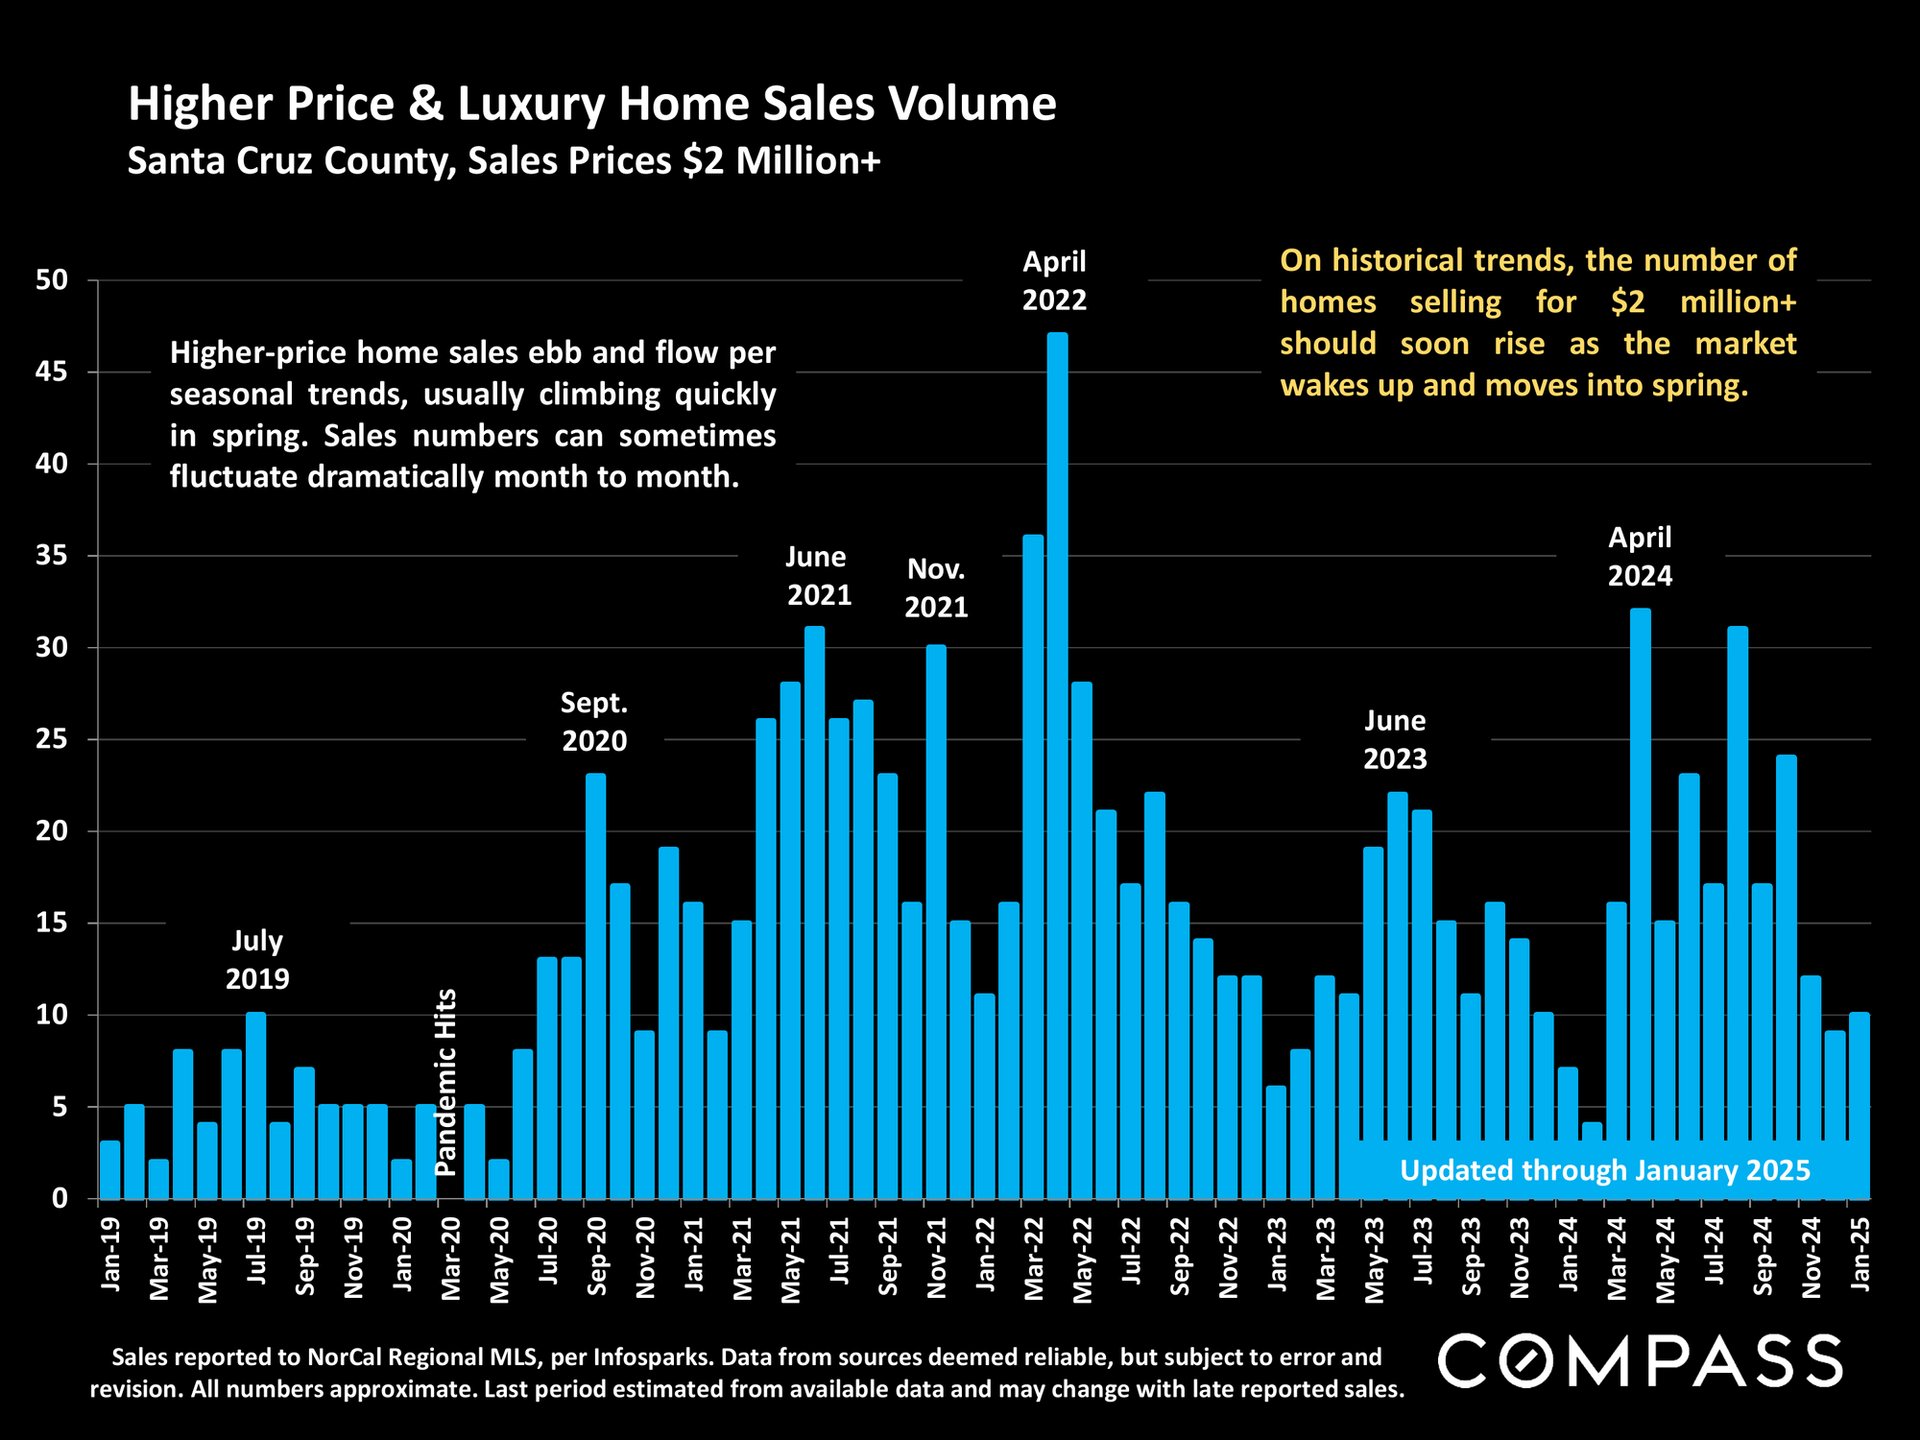
Chart of monthly Santa Cruz County sales over $2 million, updated through January 2025.
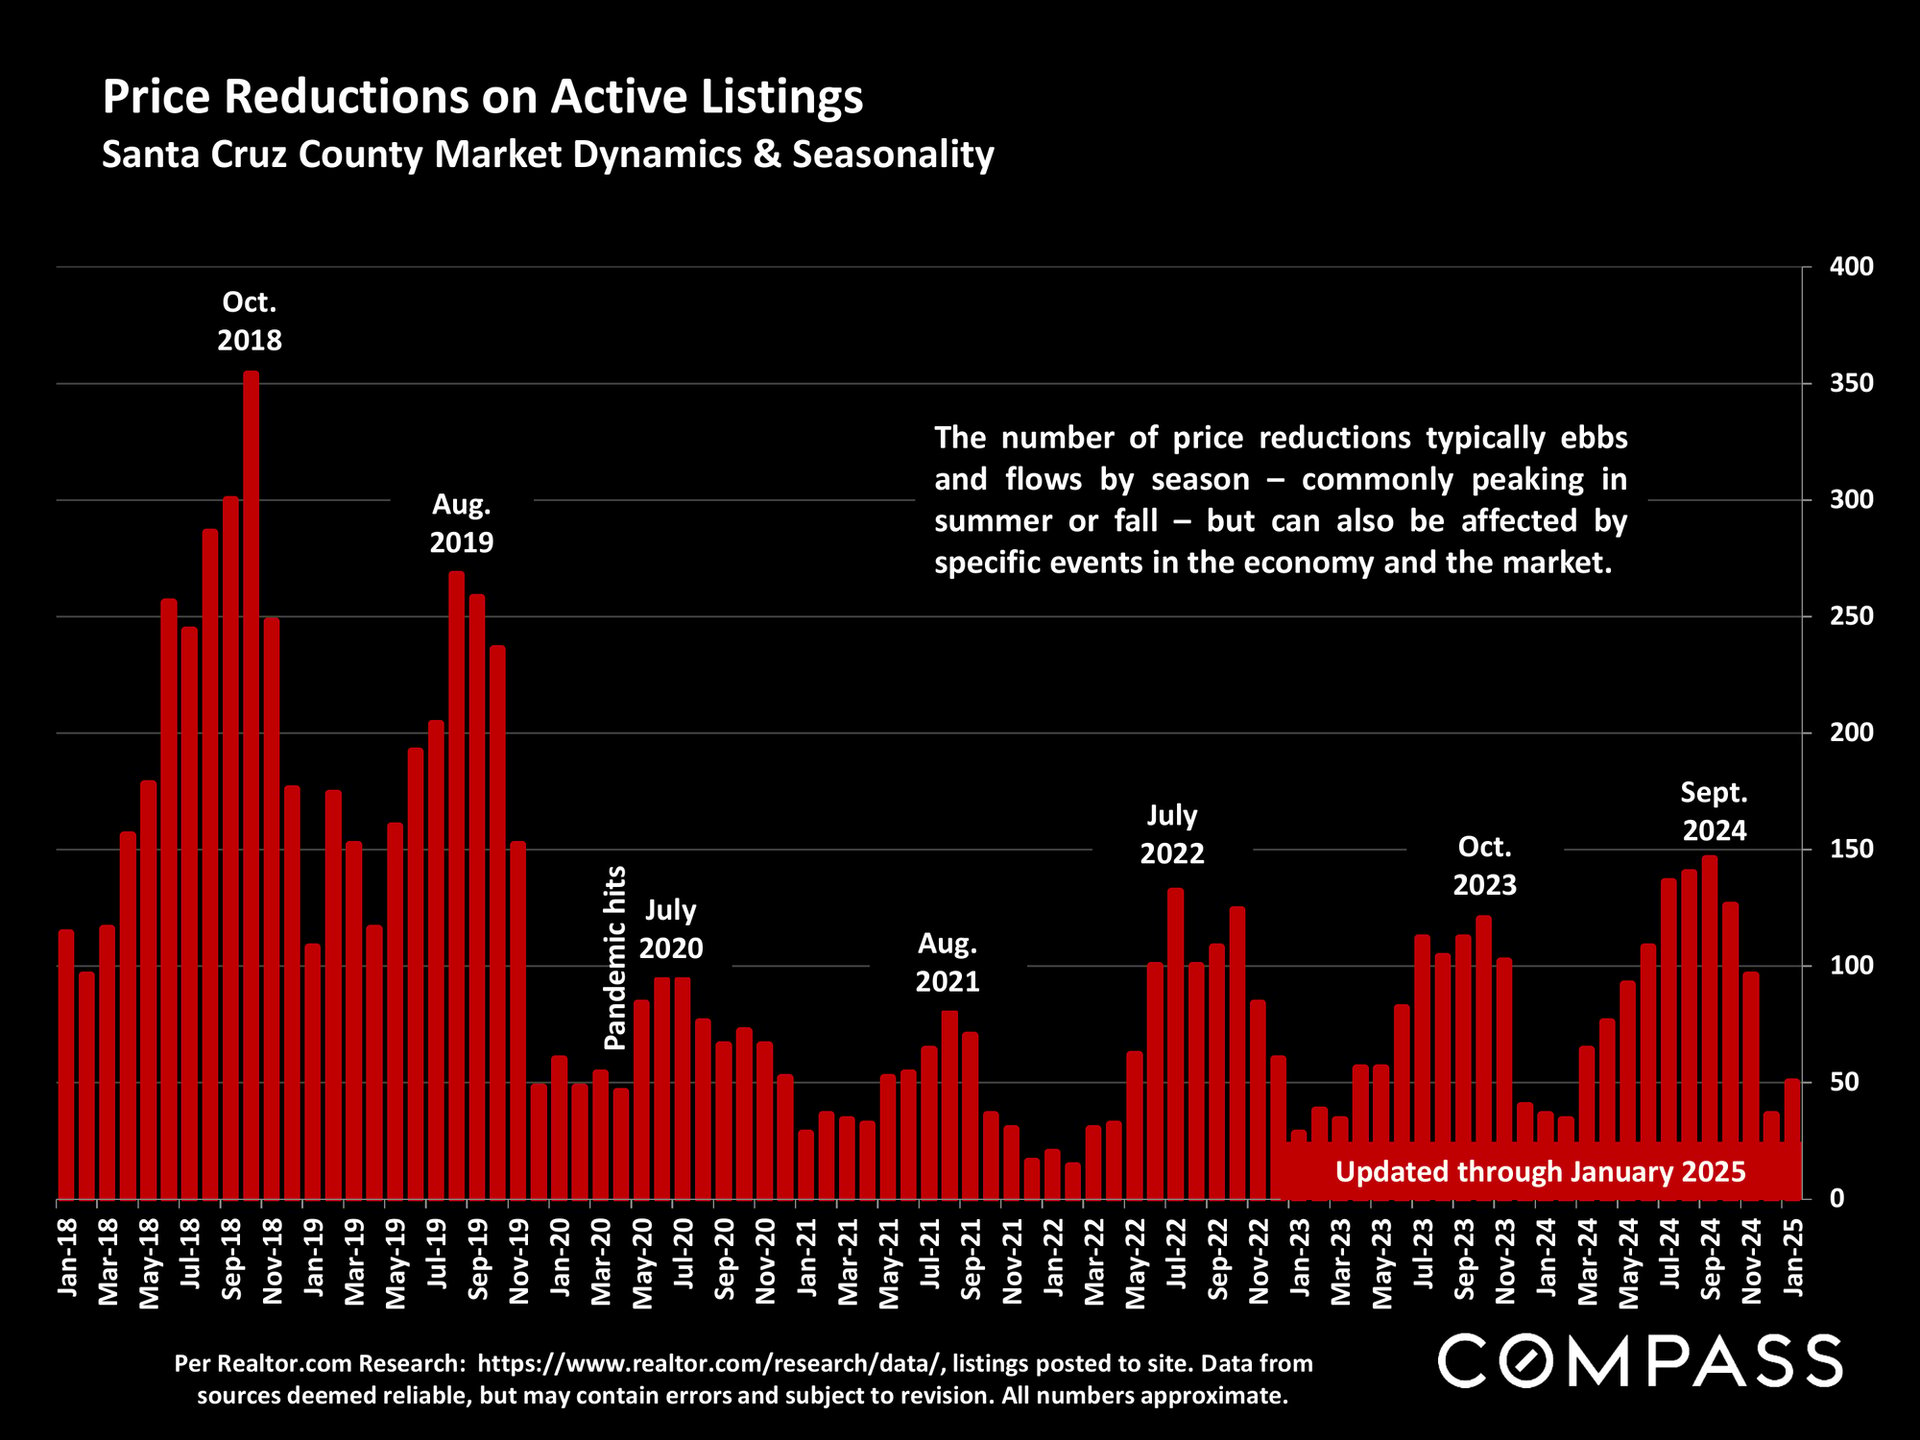
Bar chart of Santa Cruz County active-listing price reductions, January 2018–January 2025, with peaks in summer and fall.
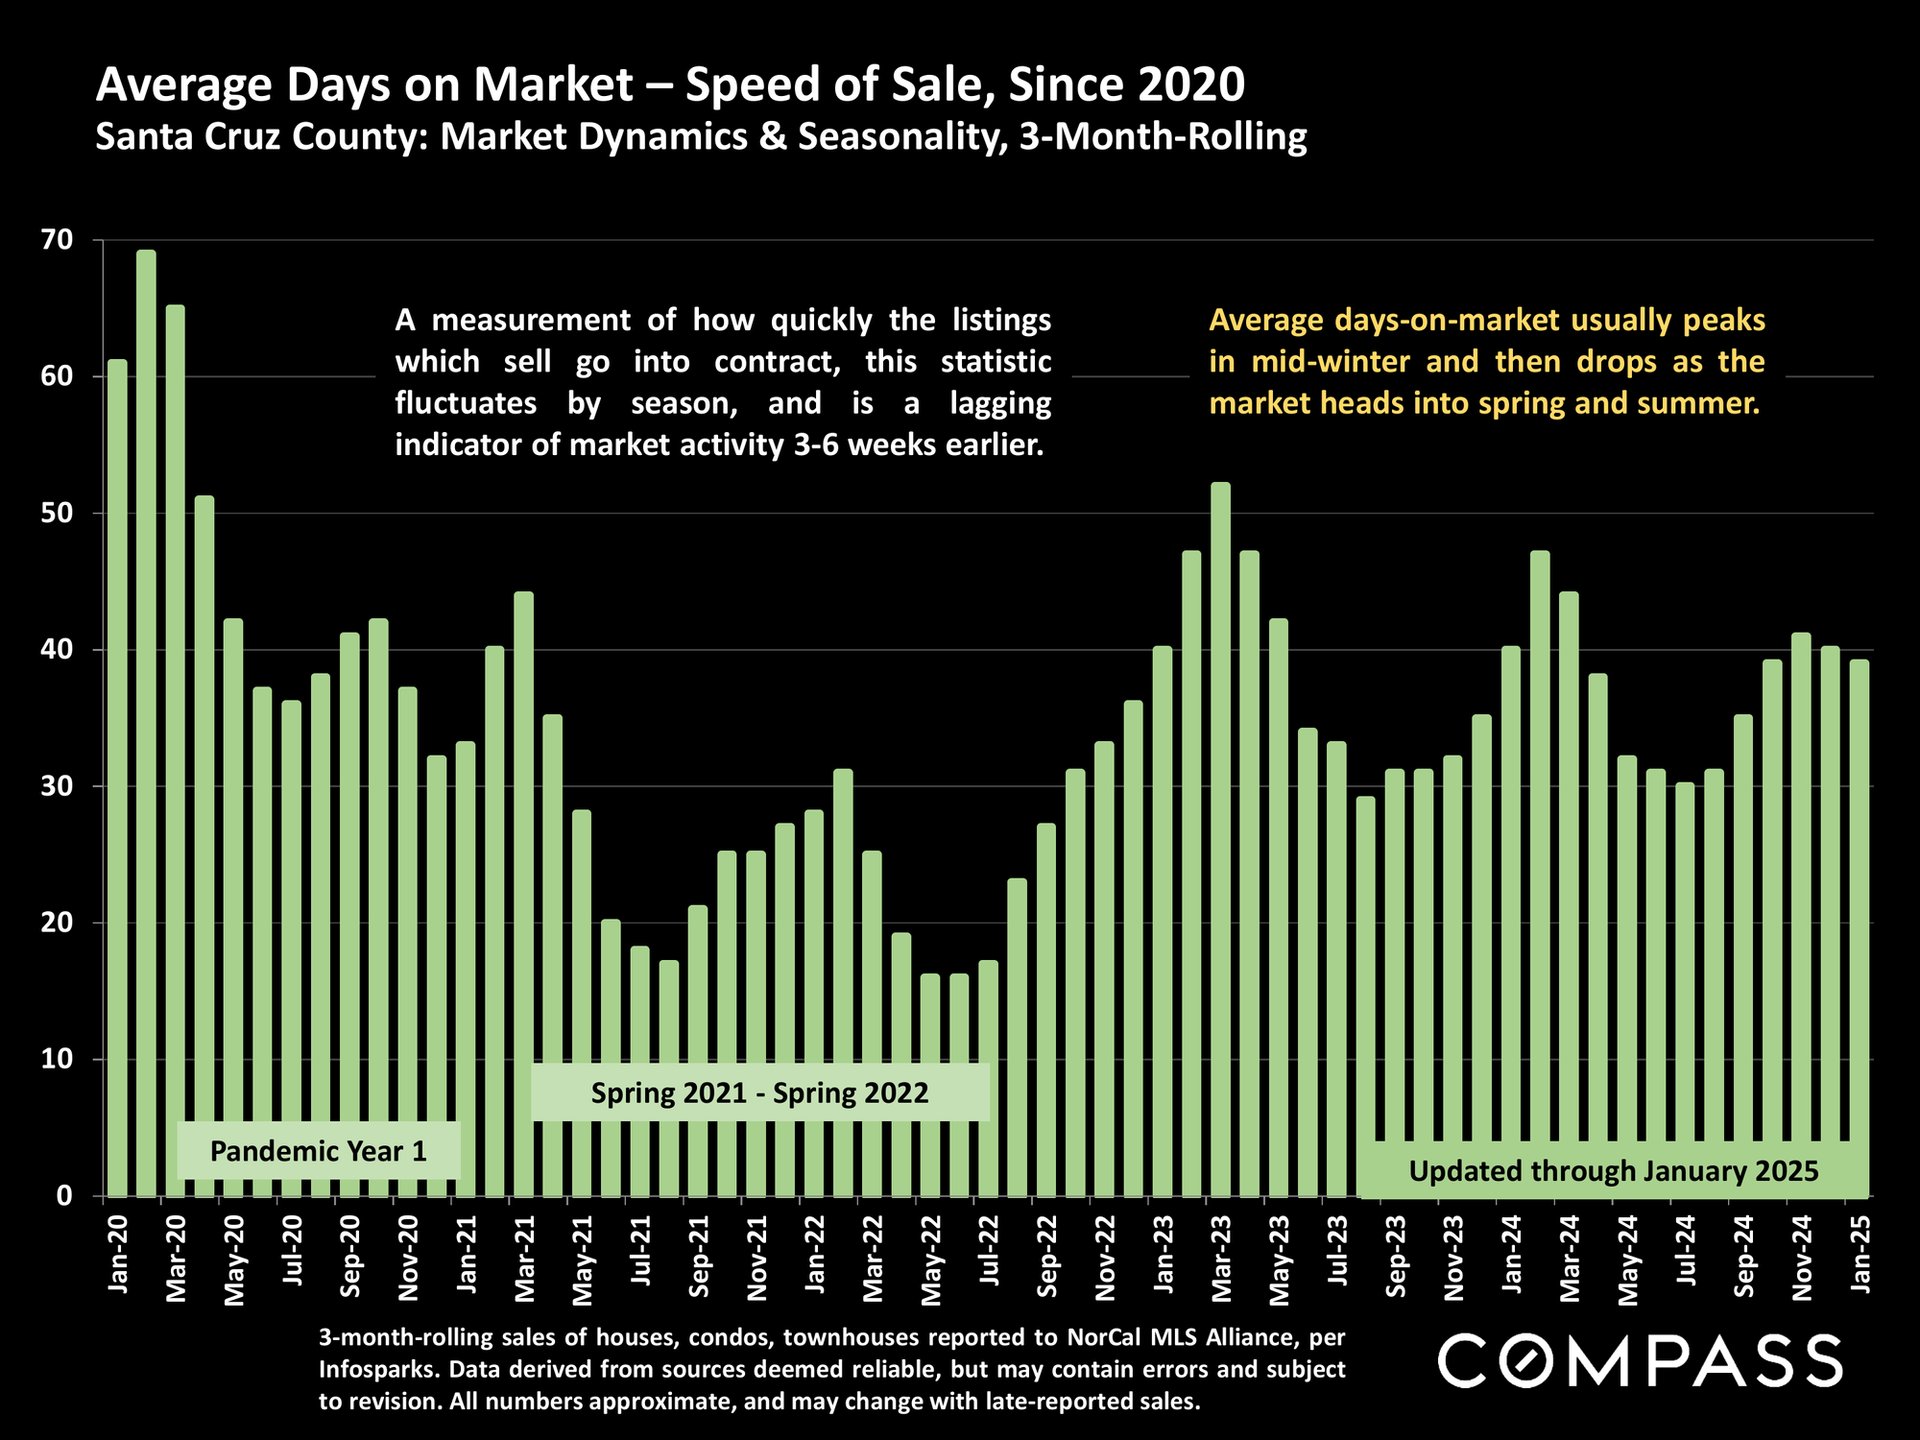
Santa Cruz County average days on market chart, January 2020–January 2025, with seasonal peaks in winter.
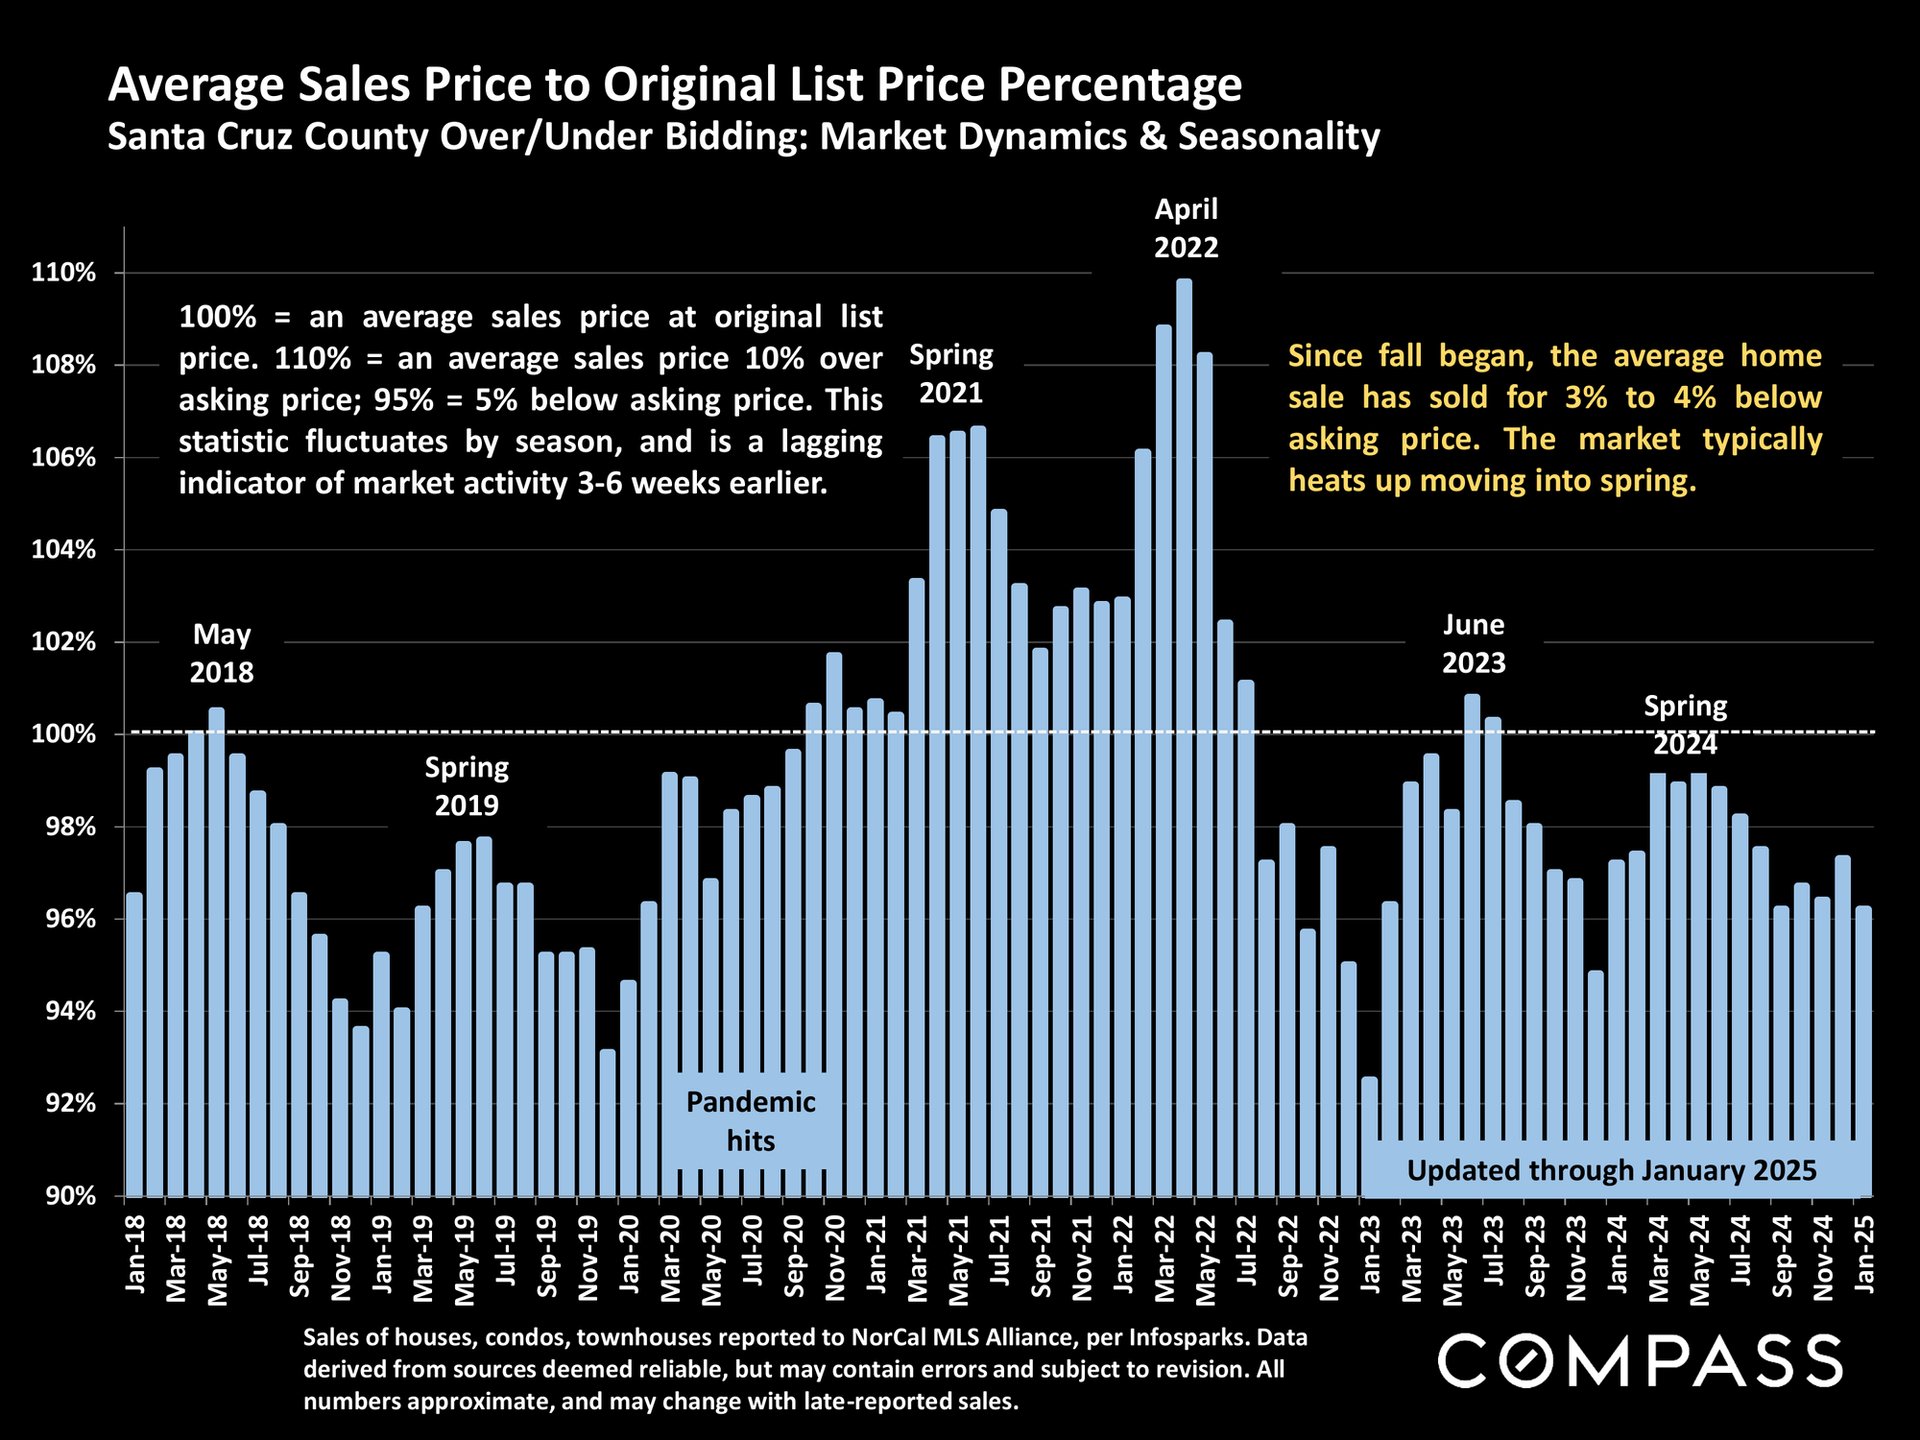
Chart of Santa Cruz County sale prices versus original list prices, January 2018–January 2025, with seasonal market annotations.
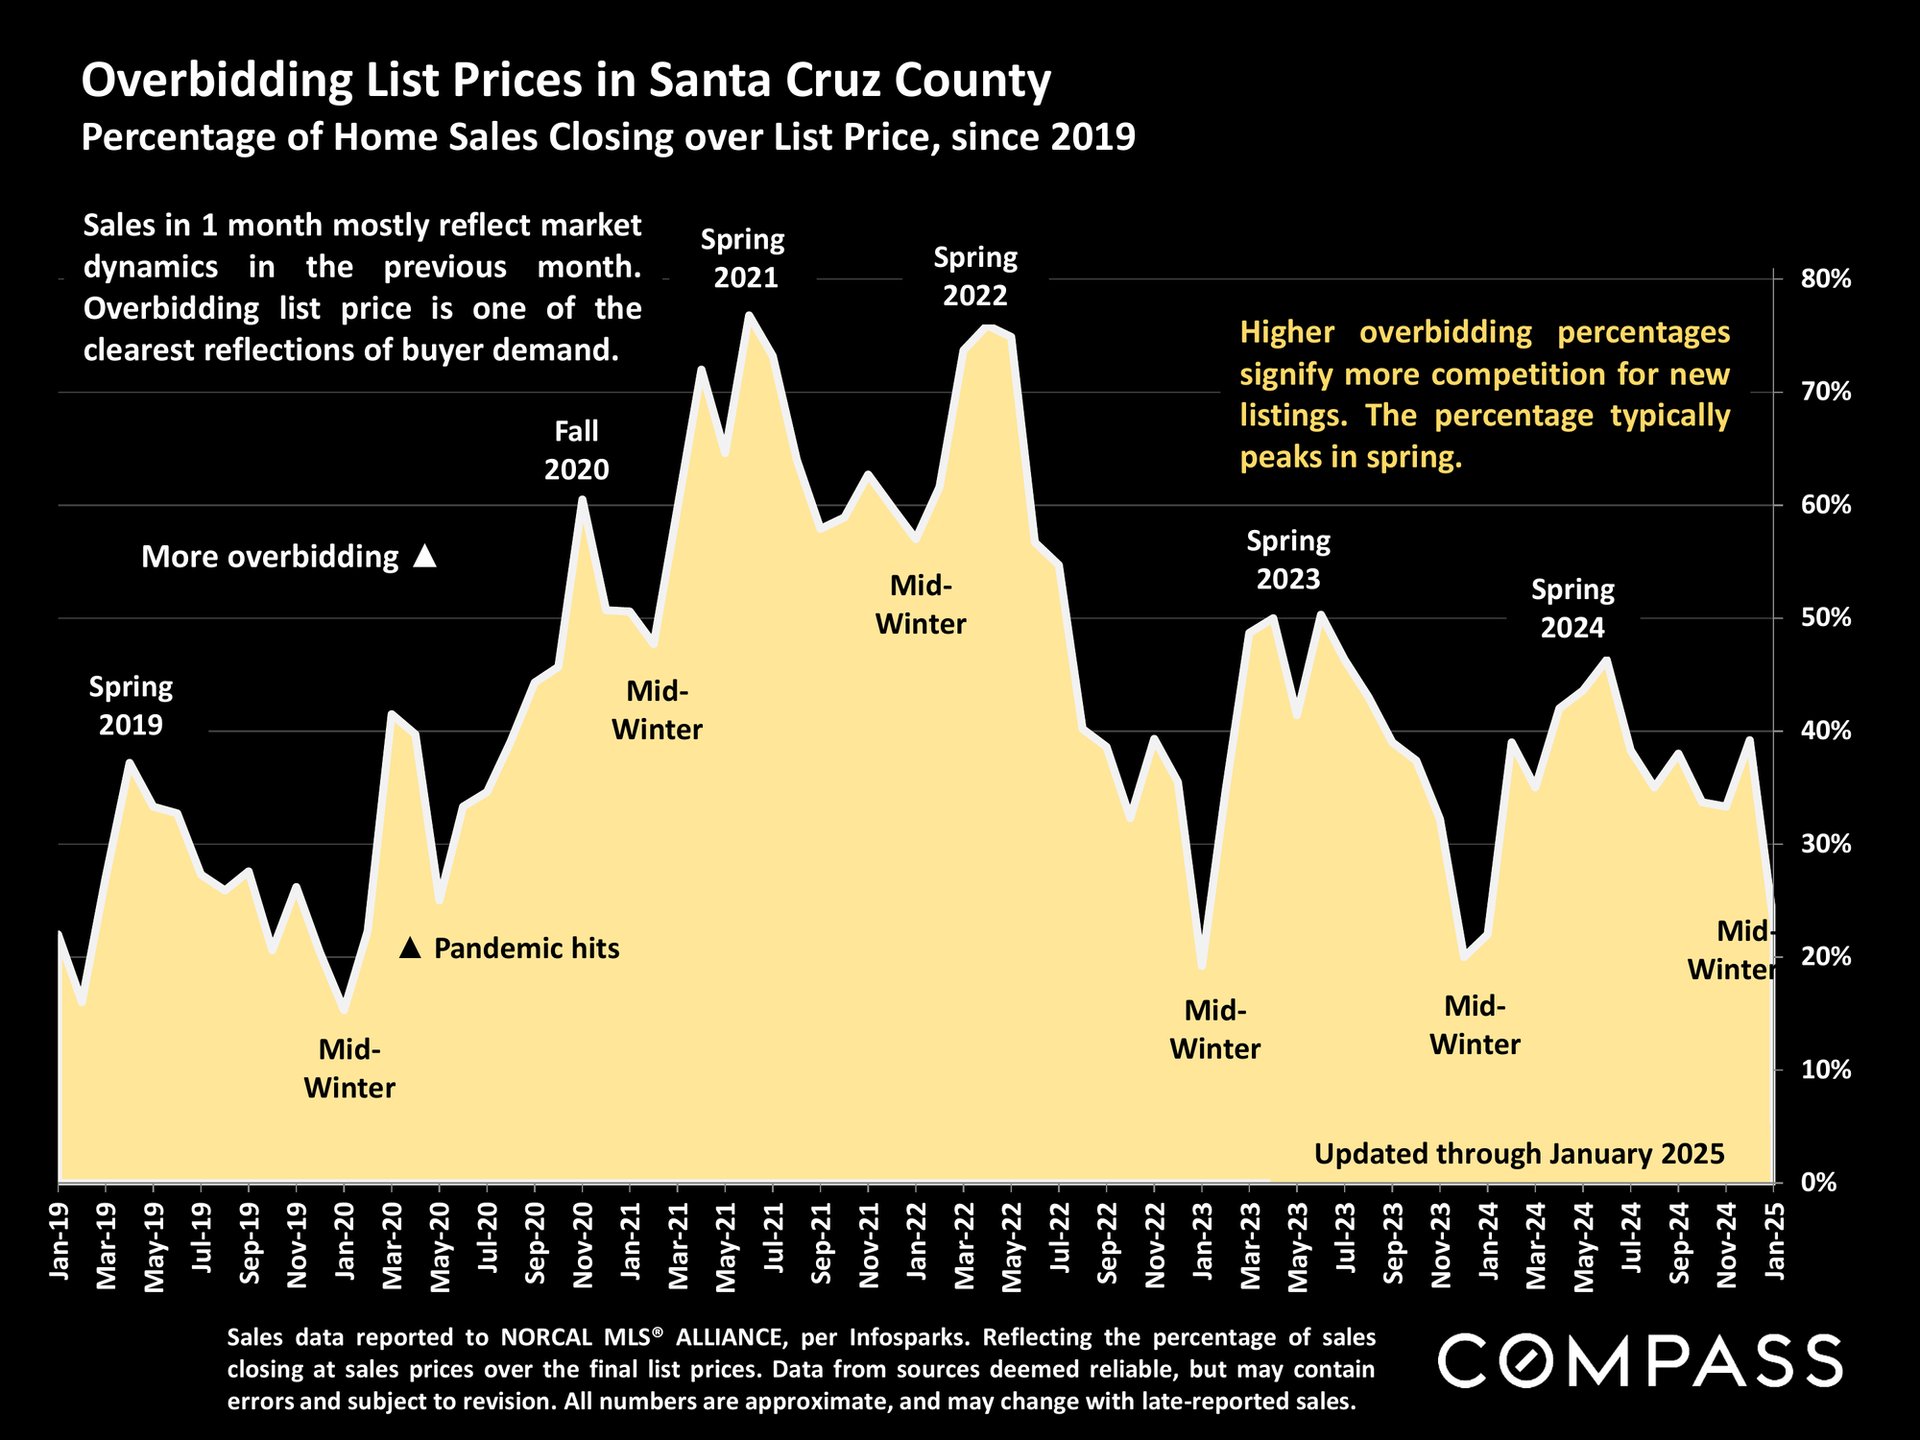
Chart of Santa Cruz County home sales over list price, peaking near 80% in spring 2021 and 2022.
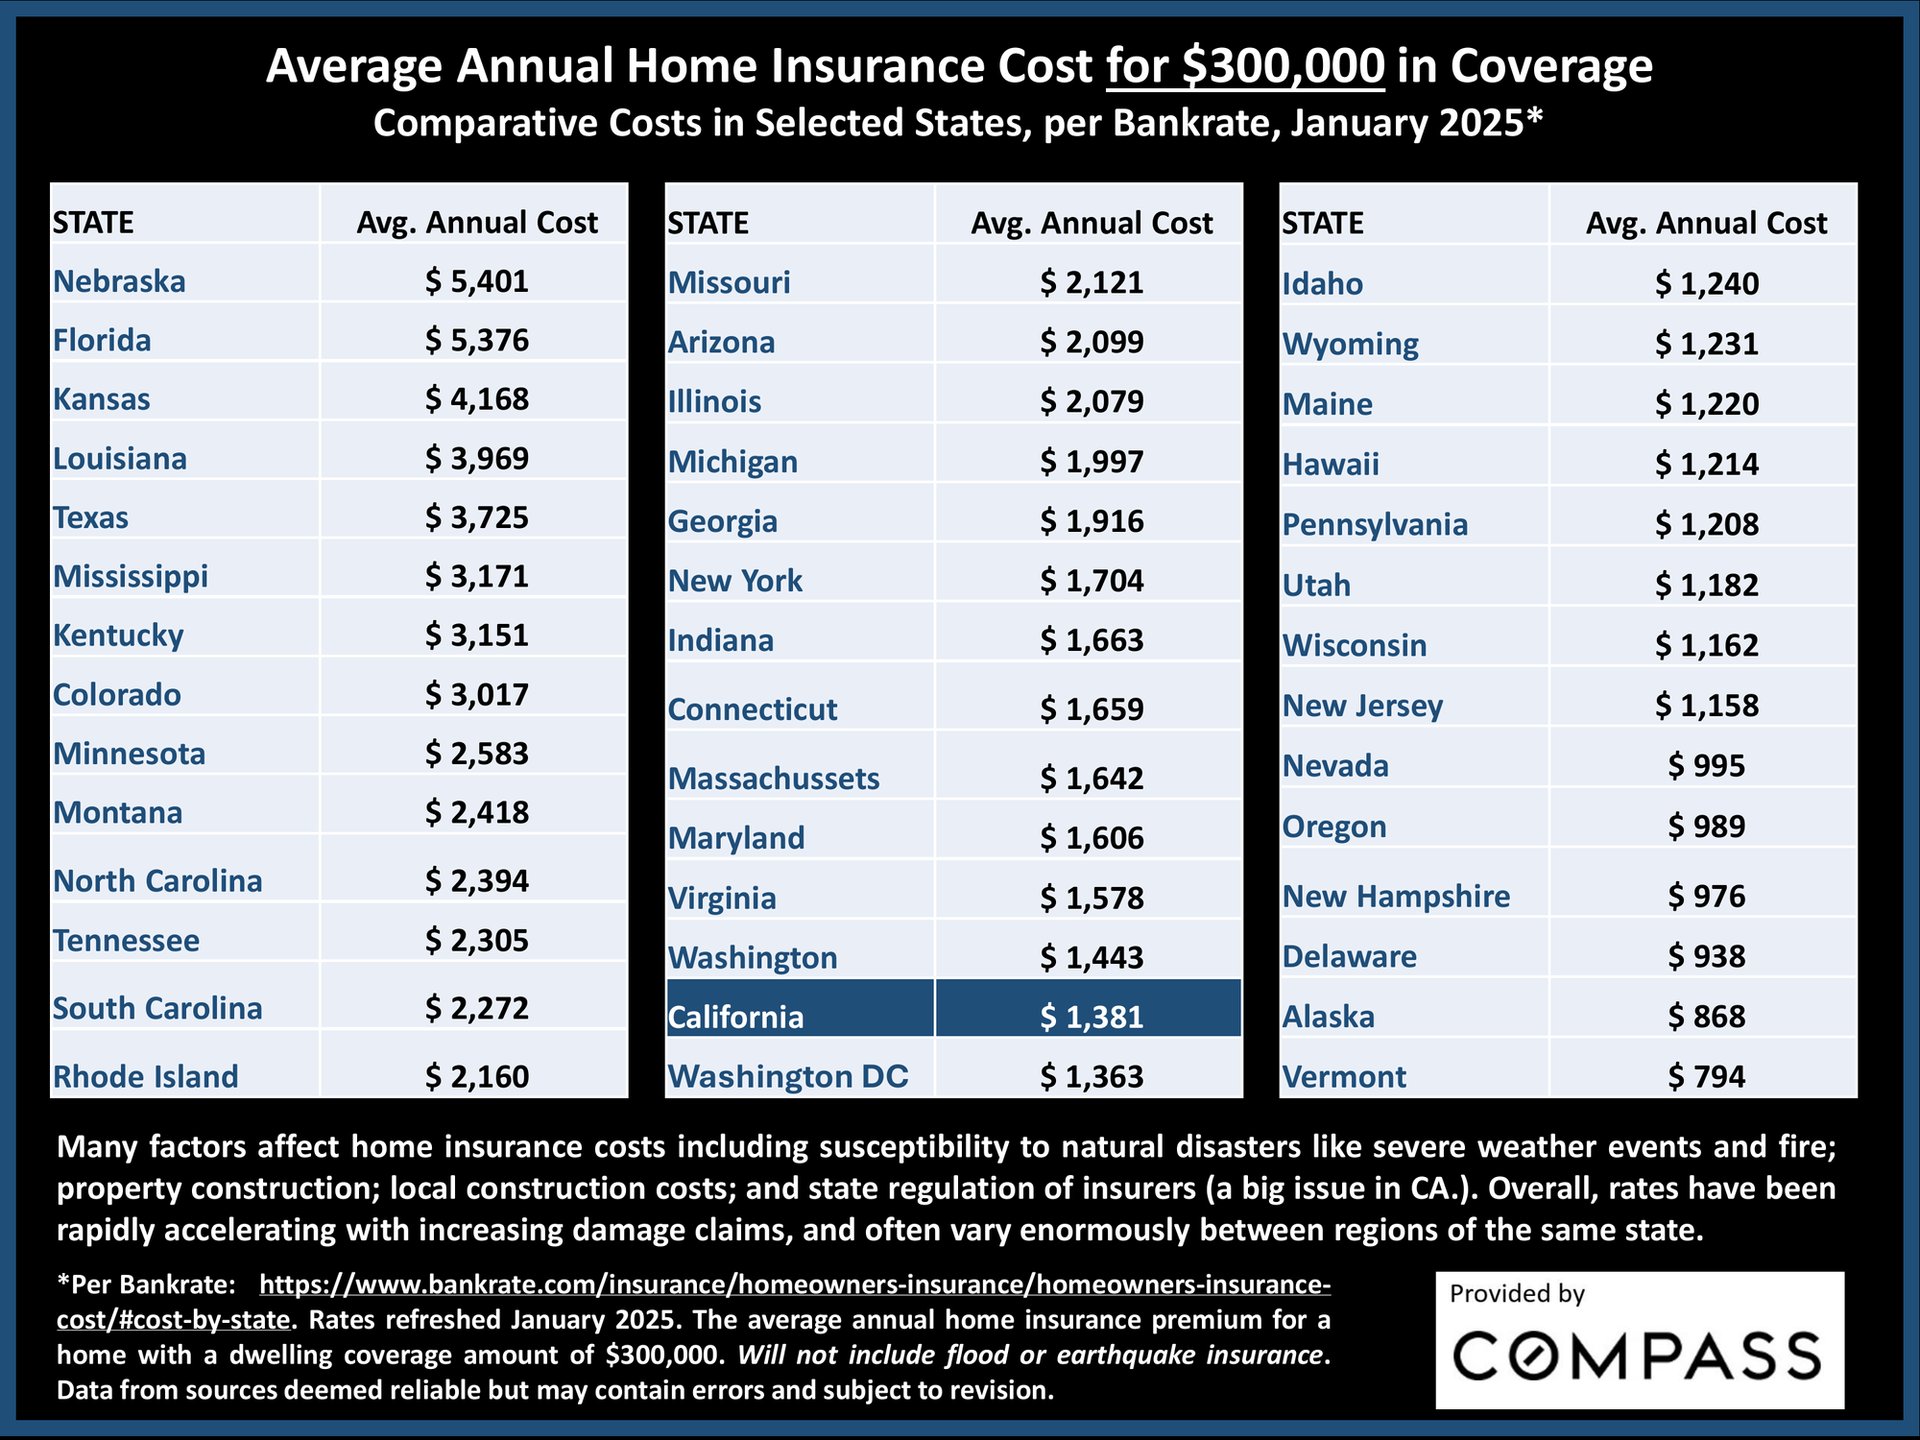
Infographic comparing average annual home insurance costs by state for $300,000 in coverage, with California highlighted at $1,381.
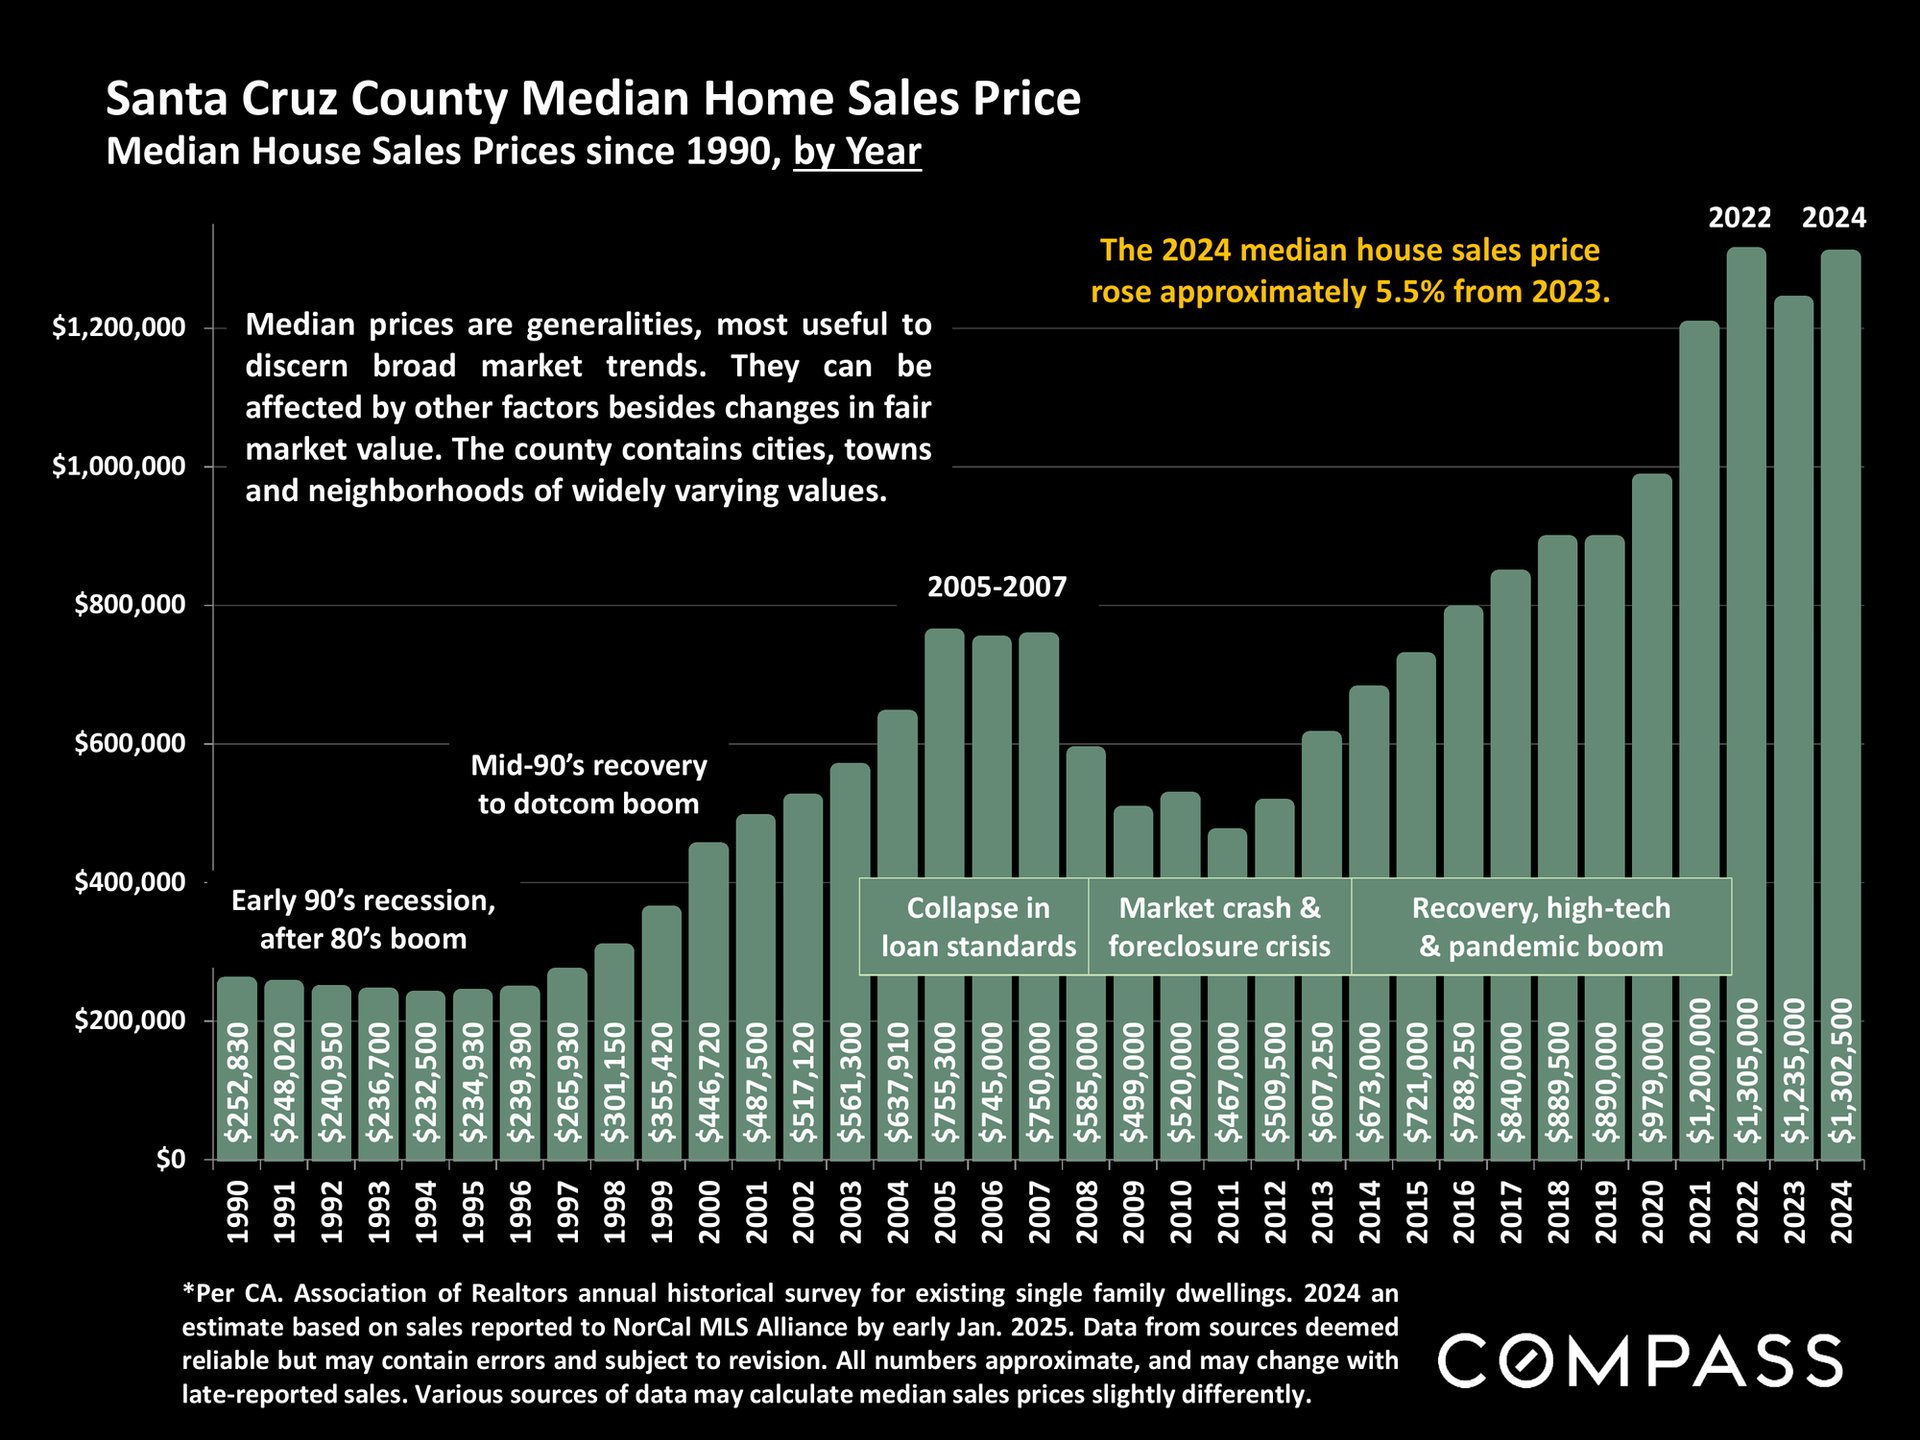
Chart of Santa Cruz County median home sale prices from 1990 to 2024, with market-cycle annotations.
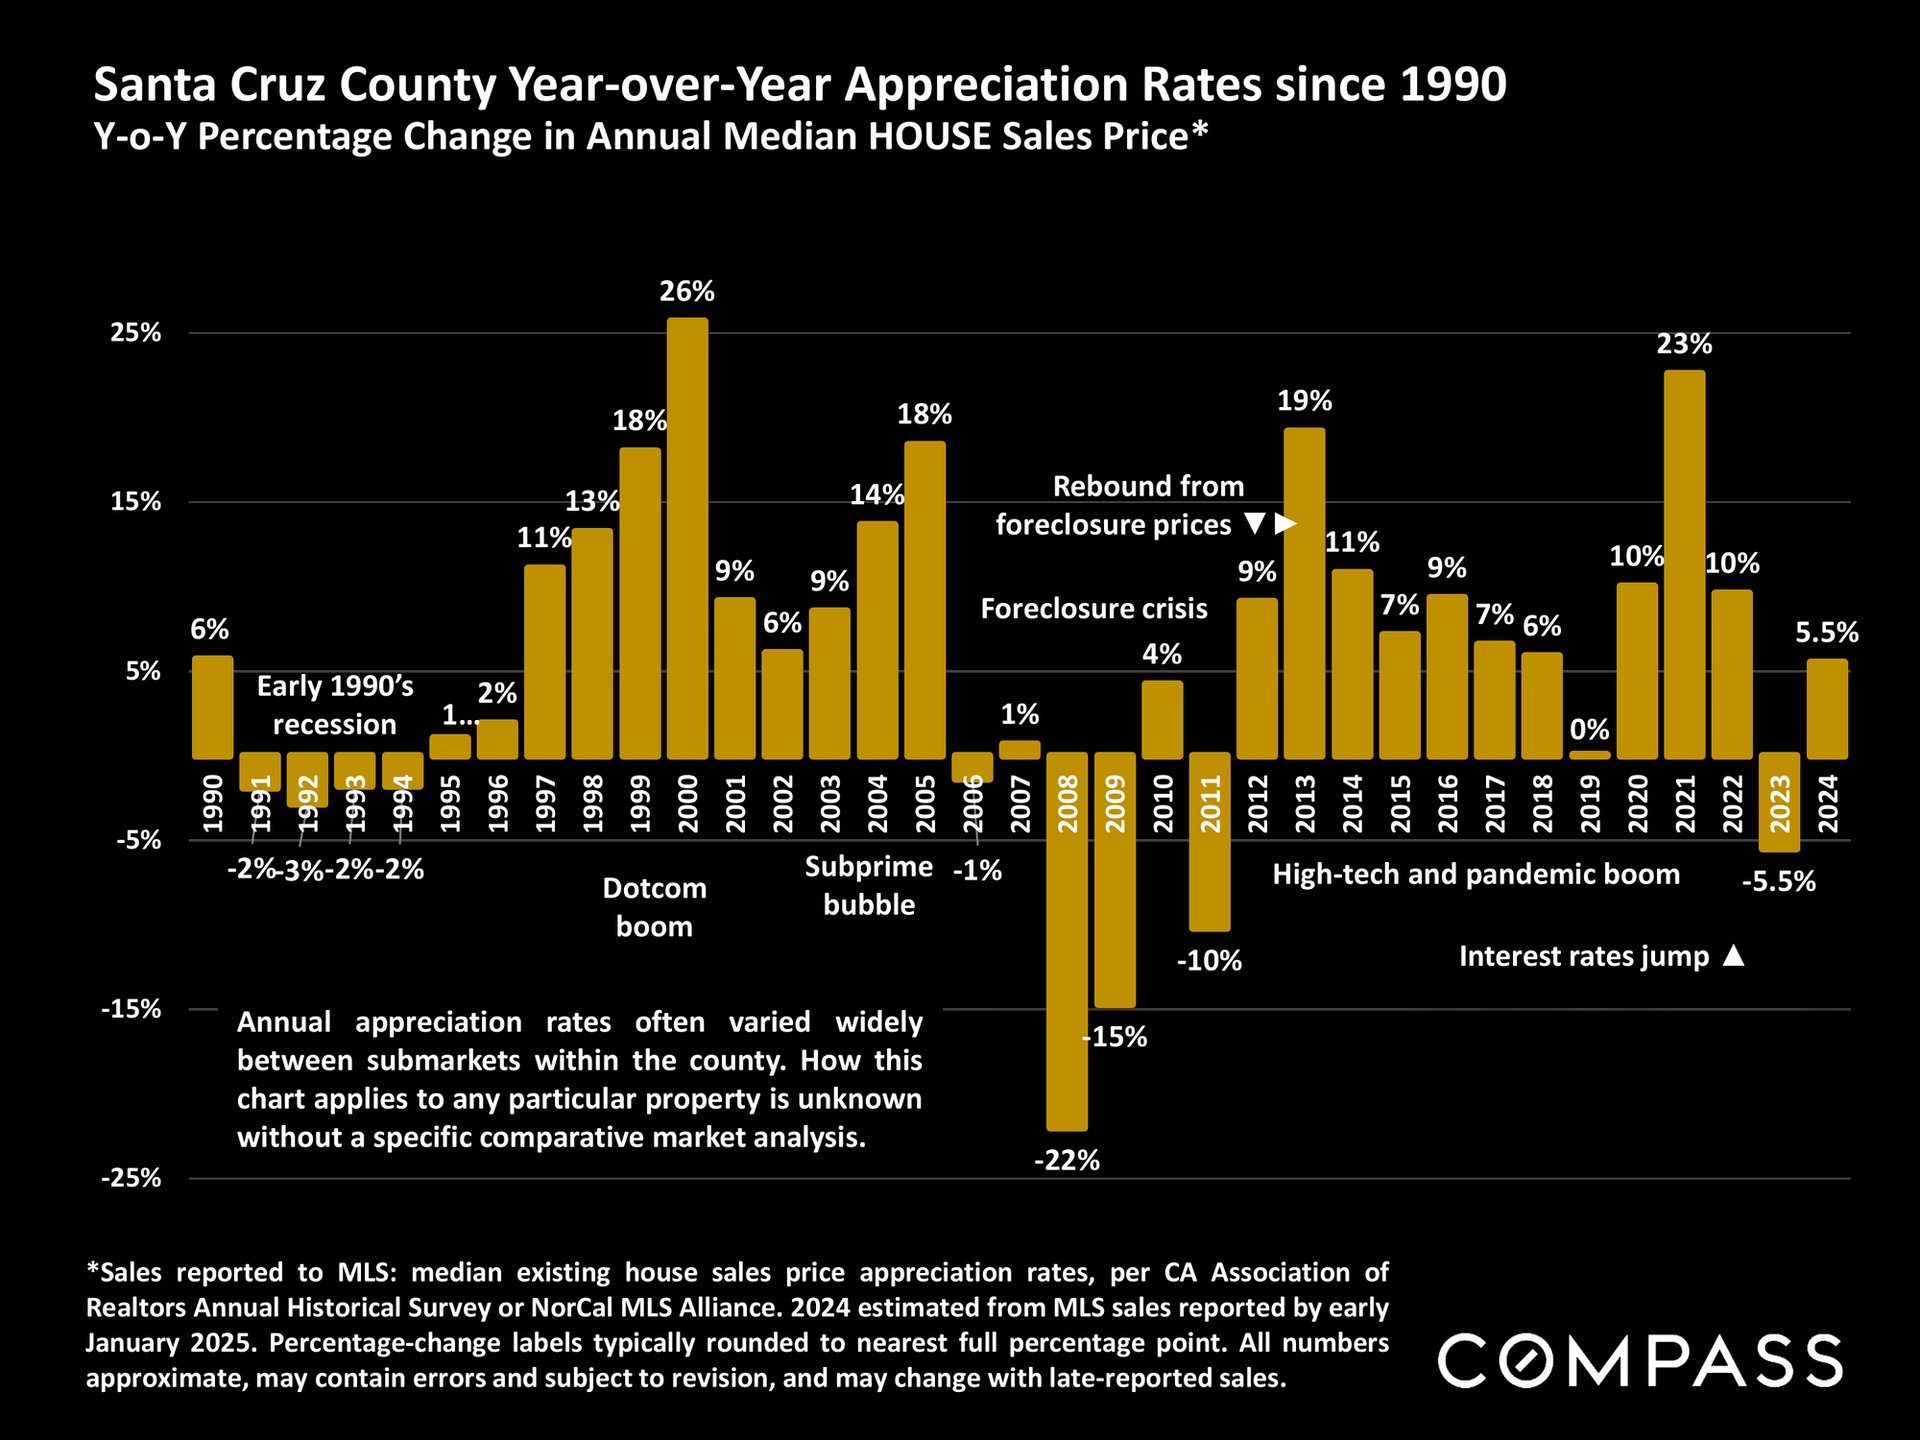
Chart of Santa Cruz County annual home-price appreciation, with gold bars from 1990 to 2024 and historical market annotations.
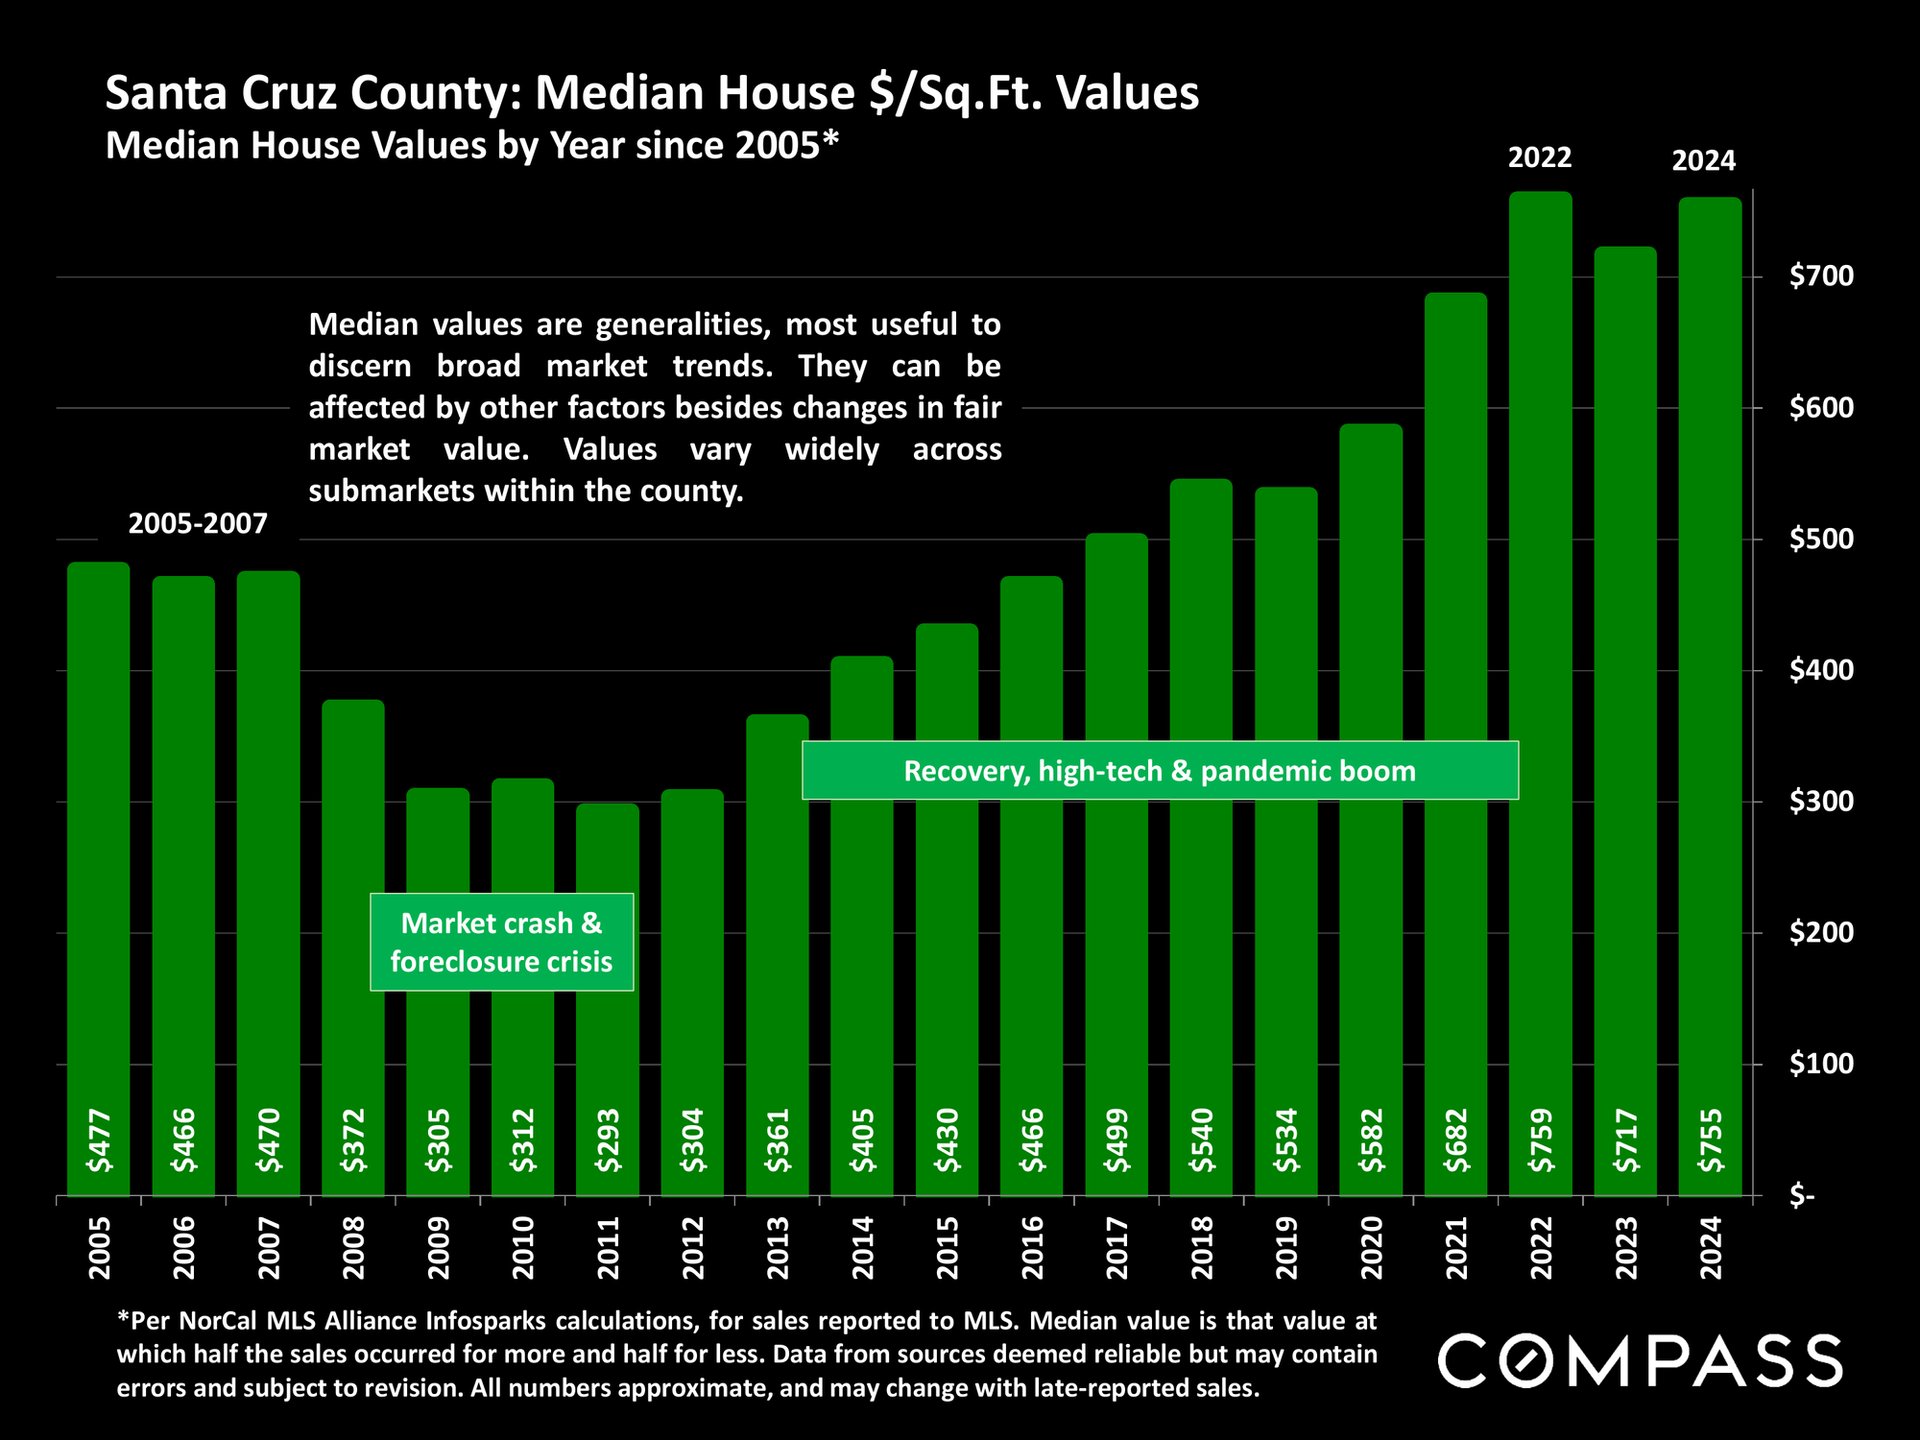
Chart of Santa Cruz County median house values per square foot, rising from $477 in 2005 to $755 in 2024.
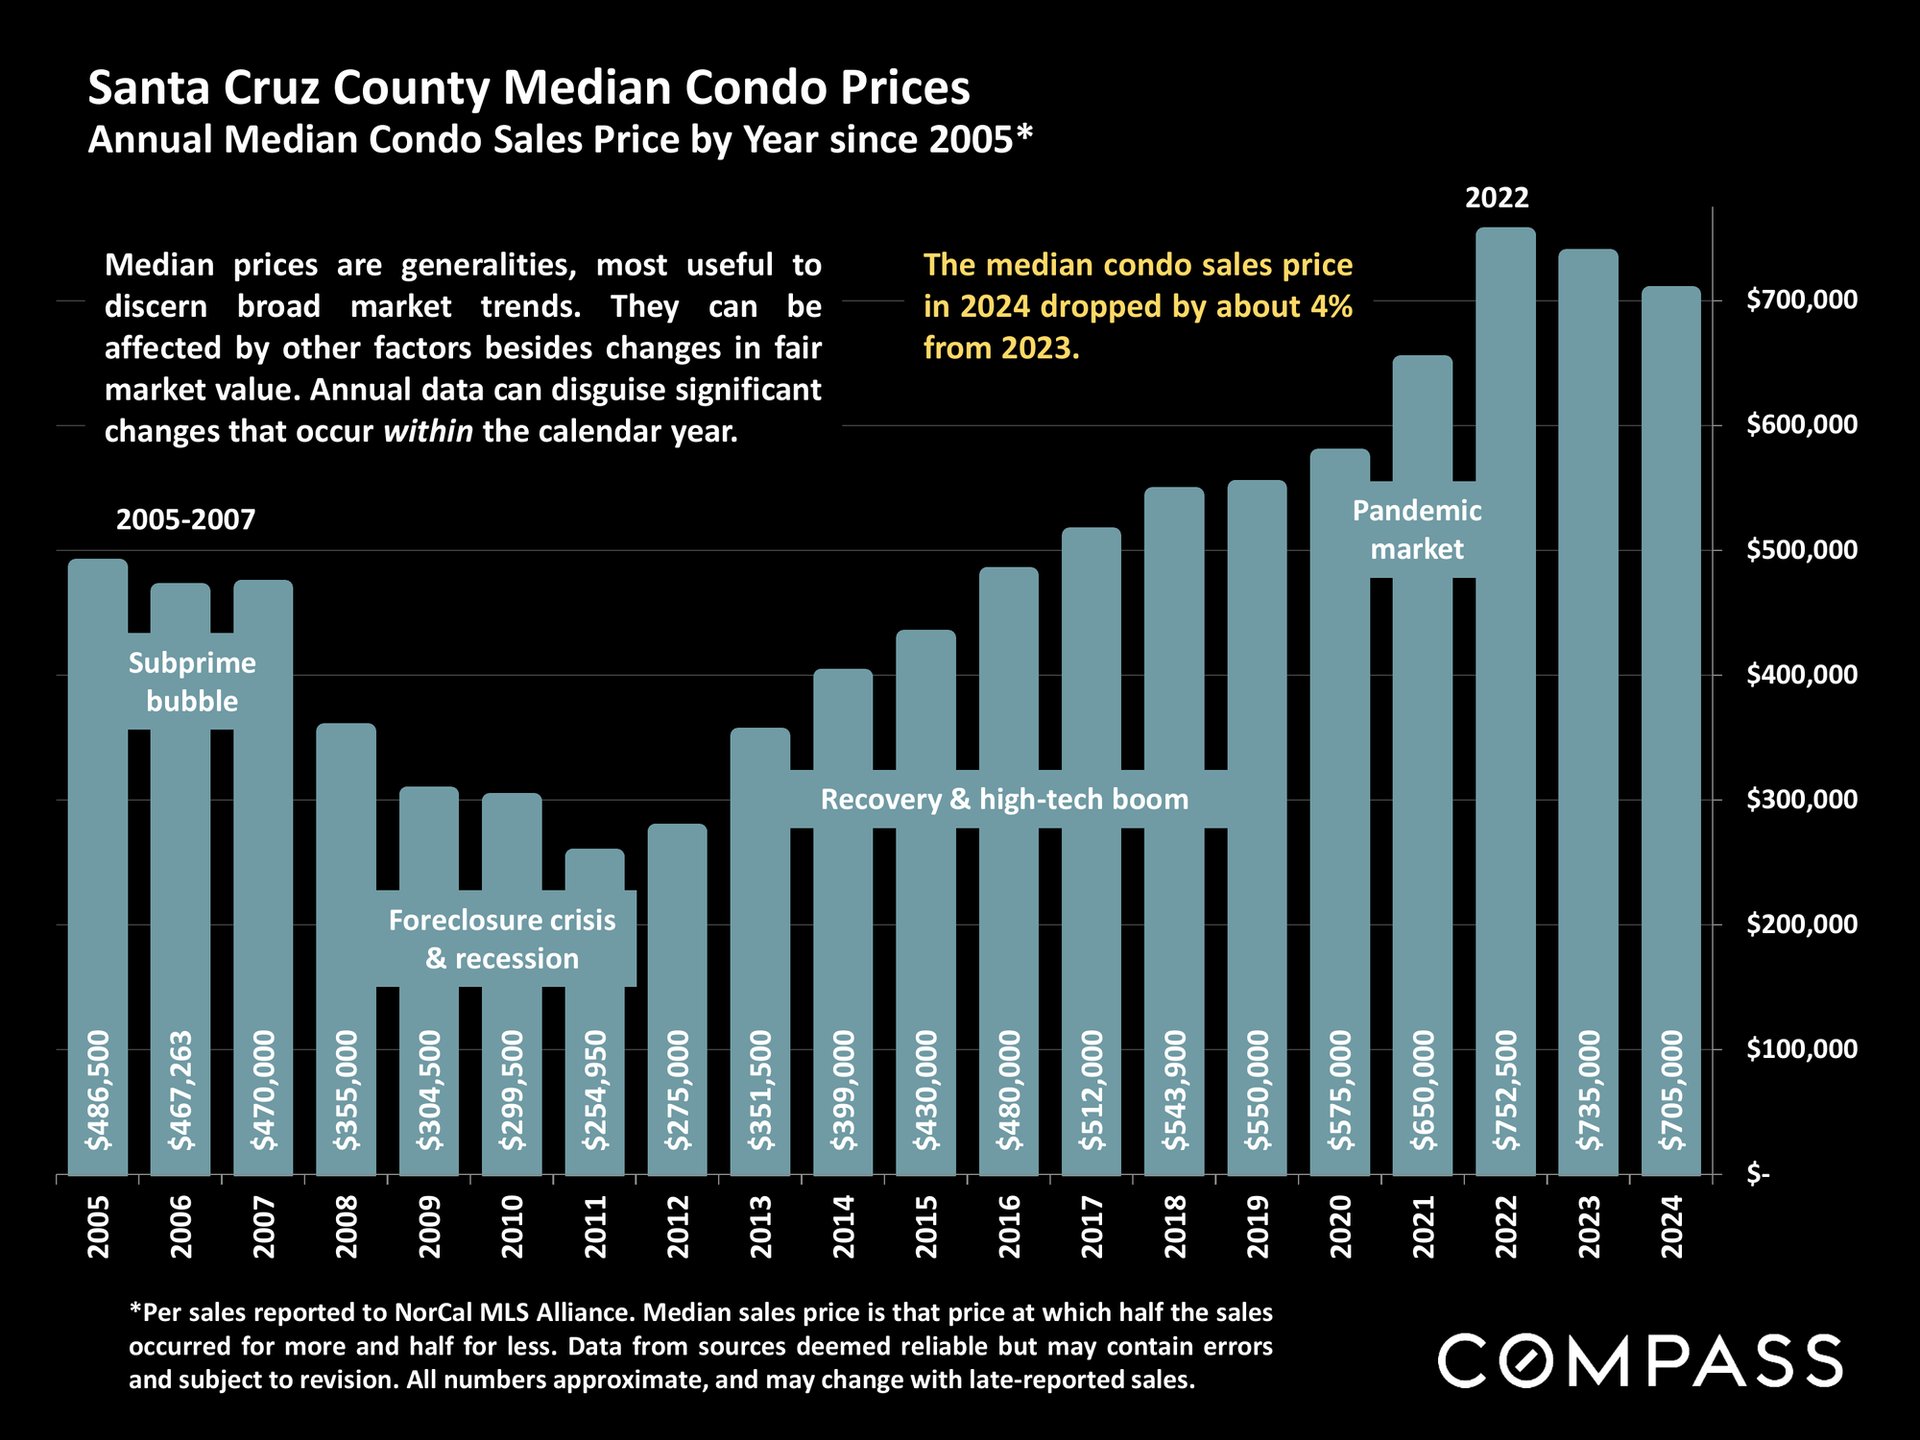
Santa Cruz County condo median prices, 2005–2024, peaked in 2022.
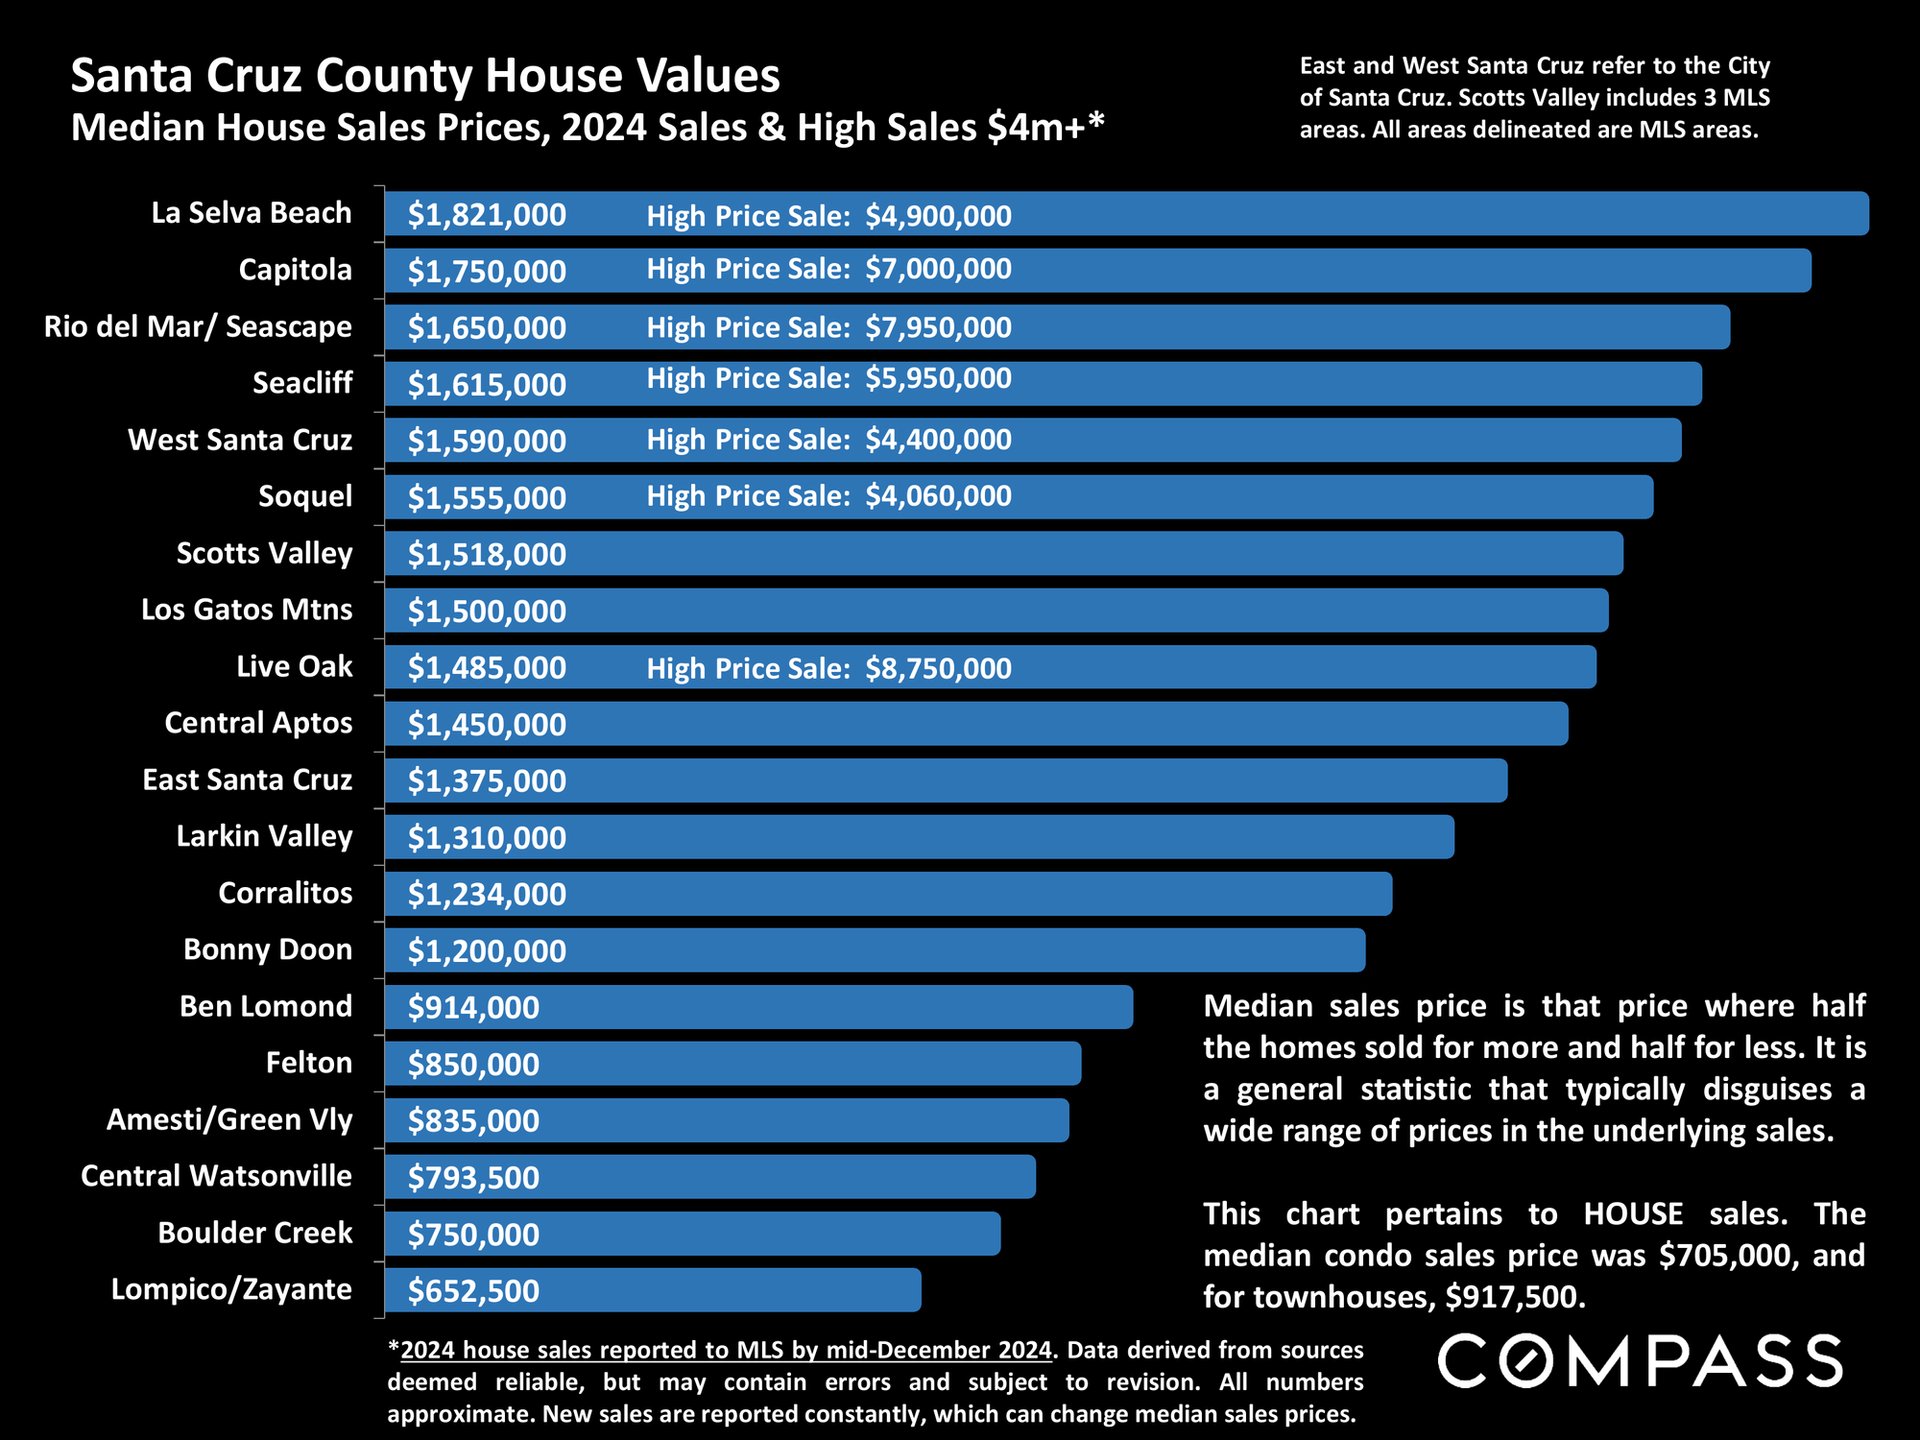
Chart of 2024 median house sale prices across Santa Cruz County, from $1.82 million in La Selva Beach to $652,500 in Lompico/Zayante.
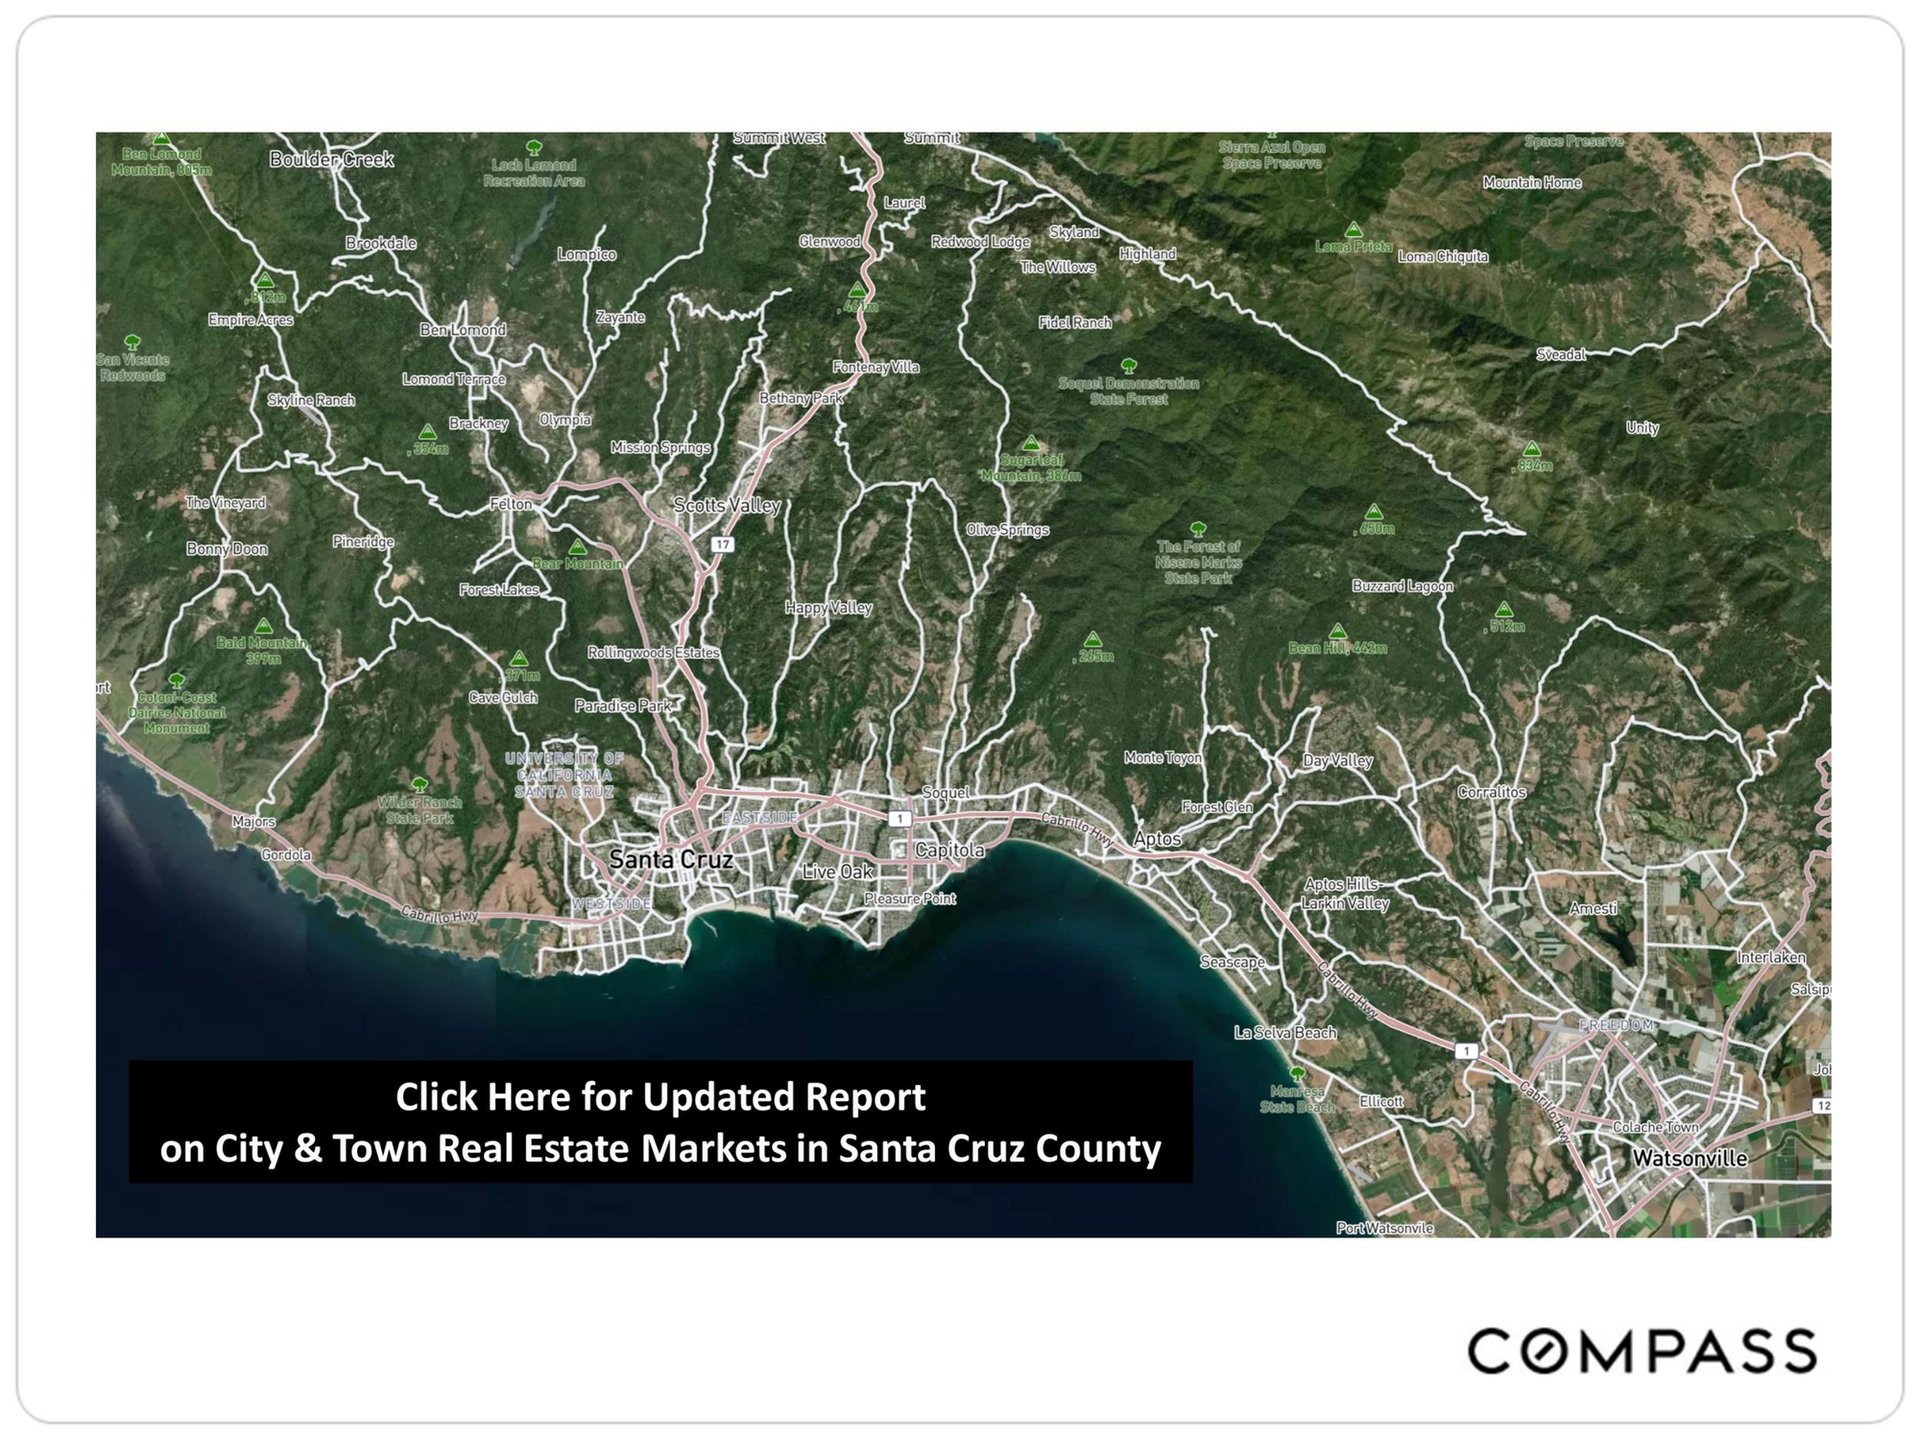
Map of Santa Cruz County from Boulder Creek to Watsonville, with a banner linking to an updated real estate report.
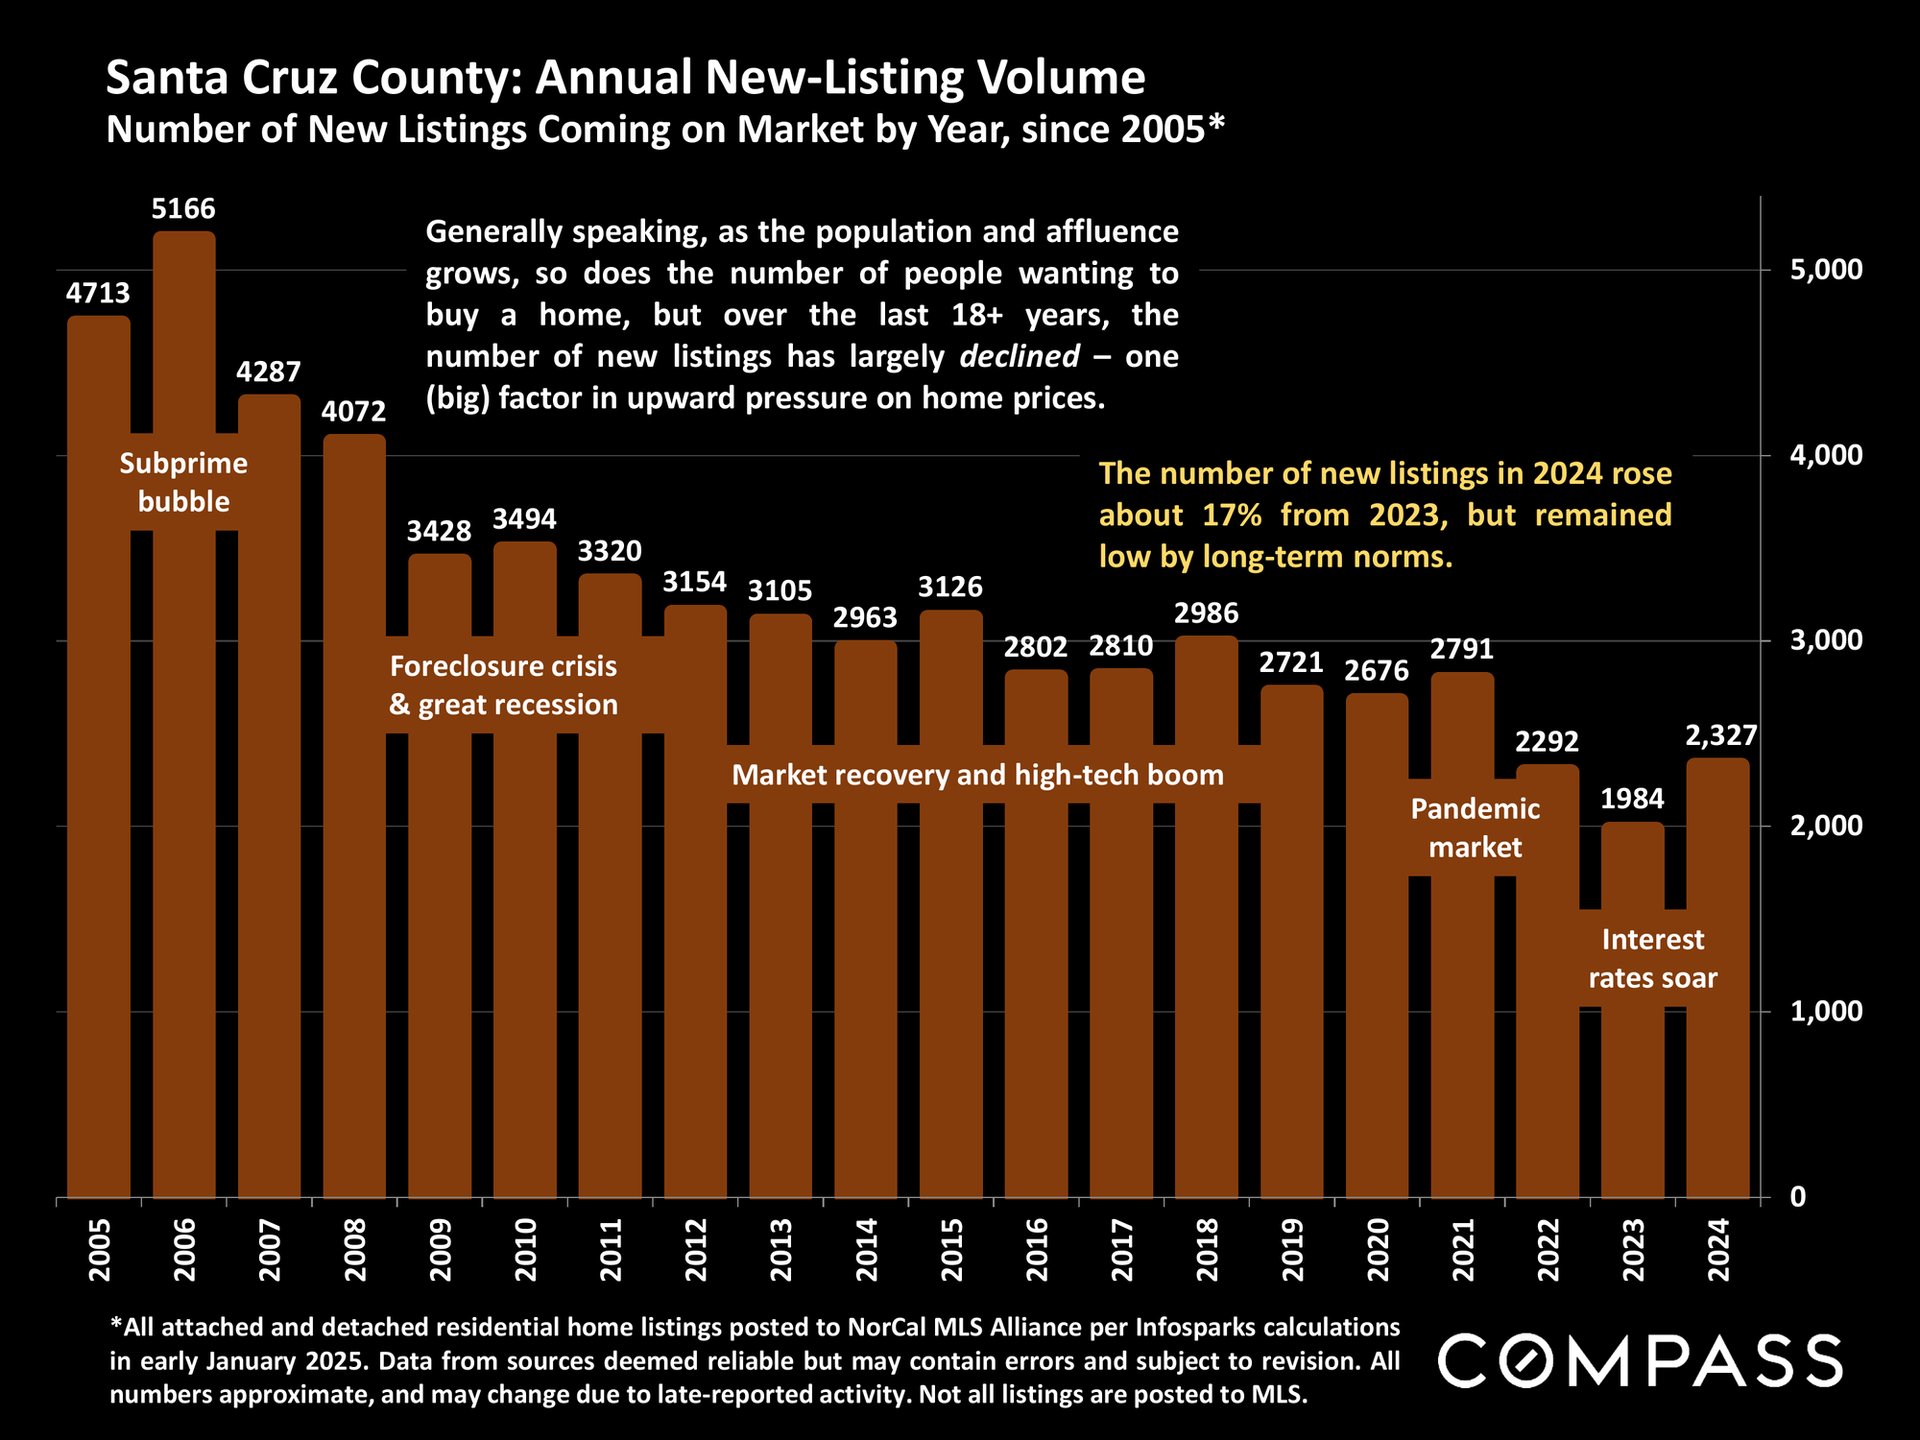
Santa Cruz County new-listing volume chart, 2005–2024, with yearly totals and real estate market annotations.
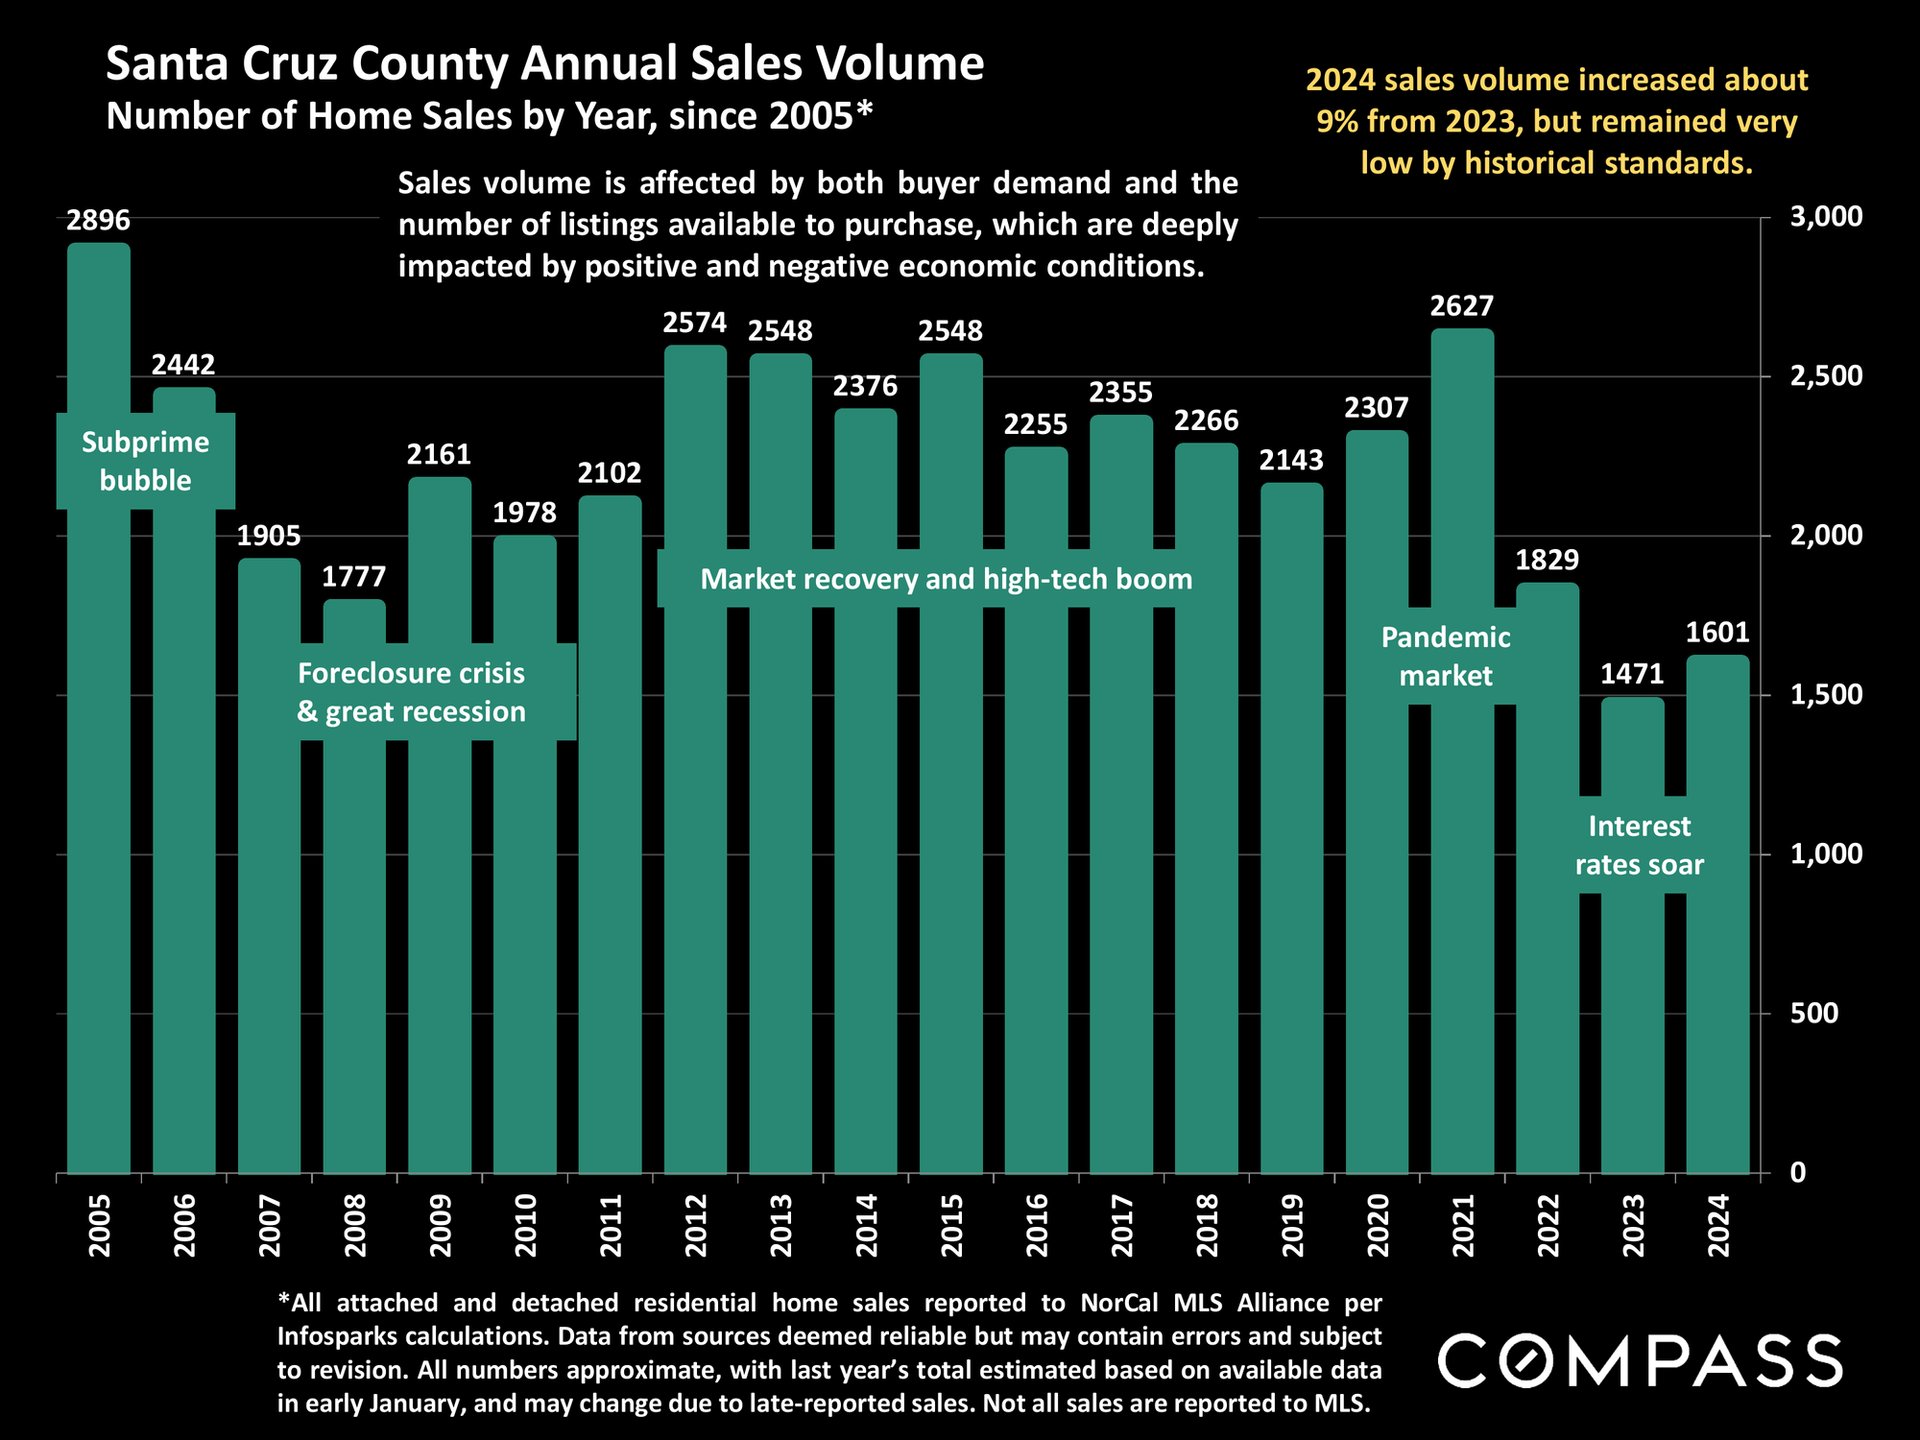
Bar chart of Santa Cruz County home sales from 2005 to 2024, with 1,601 sales in 2024 and historical market annotations.
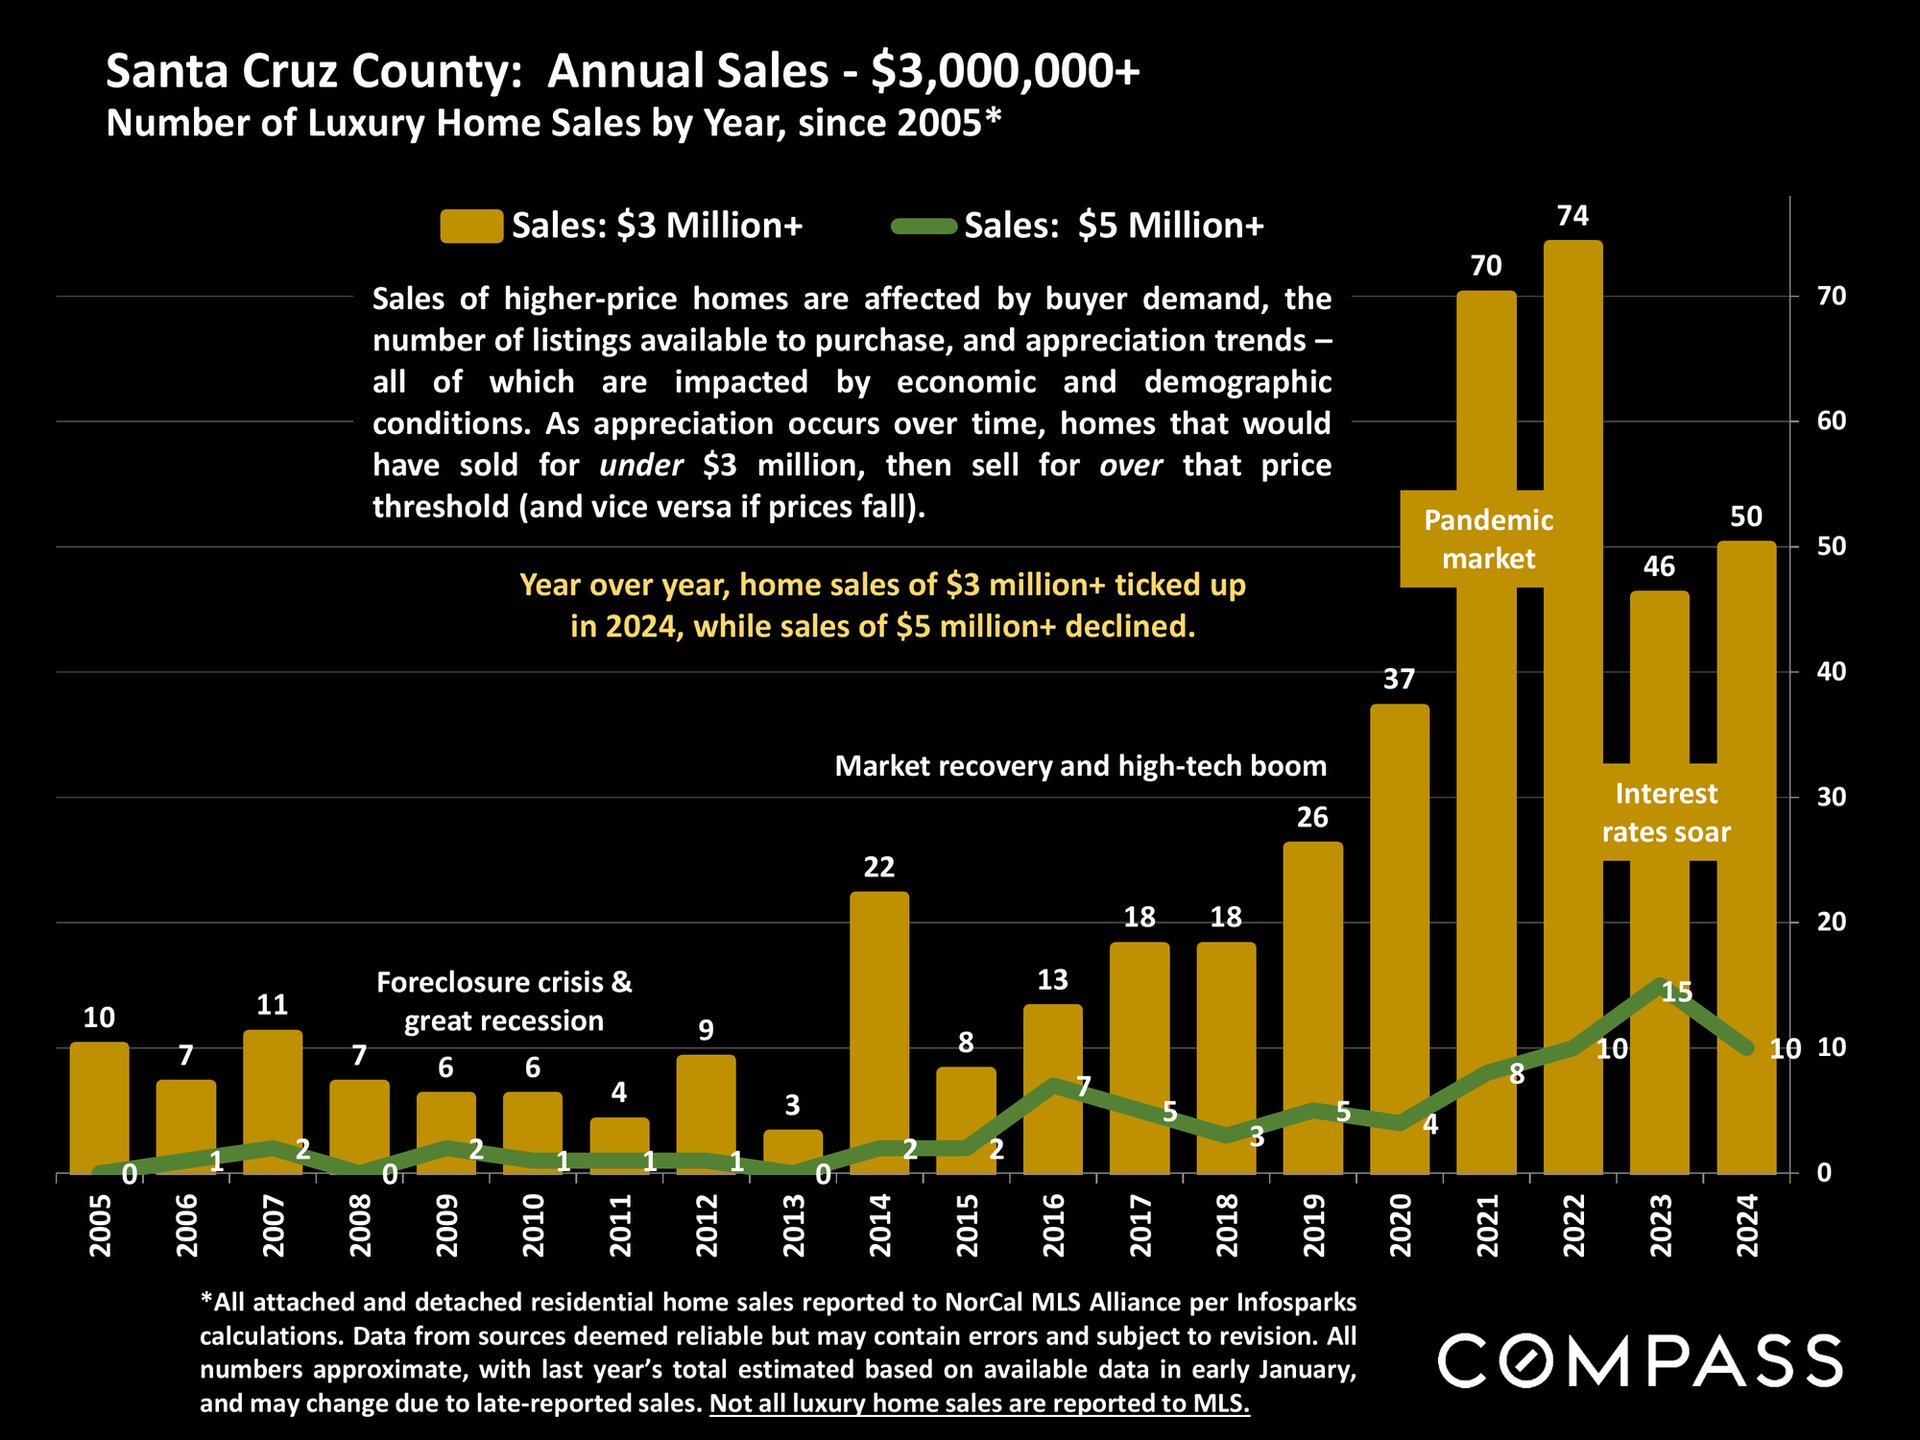
Chart comparing Santa Cruz County home sales over $3 million and $5 million from 2005 to 2024.
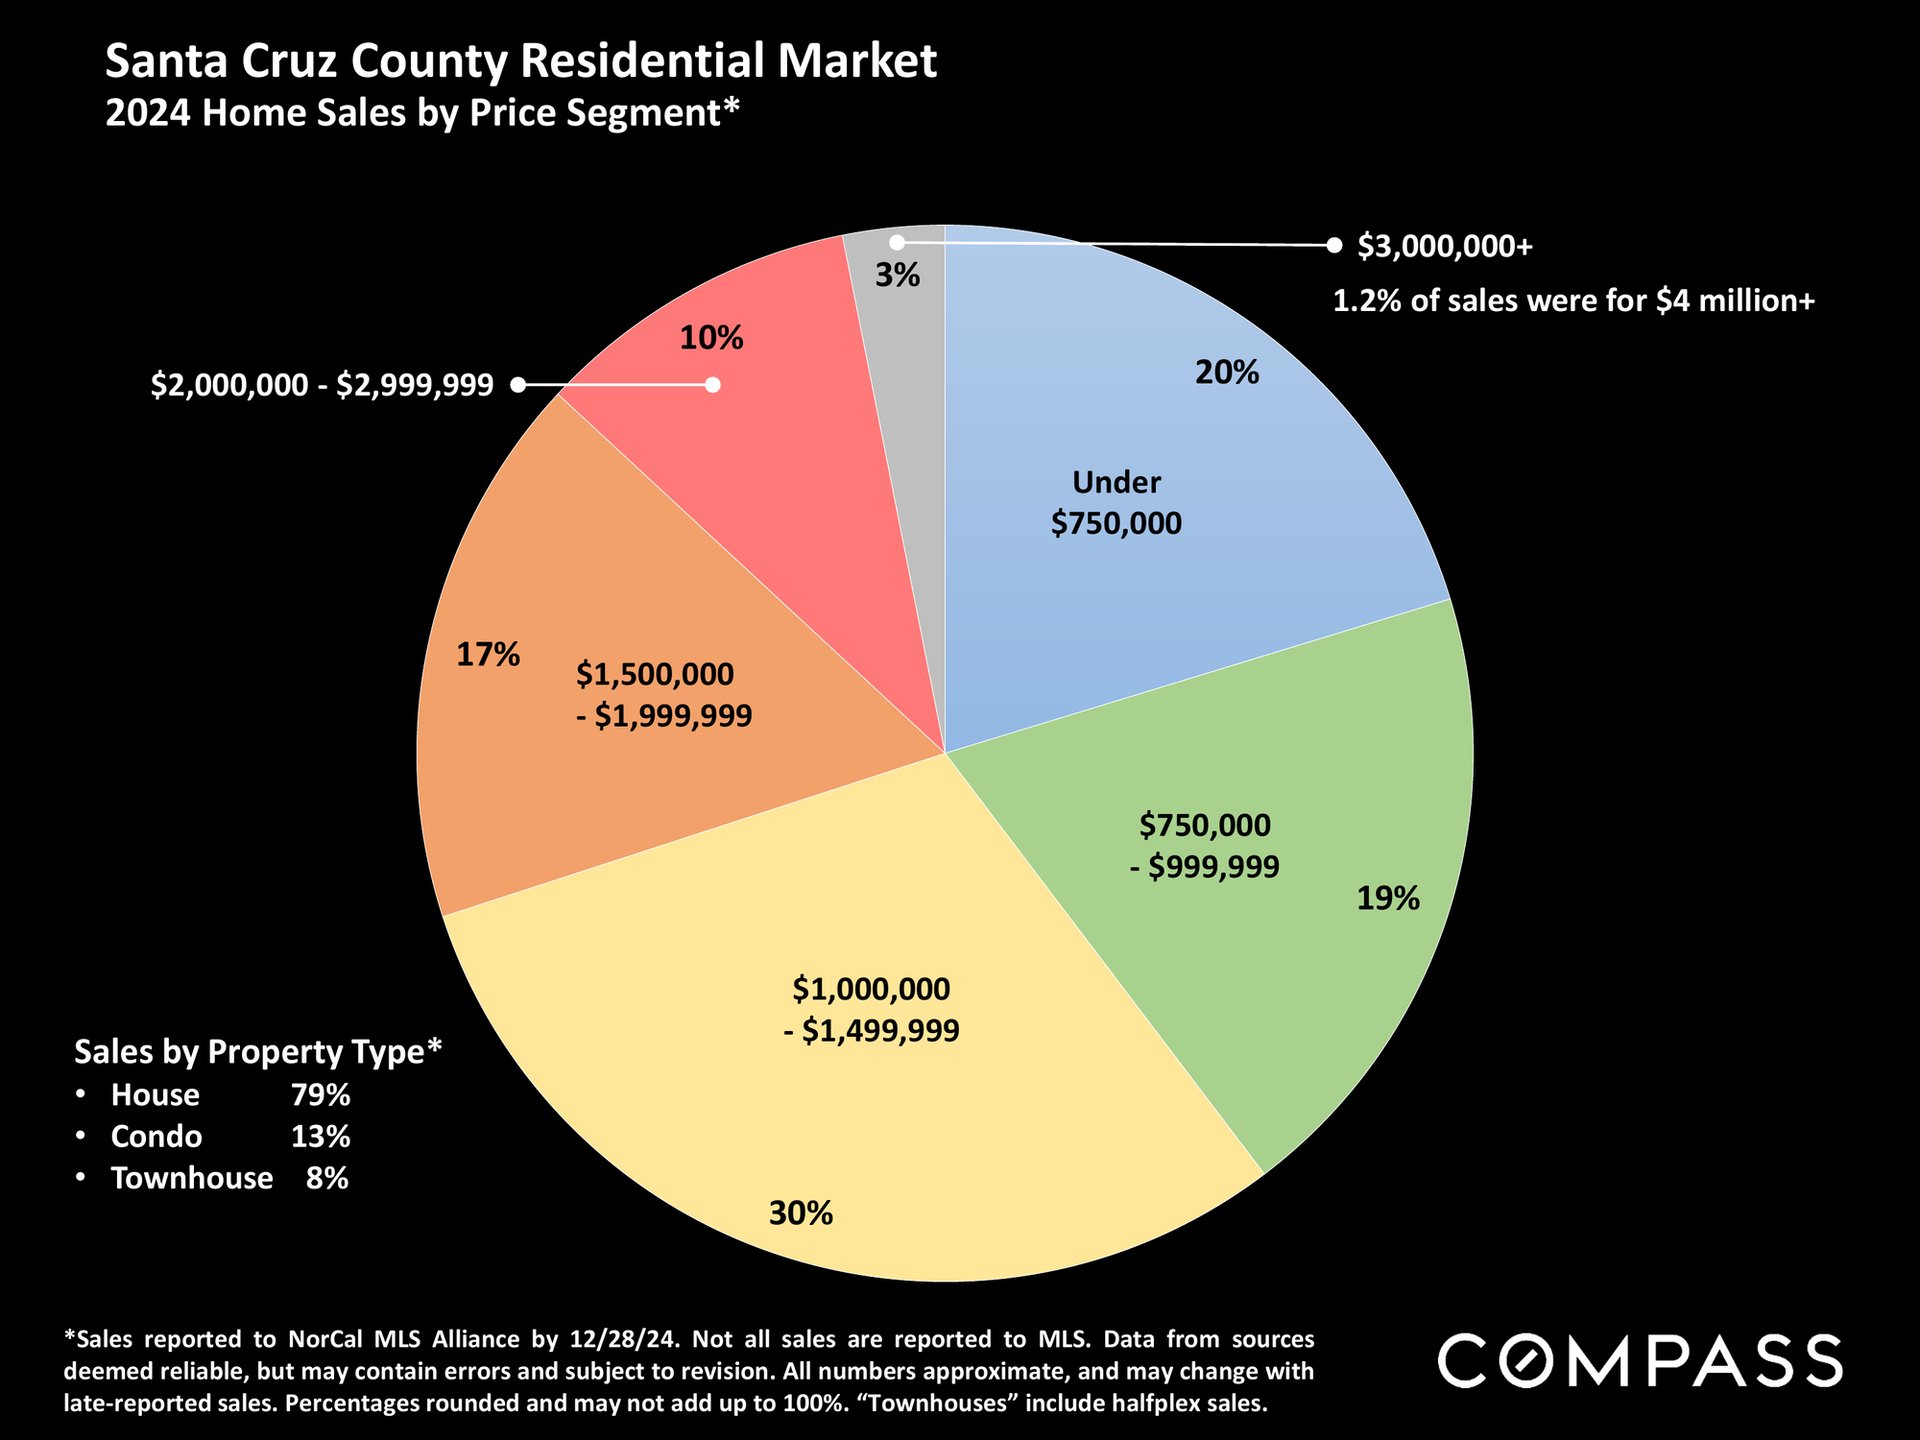
Pie chart of 2024 Santa Cruz County home sales by price segment; the largest share was $1 million–$1.5 million.
Santa Cruz County average days on market bar chart, 2005–2024, with annual values and historical market annotations.
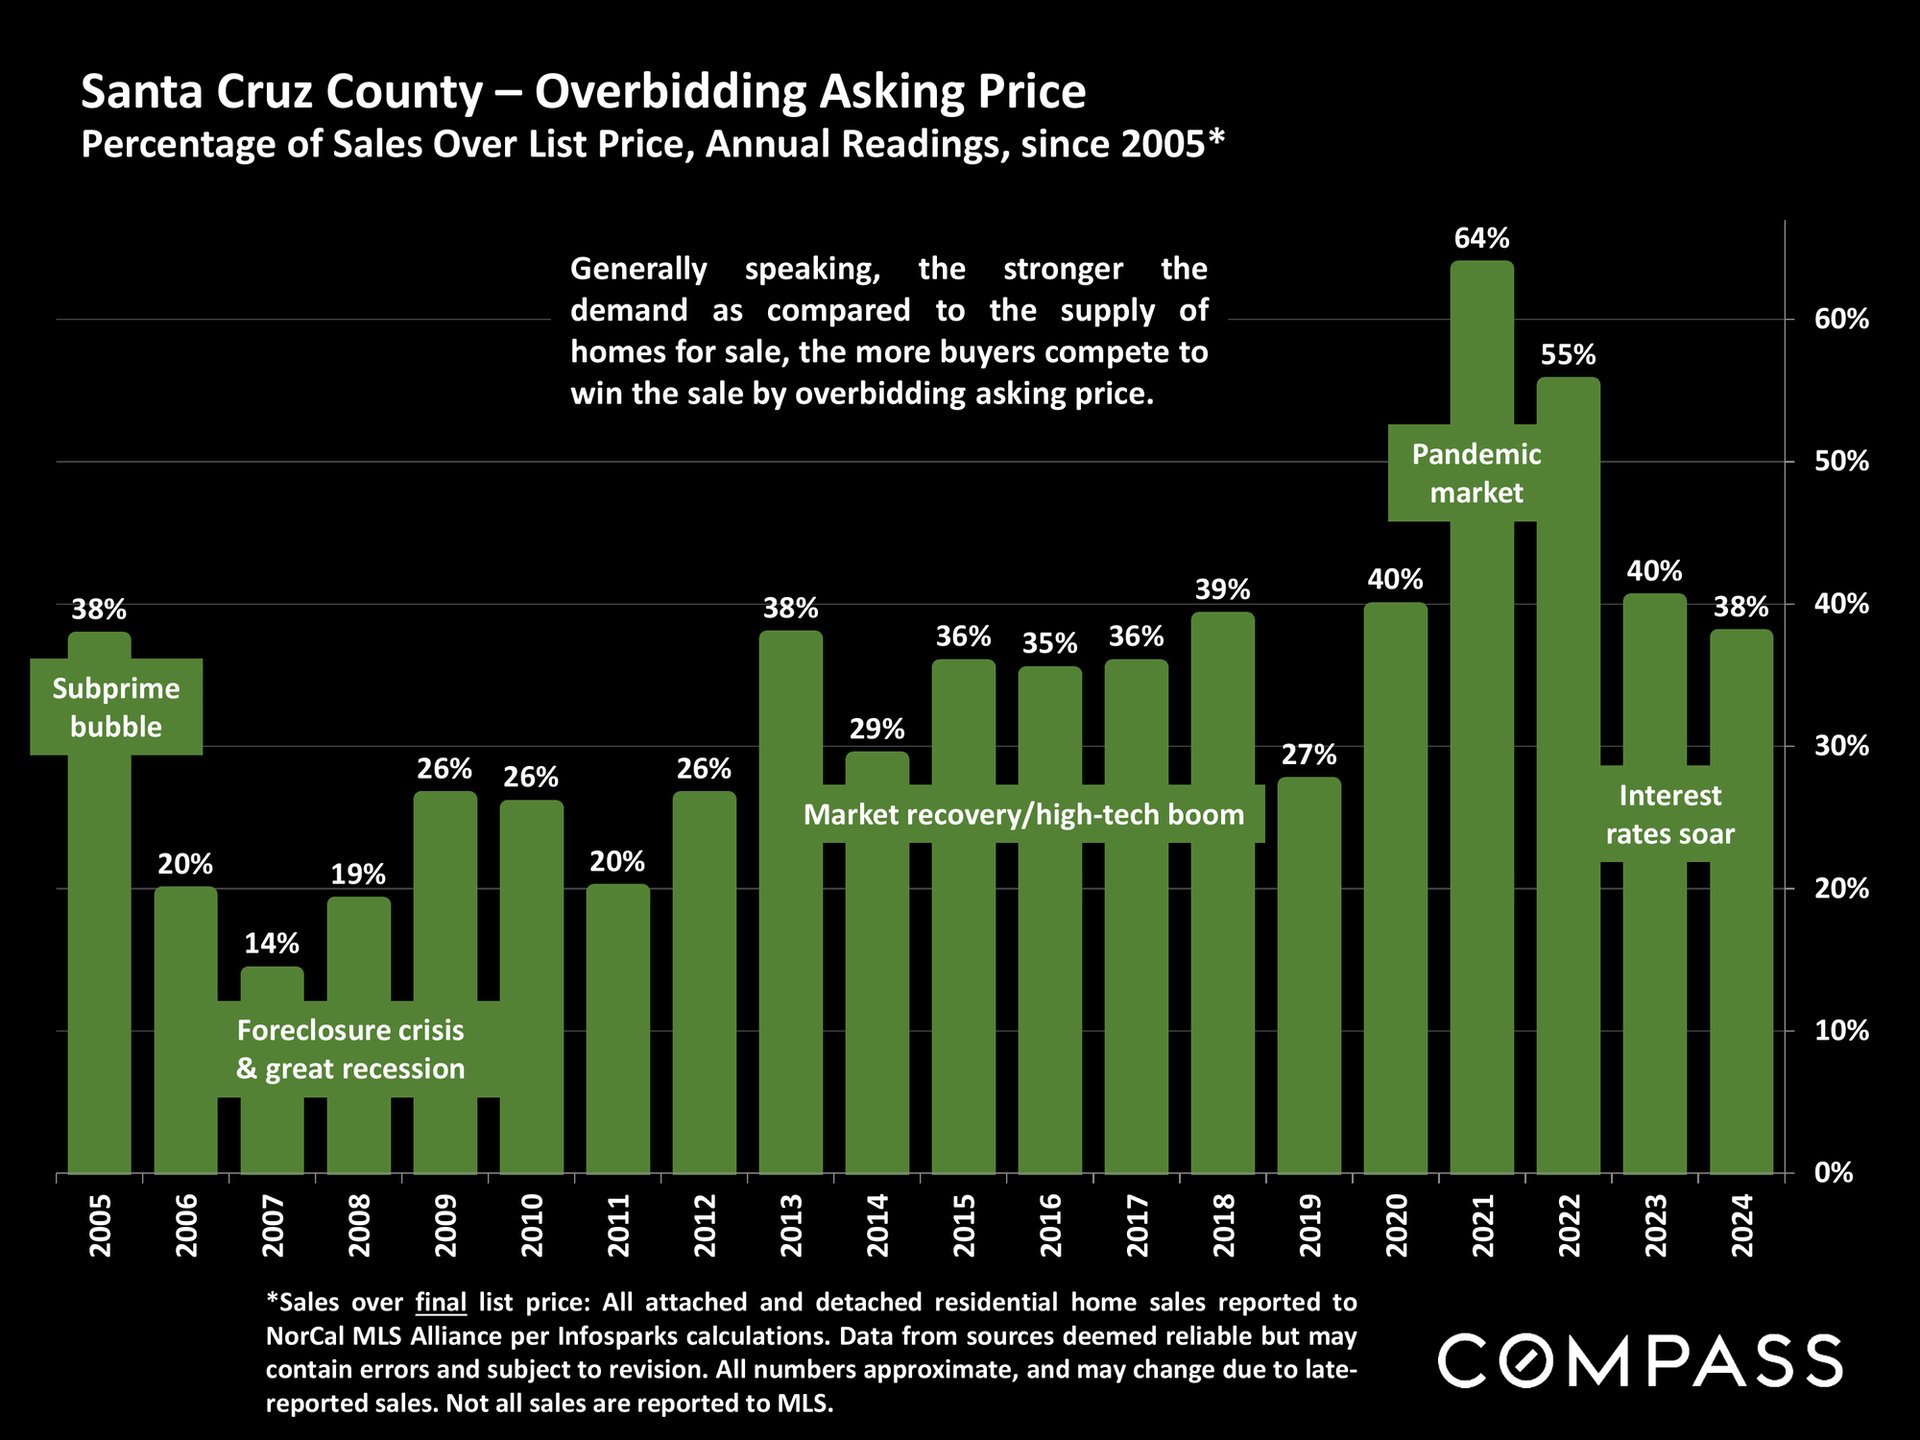
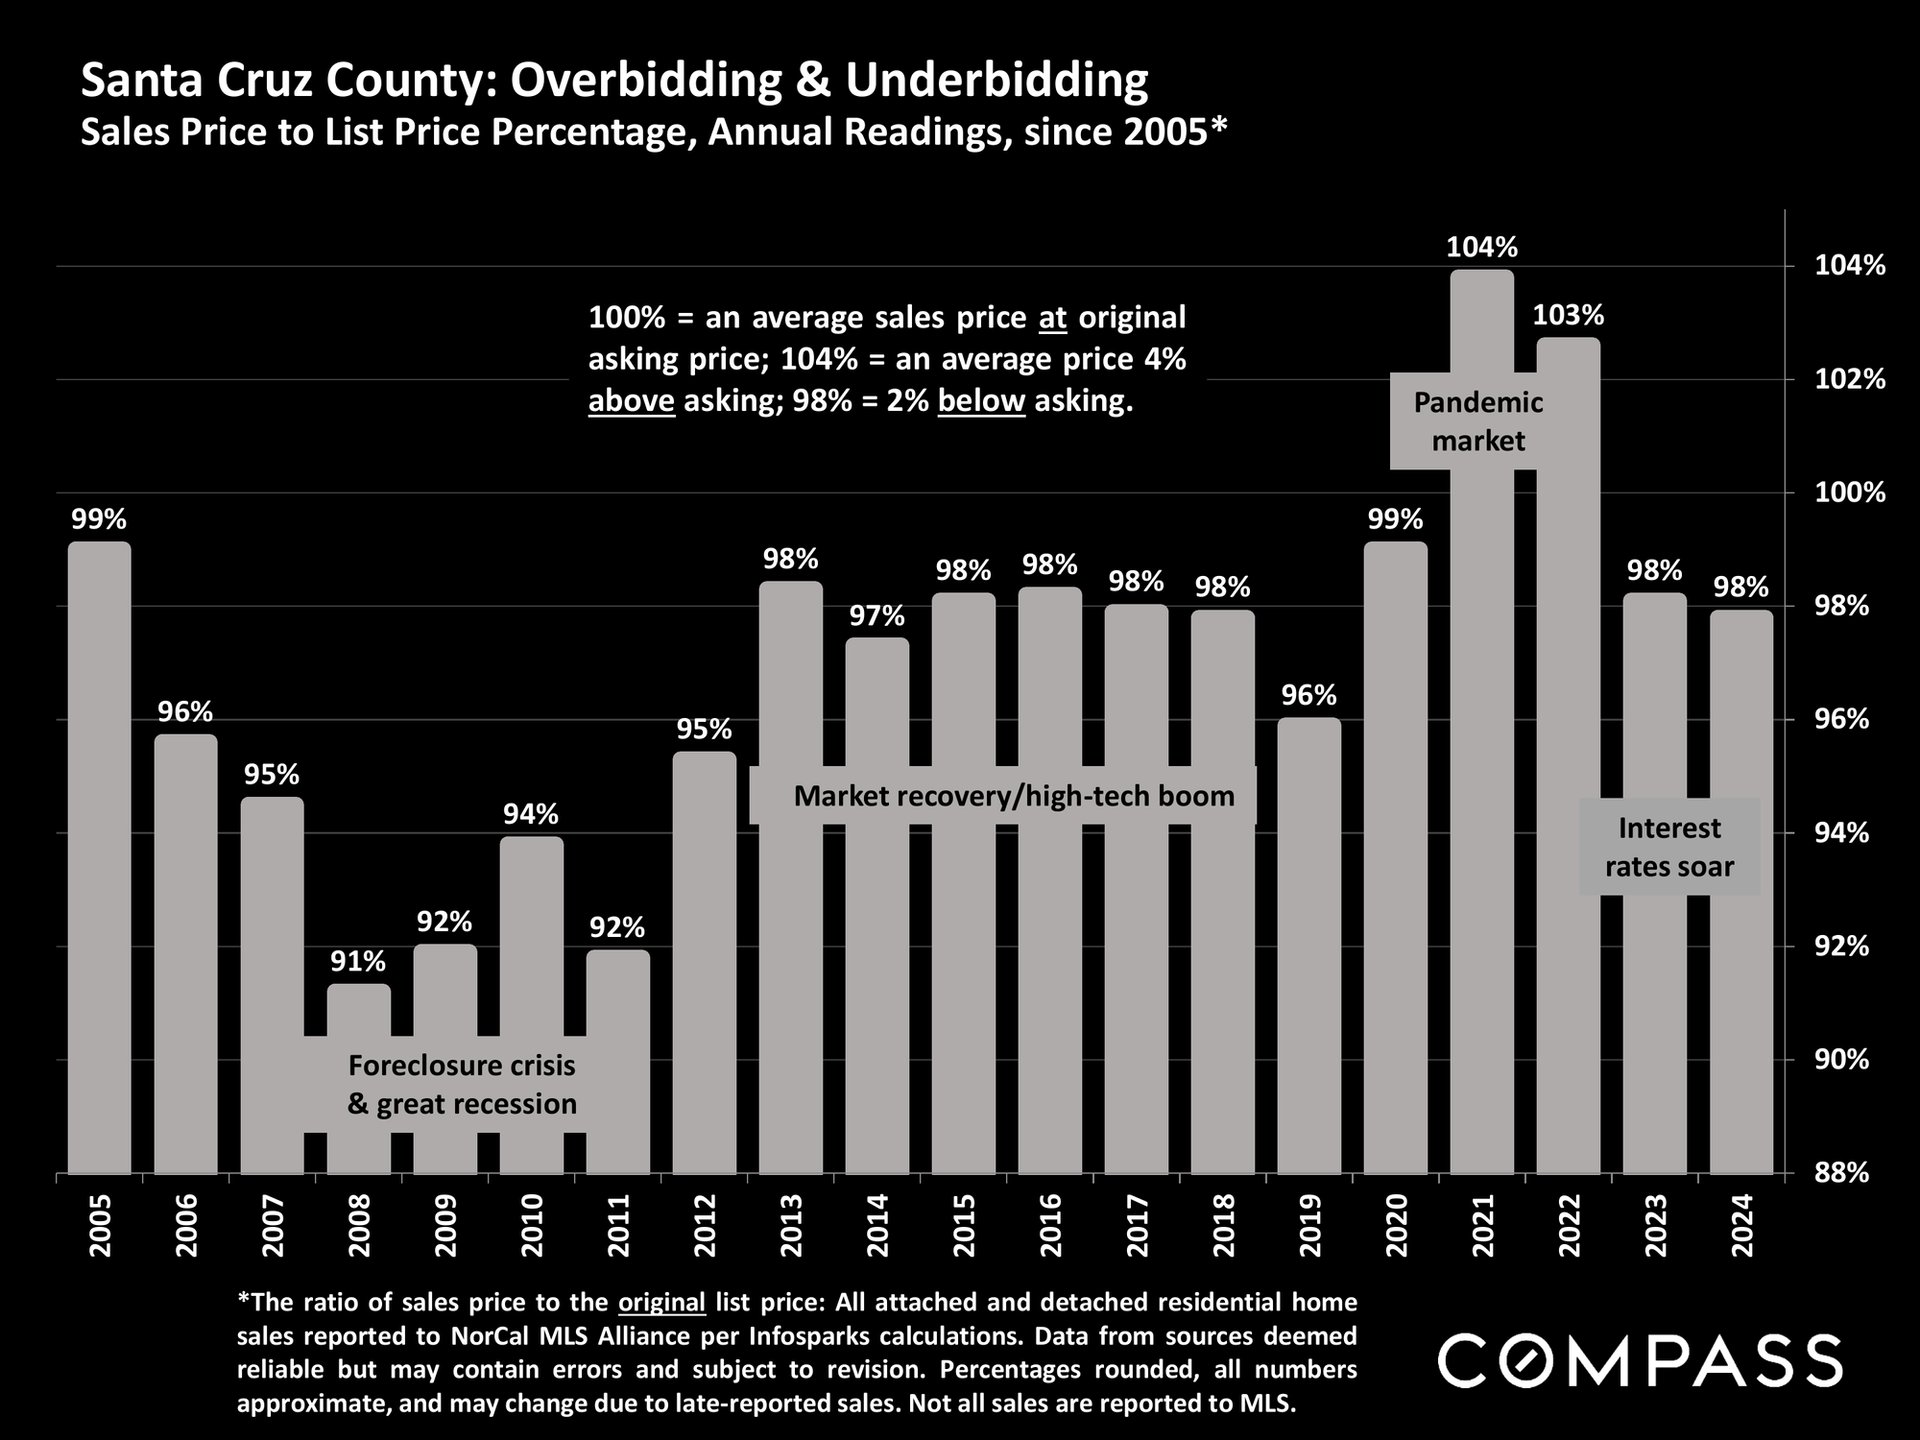
Santa Cruz County home sales over list price, charted annually from 2005 to 2024, peaking at 64% in 2021.Bar chart of Santa Cruz County sale-to-list price percentages from 2005–2024, peaking at 104% in 2021.
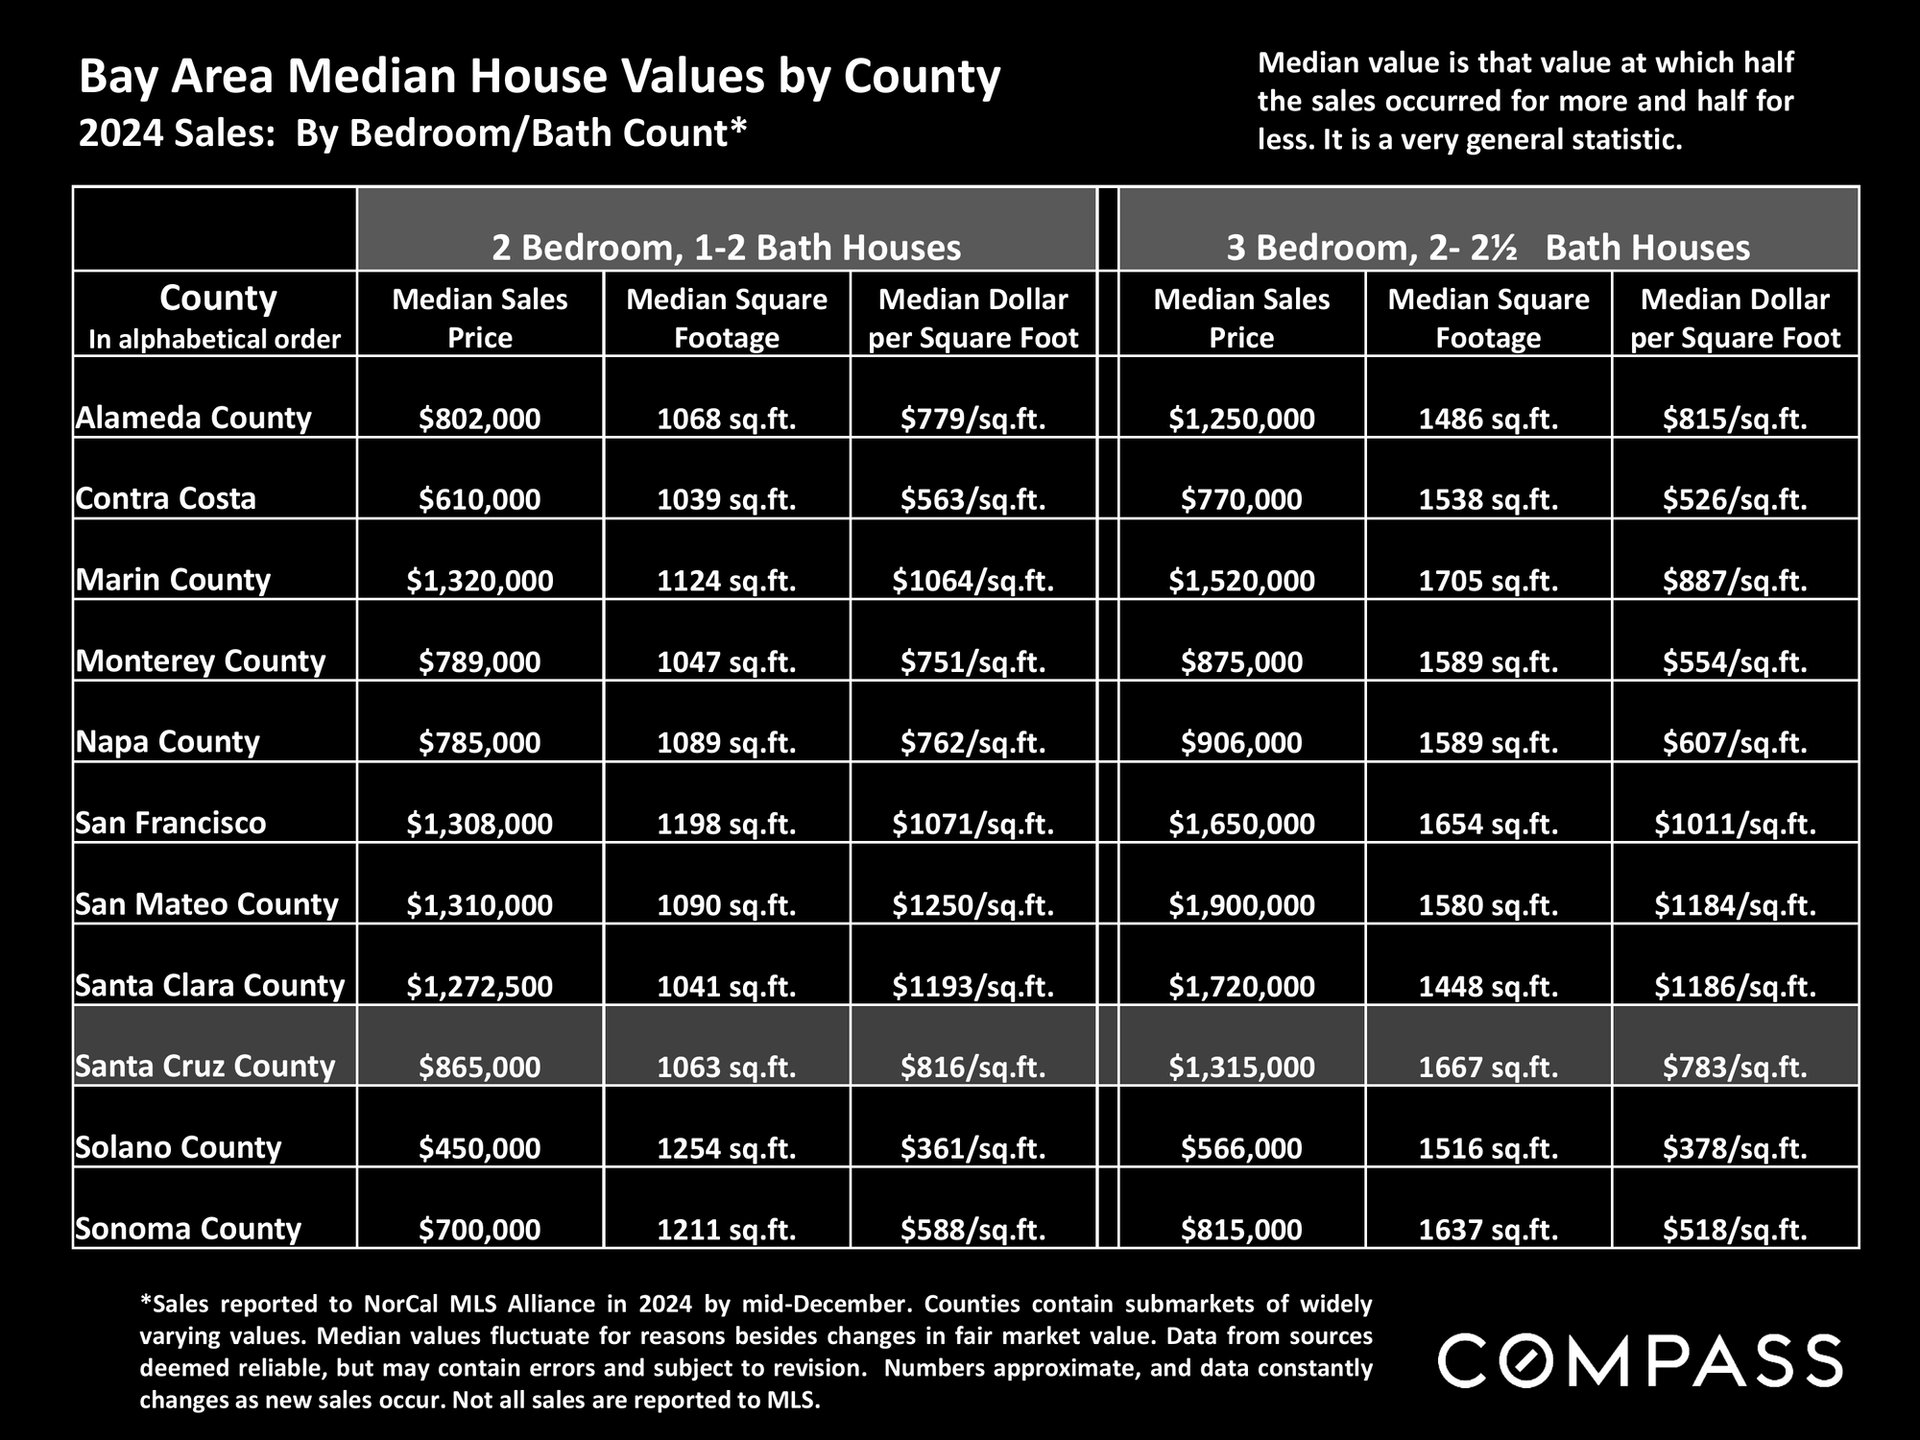
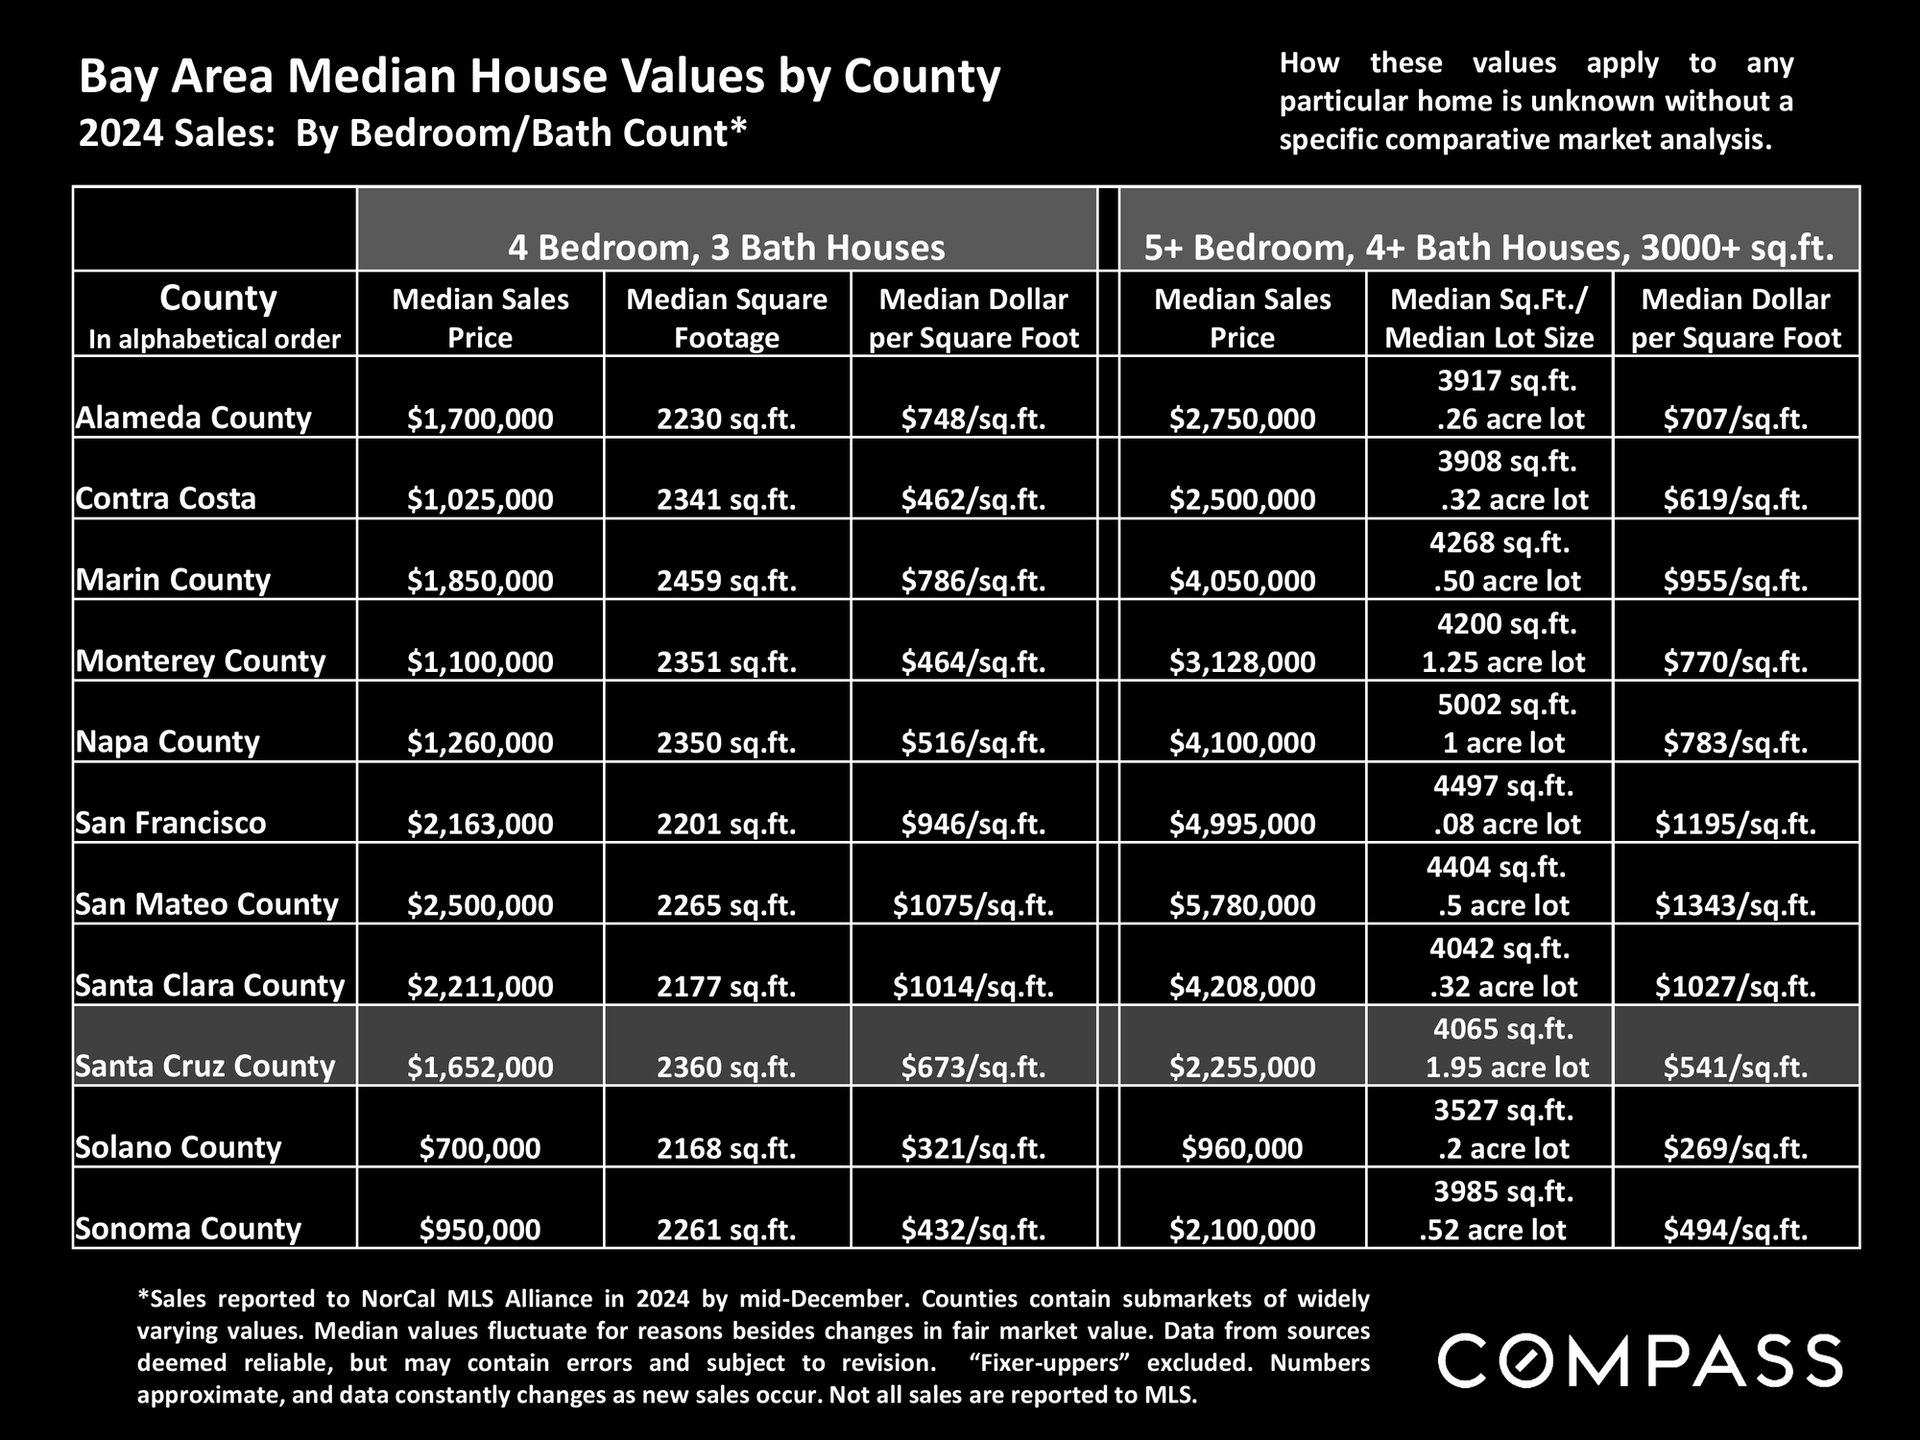
Table comparing 2024 median house values across 11 Bay Area counties, with the Santa Cruz County row highlighted.
2024 Bay Area home-value table; Santa Cruz County figures are highlighted.
Table comparing 2024 median home values across Bay Area counties, with Santa Cruz County highlighted.
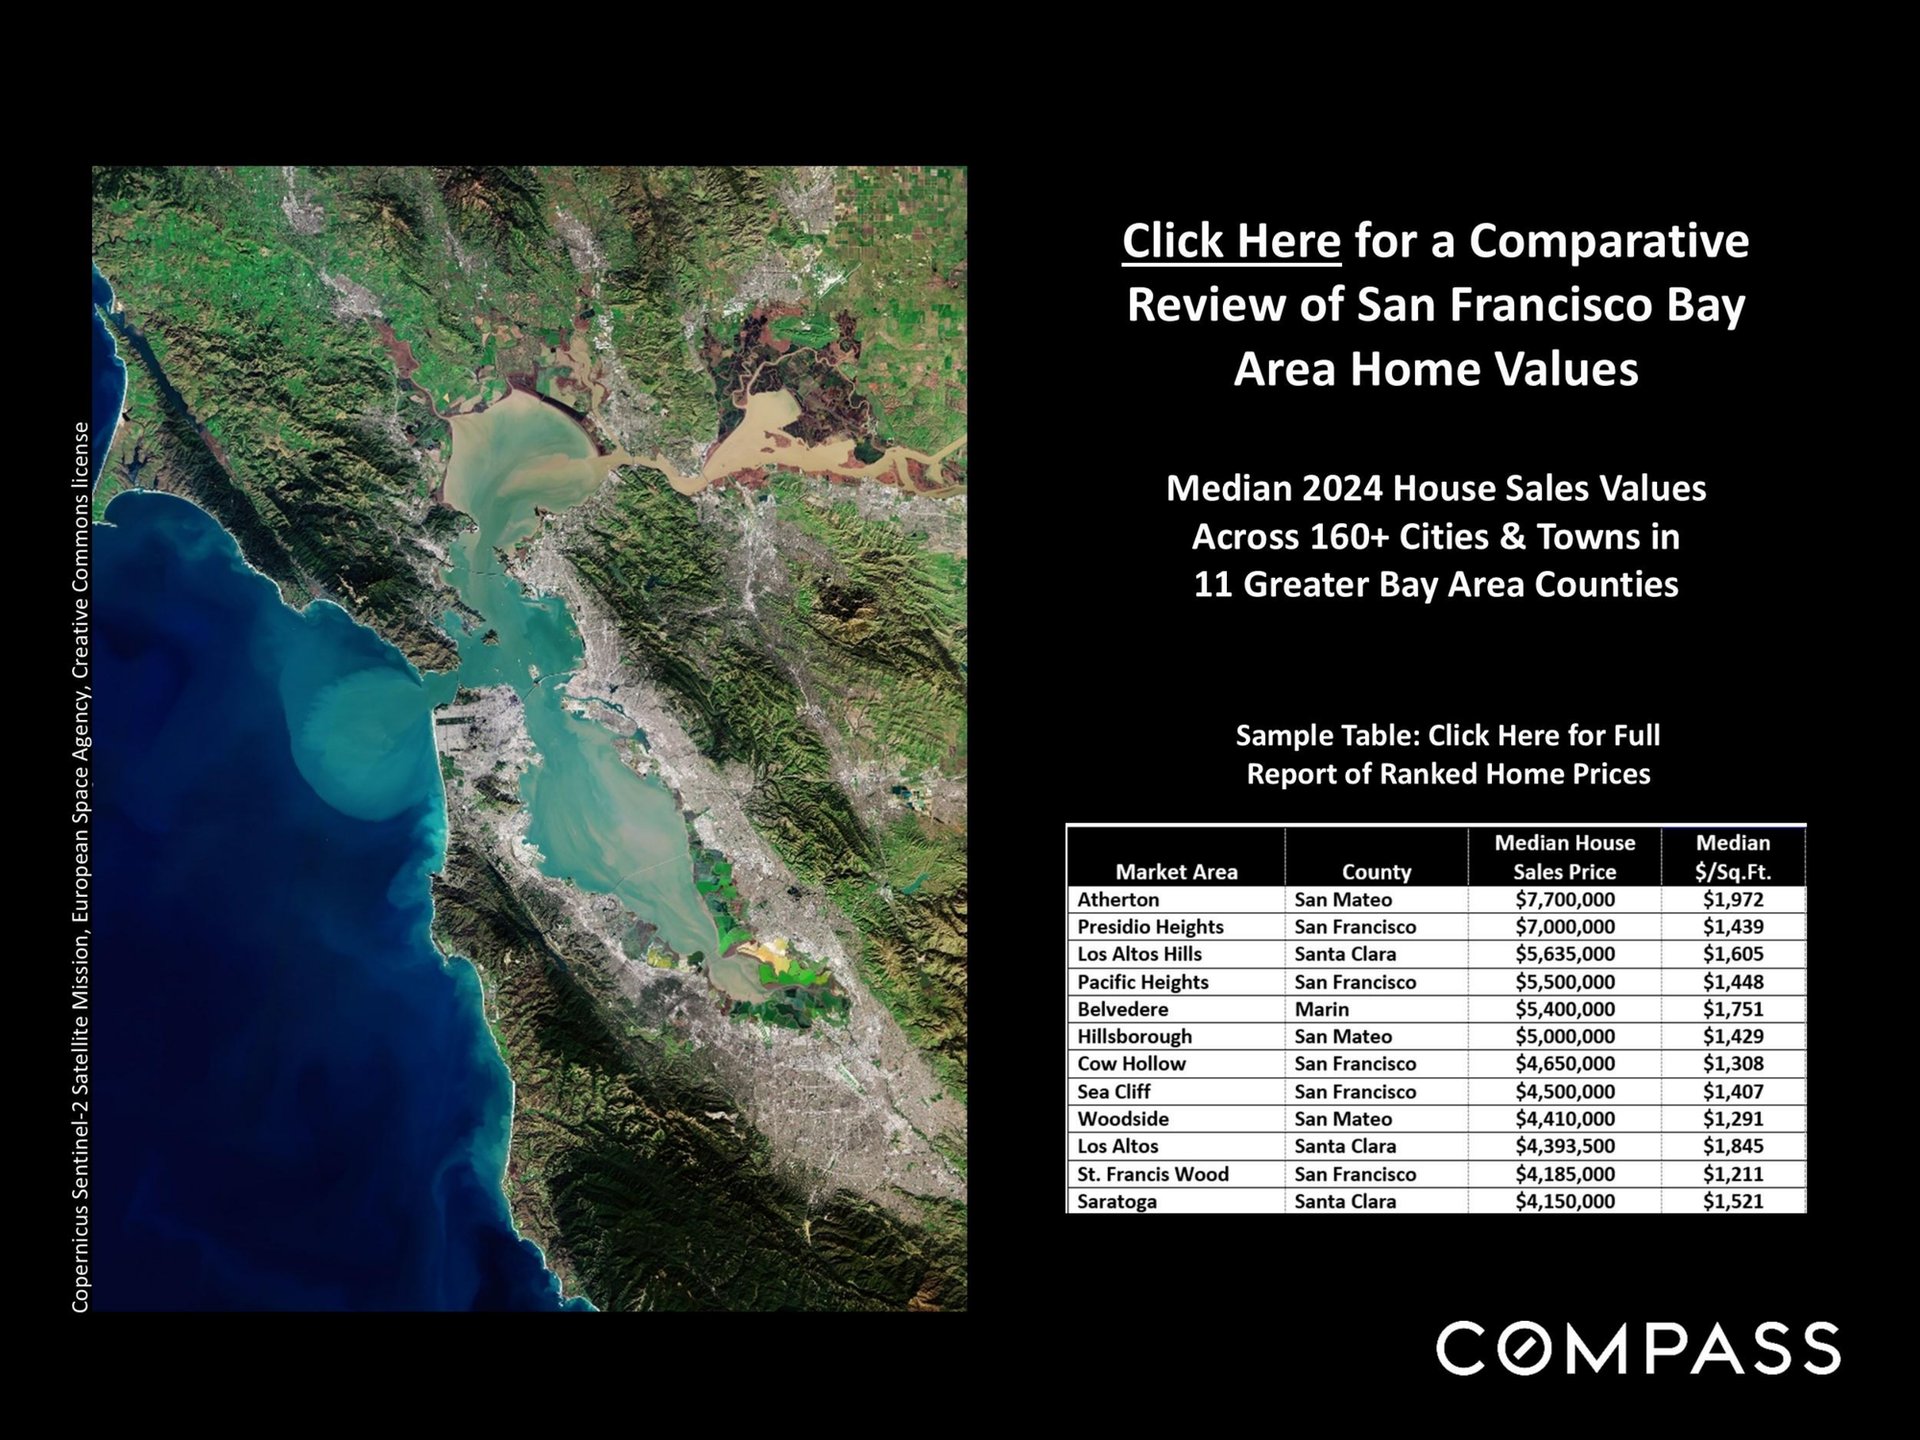
San Francisco Bay Area home-value graphic with a satellite map and sample 2024 sales-price table.
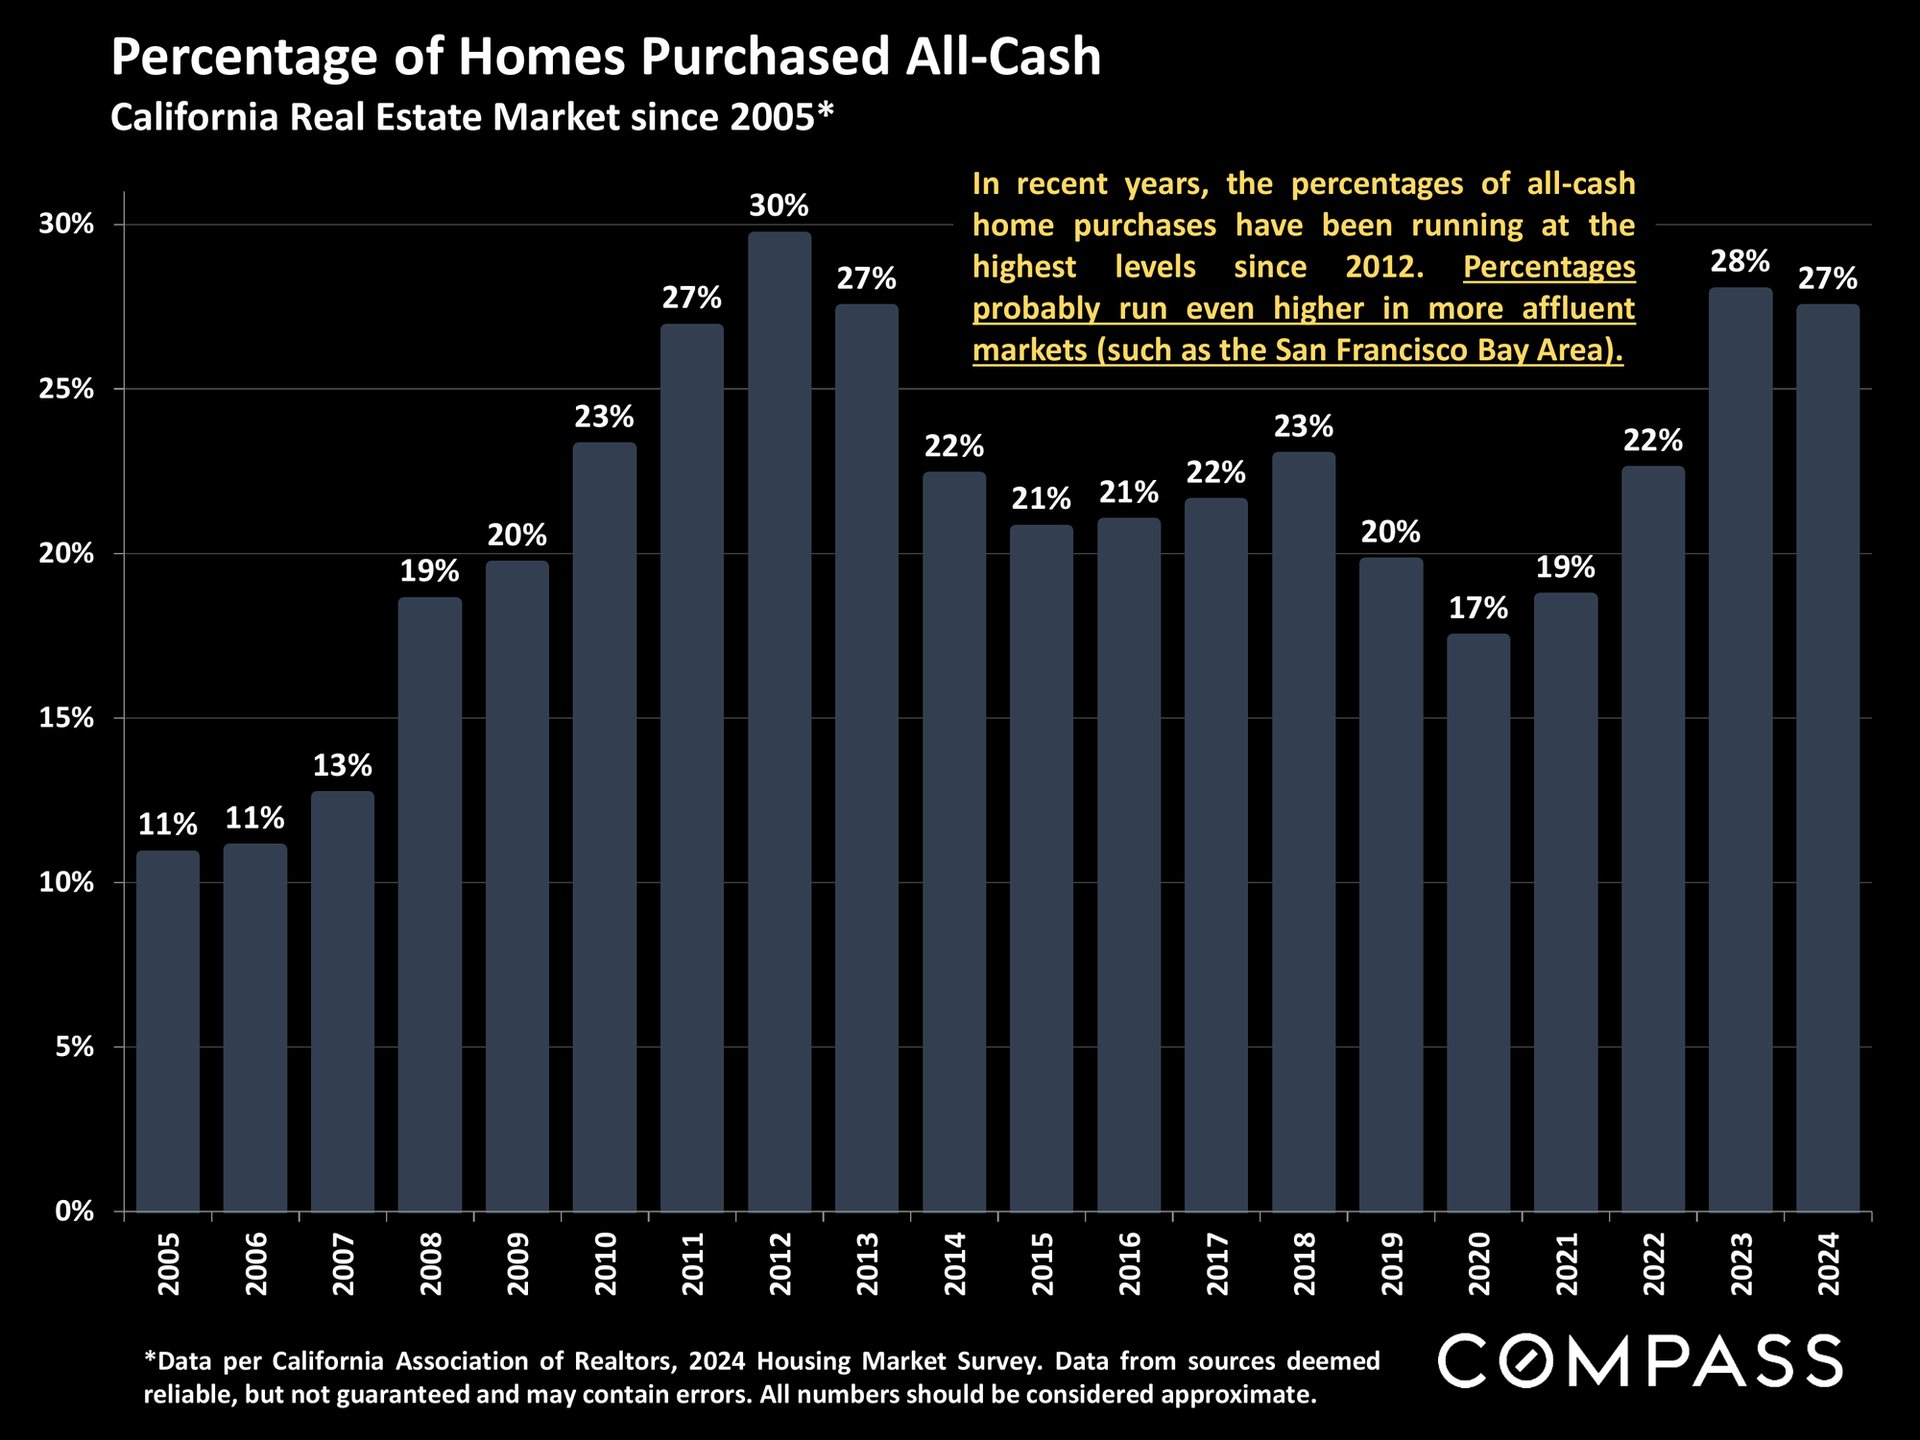
Chart of California all-cash home purchases, showing 27% in 2024 and a 30% peak in 2012.
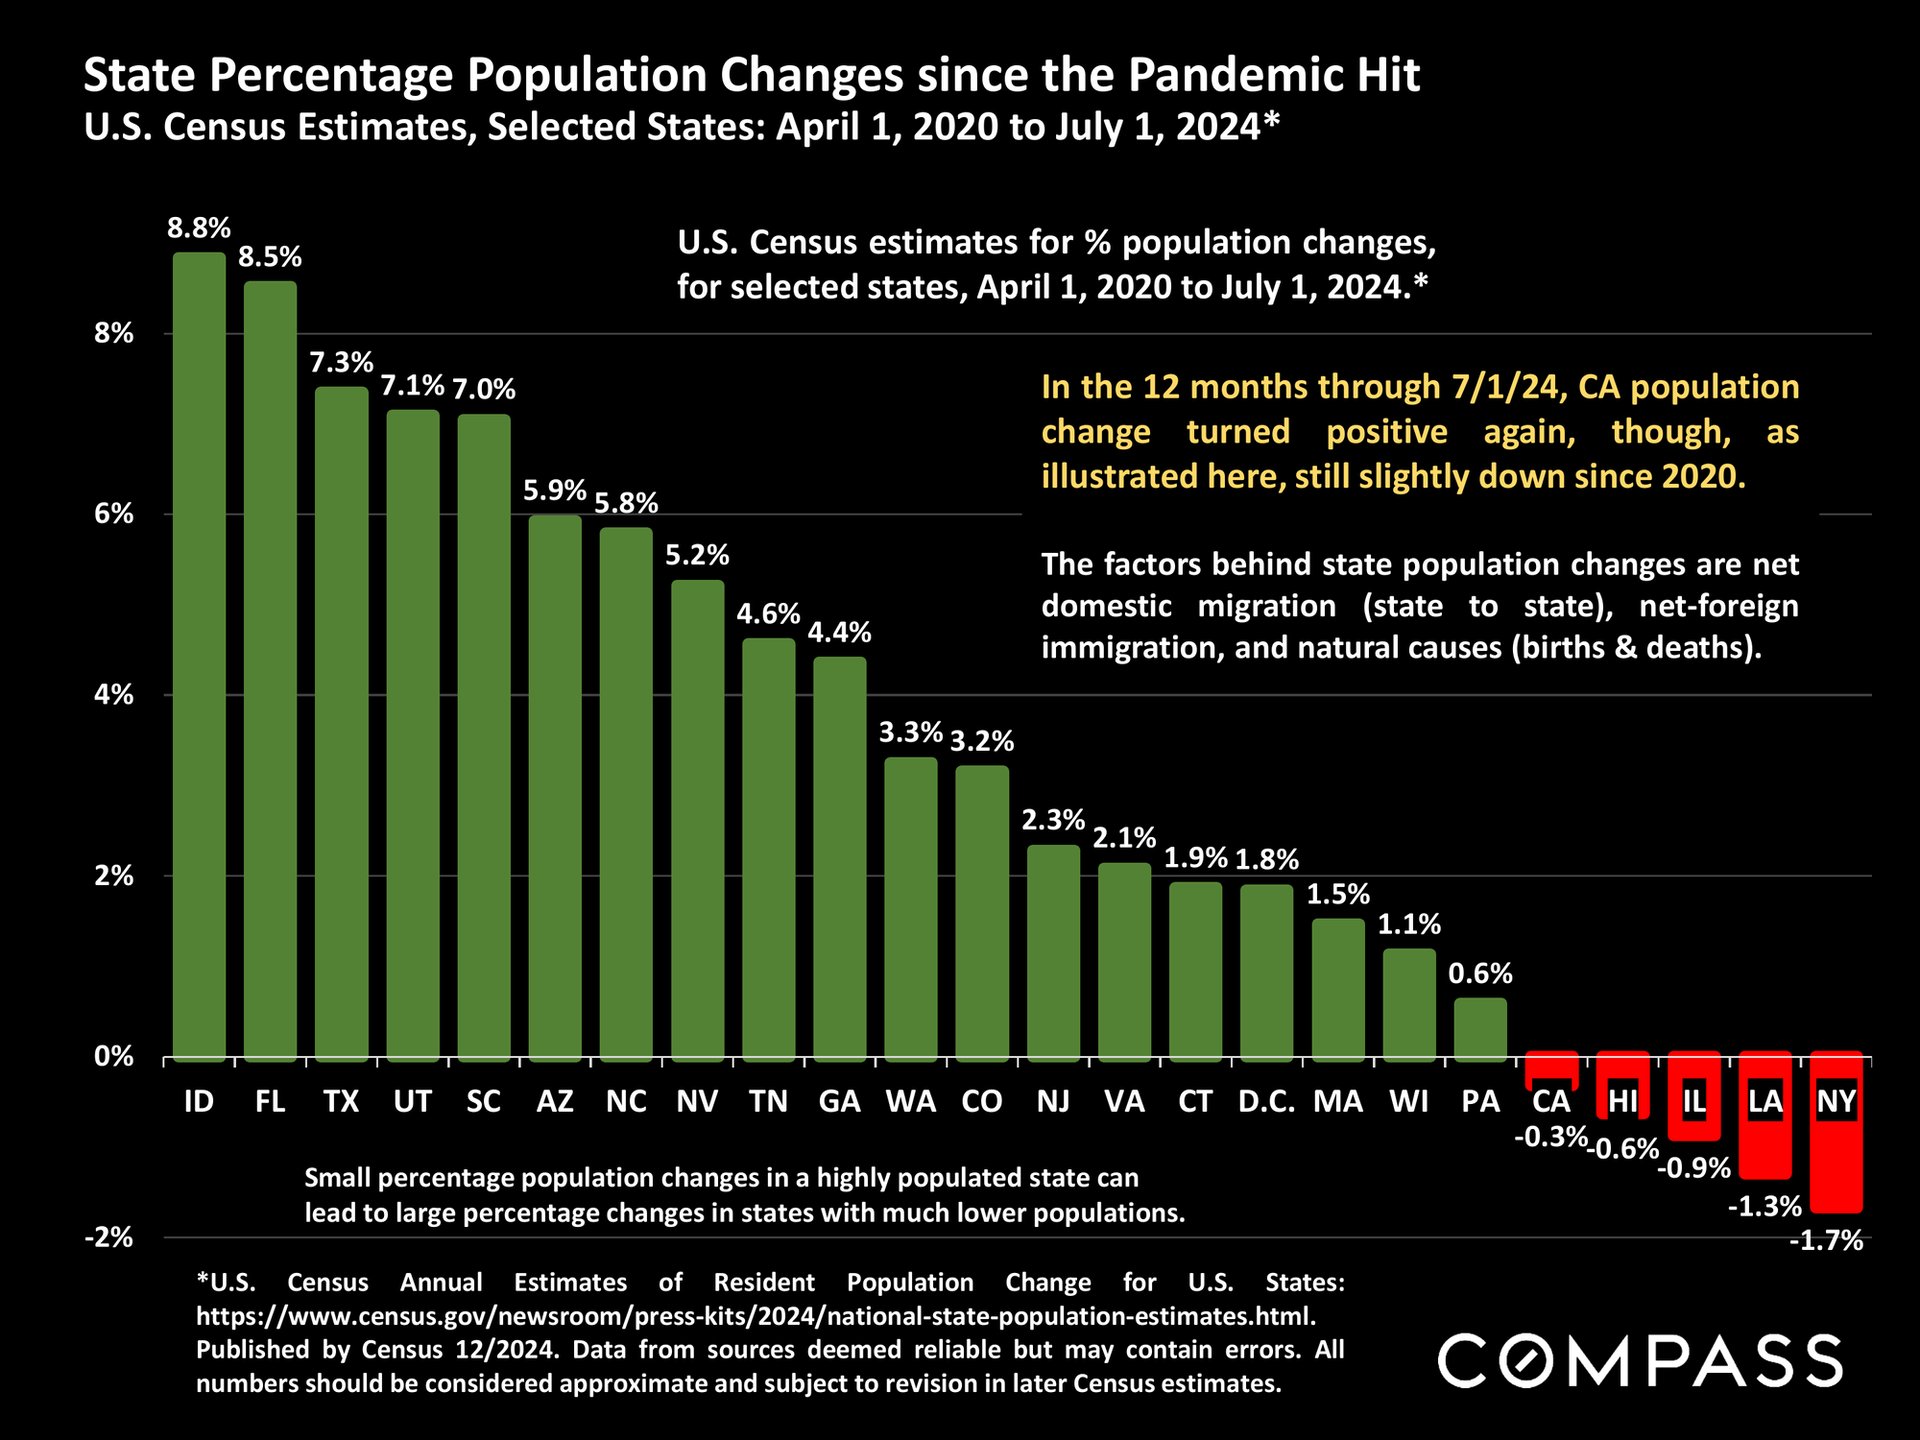
Bar chart of state population changes from 2020 to 2024, with Idaho highest at 8.8% and New York lowest at -1.7%.
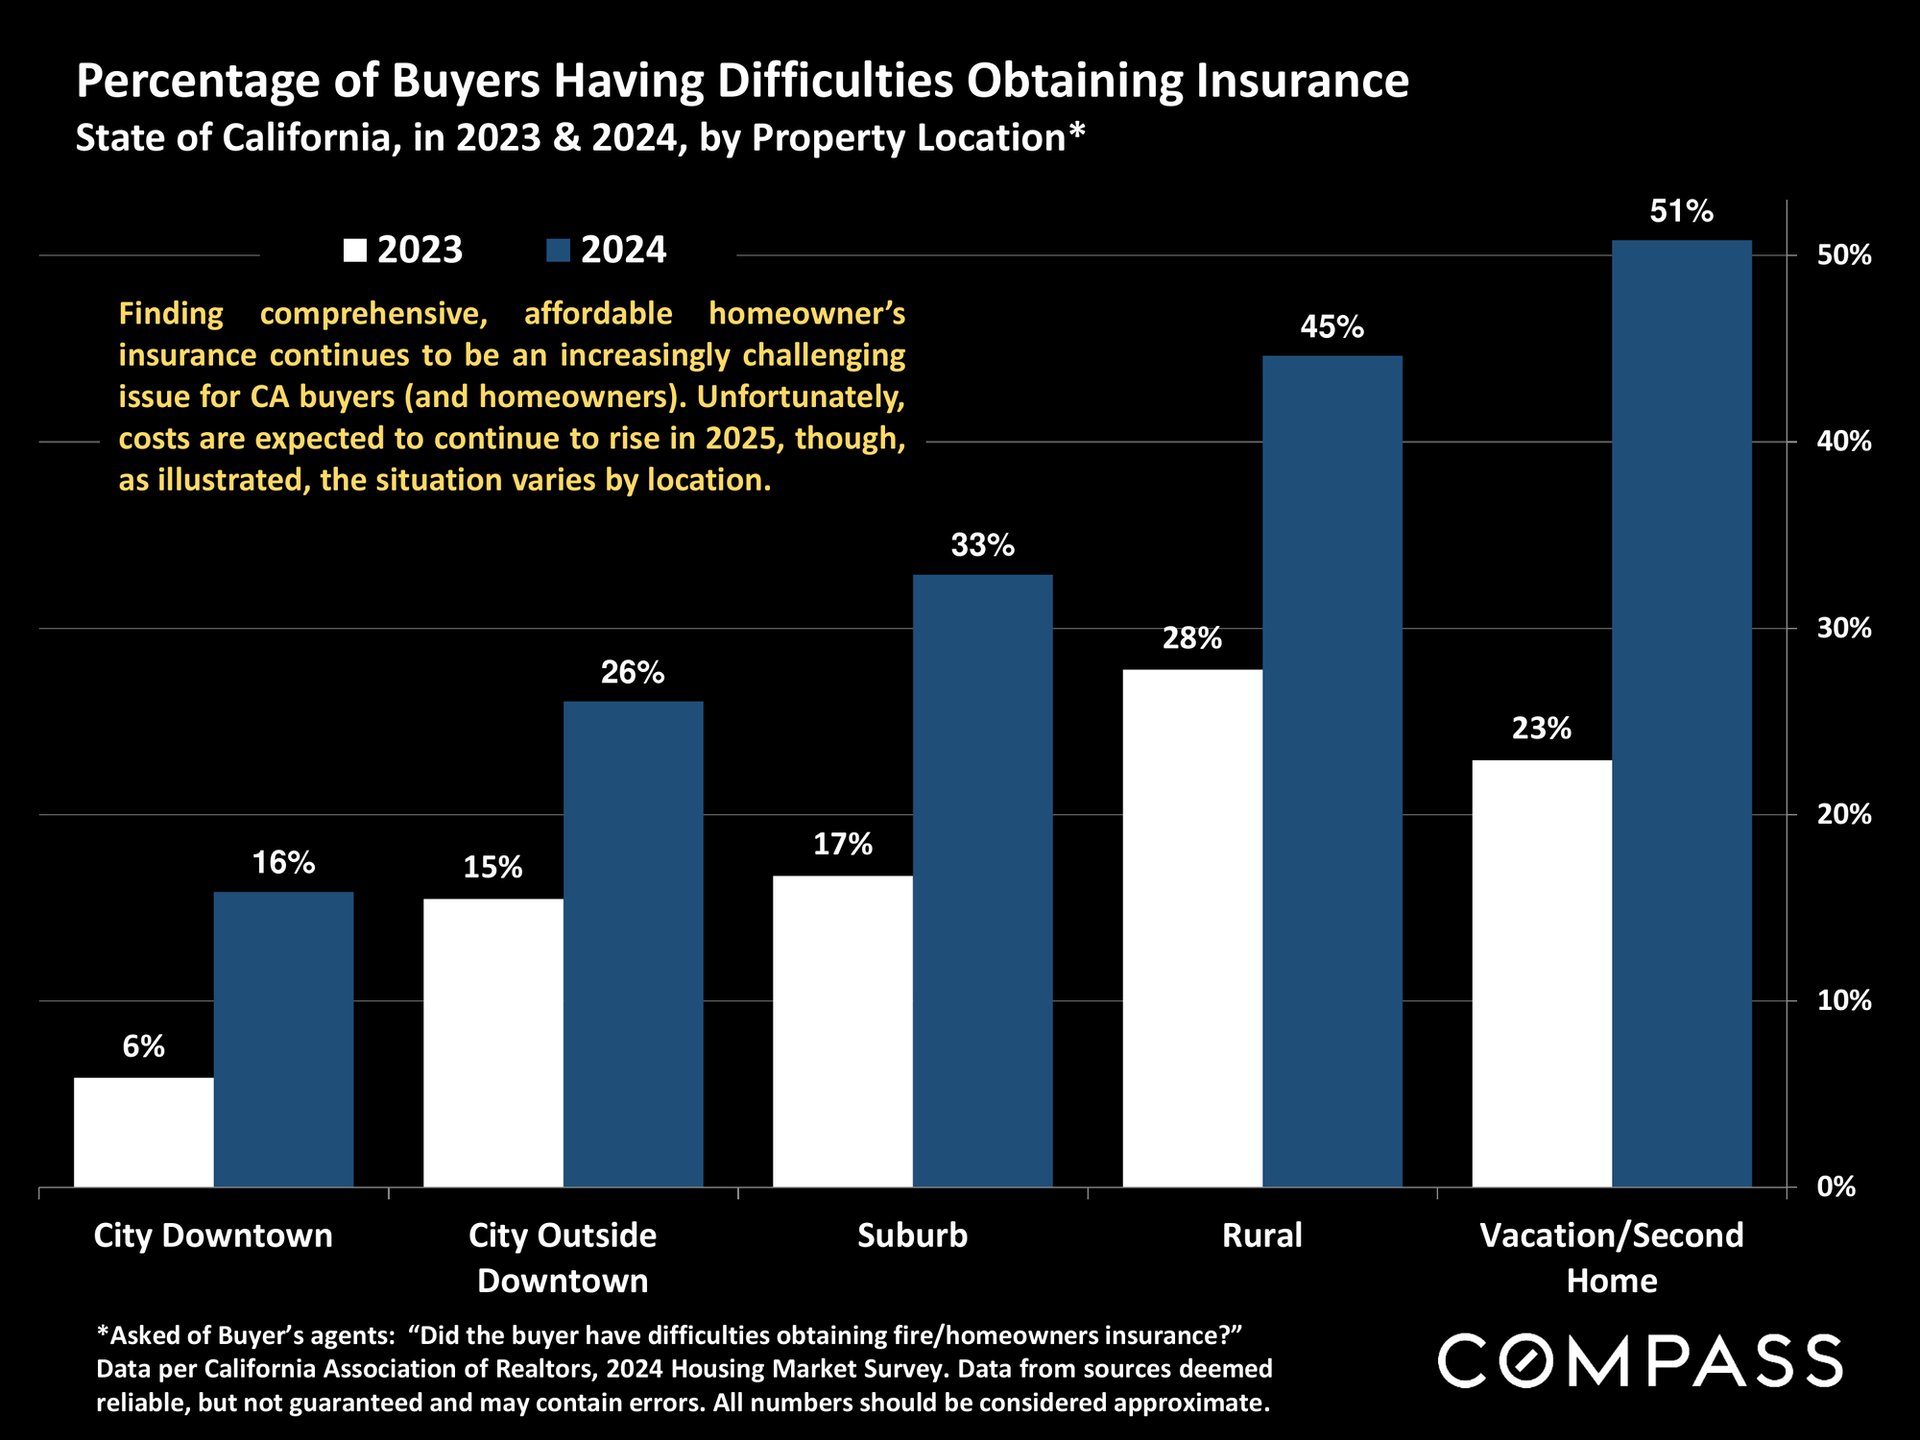
Bar chart compares California buyers’ insurance difficulties by property location in 2023 and 2024, rising most for vacation homes.


WORK WITH US

We offer the highest level of service and expertise to our clients. Our team has built a reputation for consistently representing the finest real estate in San Francisco and Napa Valley. Results driven and dedicated to your success, whether buying, selling, renting or investing. Contact us today for a private consultation.

Contact Us