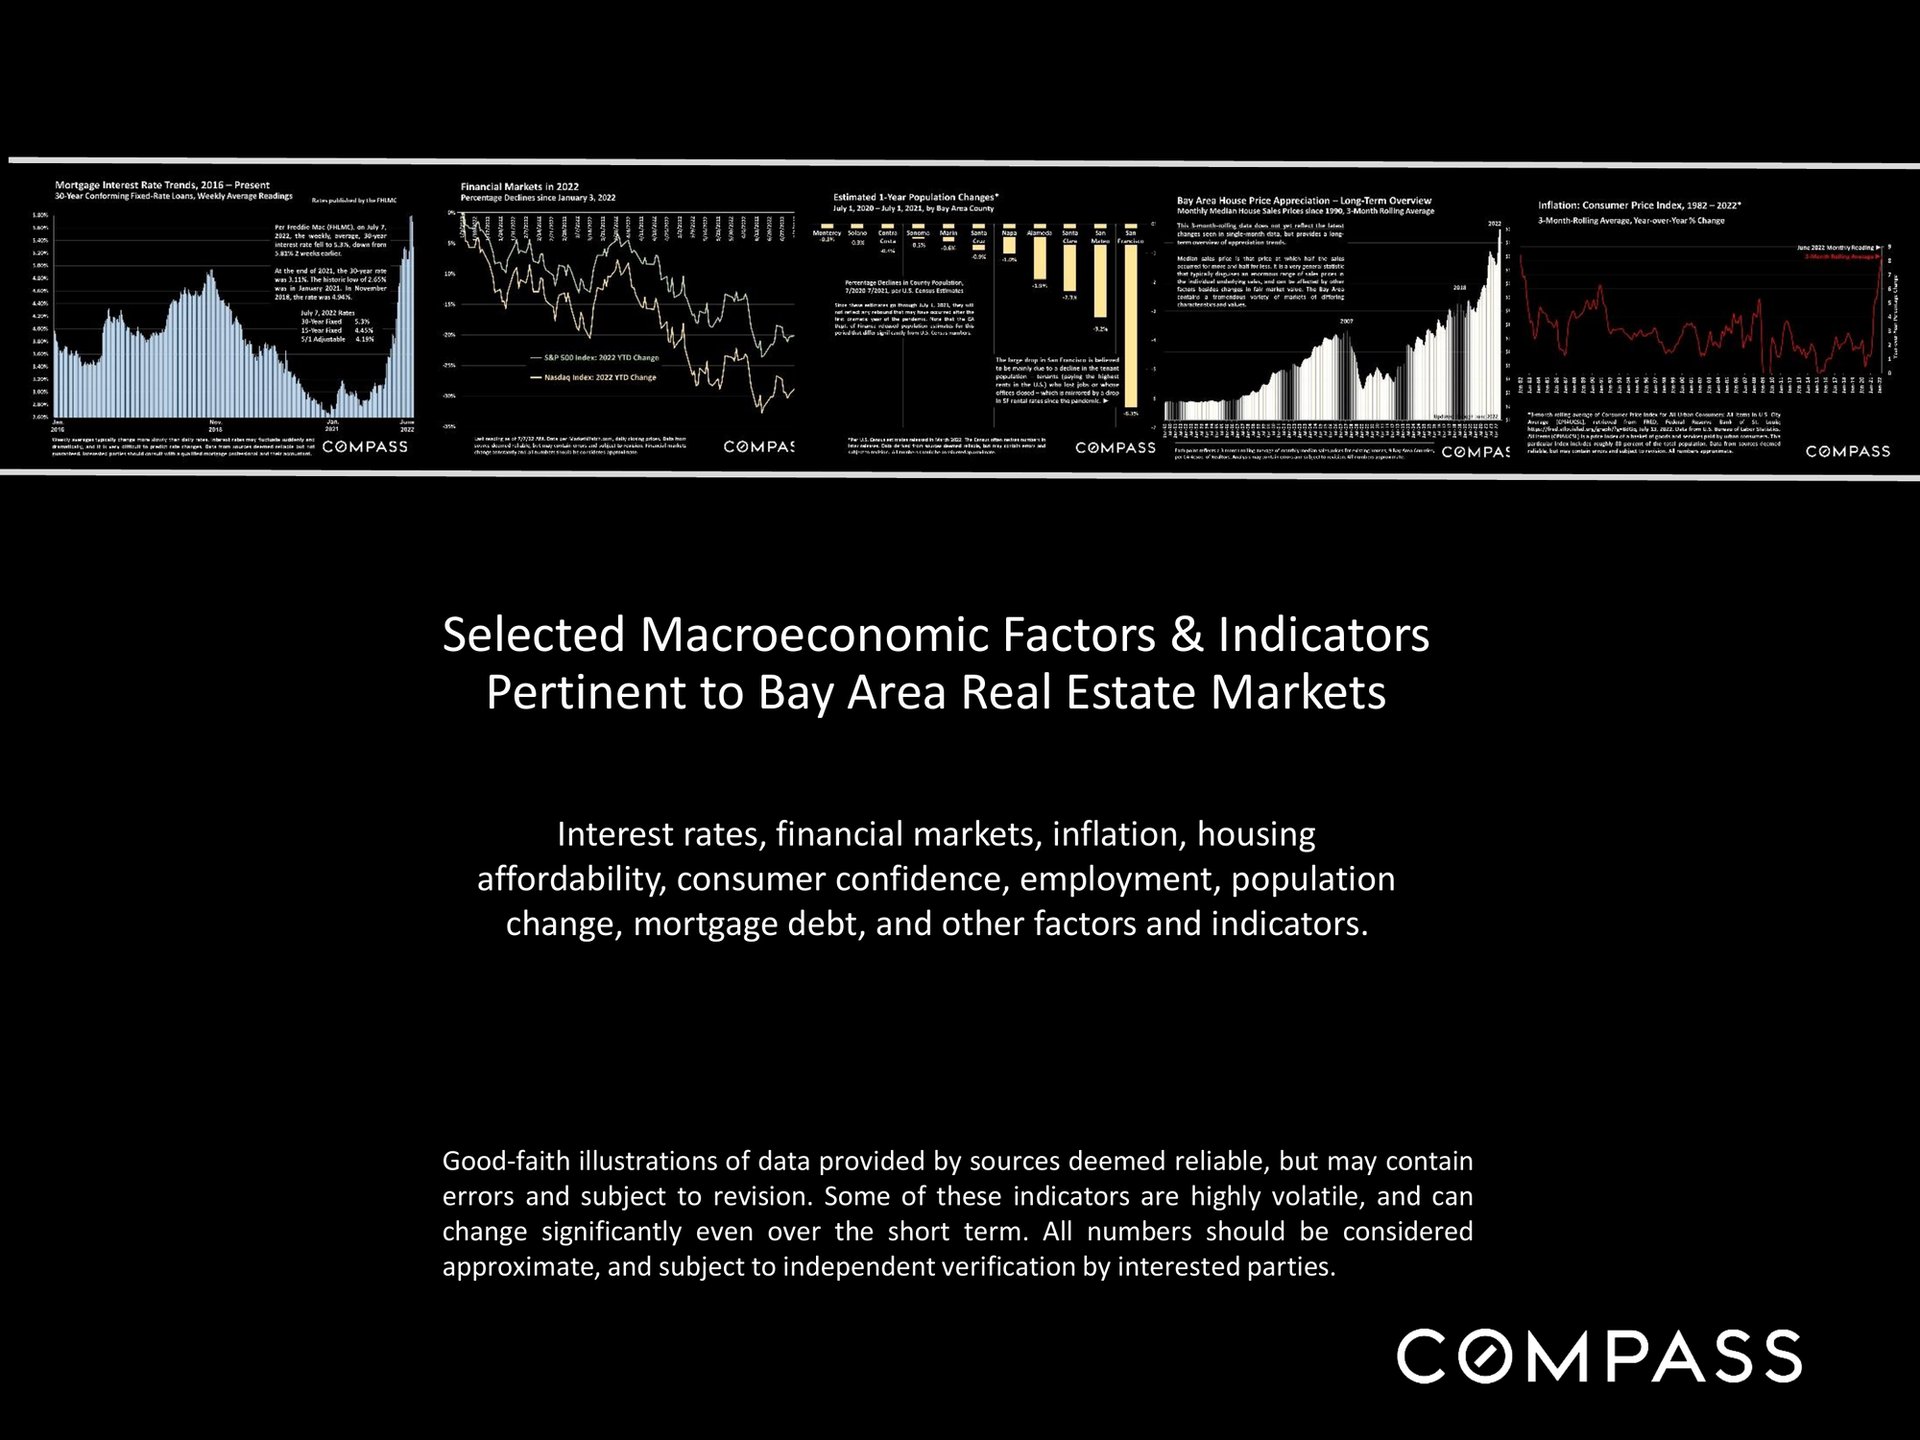

Selected Macroeconomic Factors & Indicators Pertinent to Bay Area Real Estate Markets

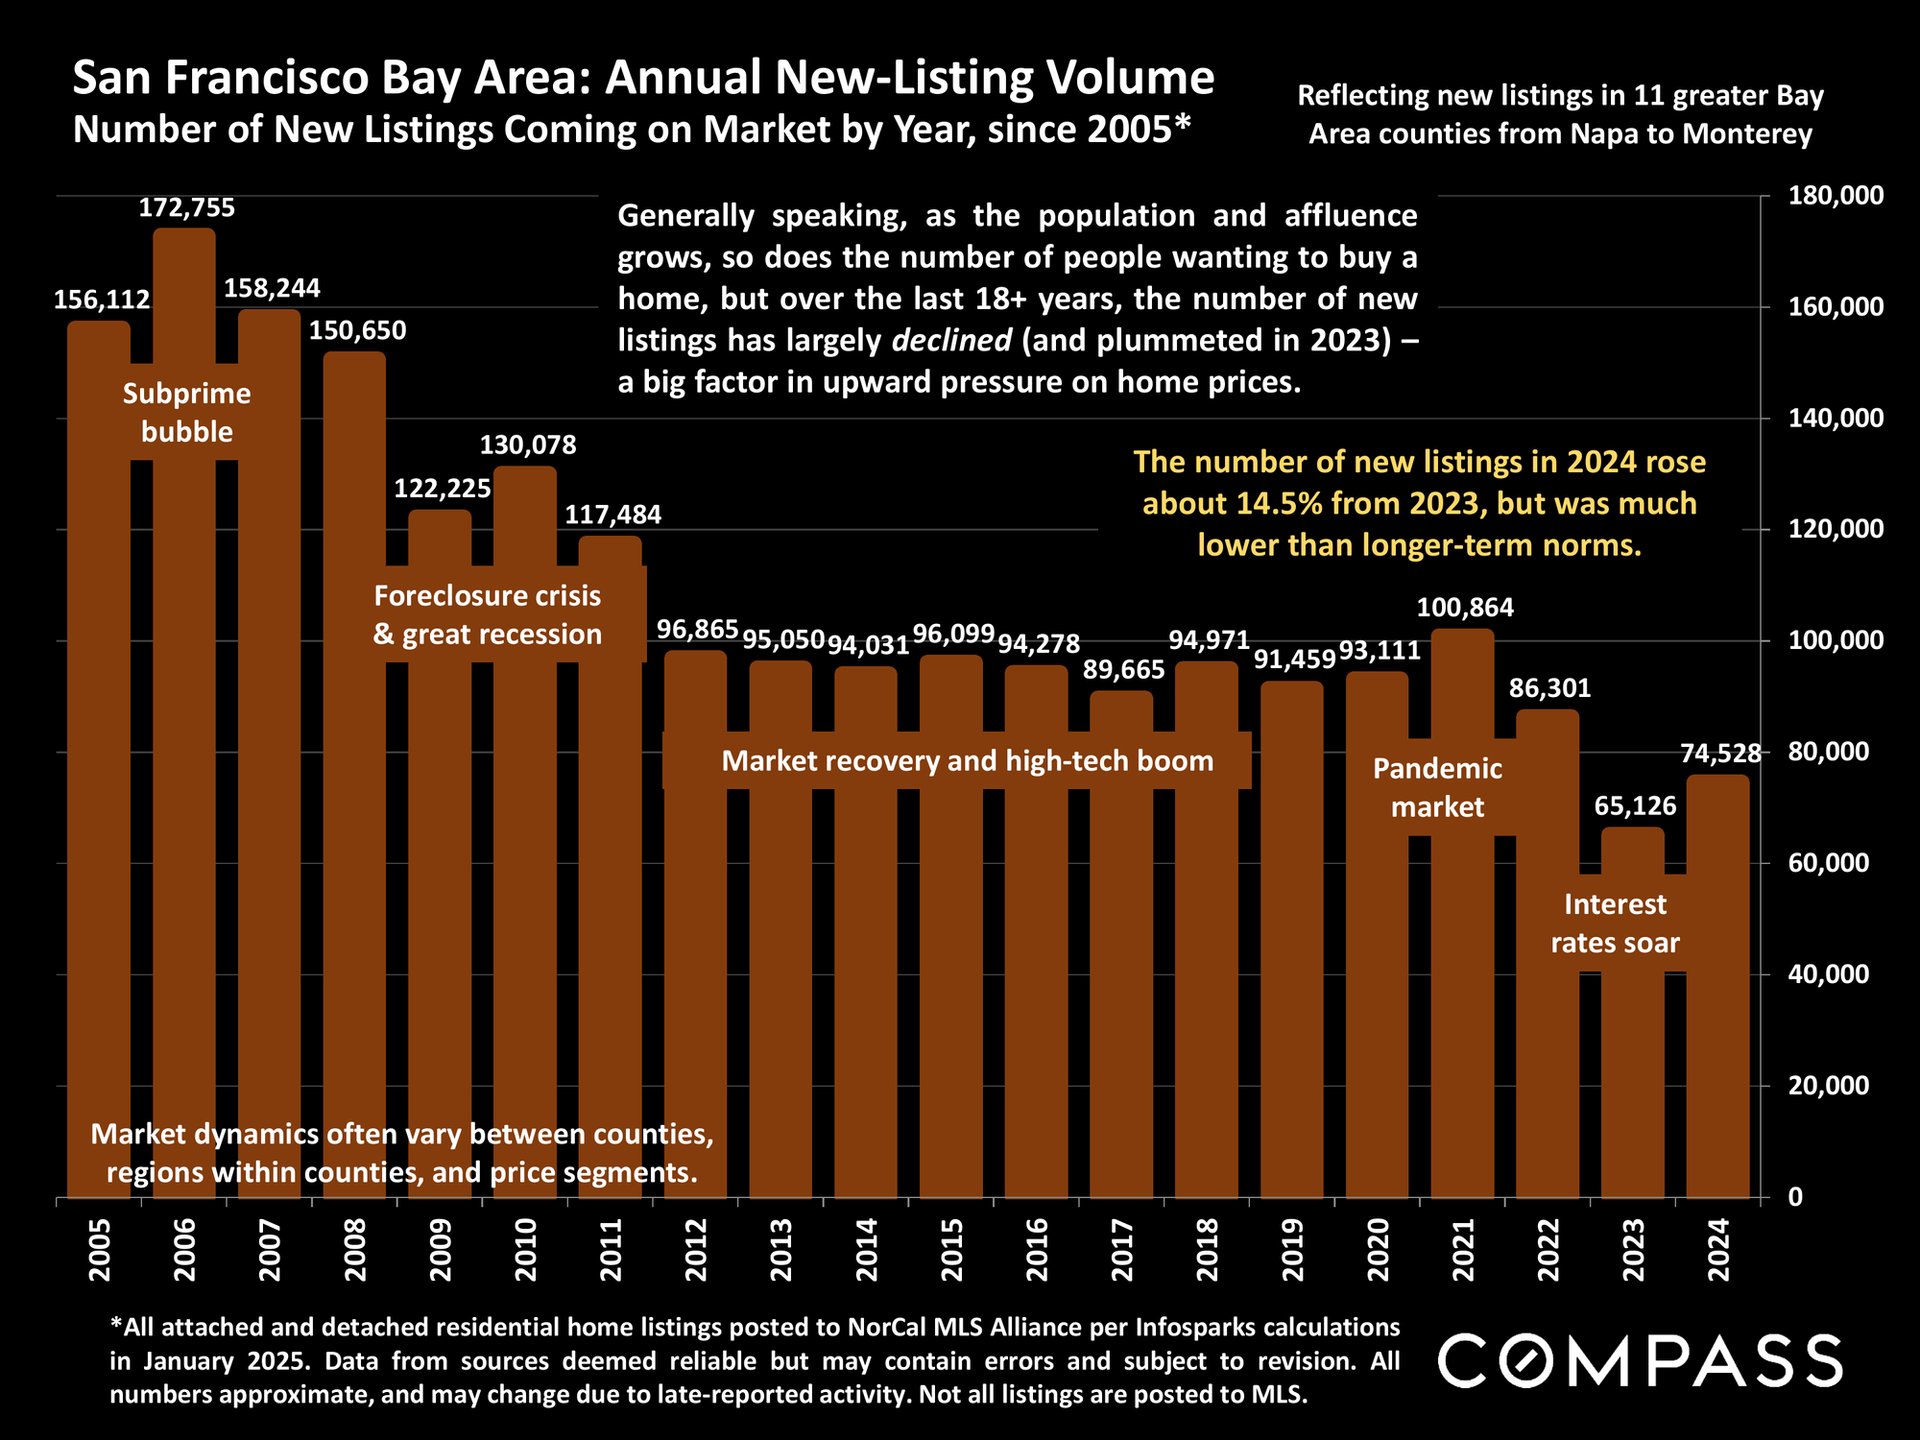
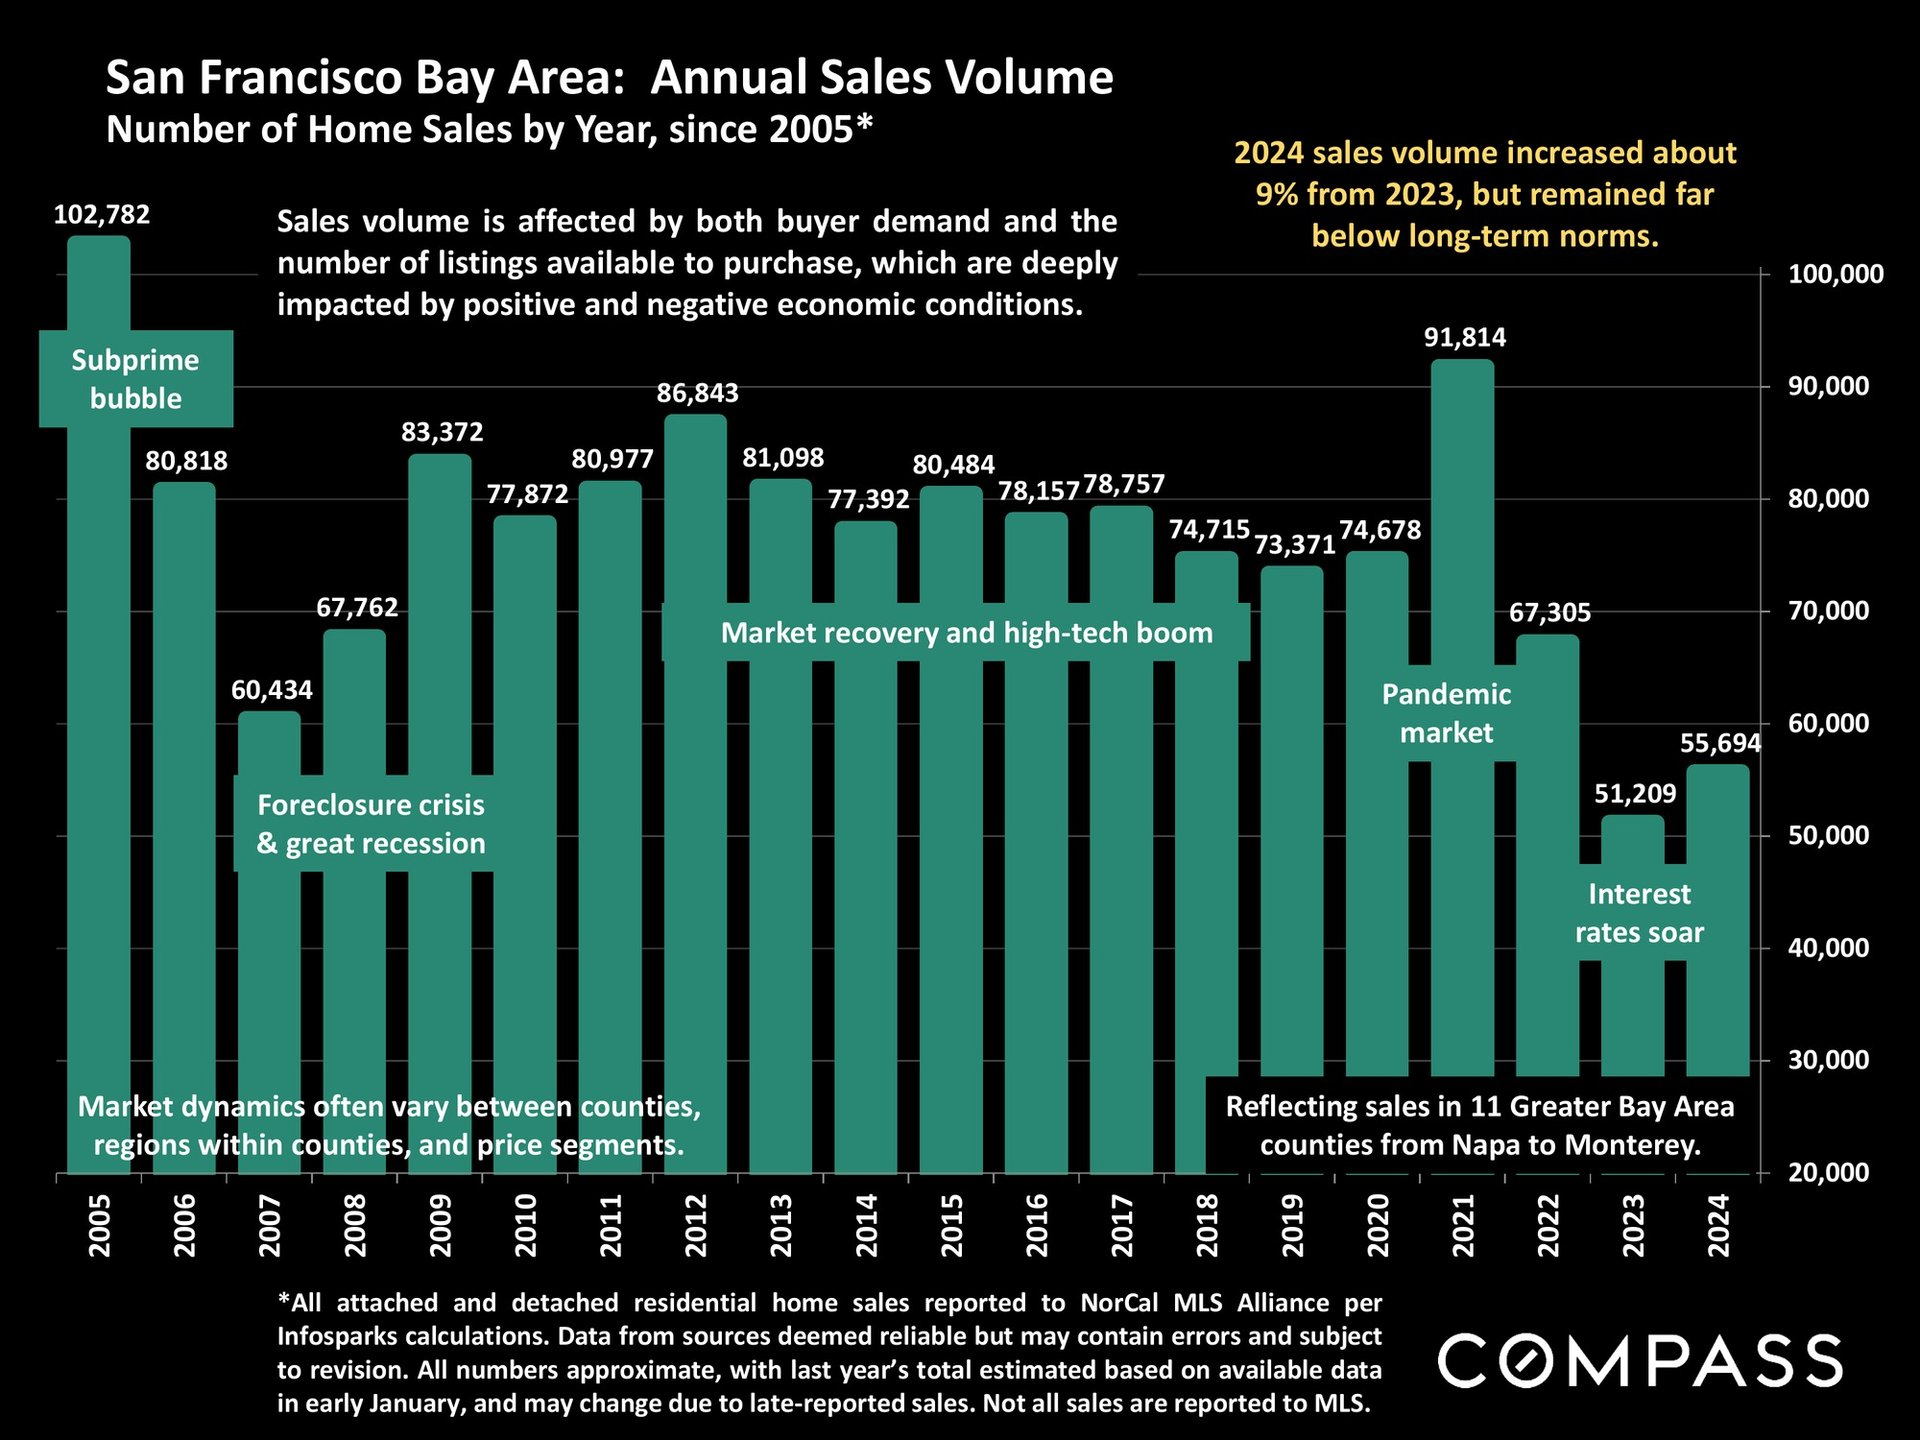
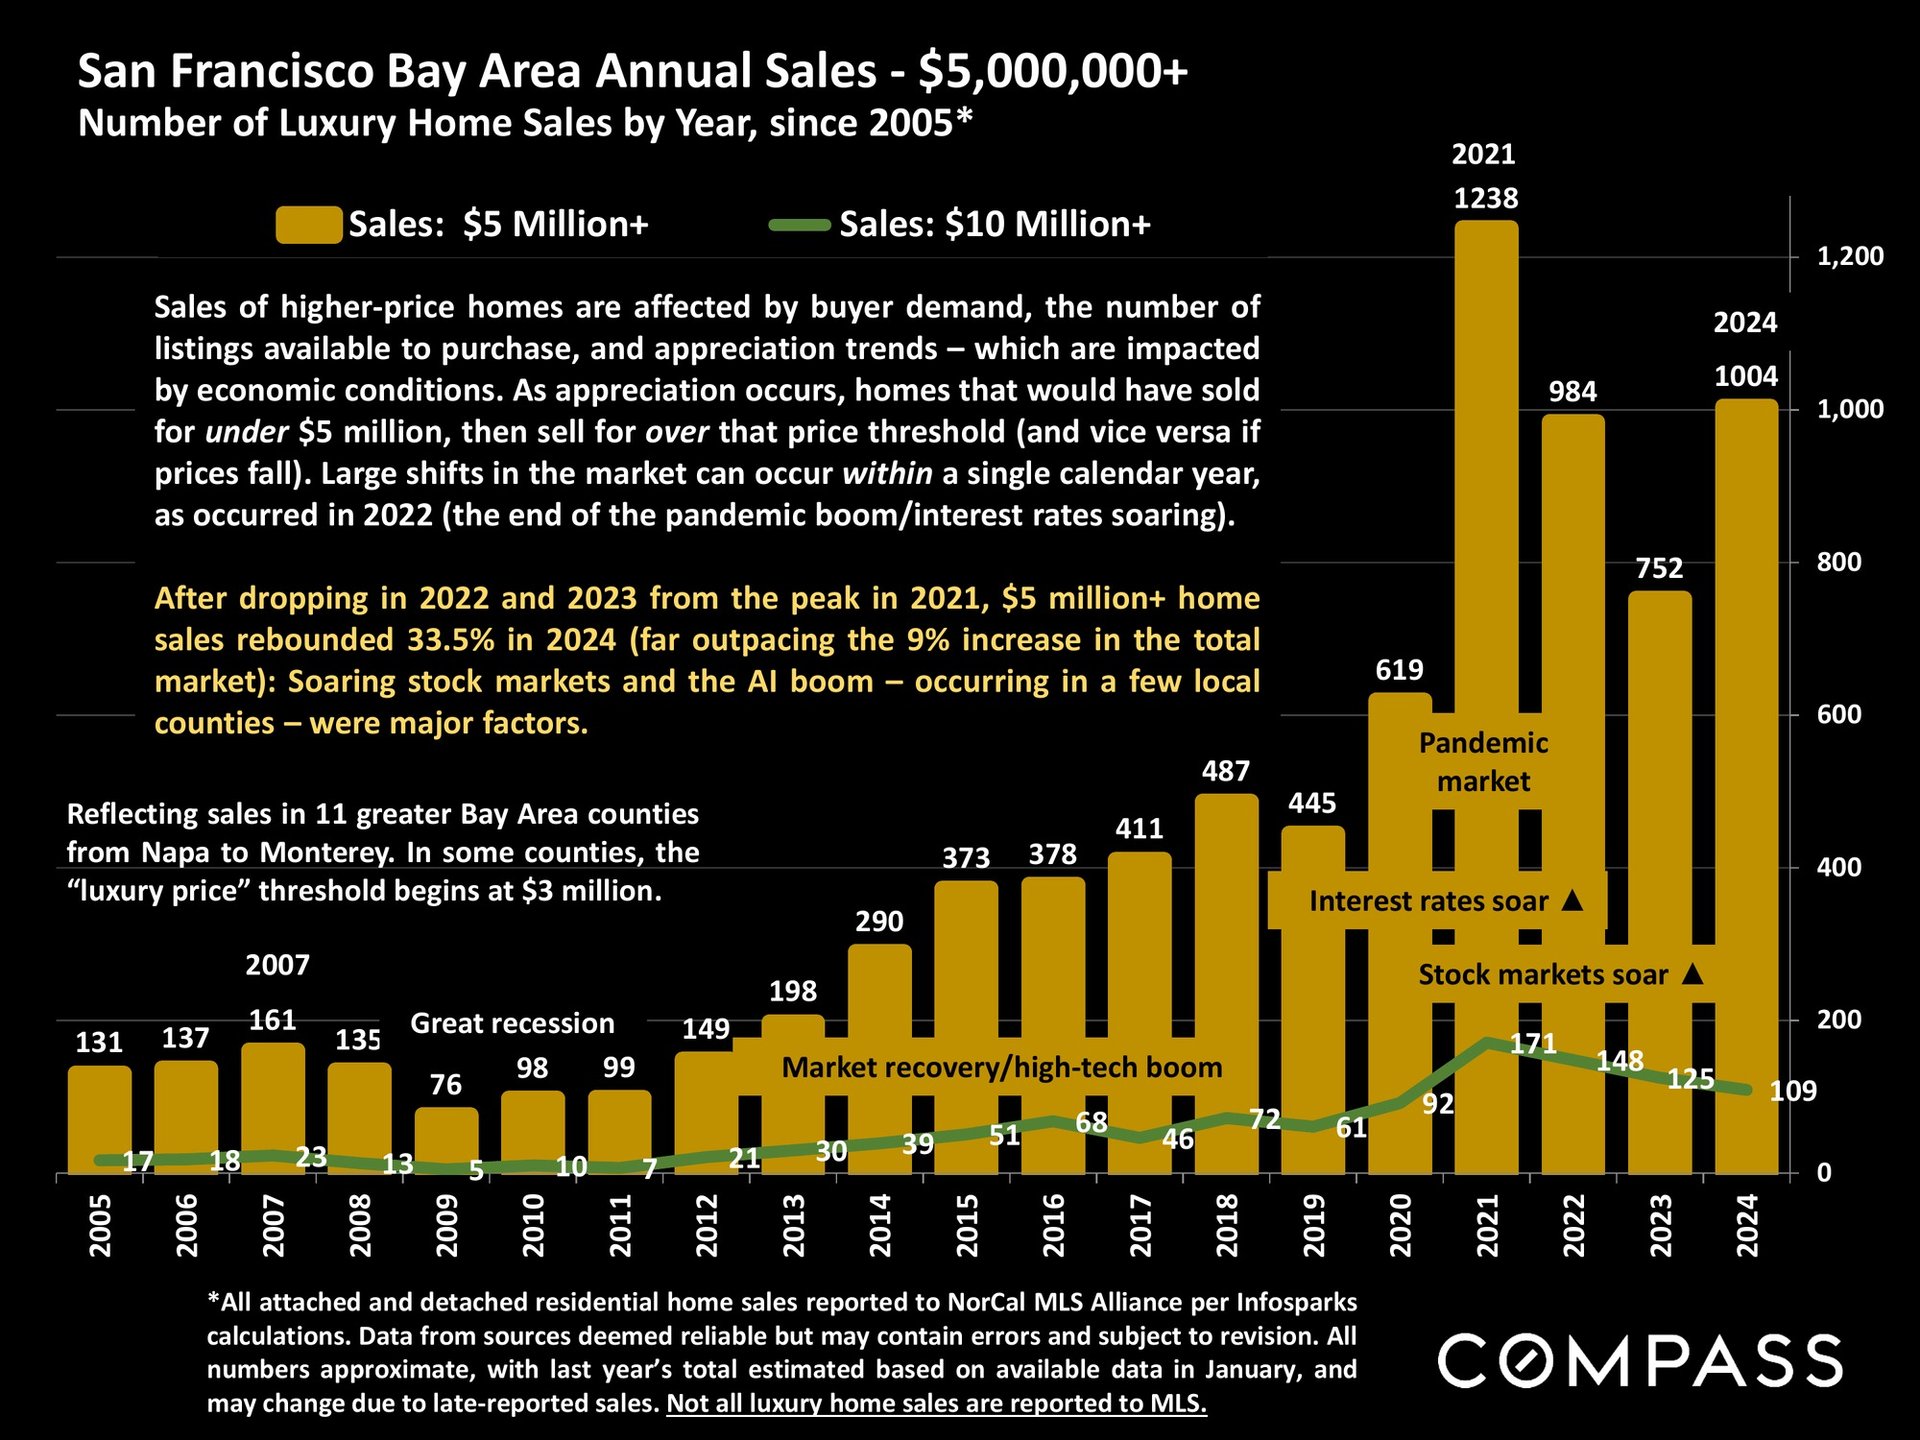
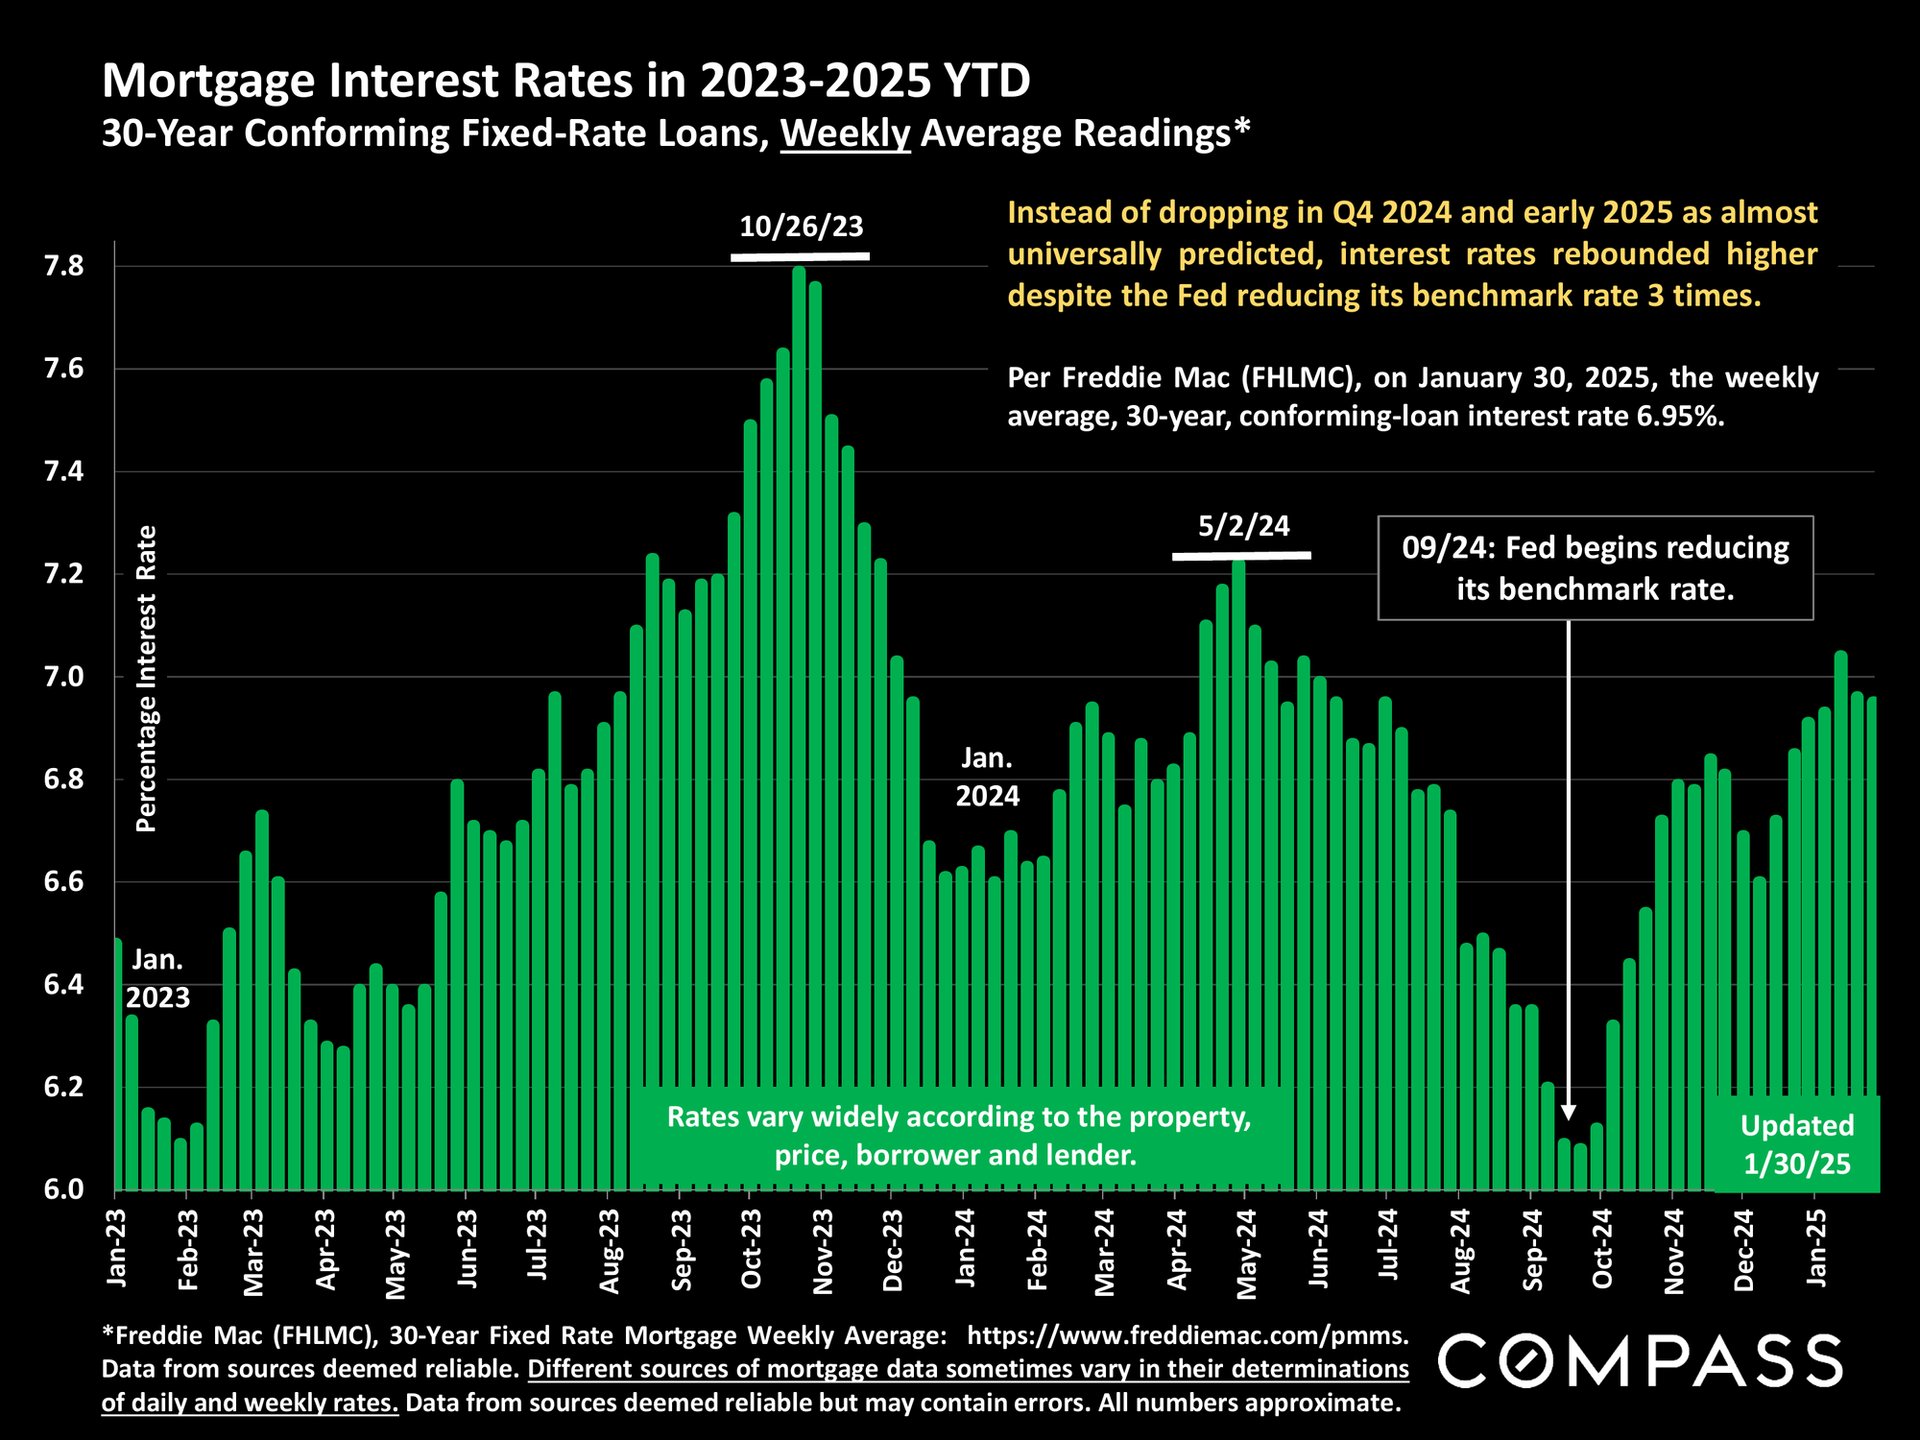
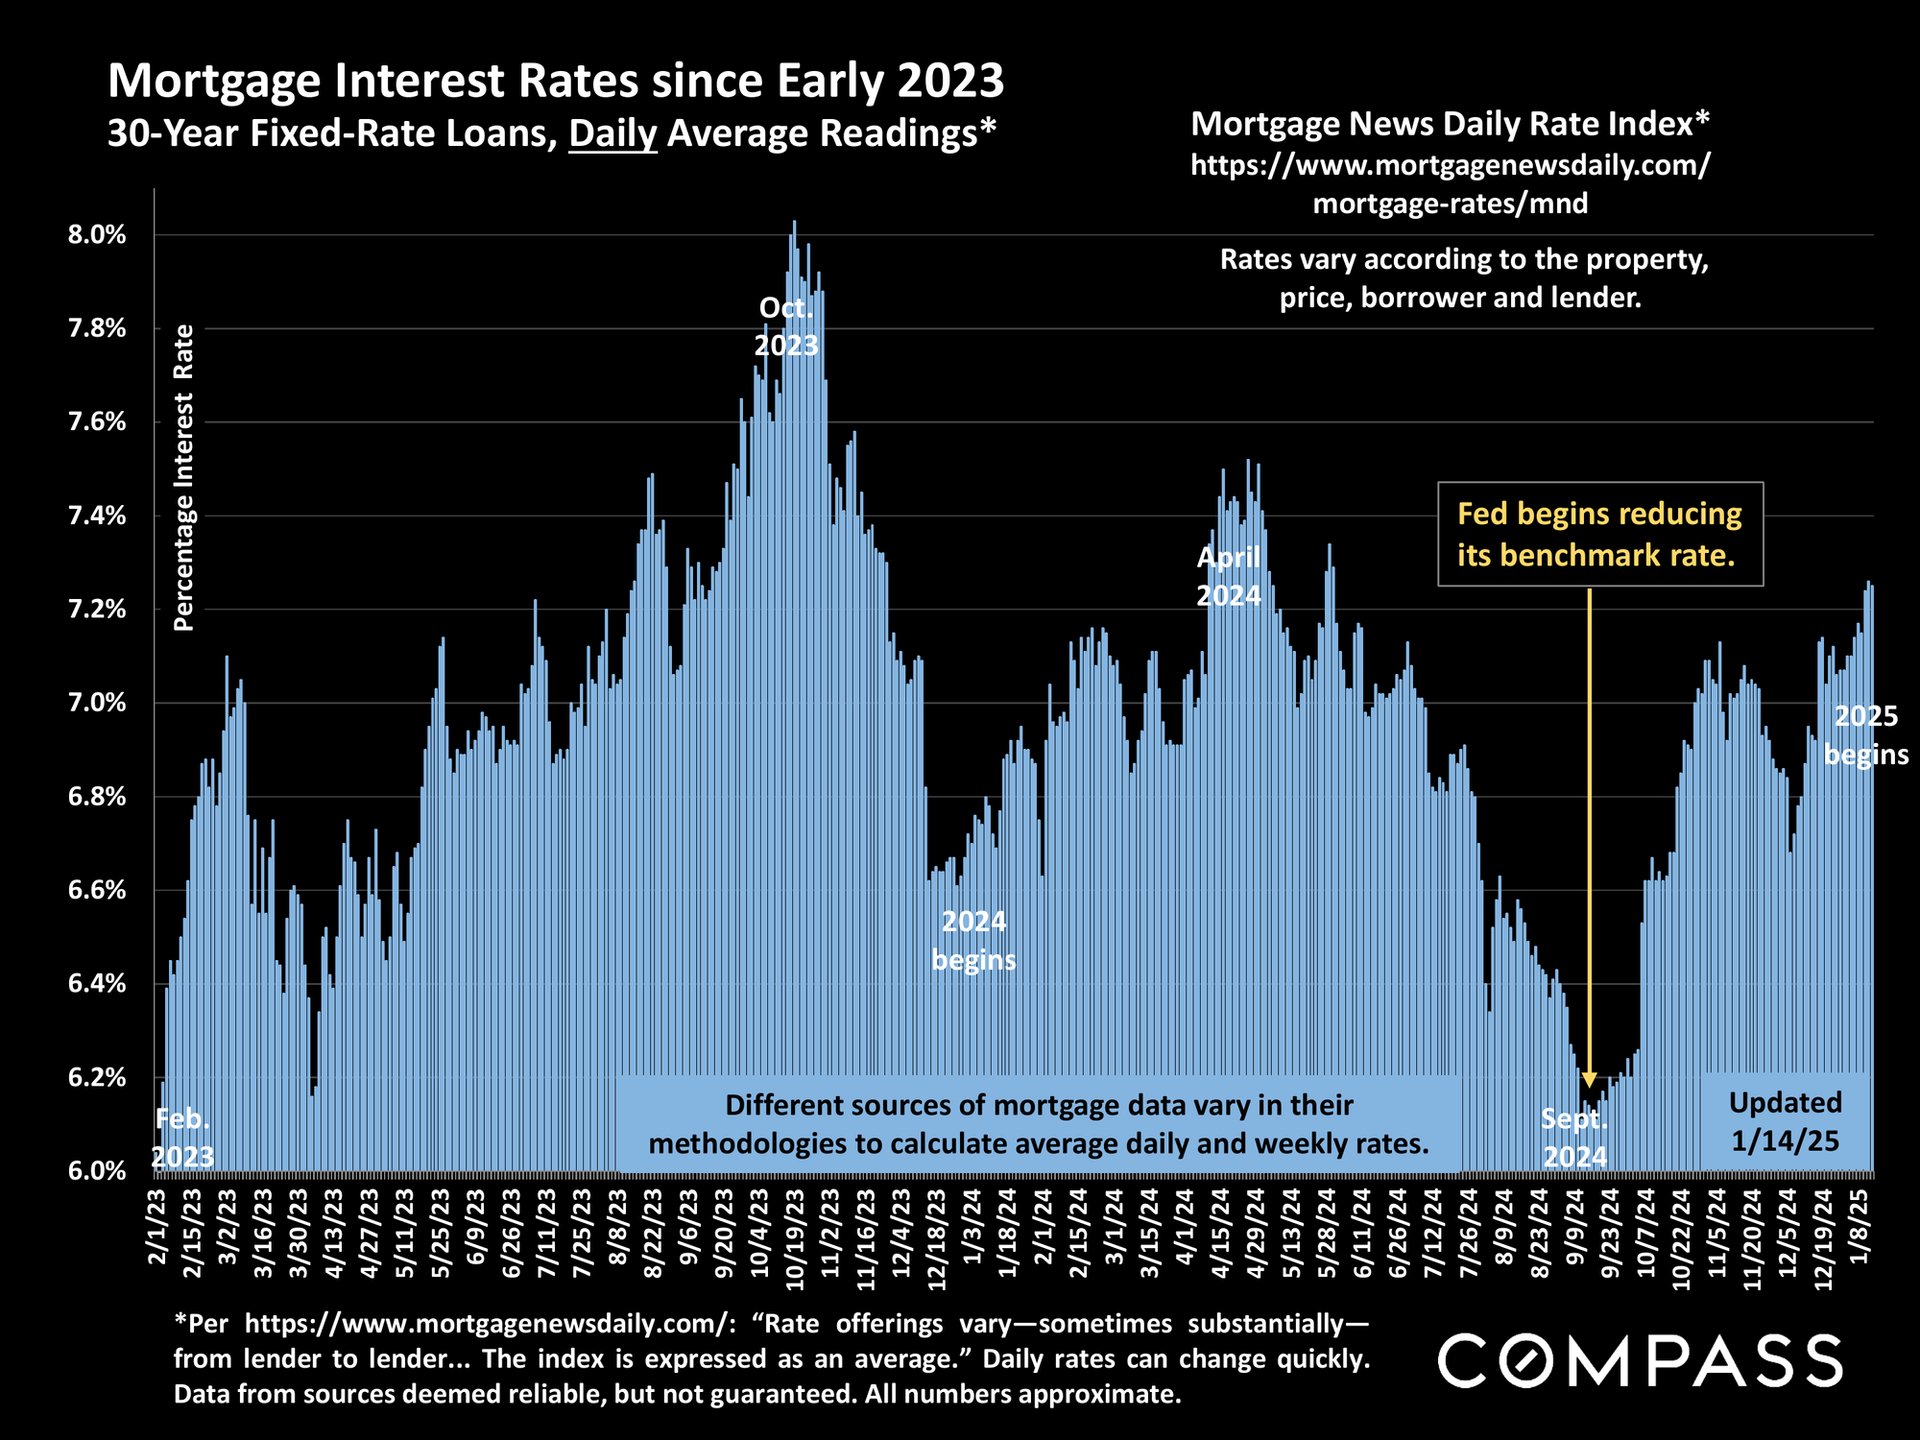
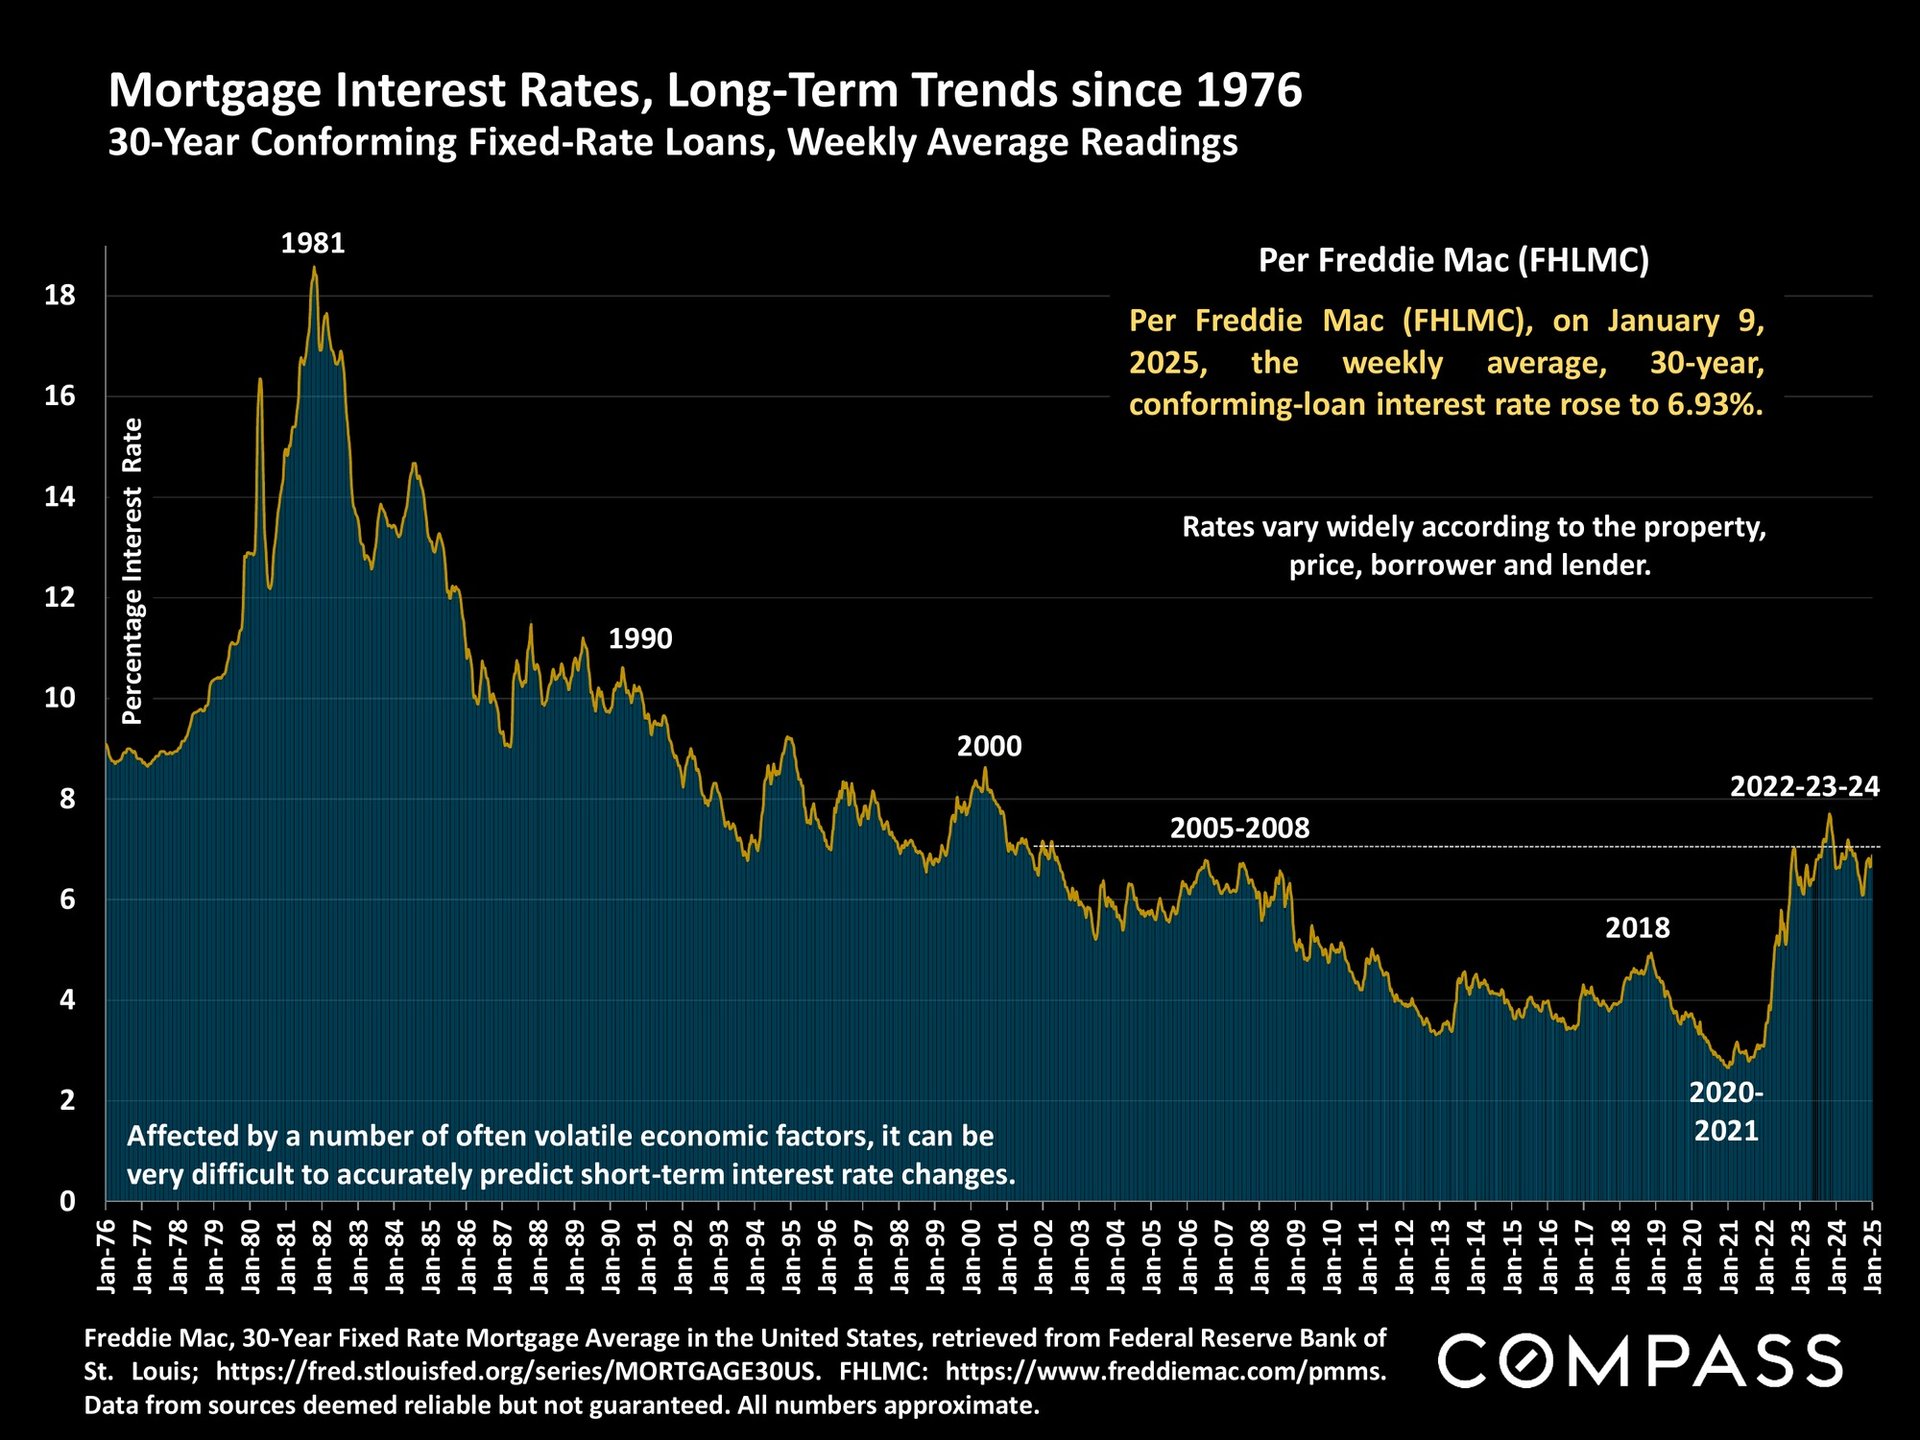
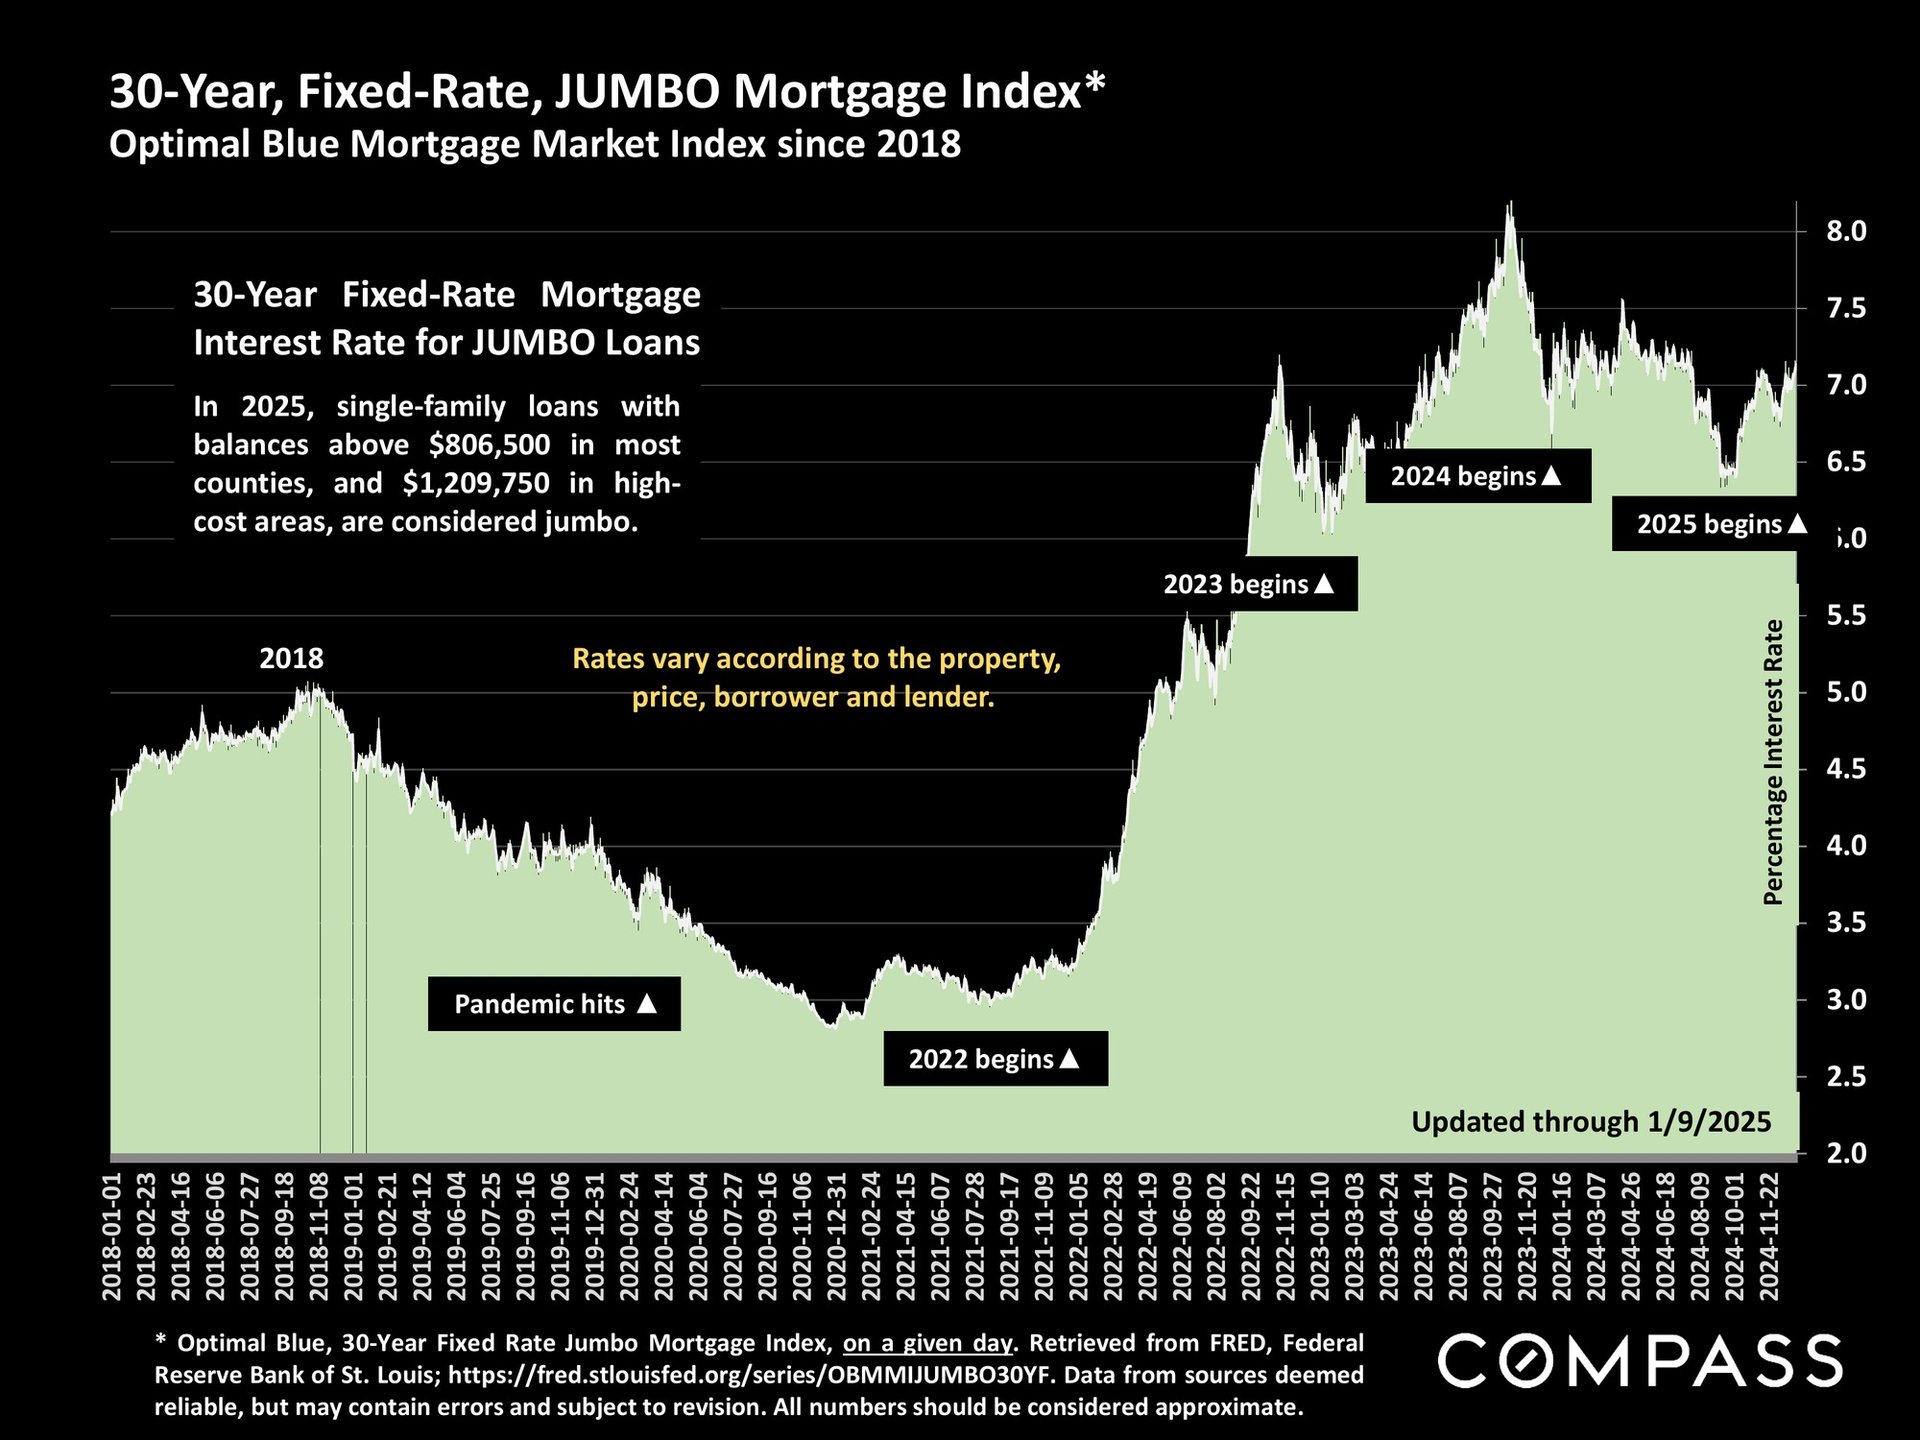
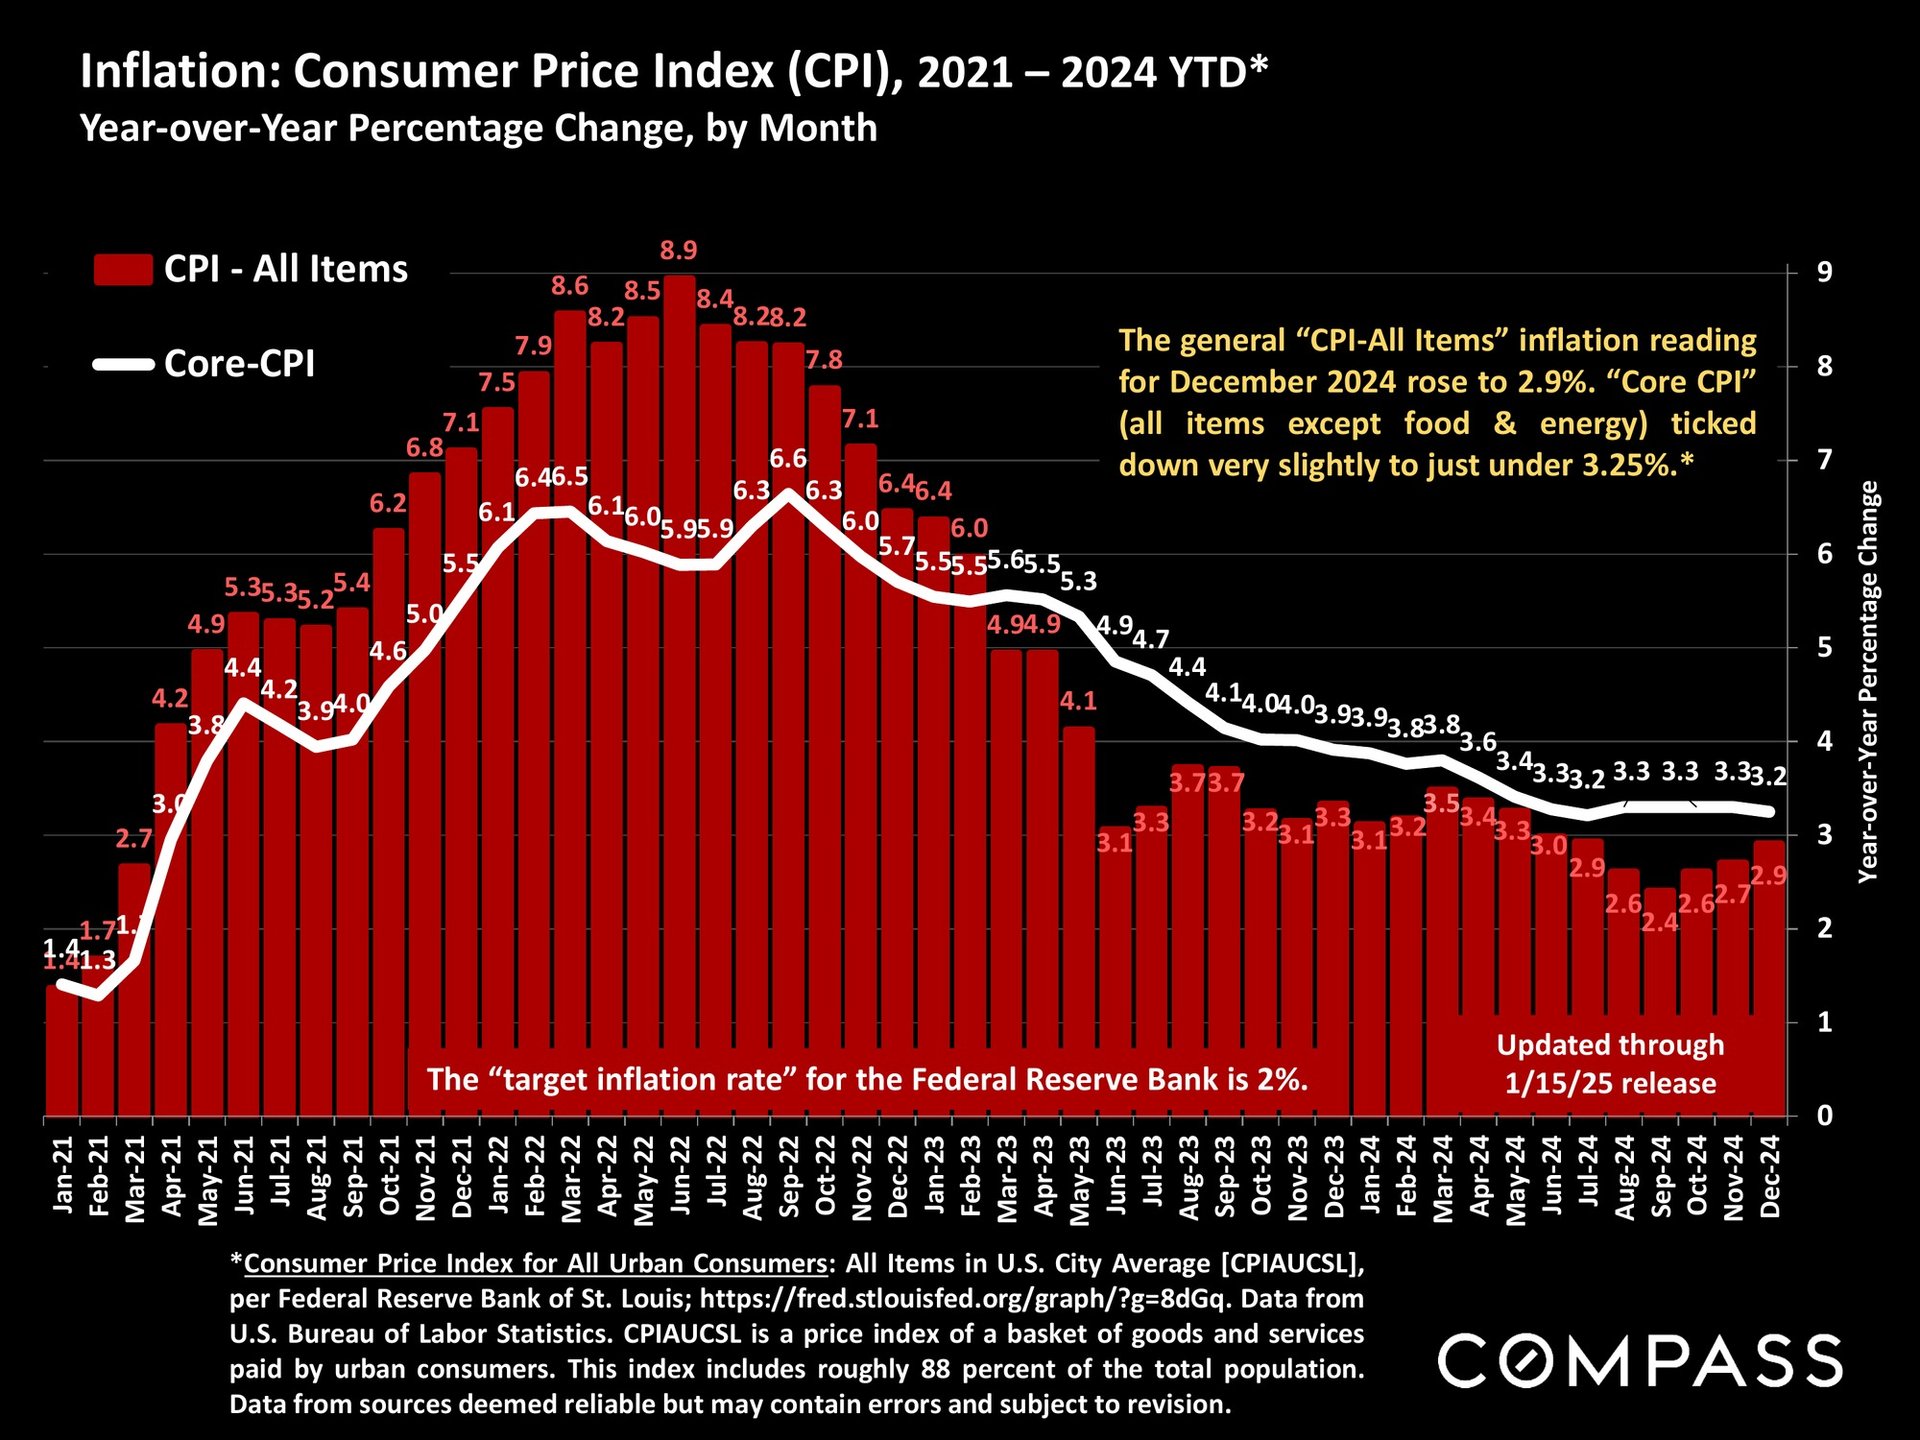
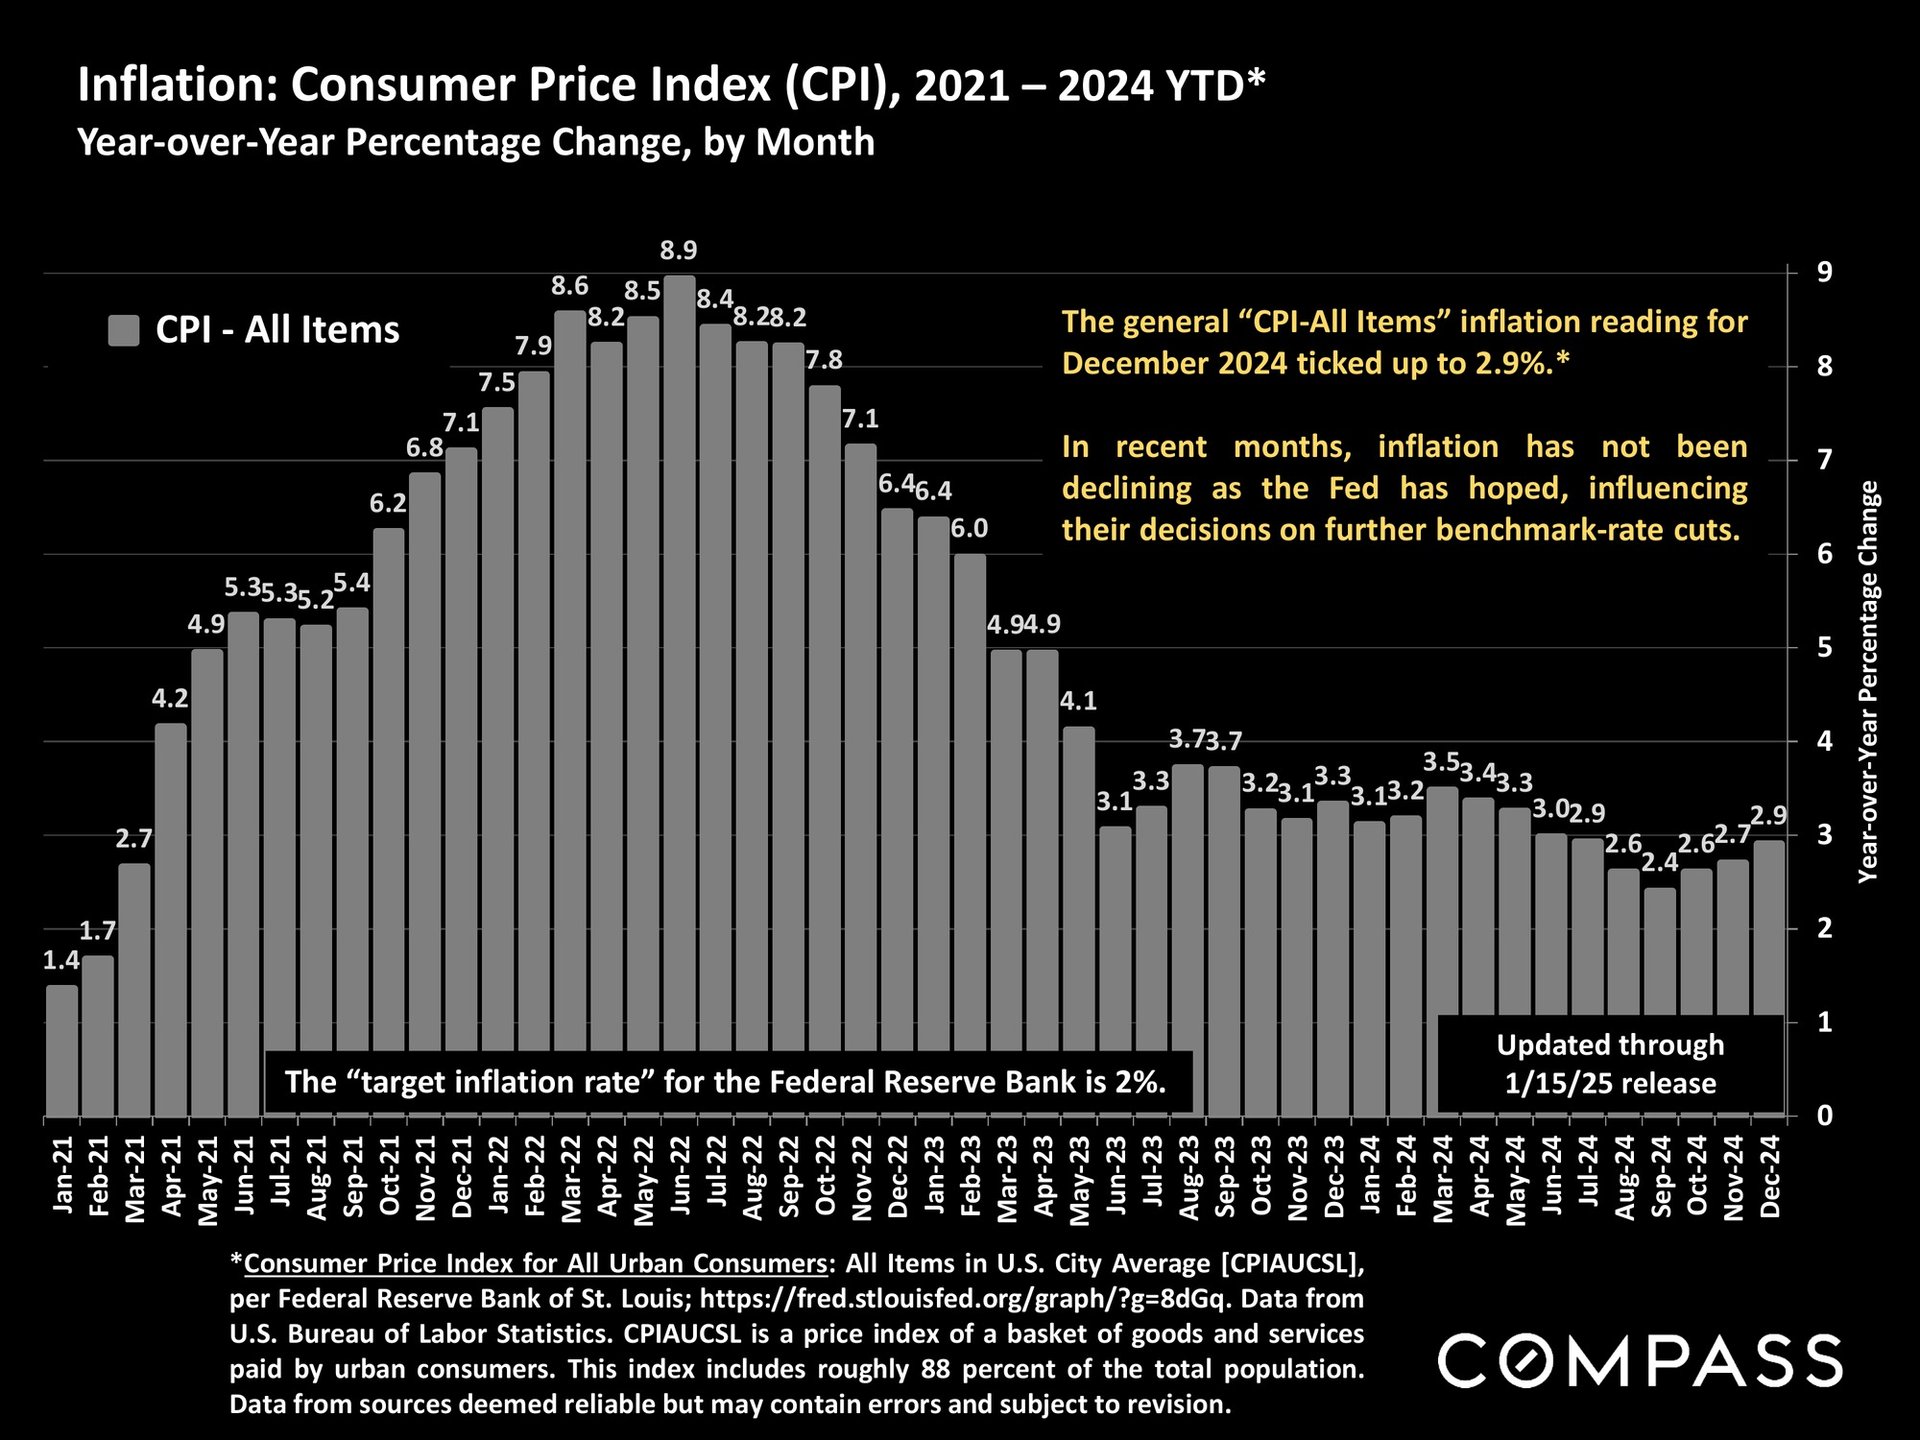
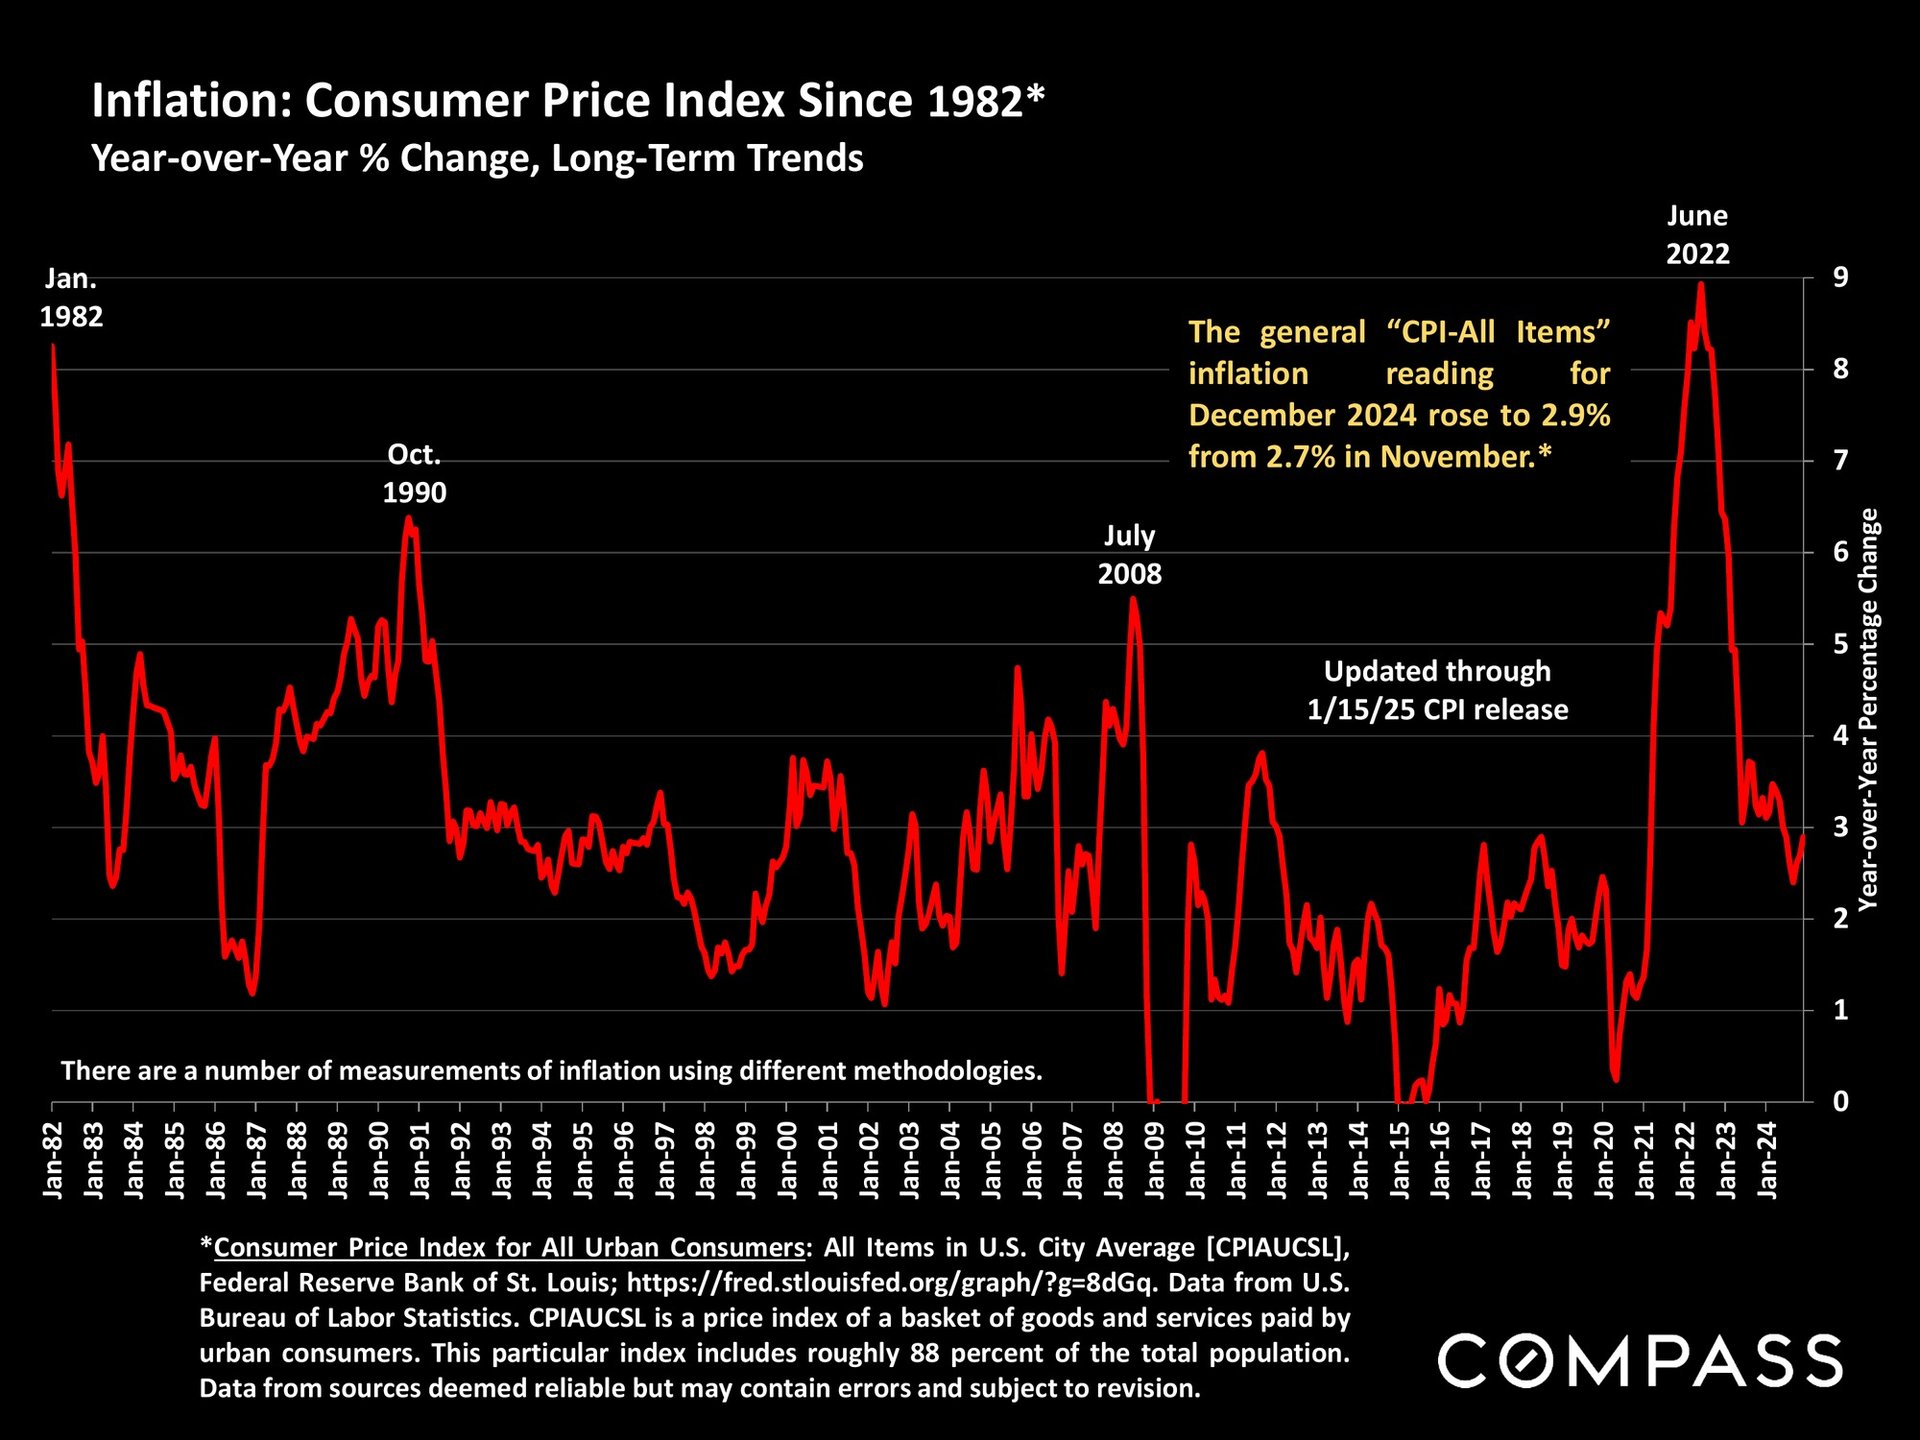
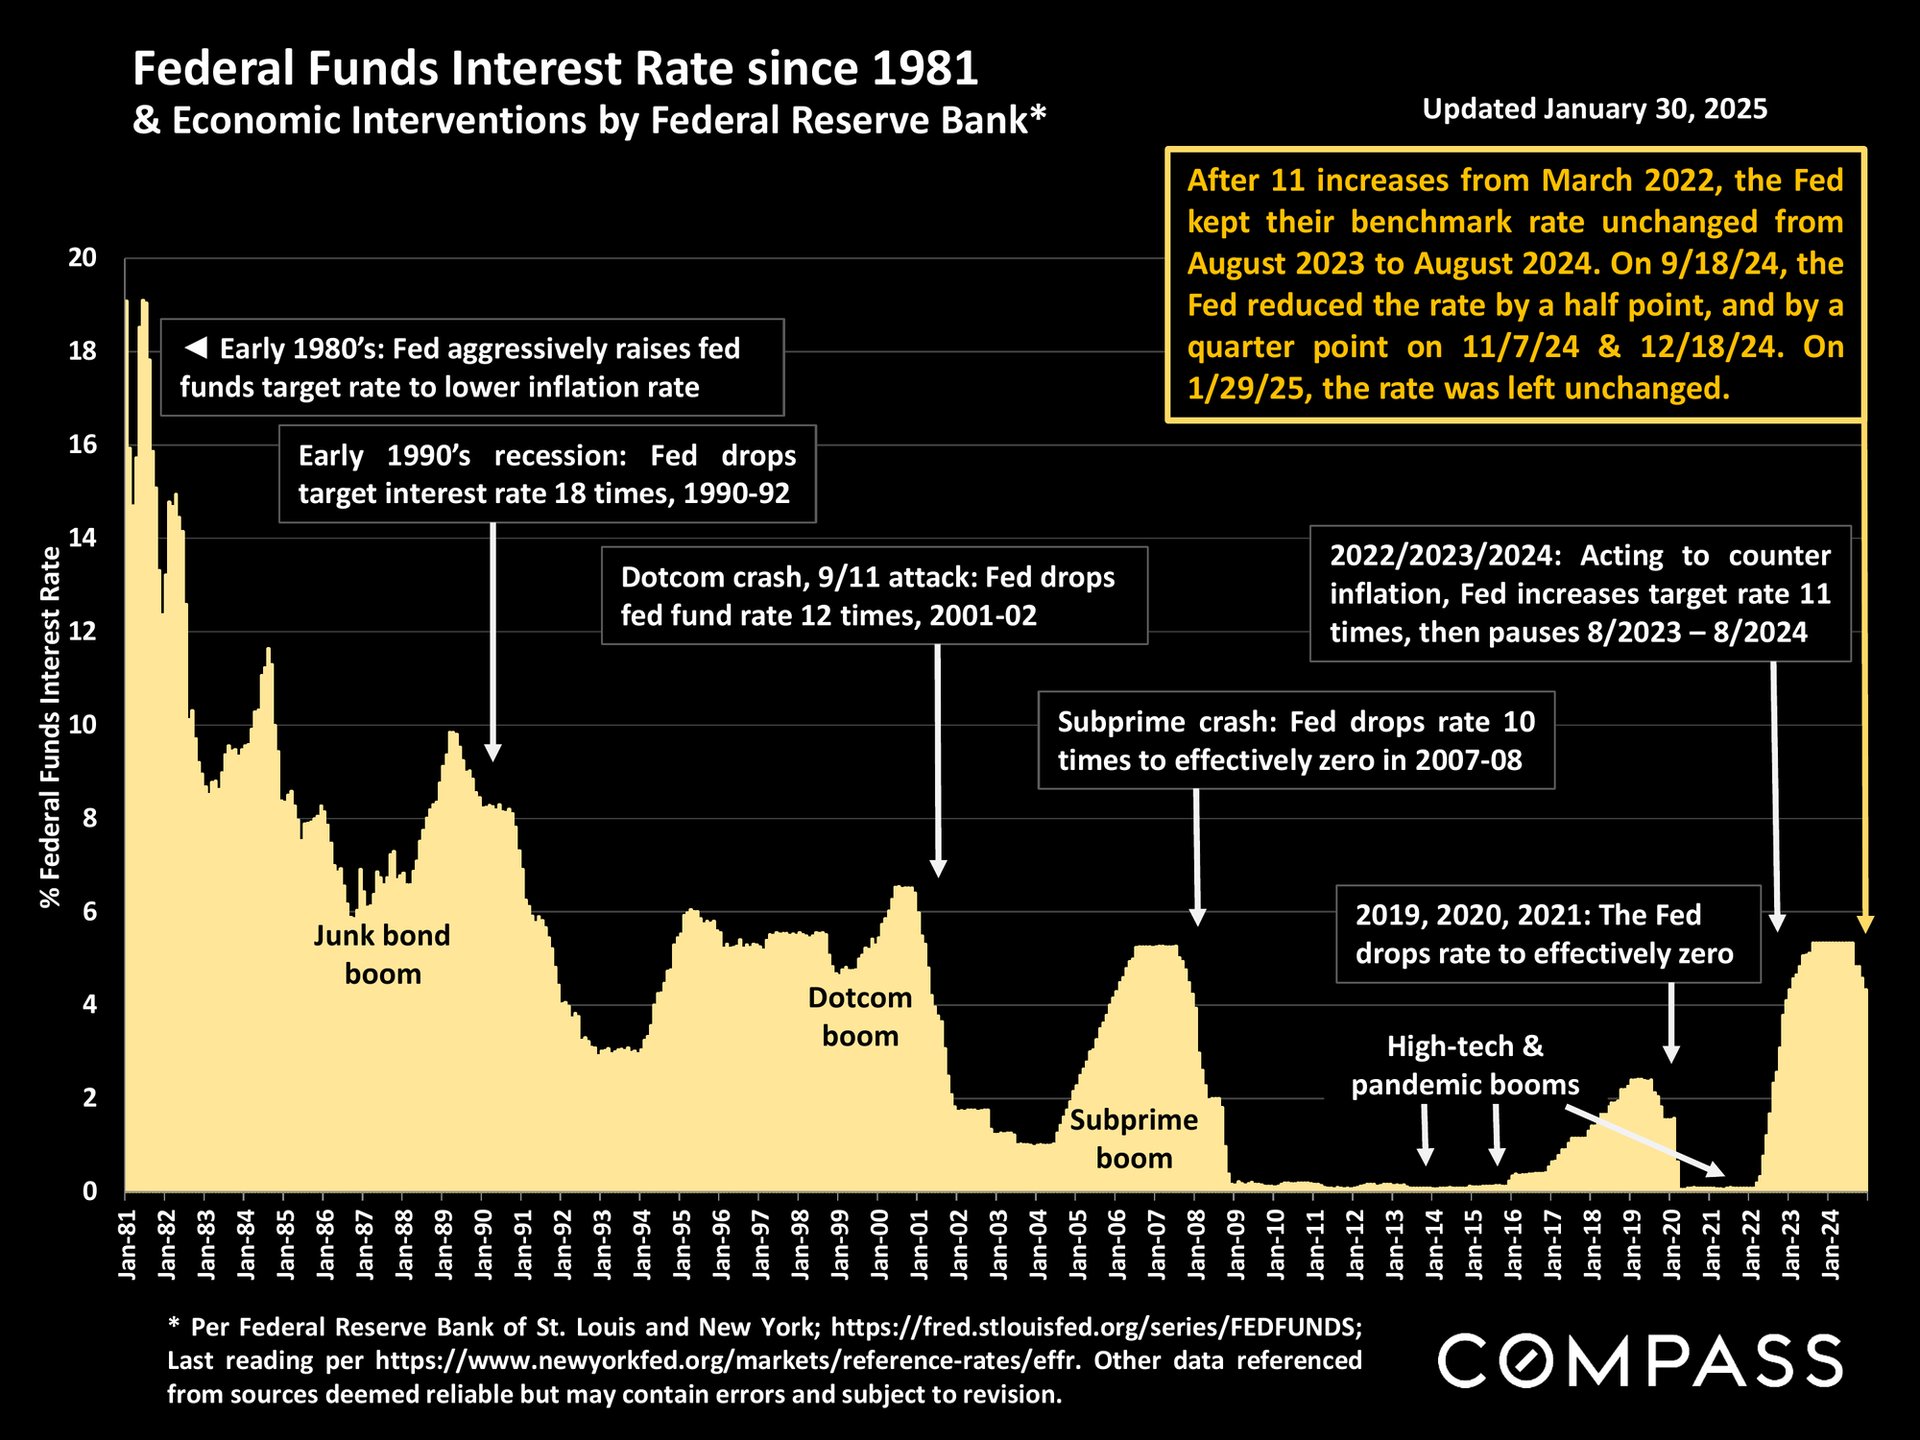
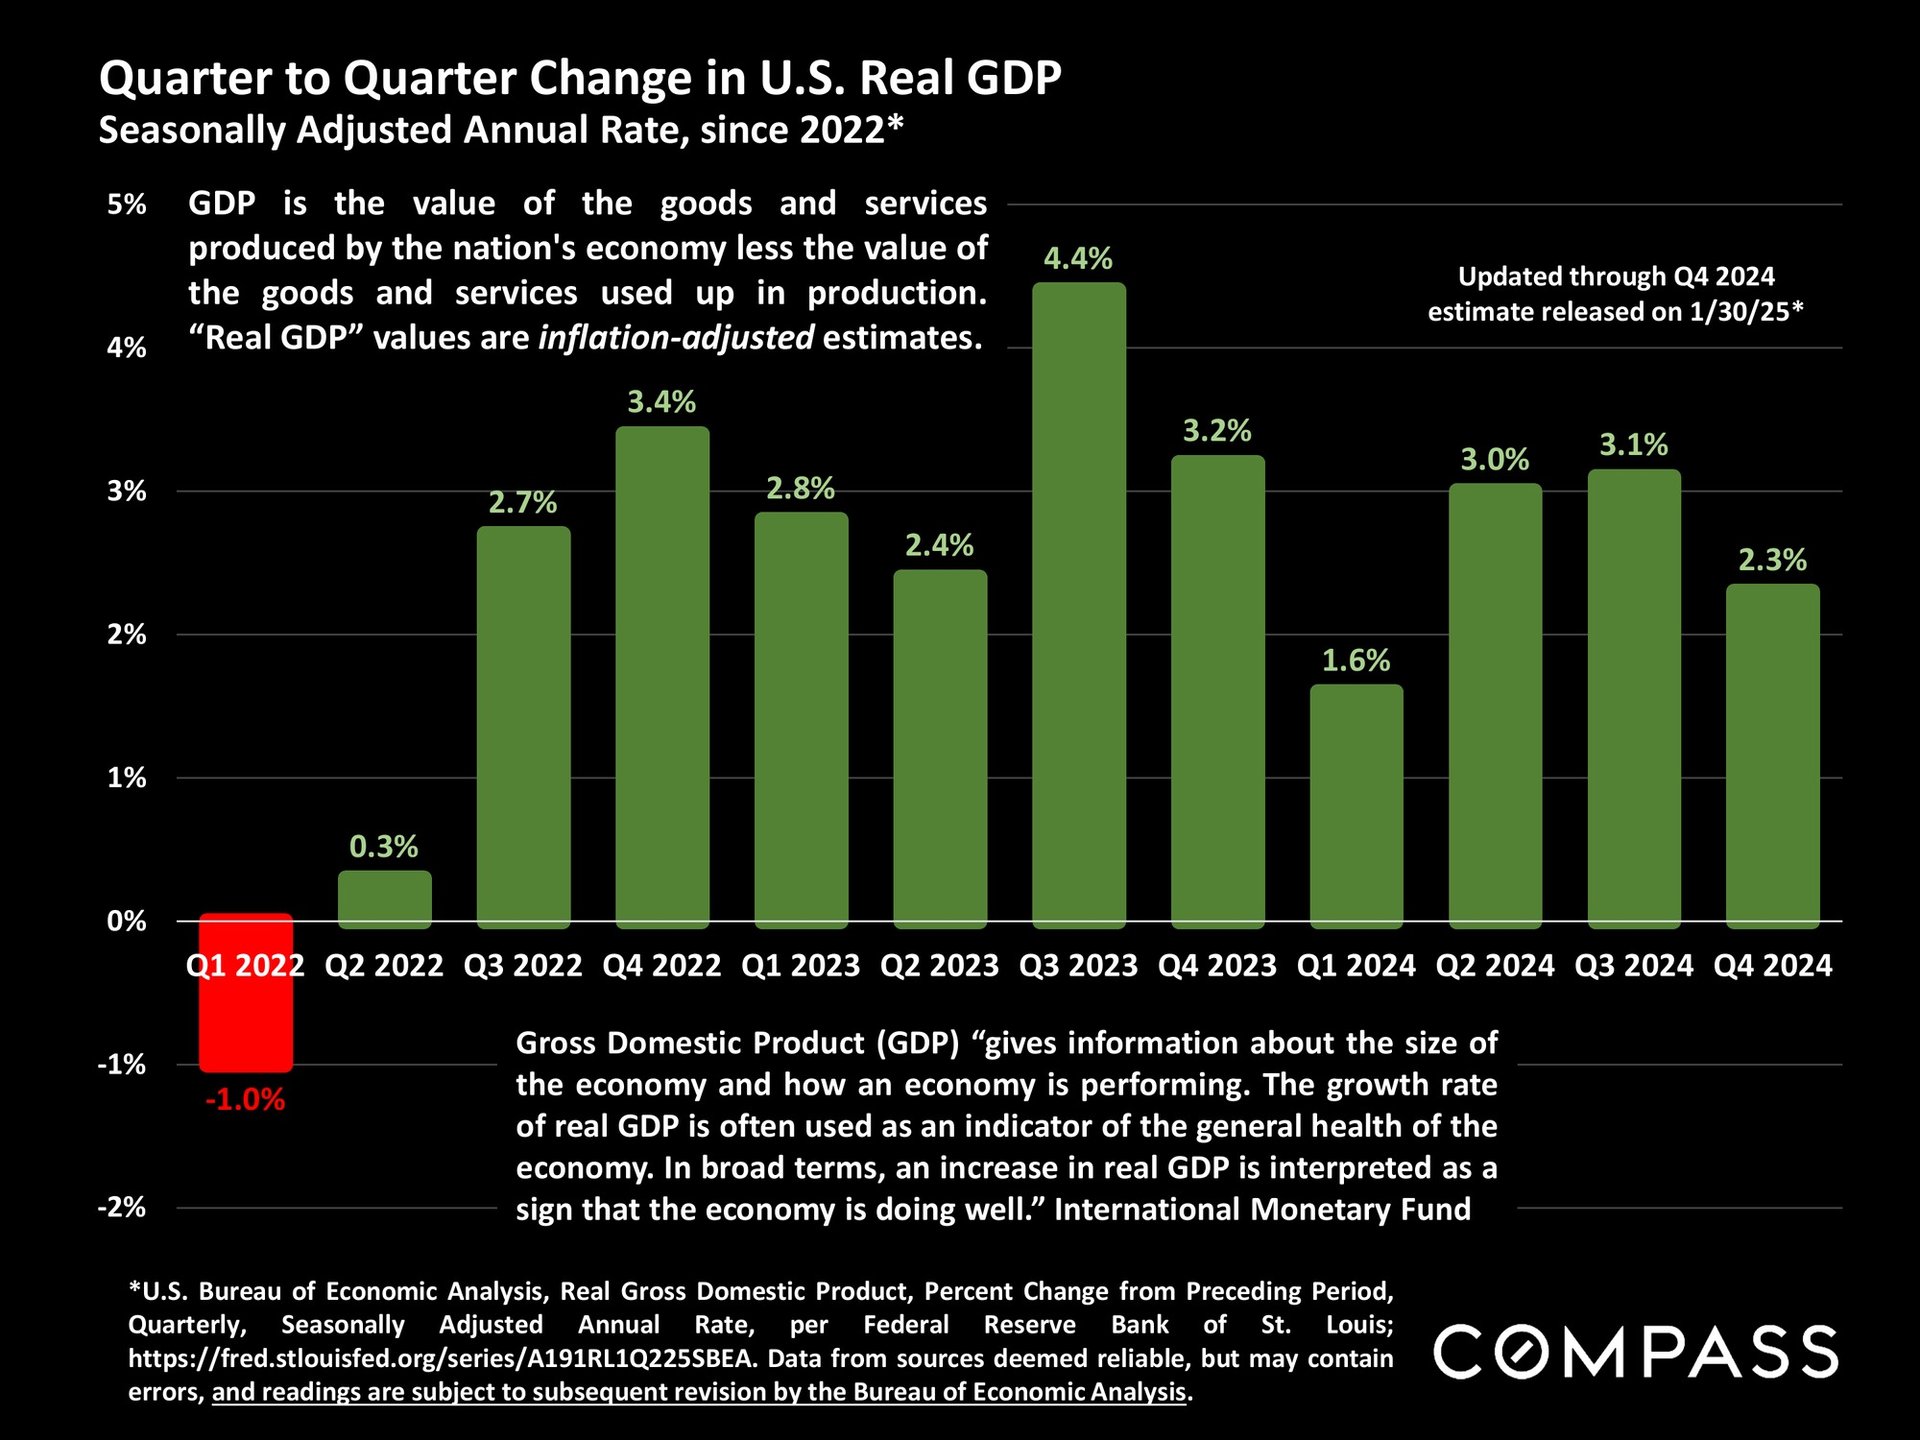
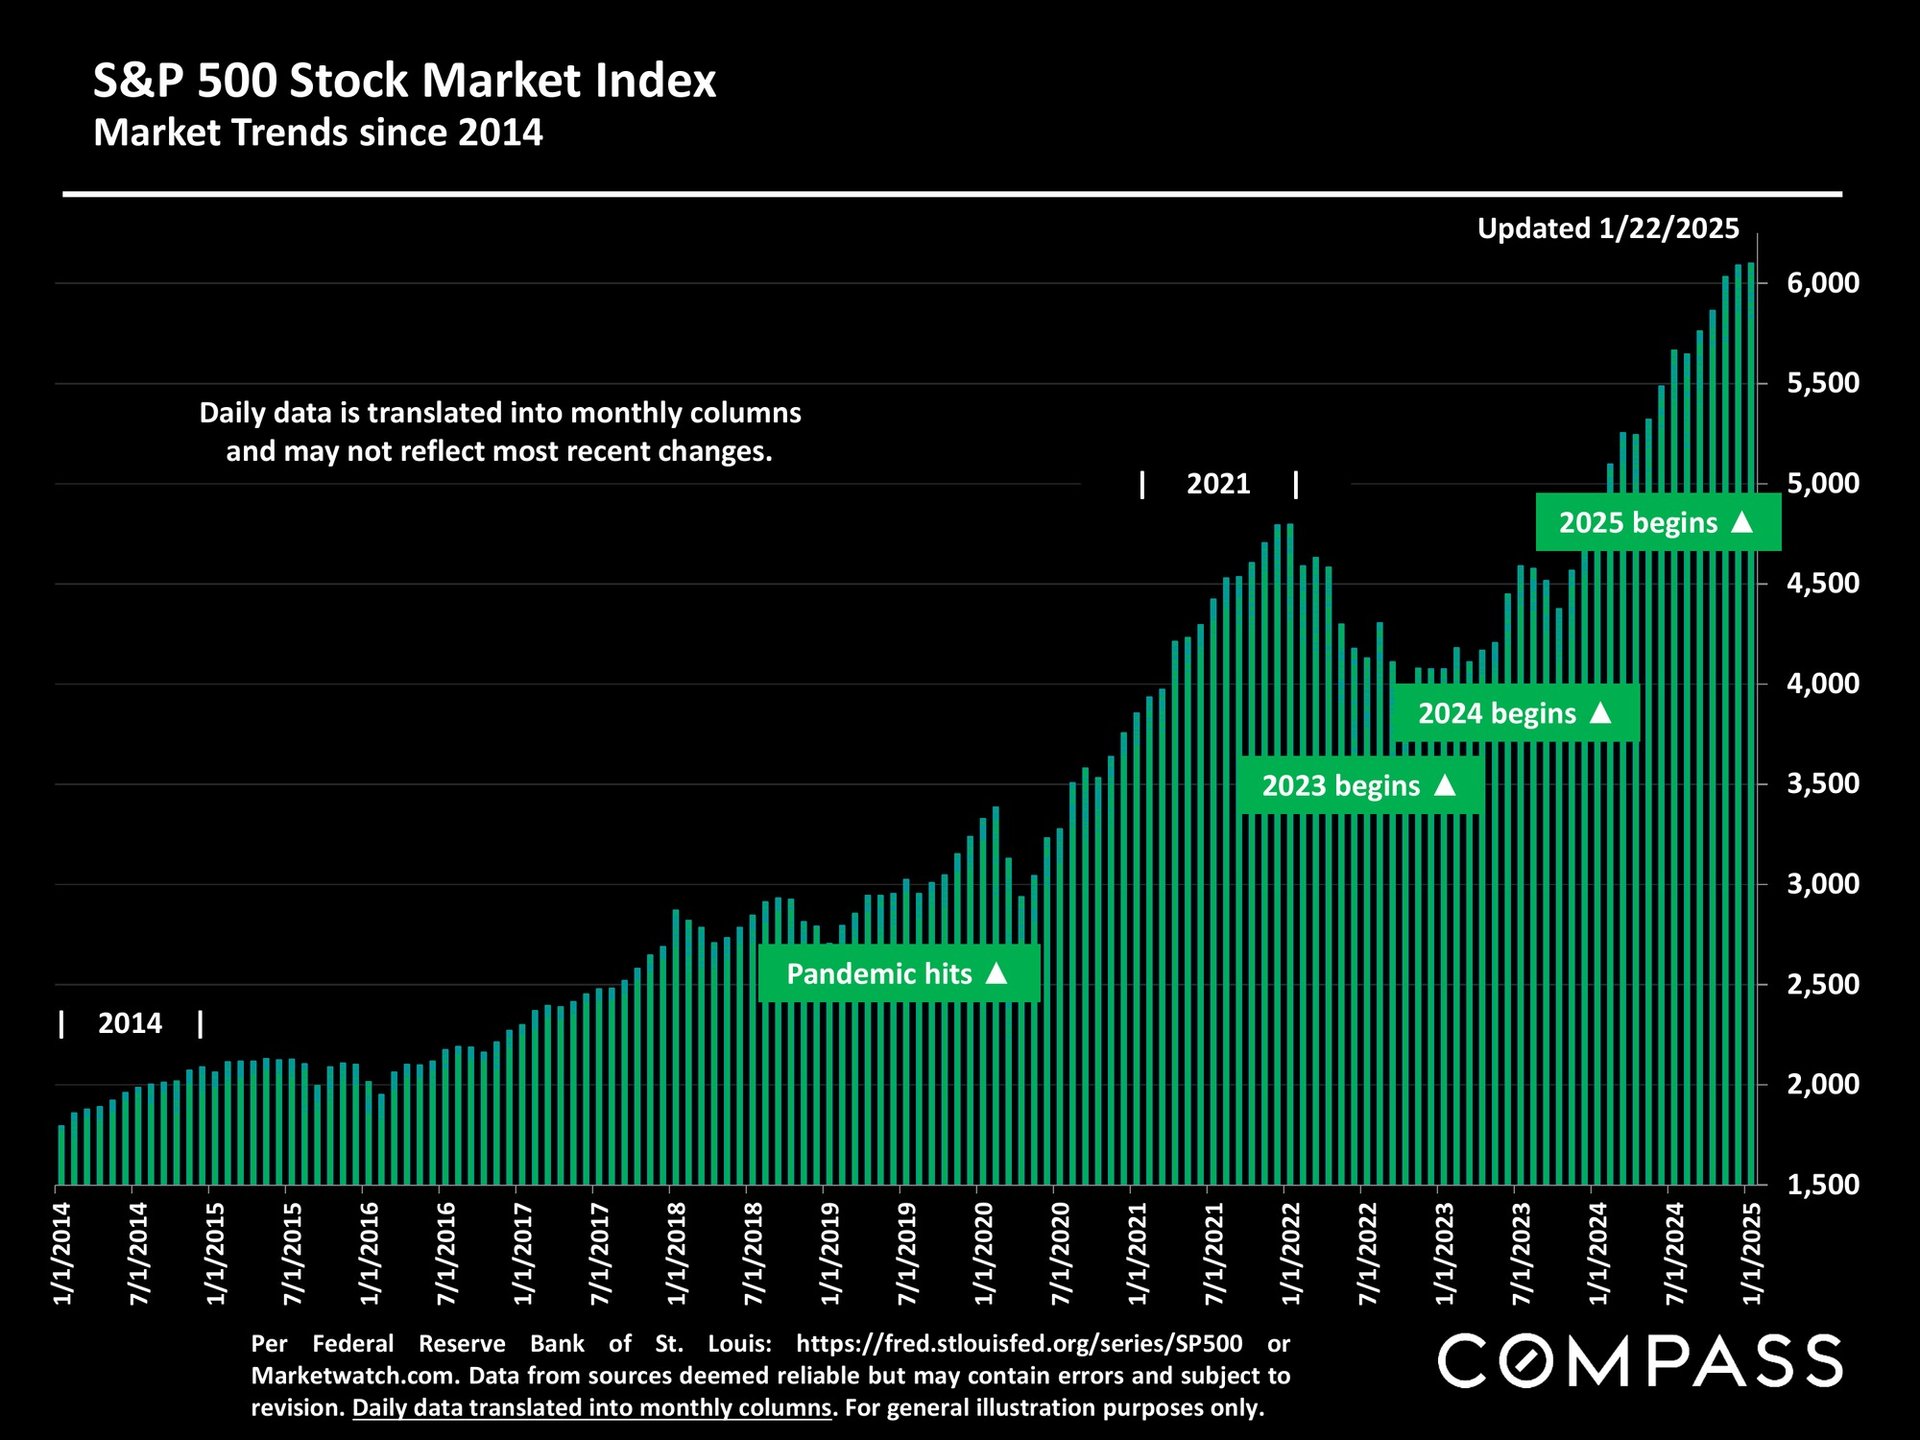
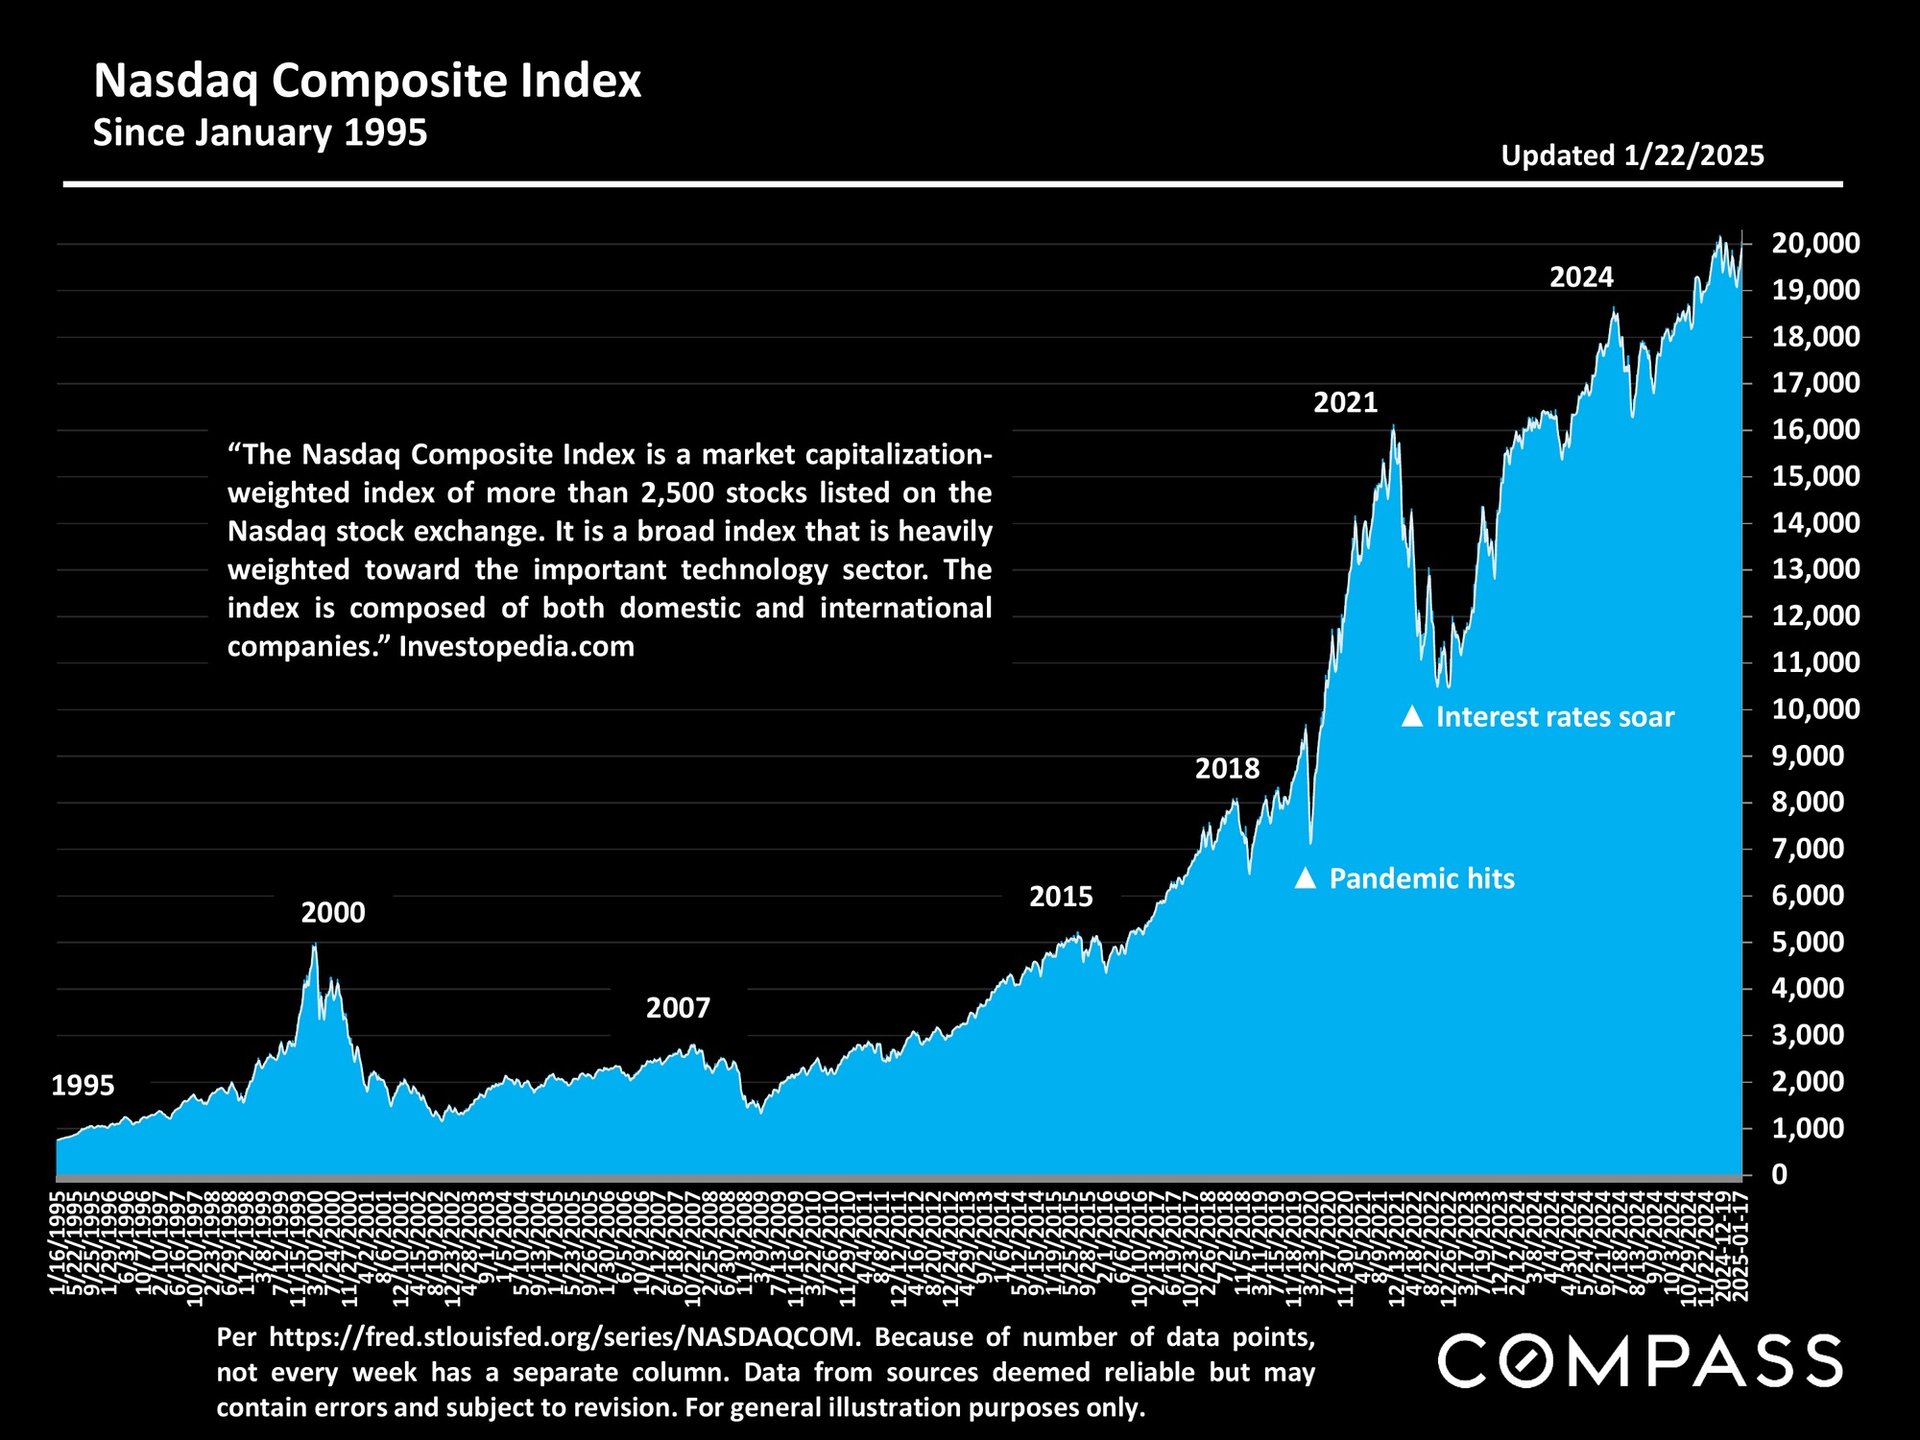
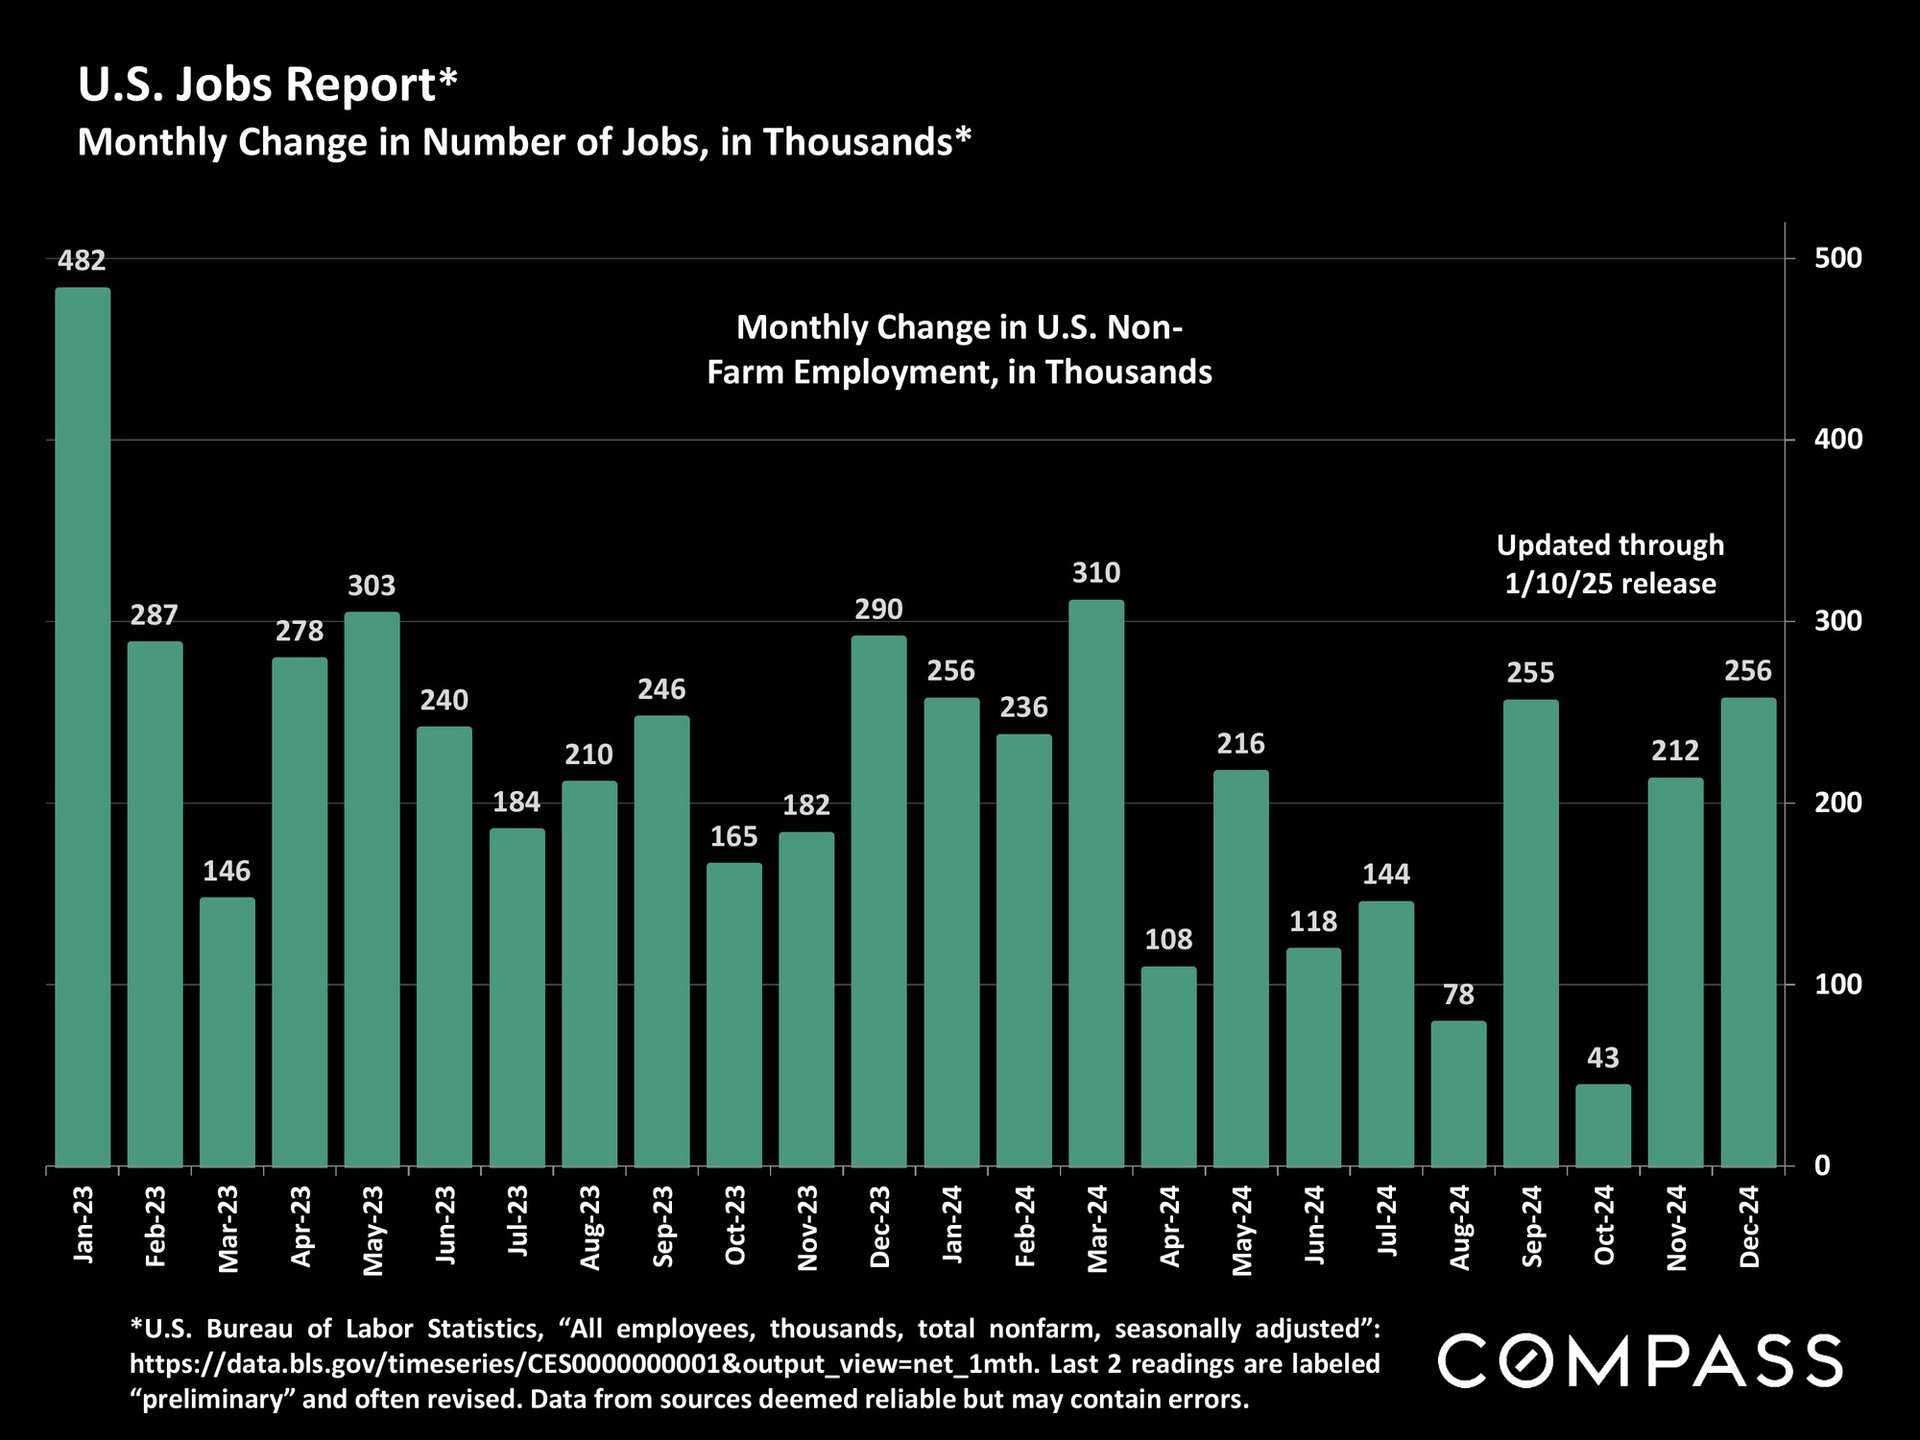
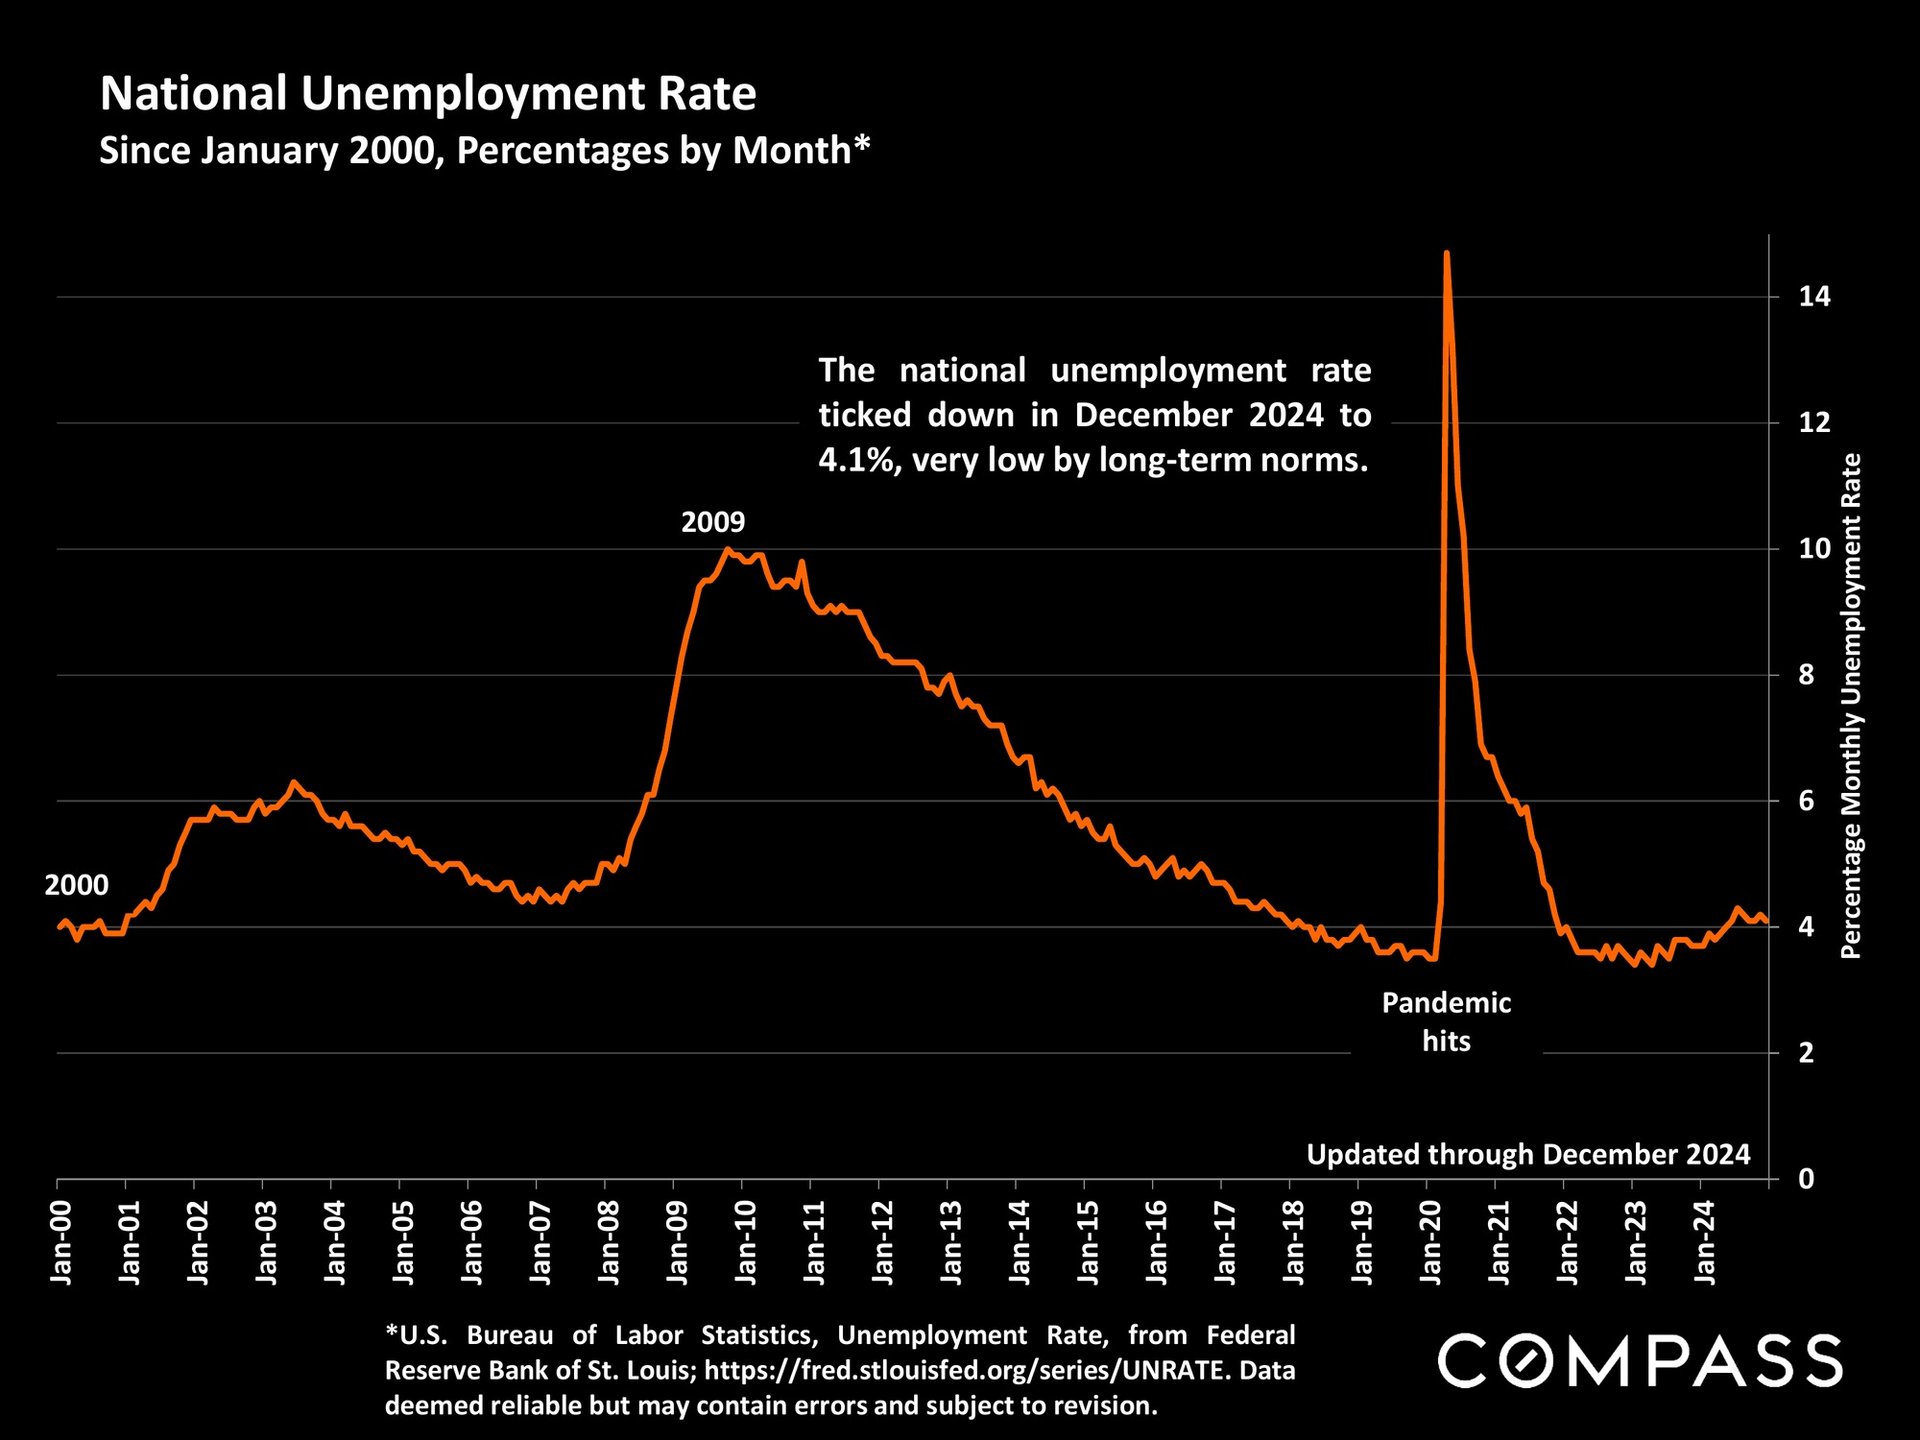
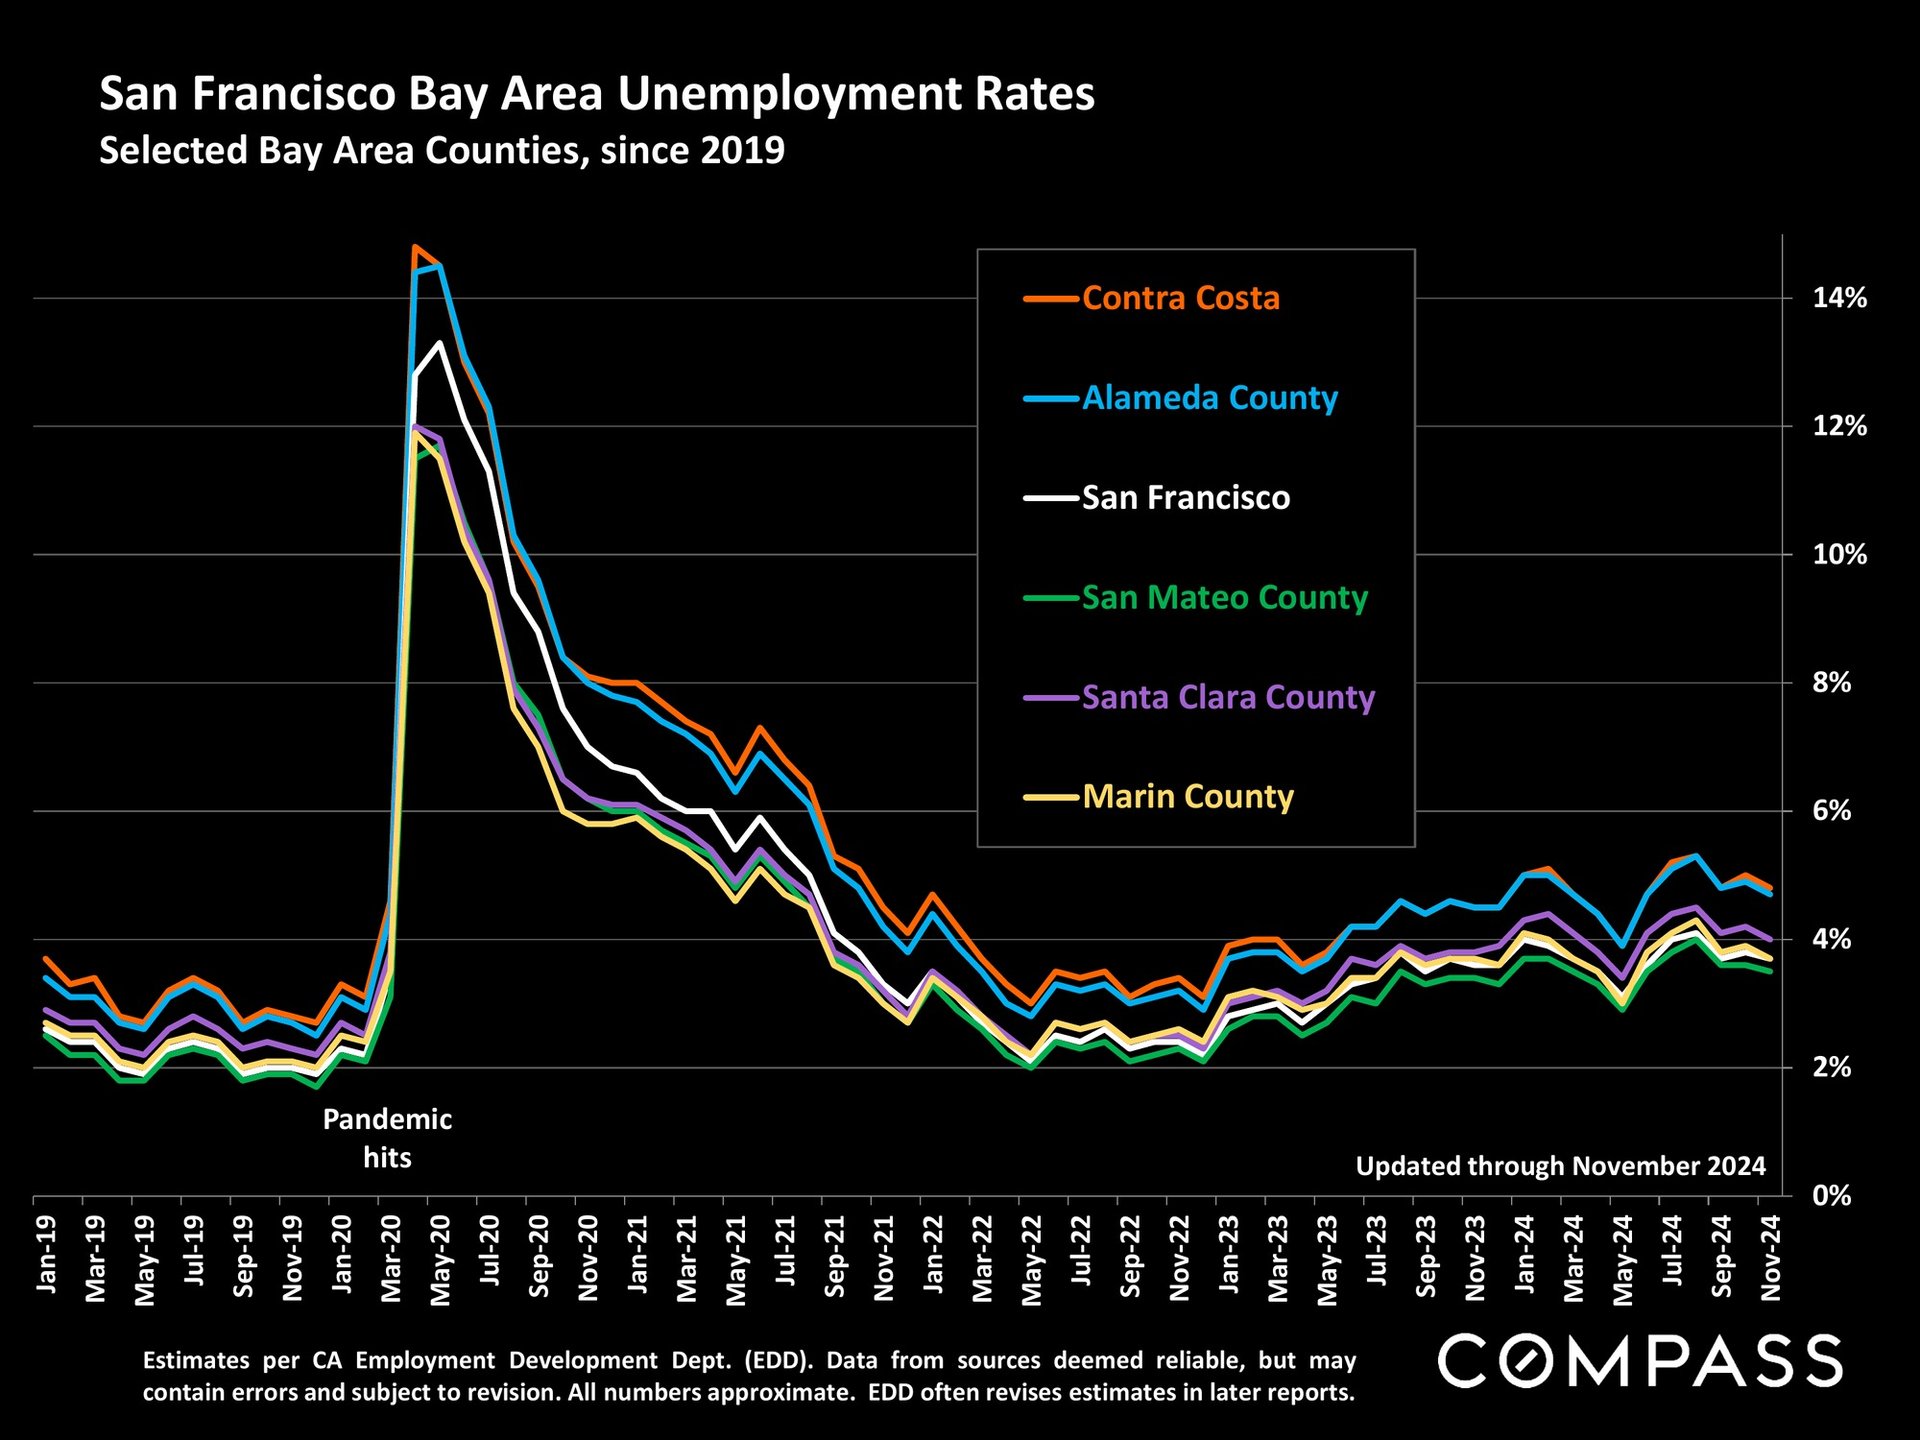
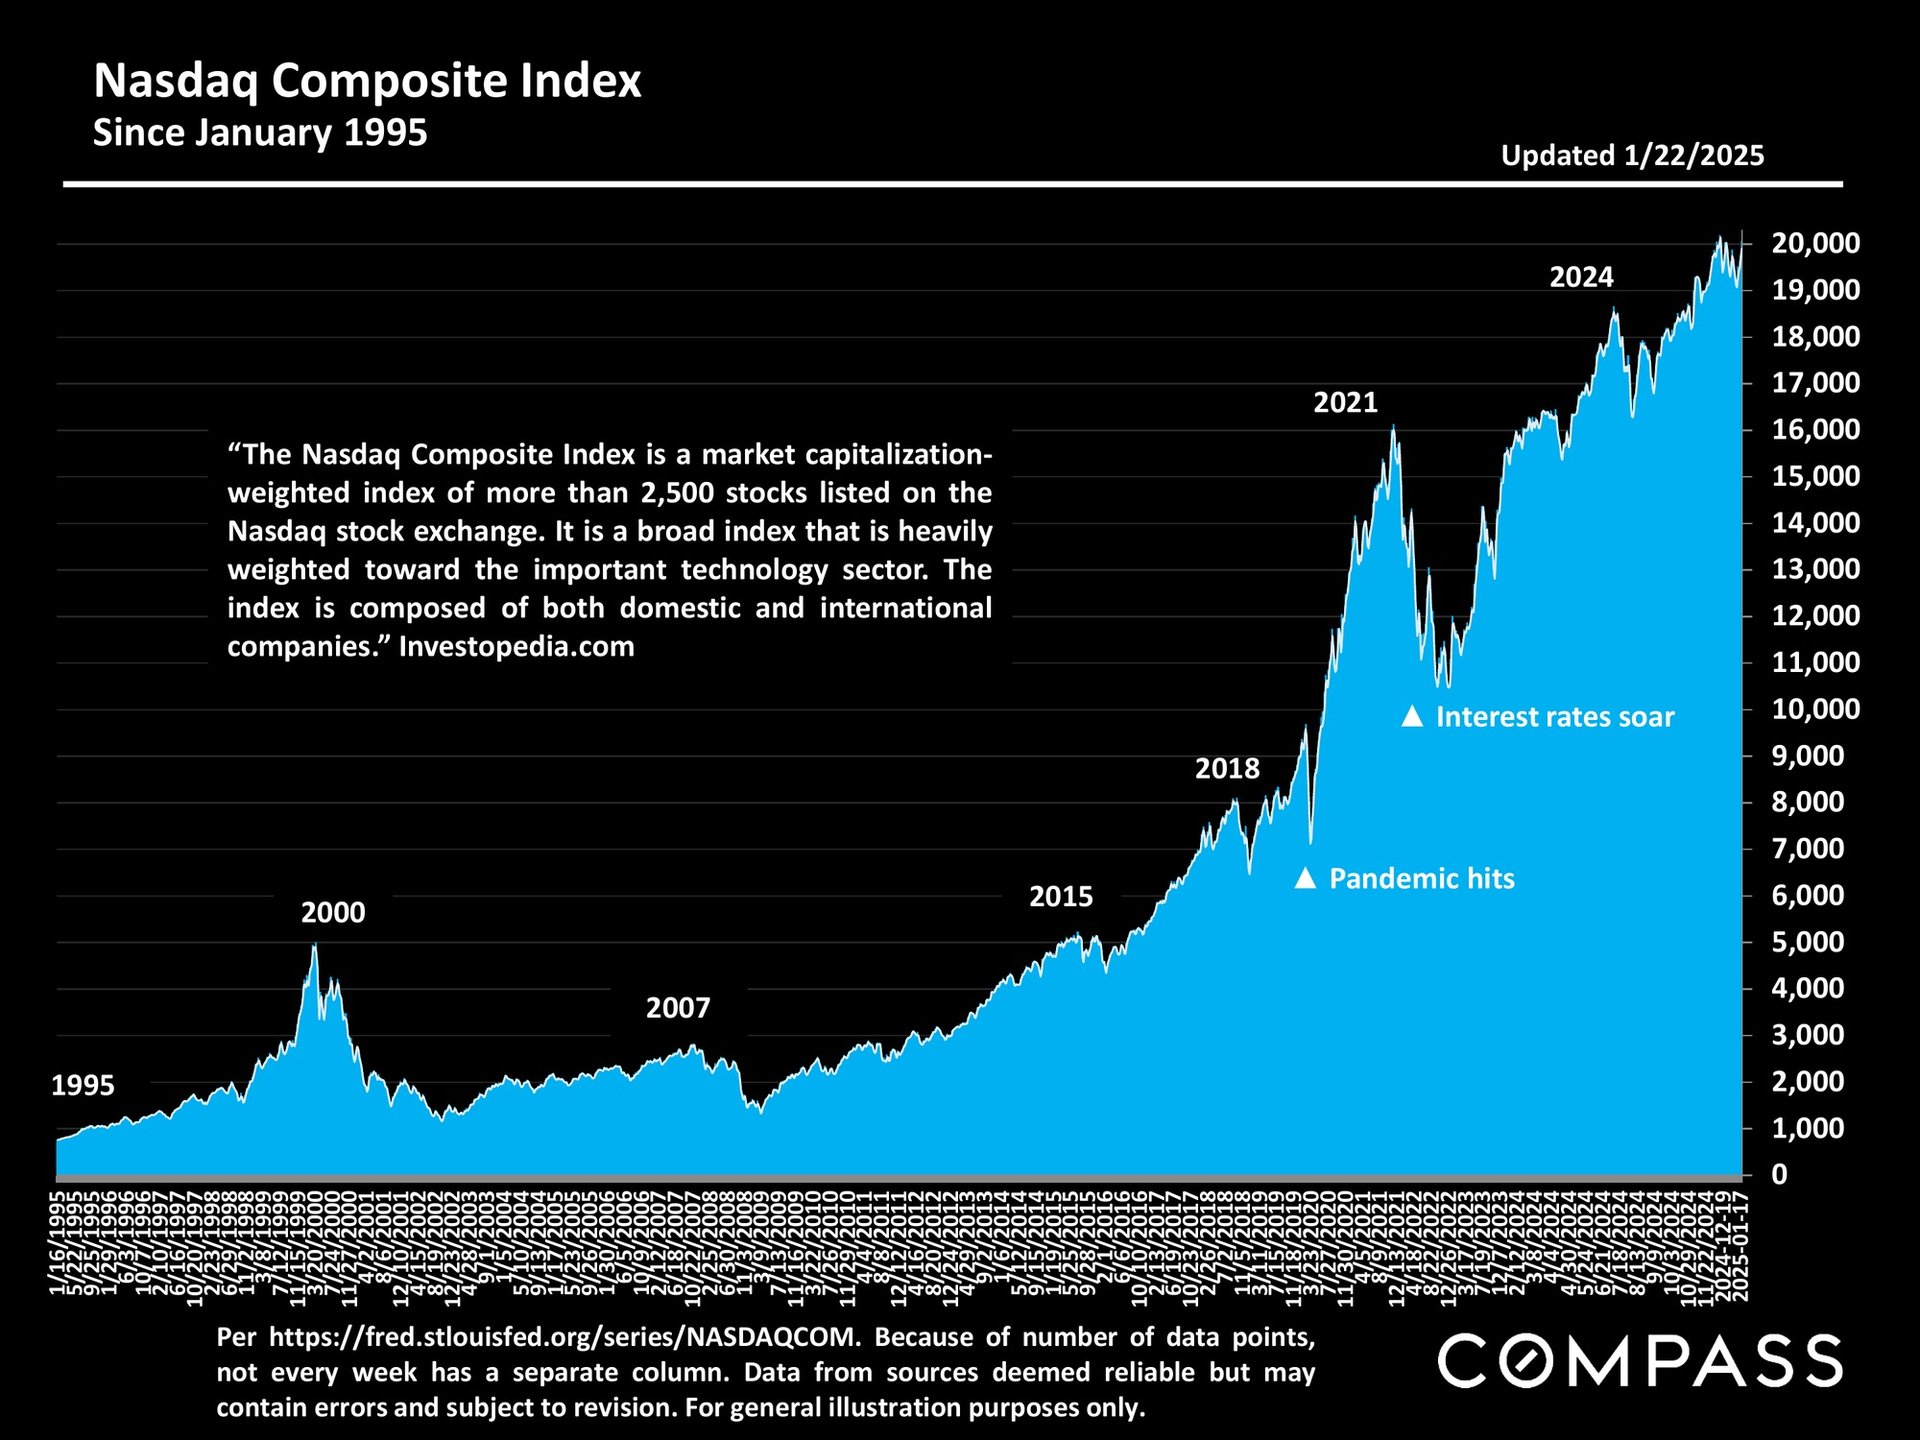
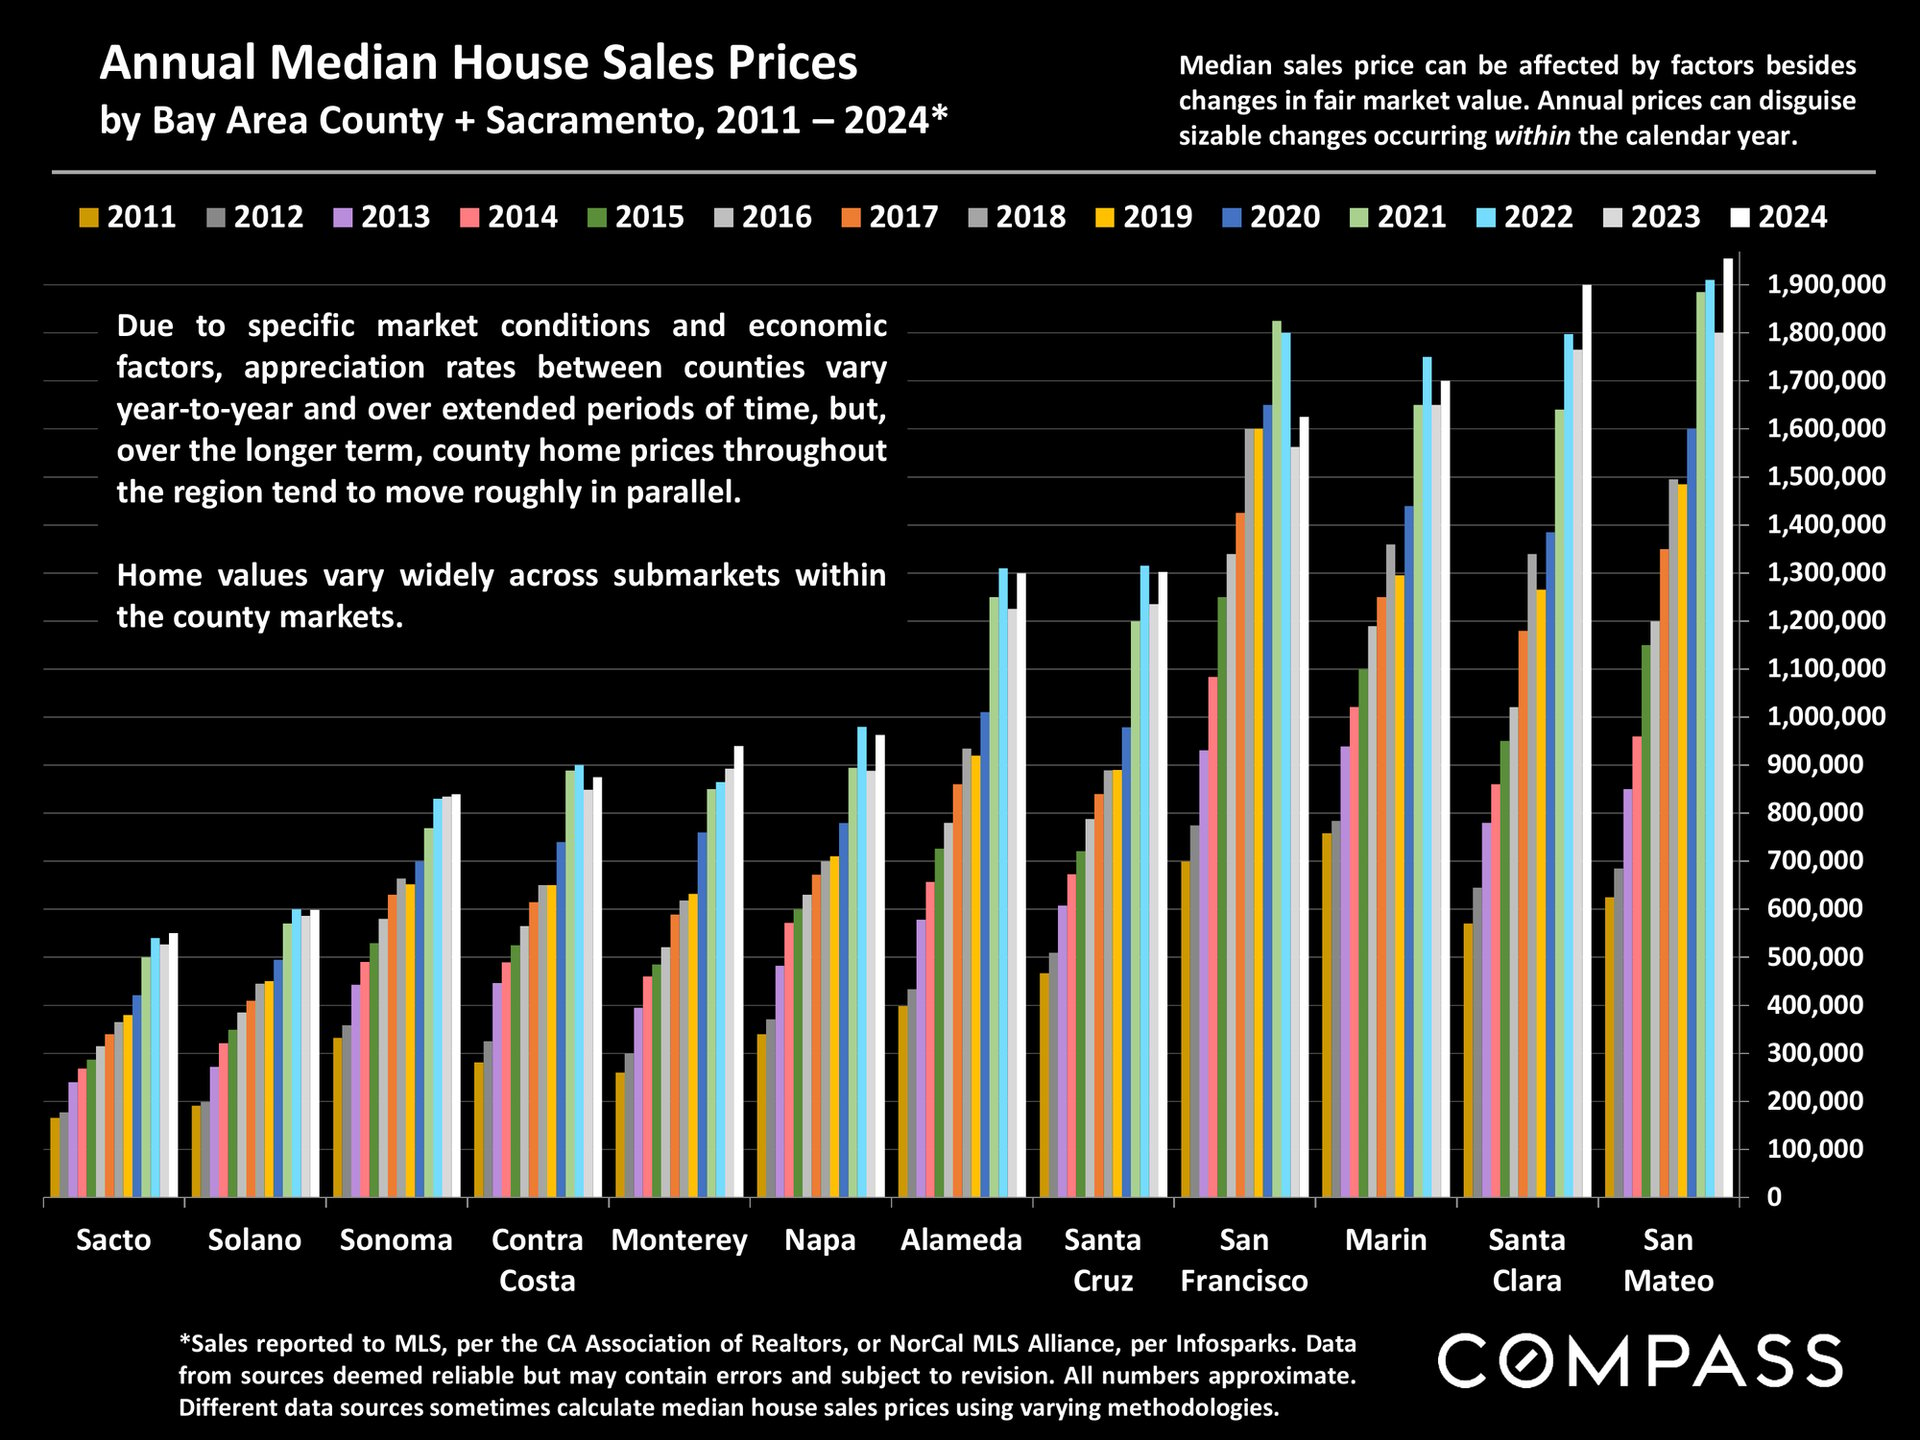
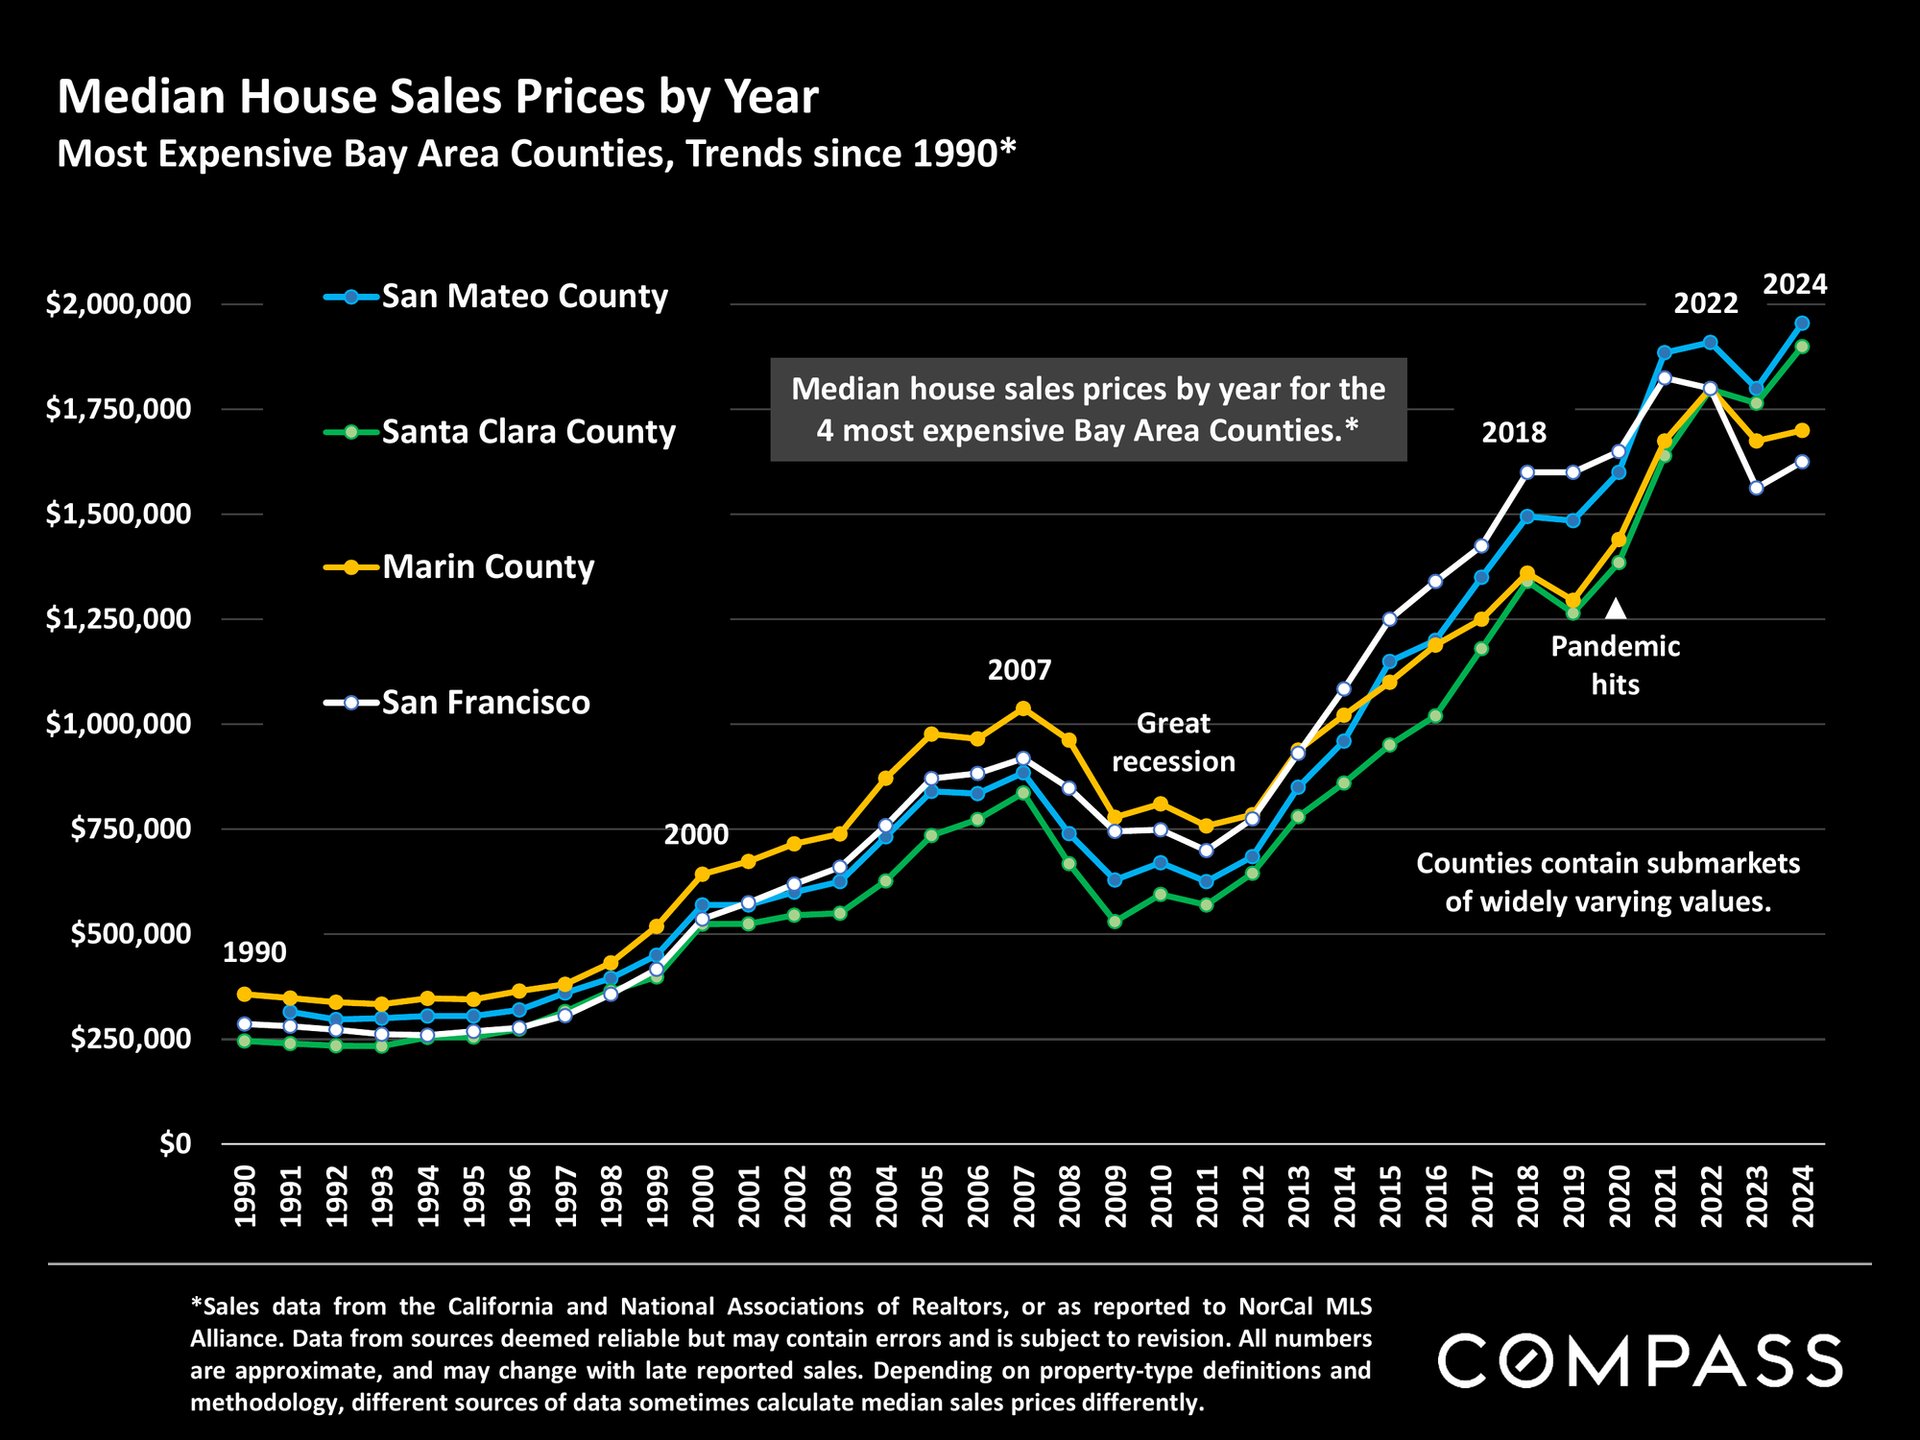
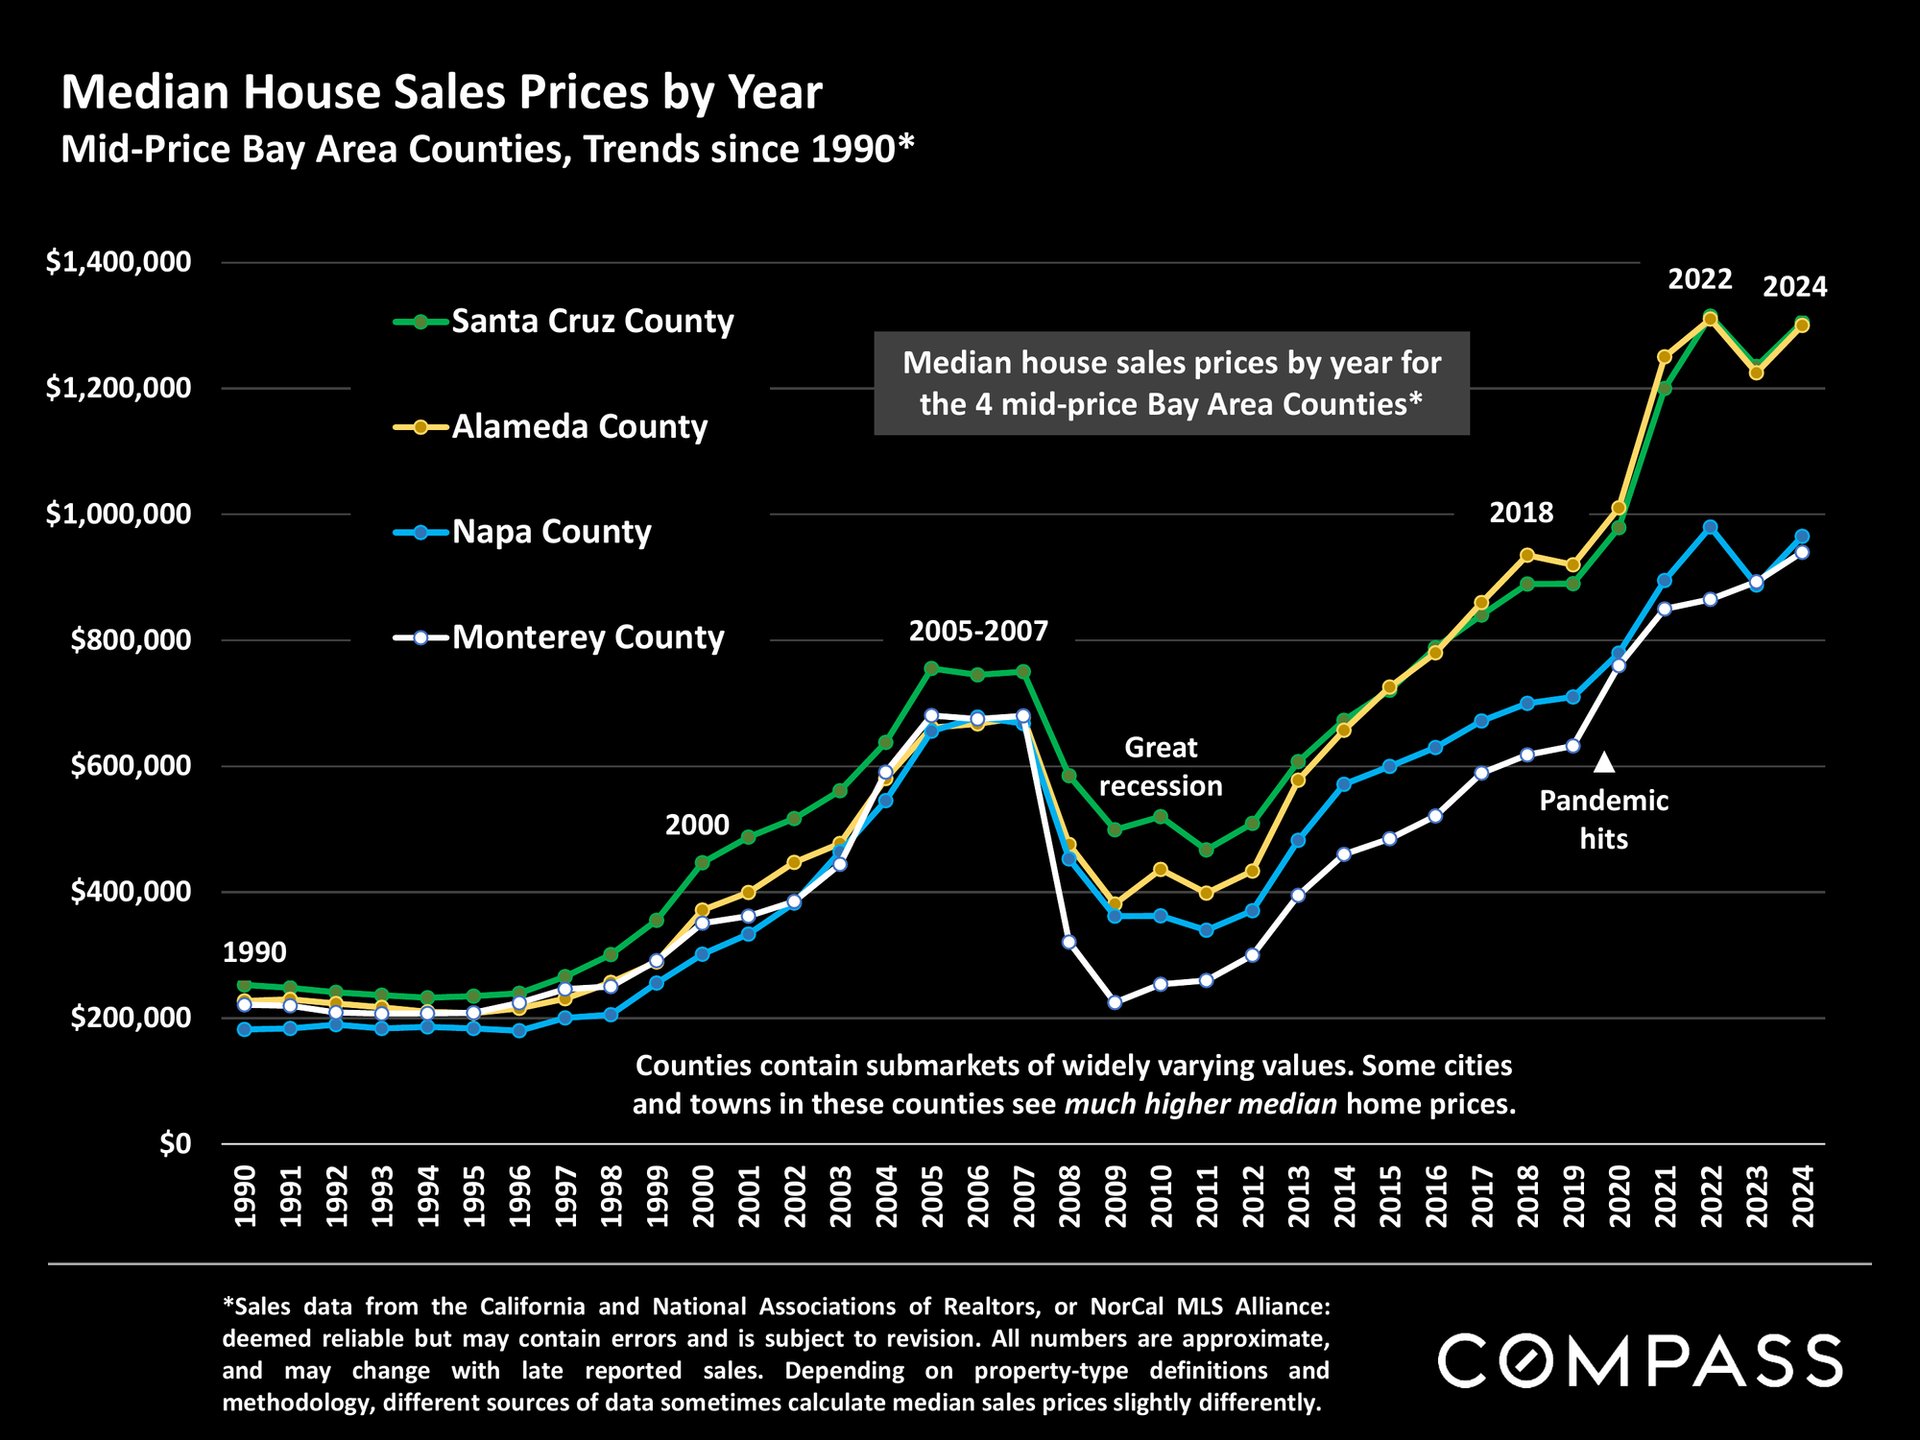
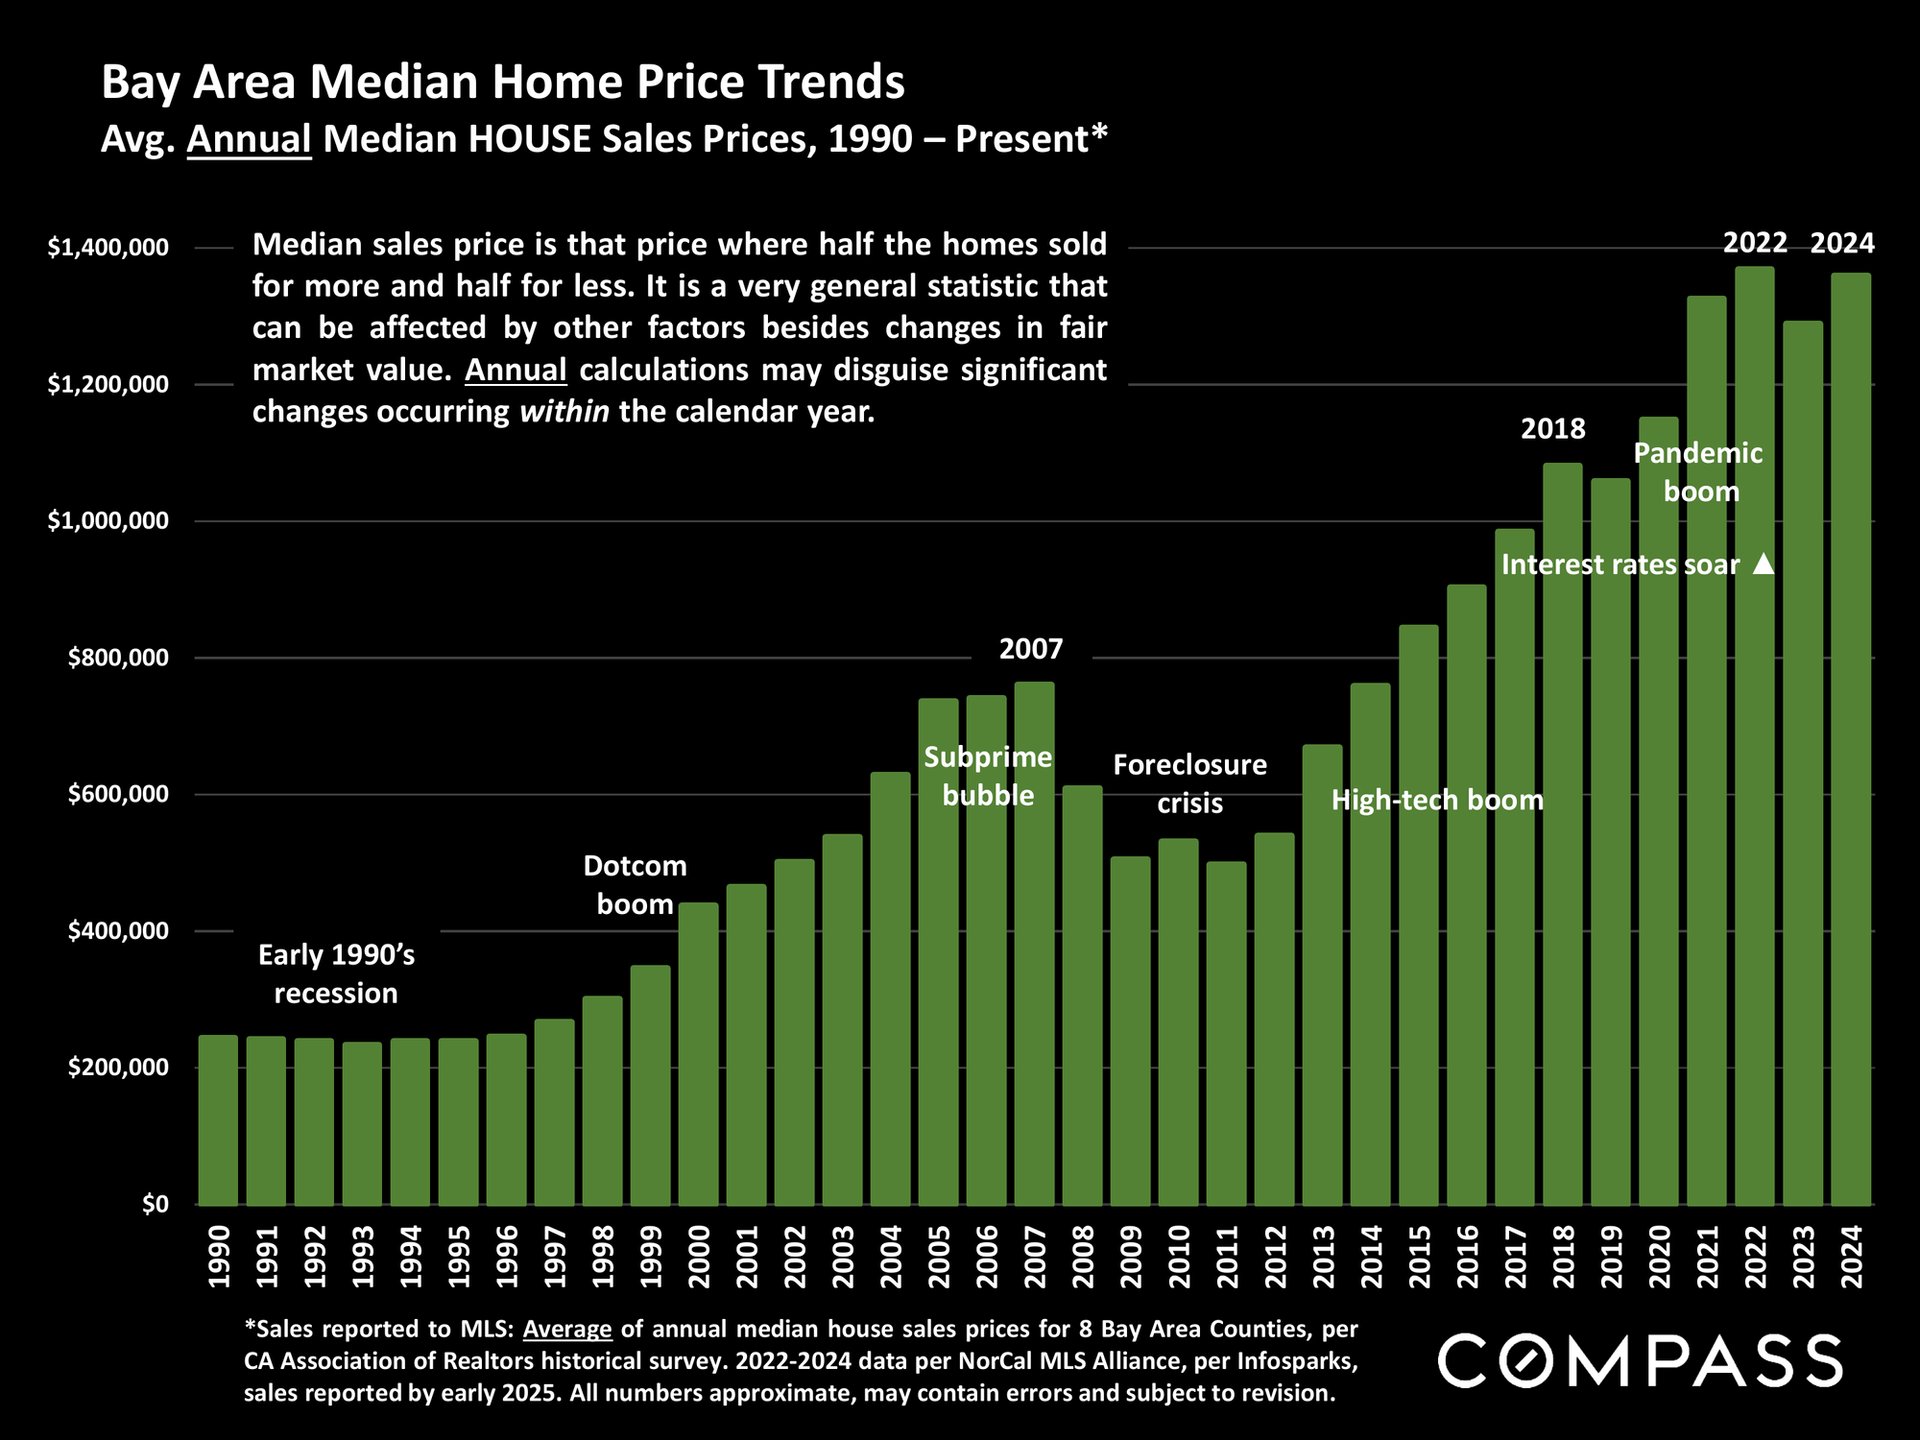
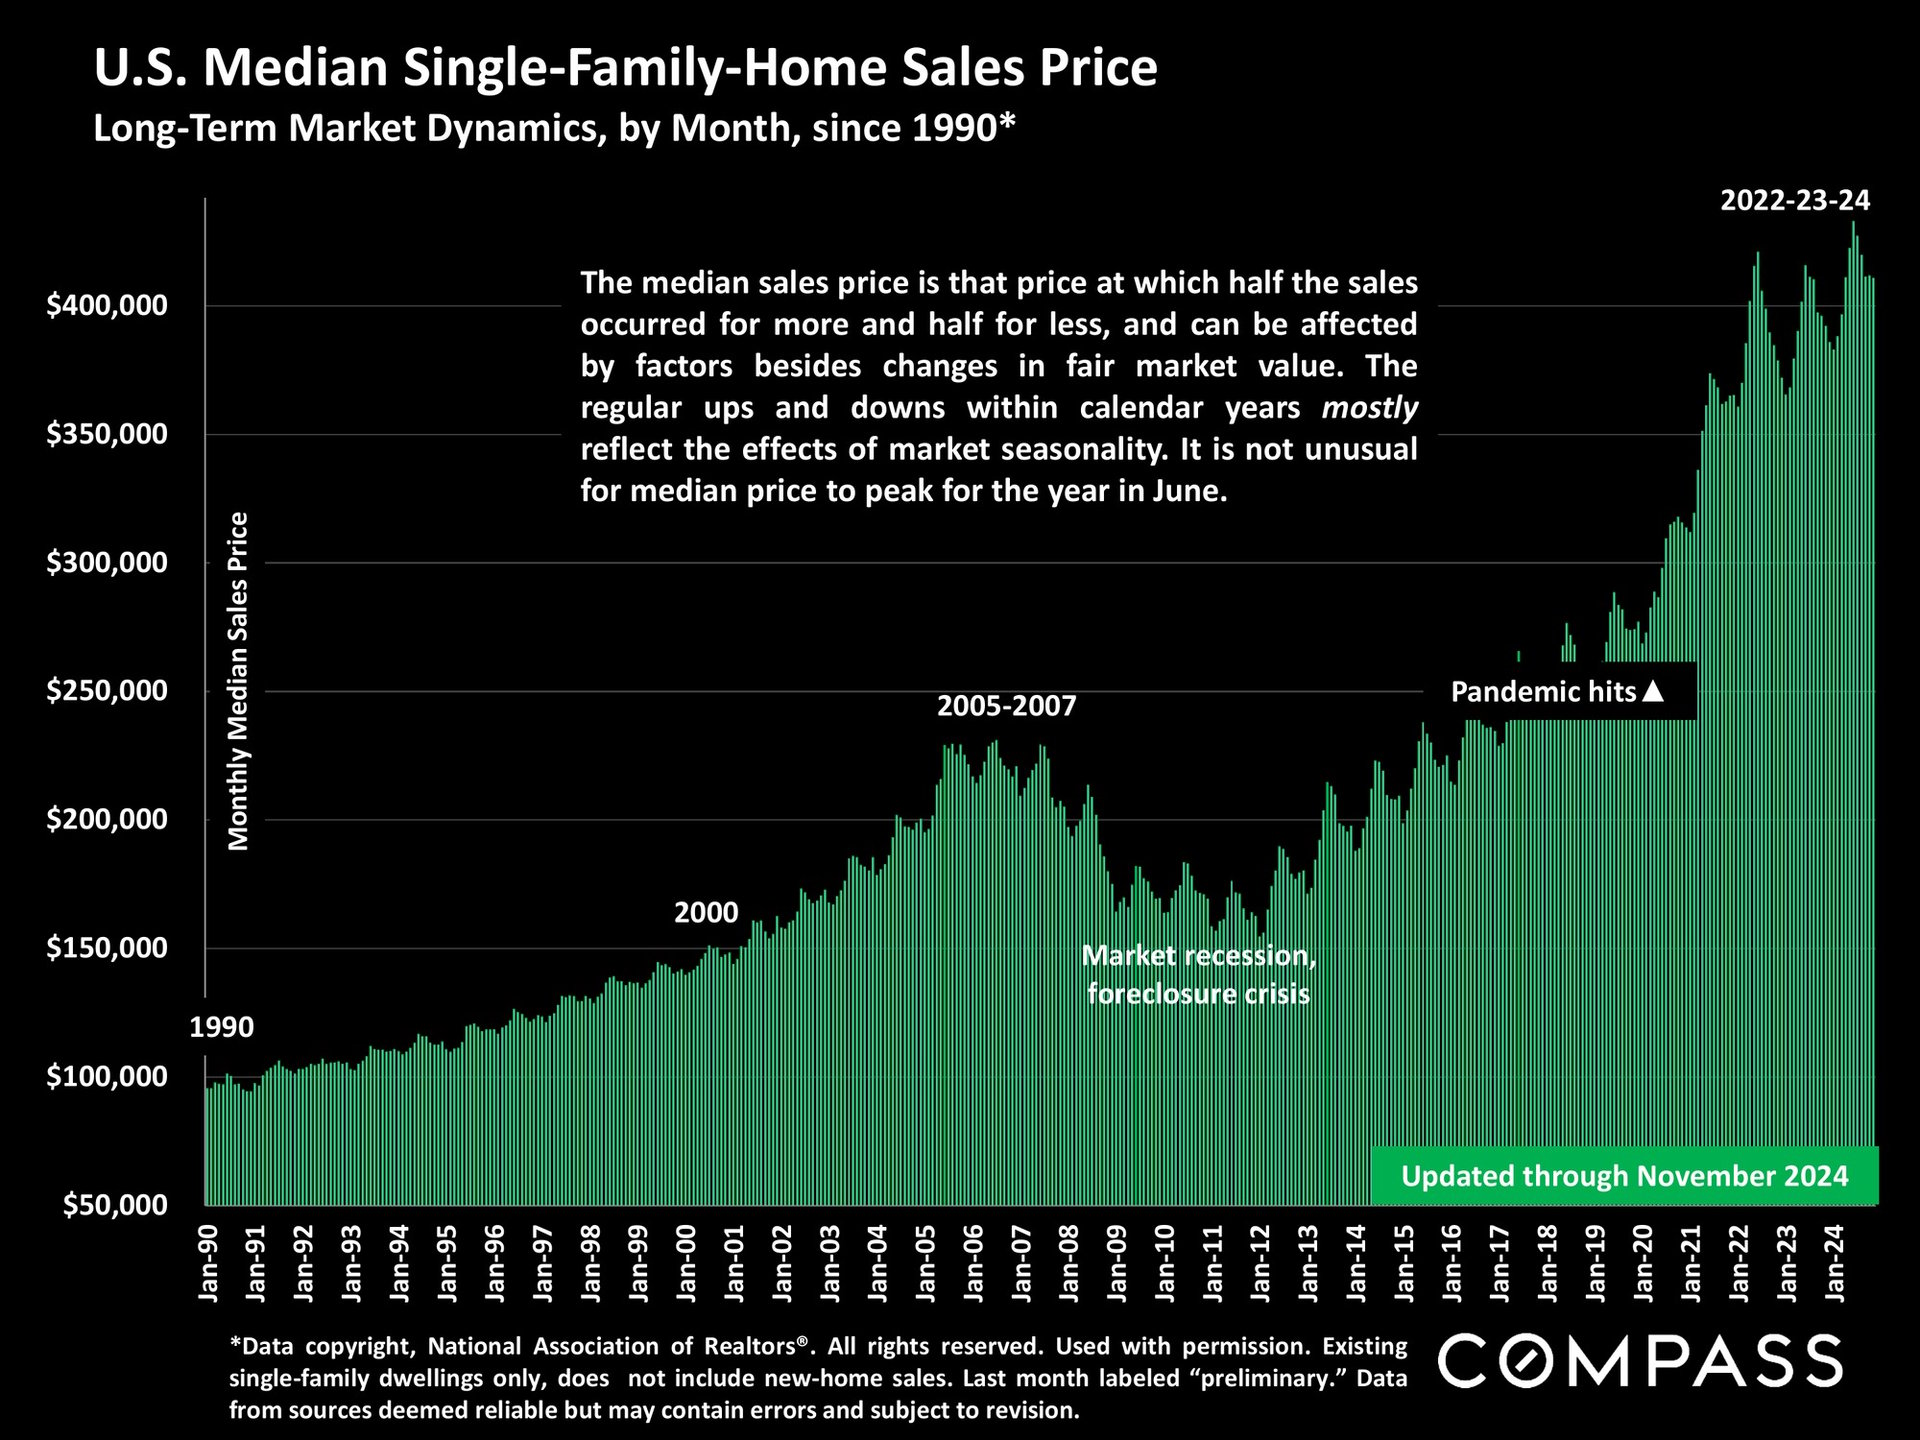
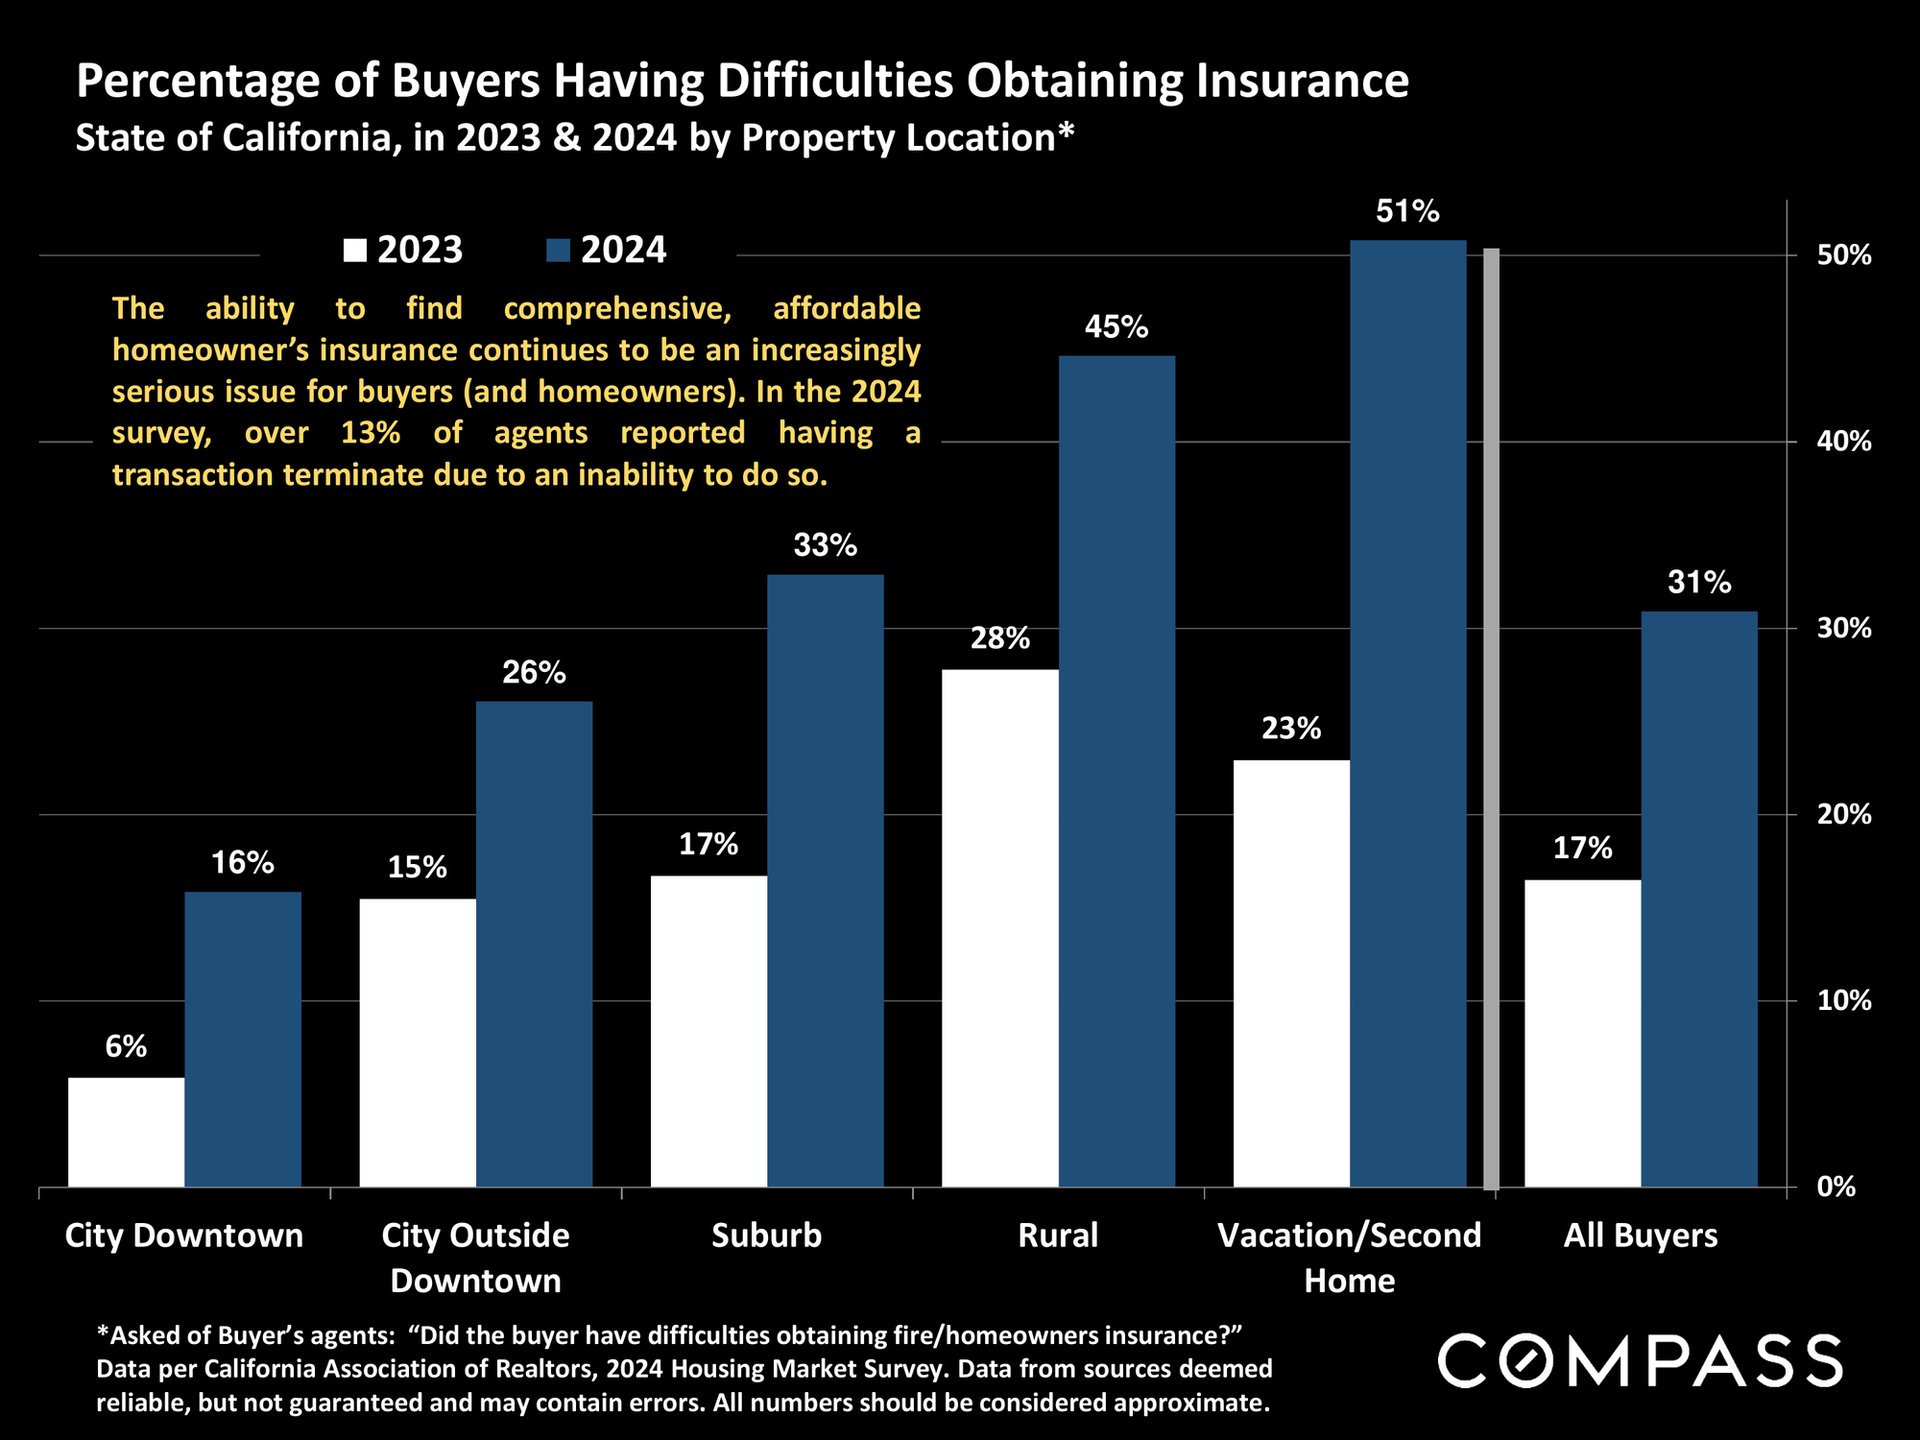
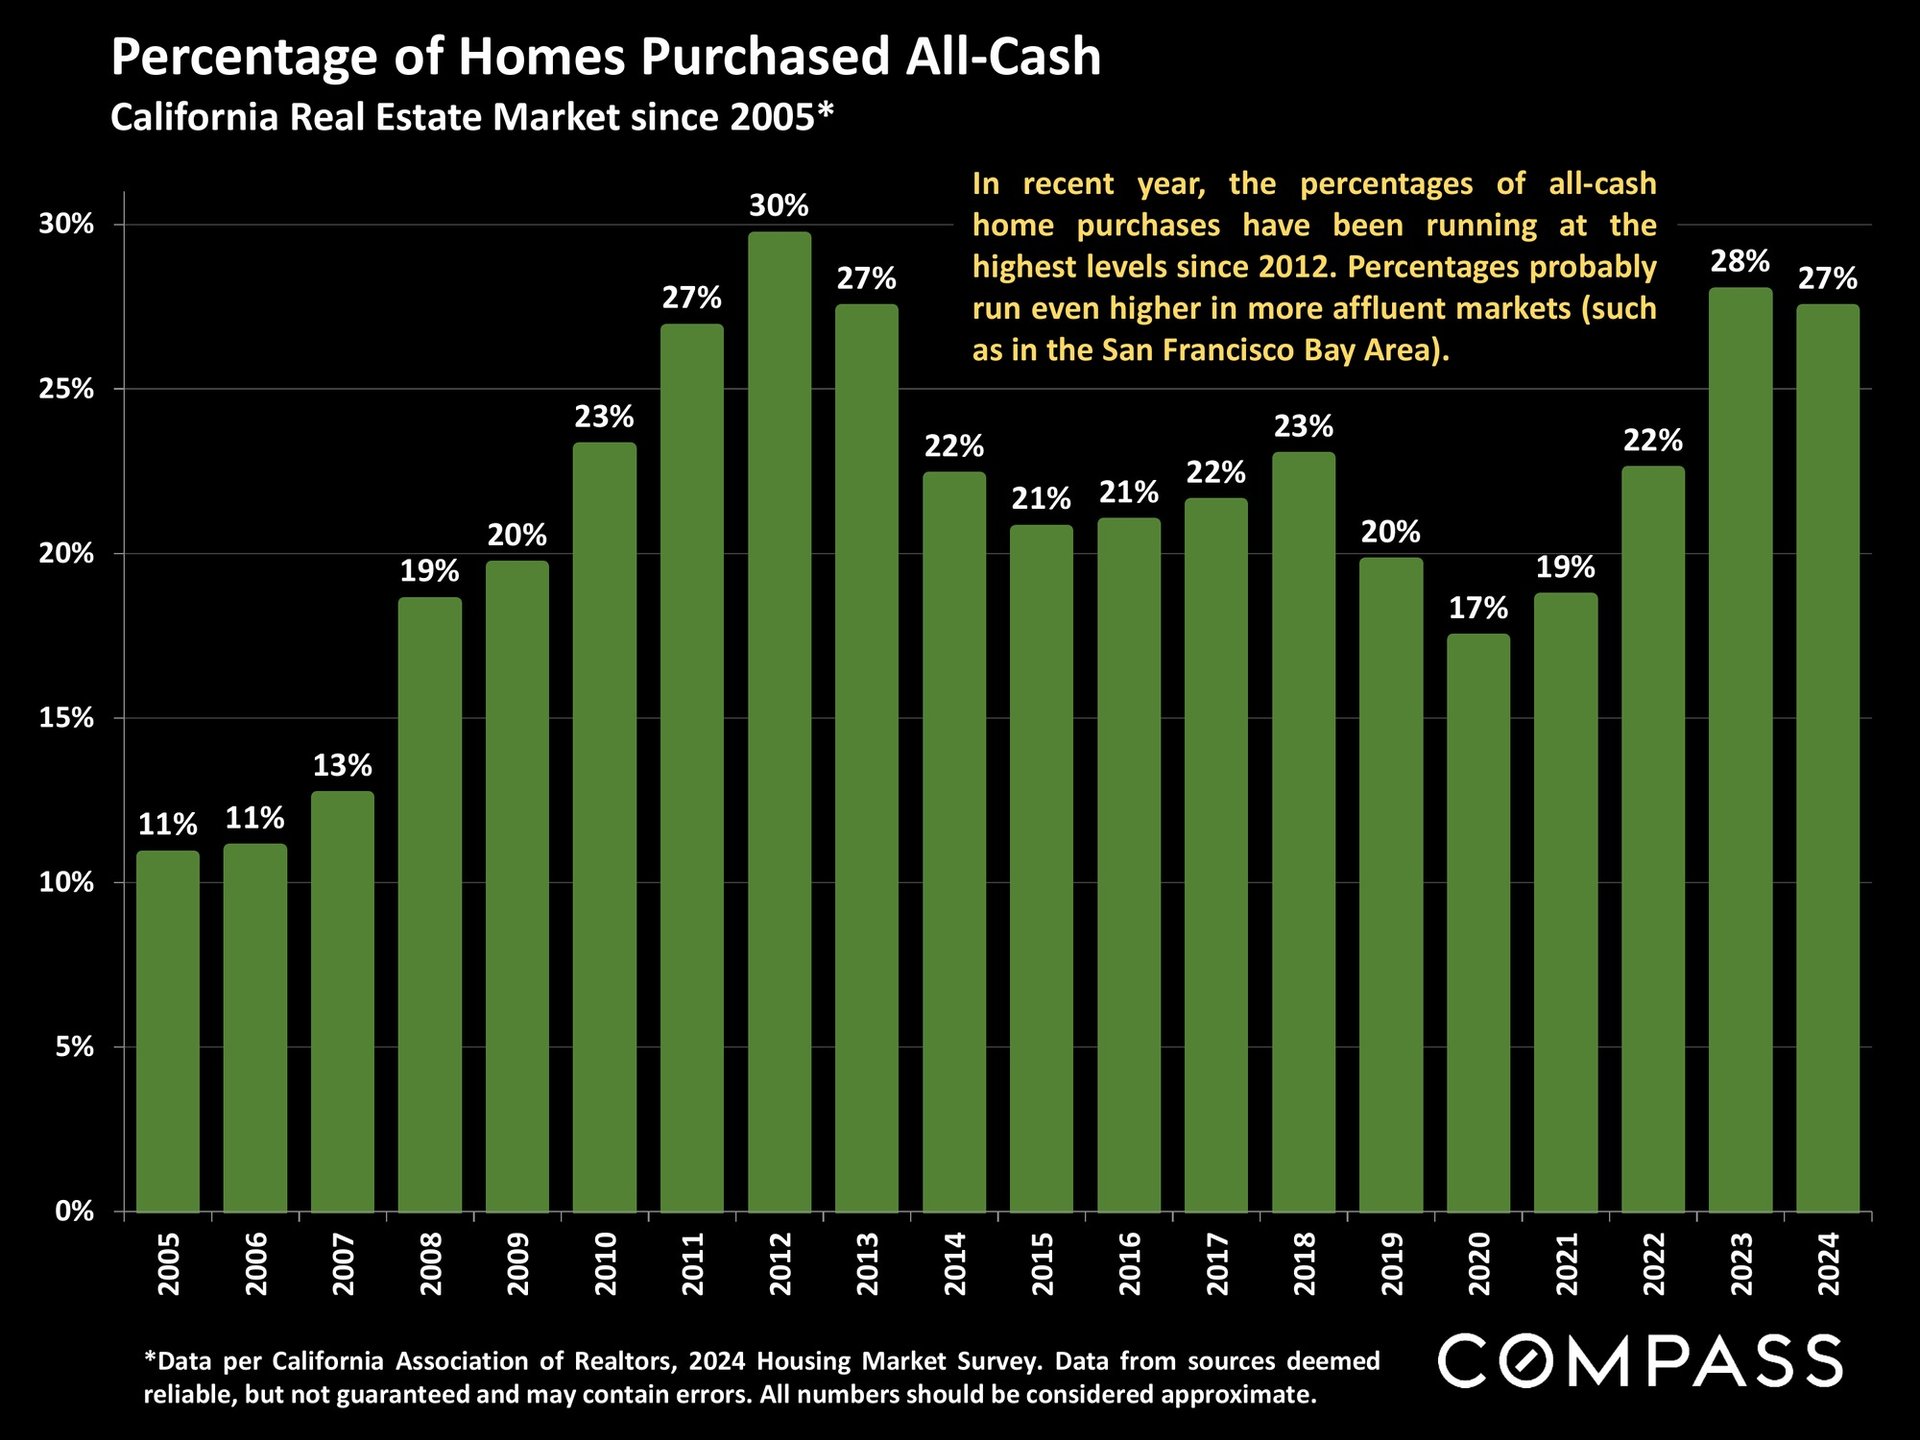
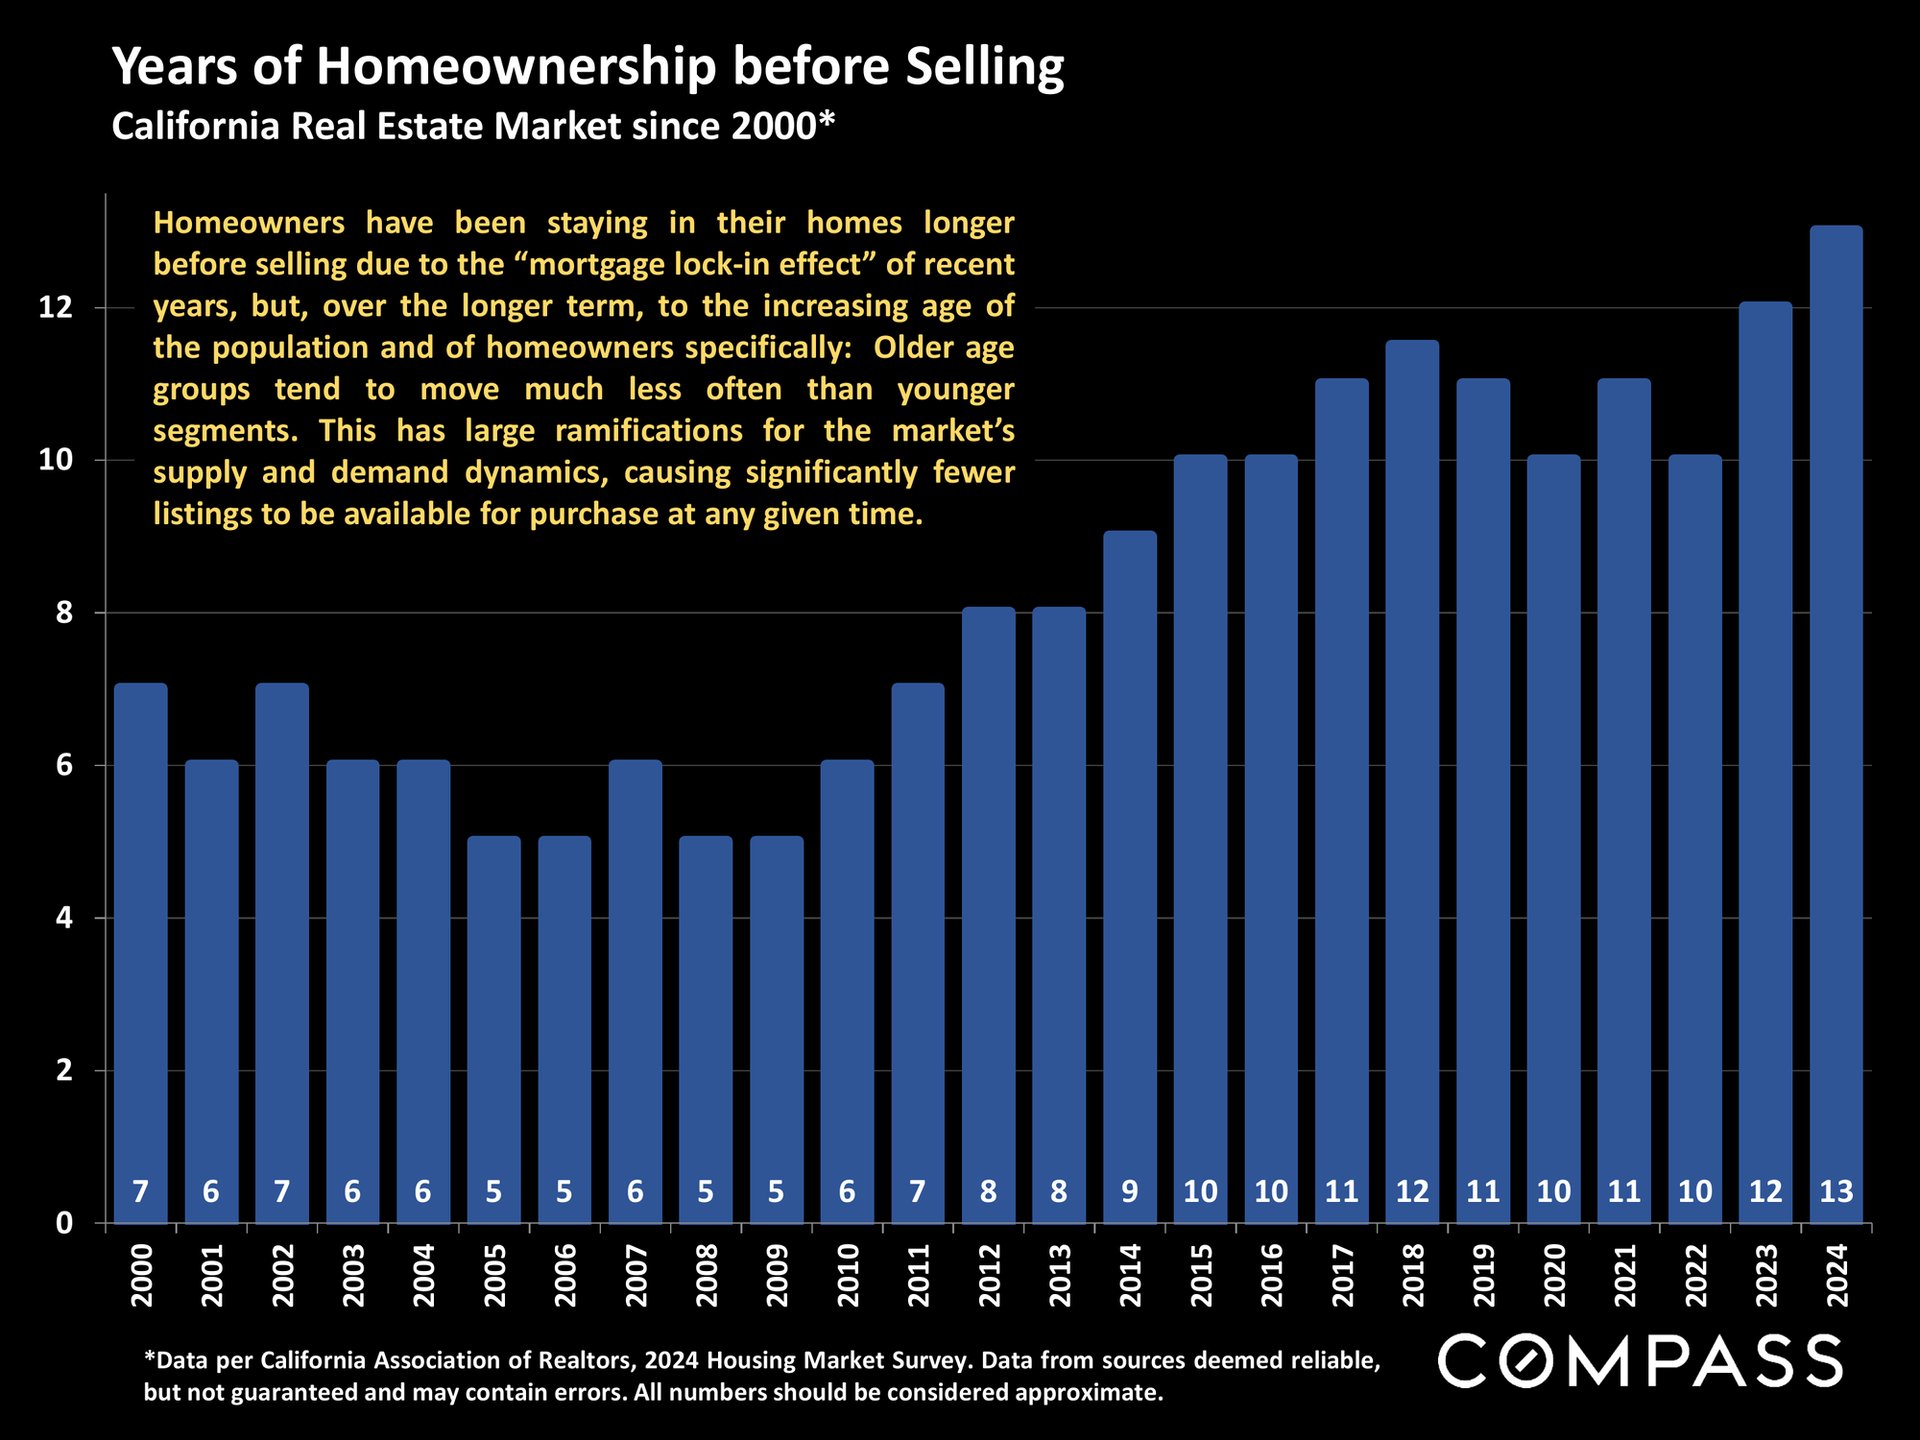
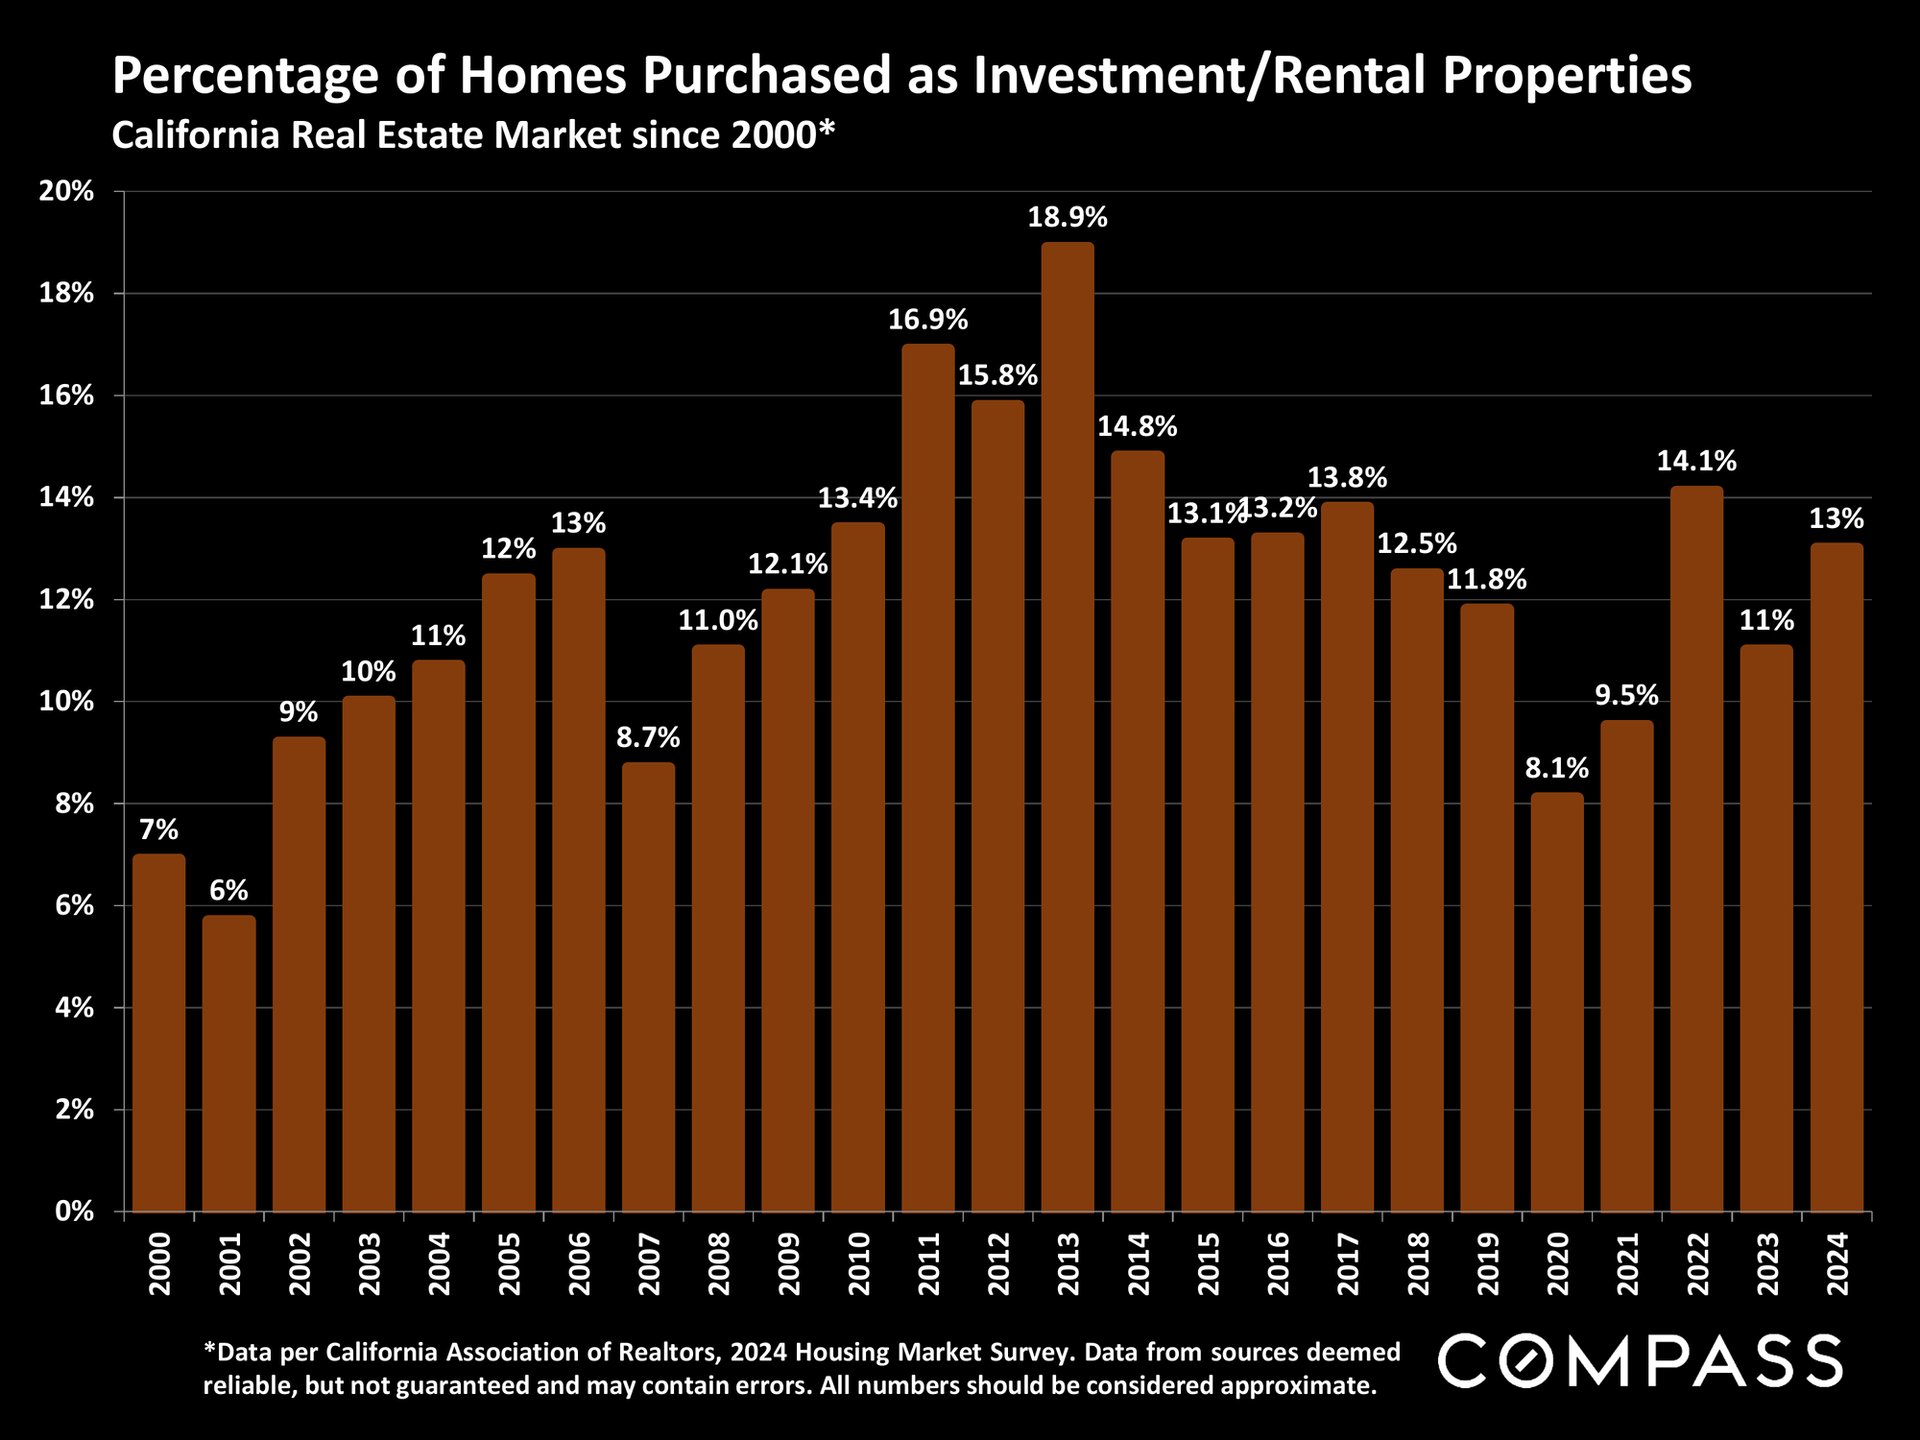
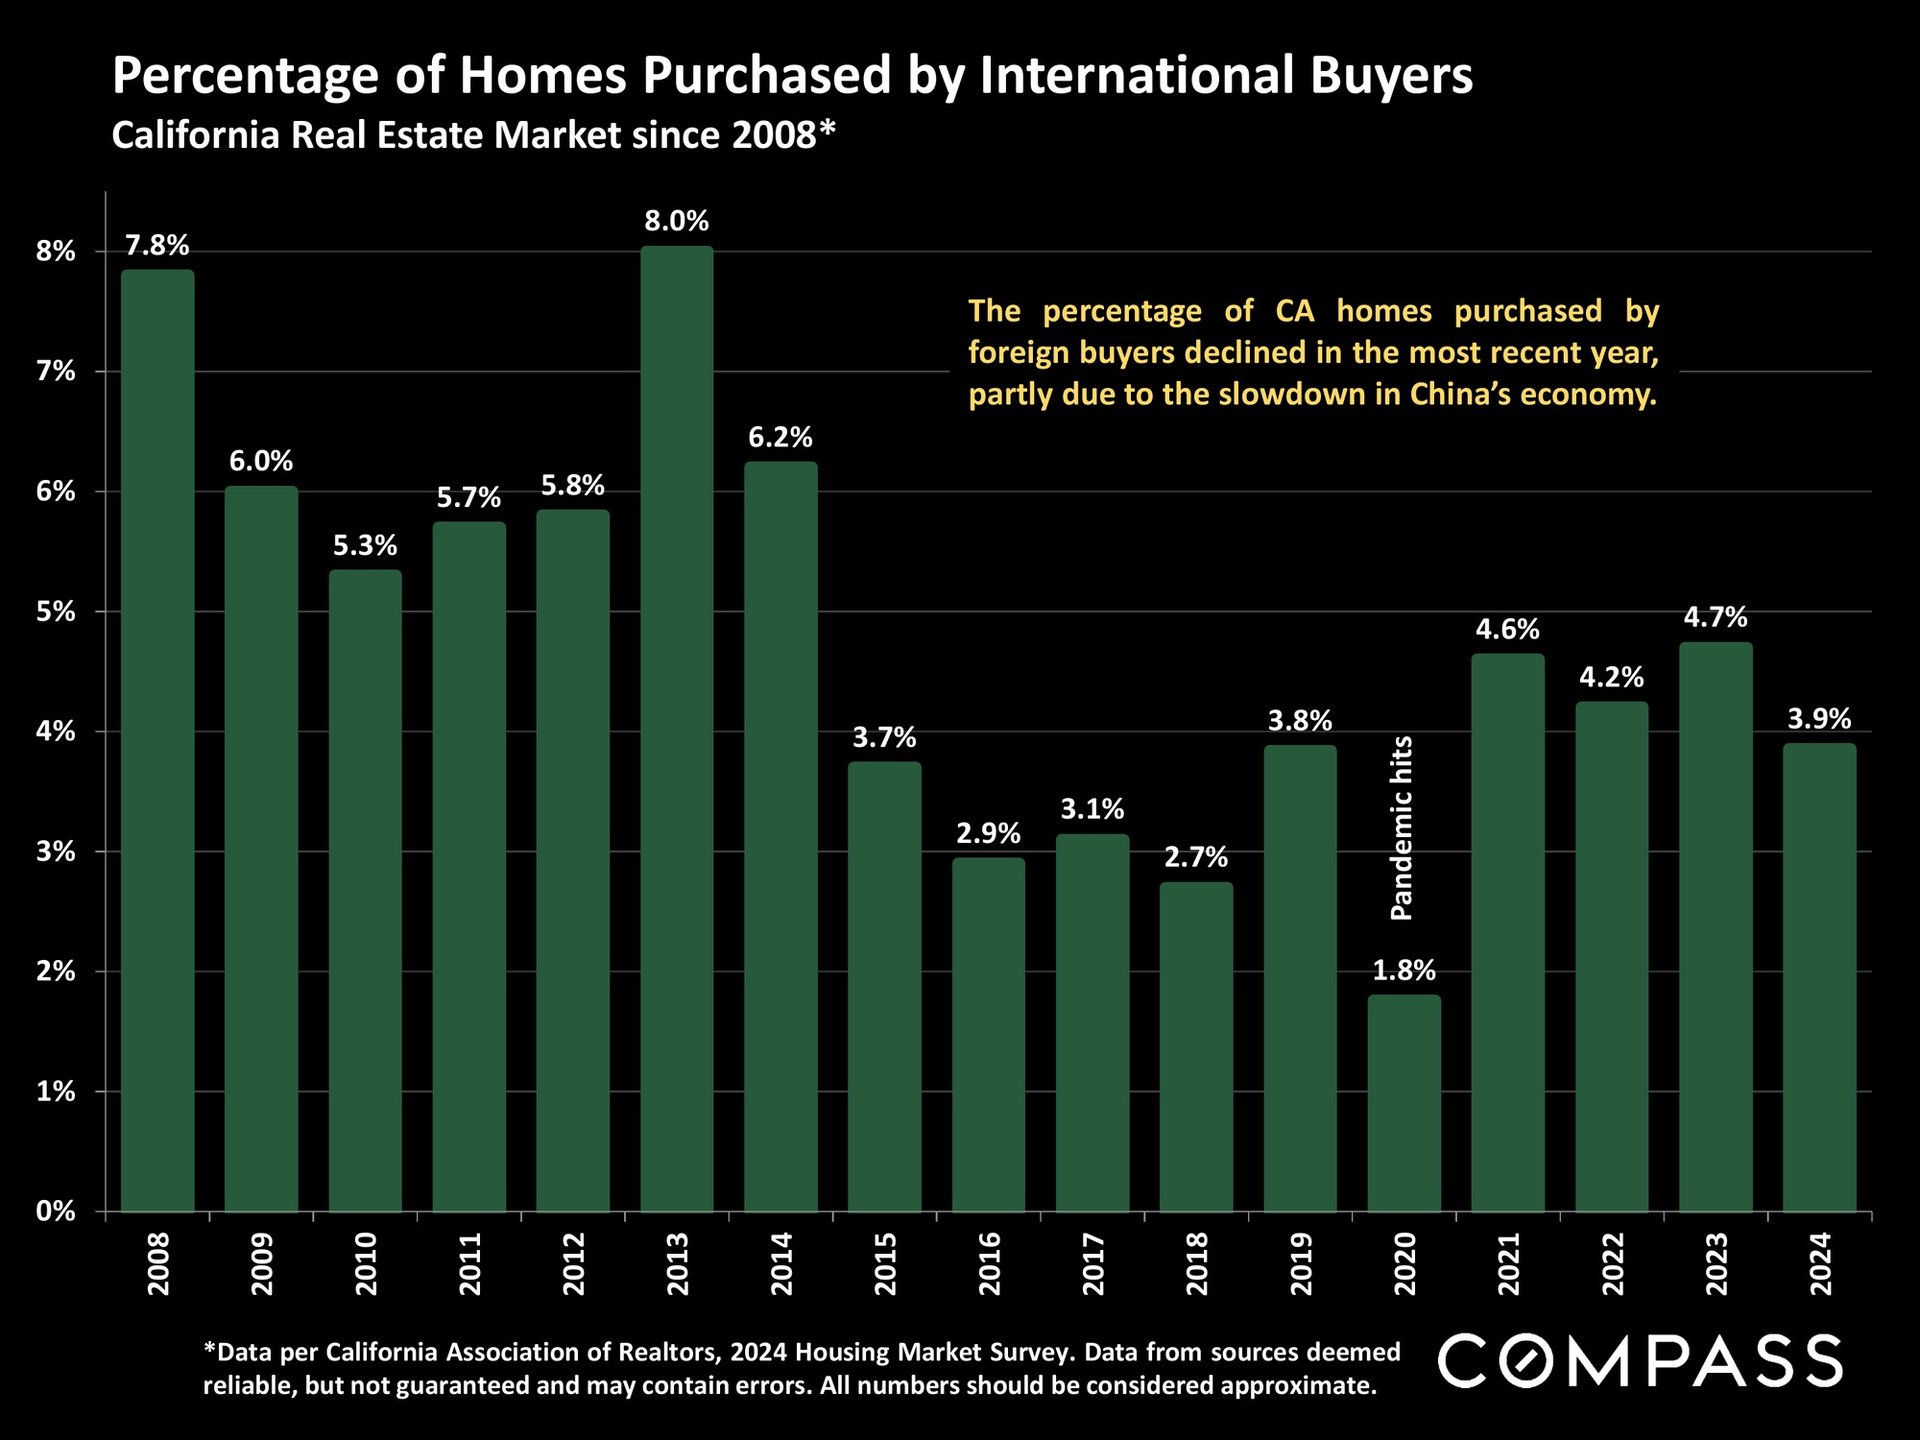
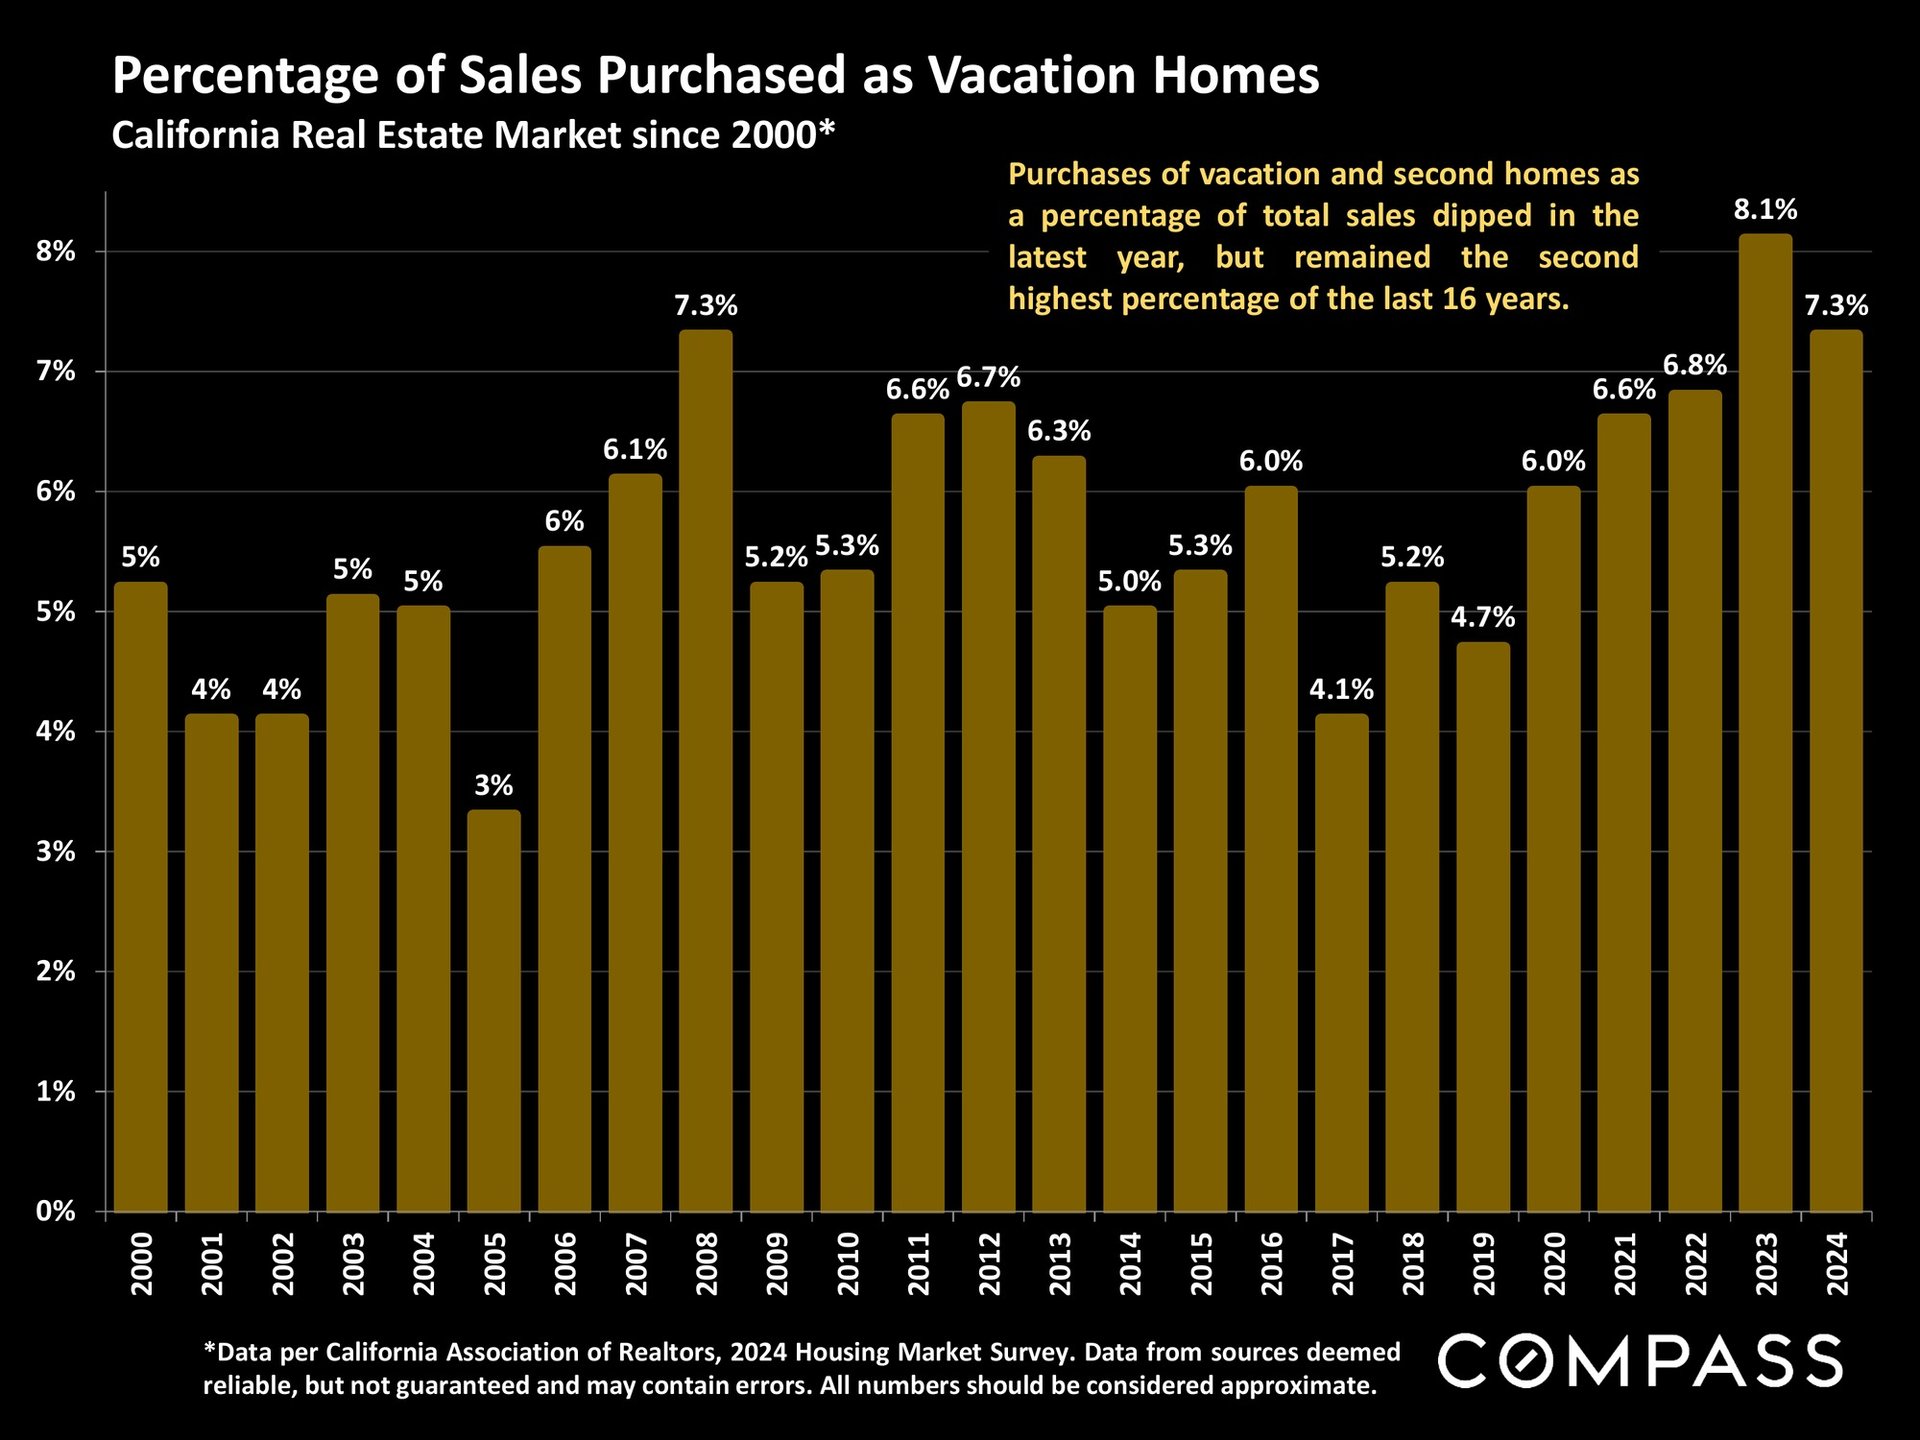
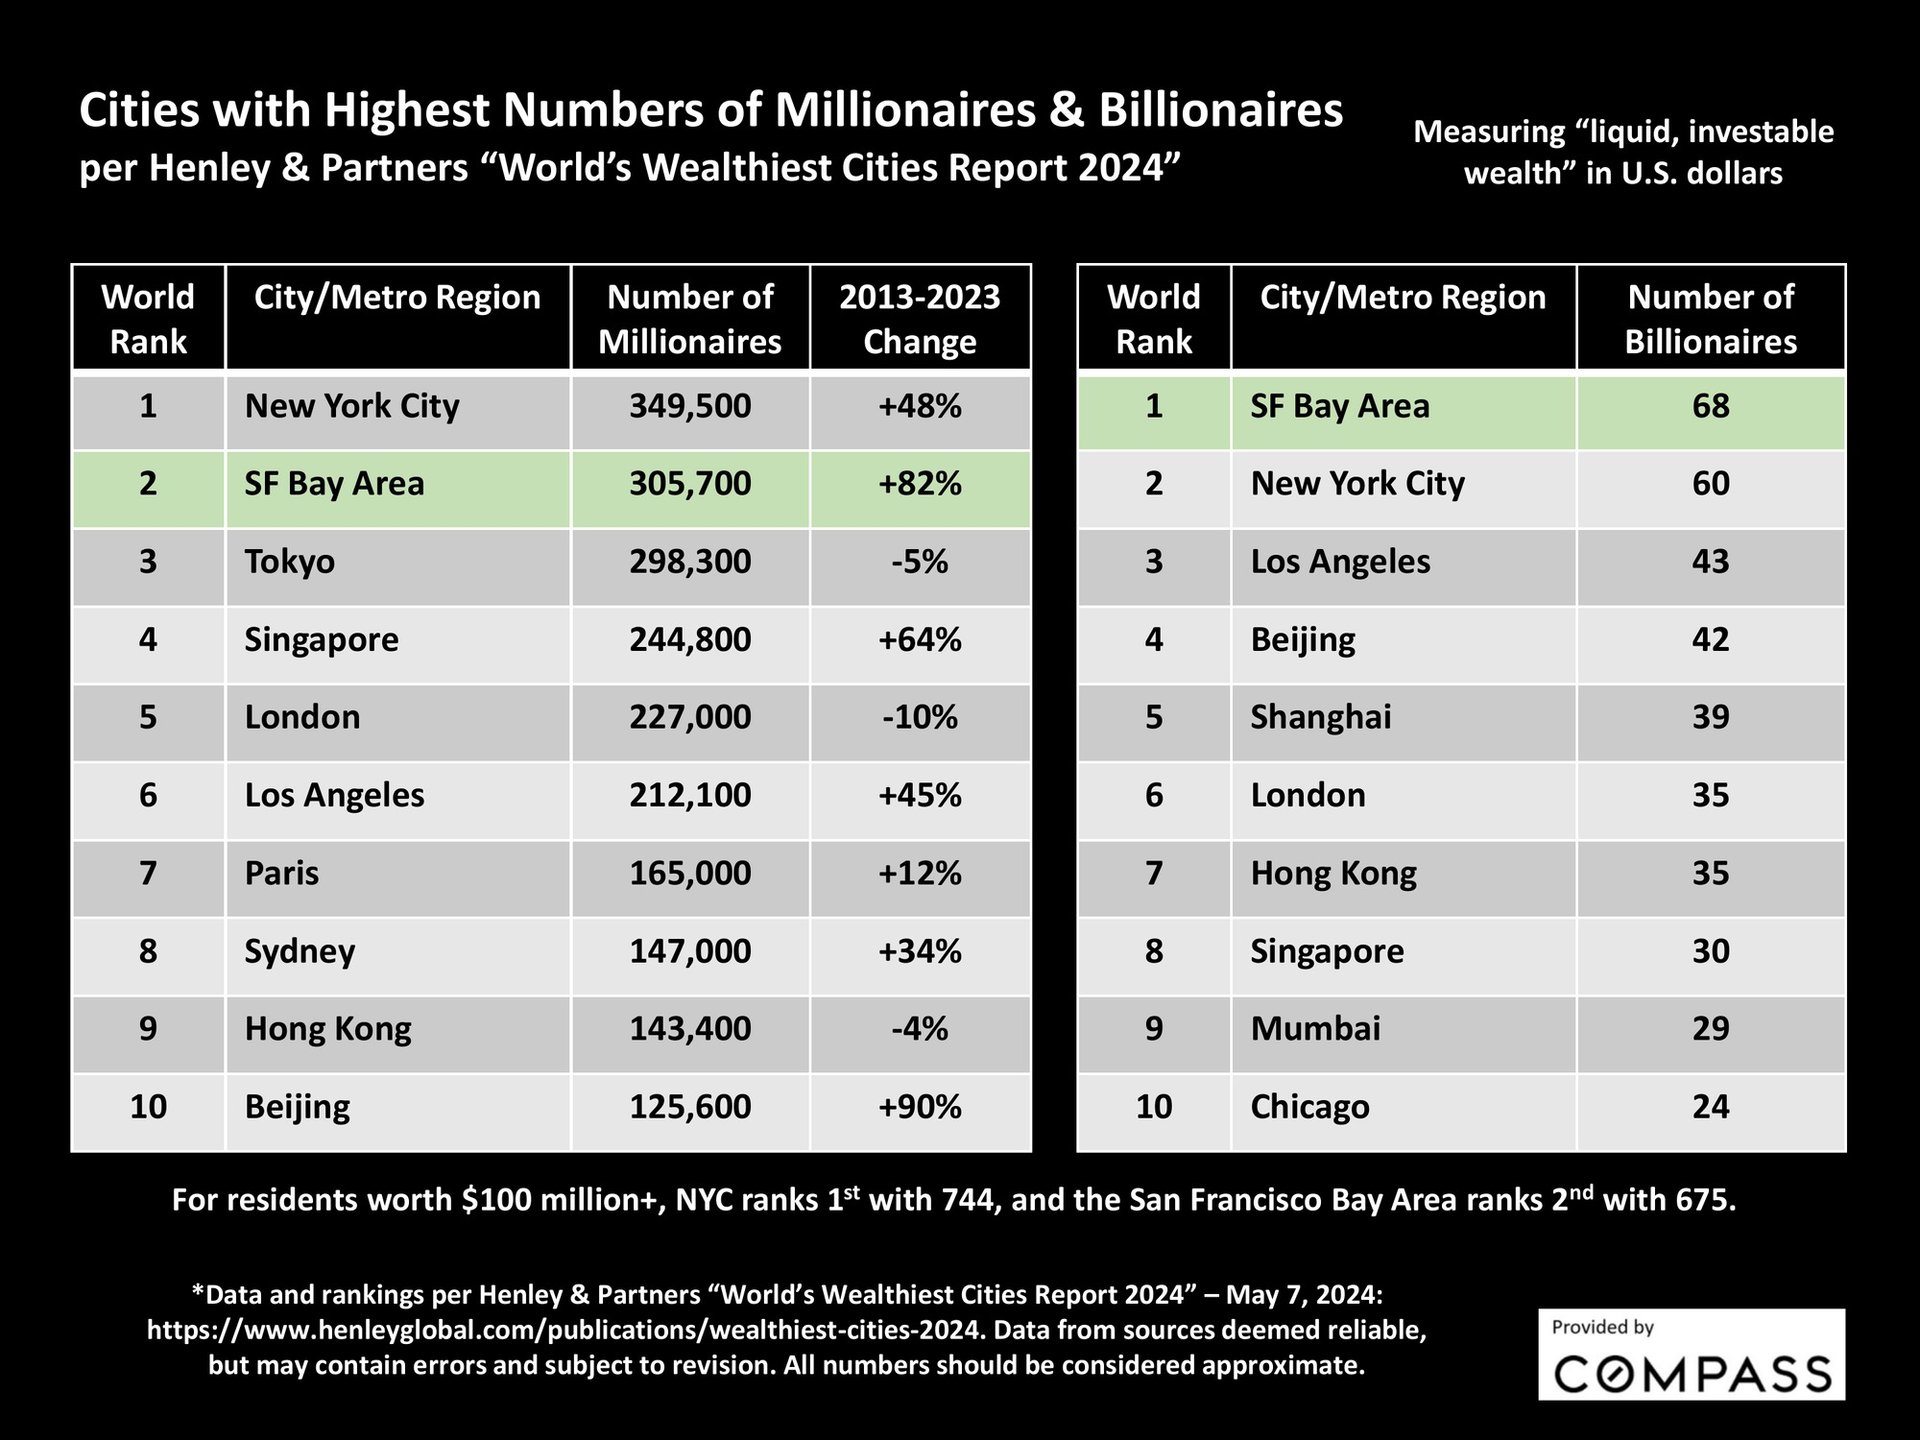
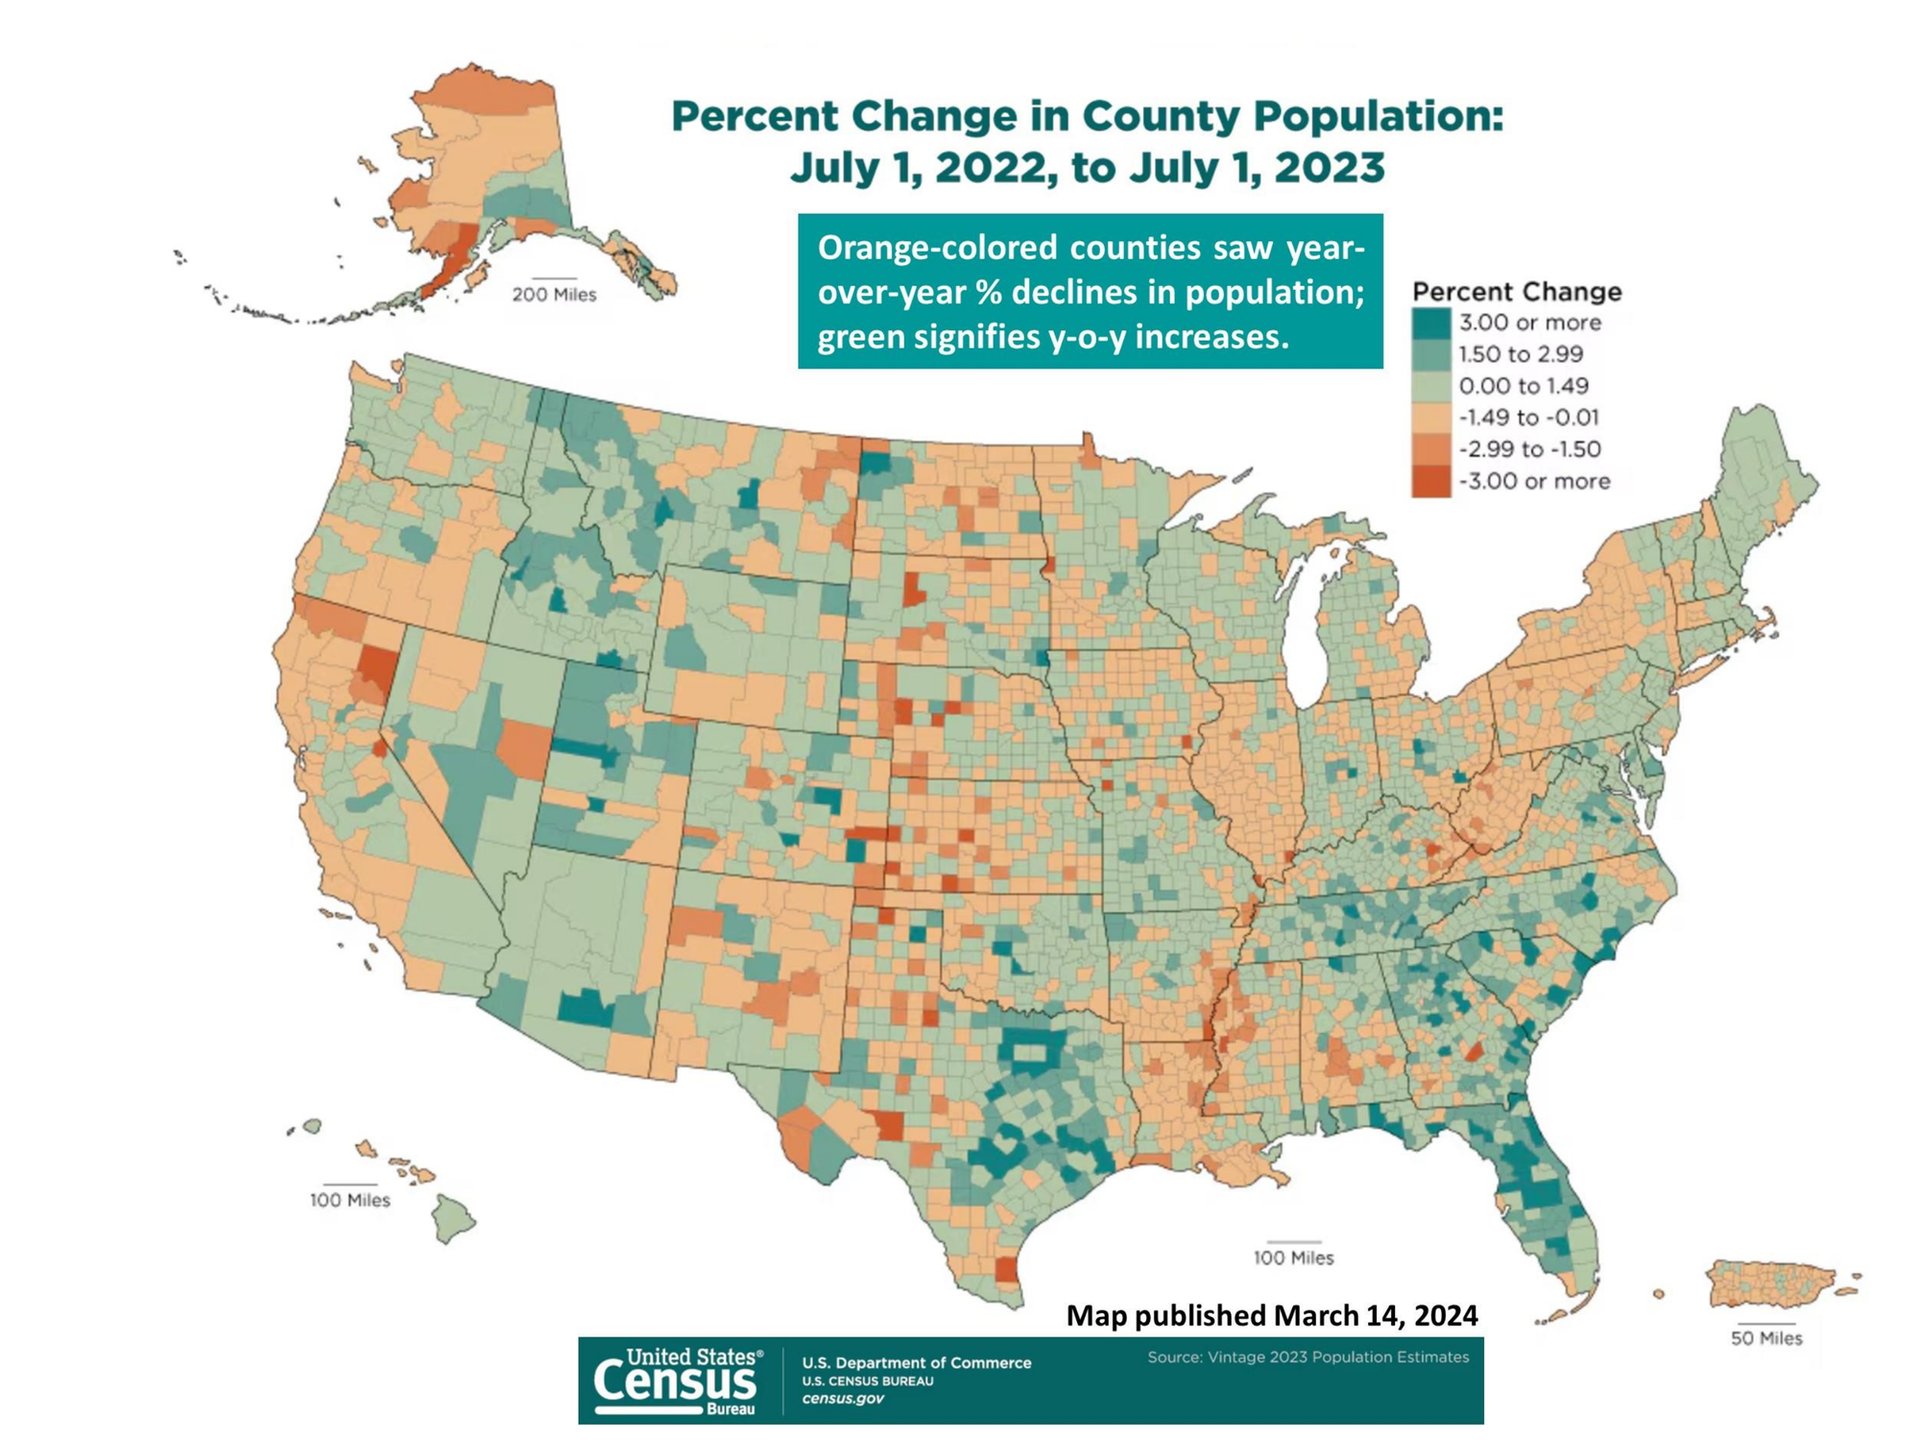
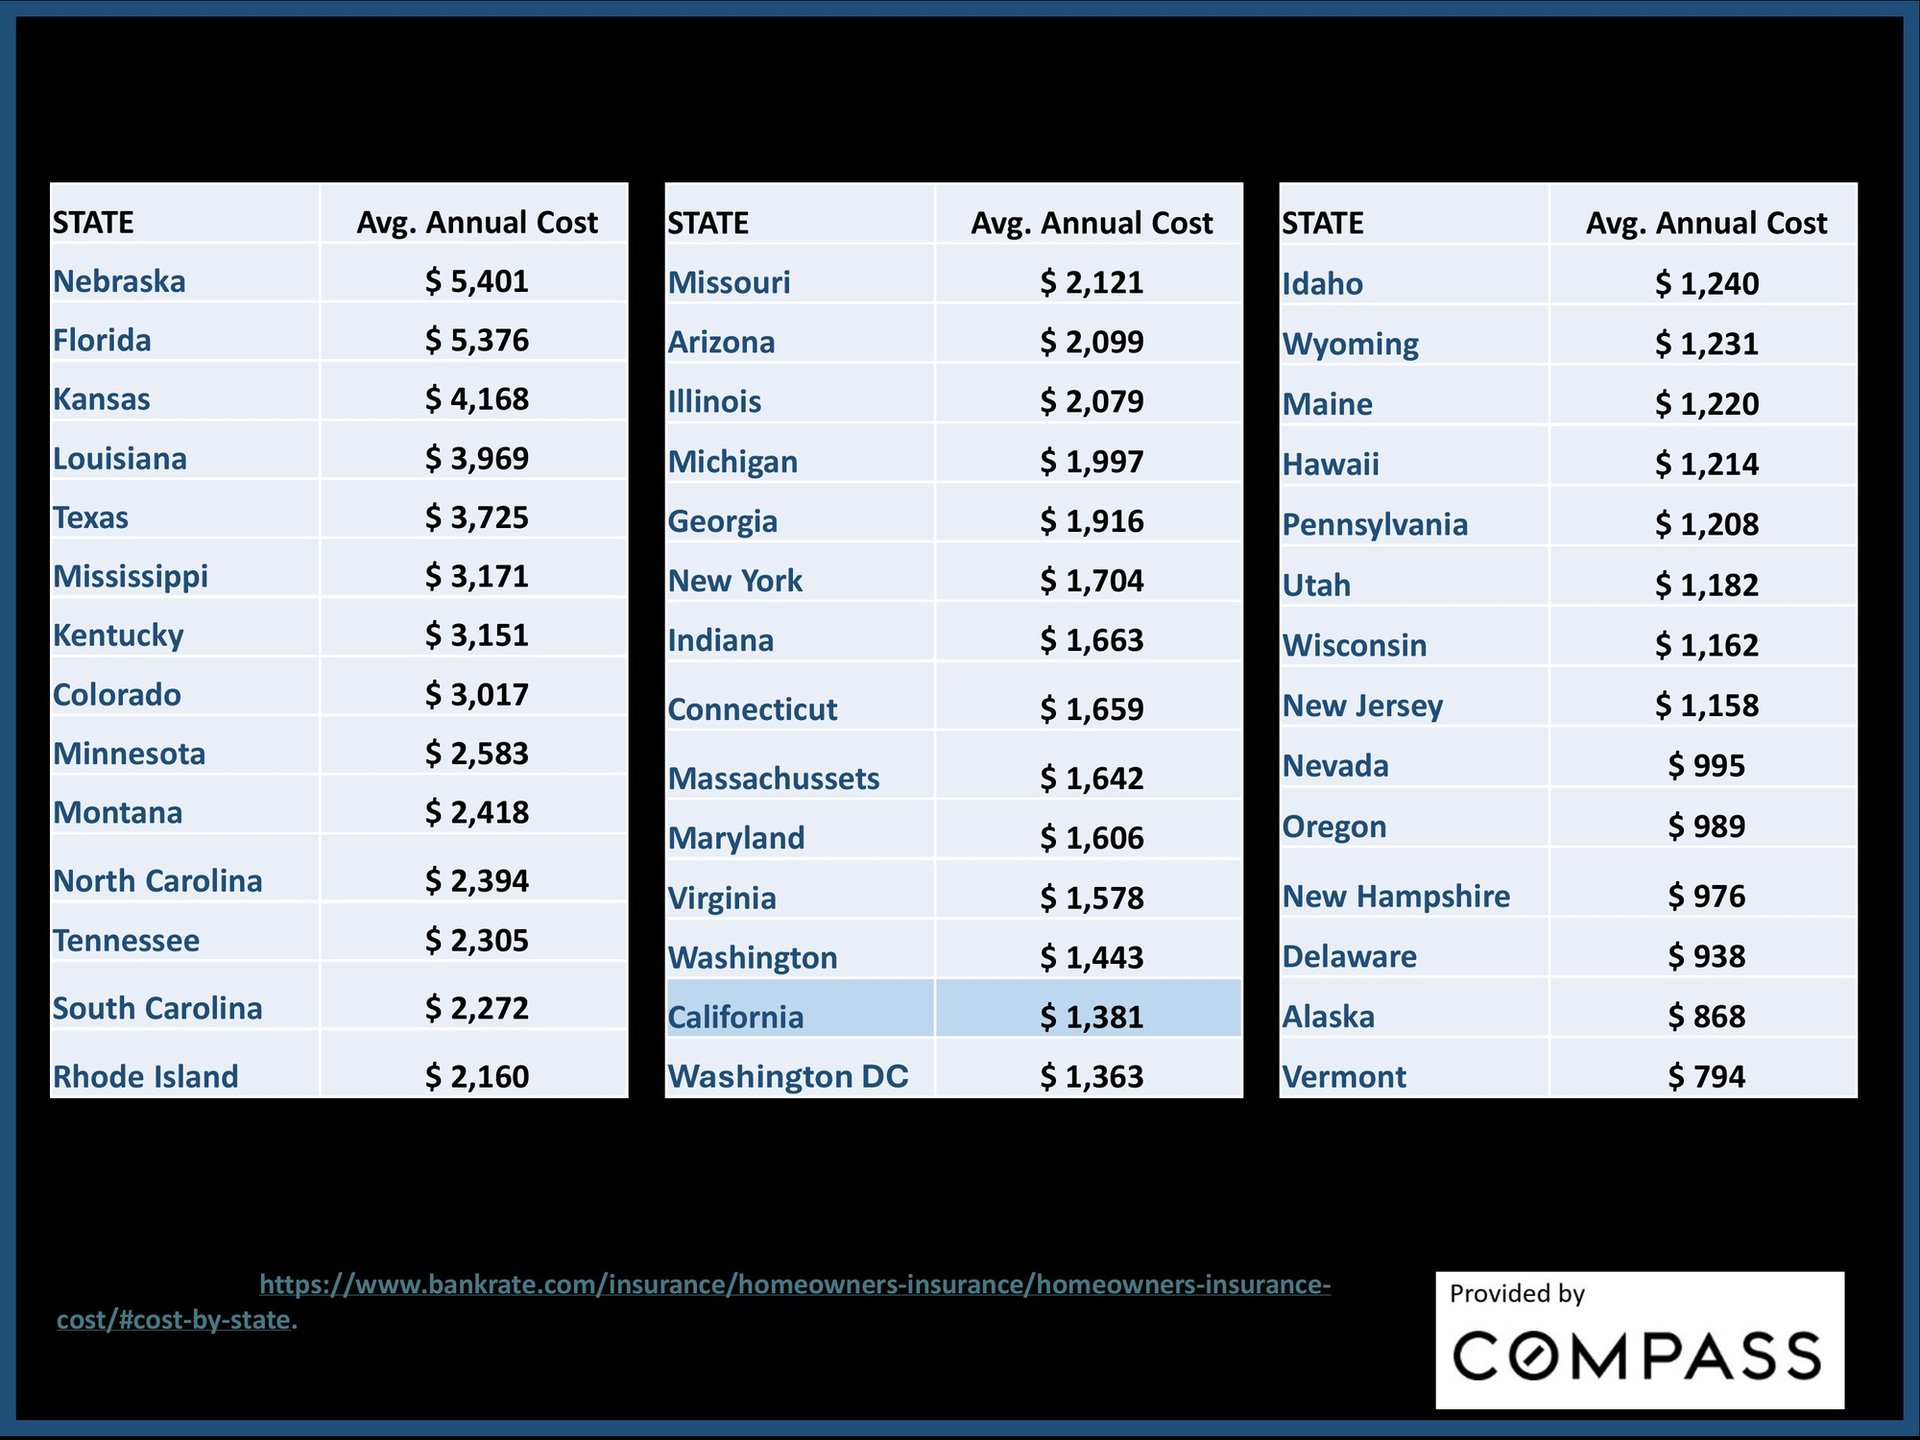
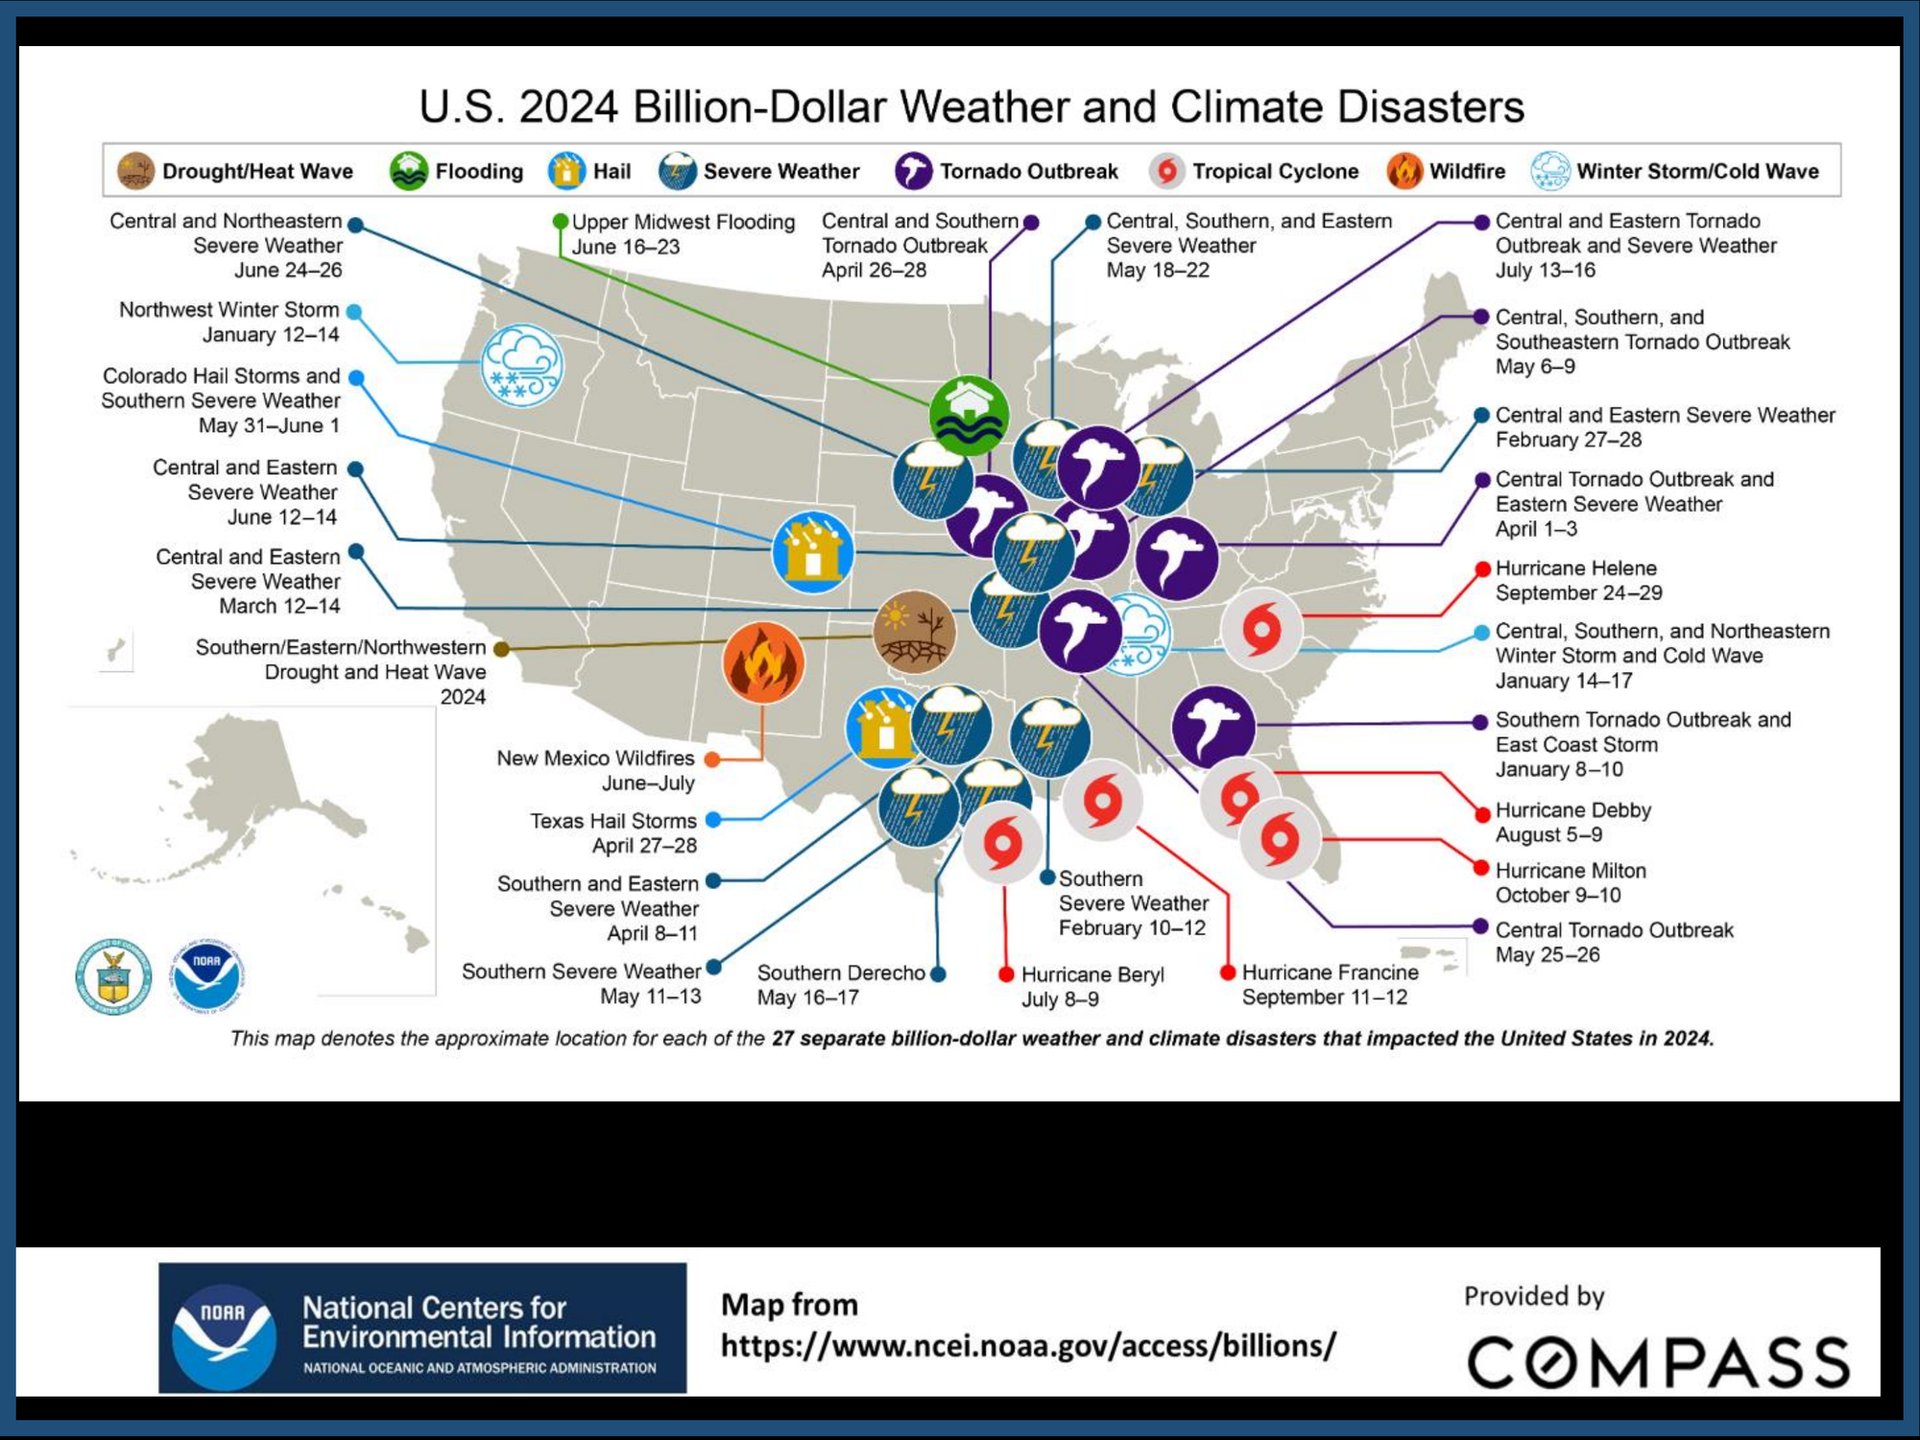
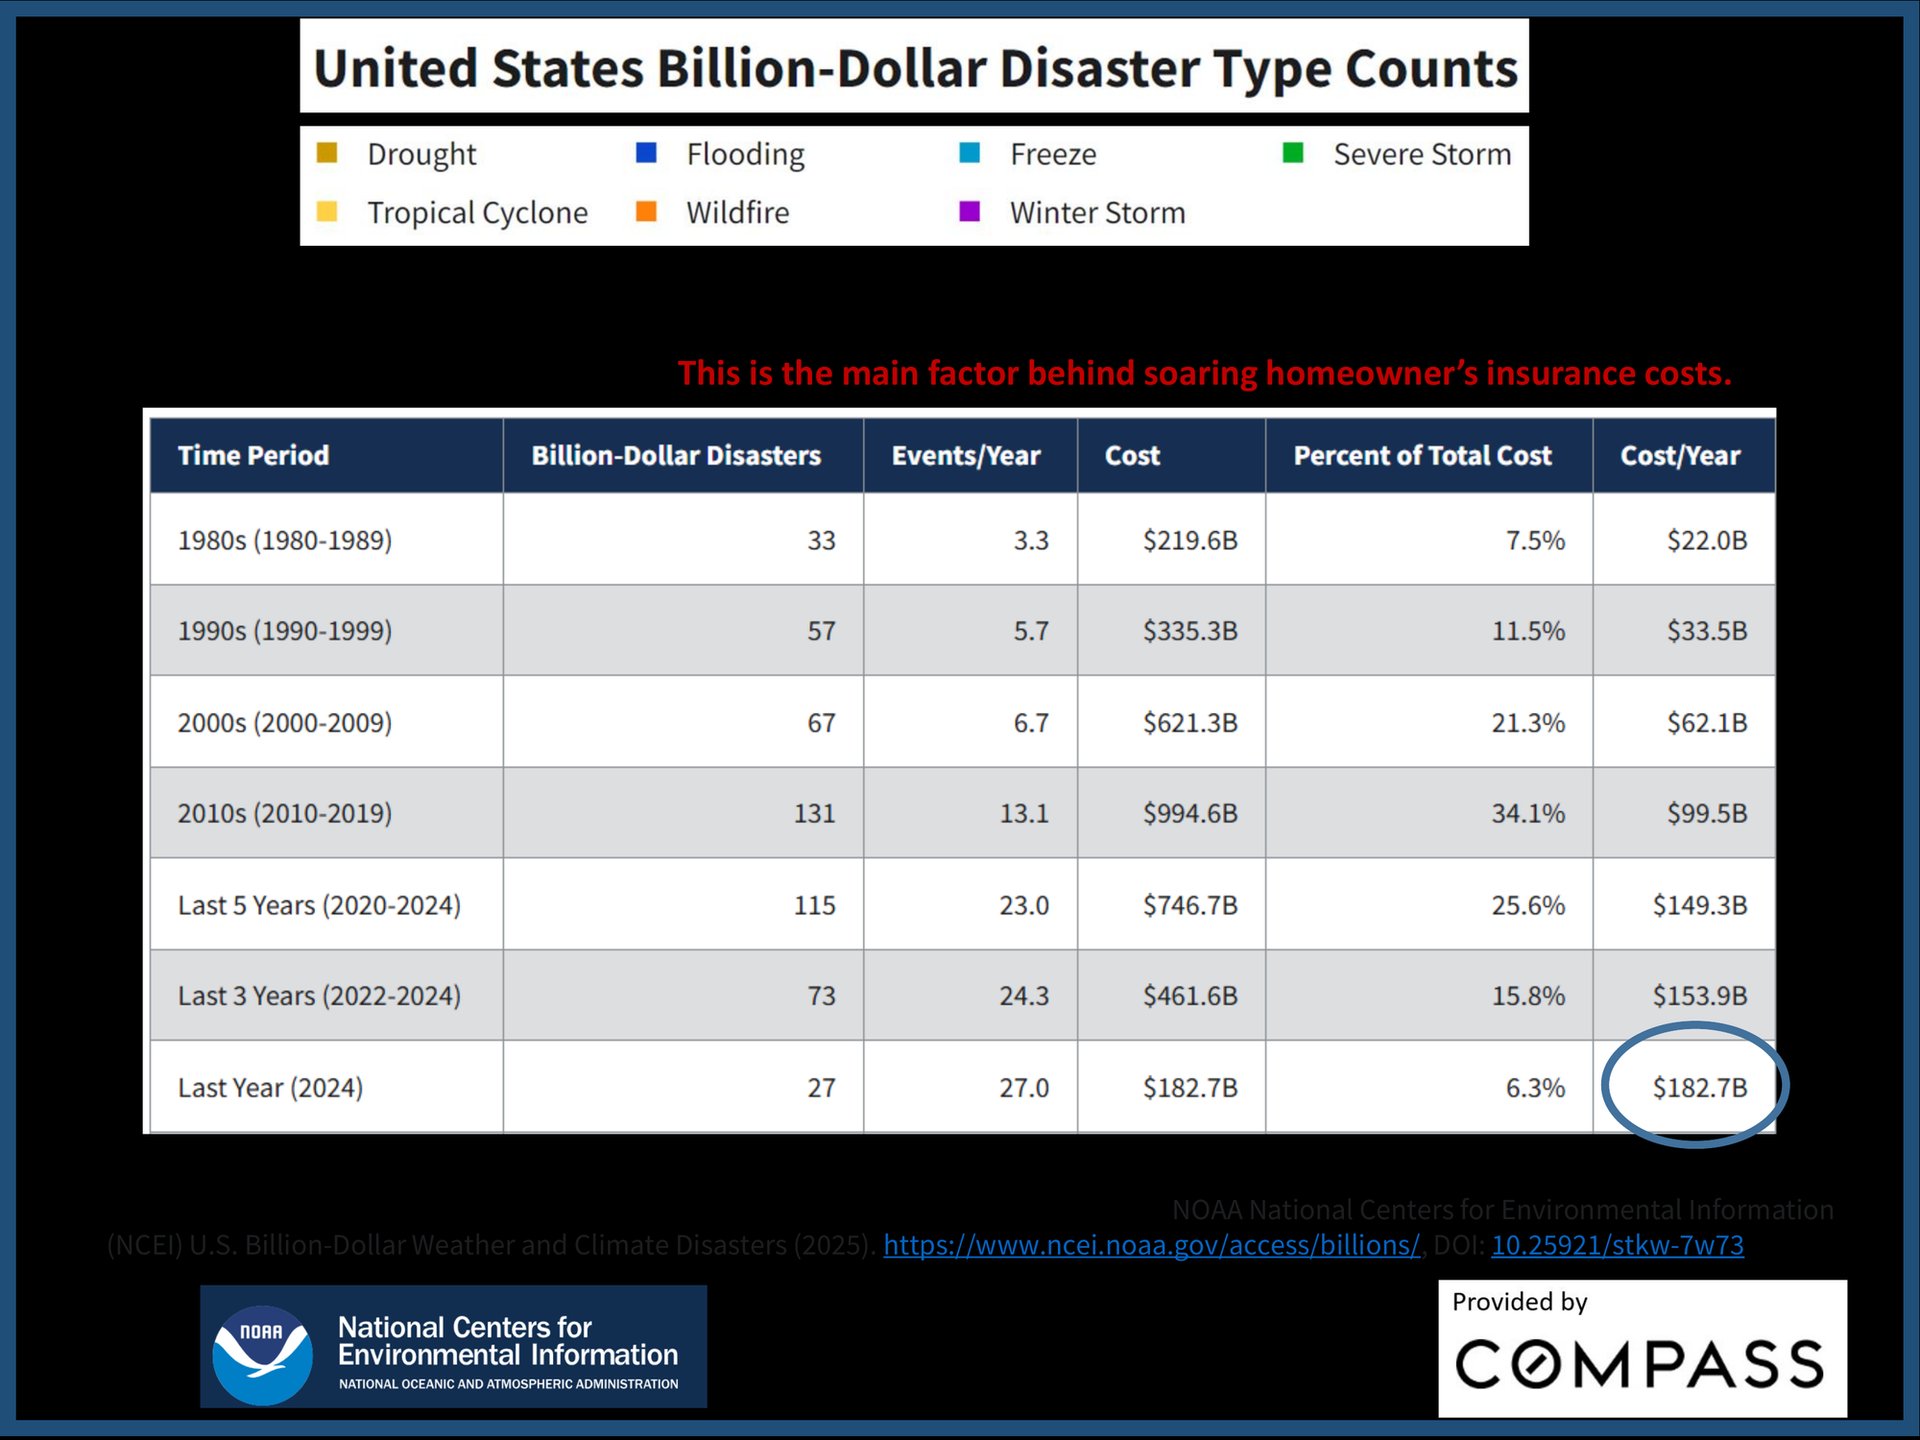
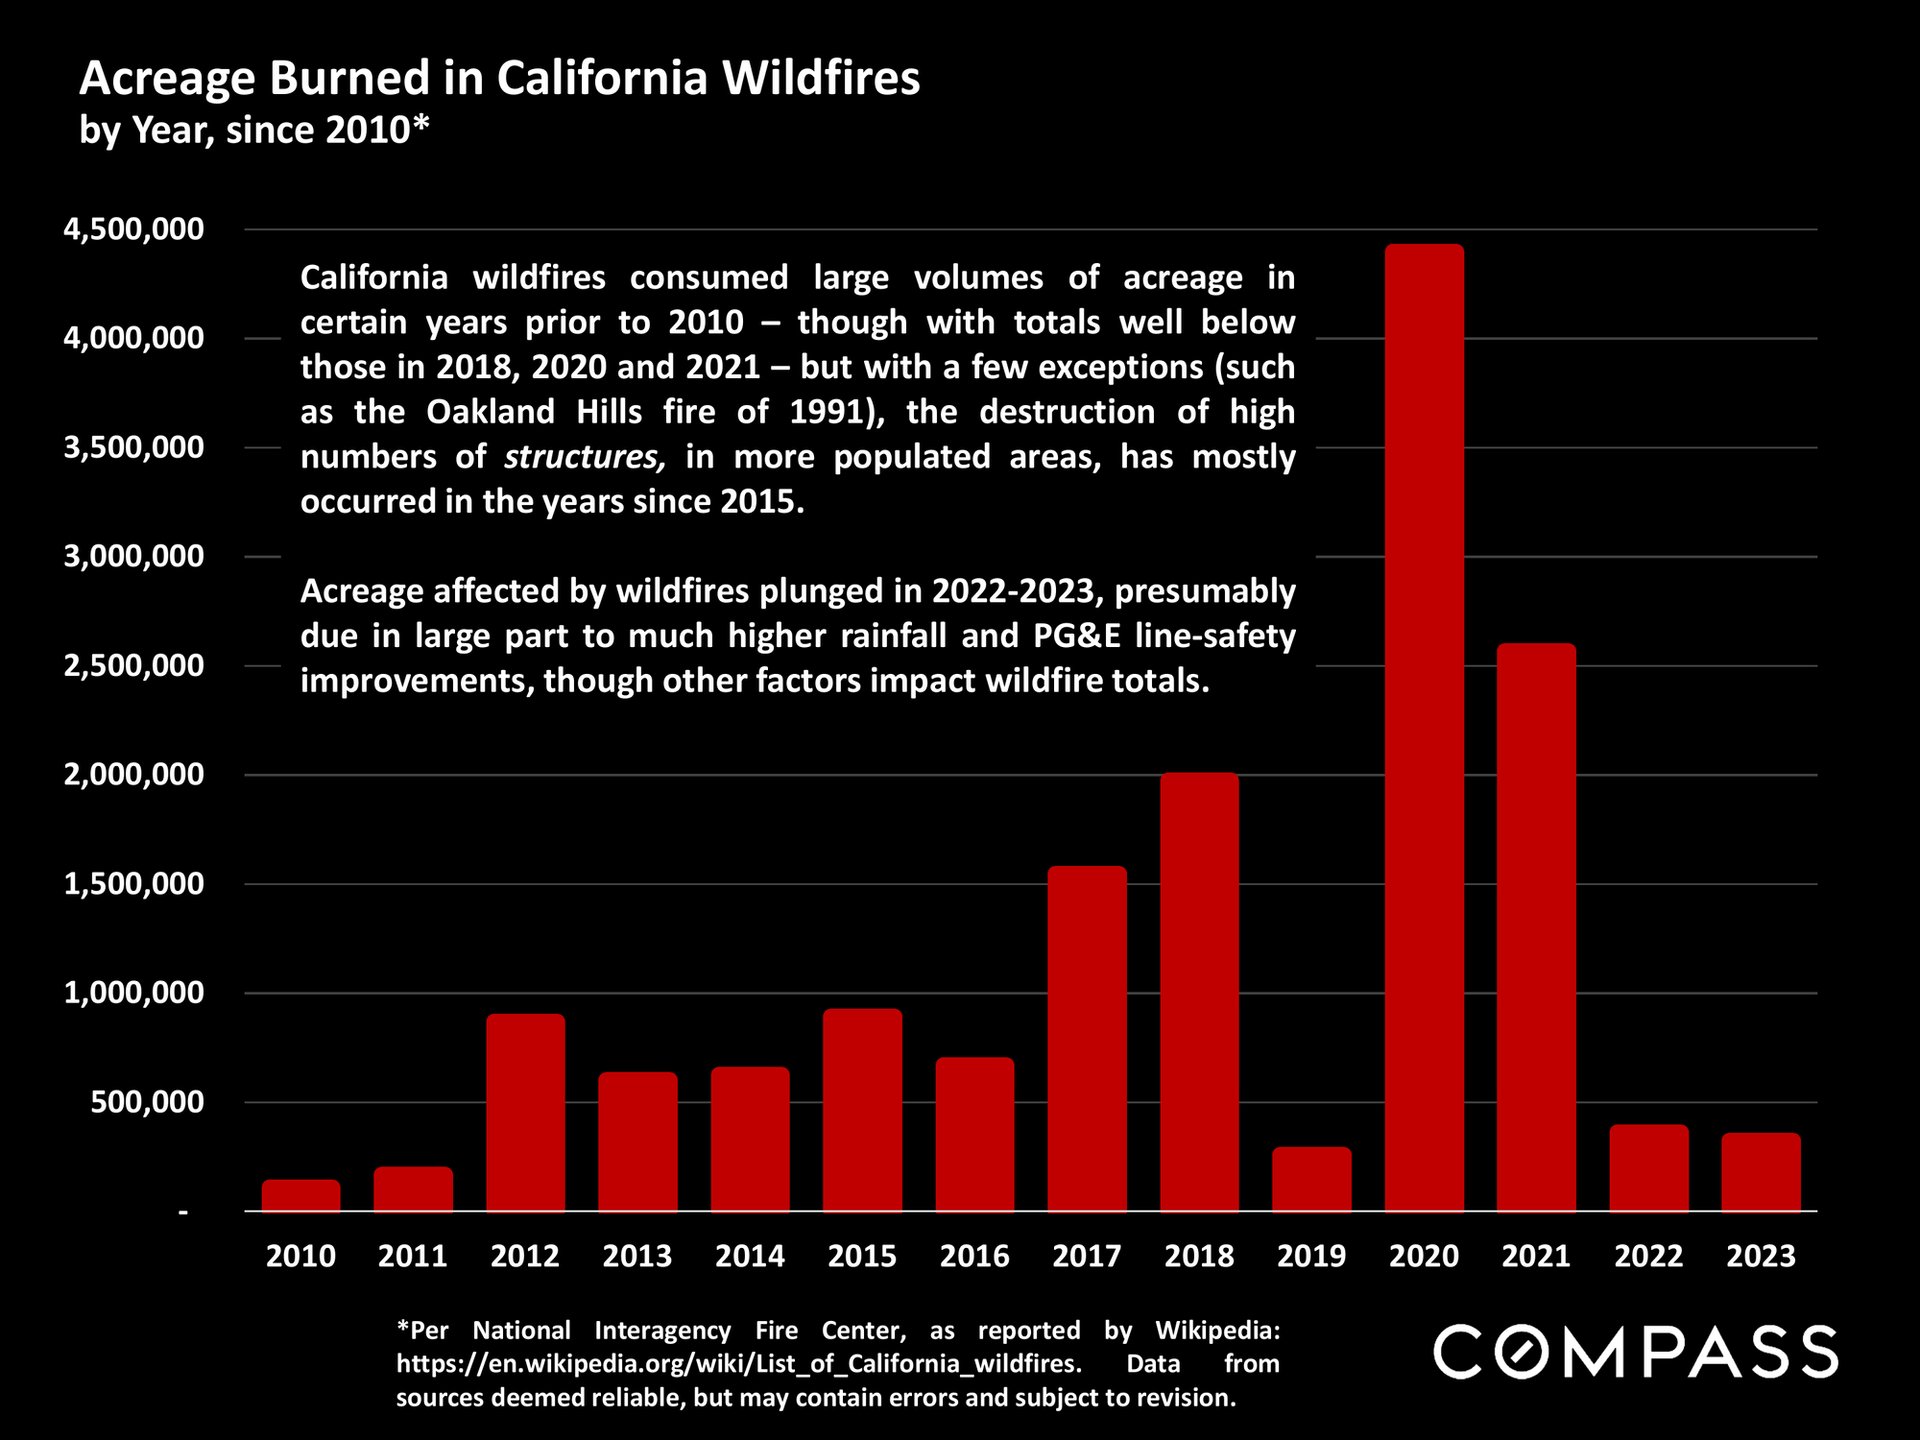
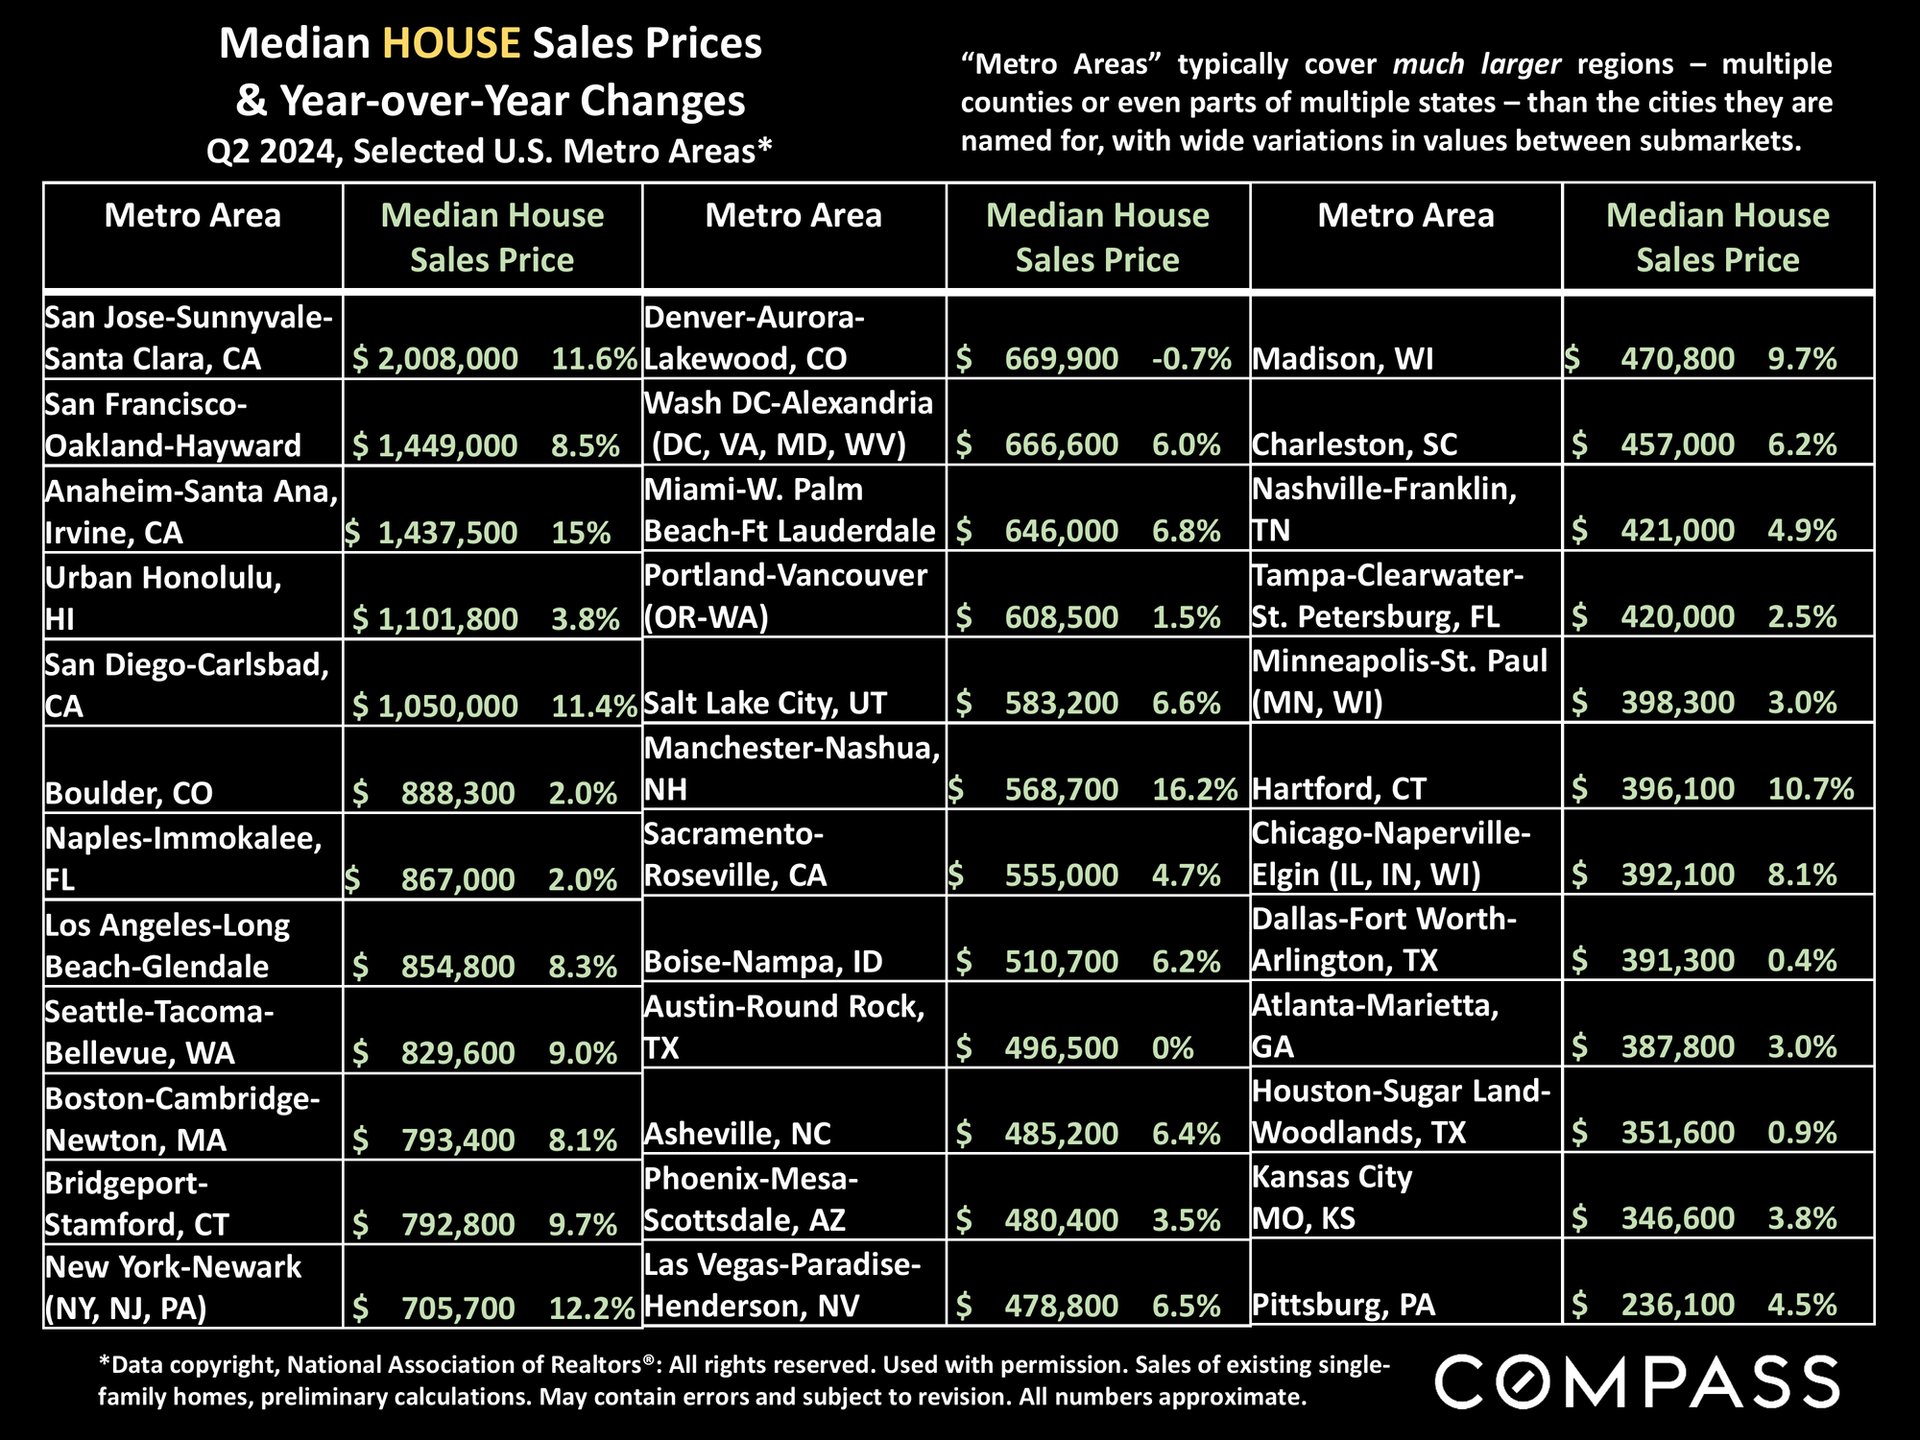
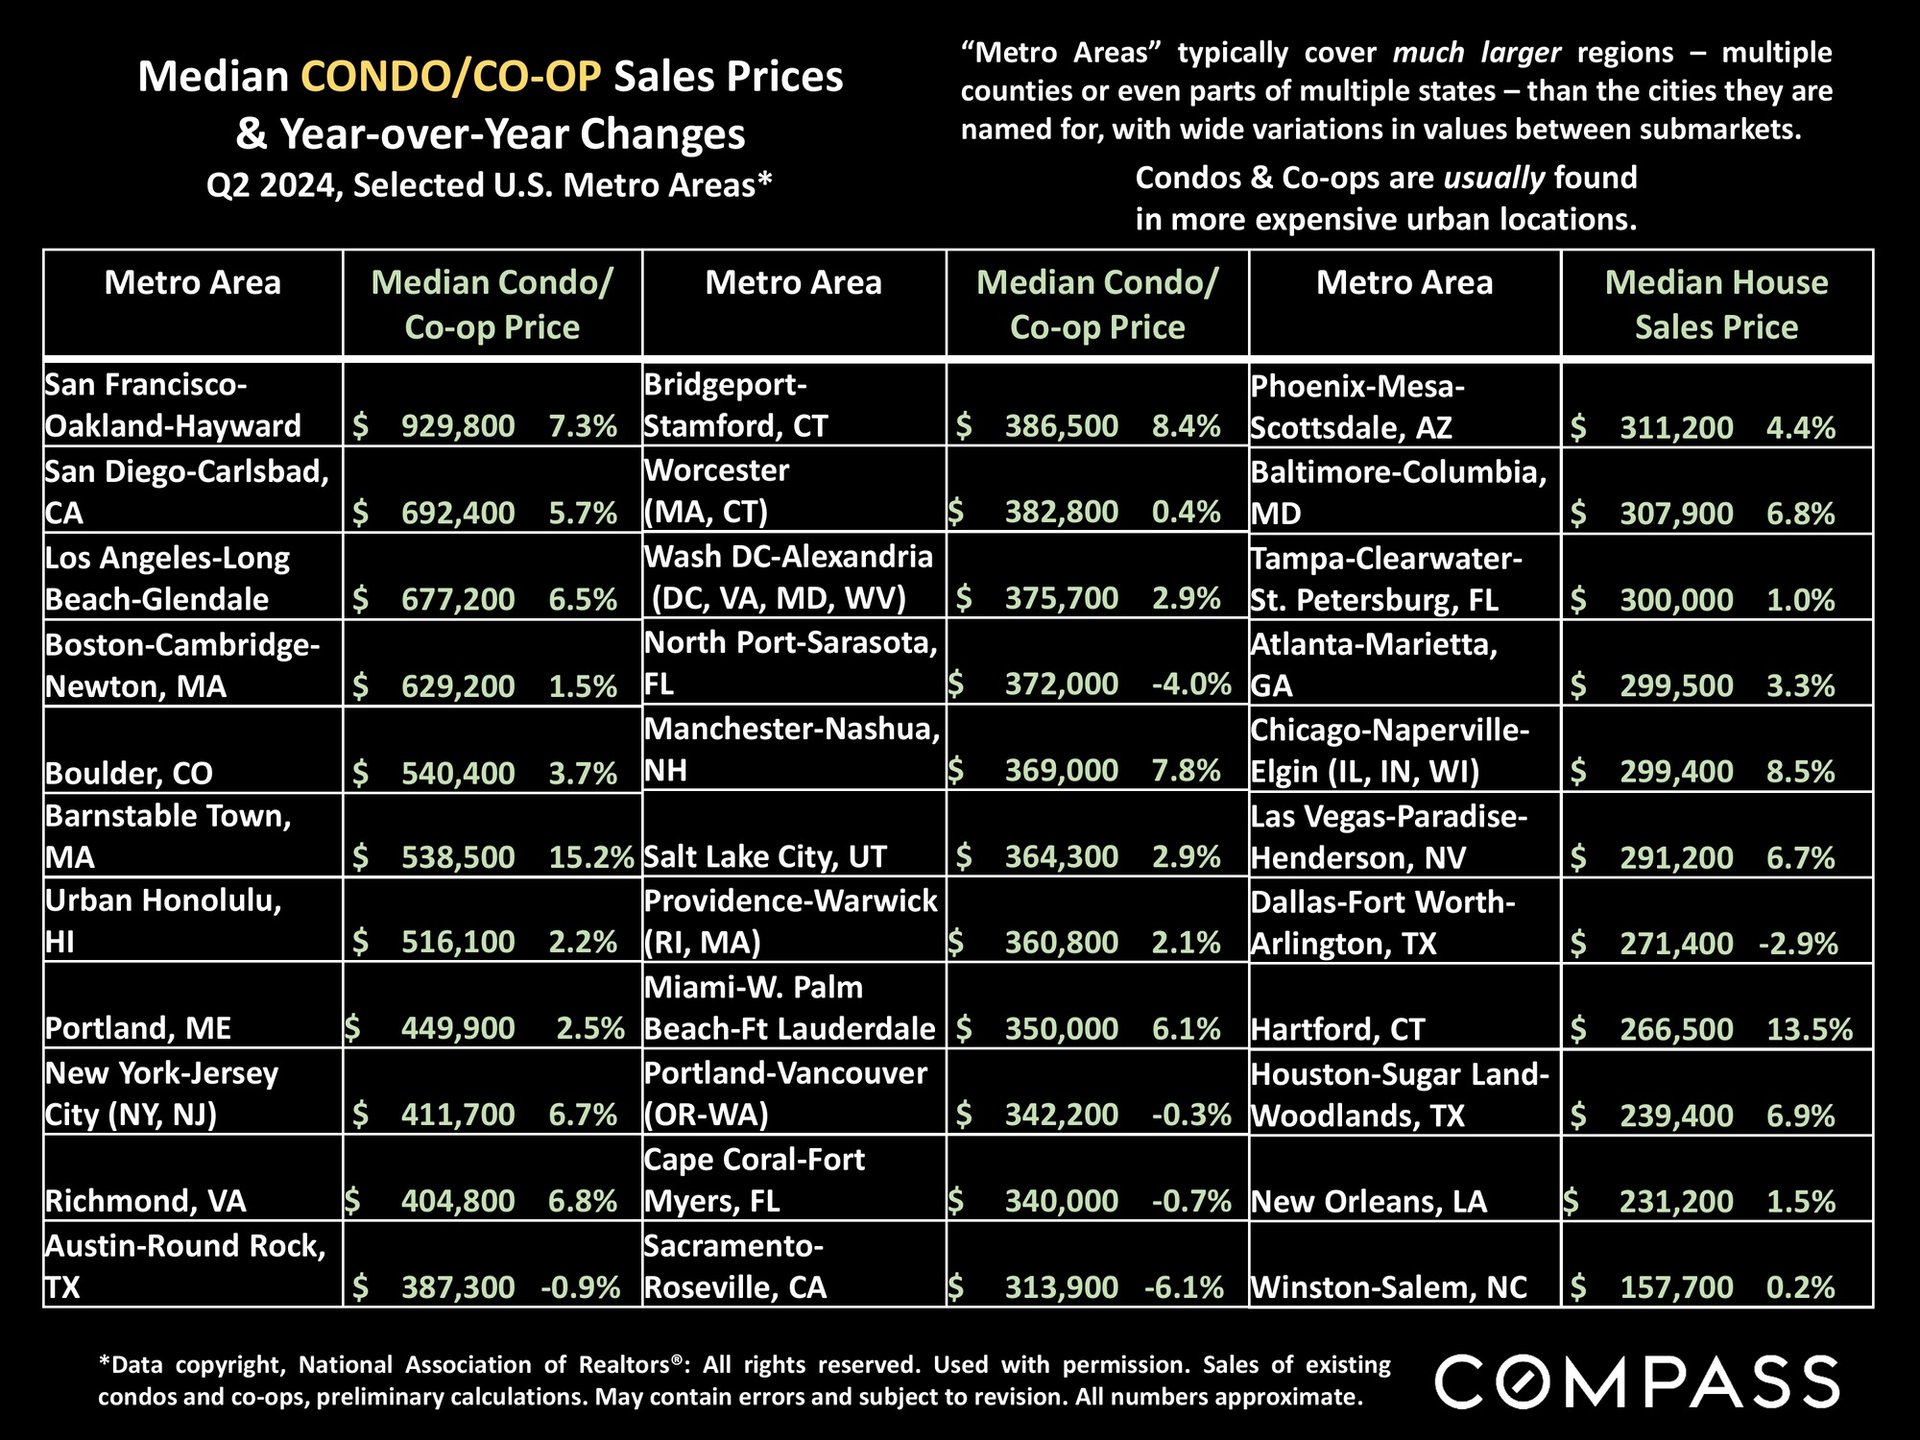
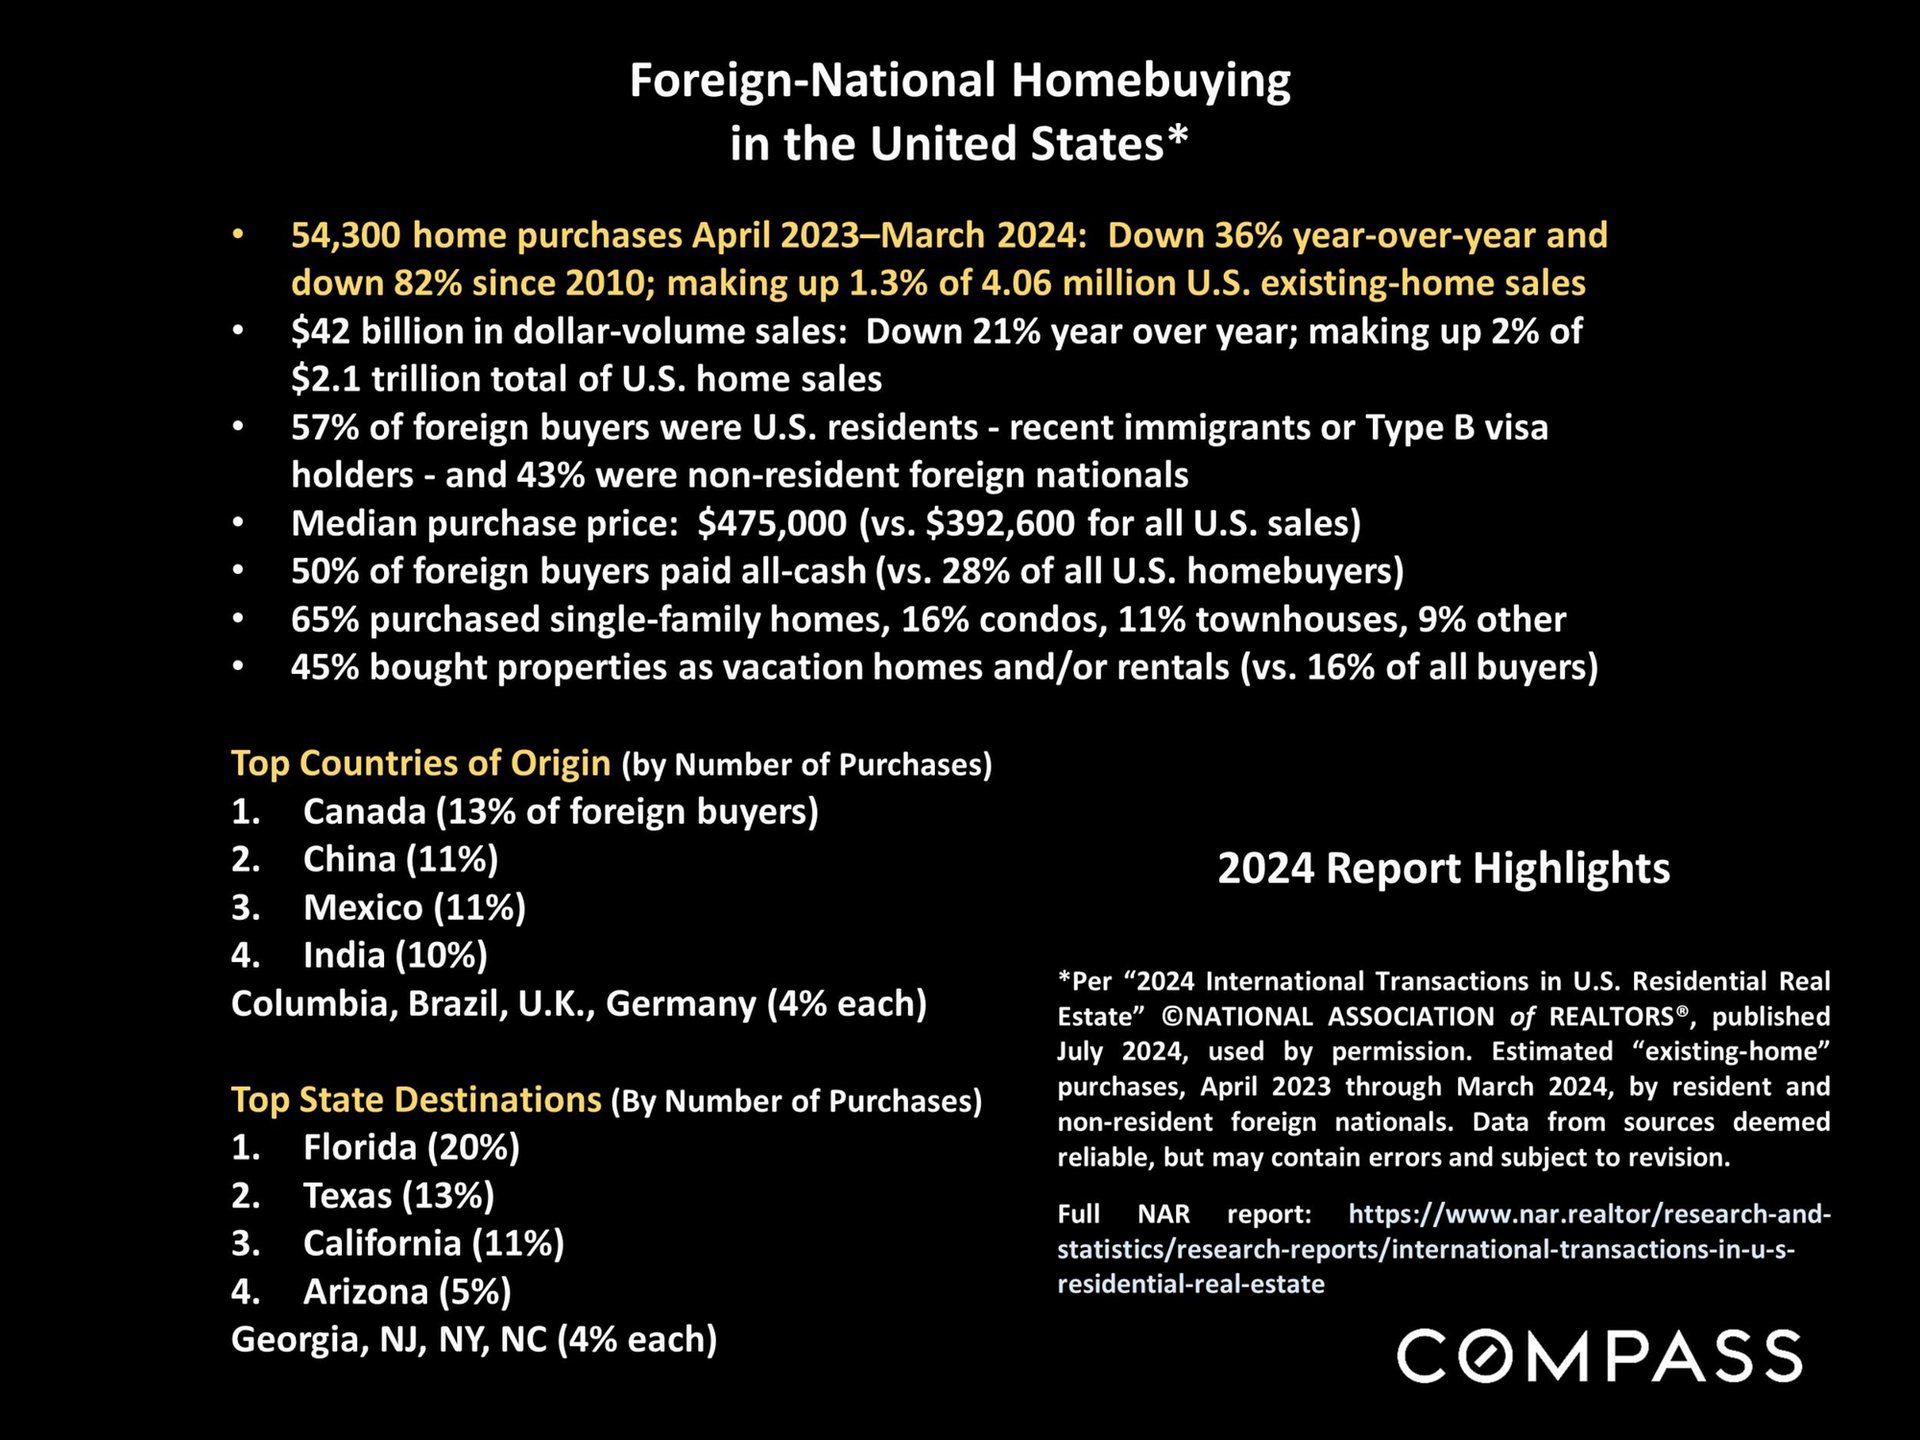
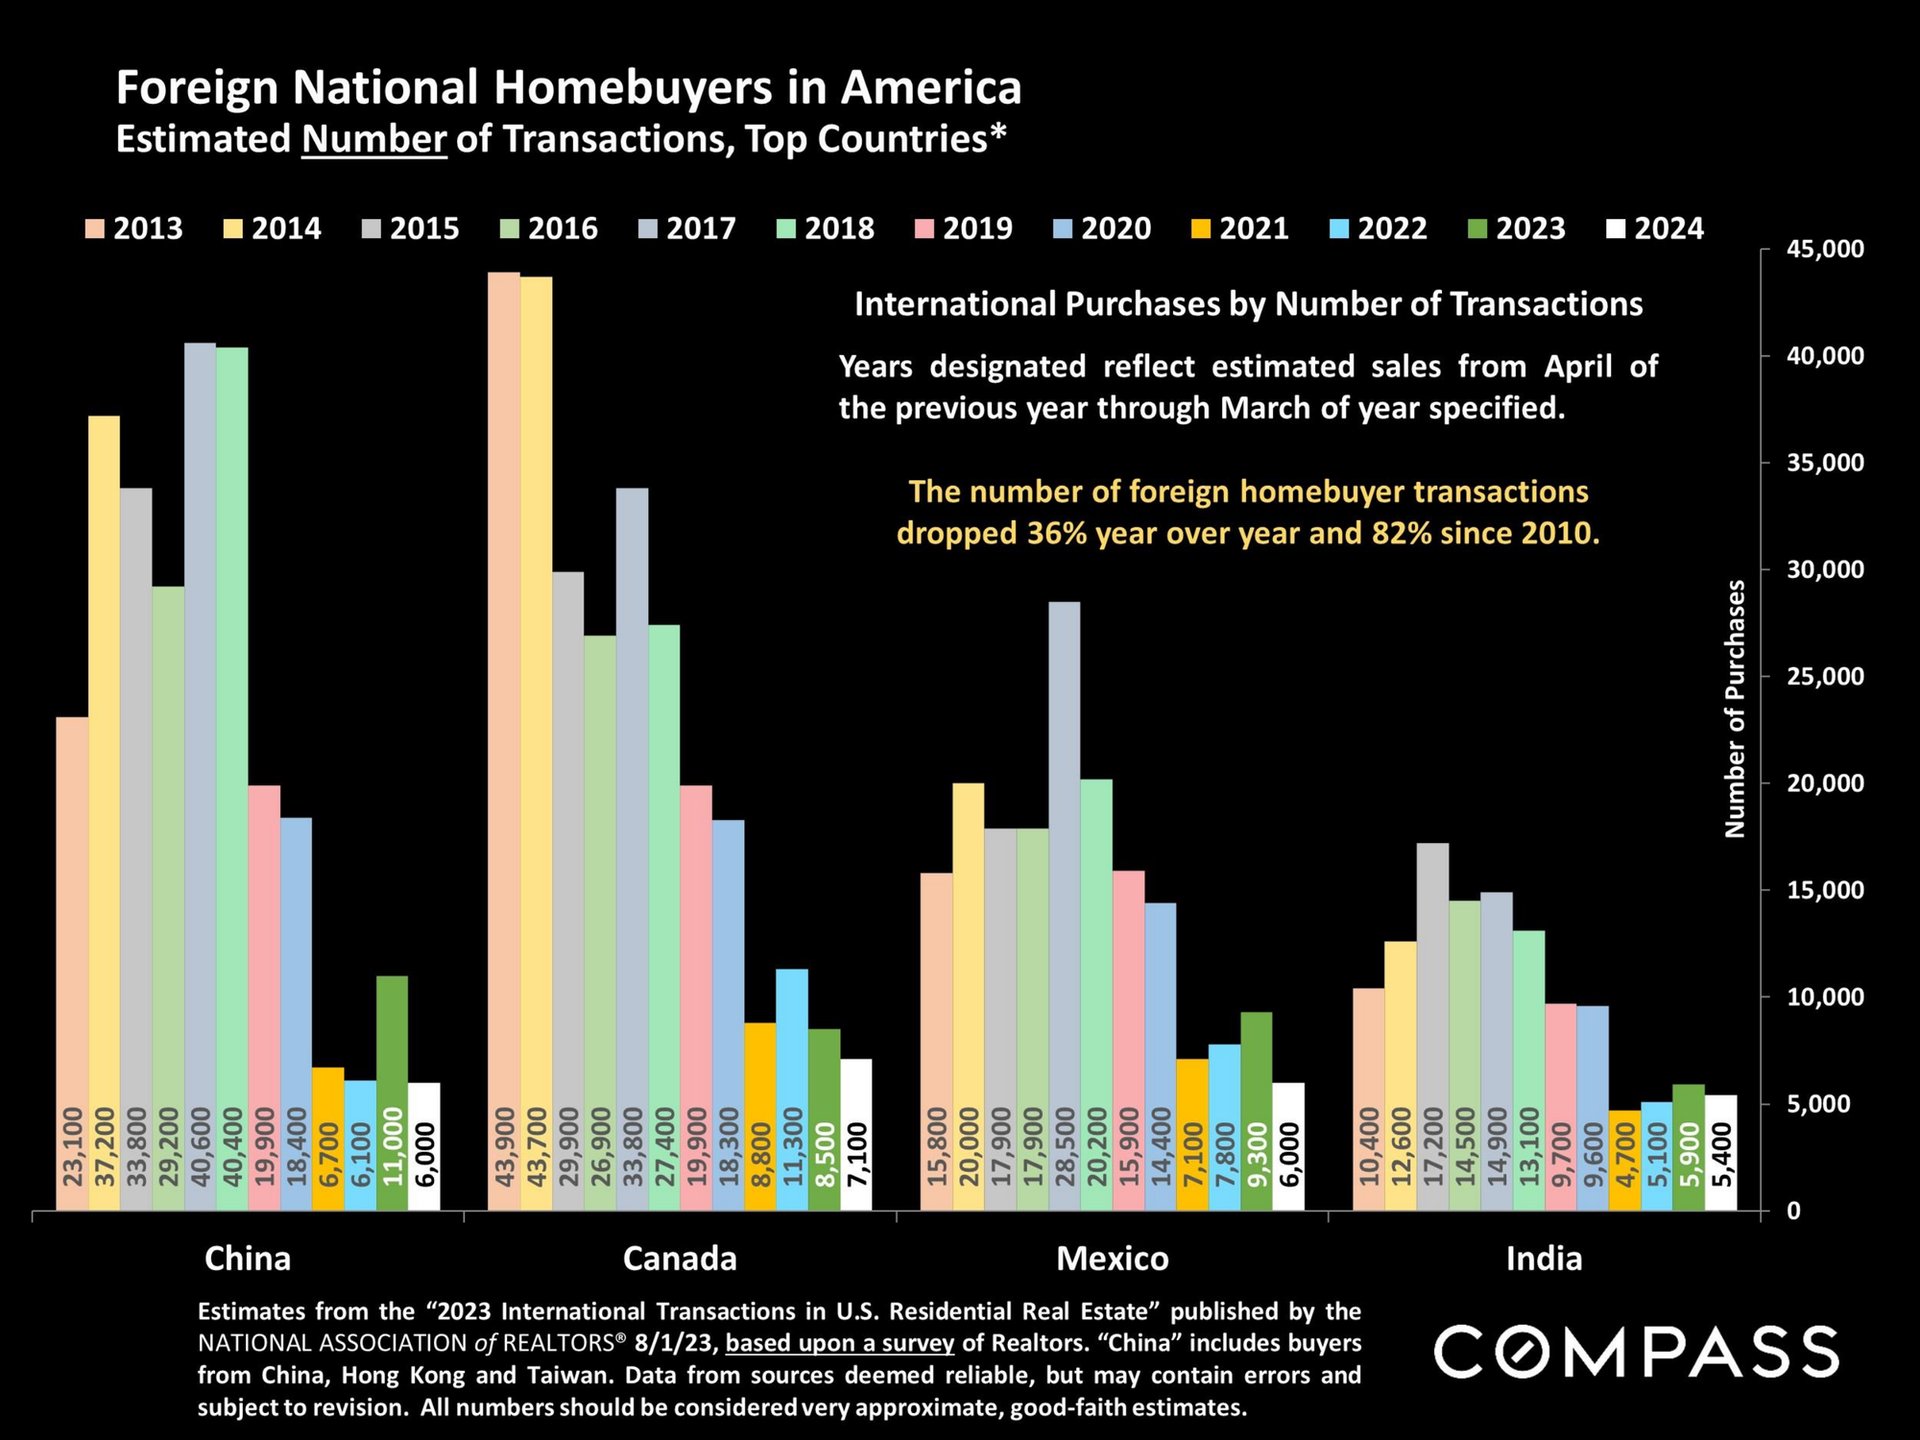
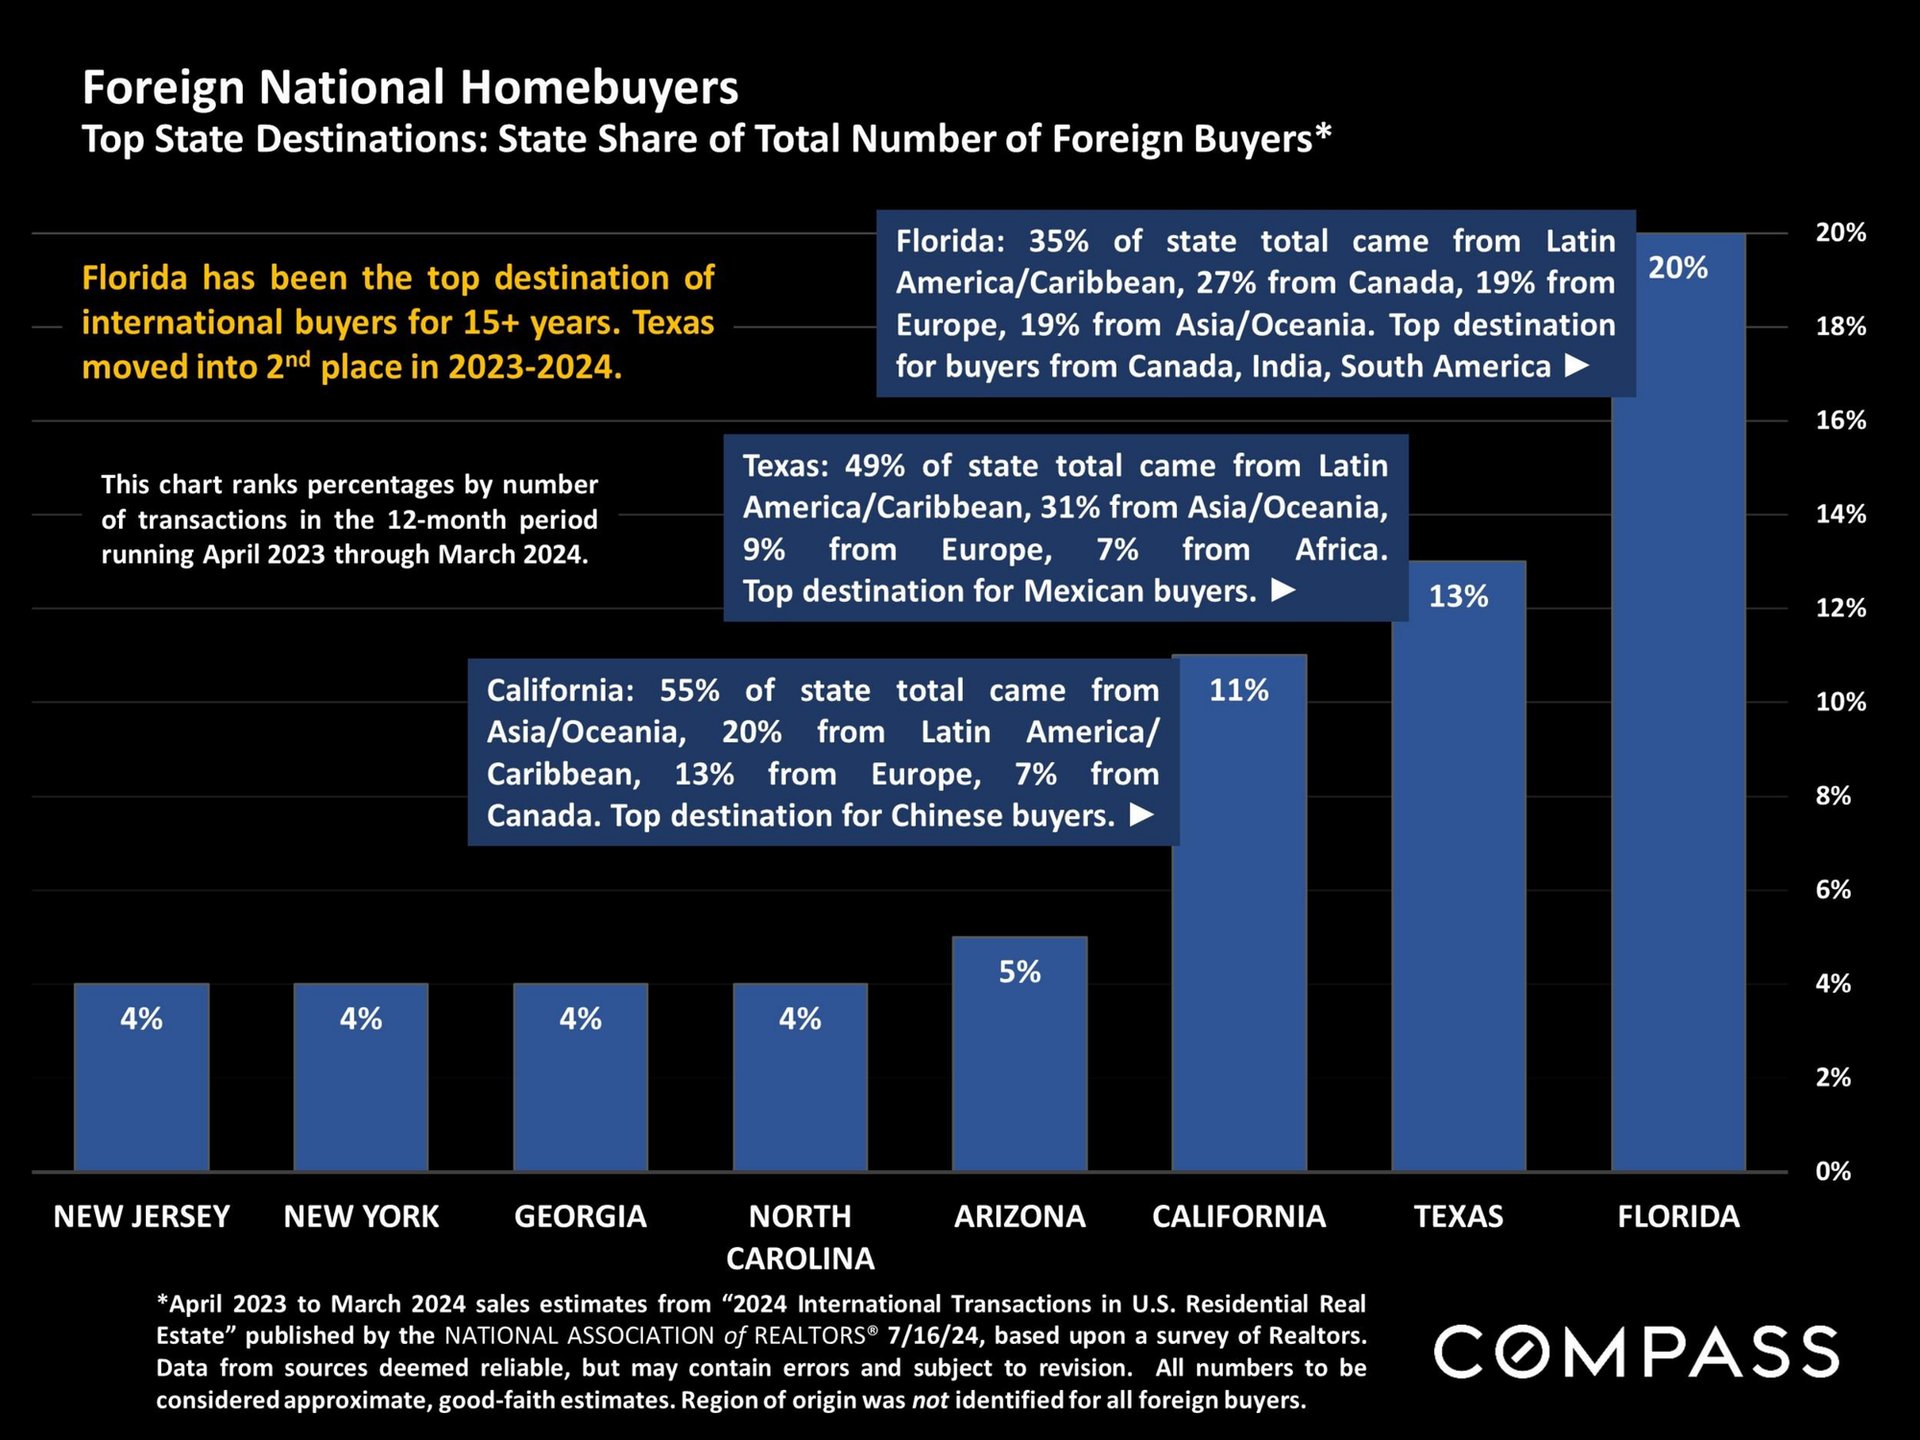
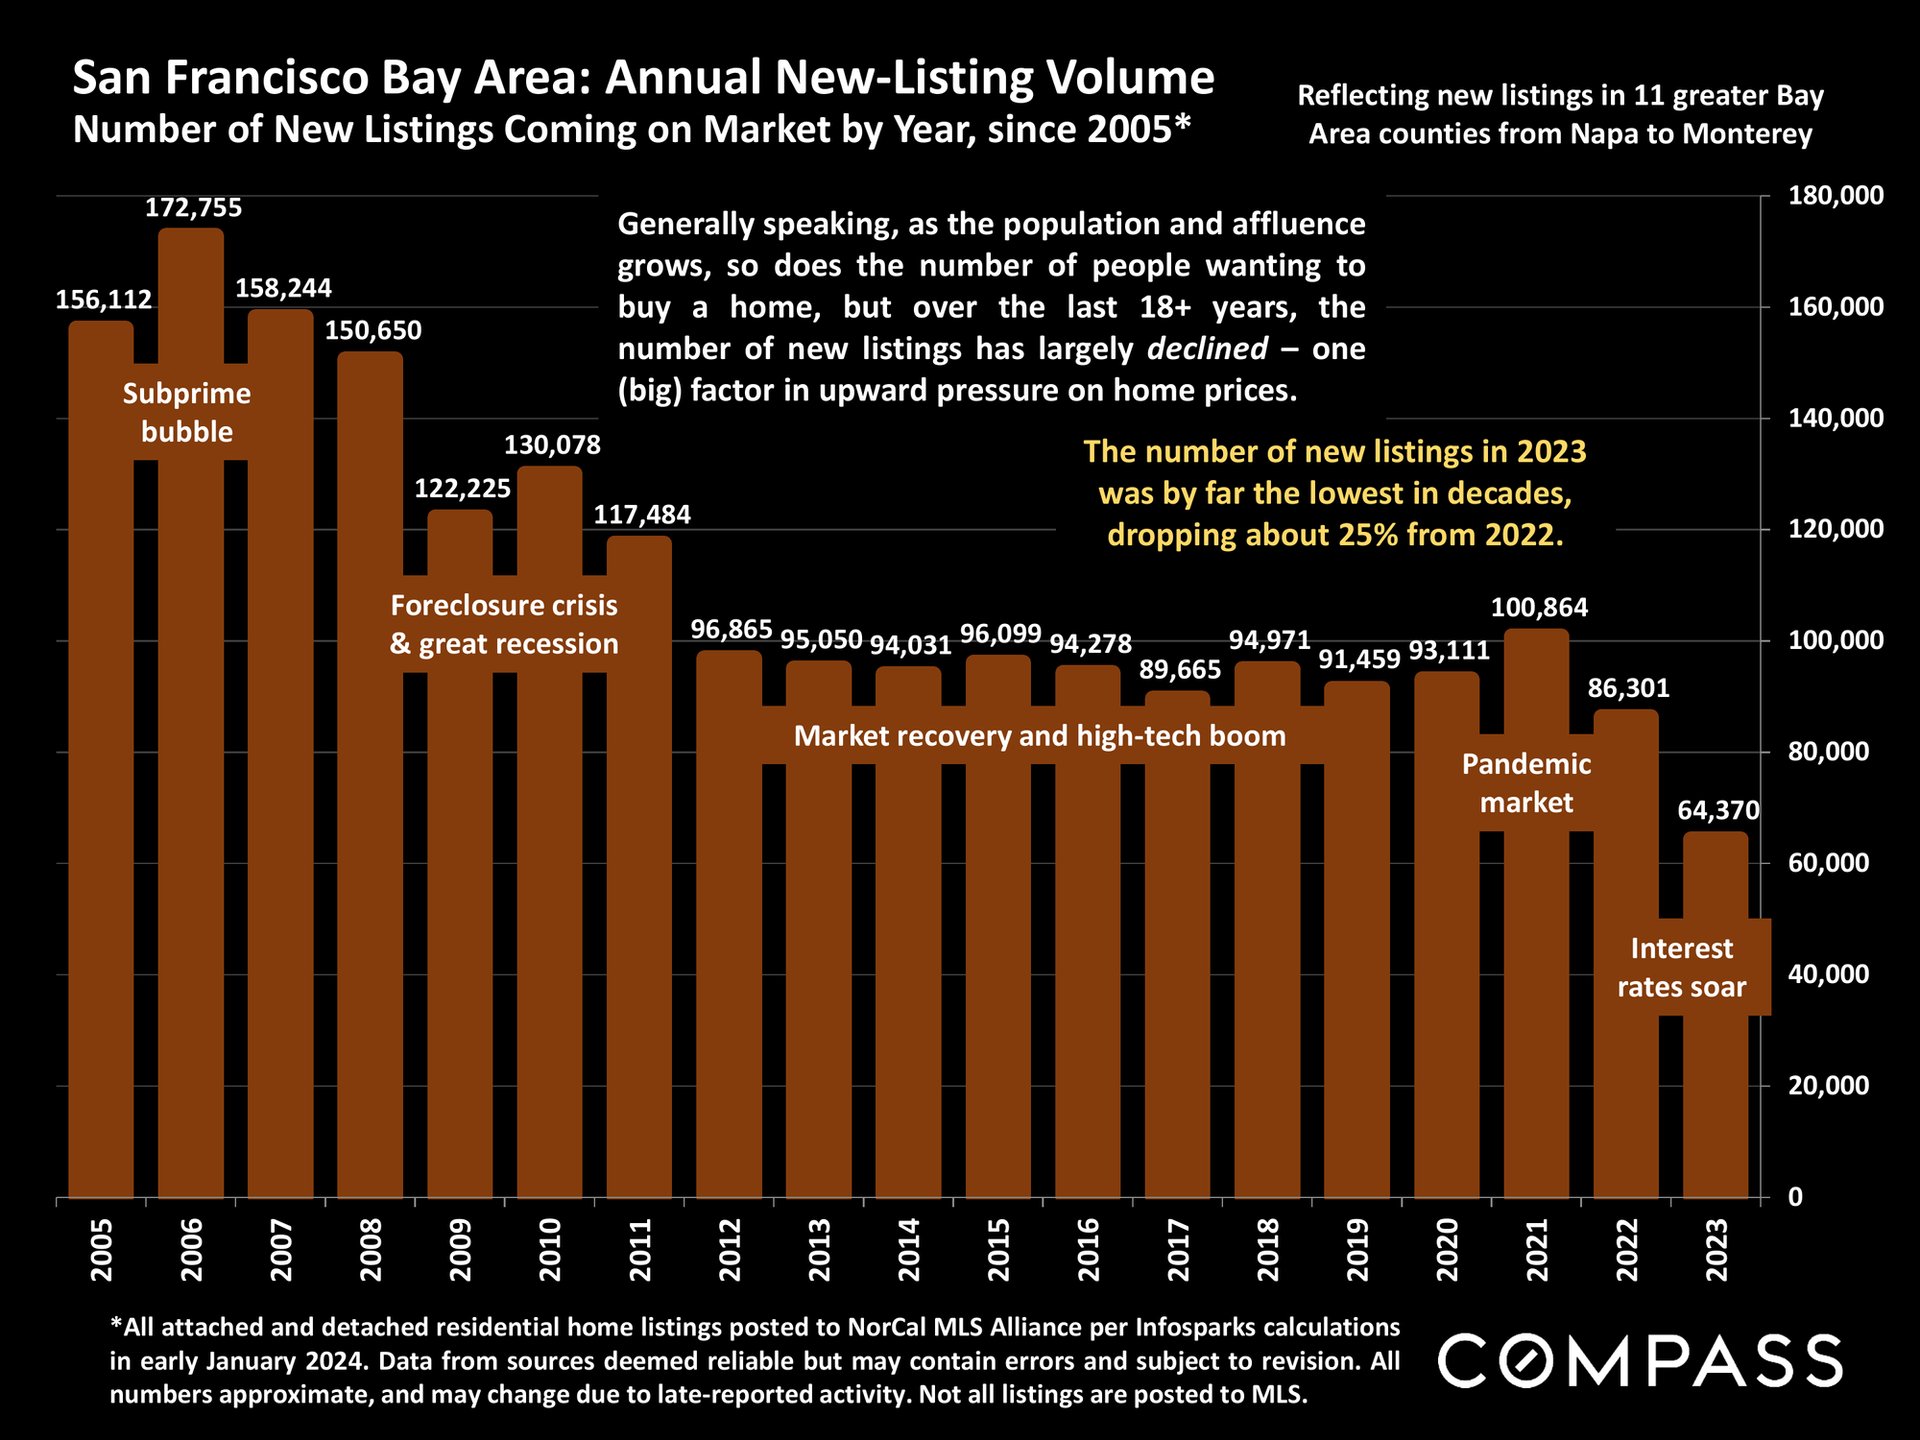
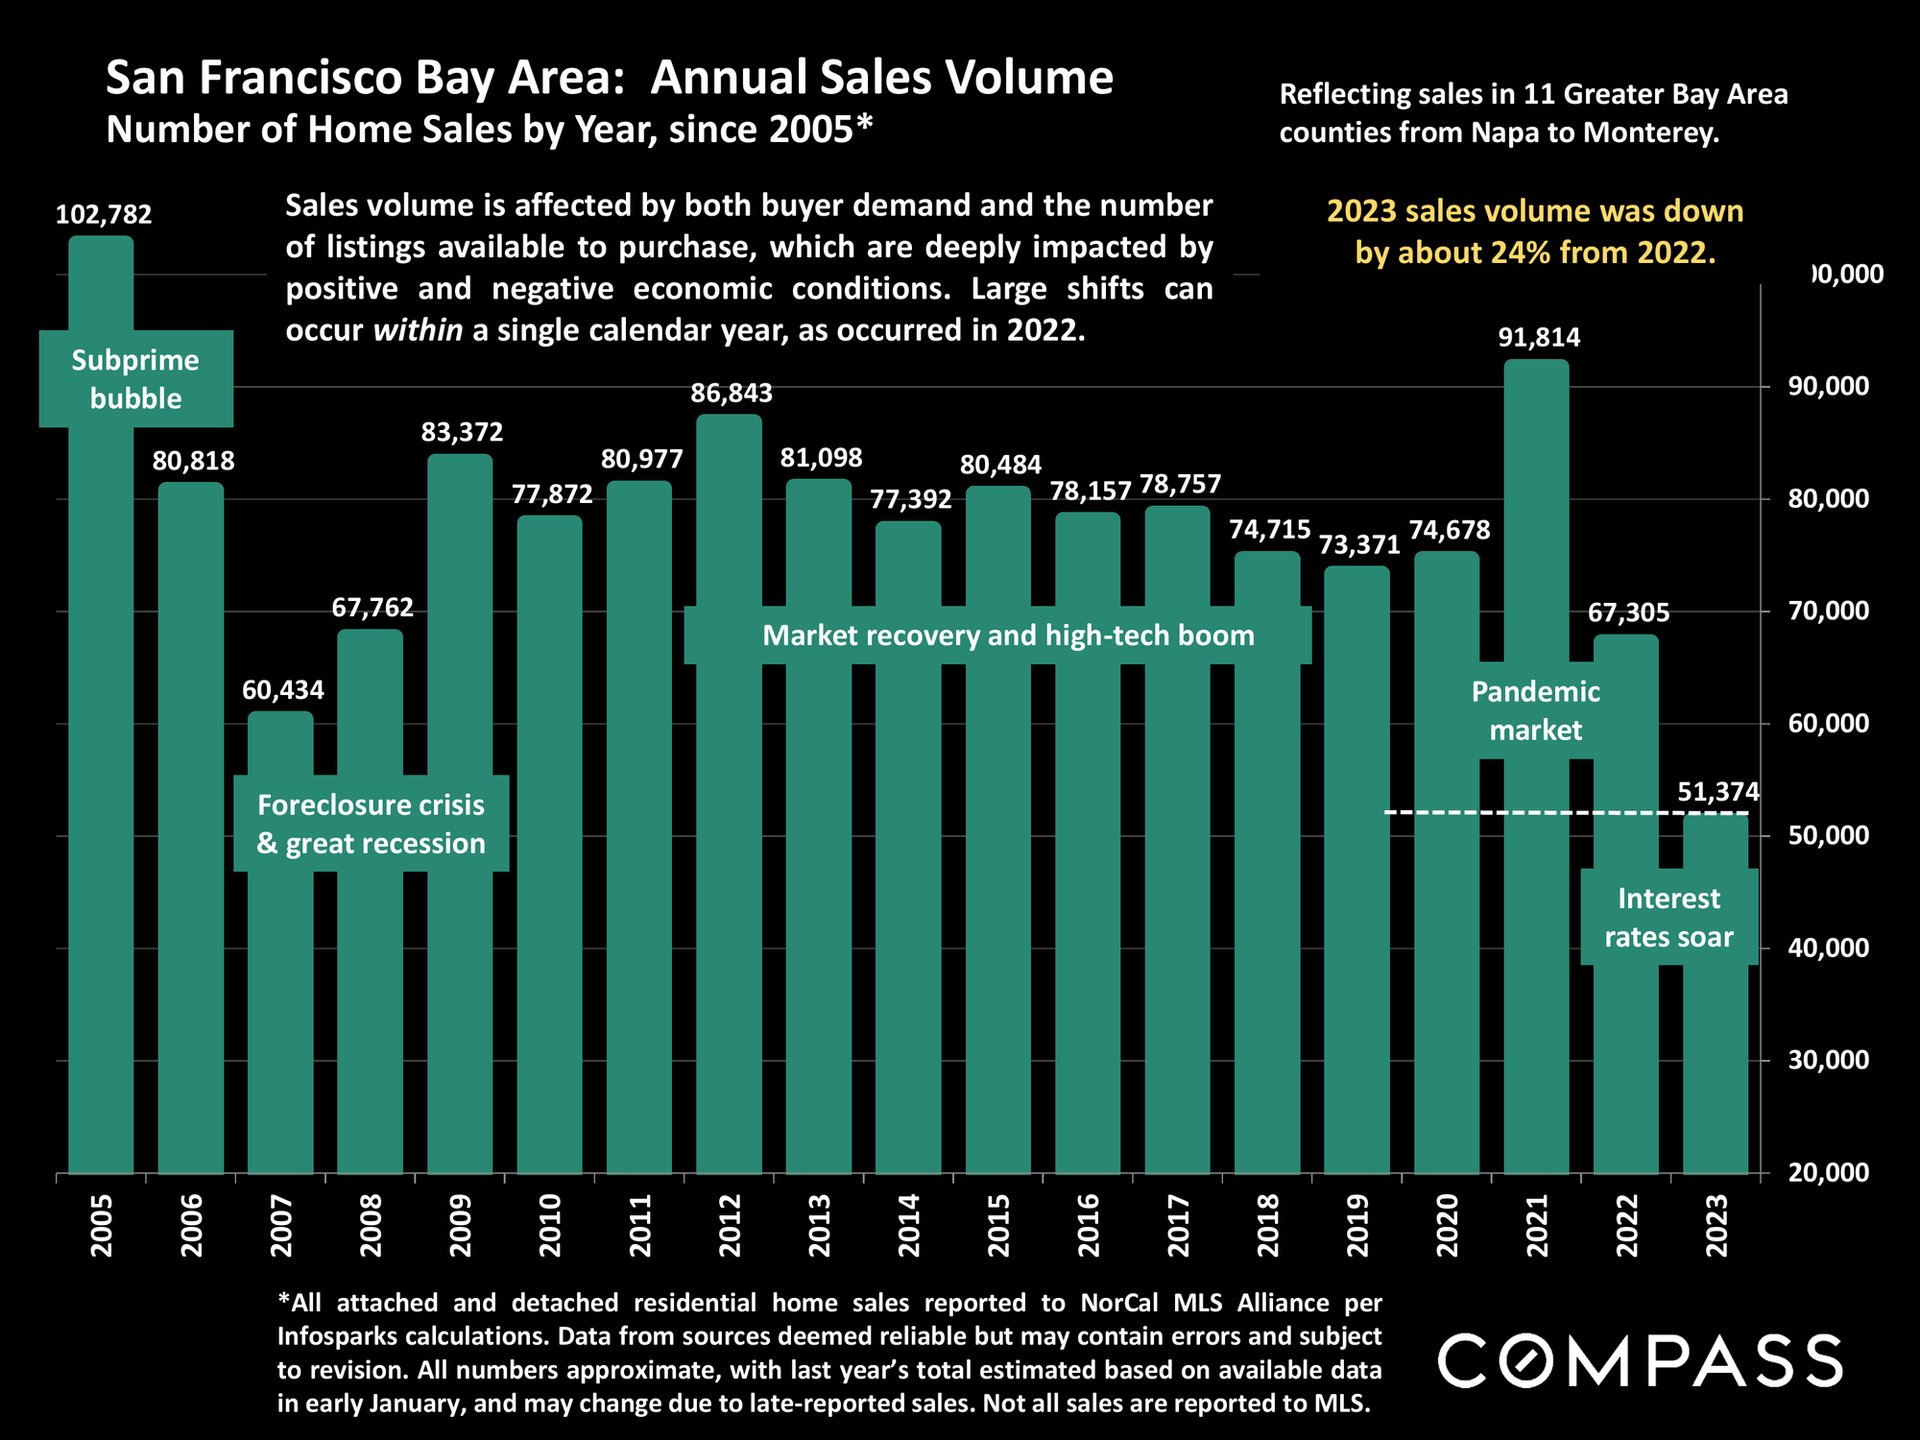
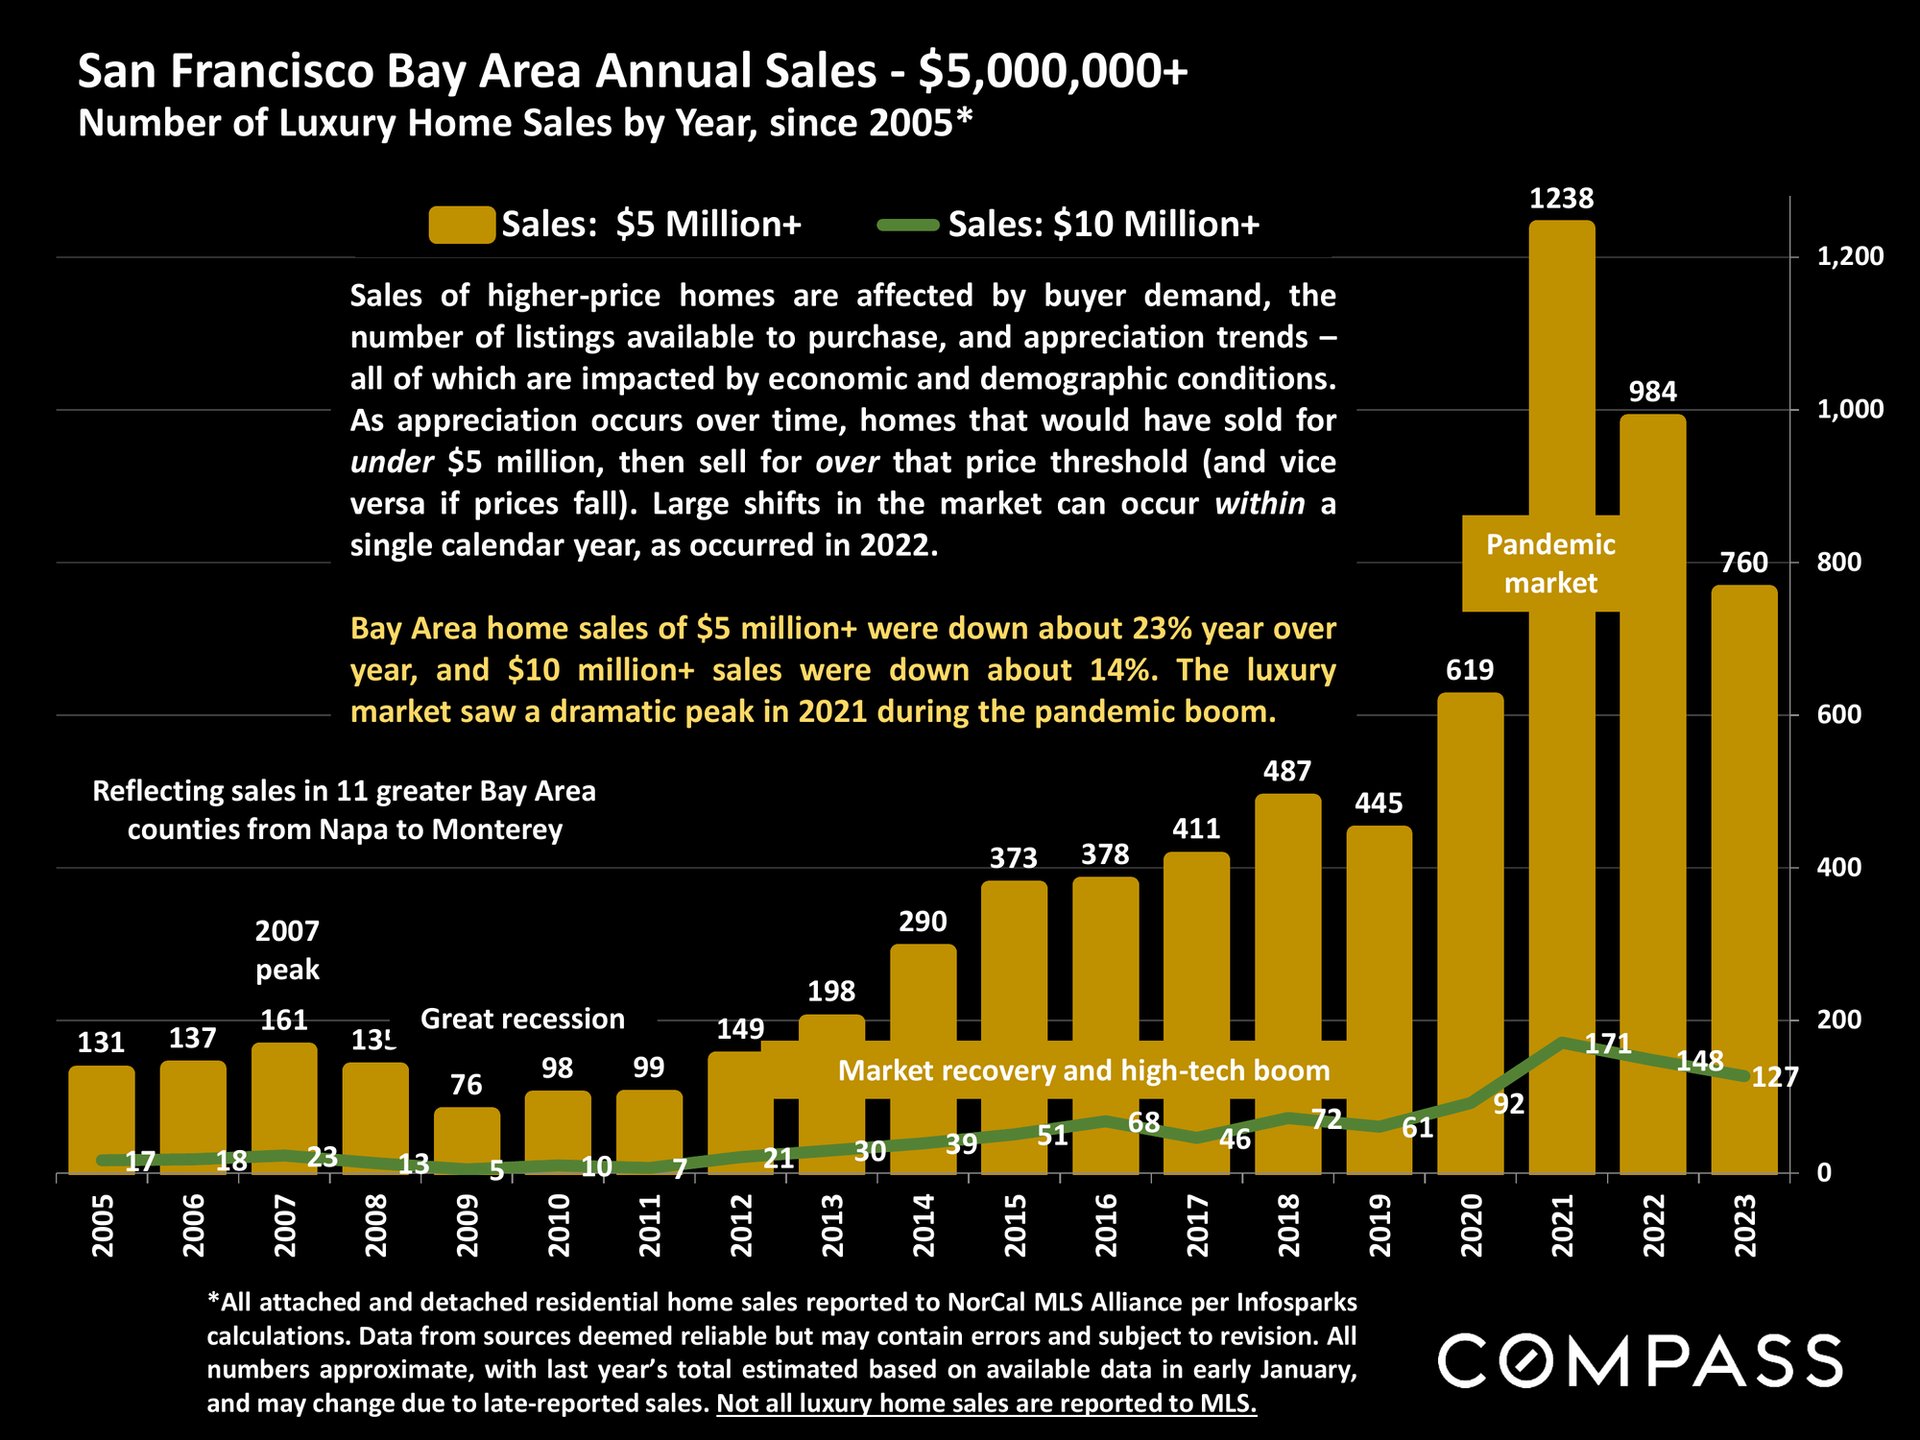
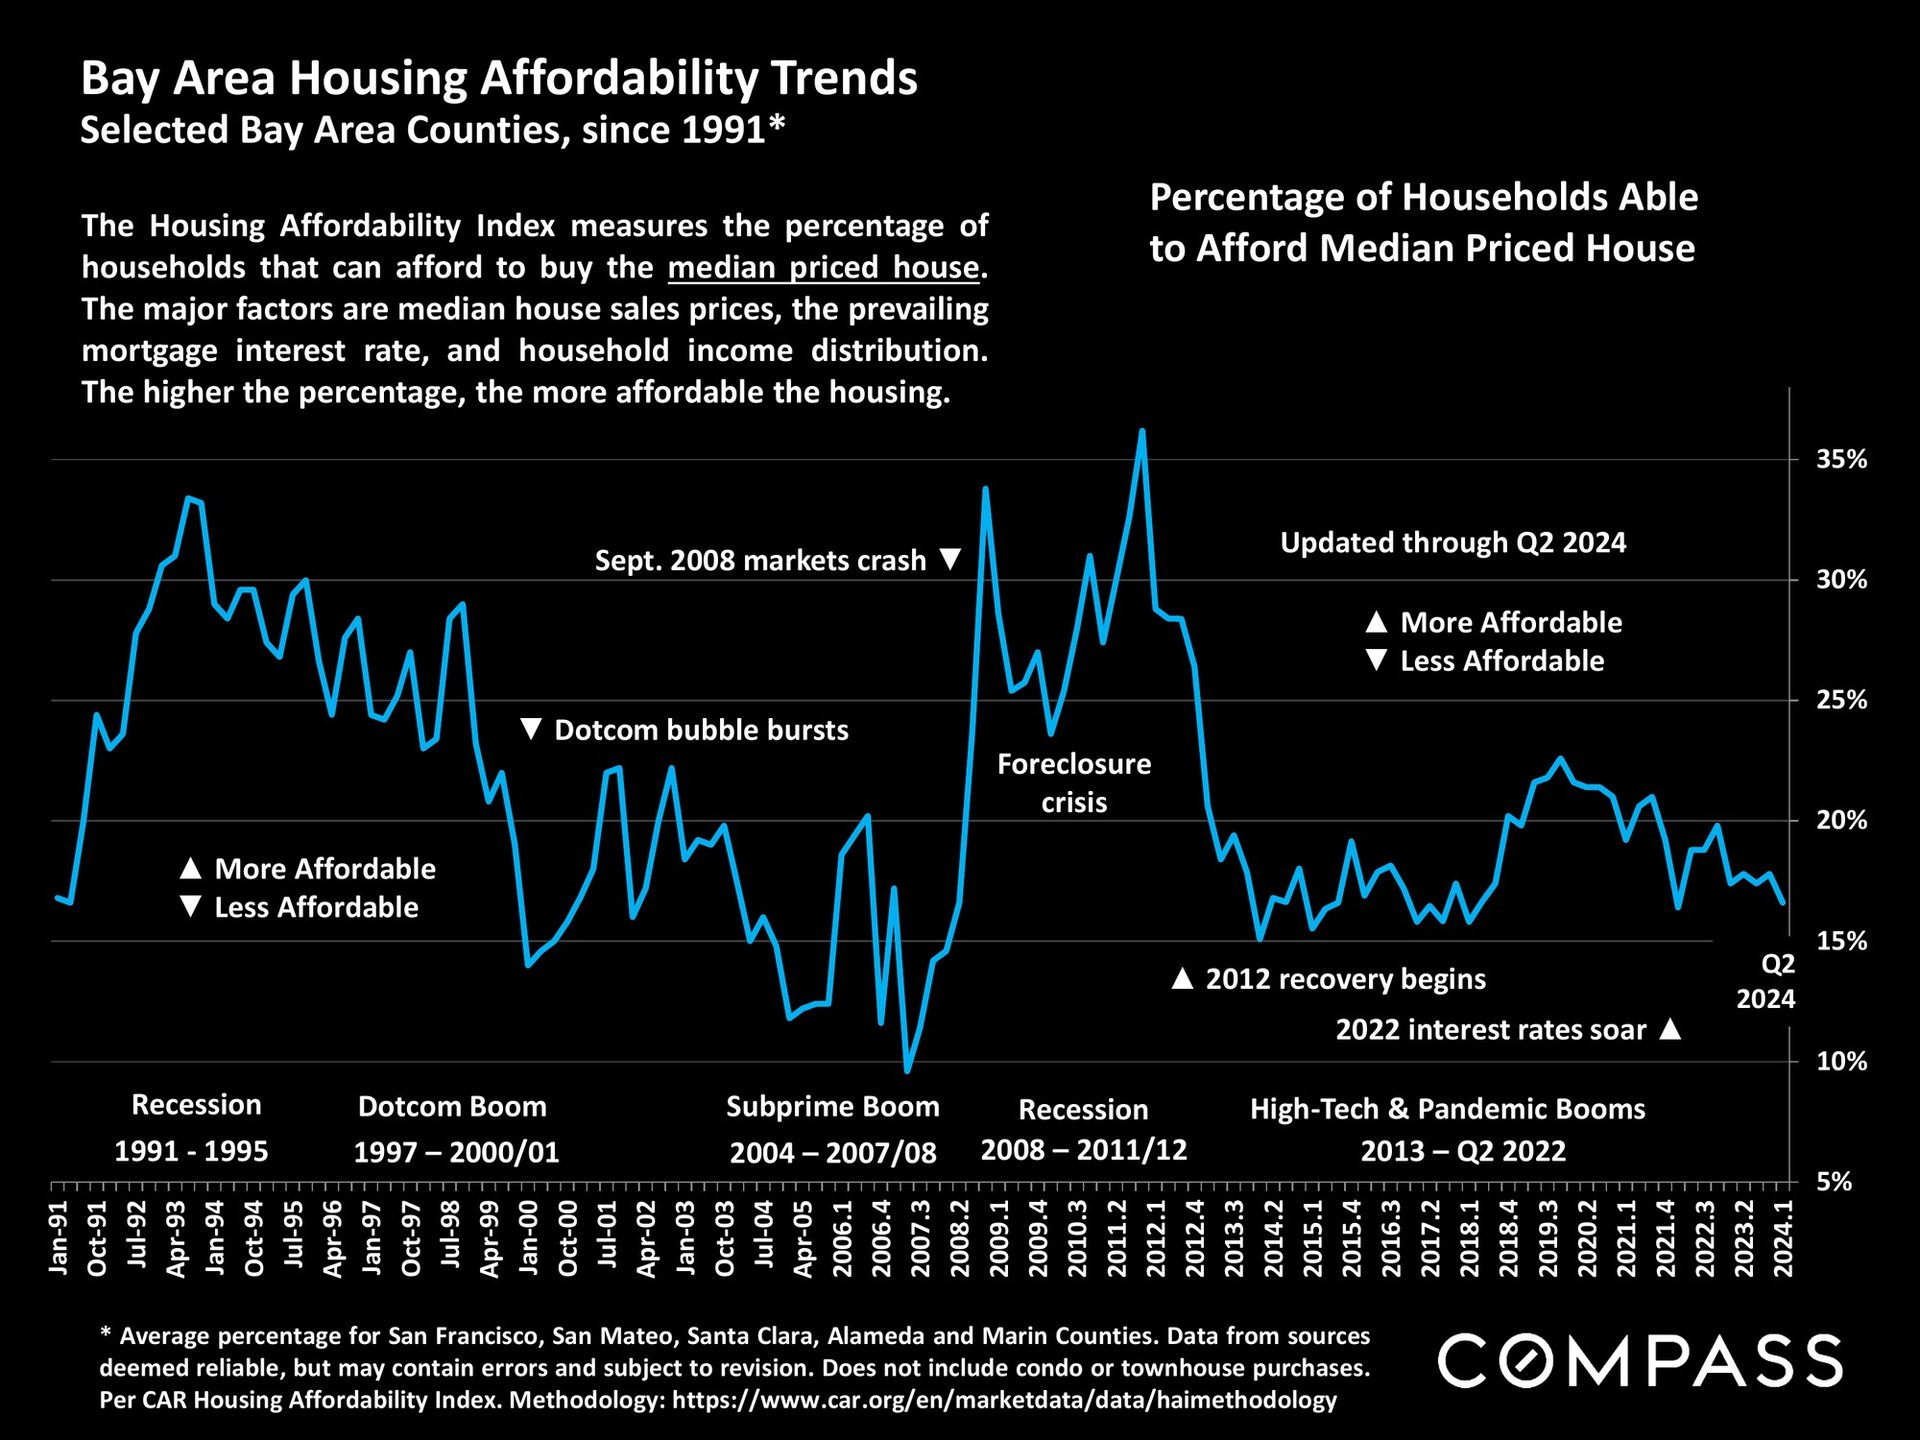
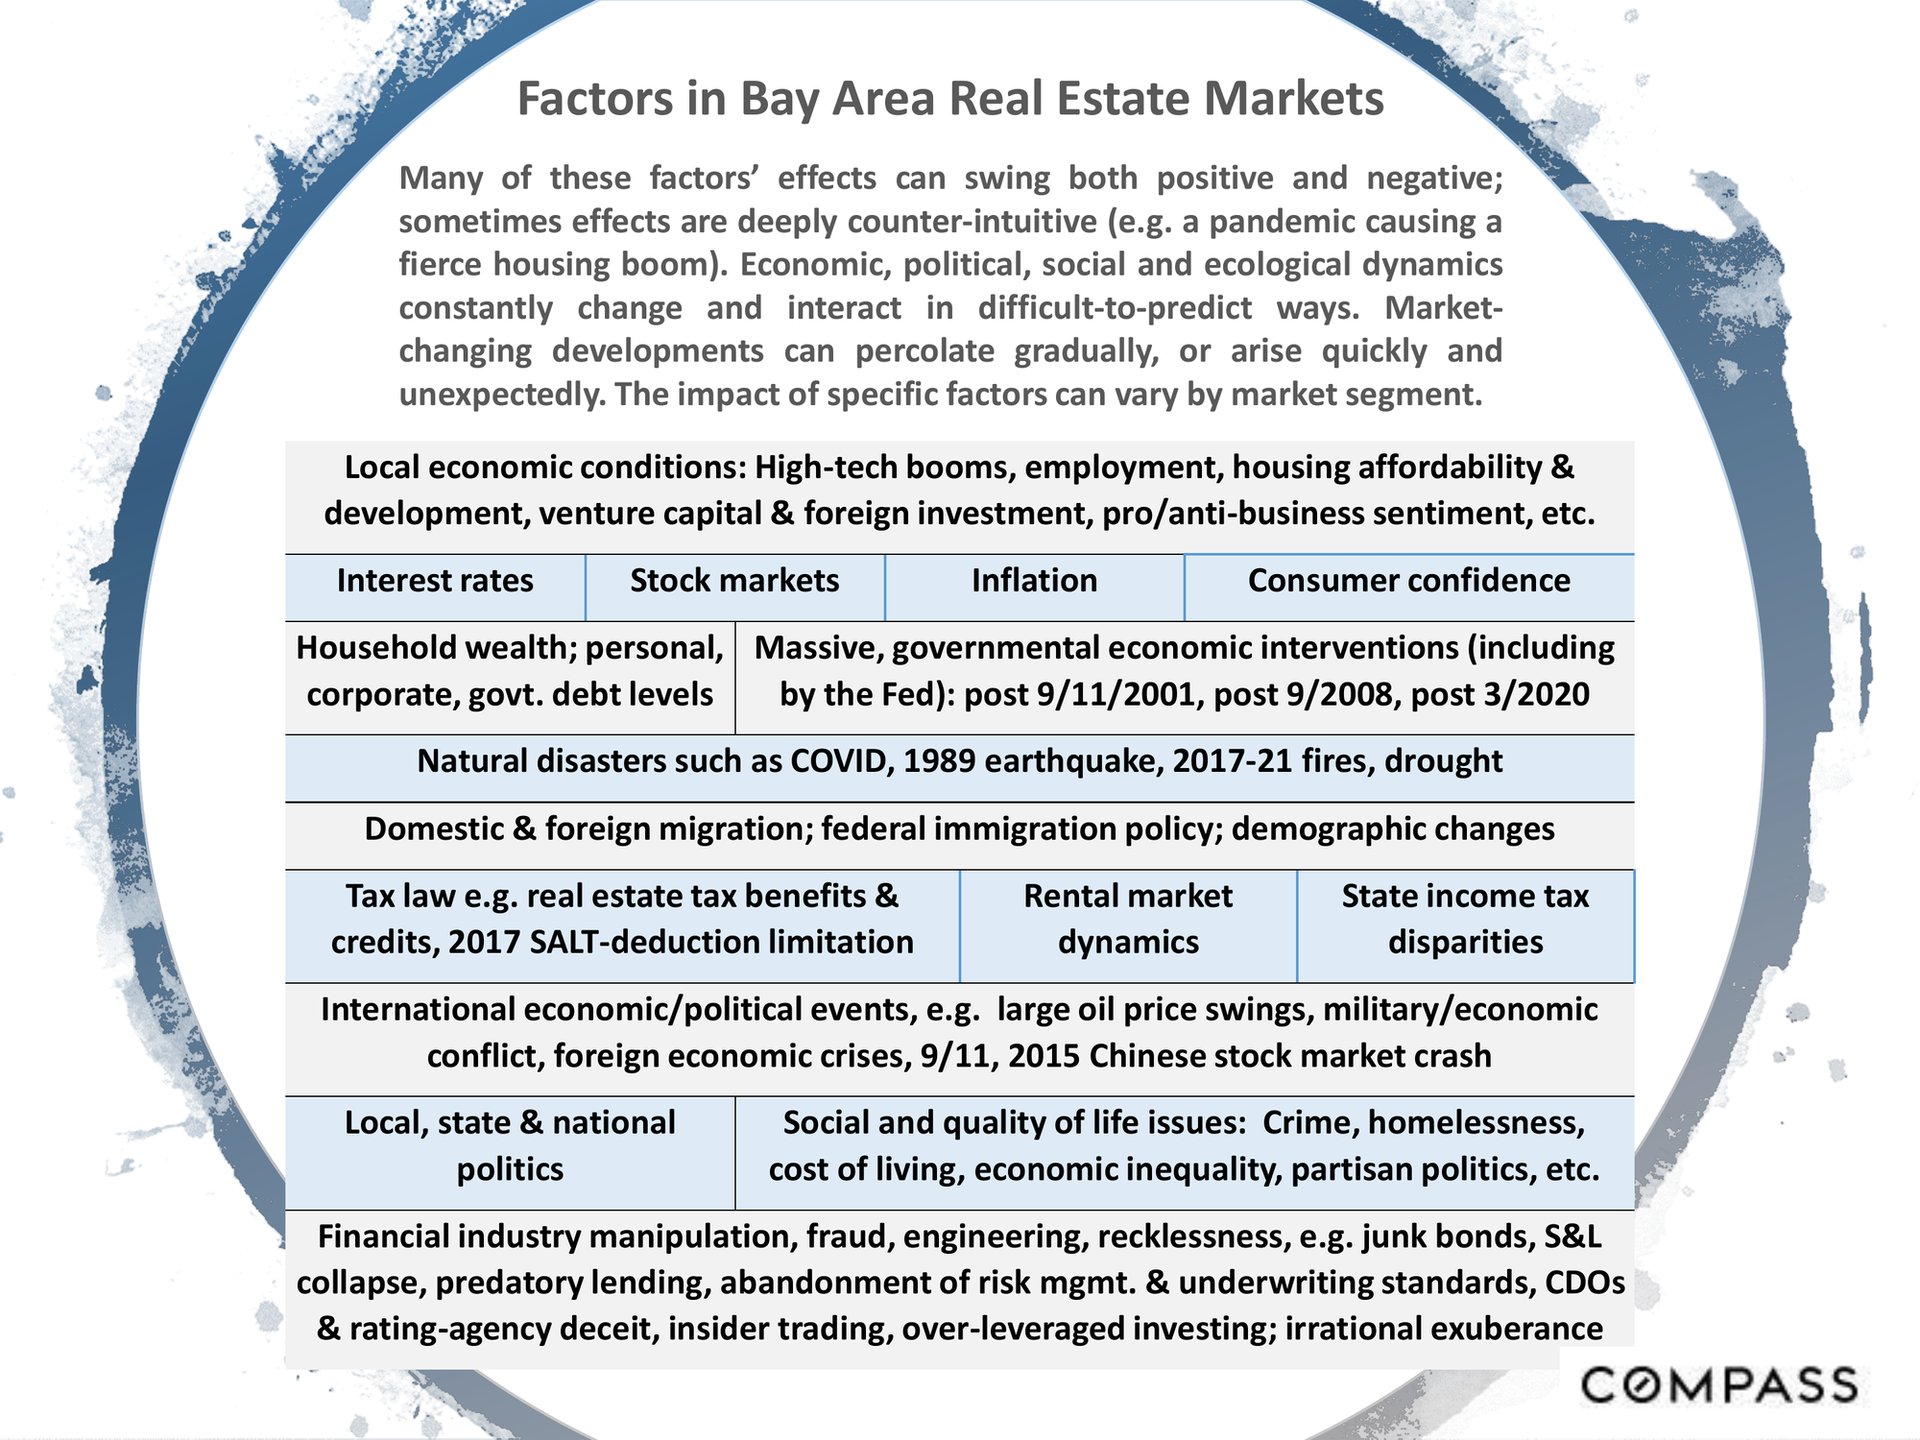
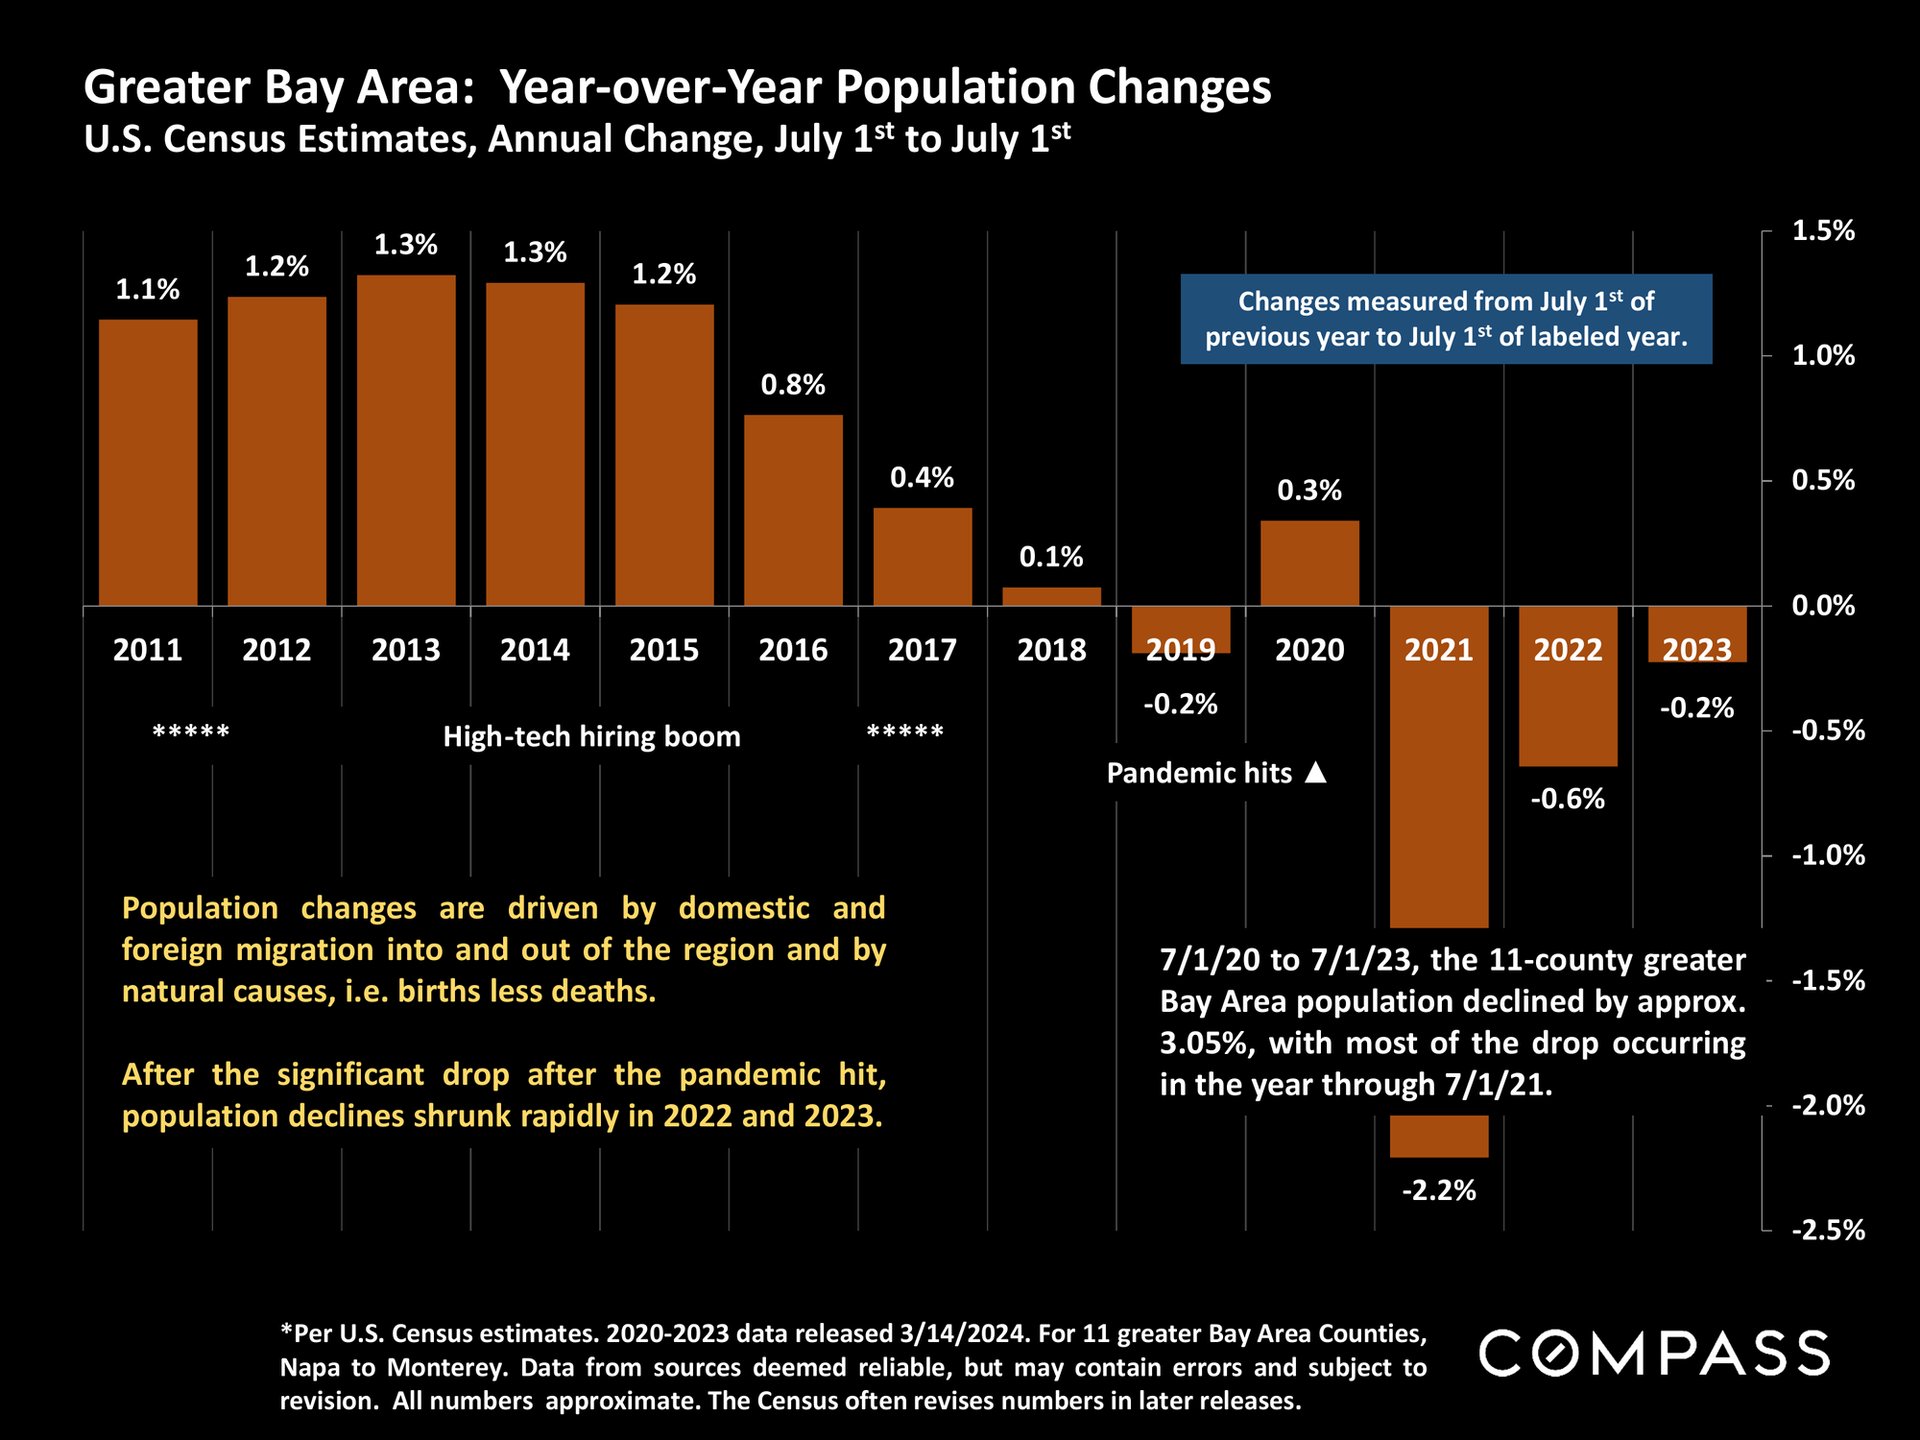
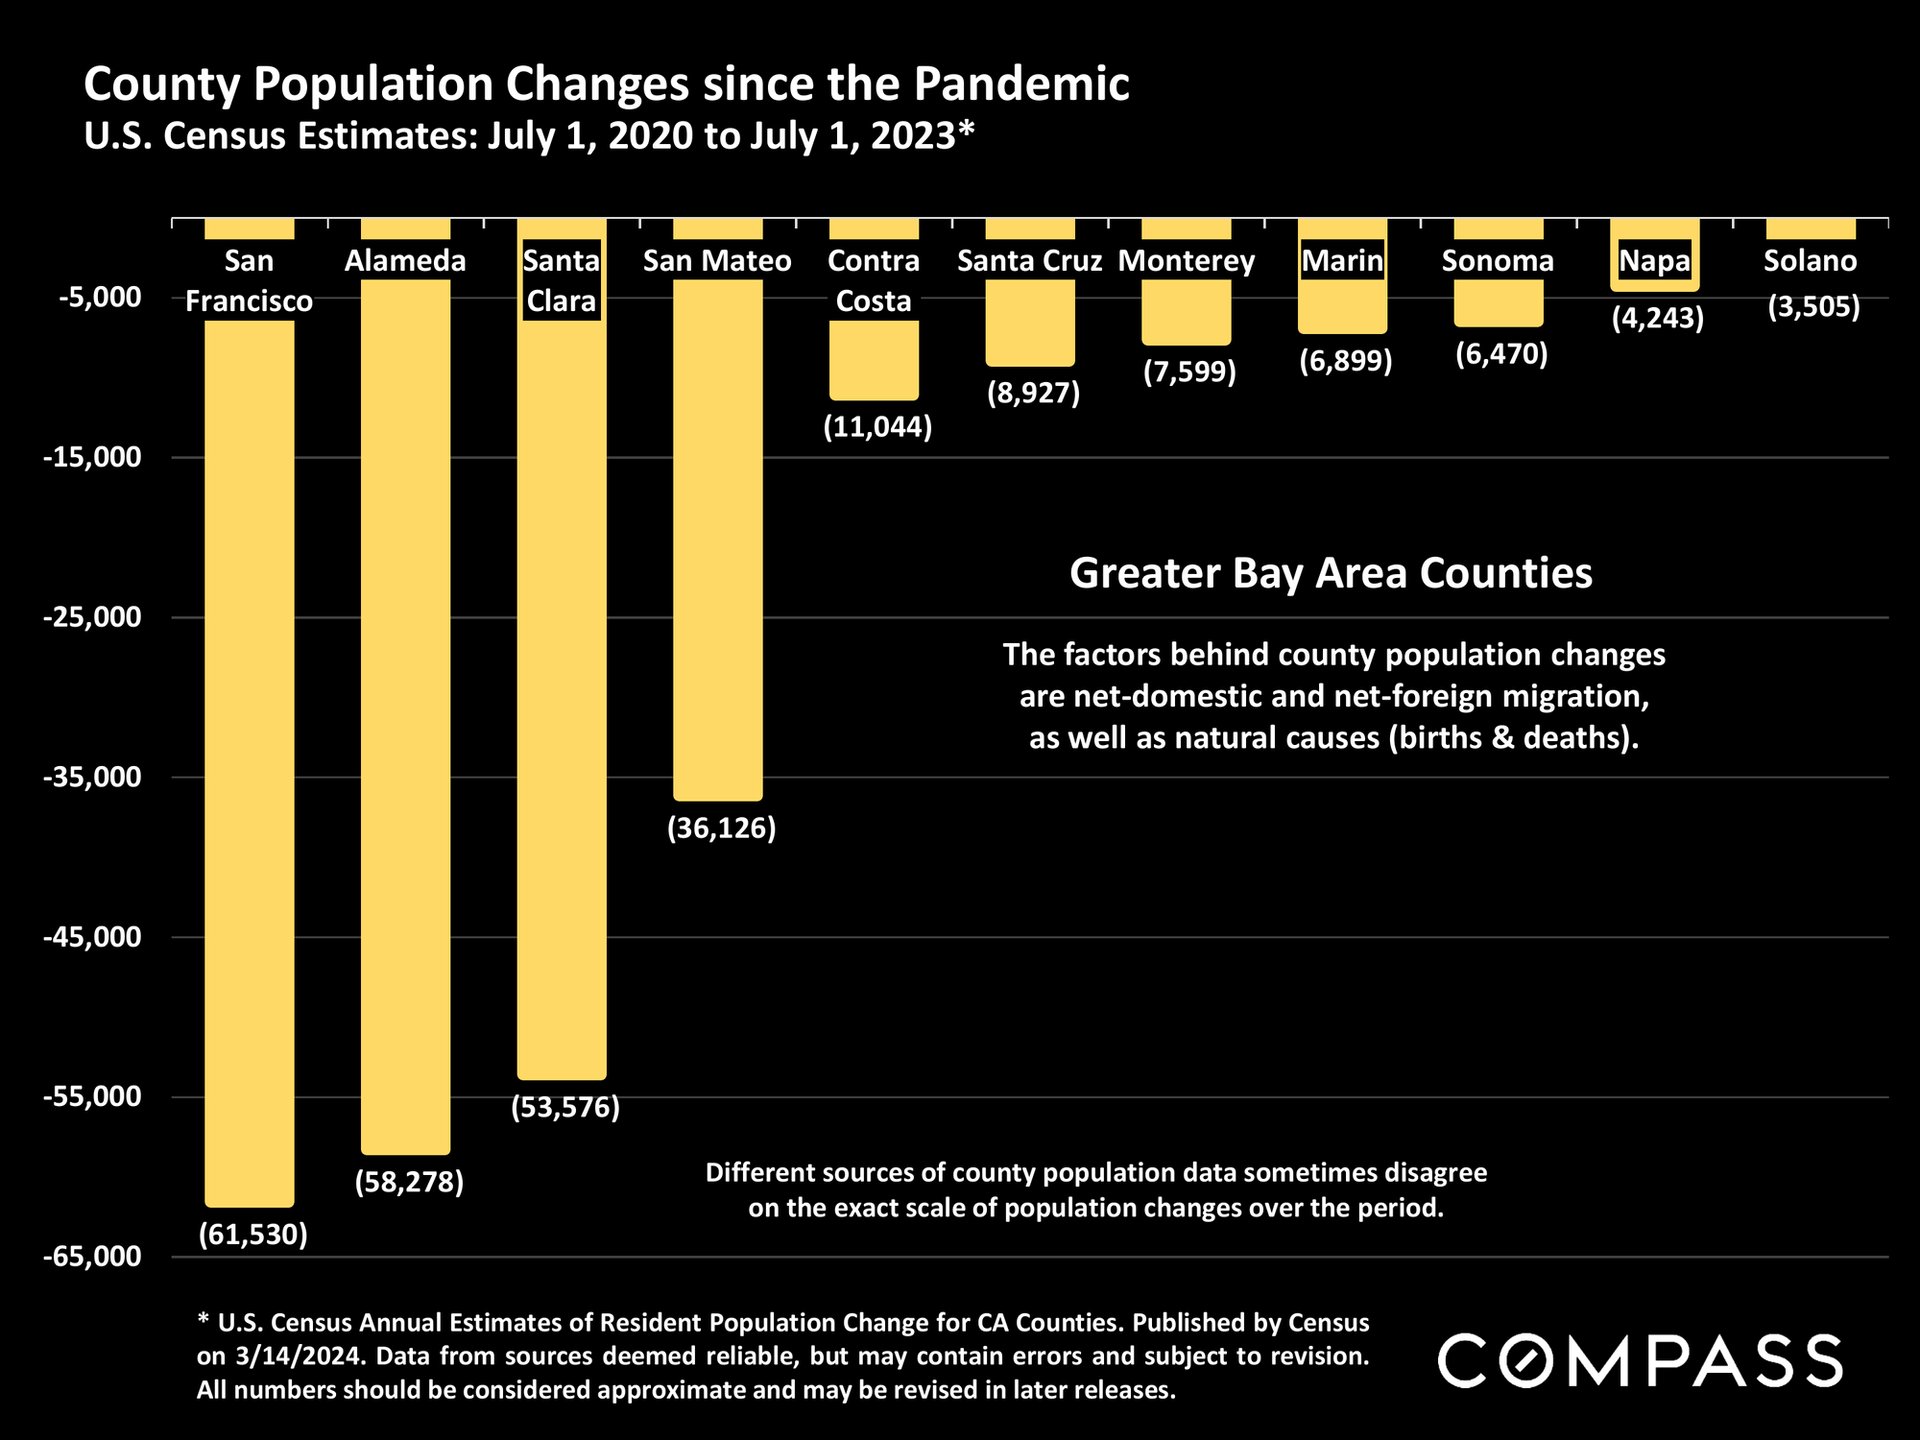
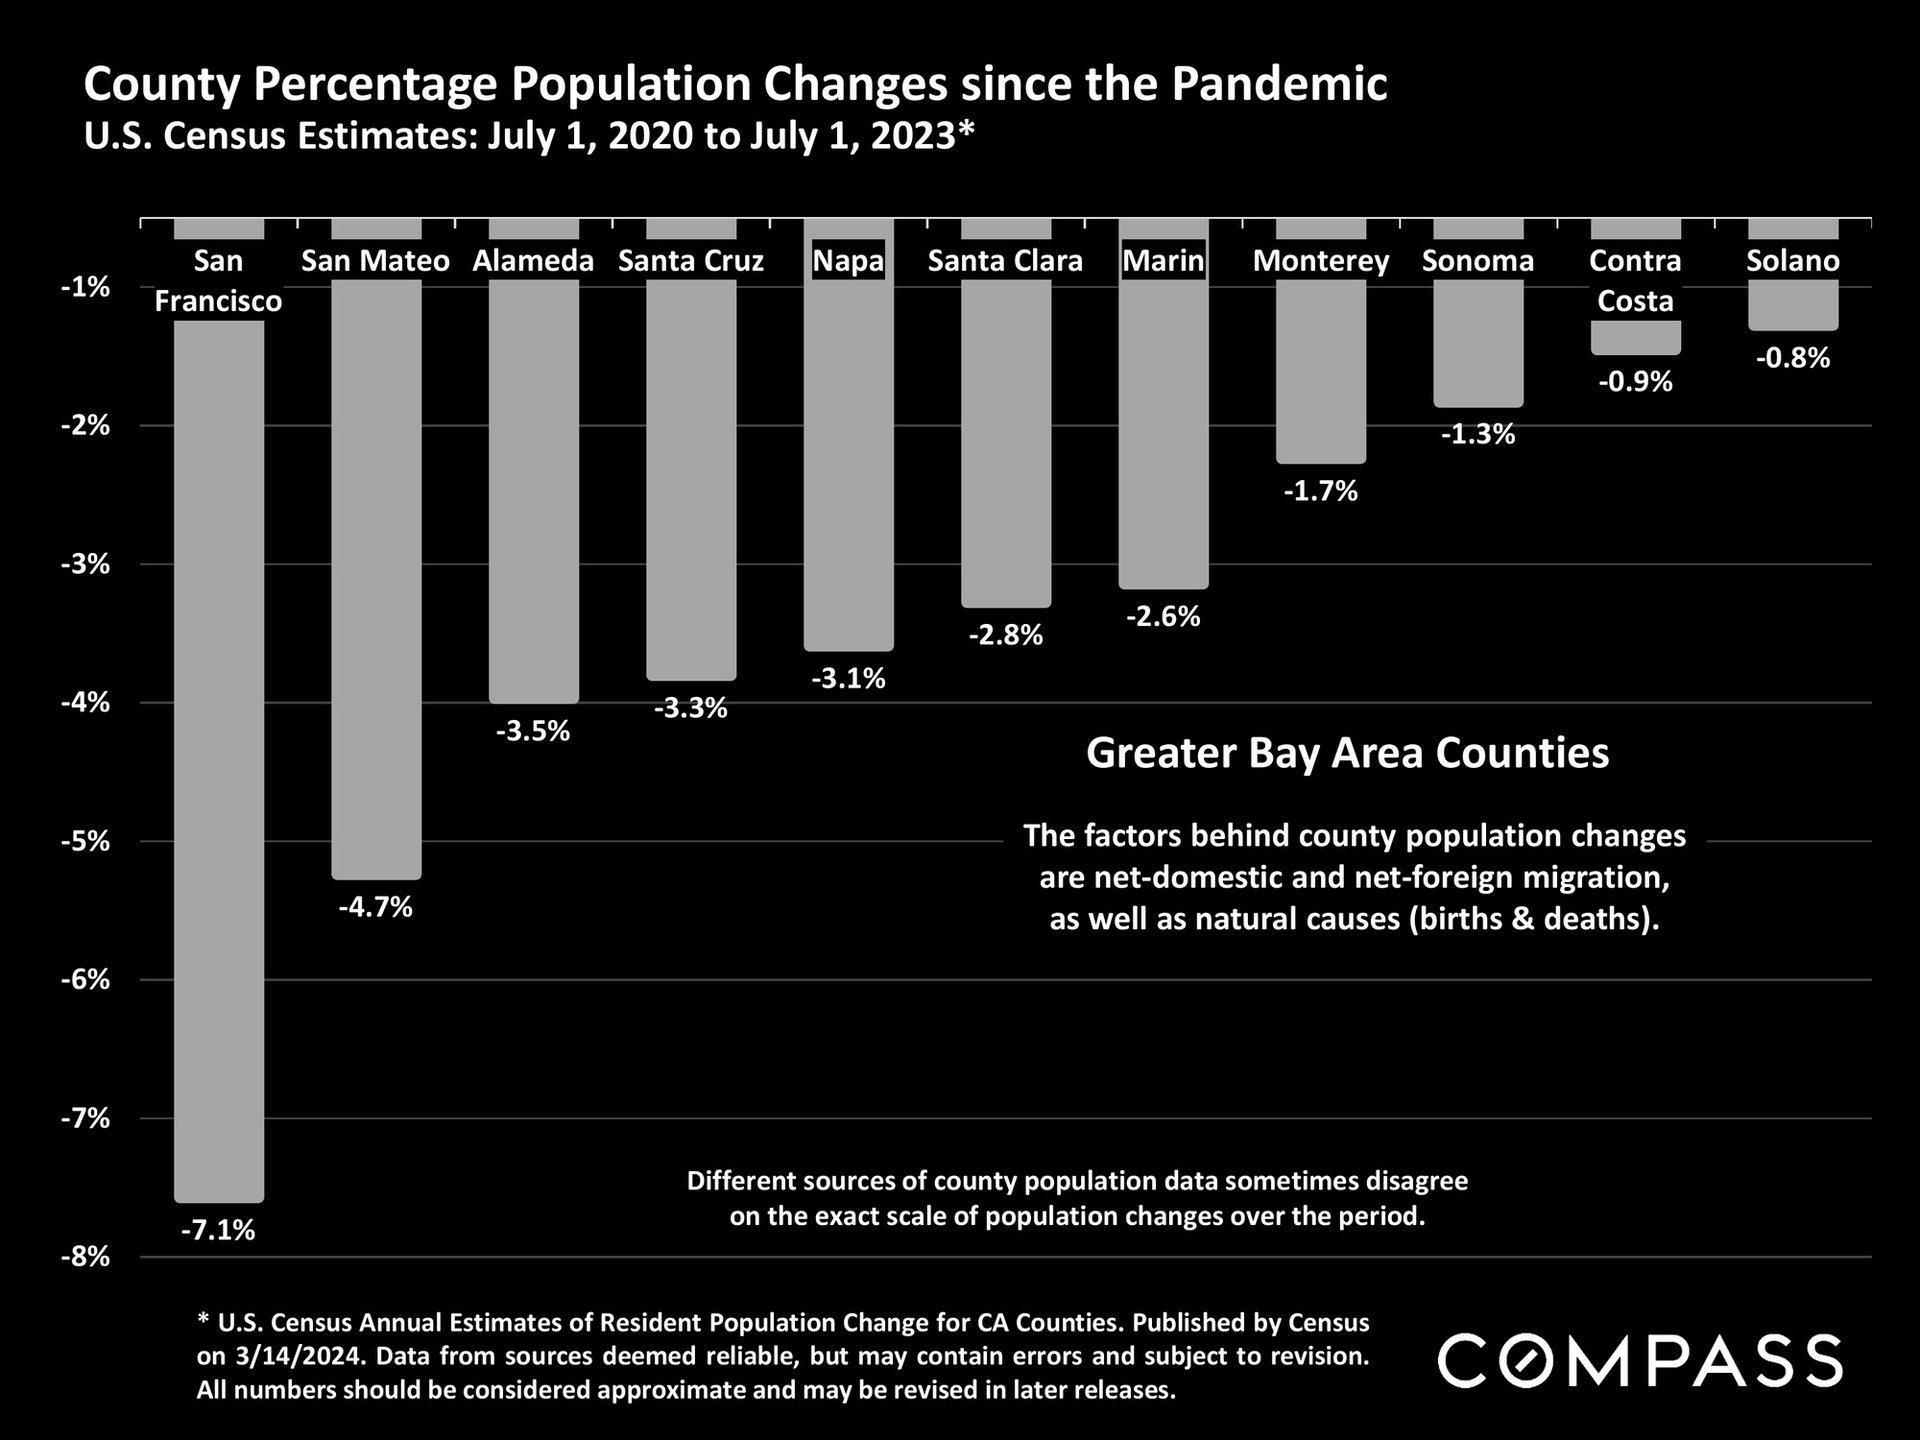
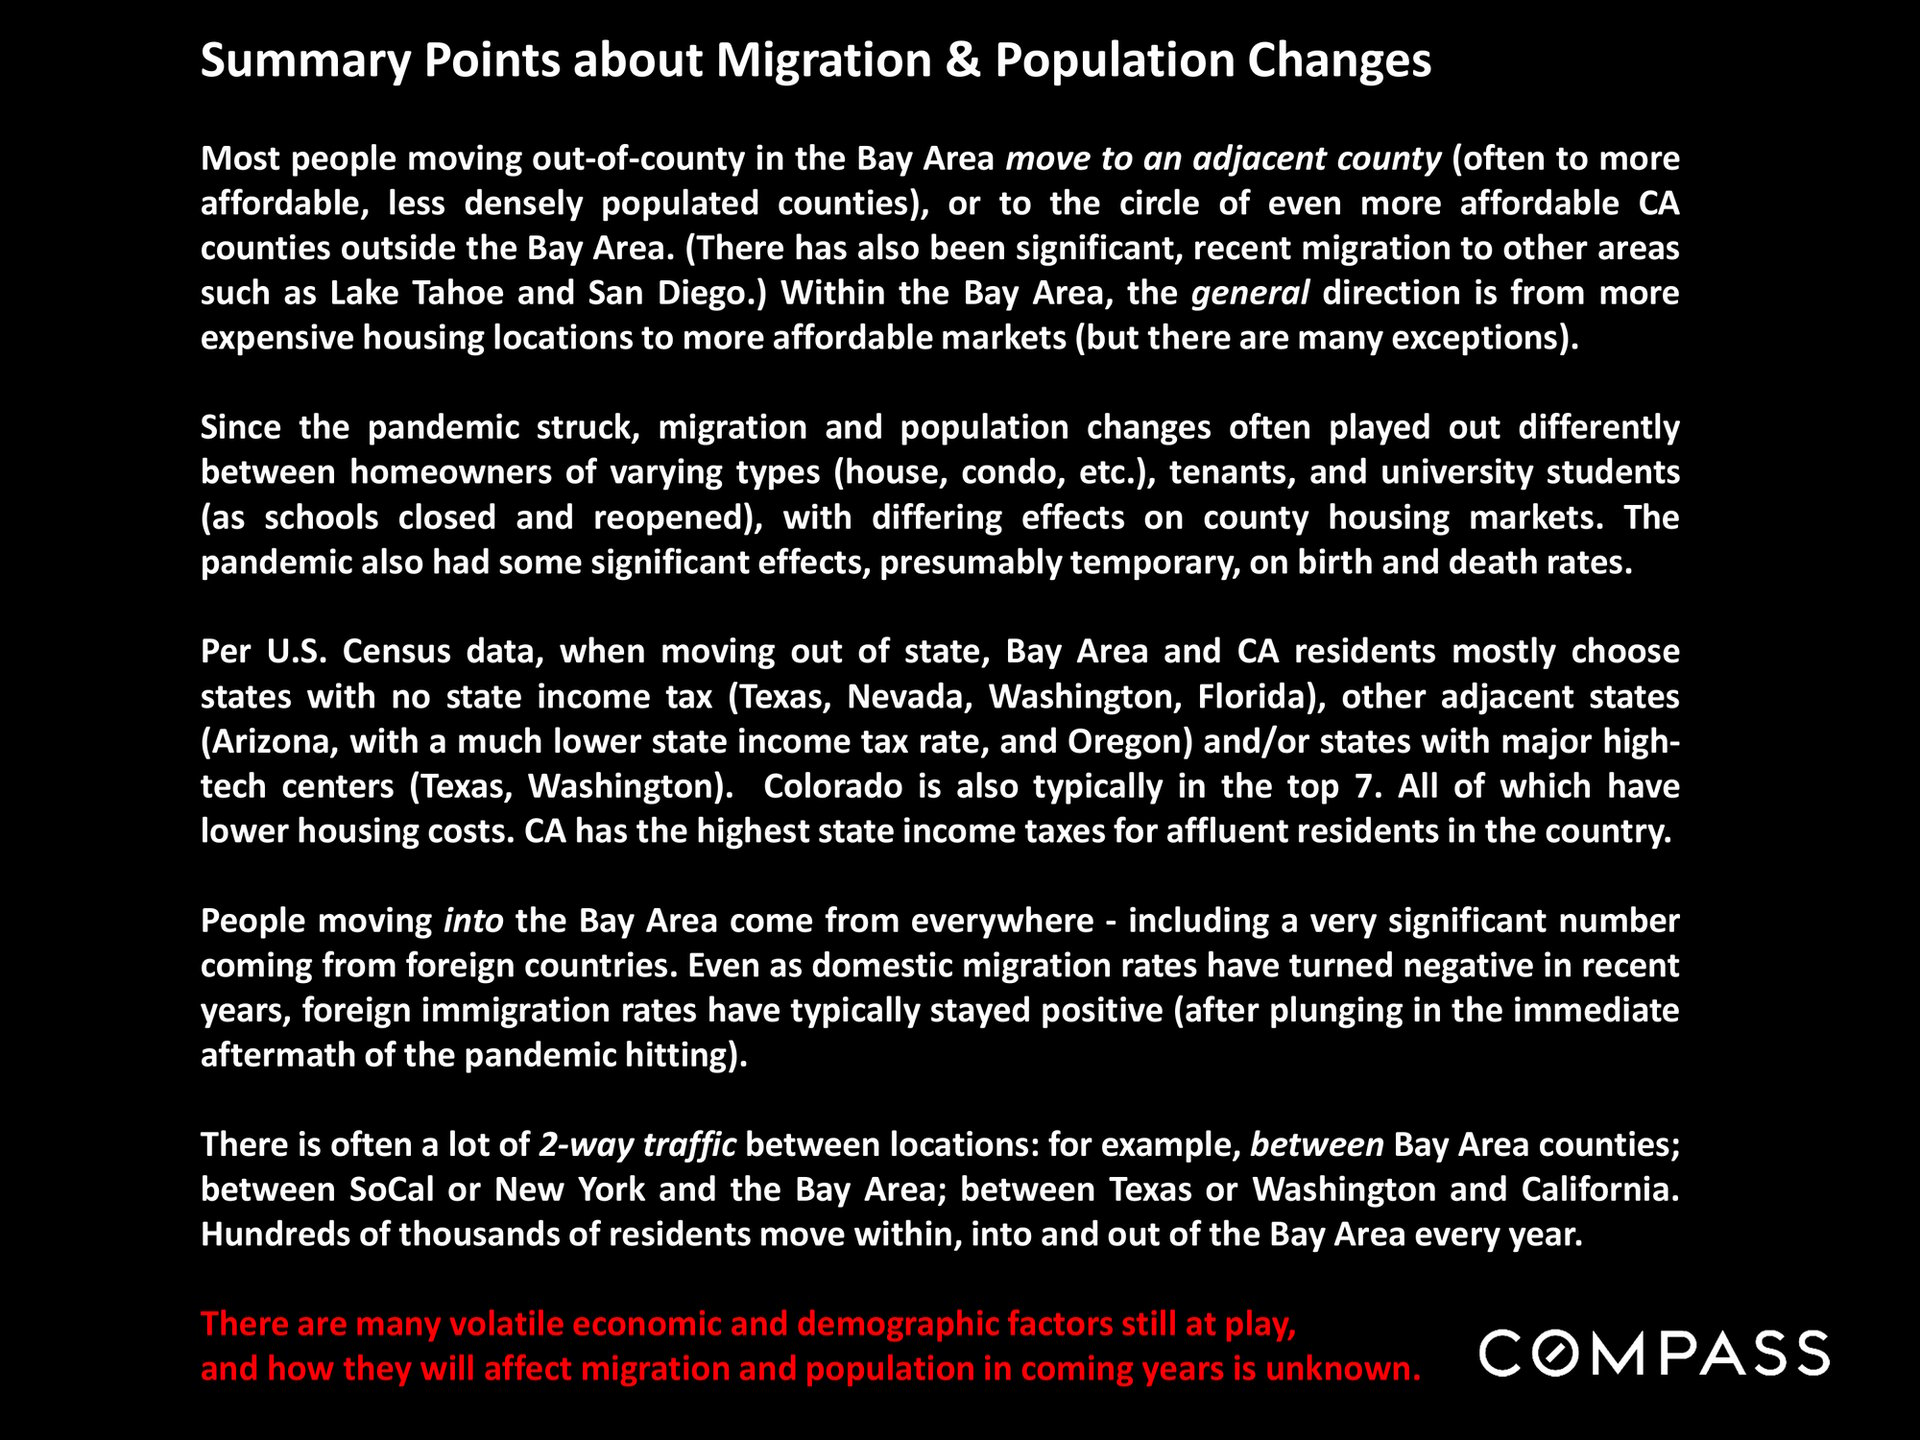
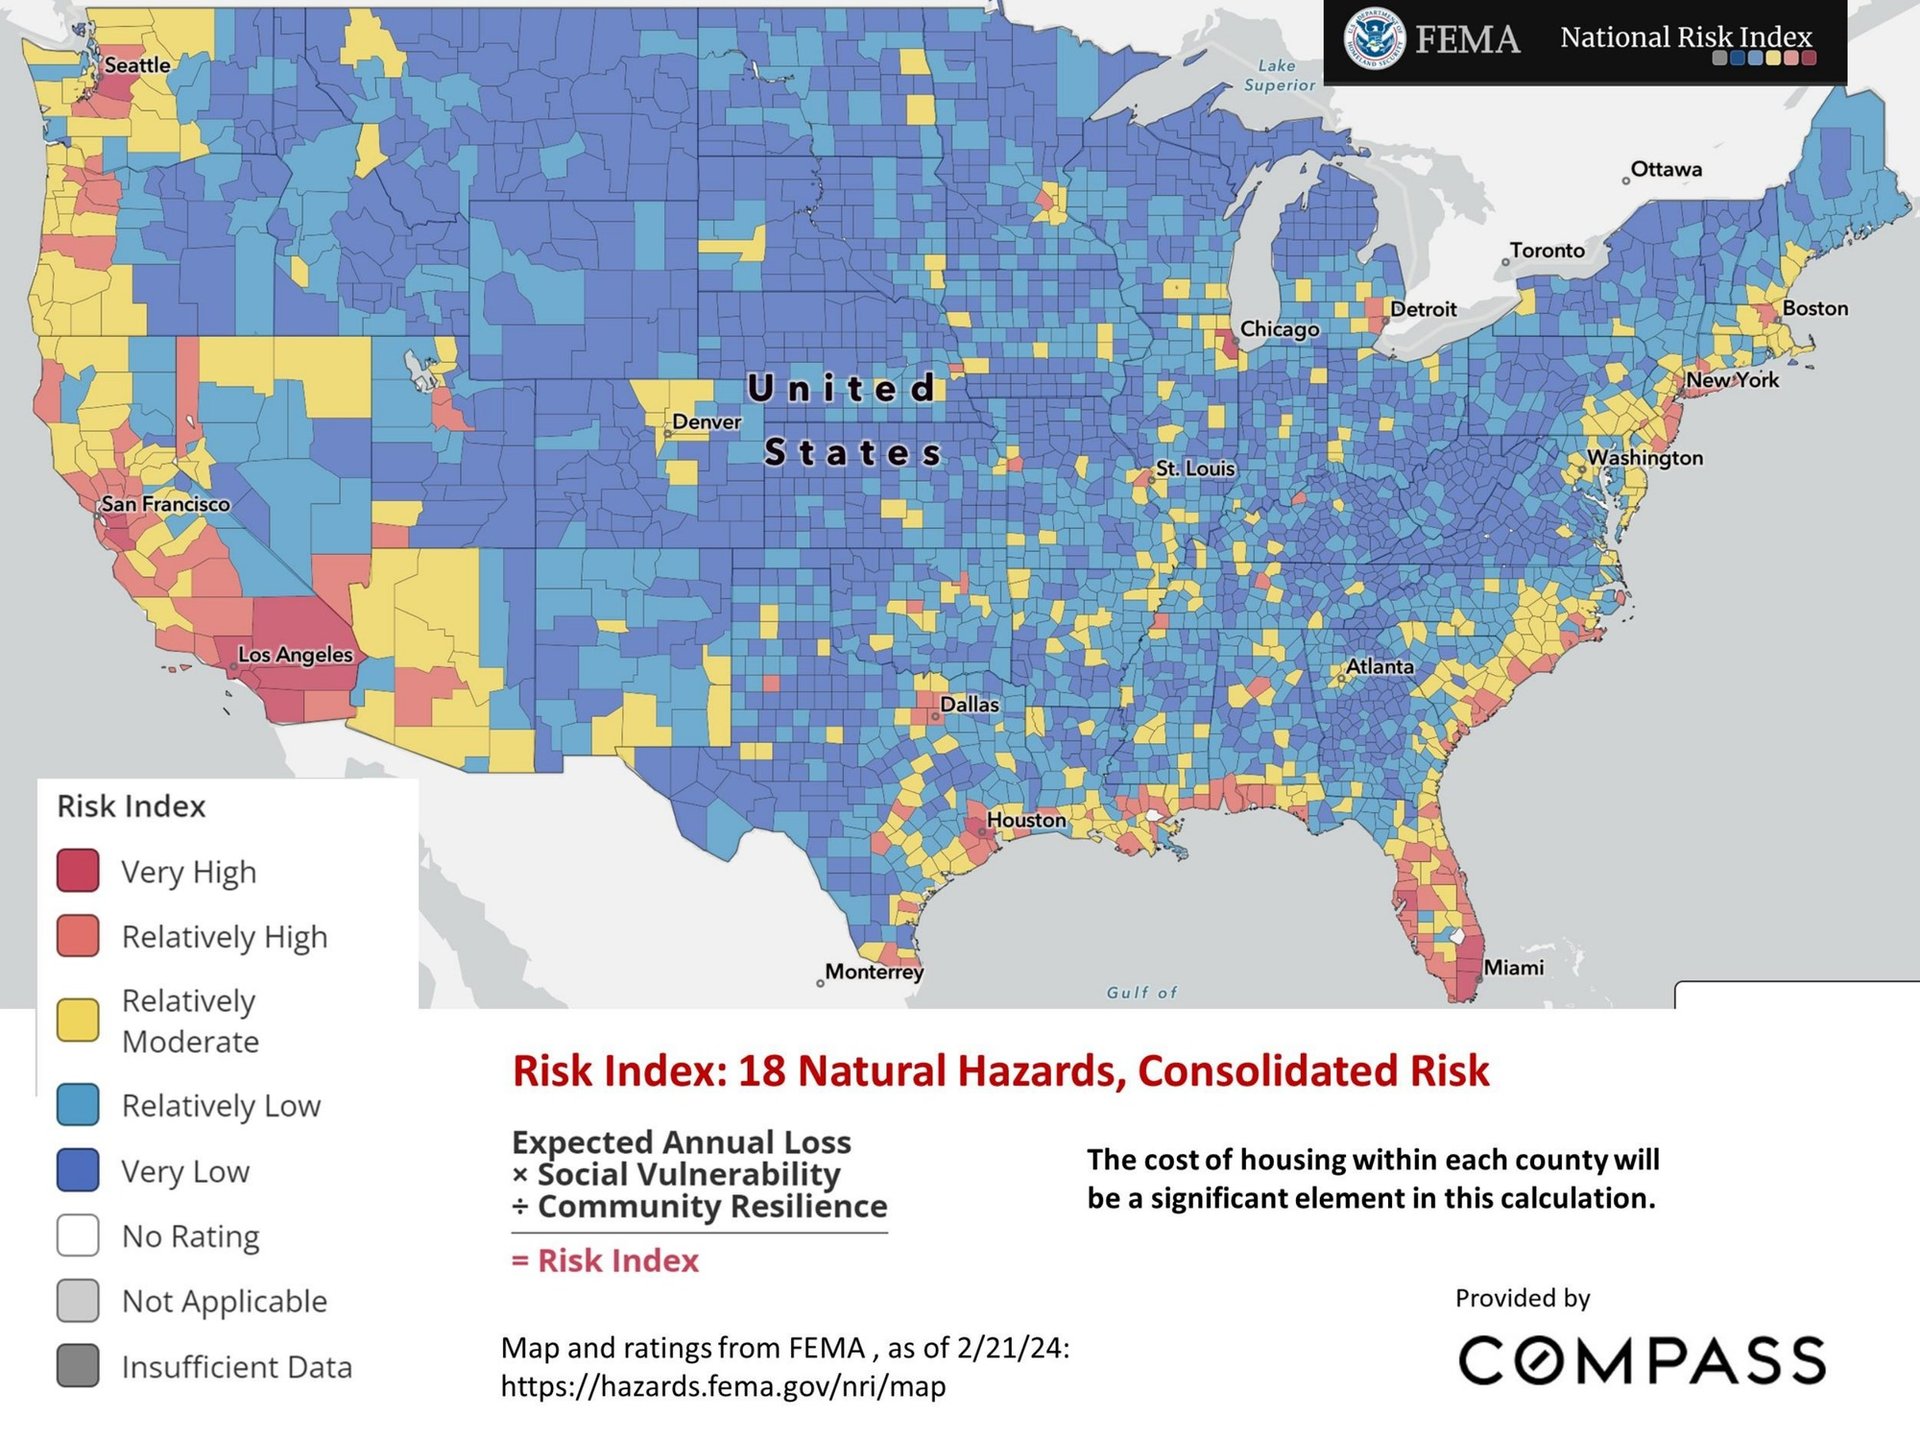
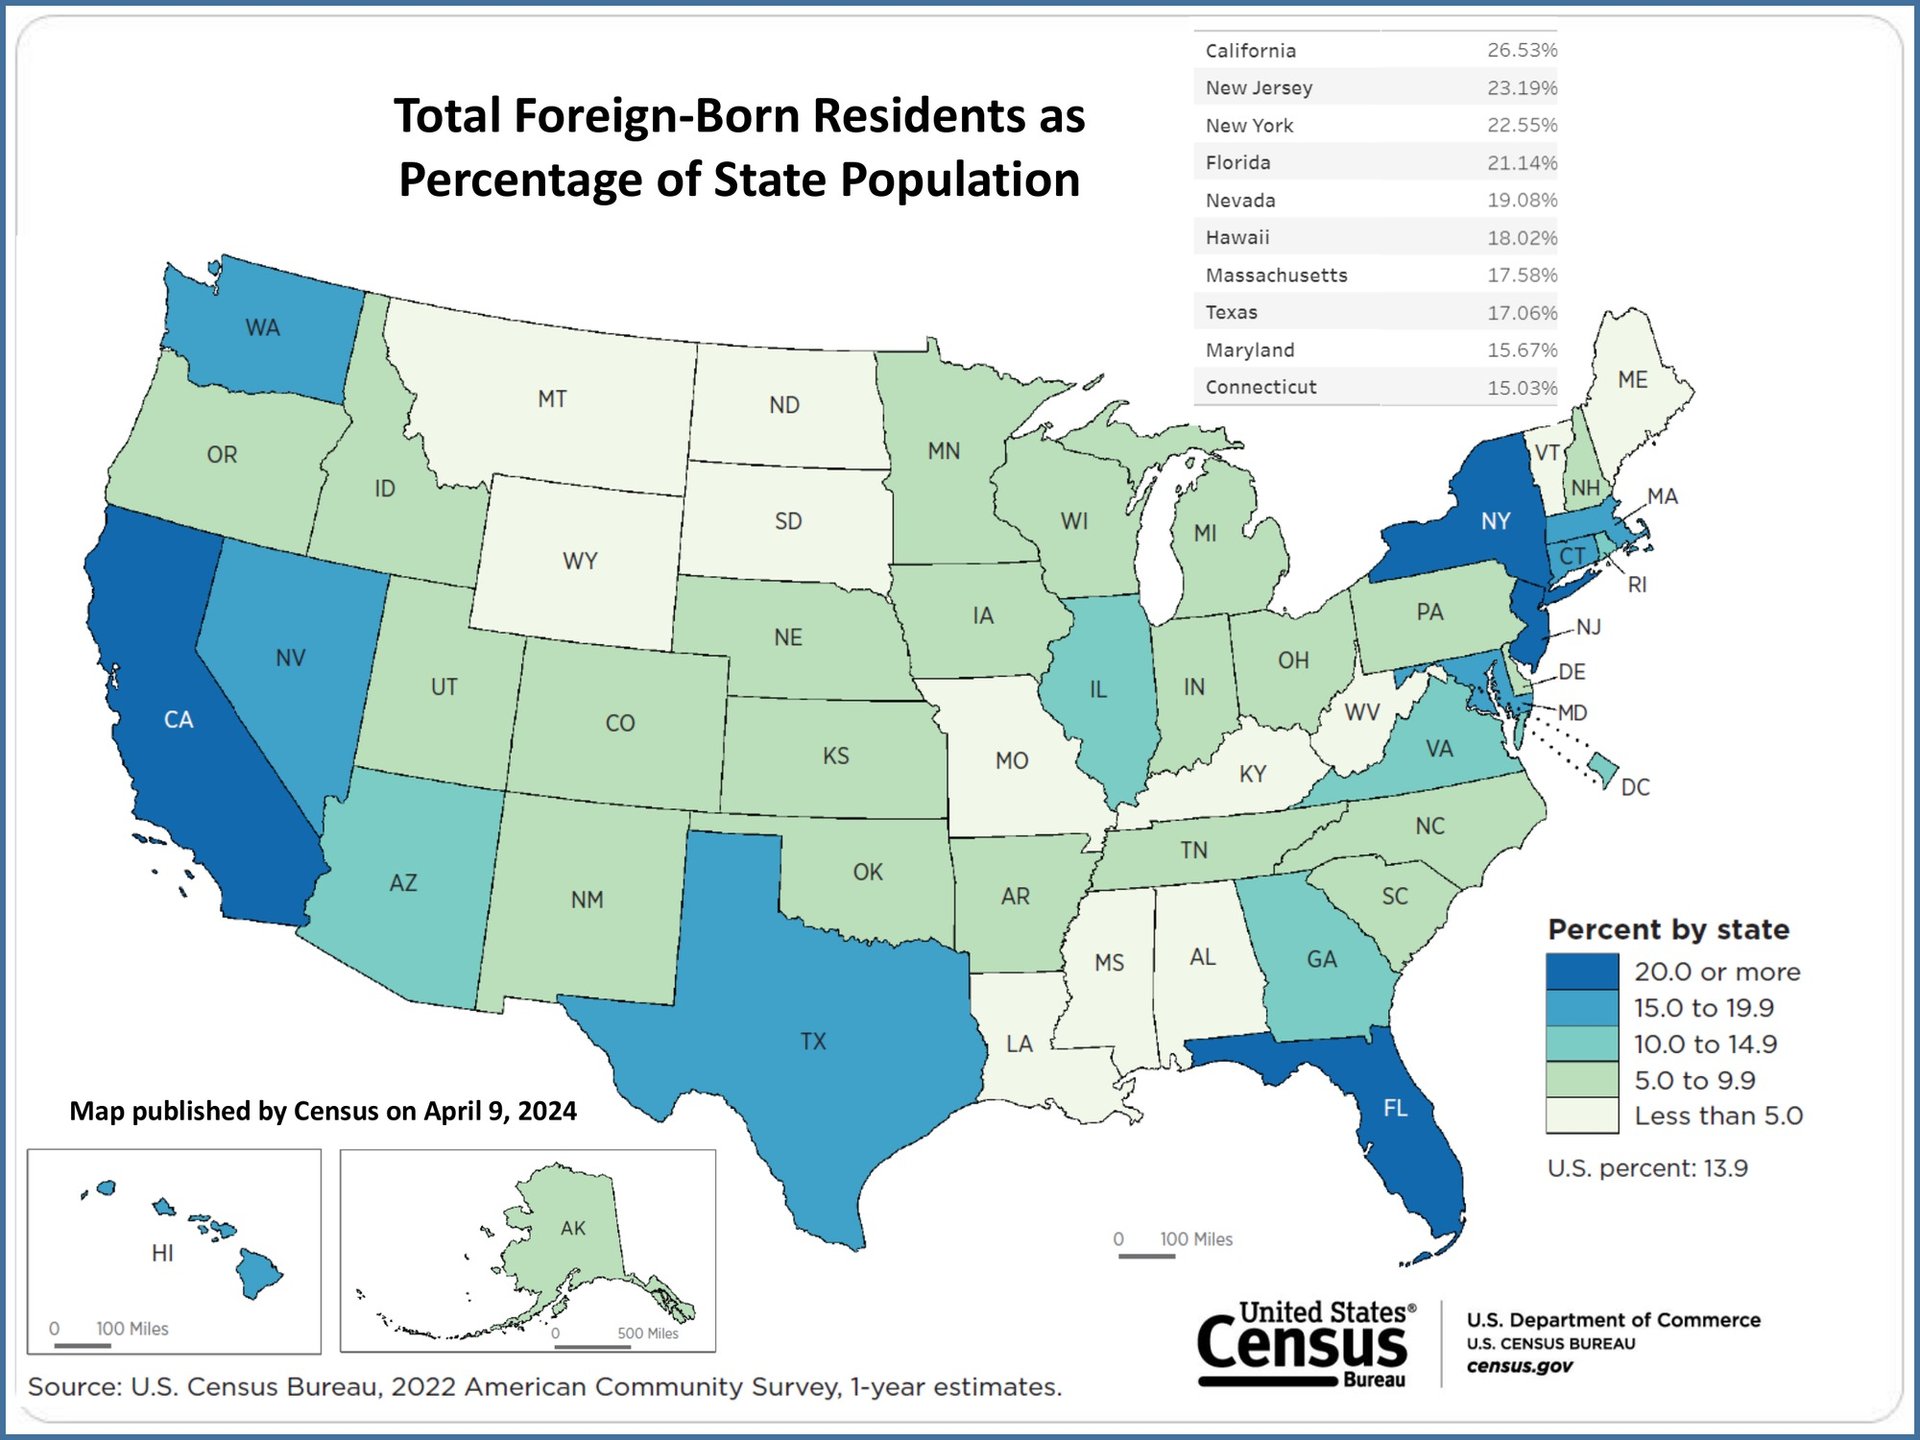
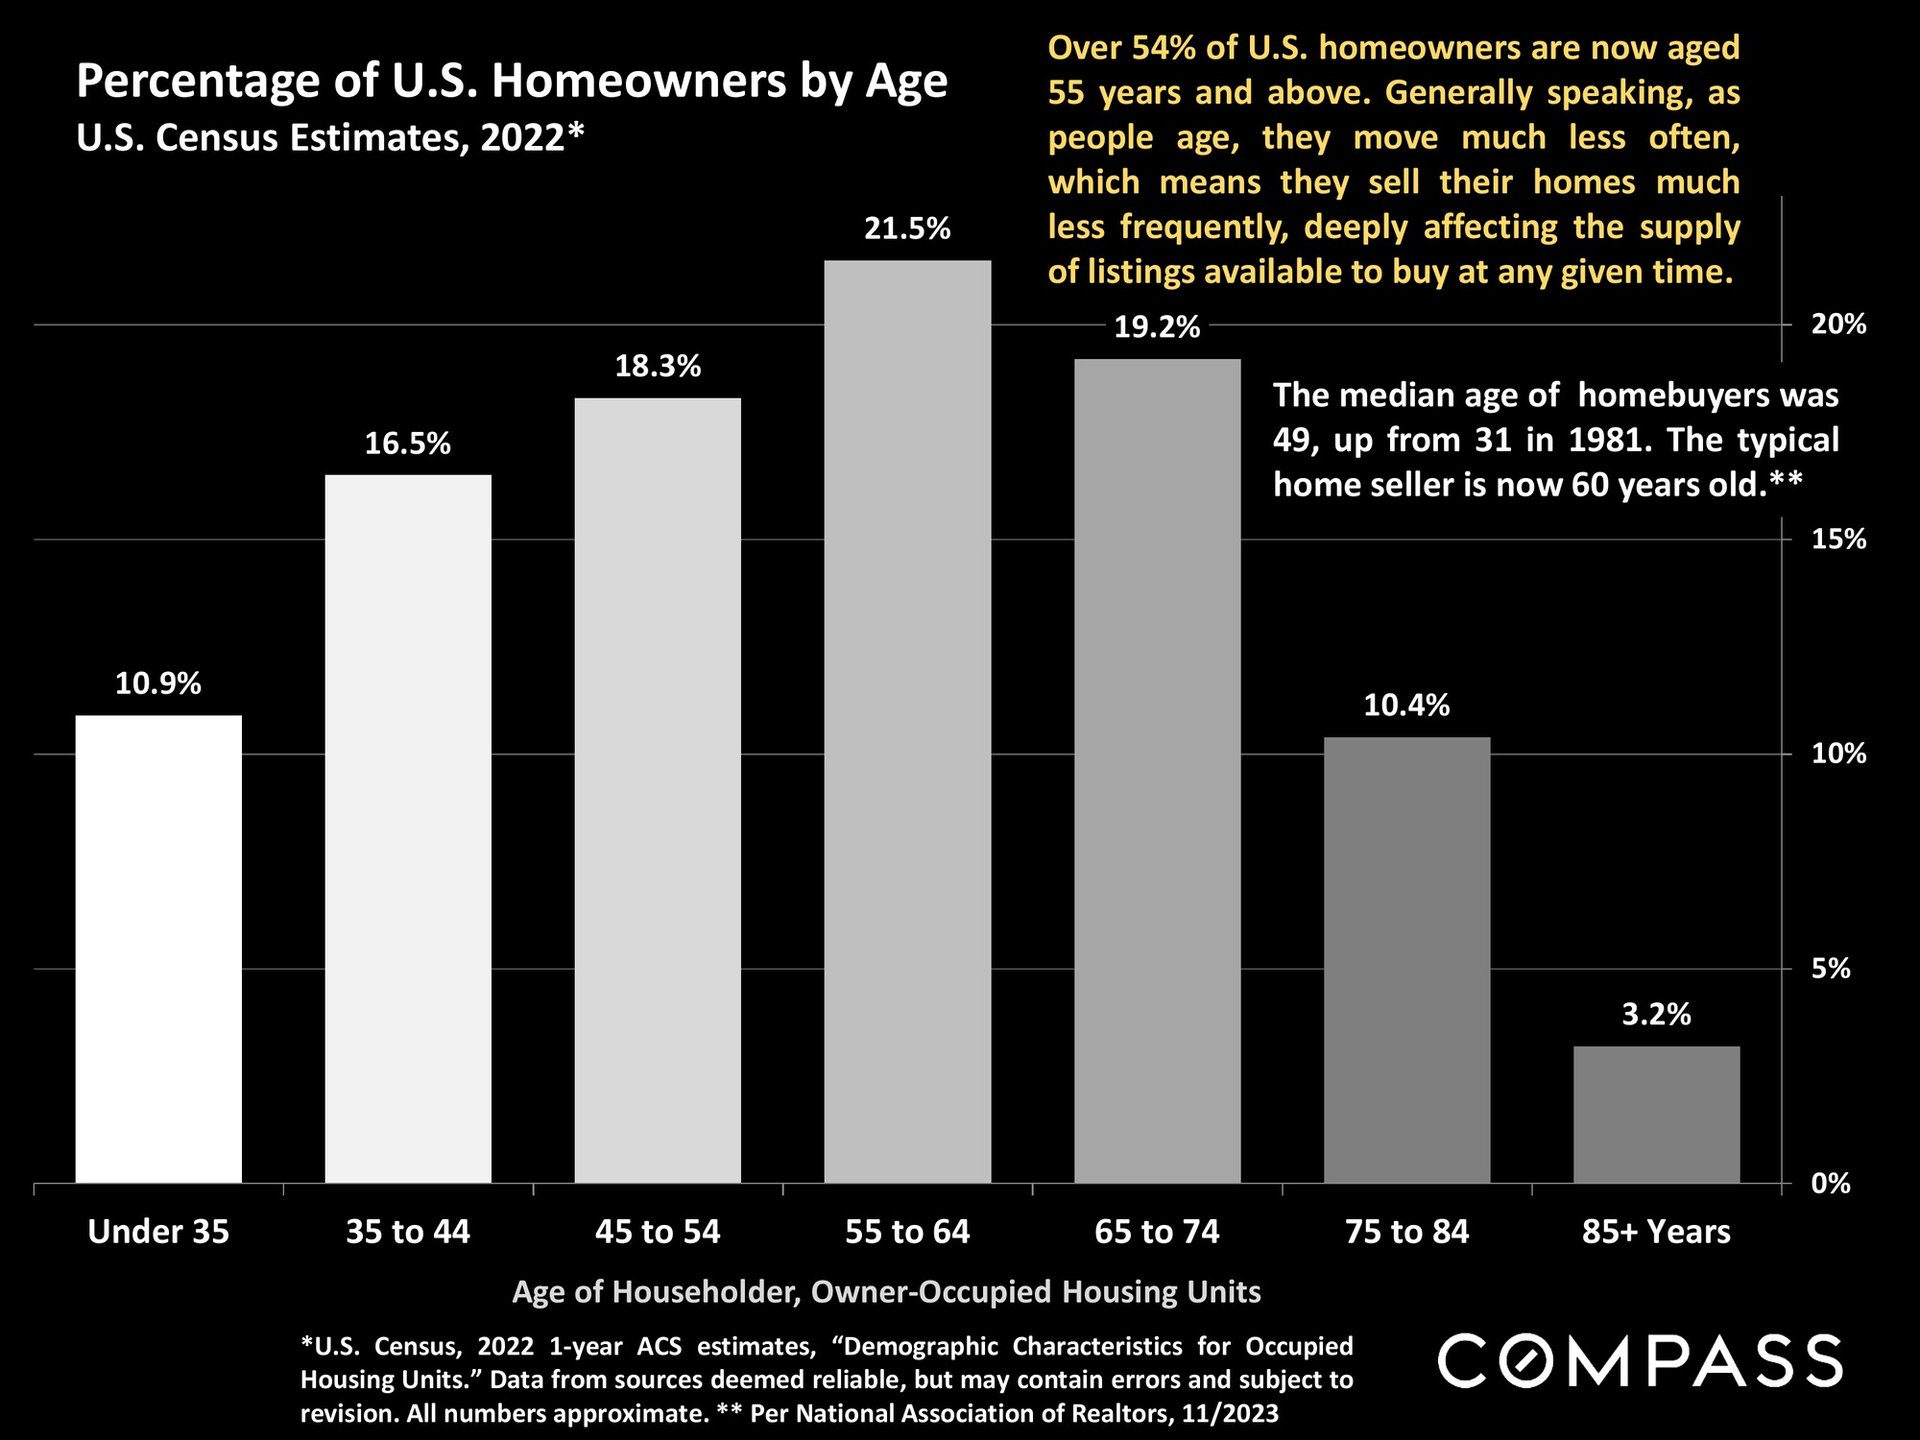
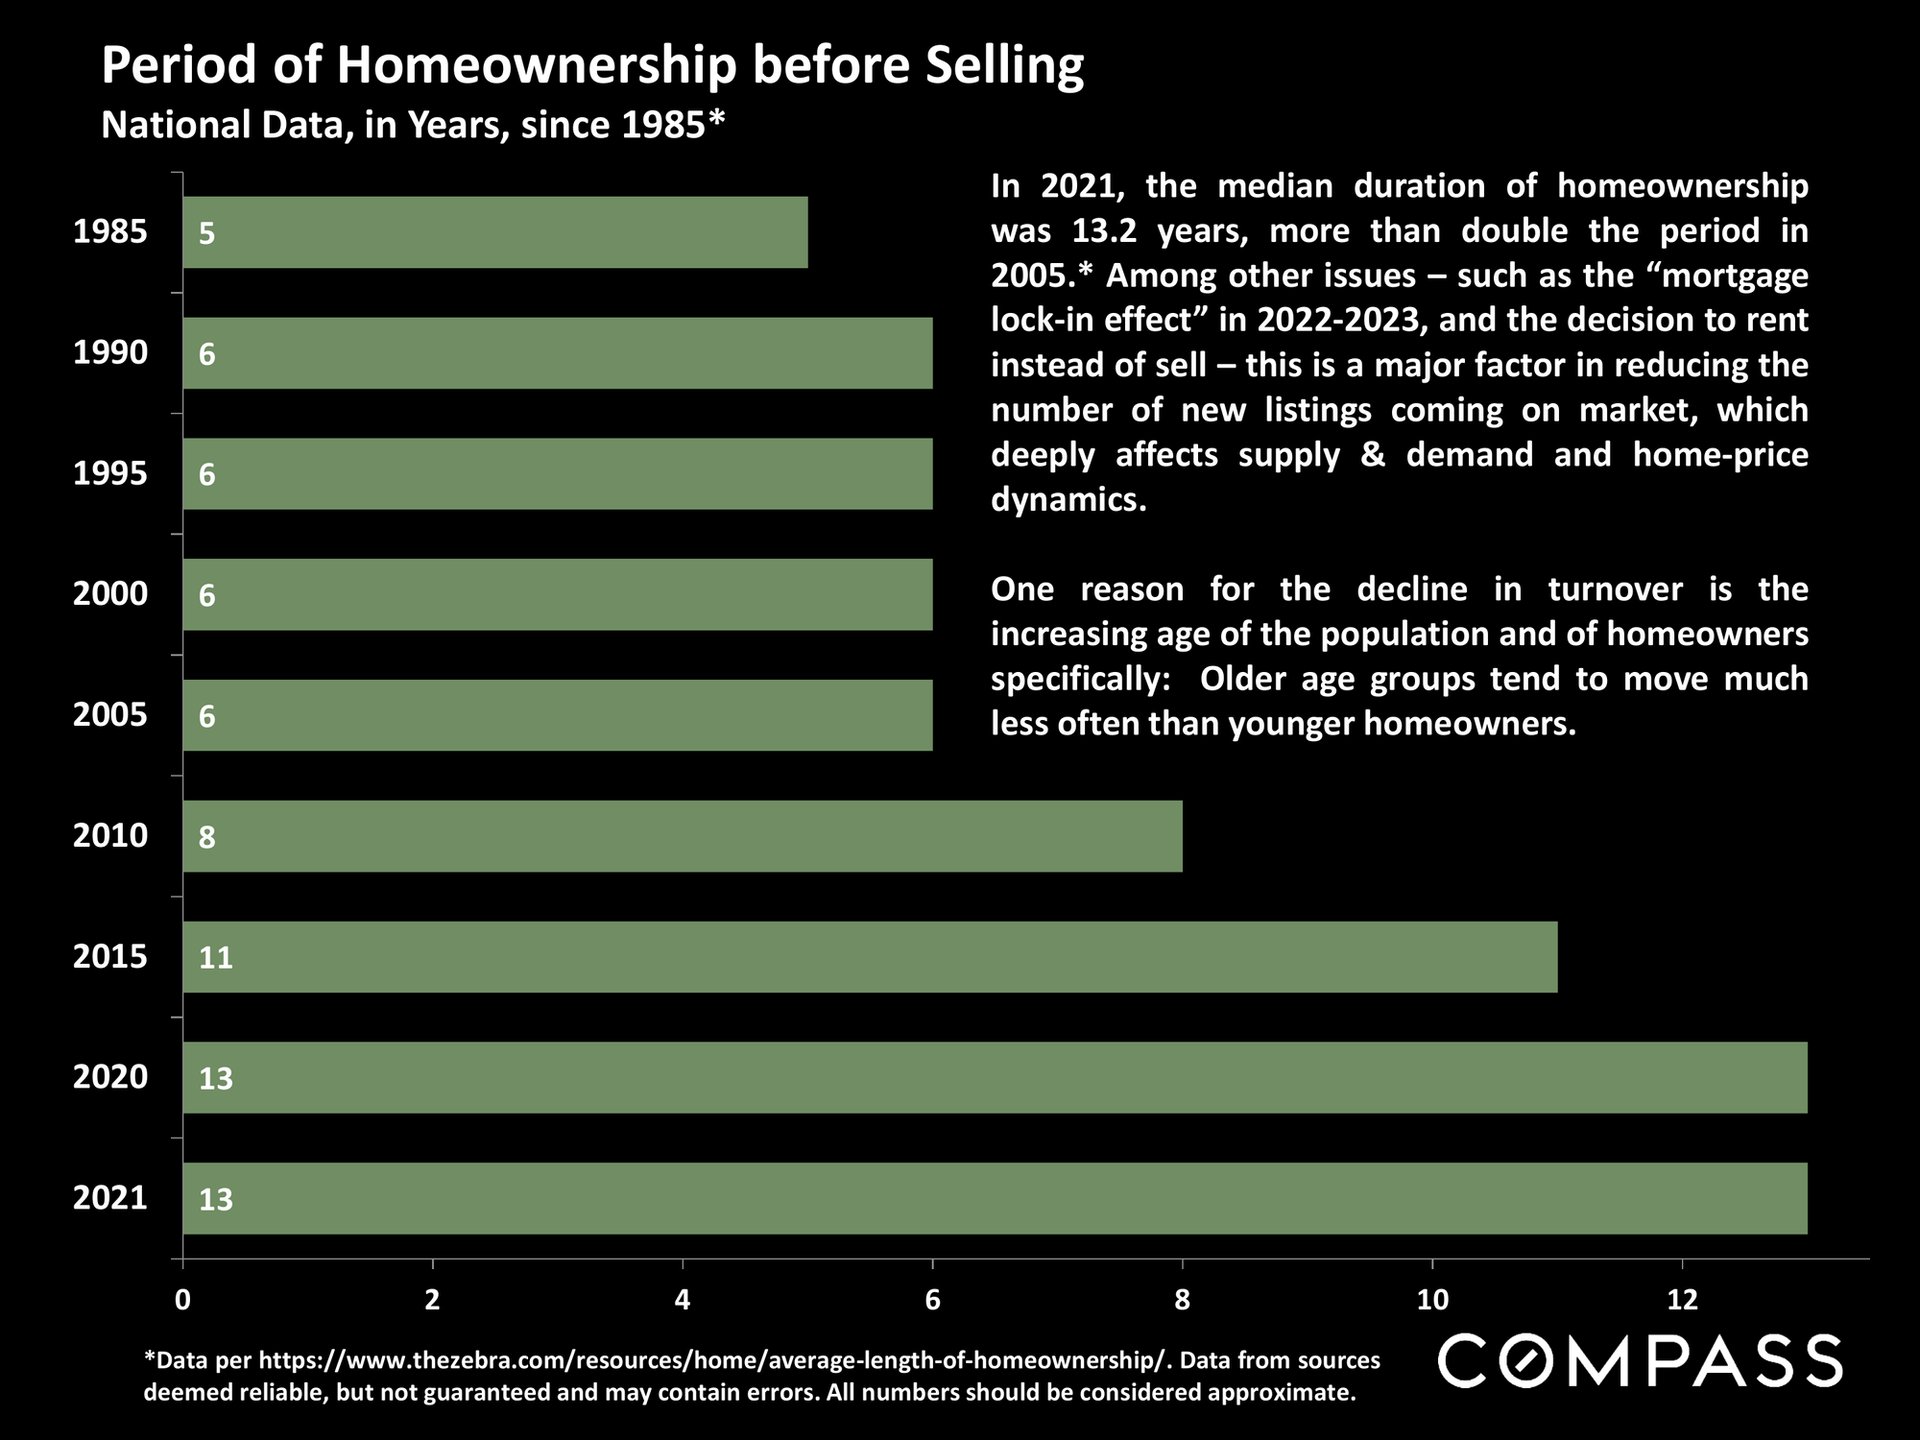
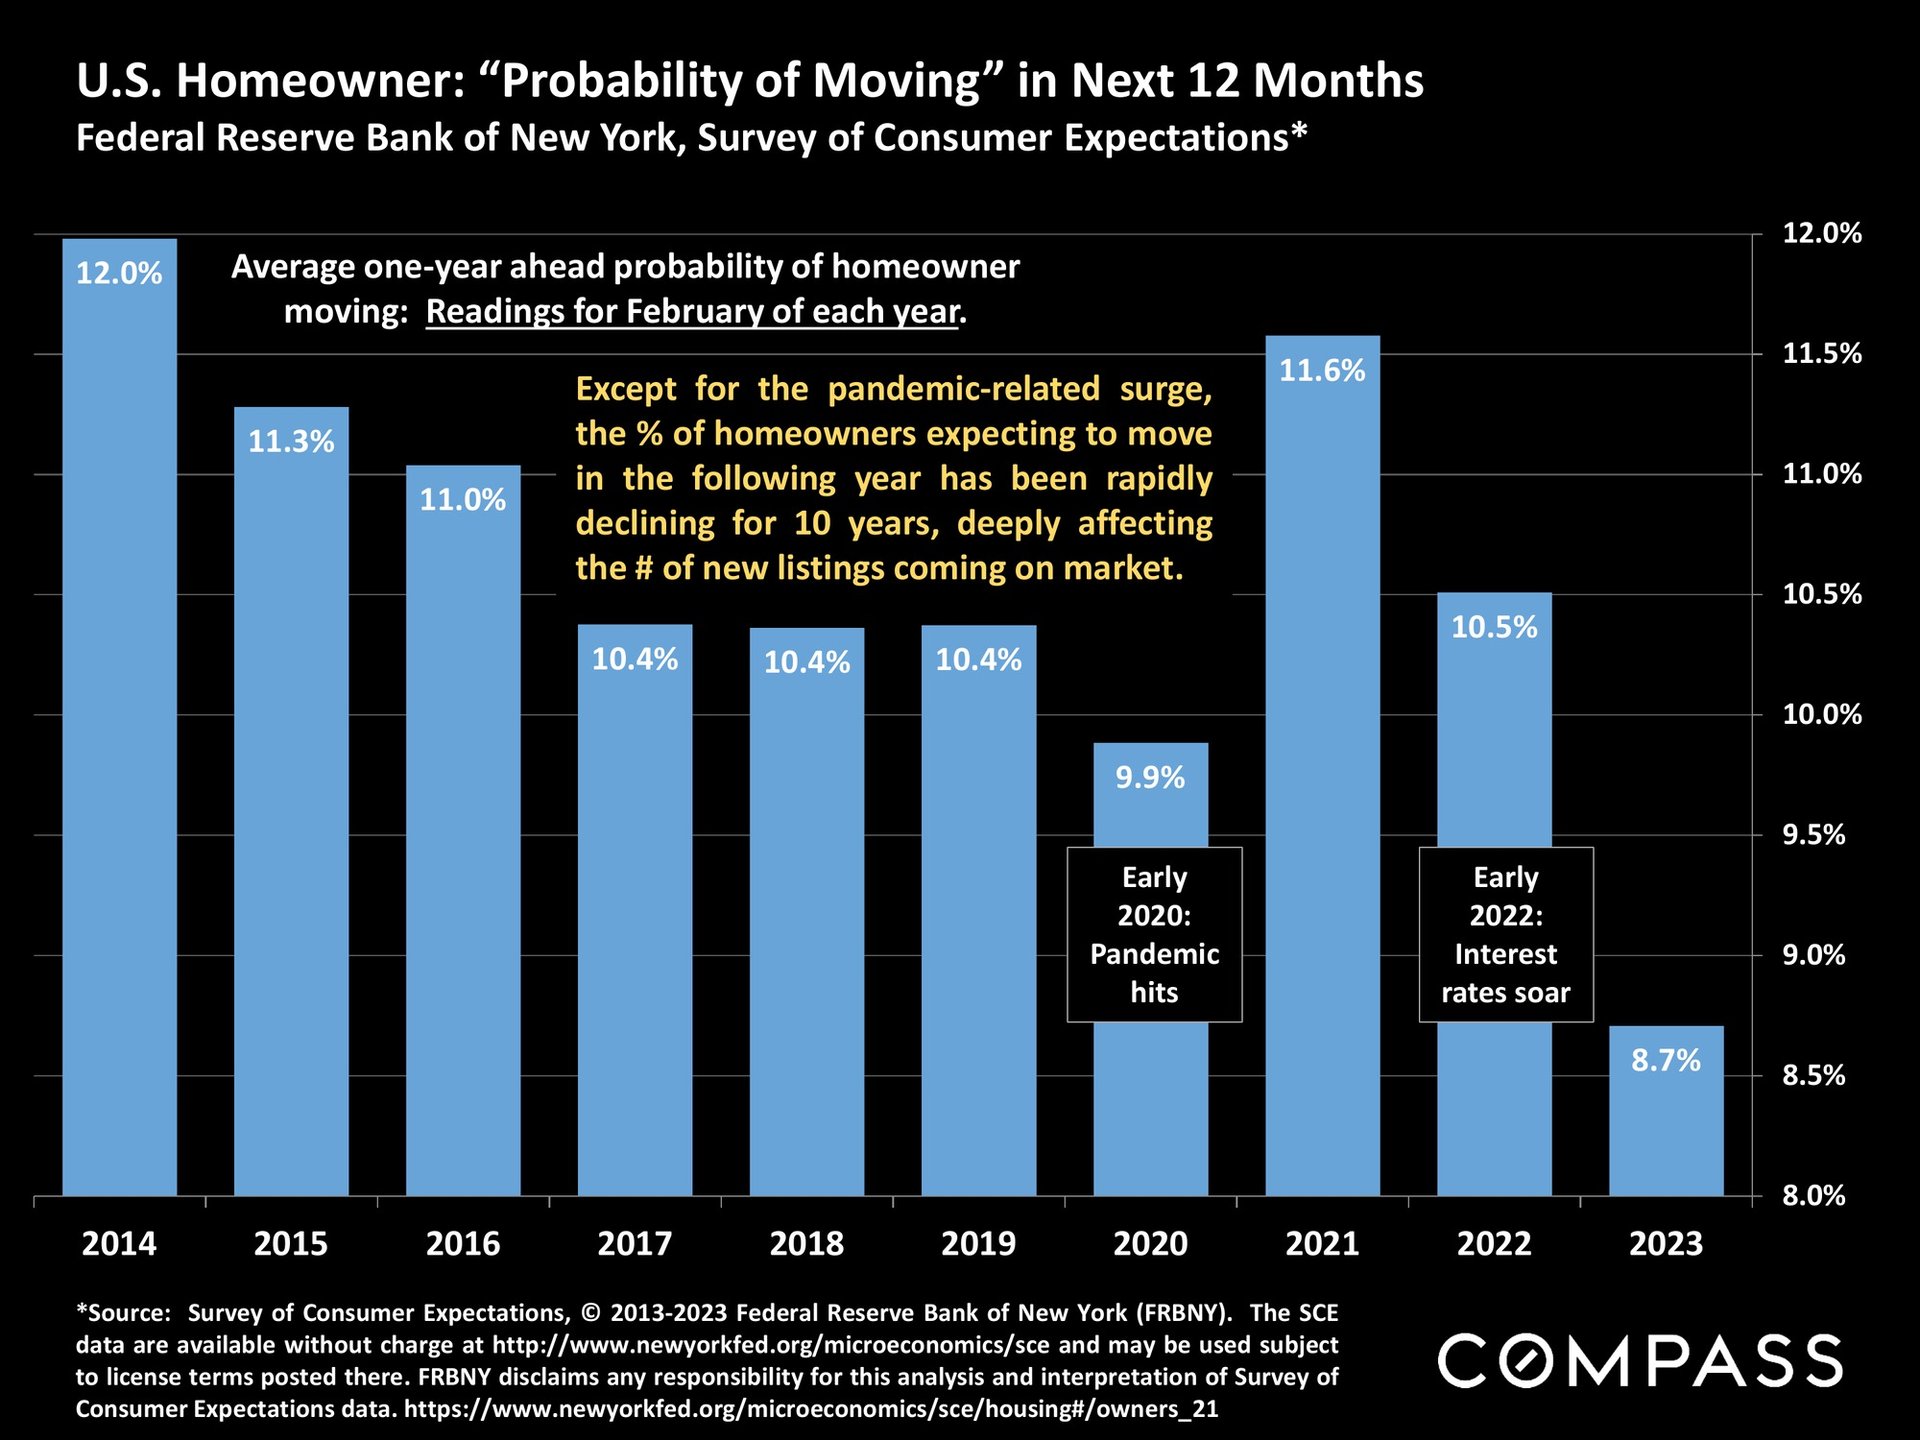
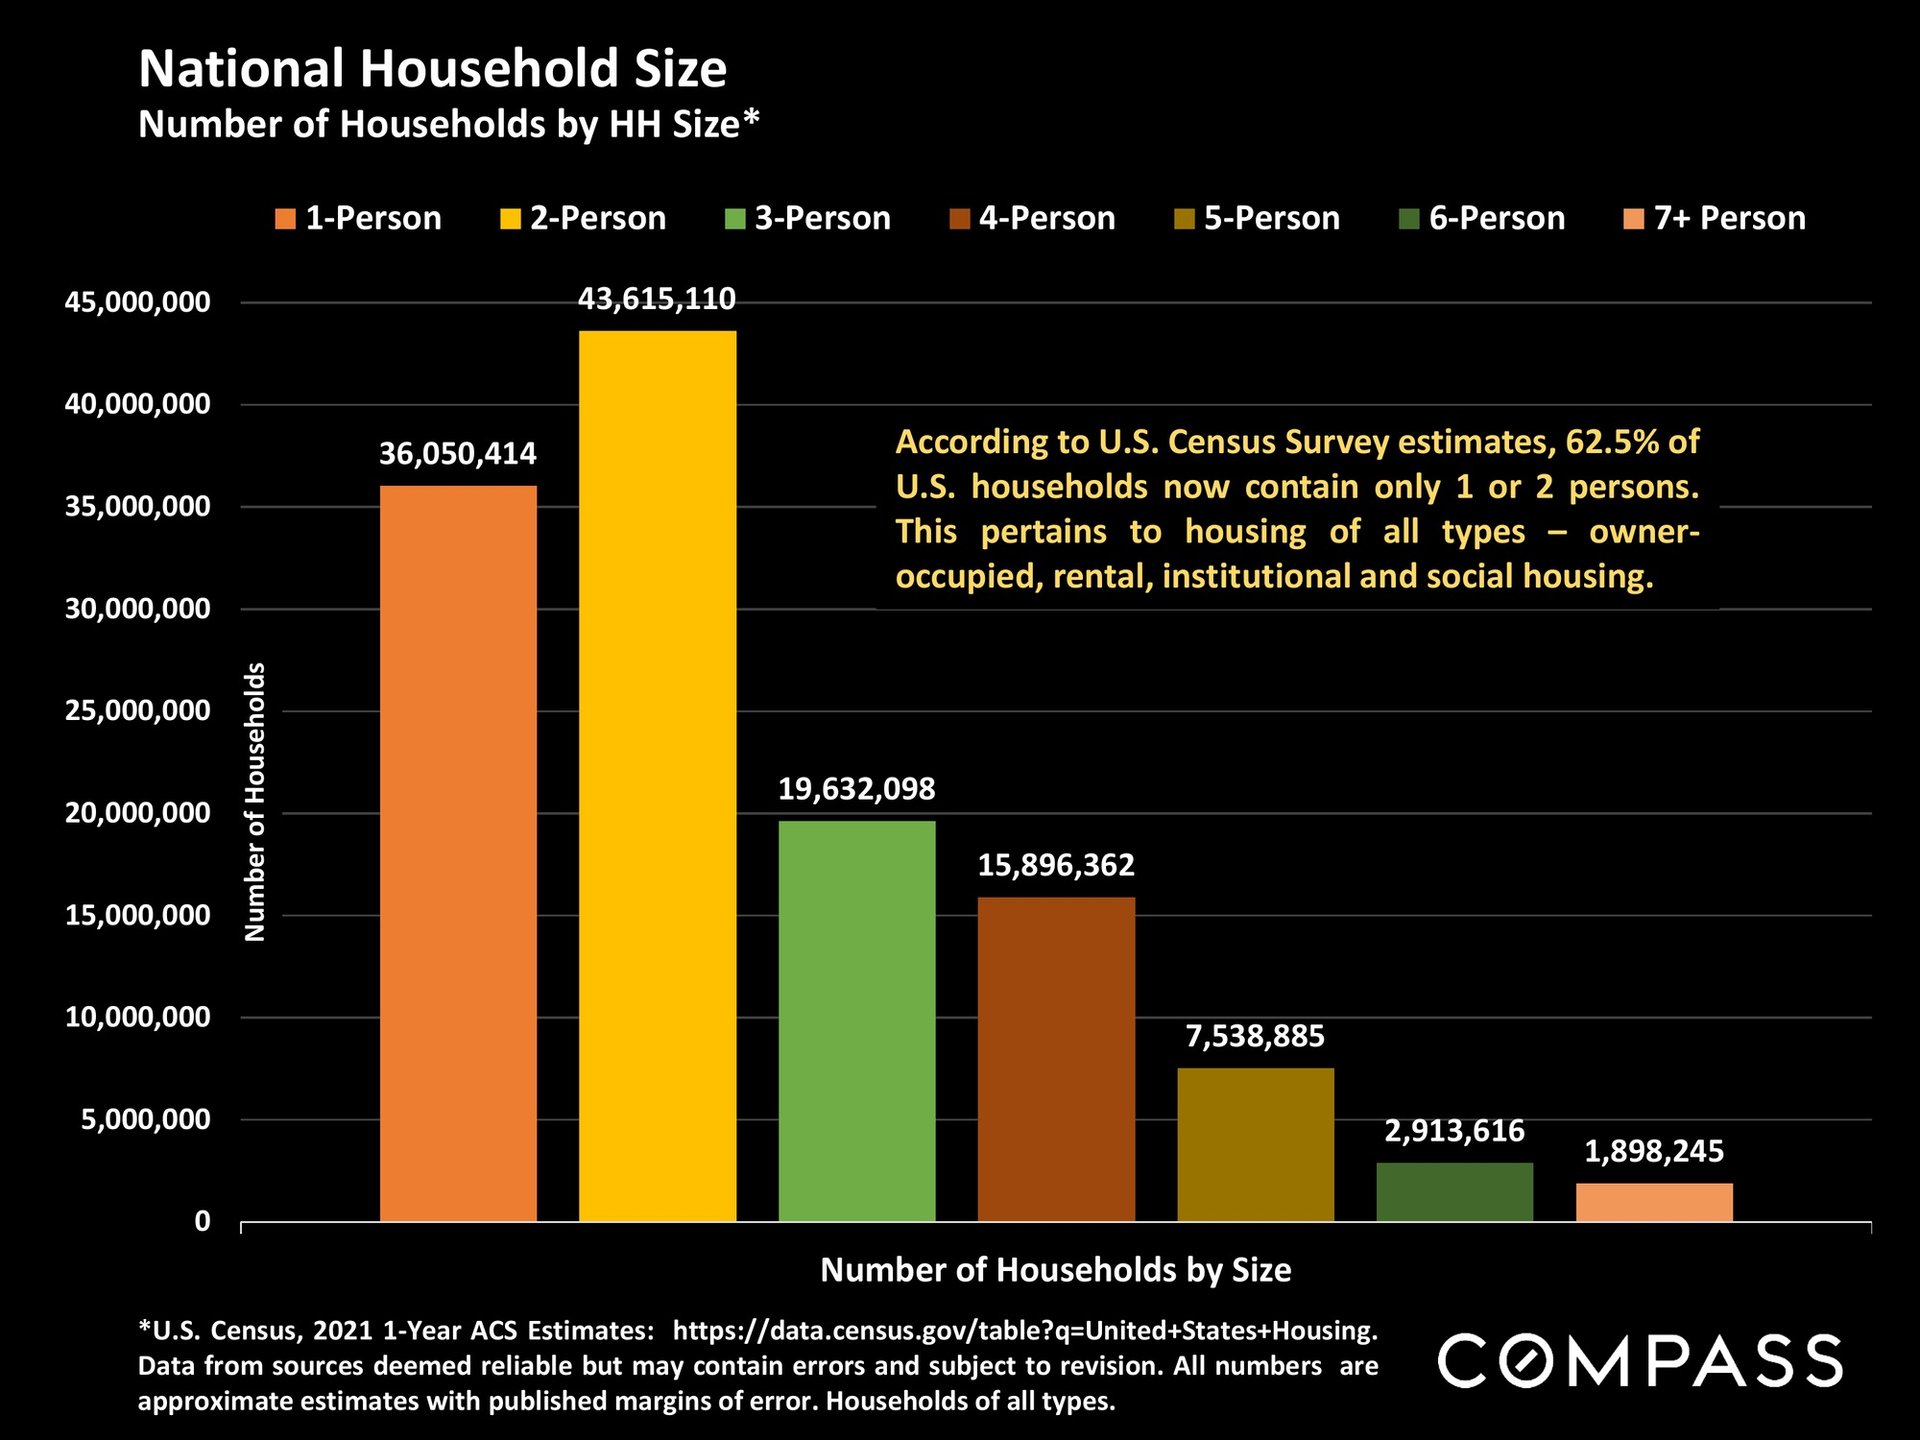
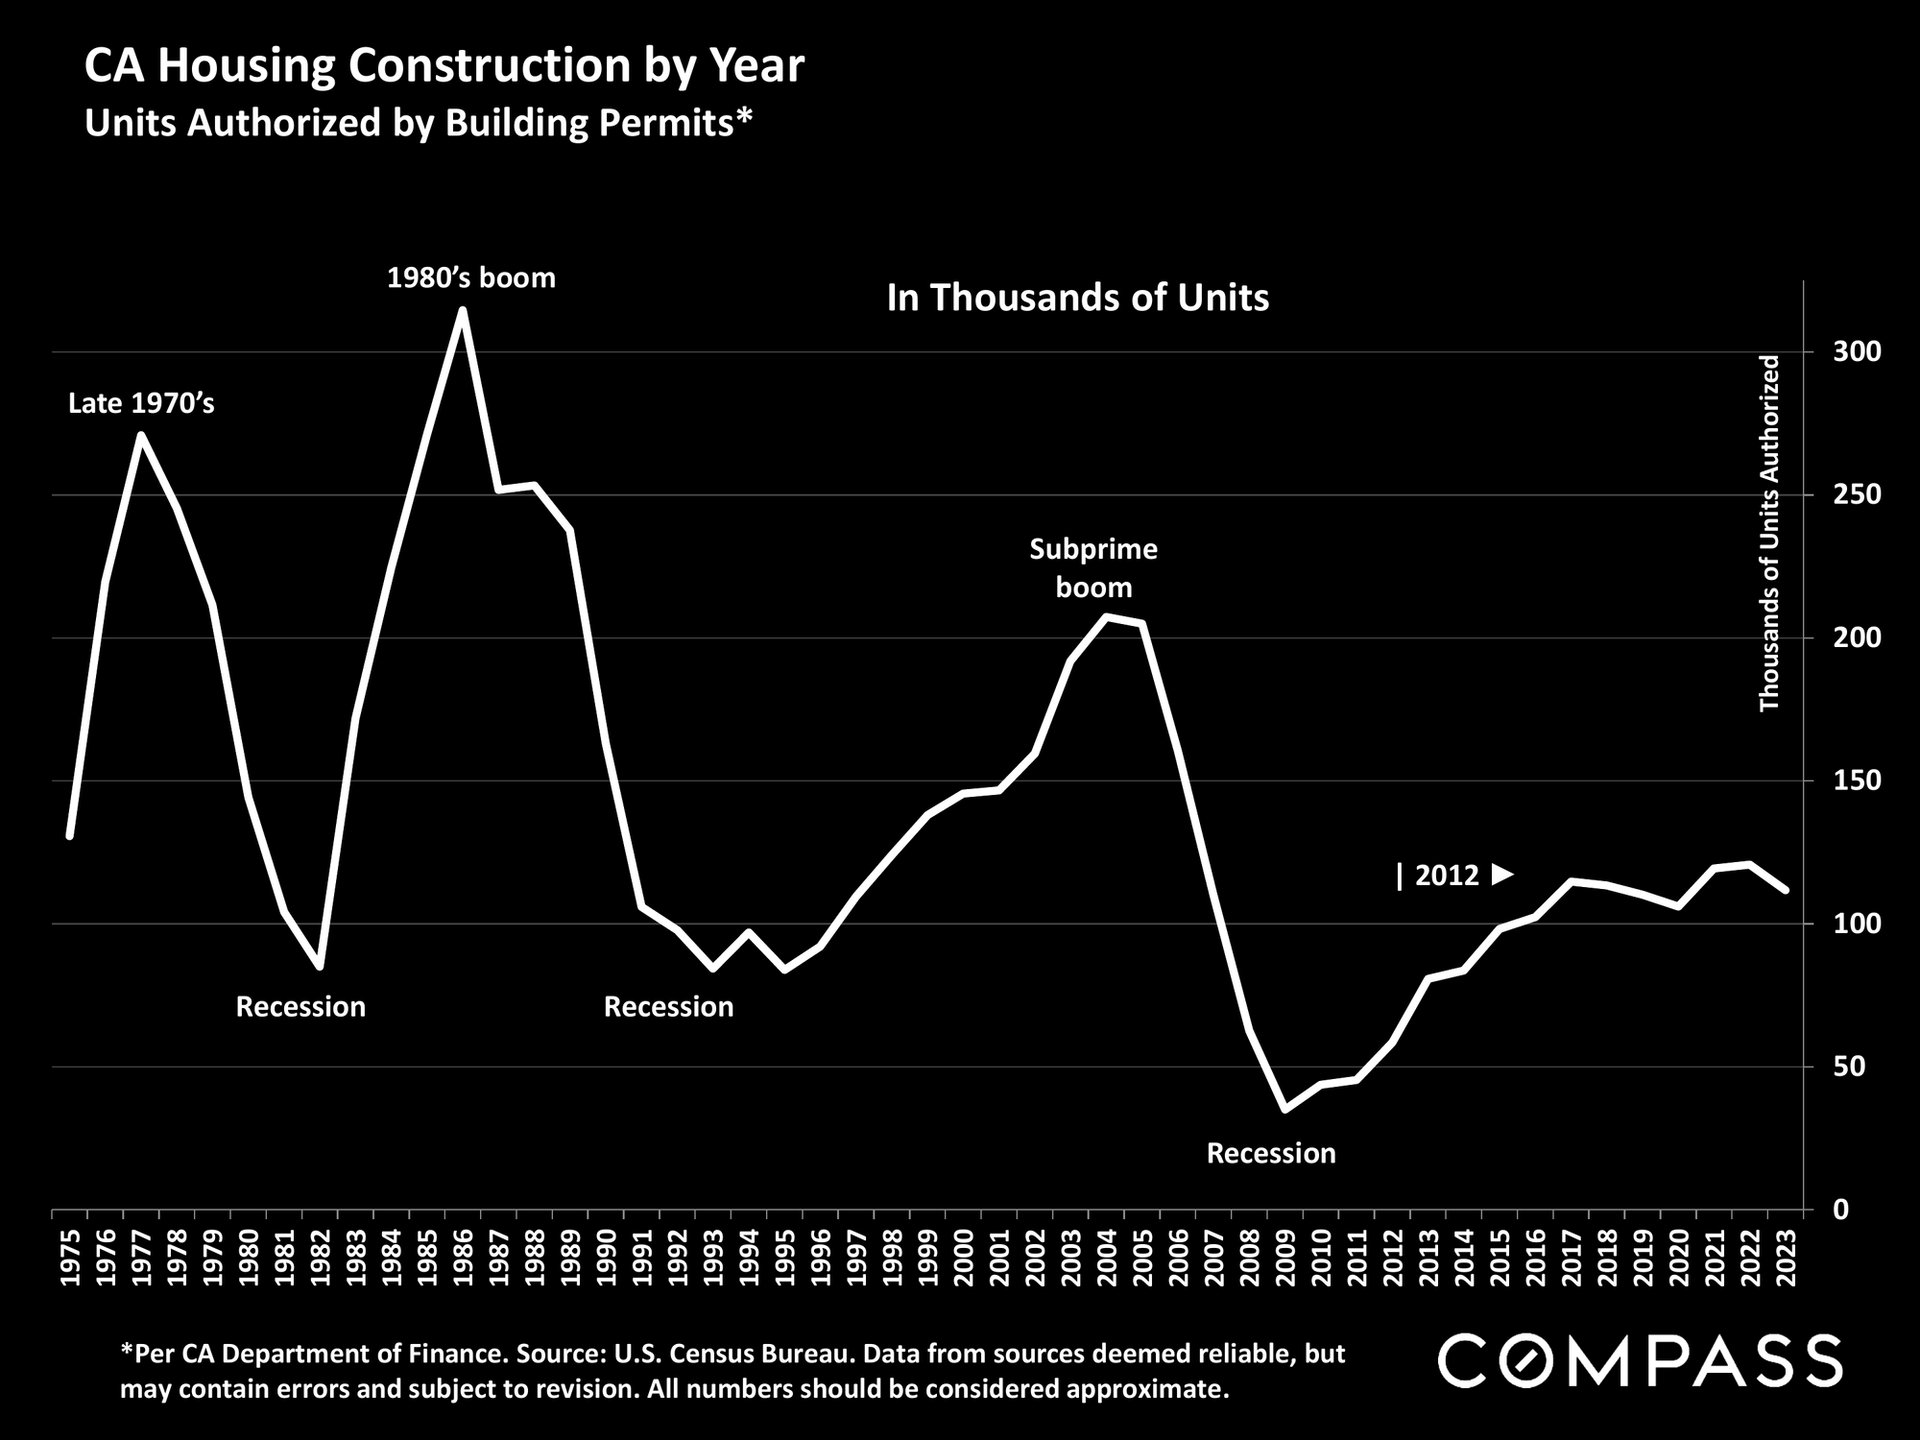
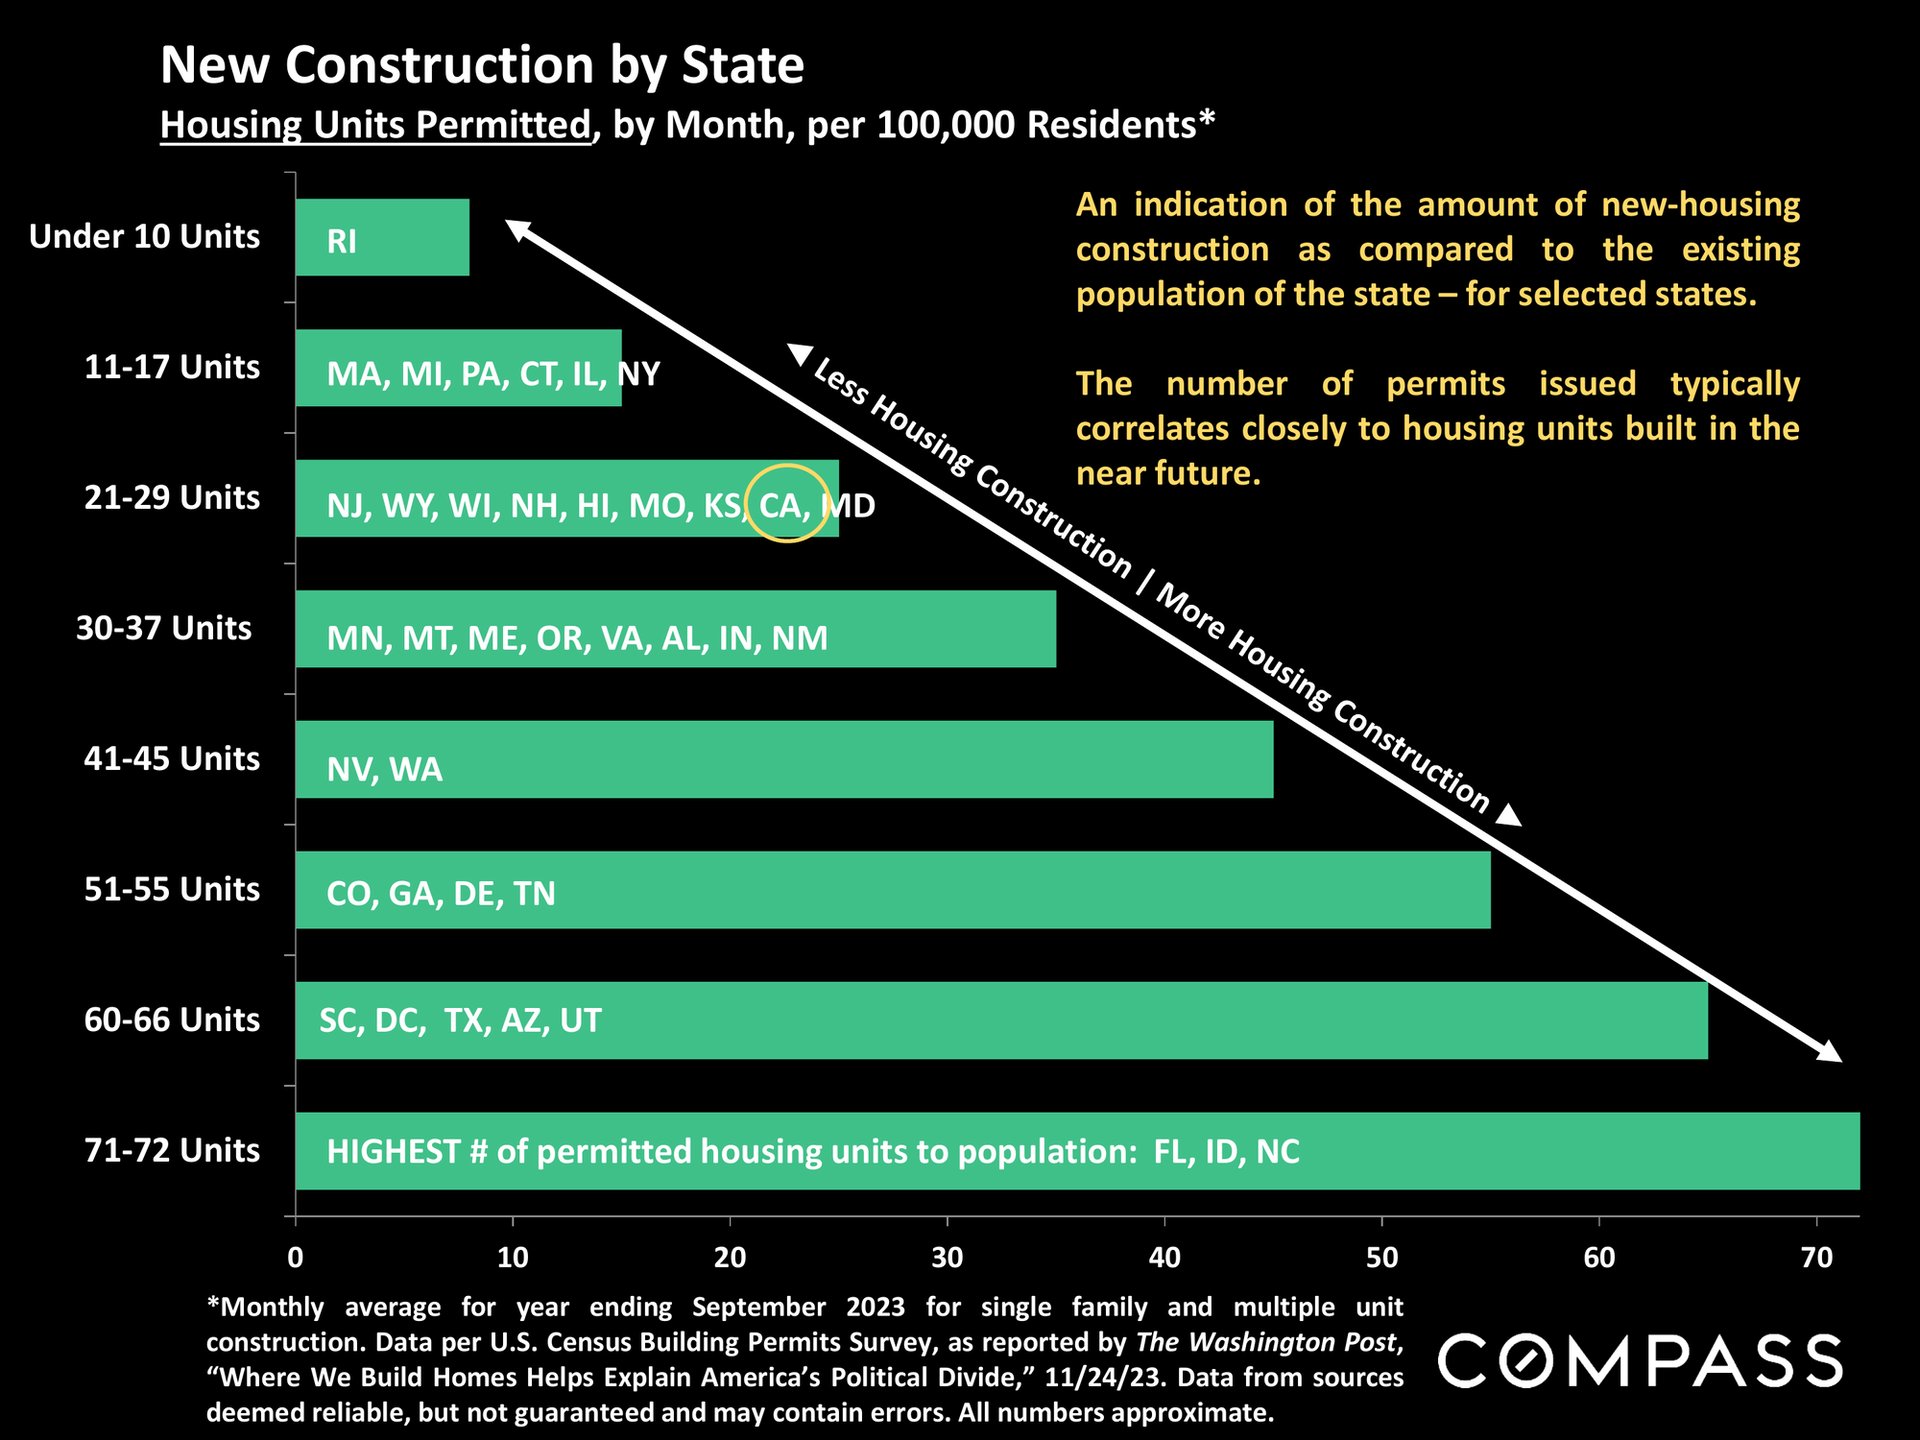
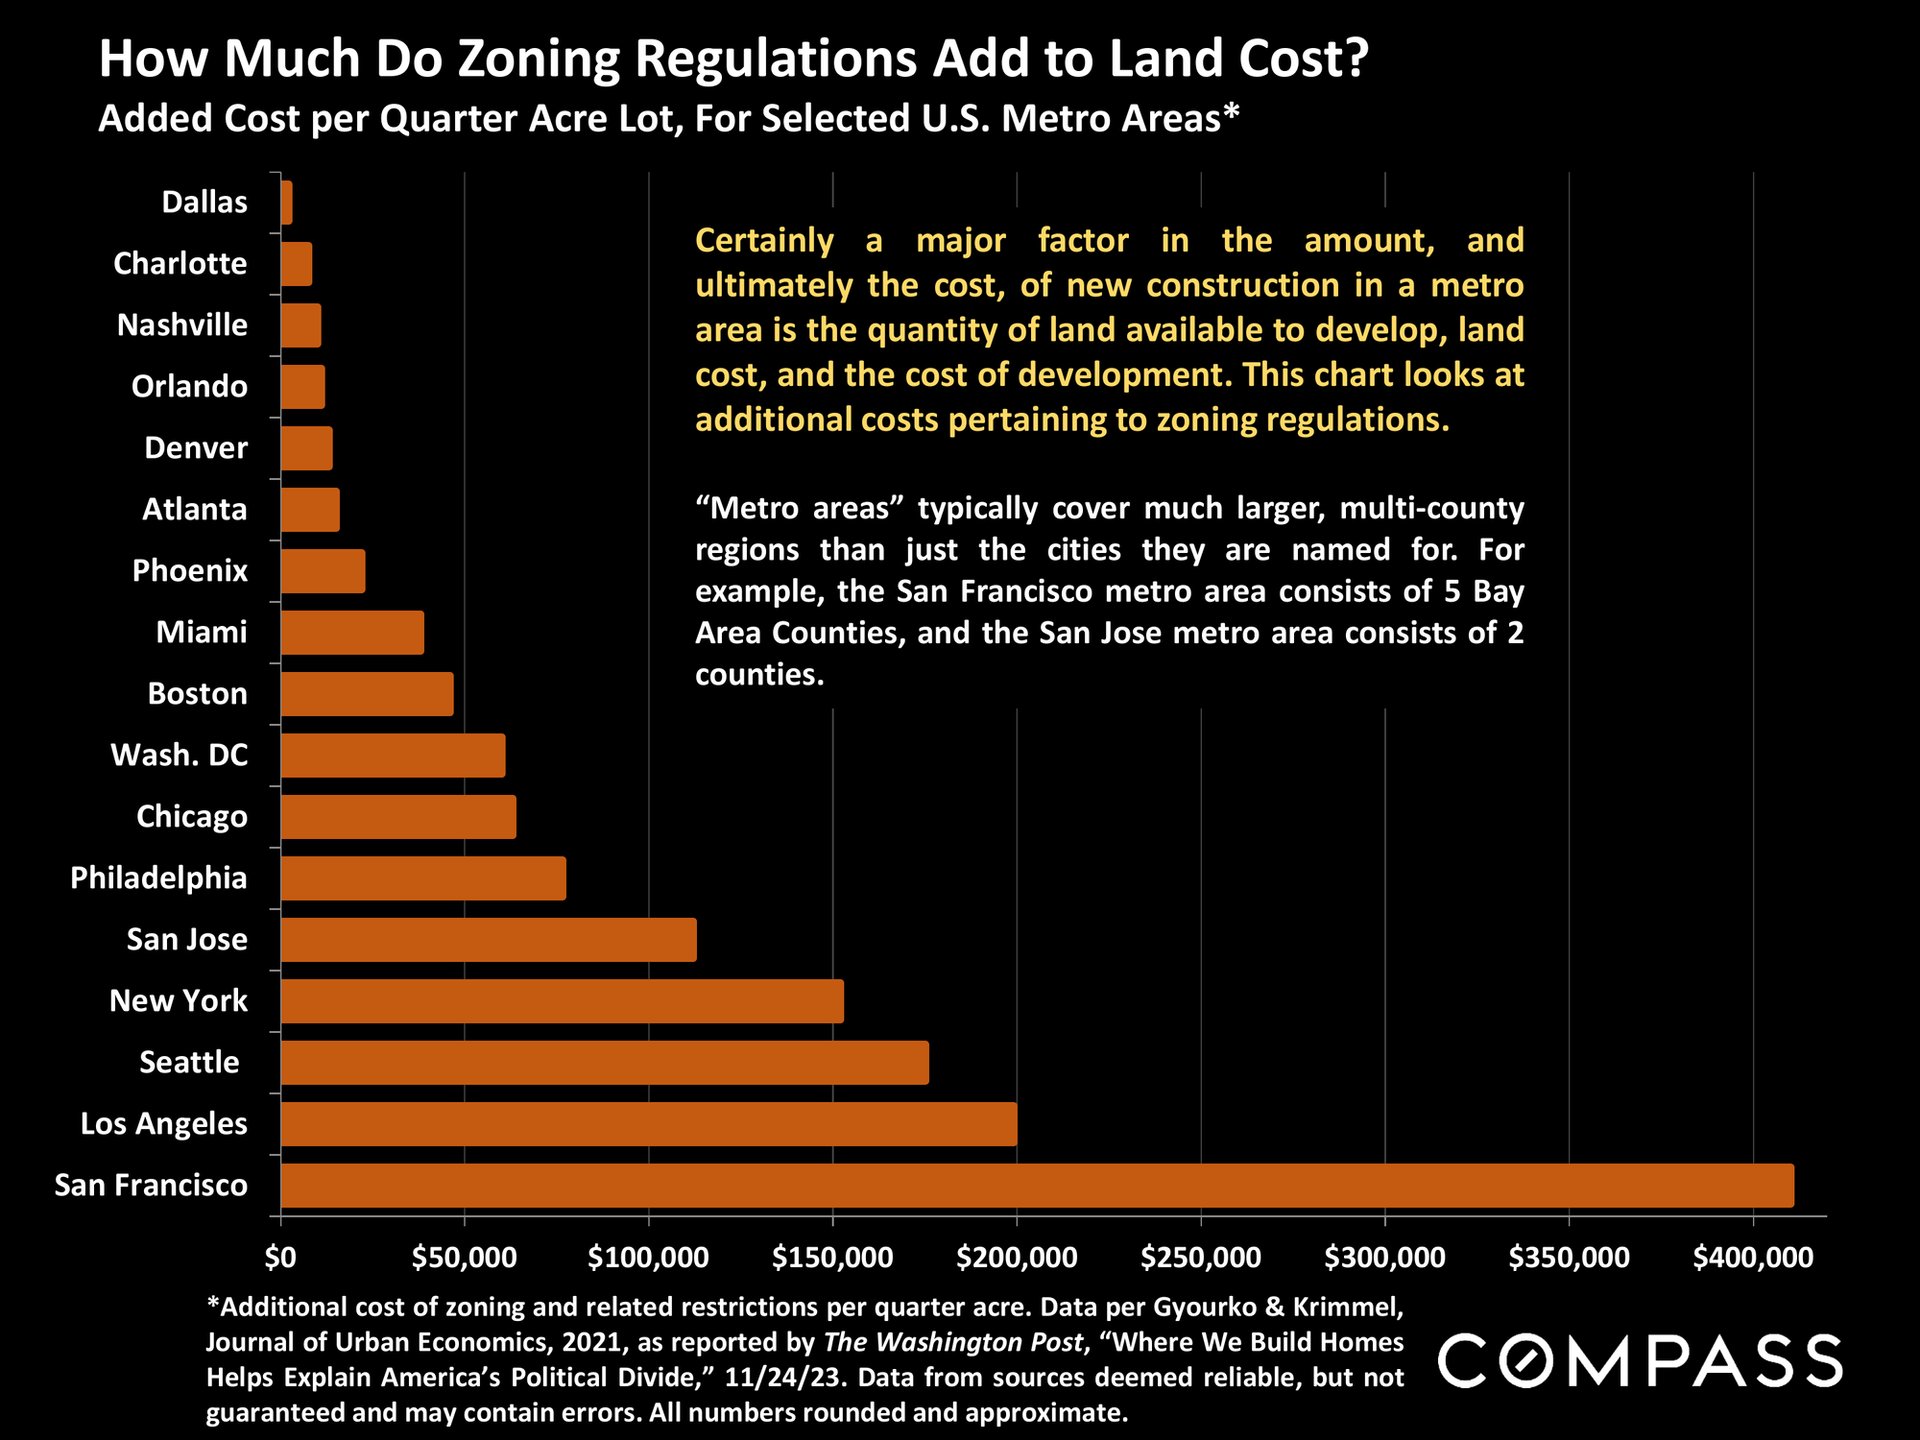
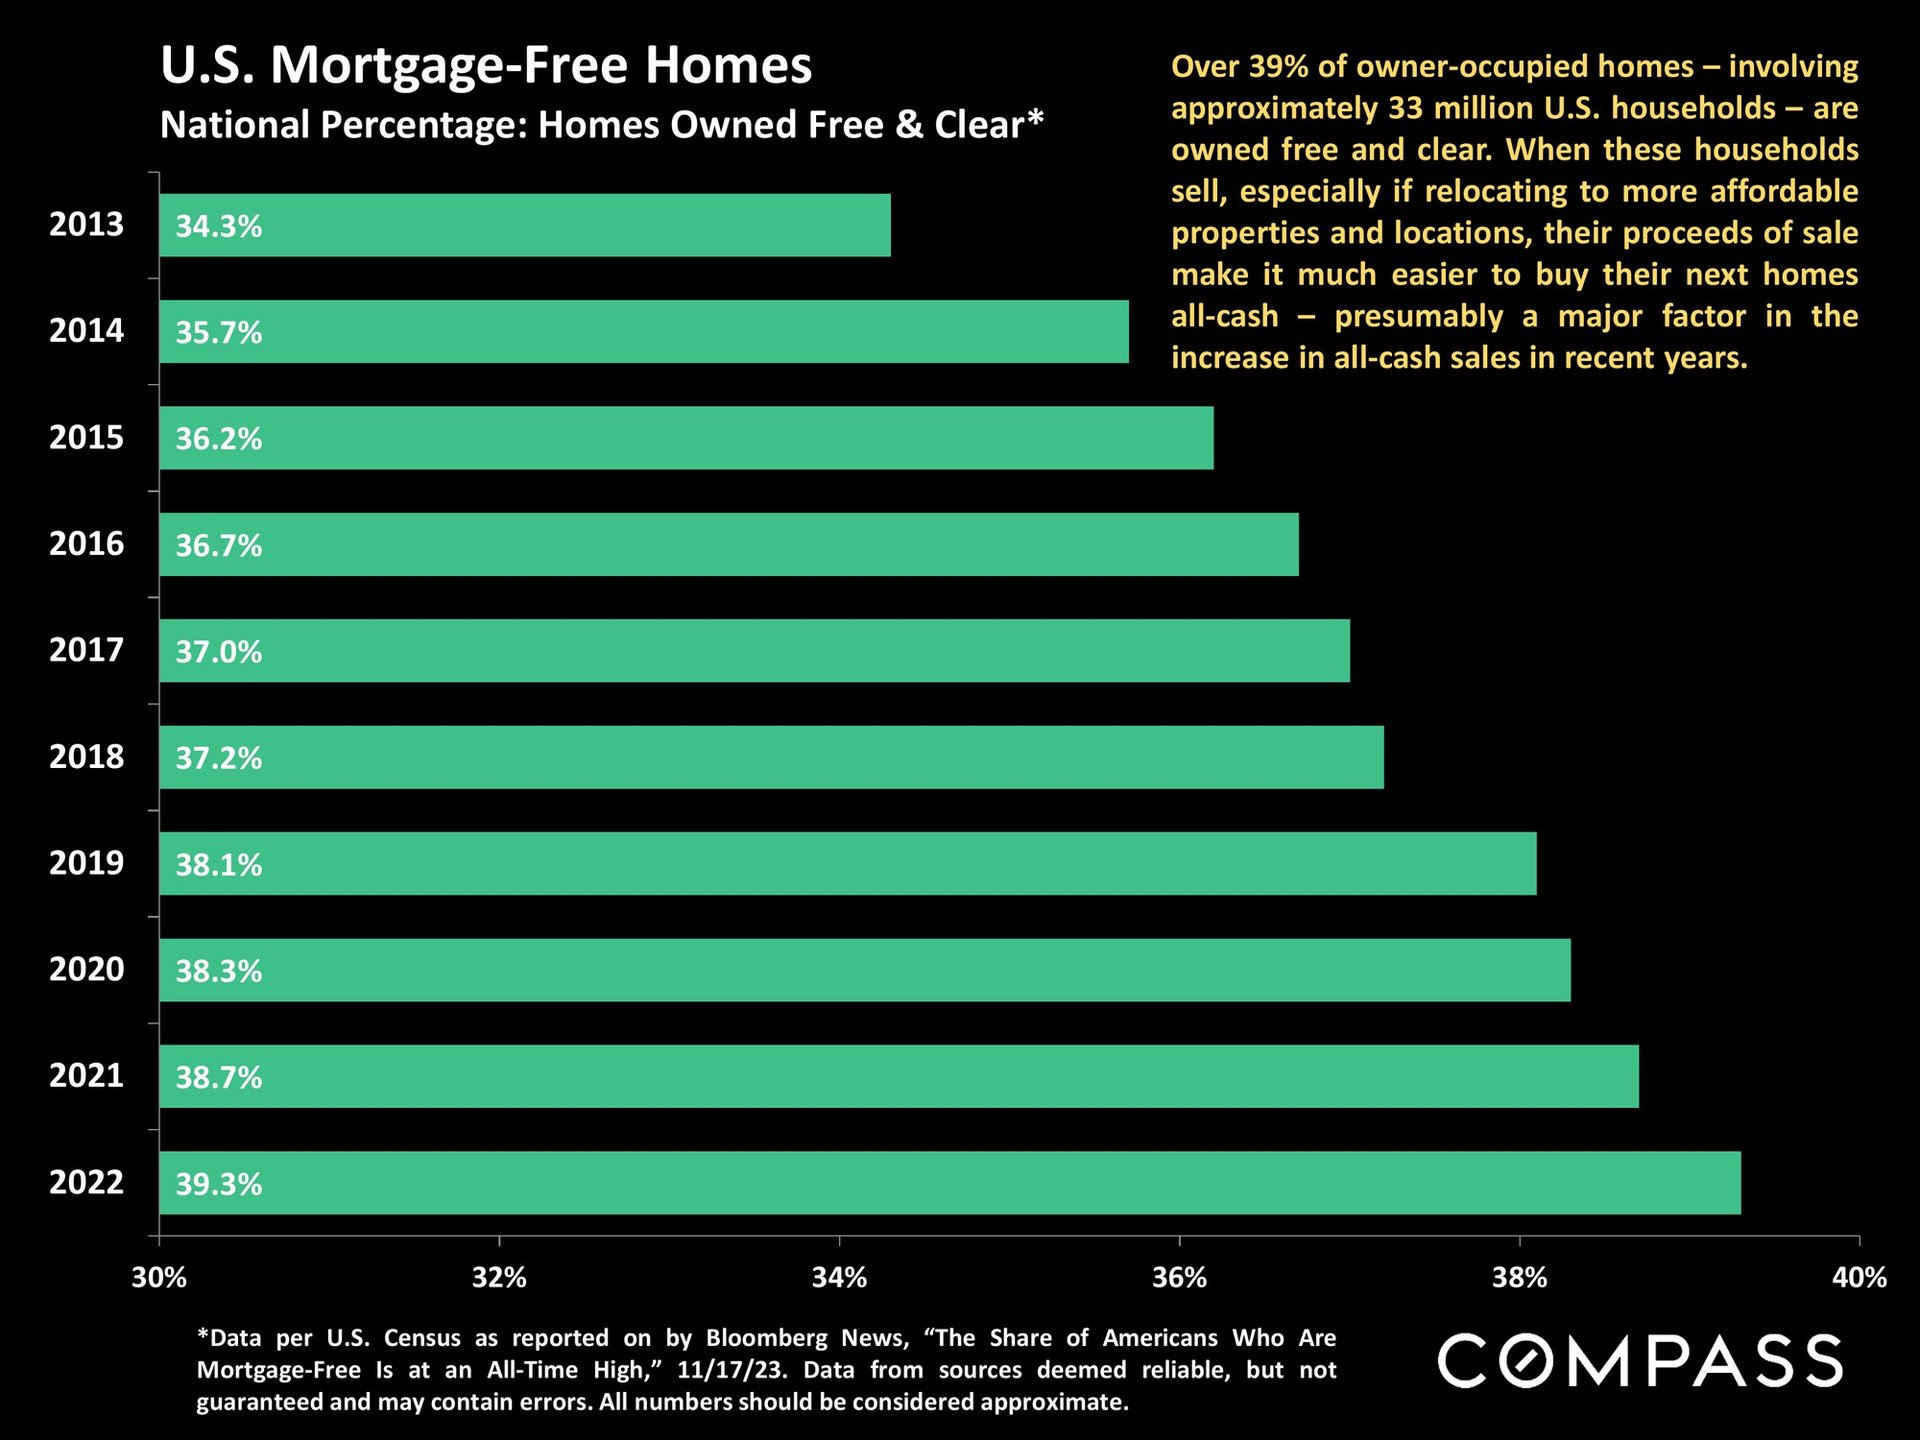
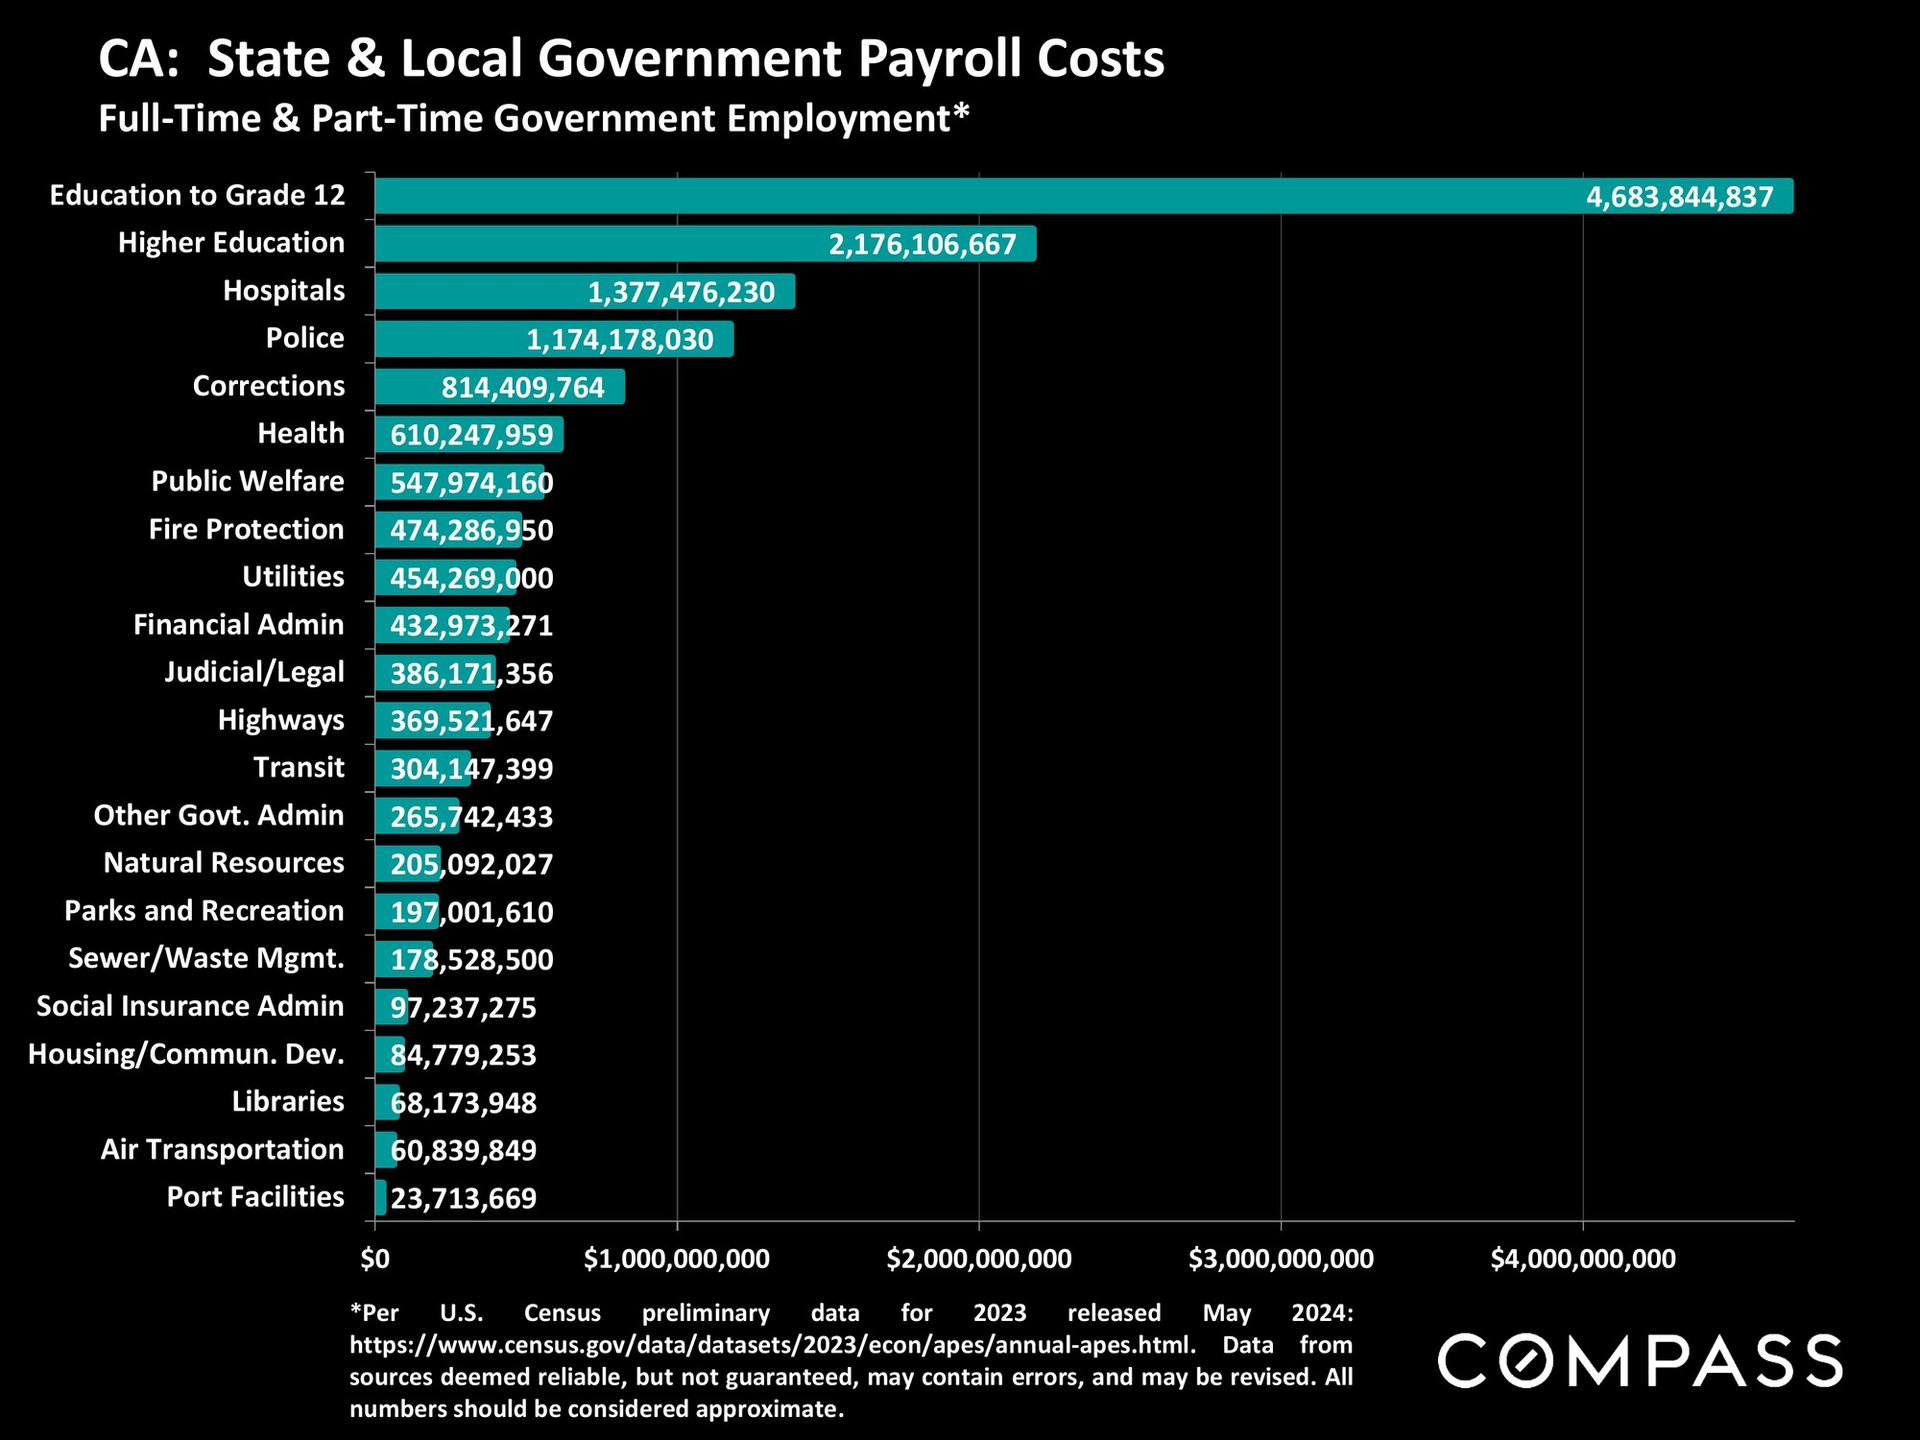
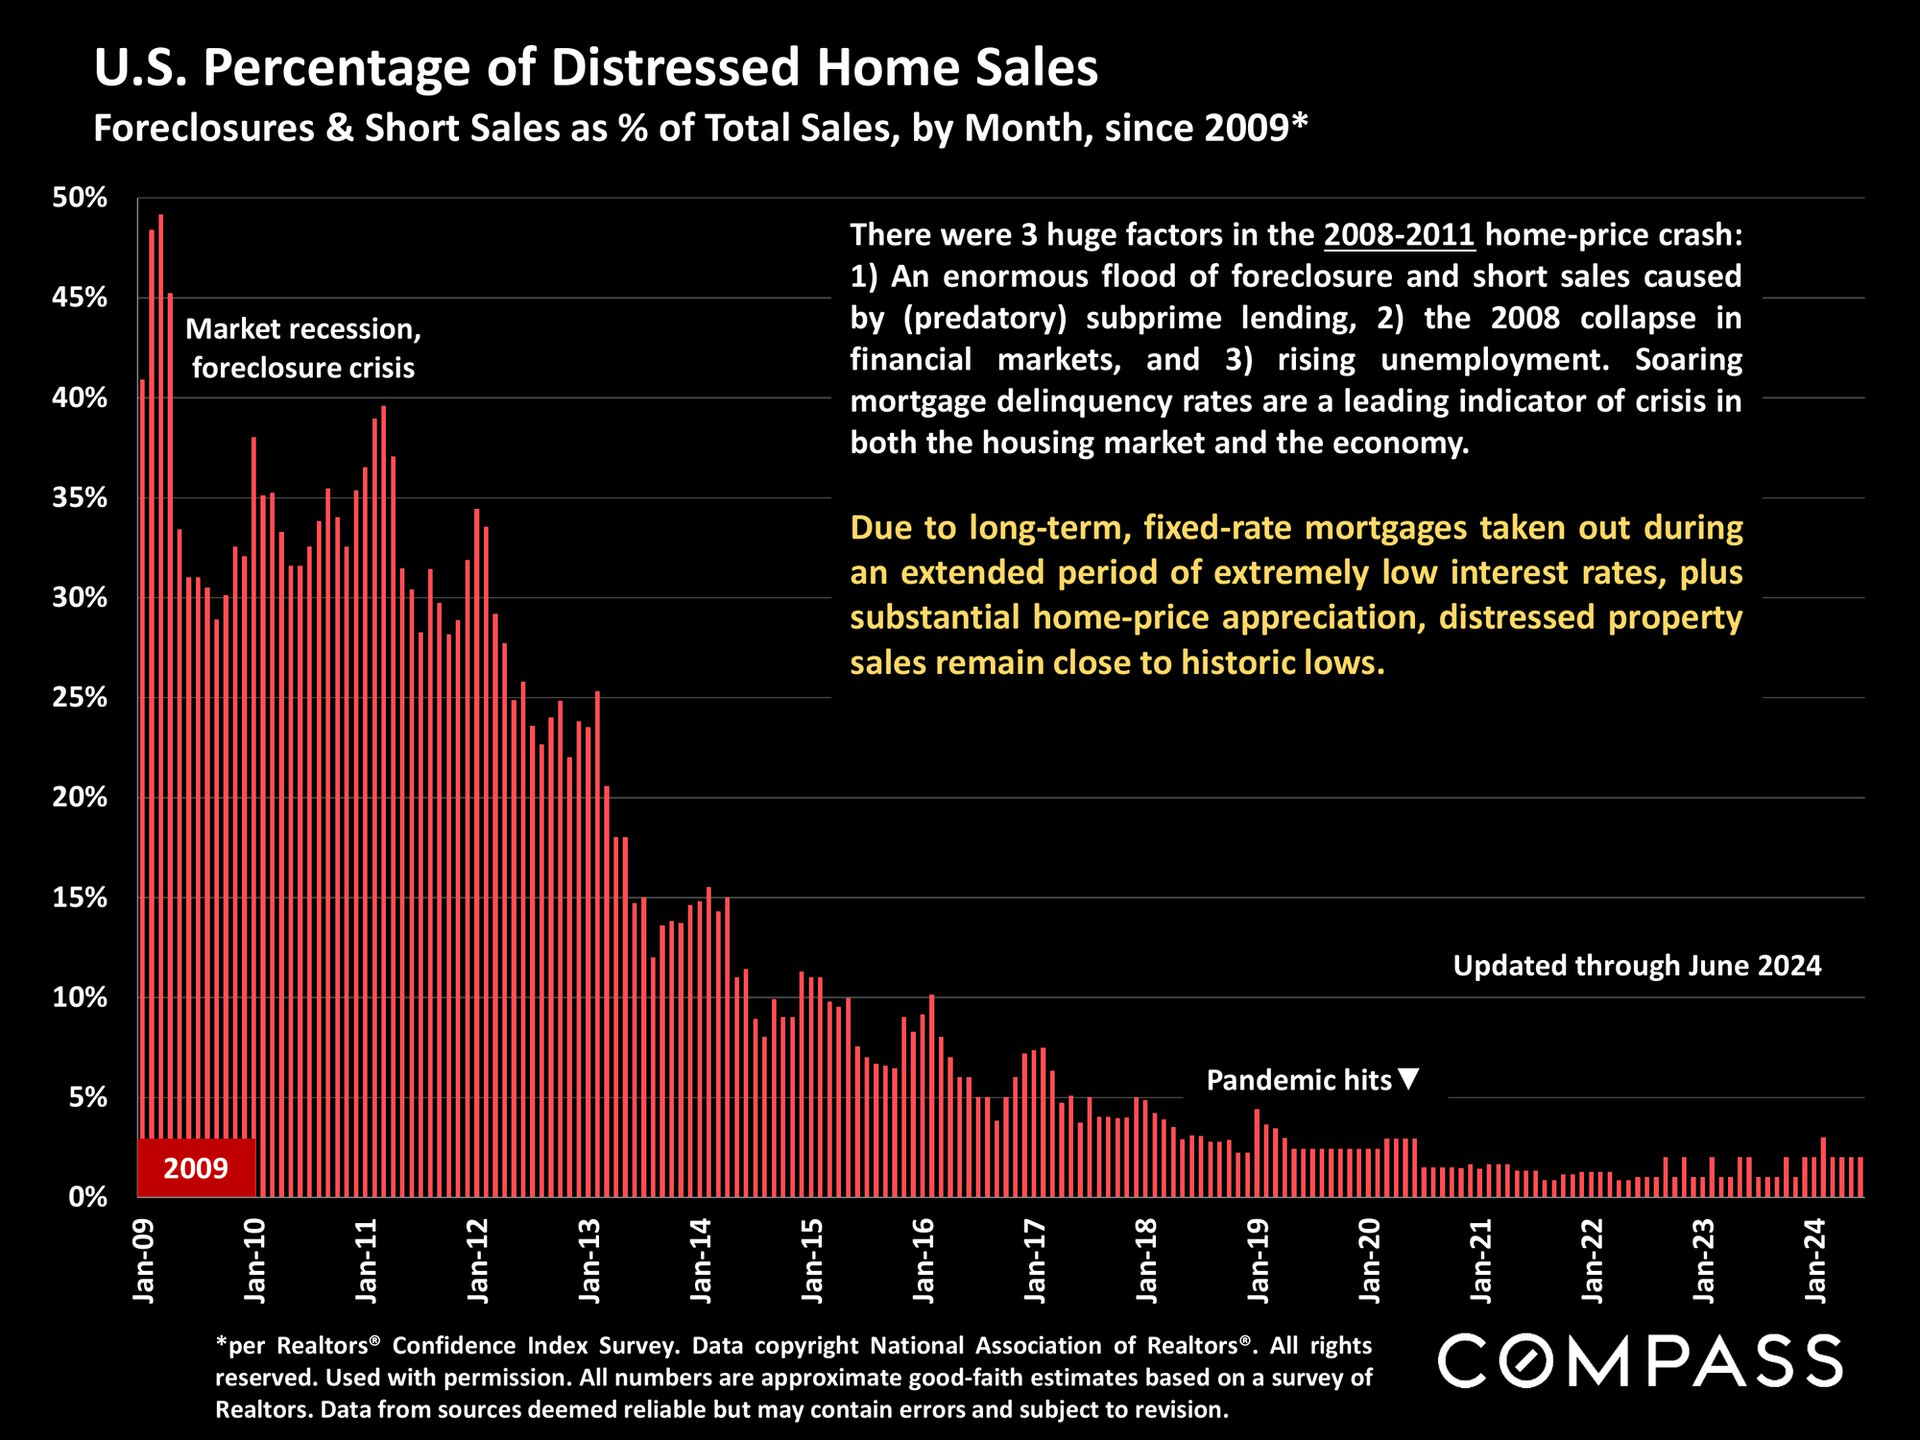
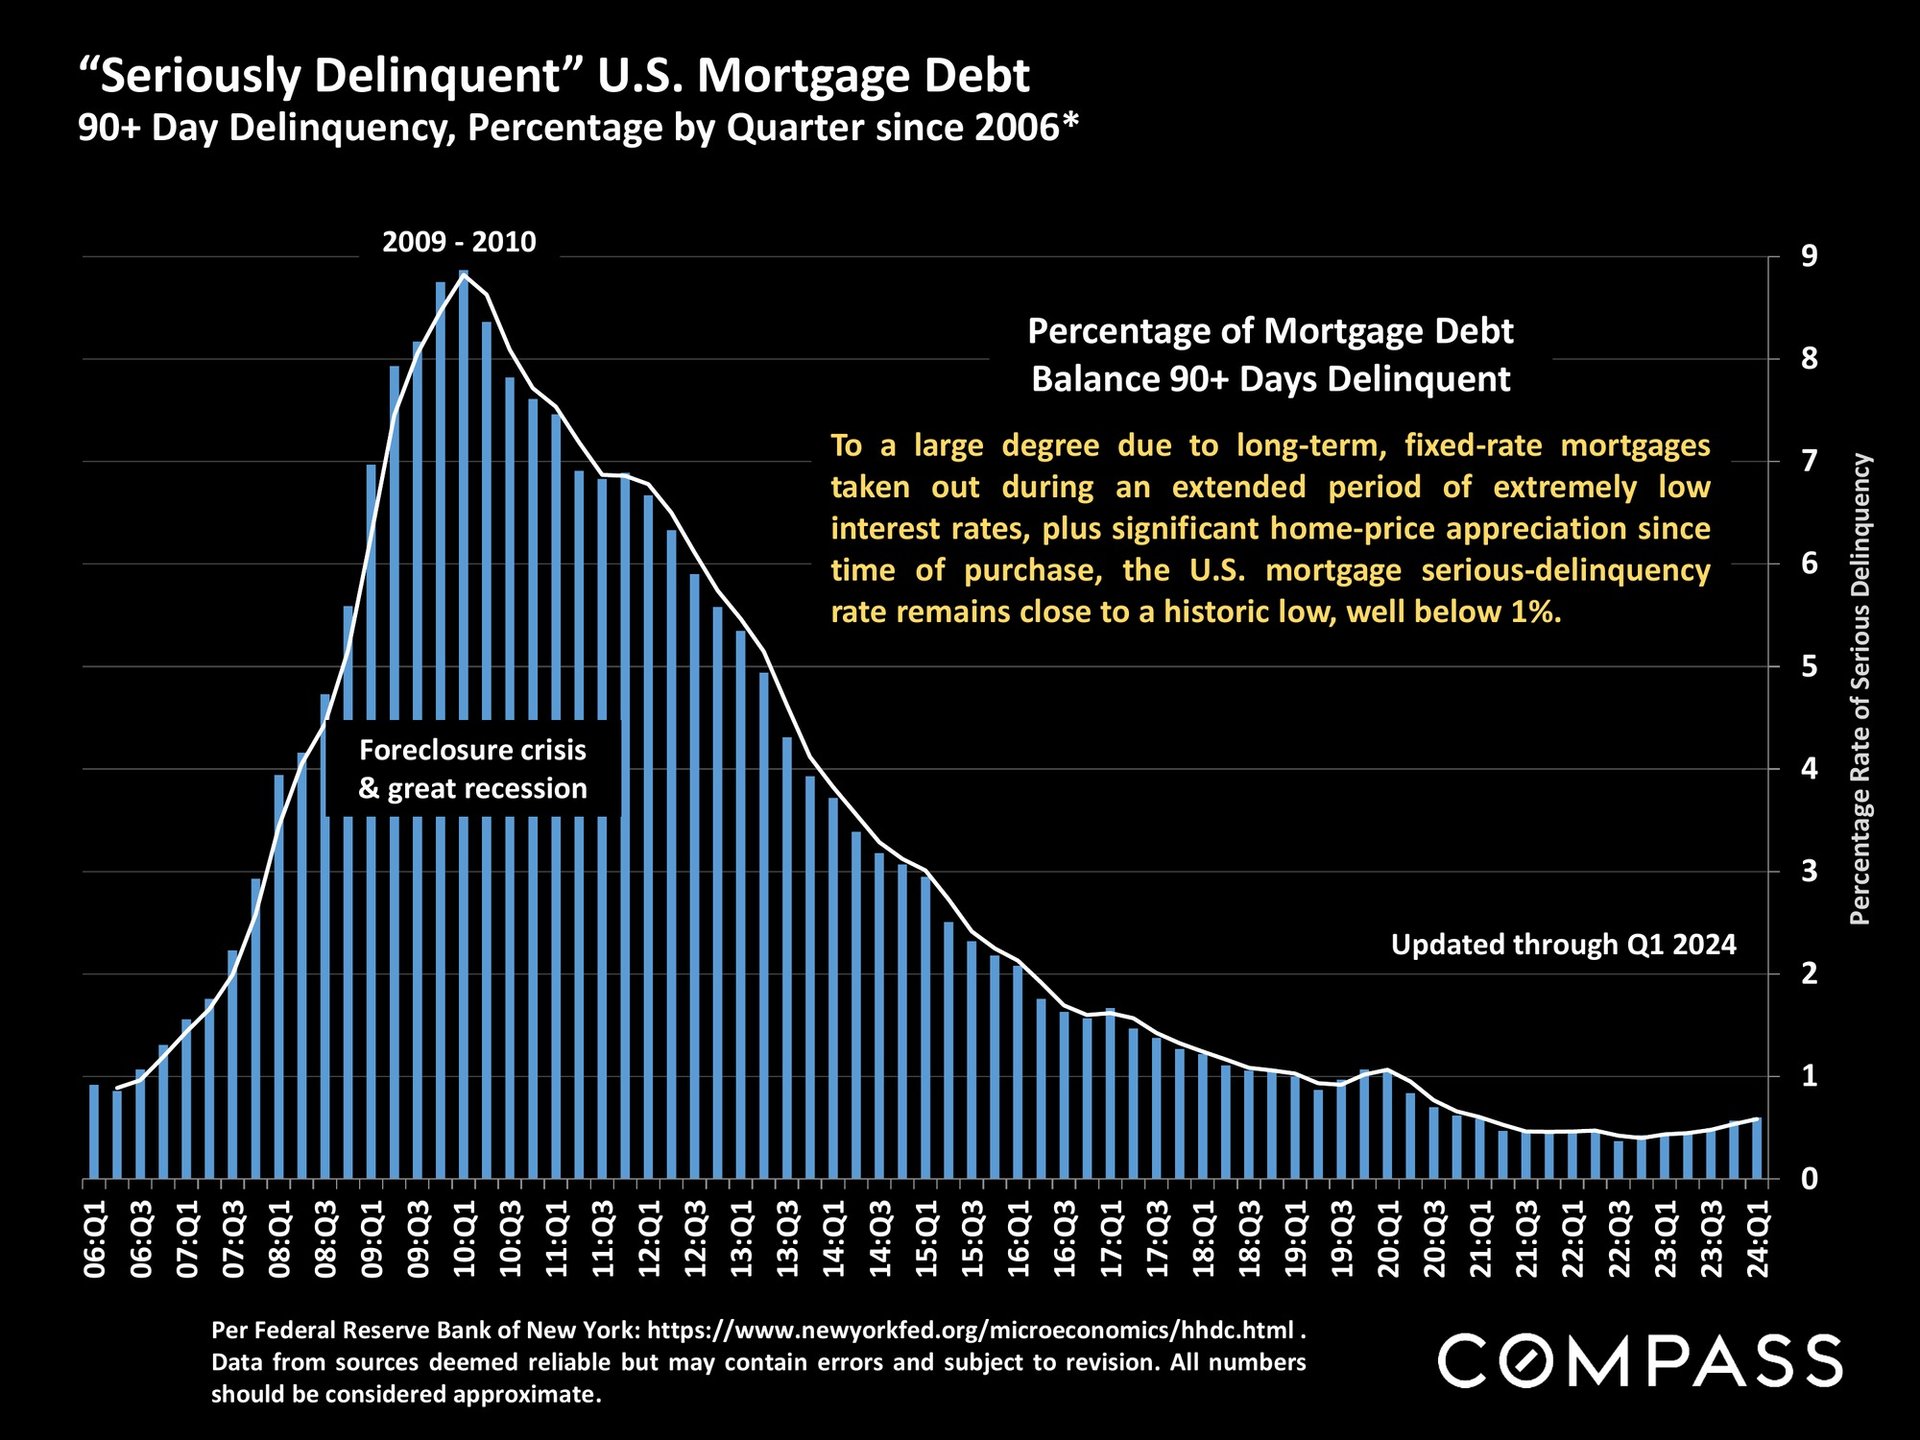
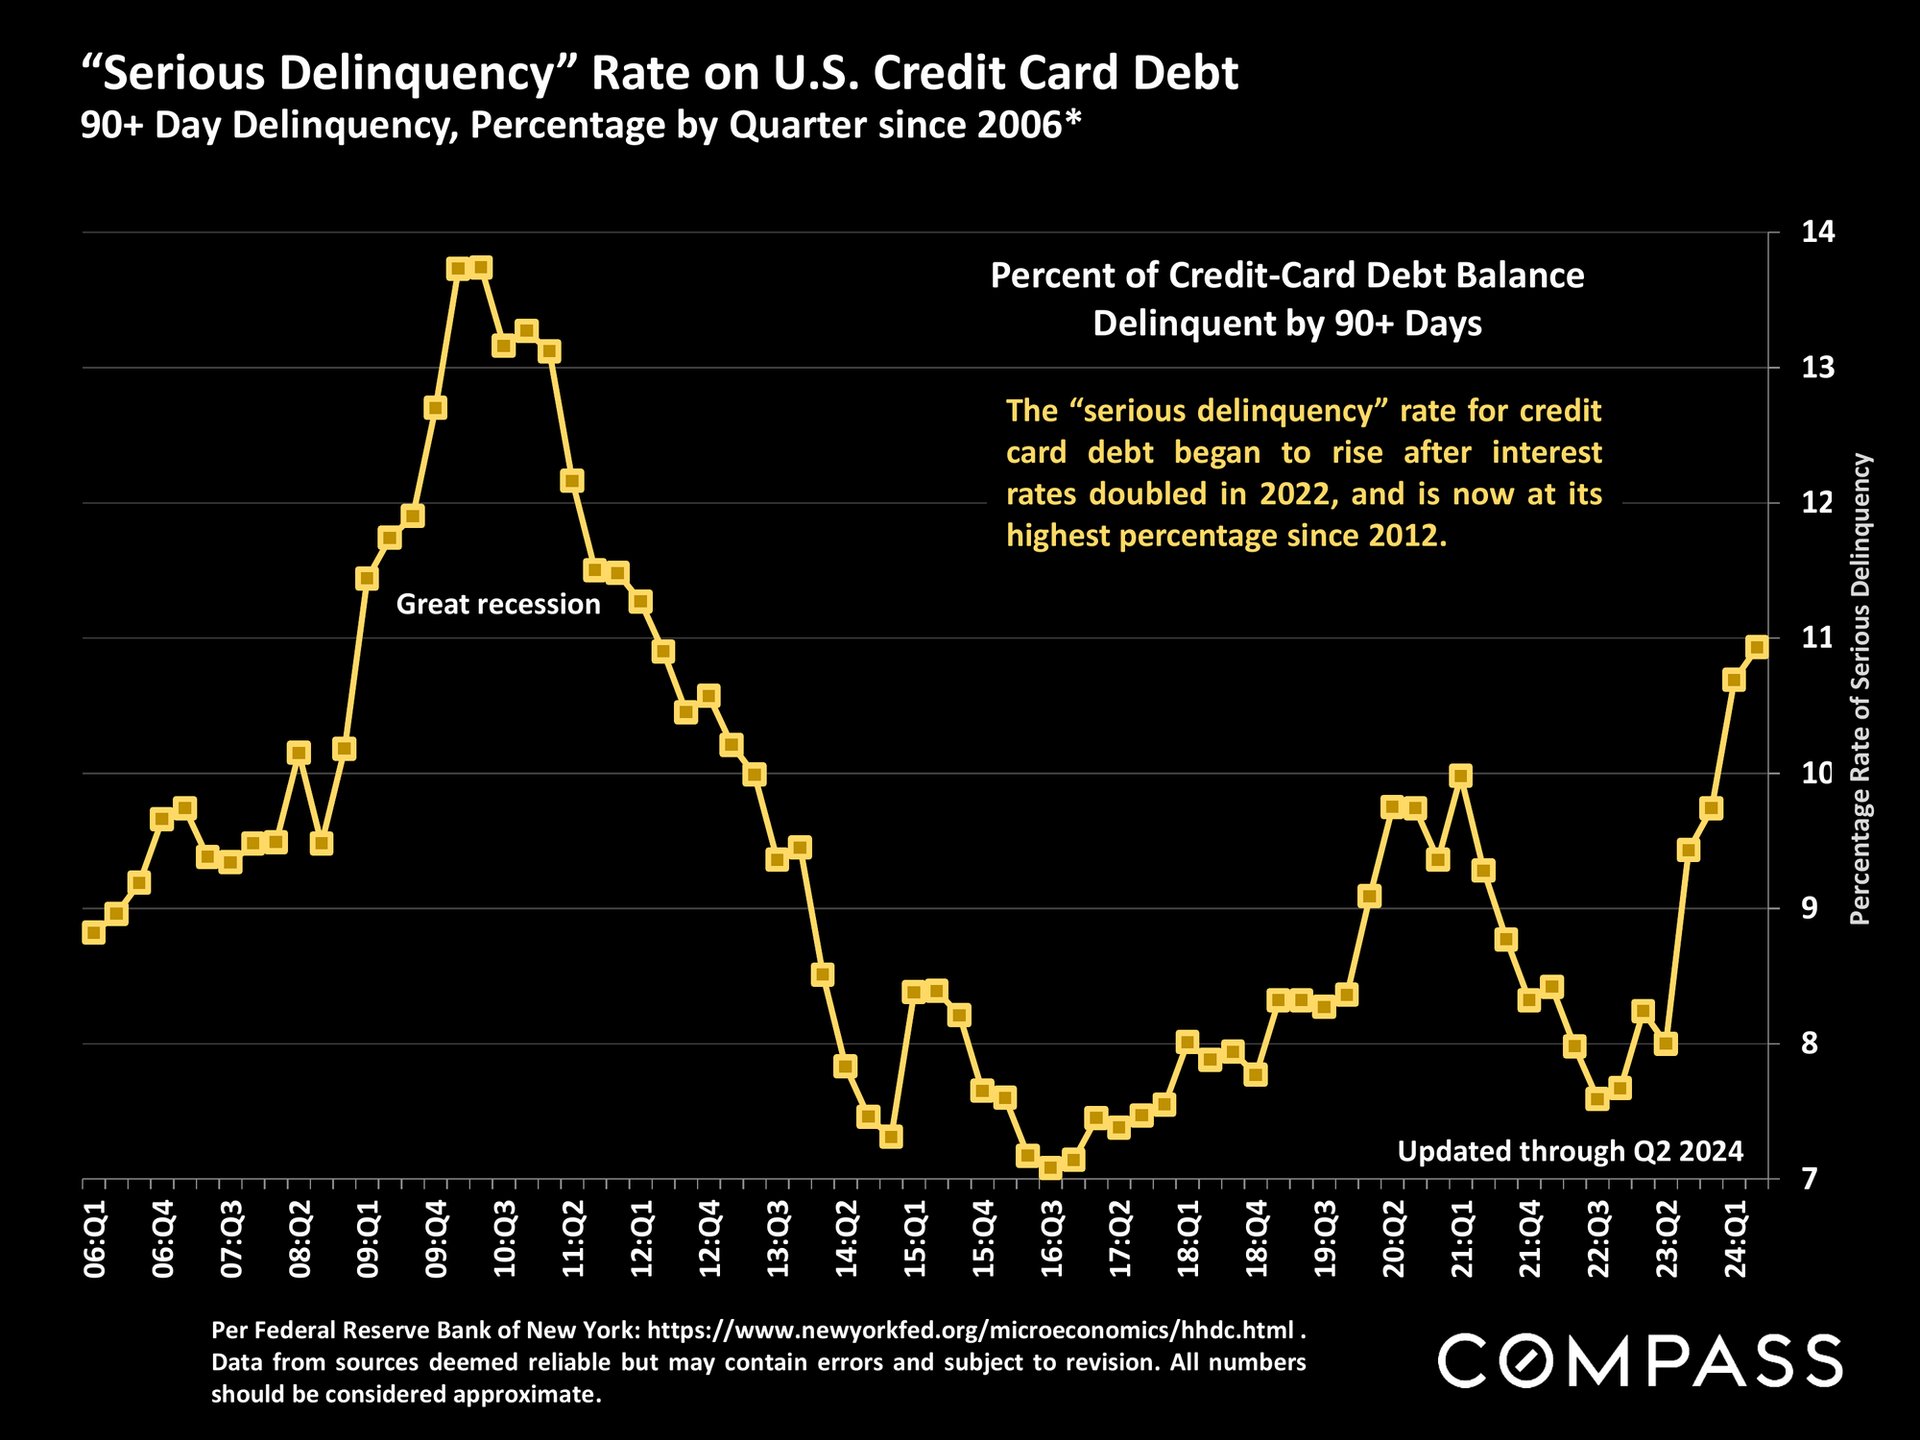
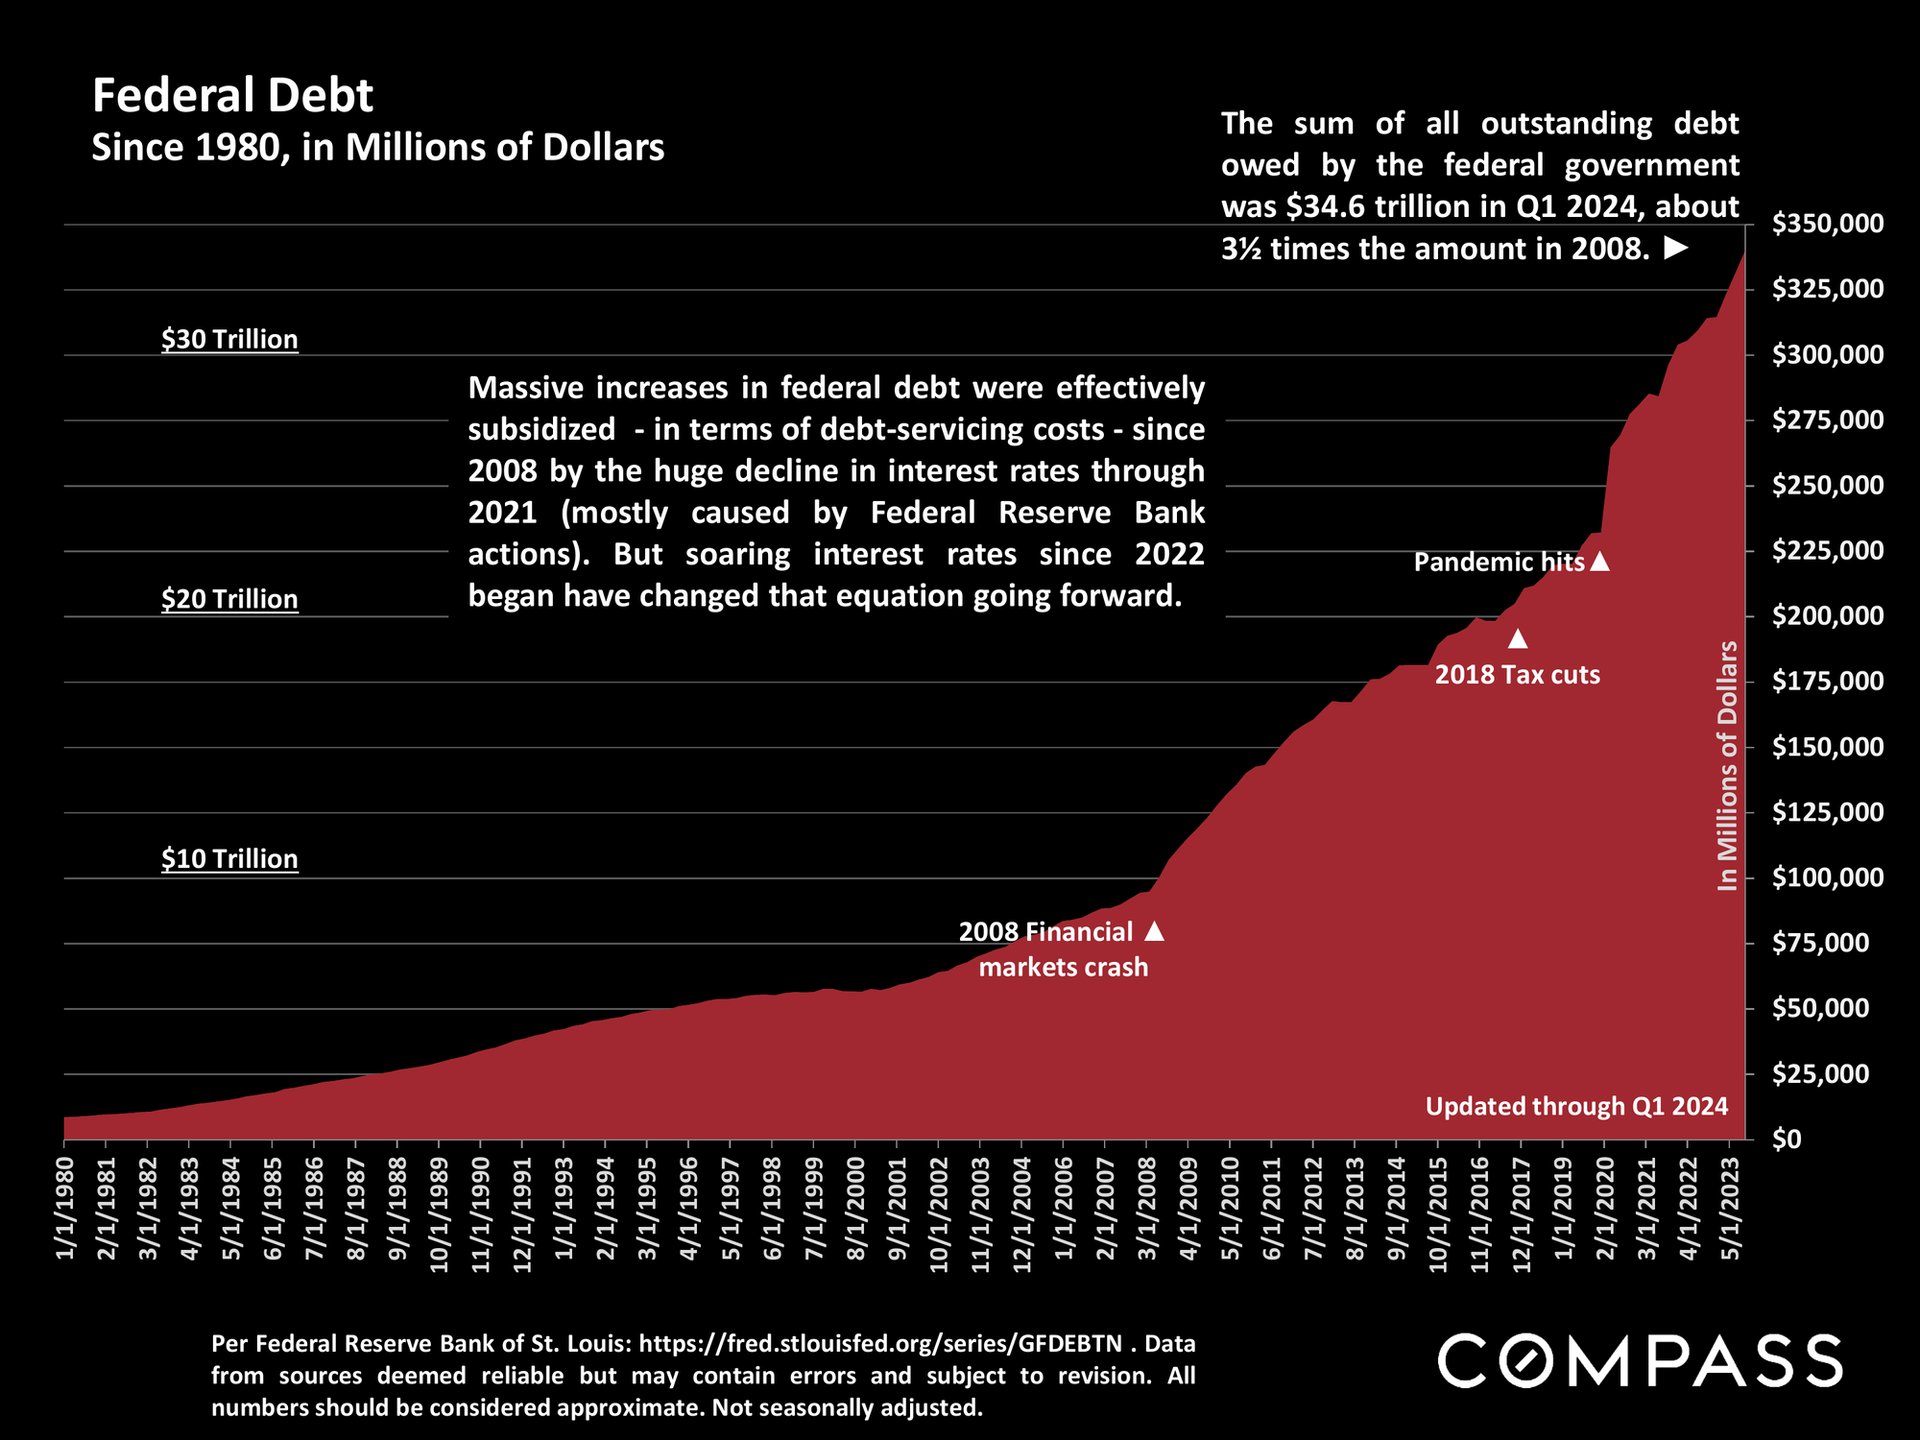
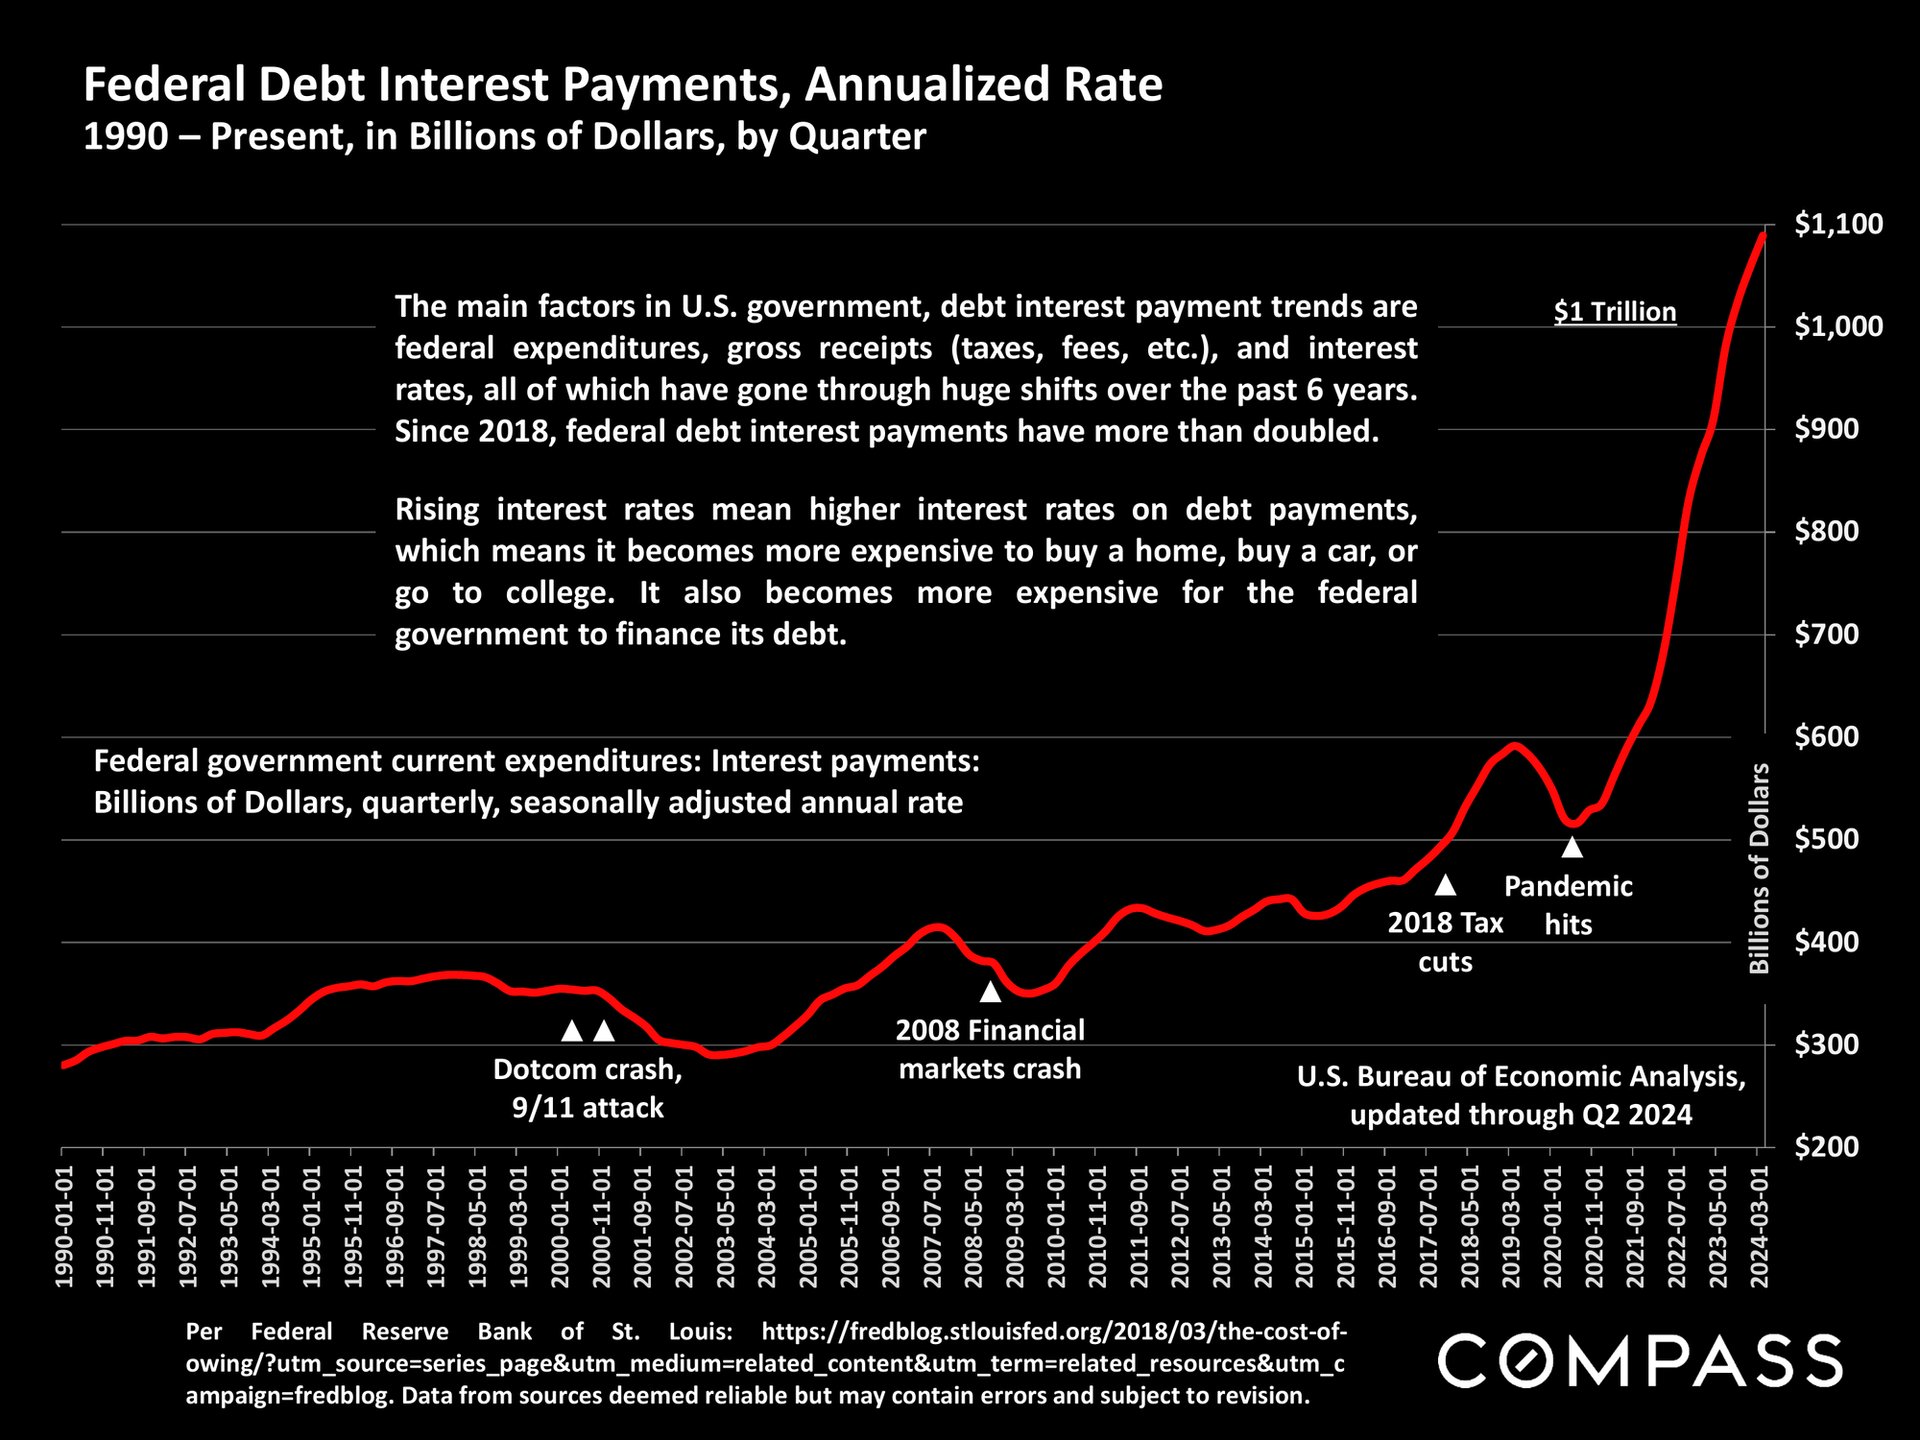
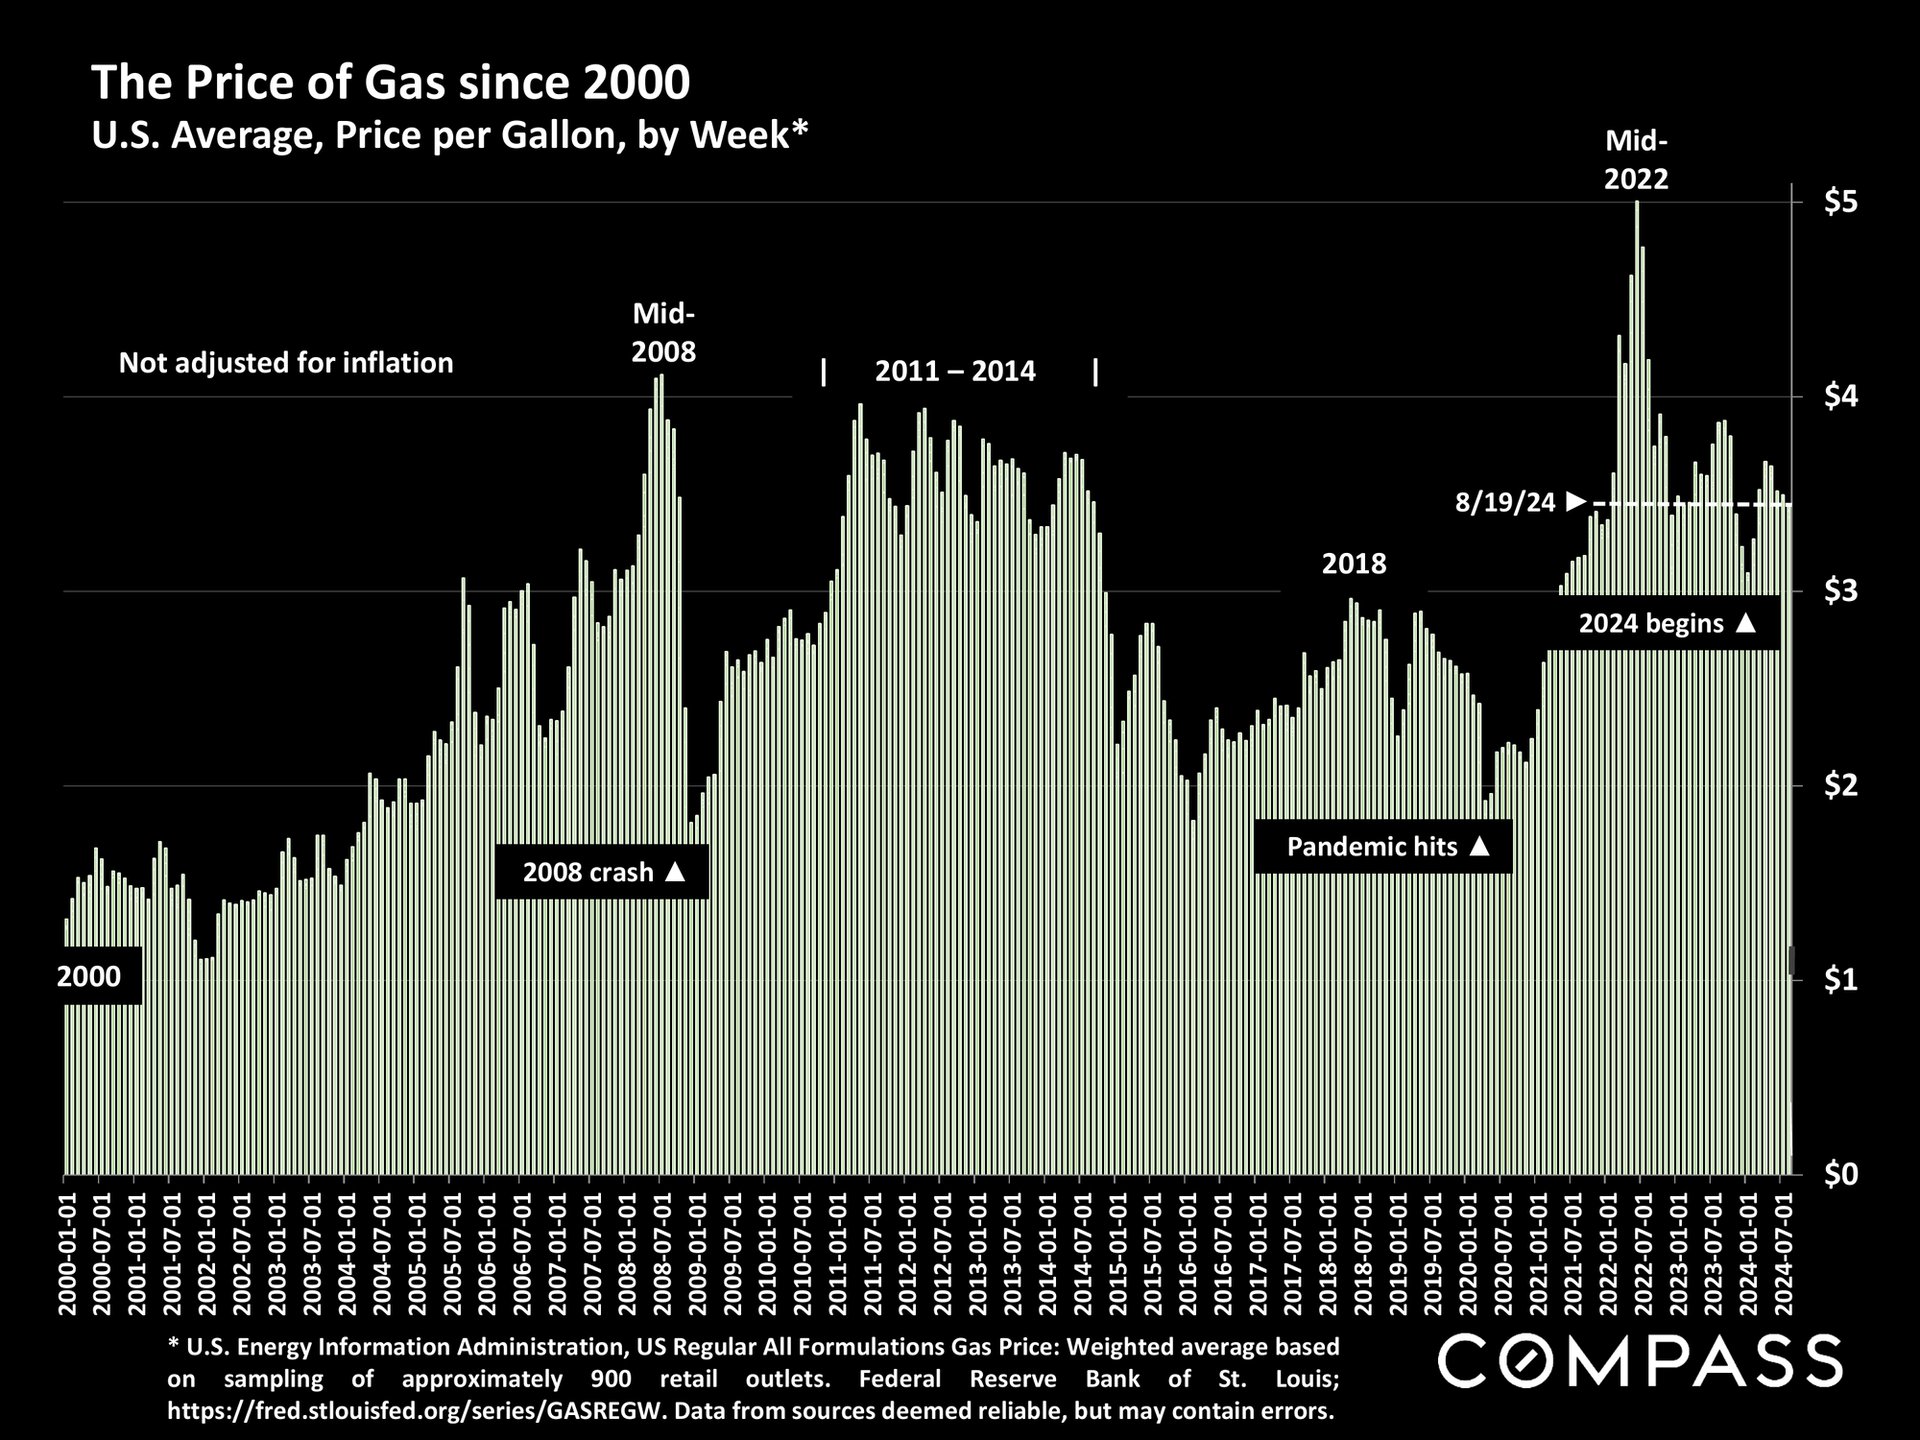
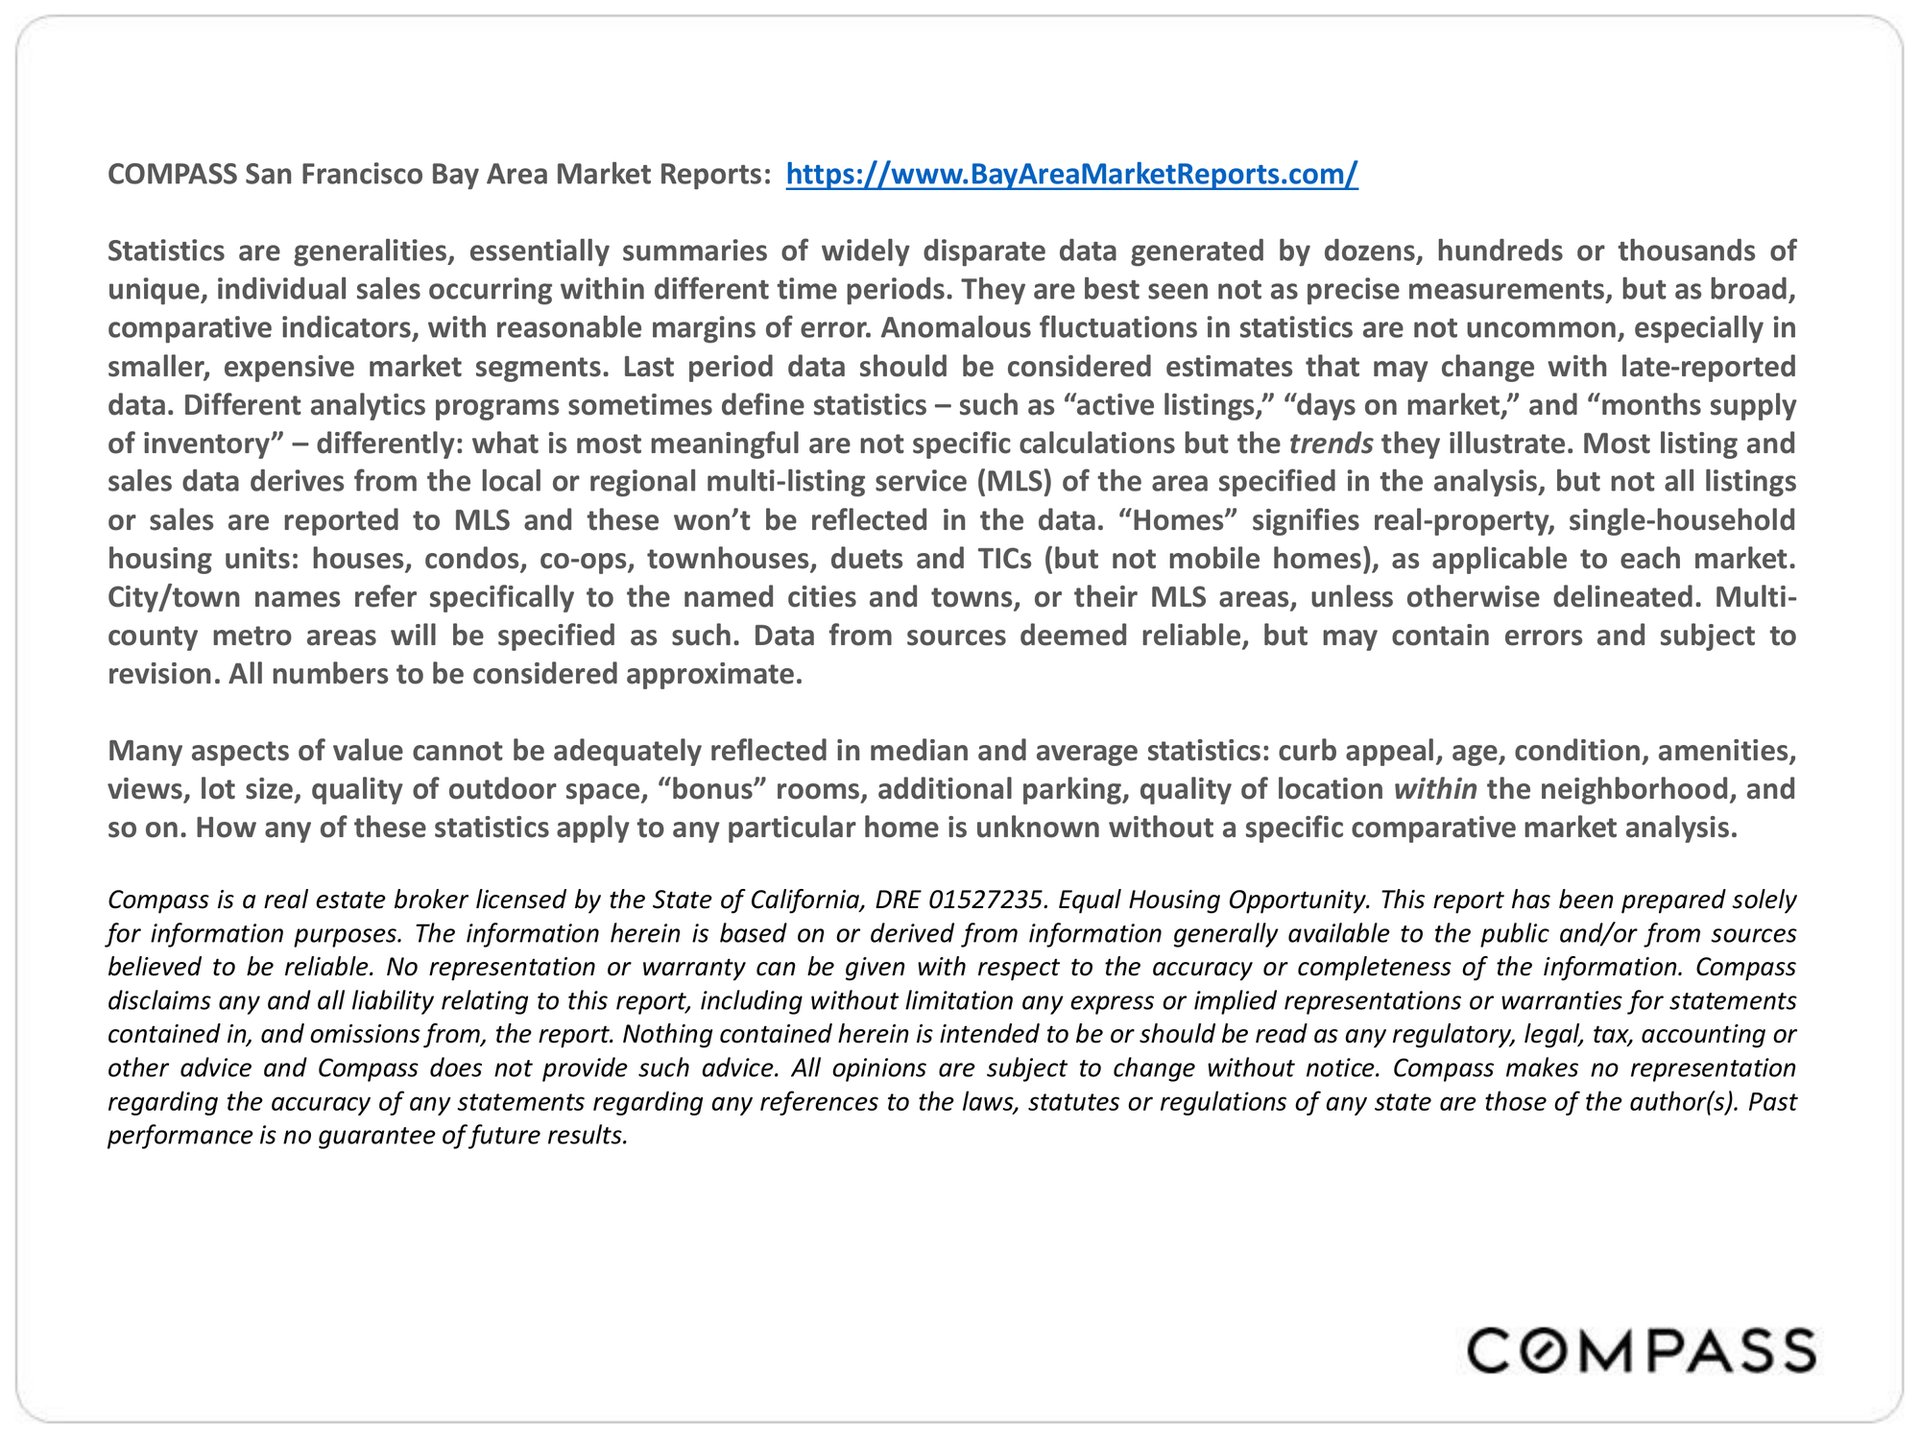
Selected macroeconomic factors and indicators pertinent to Bay Area real estate markets, with charts and a list of economic topics.Chart of annual new listings in the San Francisco Bay Area from 2005 to 2024, with a low in 2023.Chart of annual Bay Area home sales from 2005 to 2024, annotated with major economic periods.Chart of Bay Area luxury home sales, with $5 million-plus sales rebounding in 2024 after a 2021 peak.Chart of weekly 30-year mortgage rates from 2023 to 2025, peaking in October 2023 and rebounding after September 2024.Chart tracks 30-year fixed mortgage rates from 2023 to January 2025, peaking above 8% in October 2023.Chart of U.S. 30-year fixed mortgage rates from 1976 to 2025, peaking above 18% in 1981 and rising recently.Chart of jumbo mortgage rates from 2018 to January 2025, showing a sharp rise after 2021 and a 2023 peak above 8%.Chart of monthly CPI and core inflation from 2021 to 2024, with red bars and a white trend line.Bar chart of monthly CPI inflation from January 2021 to December 2024, peaking at 8.9% in June 2022 and ending at 2.9%.Line chart of U.S. CPI inflation, 1982–2024, with a sharp peak in 2022 and December 2024 at 2.9%.Chart of federal funds interest rates from 1981 to 2025, annotated with economic events and Federal Reserve interventions.University of Michigan consumer sentiment chart, 1978–2025, annotated with recessions, market crashes, and a January 2025 reading.Chart of U.S. quarterly real GDP growth from Q1 2022 to Q4 2024, peaking at 4.4% in Q3 2023.Chart compares 2024–2025 year-to-date gains for the Nasdaq and S&P 500.S&P 500 stock market index trends from 2014 through January 2025, rising above 6,000.Nasdaq Composite Index chart from 1995 to 2025, with pandemic and interest-rate annotations.Bar chart of monthly U.S. nonfarm job changes, January 2023–December 2024, with values and Compass branding.Chart of U.S. monthly unemployment rates from 2000 to December 2024, with an orange line and a 4.1% latest rate.Line chart compares unemployment rates across six Bay Area counties from 2019 through November 2024.Nasdaq Composite Index chart from 1995 to 2025, with pandemic and rising-interest-rate annotations.Bar chart comparing annual median house sale prices across Sacramento and Bay Area counties from 2011 to 2024.Chart of median home sale prices in four Bay Area counties from 1990 to 2024, with recession and pandemic annotations.Line chart comparing median home sale prices in four Bay Area counties from 1990 to 2024.Bar chart of Bay Area median home prices from 1990 to 2024, rising from about $240,000 to over $1.3 million.Chart of U.S. median single-family-home prices since 1990, with recession, pandemic, and seasonal market annotations.Chart shows insurance difficulties increased from 2023 to 2024 across California property locations, highest for vacation homes at 51%.Bar chart of California all-cash home purchases, 2005–2024, peaking at 30% in 2012 and 28% in 2023.Bar chart showing California homeowners’ years in their homes before selling, rising to 13 years in 2024.Bar chart of California investment and rental home purchases, 2000–2024; the 2013 peak is 18.9%.Chart of international buyers’ share of California home purchases from 2008 to 2024, with a 2020 pandemic marker.Bar chart of California vacation-home sales shares from 2000–2024, peaking at 8.1% in 2023 before falling to 7.3%.Infographic ranking cities by millionaire and billionaire populations; San Francisco Bay Area is second for millionaires and first for billionaires.Map of U.S. county population changes from July 2022 to July 2023, shaded by percentage increase or decline.Homeowners insurance average annual cost by state, with California highlighted.Map of 27 U.S. billion-dollar weather and climate disasters in 2024, with event locations, types, and dates.Infographic comparing billion-dollar U.S. disaster counts and costs, with 2024 costs highlighted at $182.7 billion.Bar chart of California wildfire acreage burned yearly from 2010 to 2023, peaking in 2020.Q2 2024 metro-area home prices and year-over-year changes, with Bay Area markets among the highest listed.Q2 2024 infographic comparing median condo and co-op sale prices across U.S. metro areas, with year-over-year changes.Infographic summarizes foreign-national U.S. home purchases, buyer characteristics, top countries of origin, and destination states.Chart of foreign homebuyer transactions by country from 2013 to 2024, highlighting a 36% annual and 82% decline since 2010.Bar chart of foreign homebuyer destinations: Florida leads at 20%, followed by Texas at 13% and California at 11%.Bar chart of annual Bay Area home listings, with volumes declining to a low of 64,370 in 2023.Chart of annual Bay Area home sales, showing a sharp decline to 51,374 sales in 2023.Chart of Bay Area luxury home sales from 2005–2023, peaking in 2021; gold bars show $5M+ sales and a green line shows $10M+ sales.Chart of Bay Area housing affordability from 1991 through Q2 2024, with a blue trend line and economic-period annotations.Infographic listing economic, political, social, and other factors affecting Bay Area real estate markets.Bar chart of Greater Bay Area annual population changes, with the steepest decline in 2021.Chart of Bay Area county population losses since the pandemic, with San Francisco showing the largest decline.Chart of pandemic-era population declines across 11 Greater Bay Area counties, from 7.1% in San Francisco to 0.8% in Solano.Summary of Bay Area migration and population changes, including destinations, pandemic effects, and uncertain future trends.FEMA map of U.S. county risk from 18 natural hazards, with a legend and risk calculation.U.S. map showing foreign-born residents as a share of each state's population; California leads at 26.53%.Bar chart of U.S. homeowners by age; ages 55–64 make up the largest group at 21.5%.Chart of national homeownership duration, rising from 5 years in 1985 to 13 years in 2021.Bar chart of U.S. homeowners’ moving expectations, falling to 8.7% in 2023 after a 2021 pandemic-era surge.Bar chart of U.S. households by size, showing two-person households as the largest group.Chart of California housing construction and building permits authorized annually from 1975 to 2023.Chart comparing monthly housing permits per 100,000 residents by state, with California highlighted in the 21–29-unit group.Chart comparing added zoning costs per quarter-acre lot across U.S. metro areas; San Francisco is highest.Chart shows U.S. mortgage-free home ownership rising from 34.3% in 2013 to 39.3% in 2022.Bar chart of California government payroll costs by category; education to grade 12 leads, followed by higher education.Chart of U.S. distressed home sales, with foreclosure and short-sale percentages falling from 2009 to 2024.Chart of U.S. mortgage delinquencies, peaking around 2009–2010 and falling below 1% by Q1 2024.Chart of U.S. credit card debt delinquency, showing a sharp rise to about 11% by Q2 2024.Chart of federal debt from 1980 to Q1 2024, with a red area graph and marked economic events.Chart of federal debt interest payments, with a red line surging to about $1.1 trillion in 2024.Chart of weekly U.S. gas prices from 2000 to 2024, peaking above $5 per gallon in mid-2022.Compass Bay Area market reports page with county listings and Bay Area landscape photos.Compass market report notes on real estate statistics, home values, and data limitations.


WORK WITH US

We offer the highest level of service and expertise to our clients. Our team has built a reputation for consistently representing the finest real estate in San Francisco and Napa Valley. Results driven and dedicated to your success, whether buying, selling, renting or investing. Contact us today for a private consultation.

Contact Us