Sonoma County - October 2023

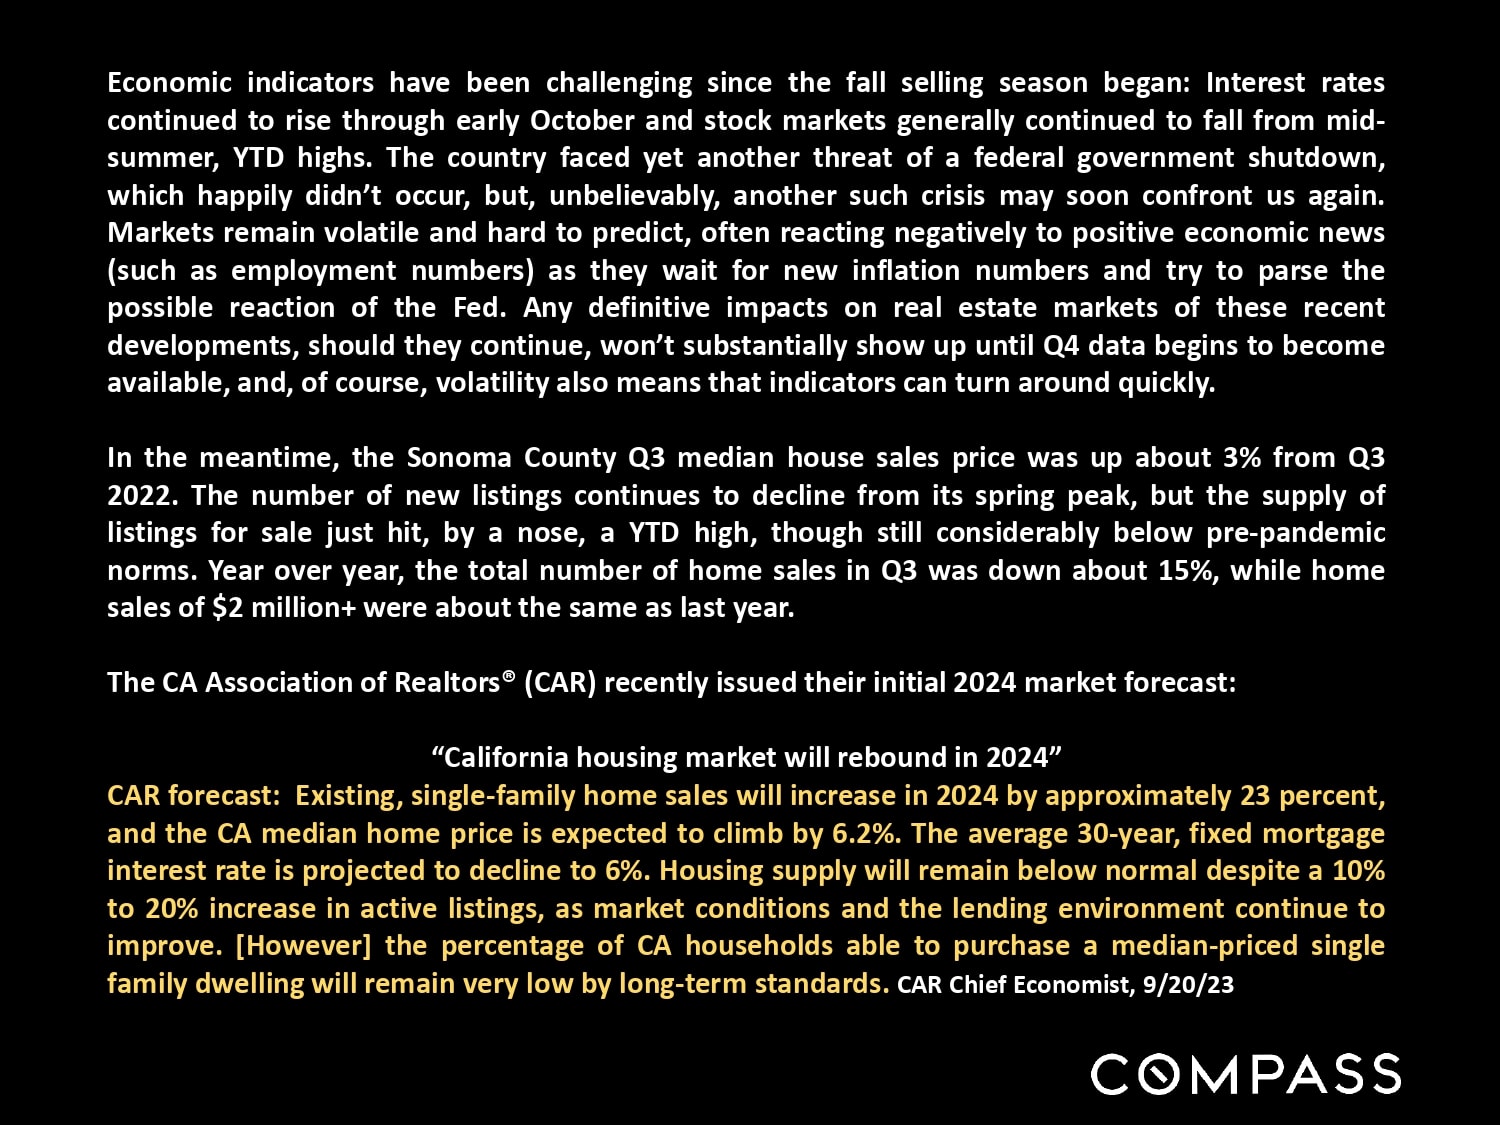
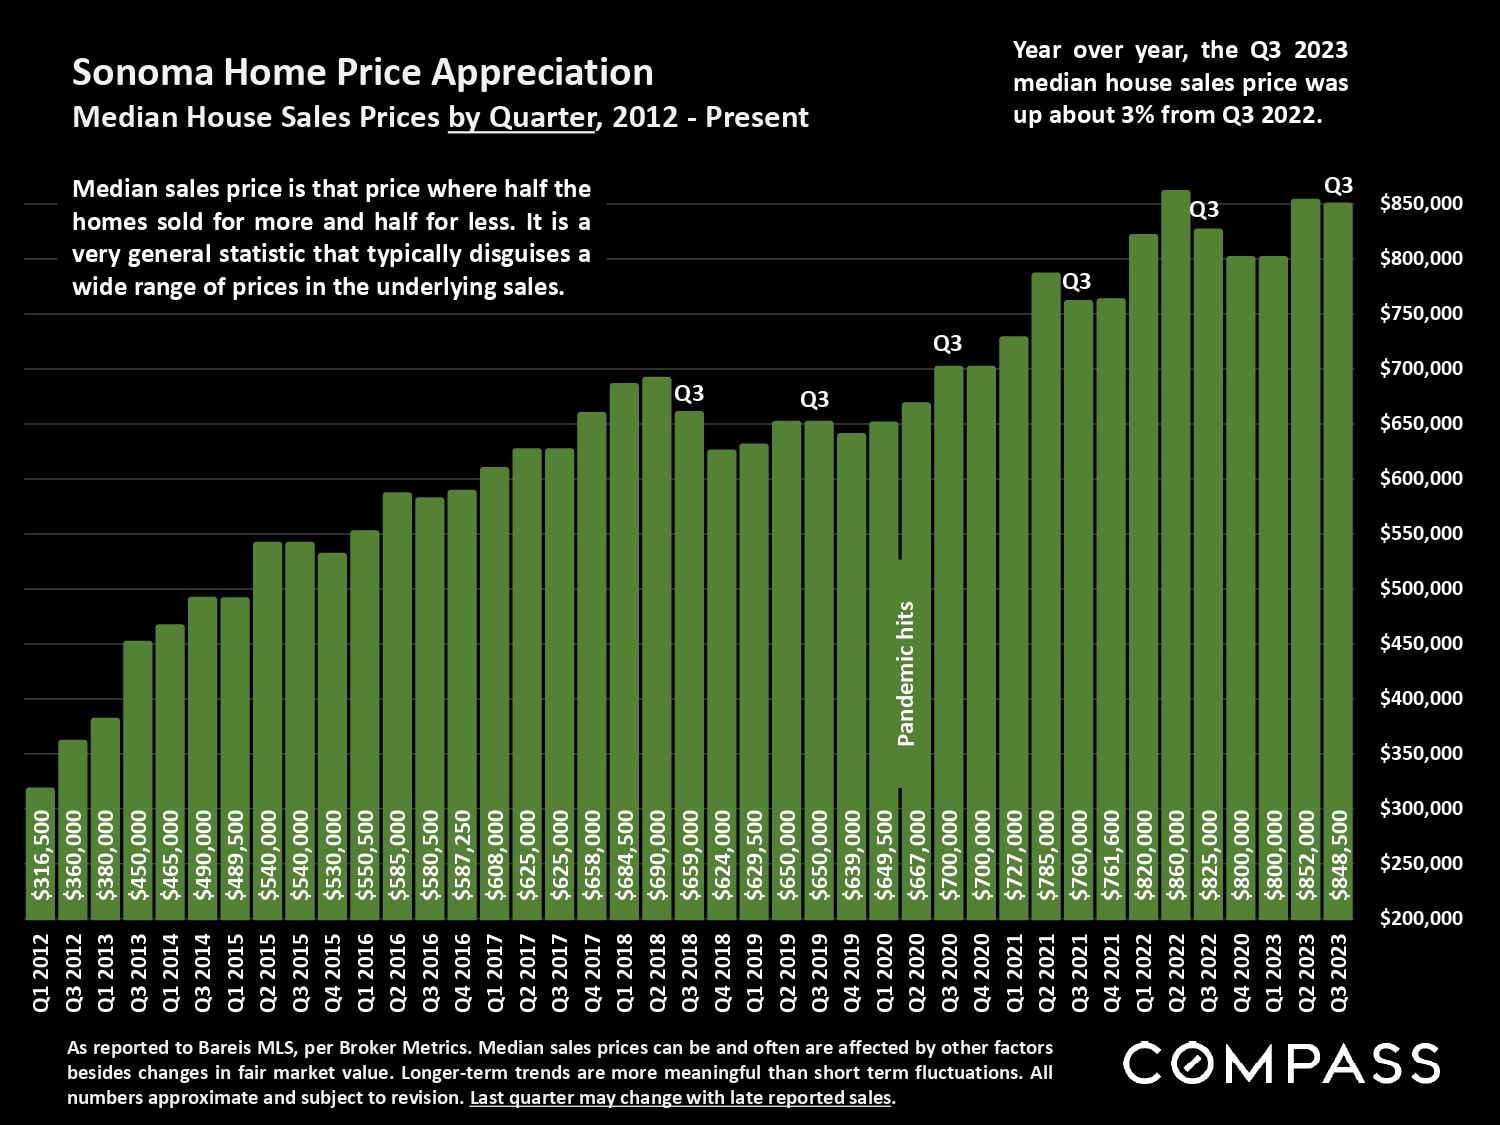
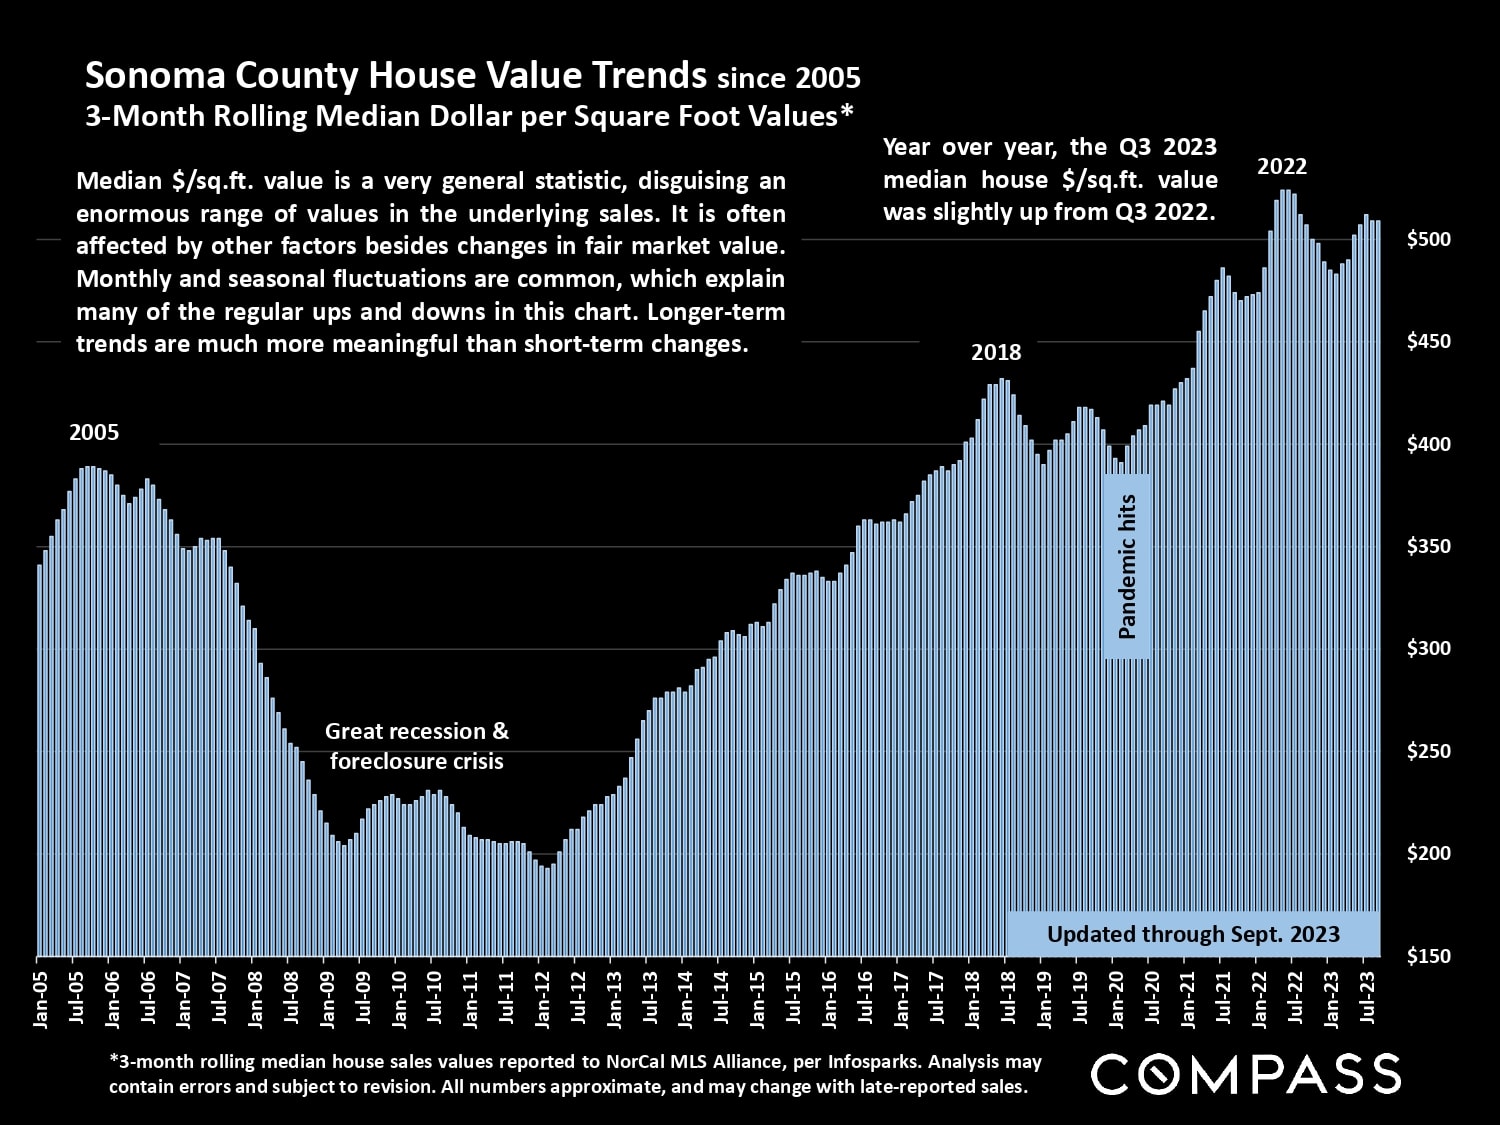
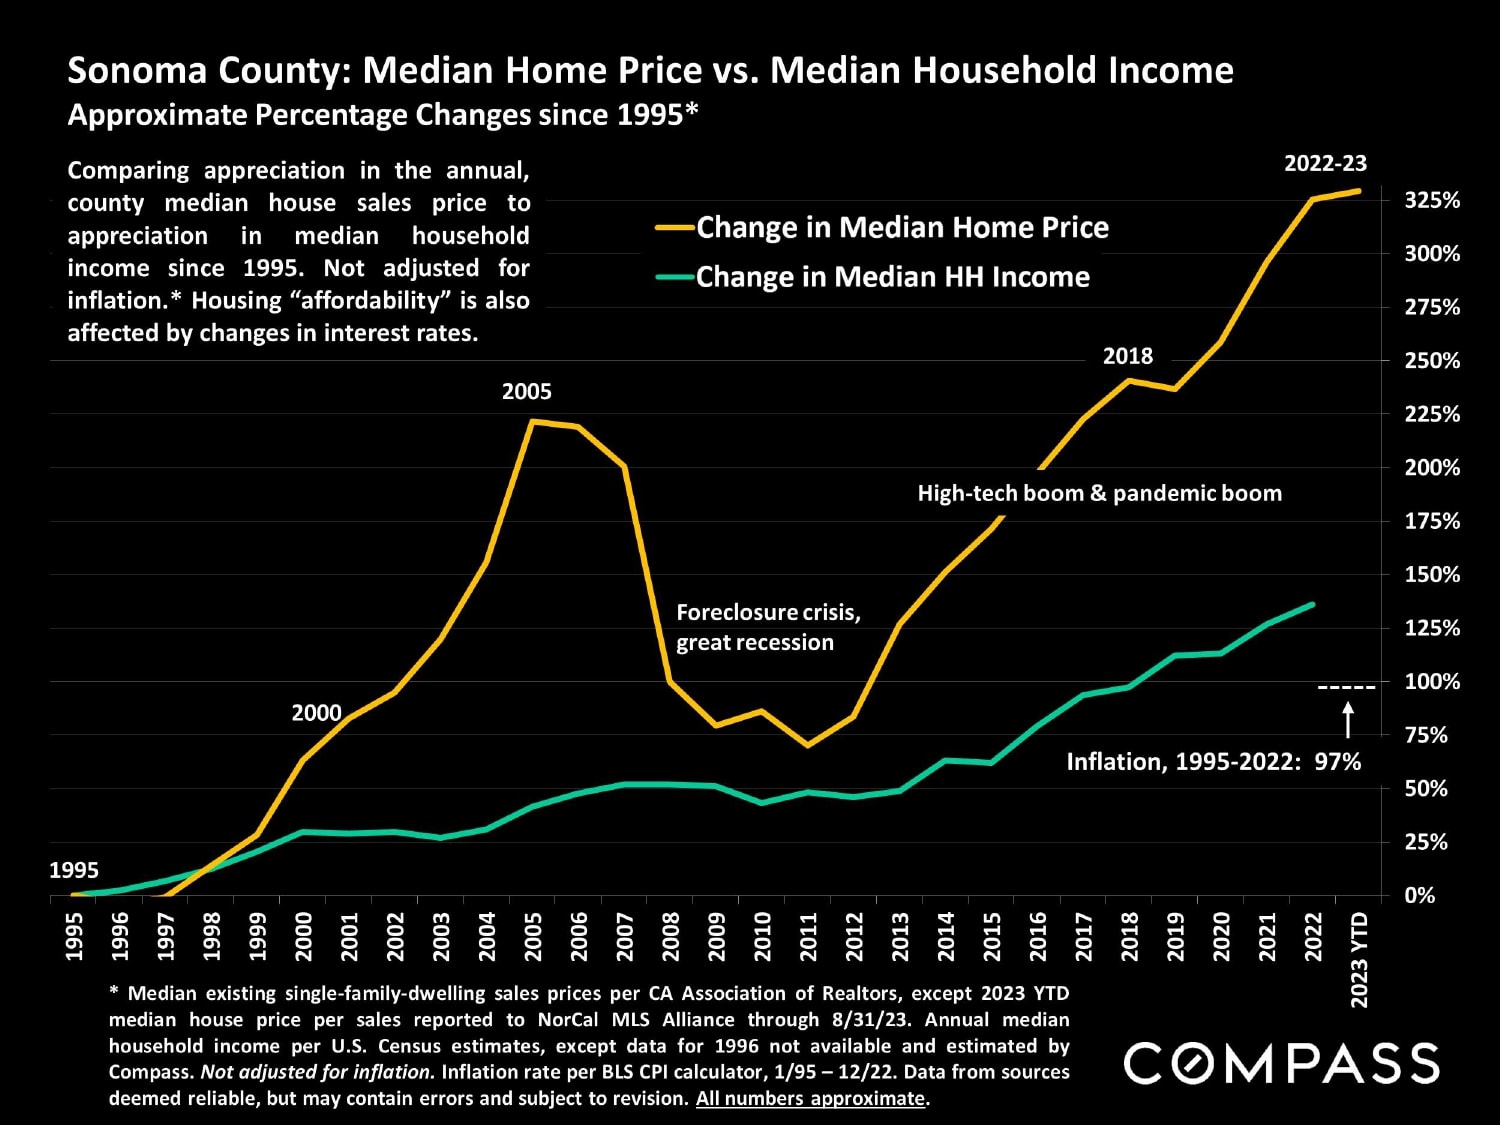
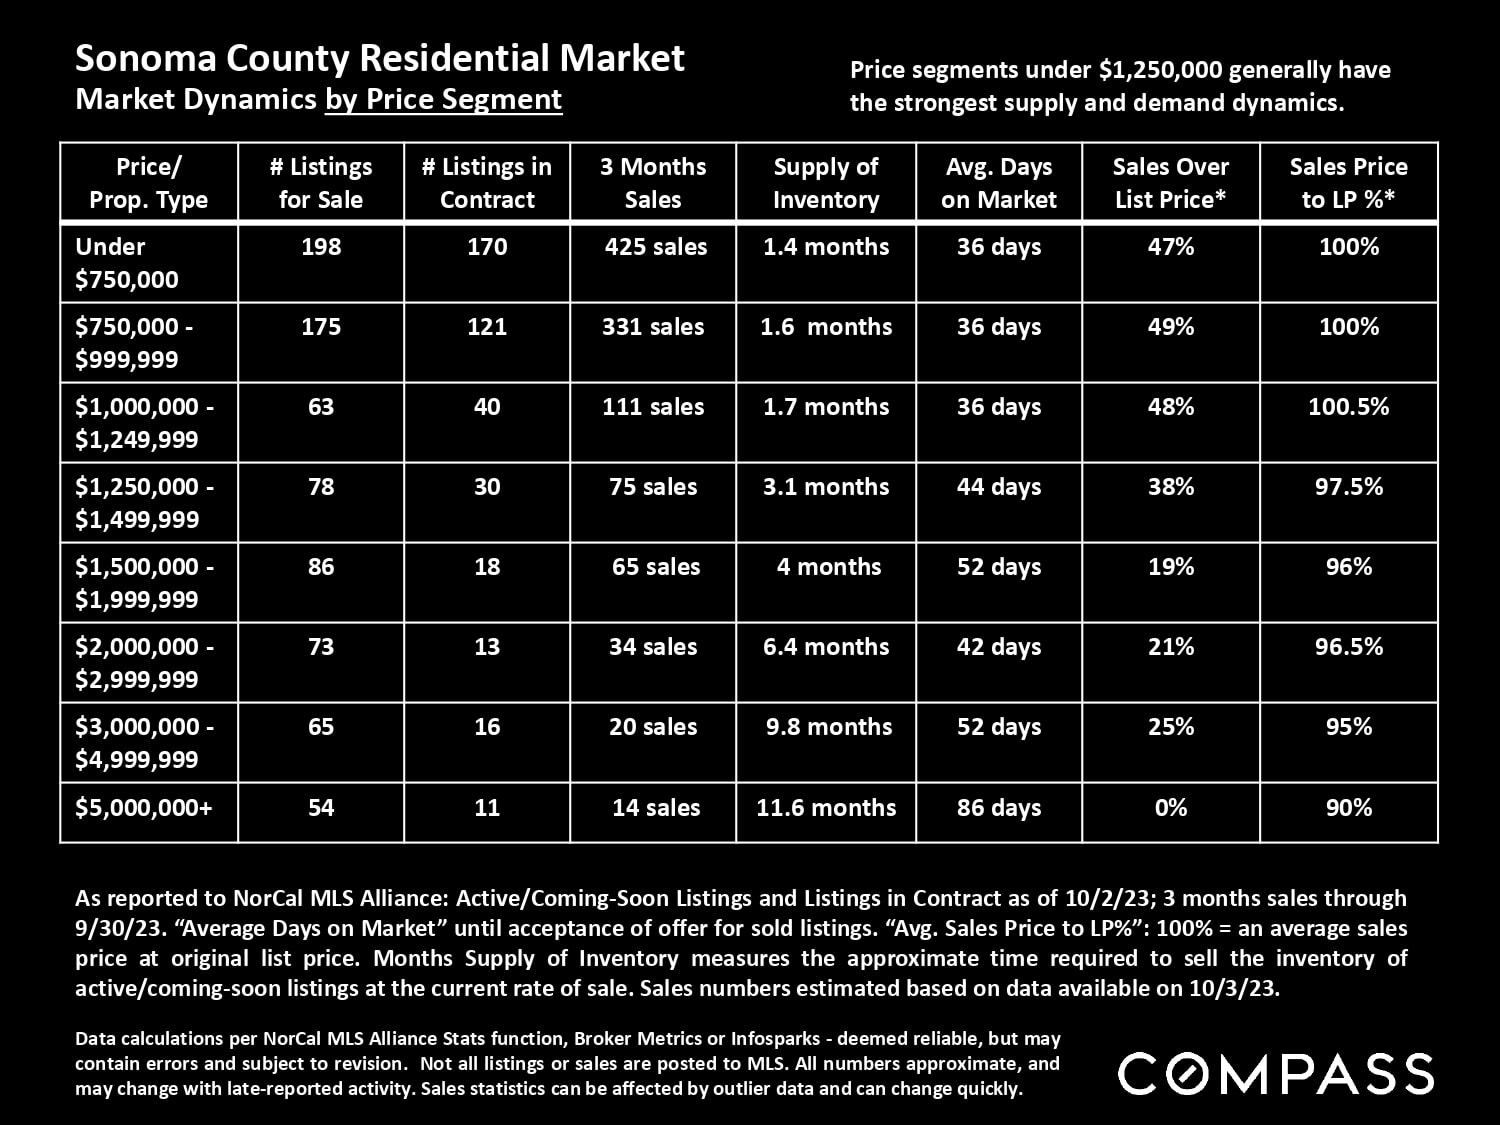
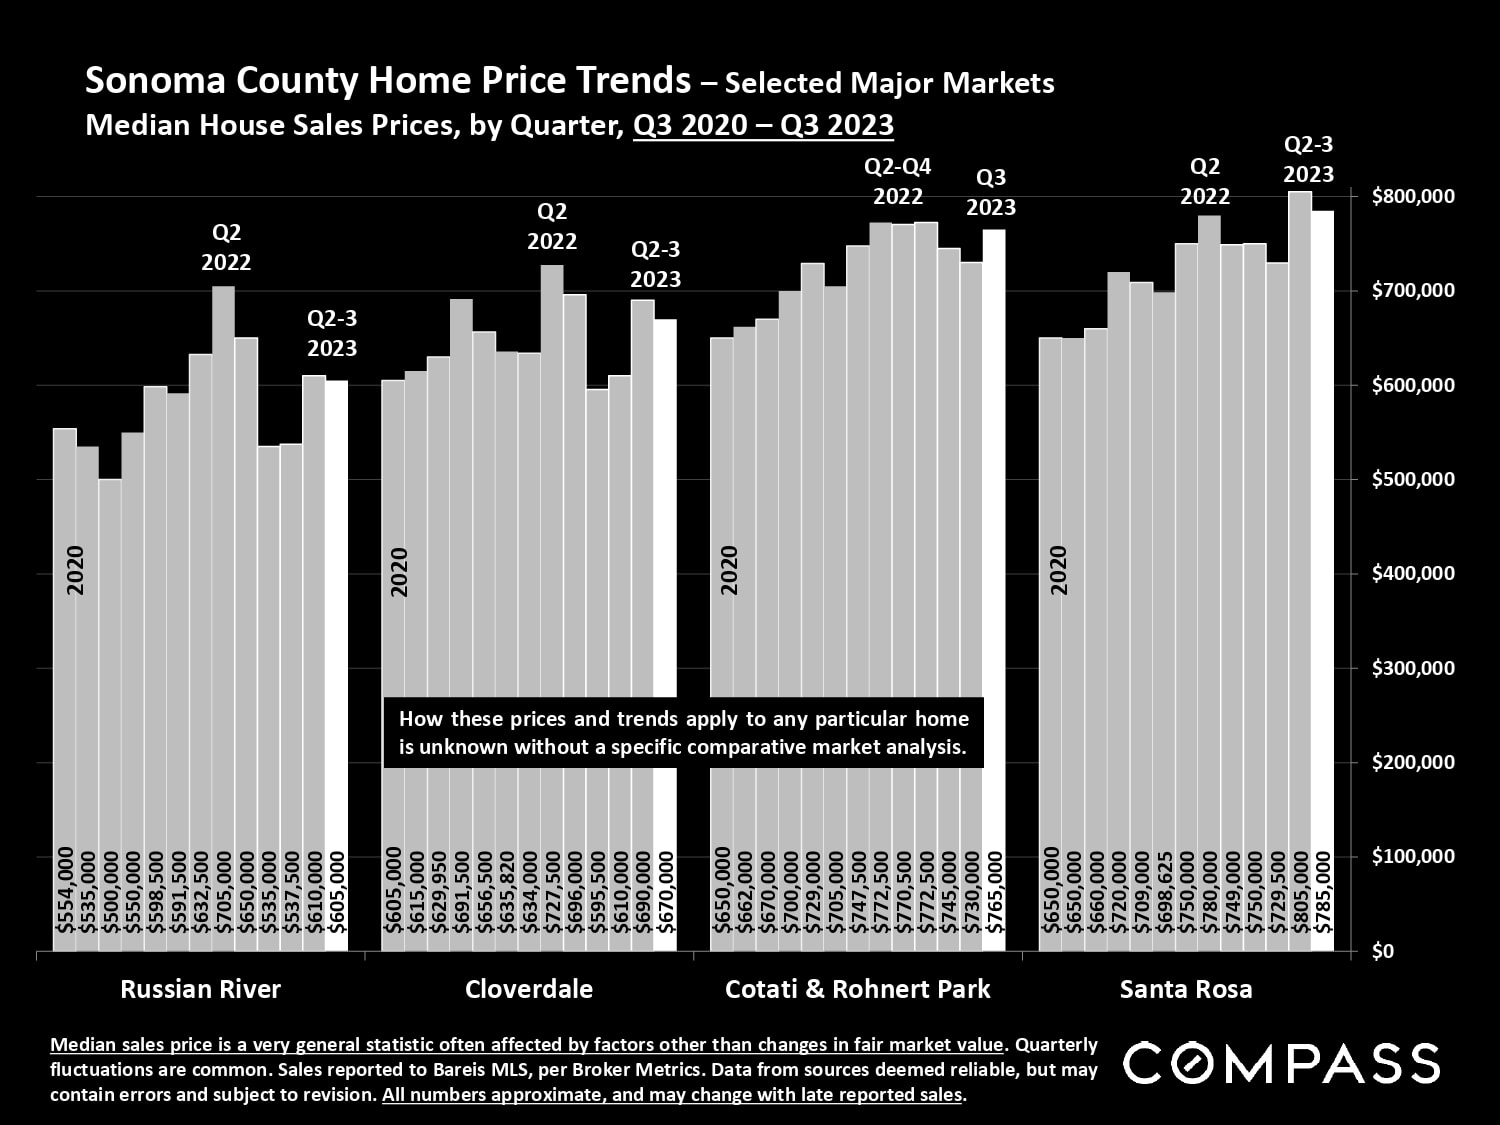
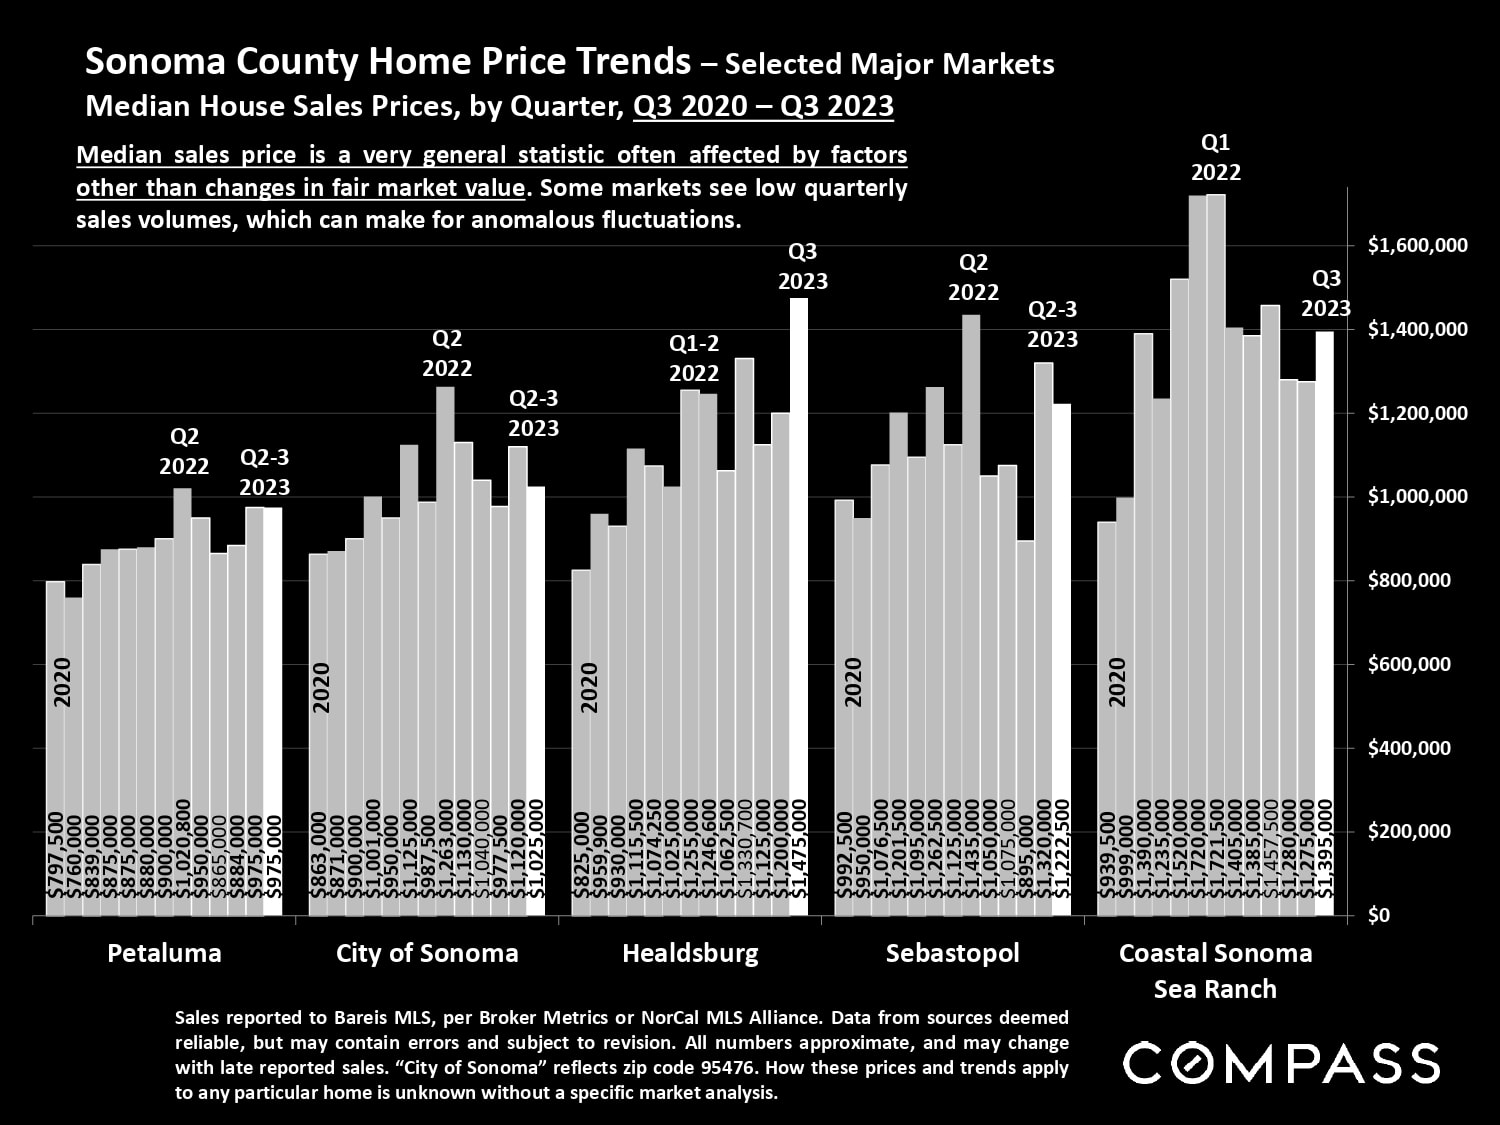
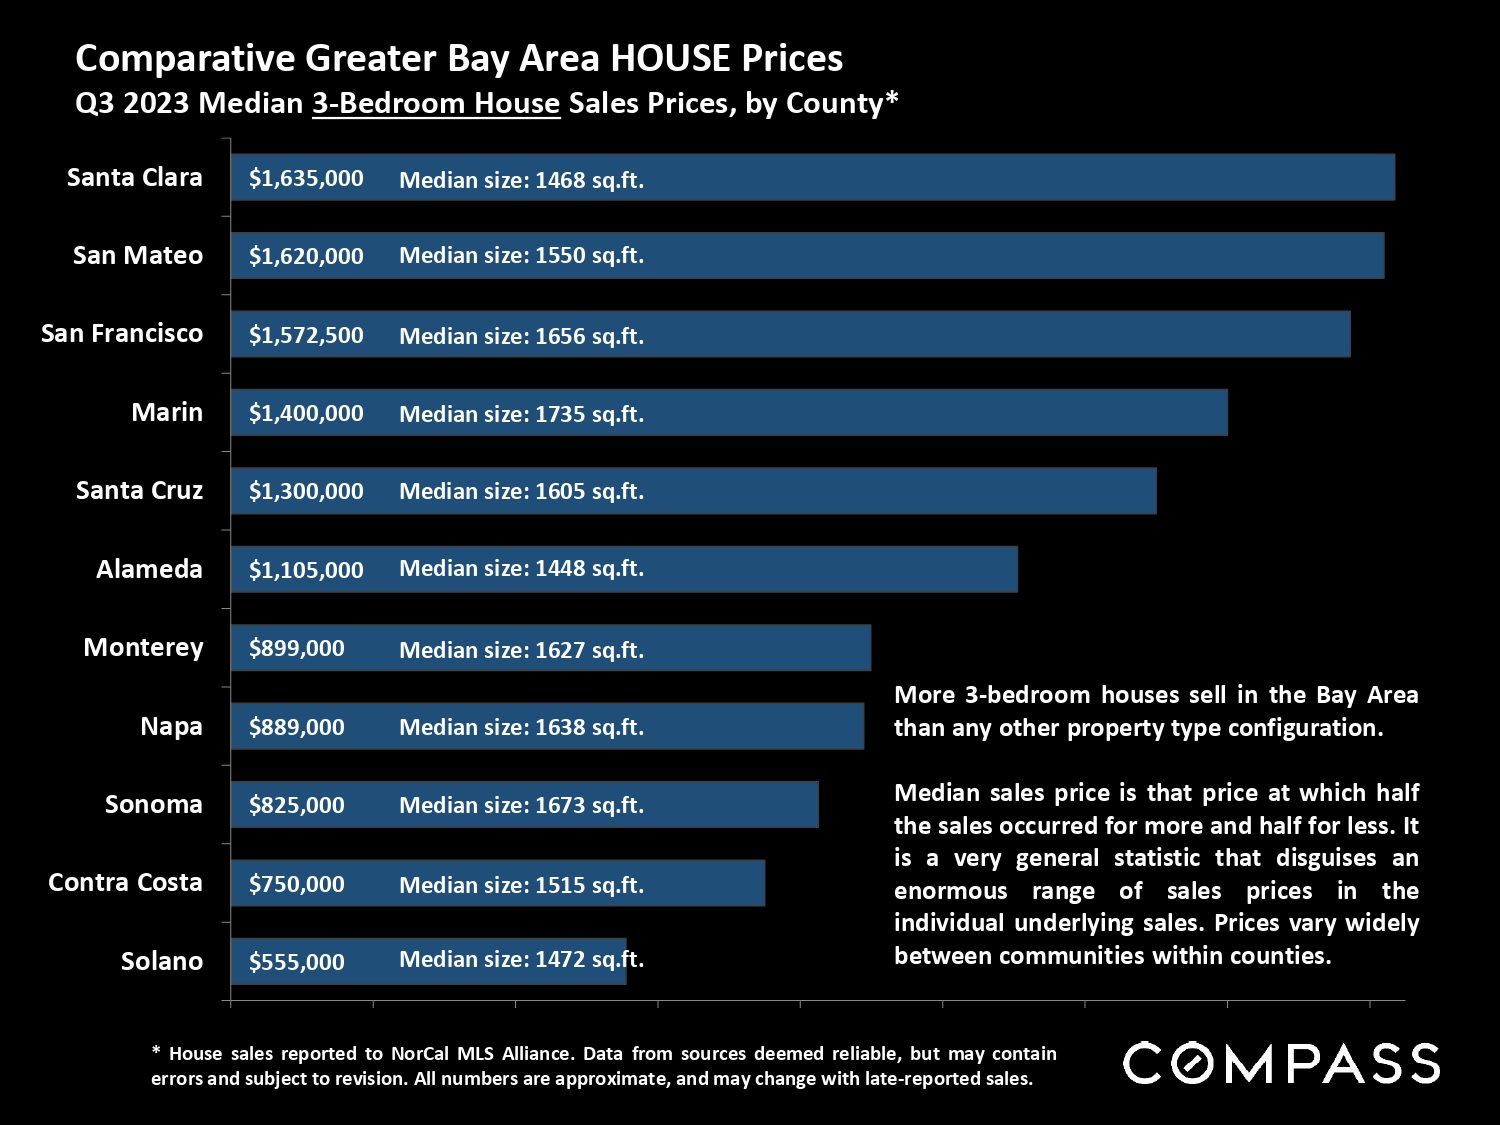
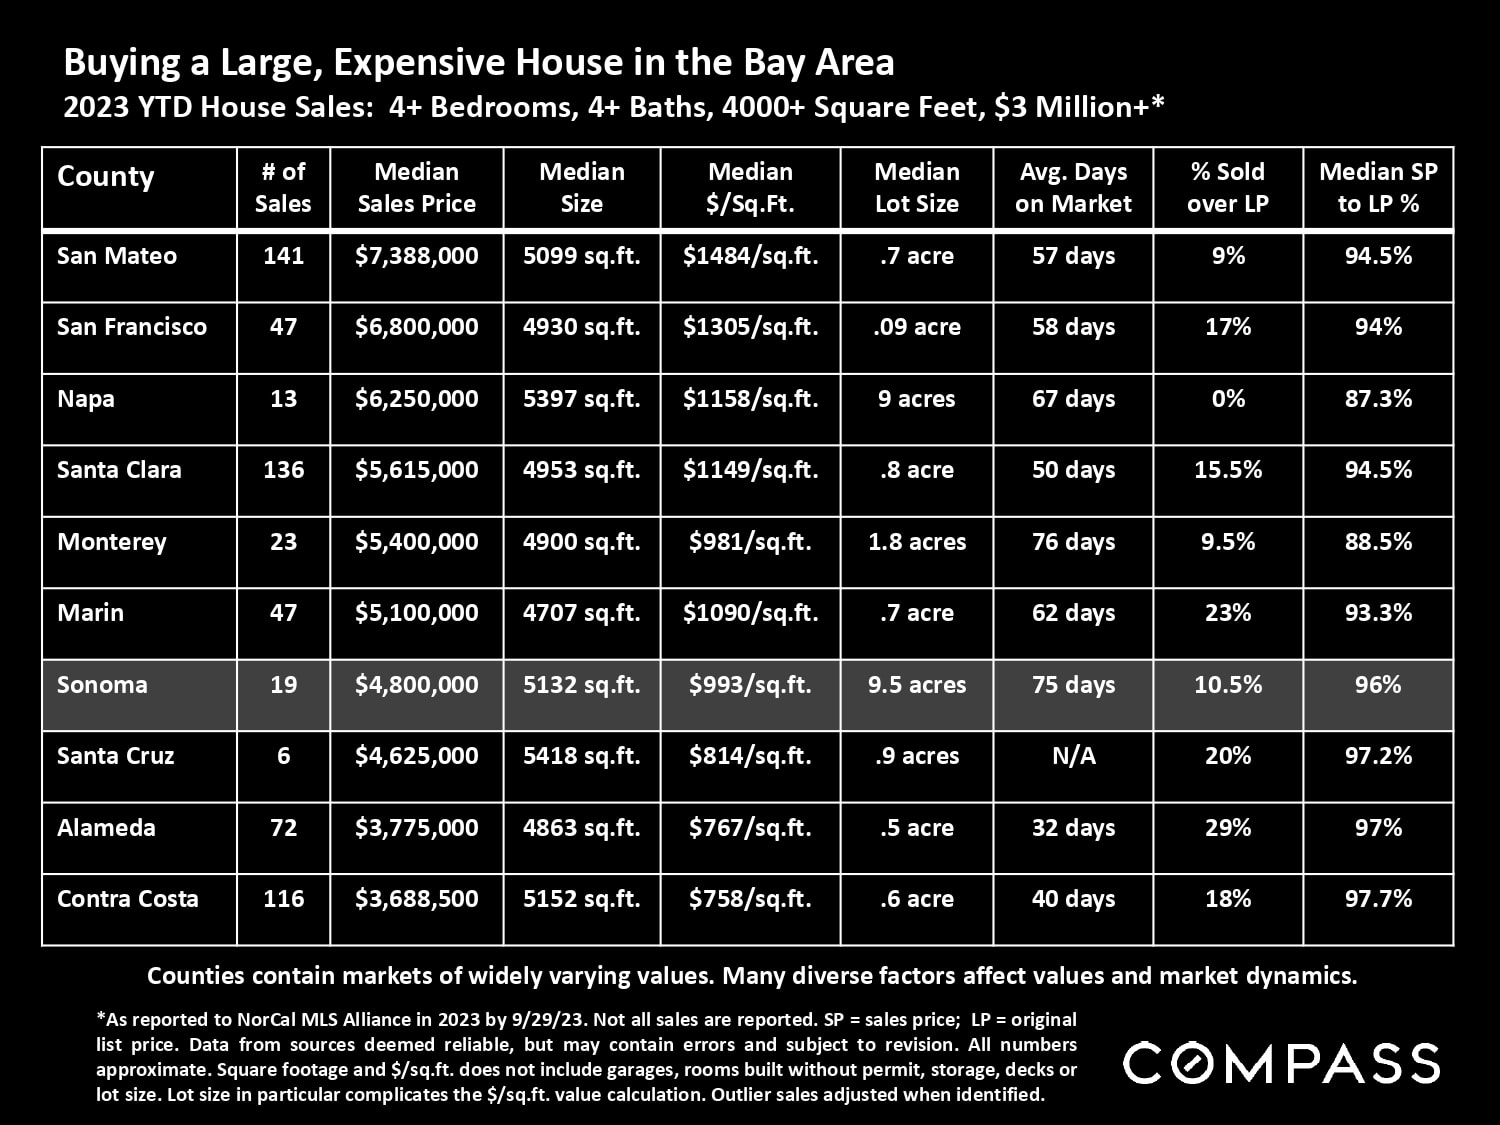
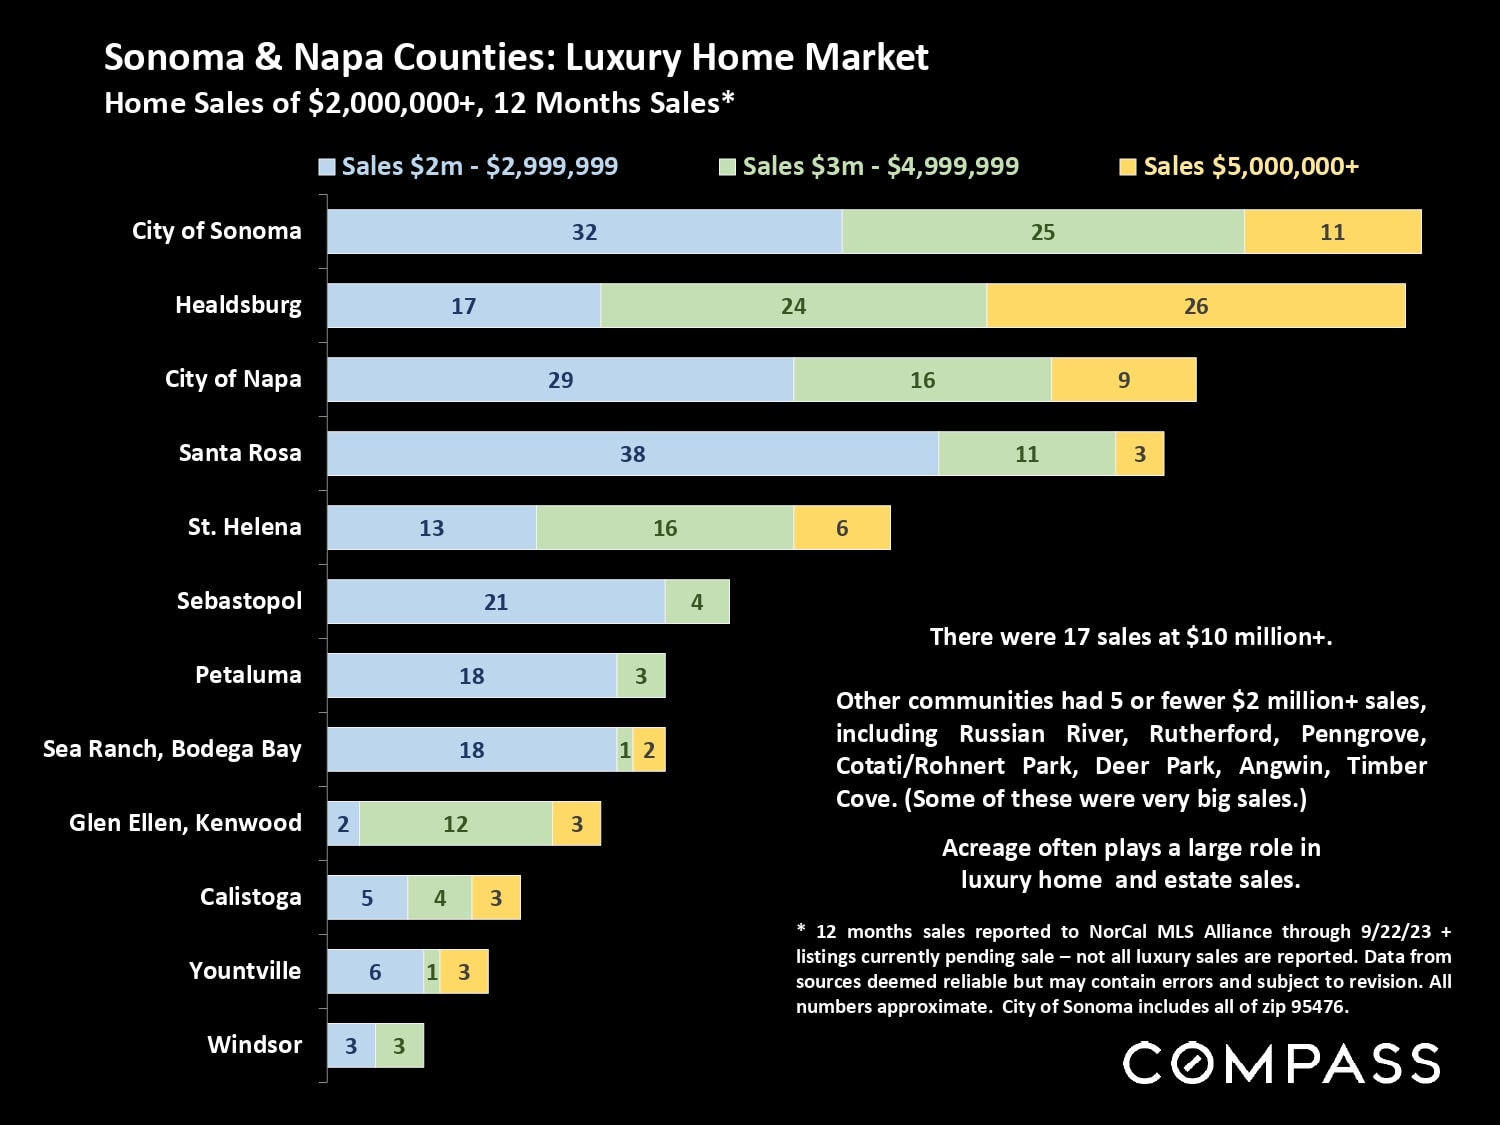
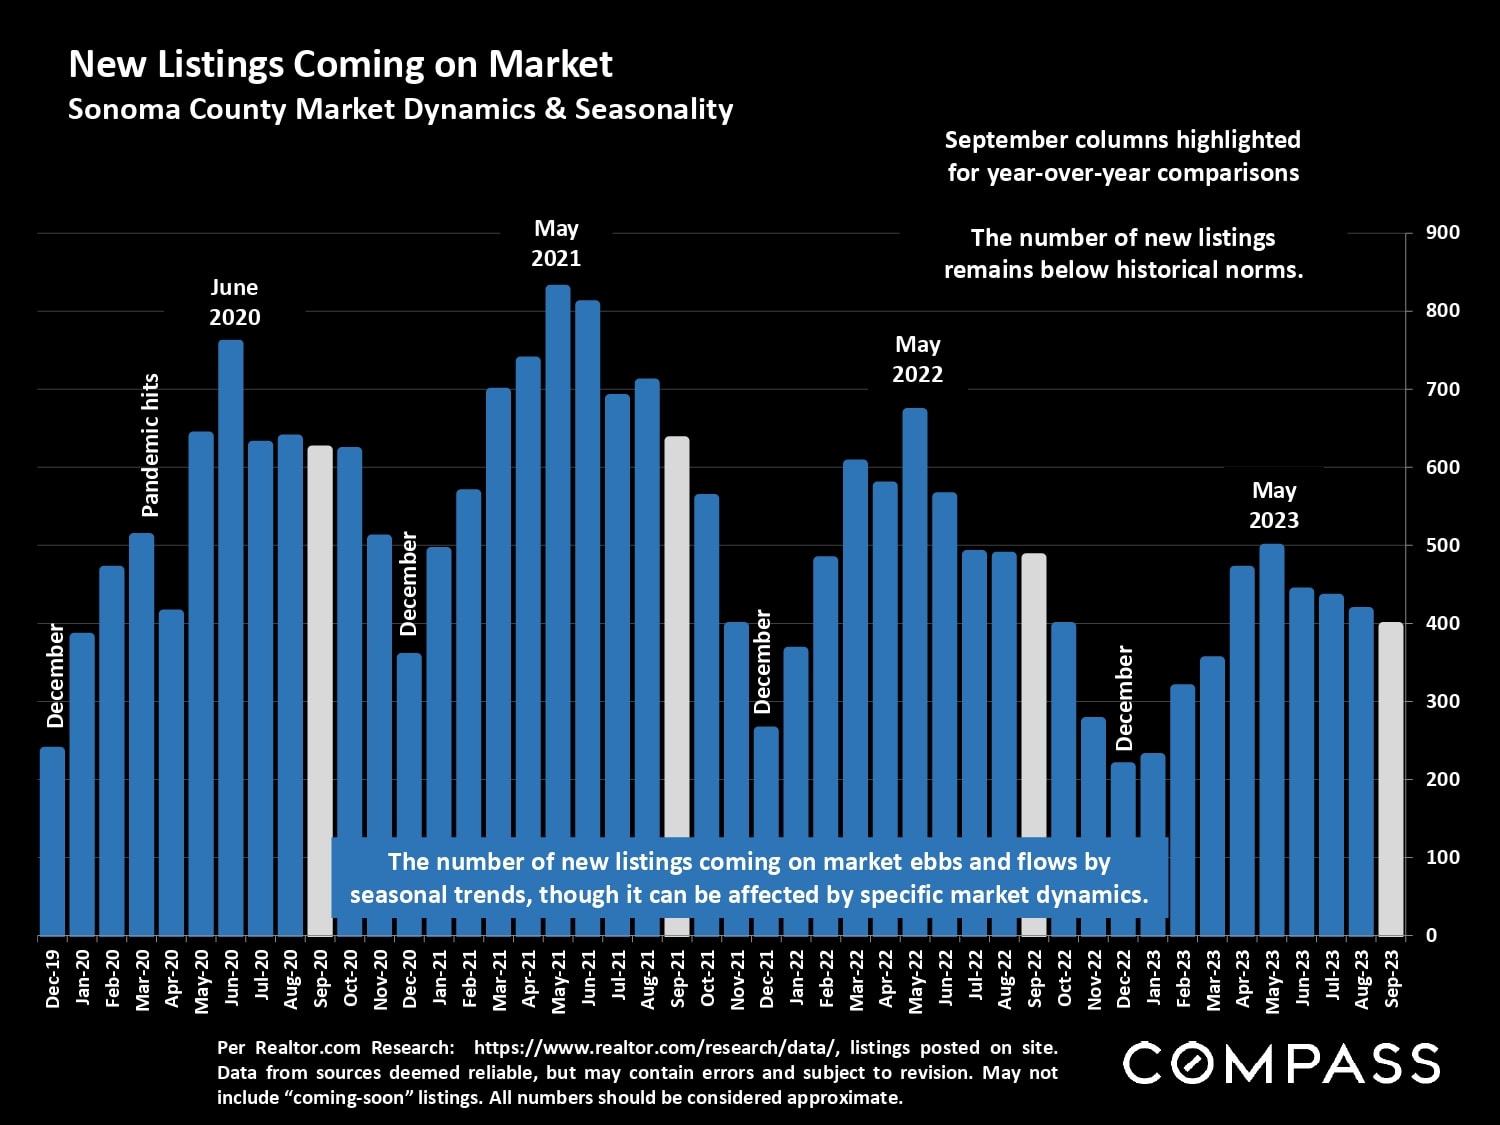
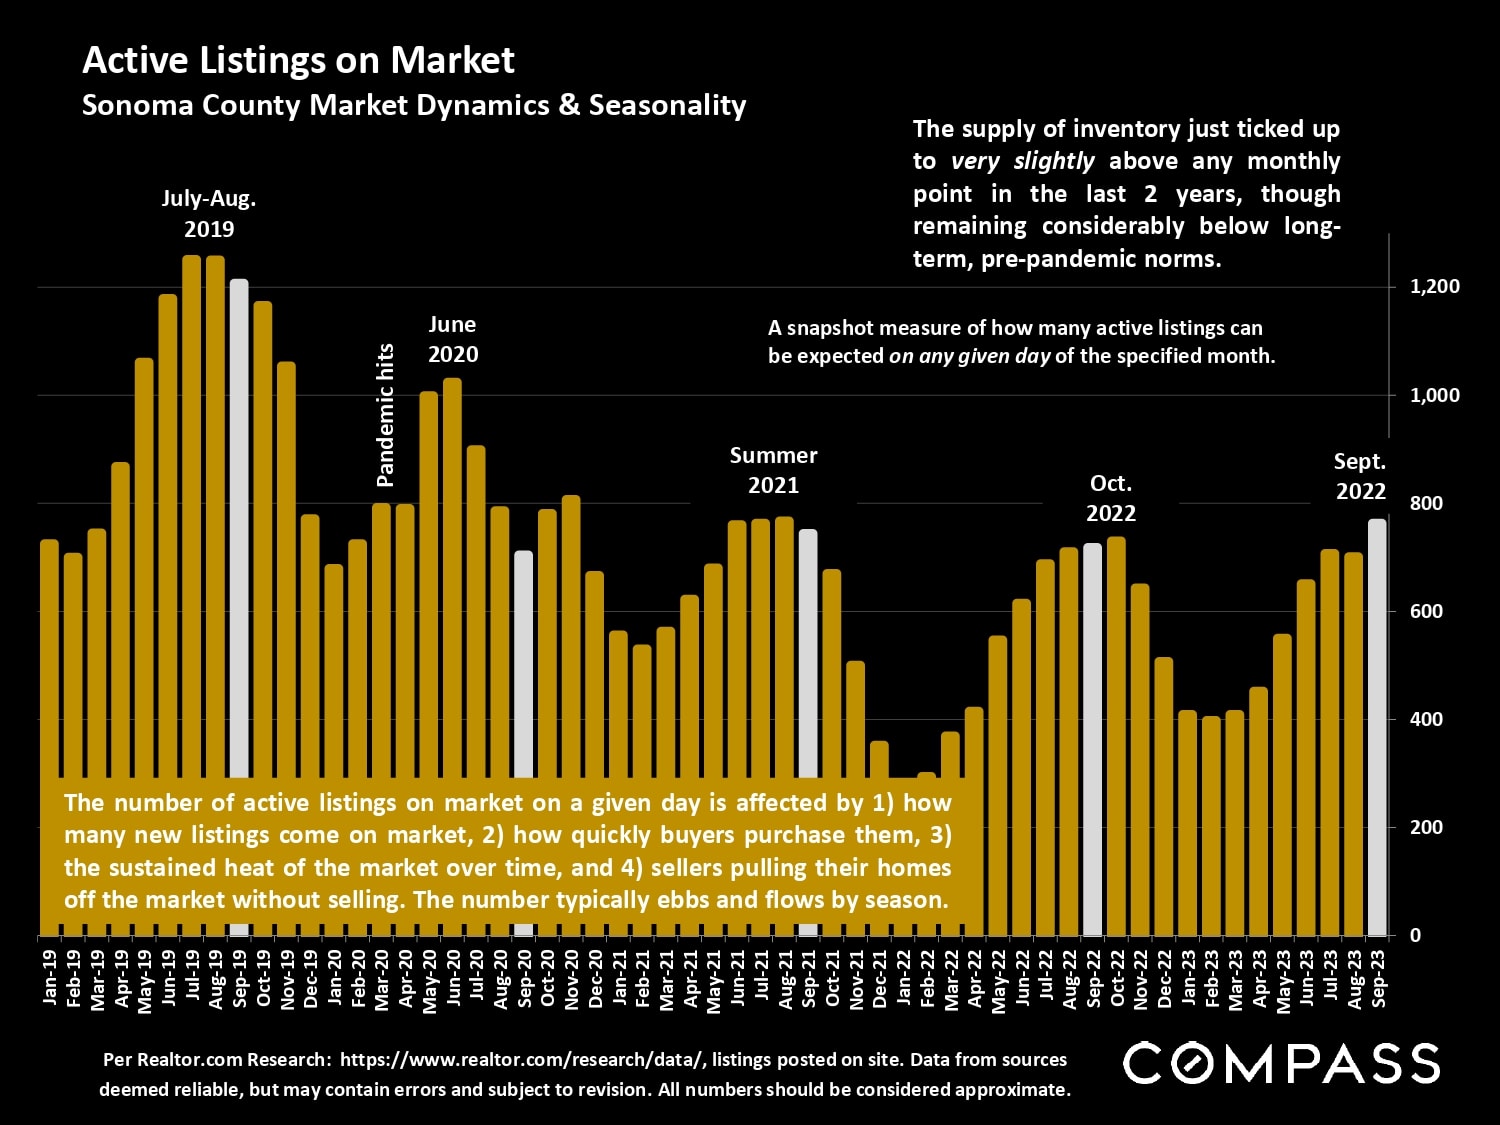
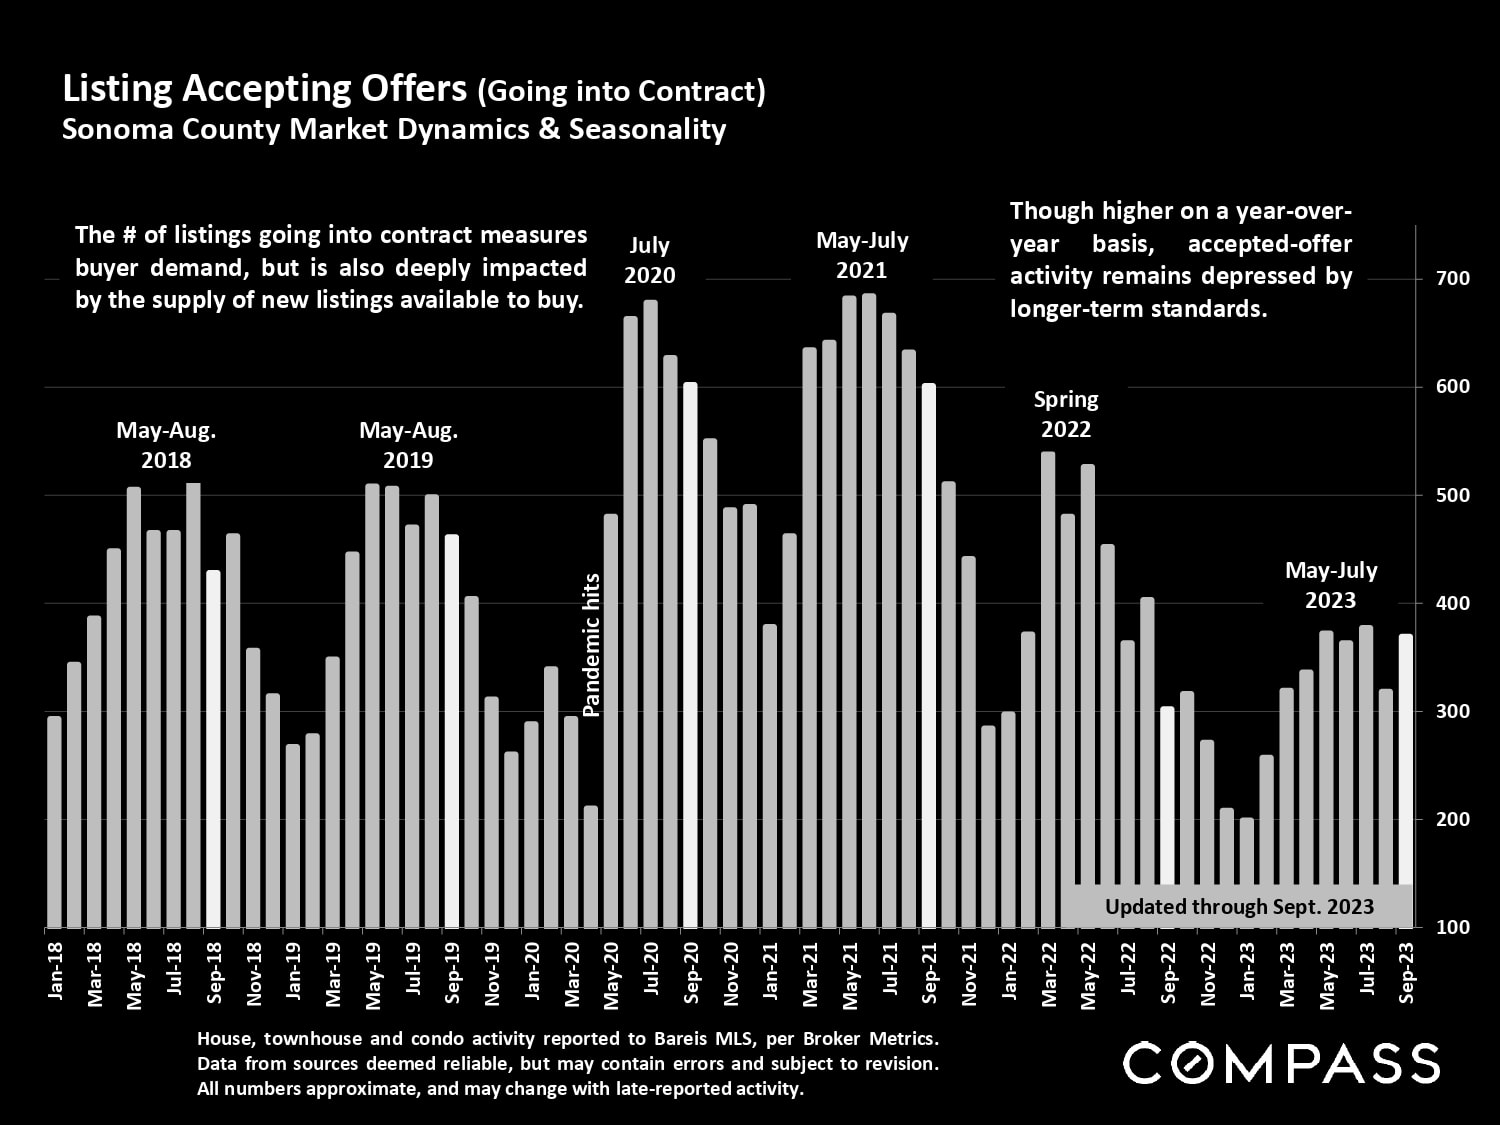
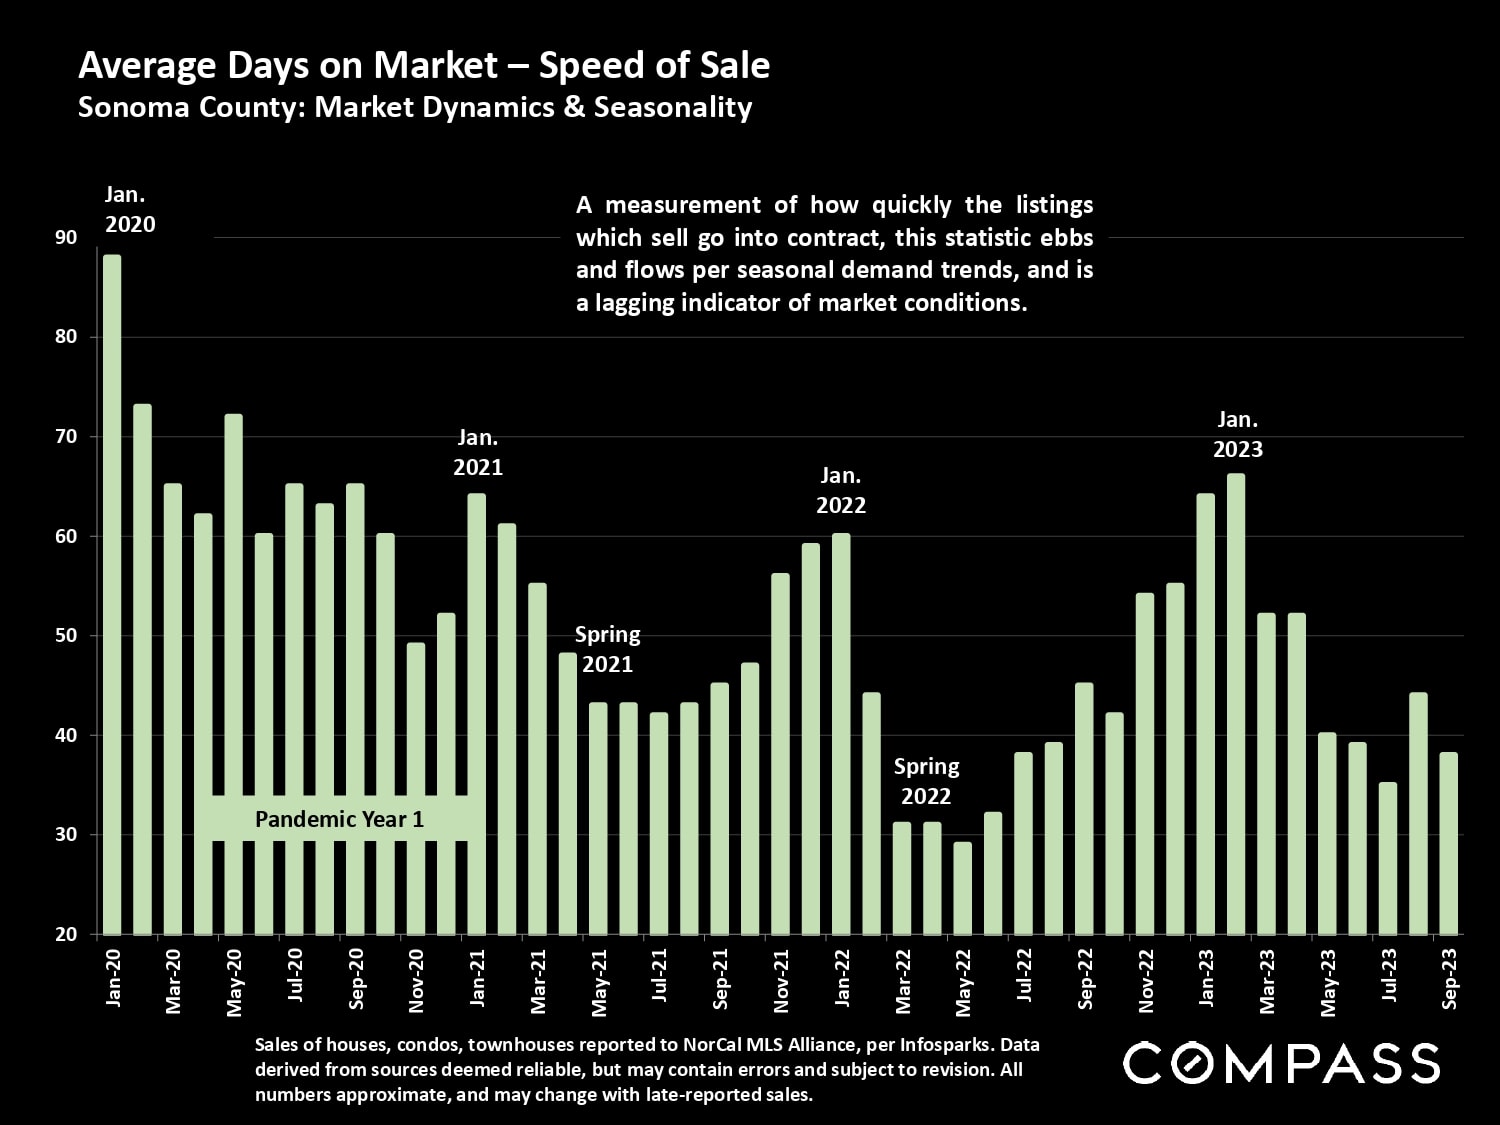
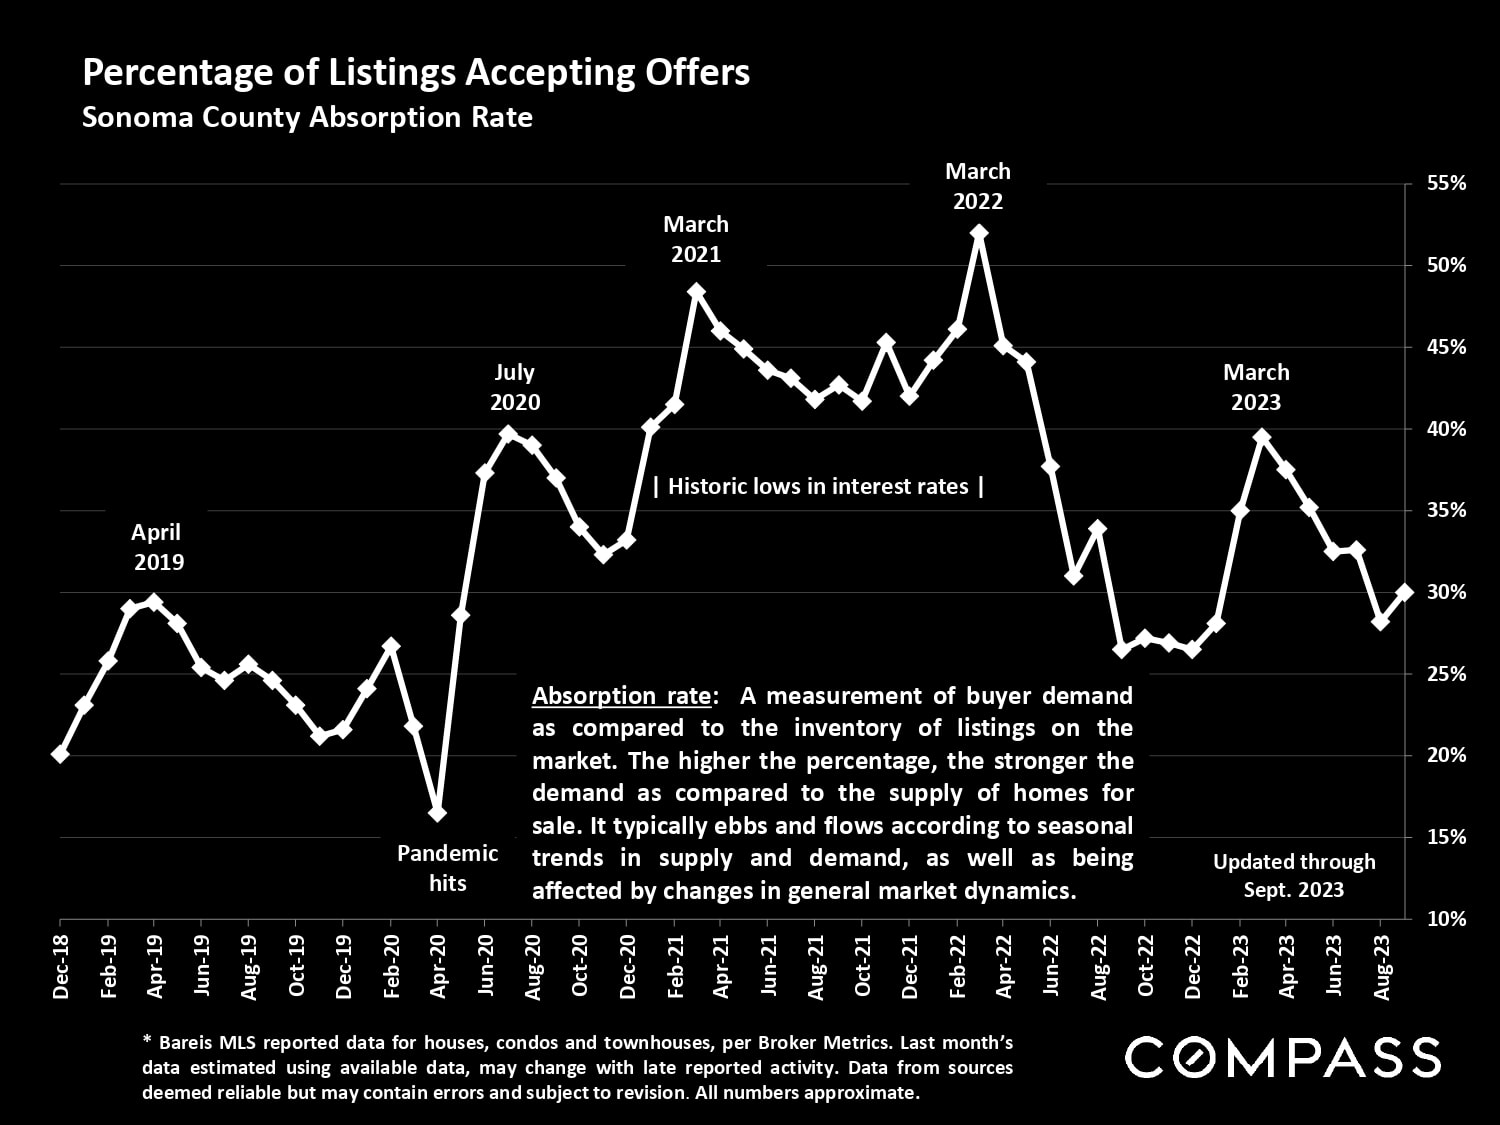
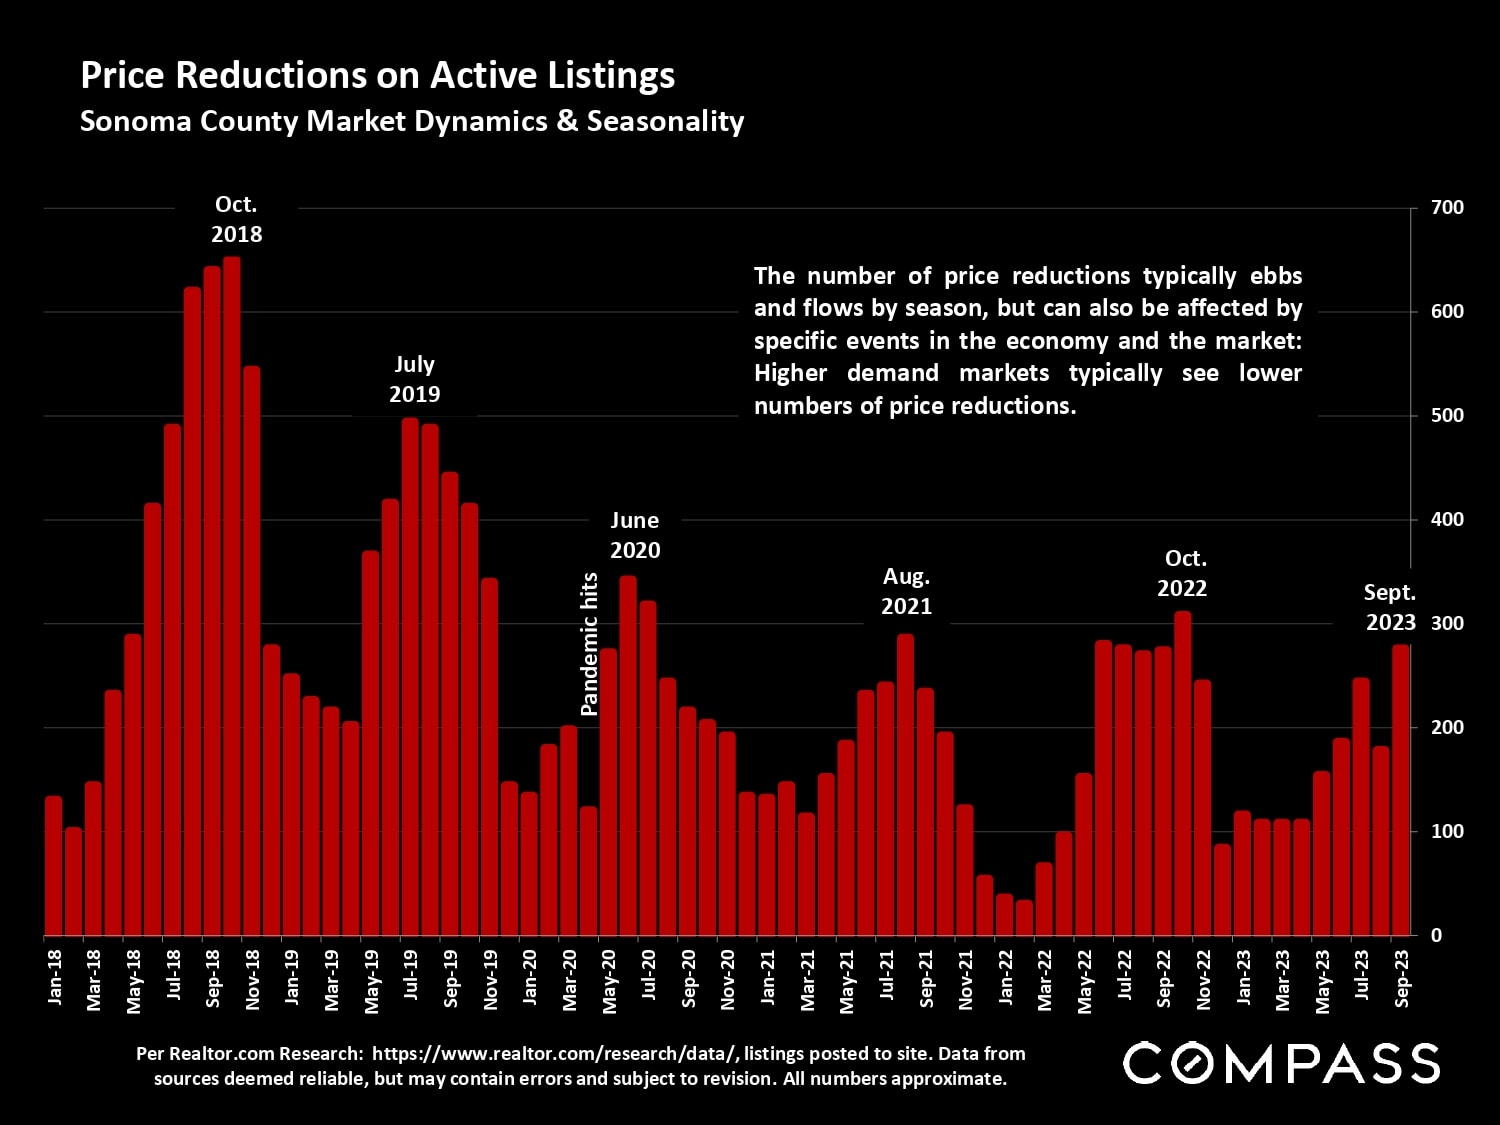
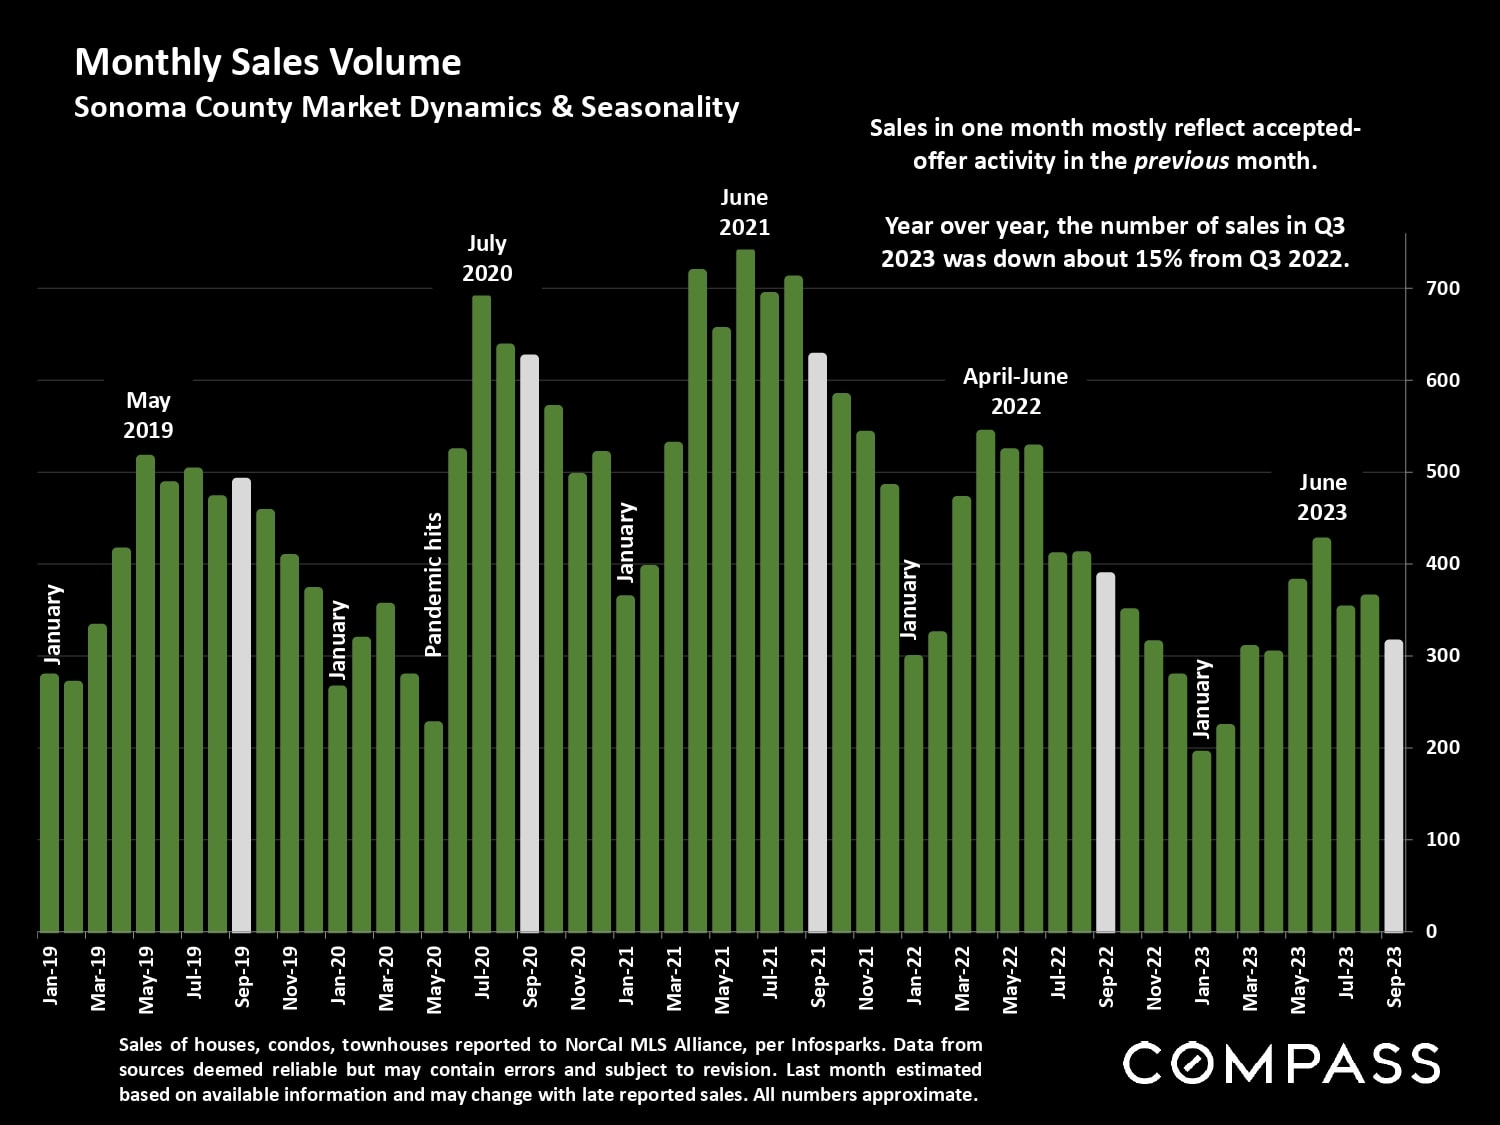
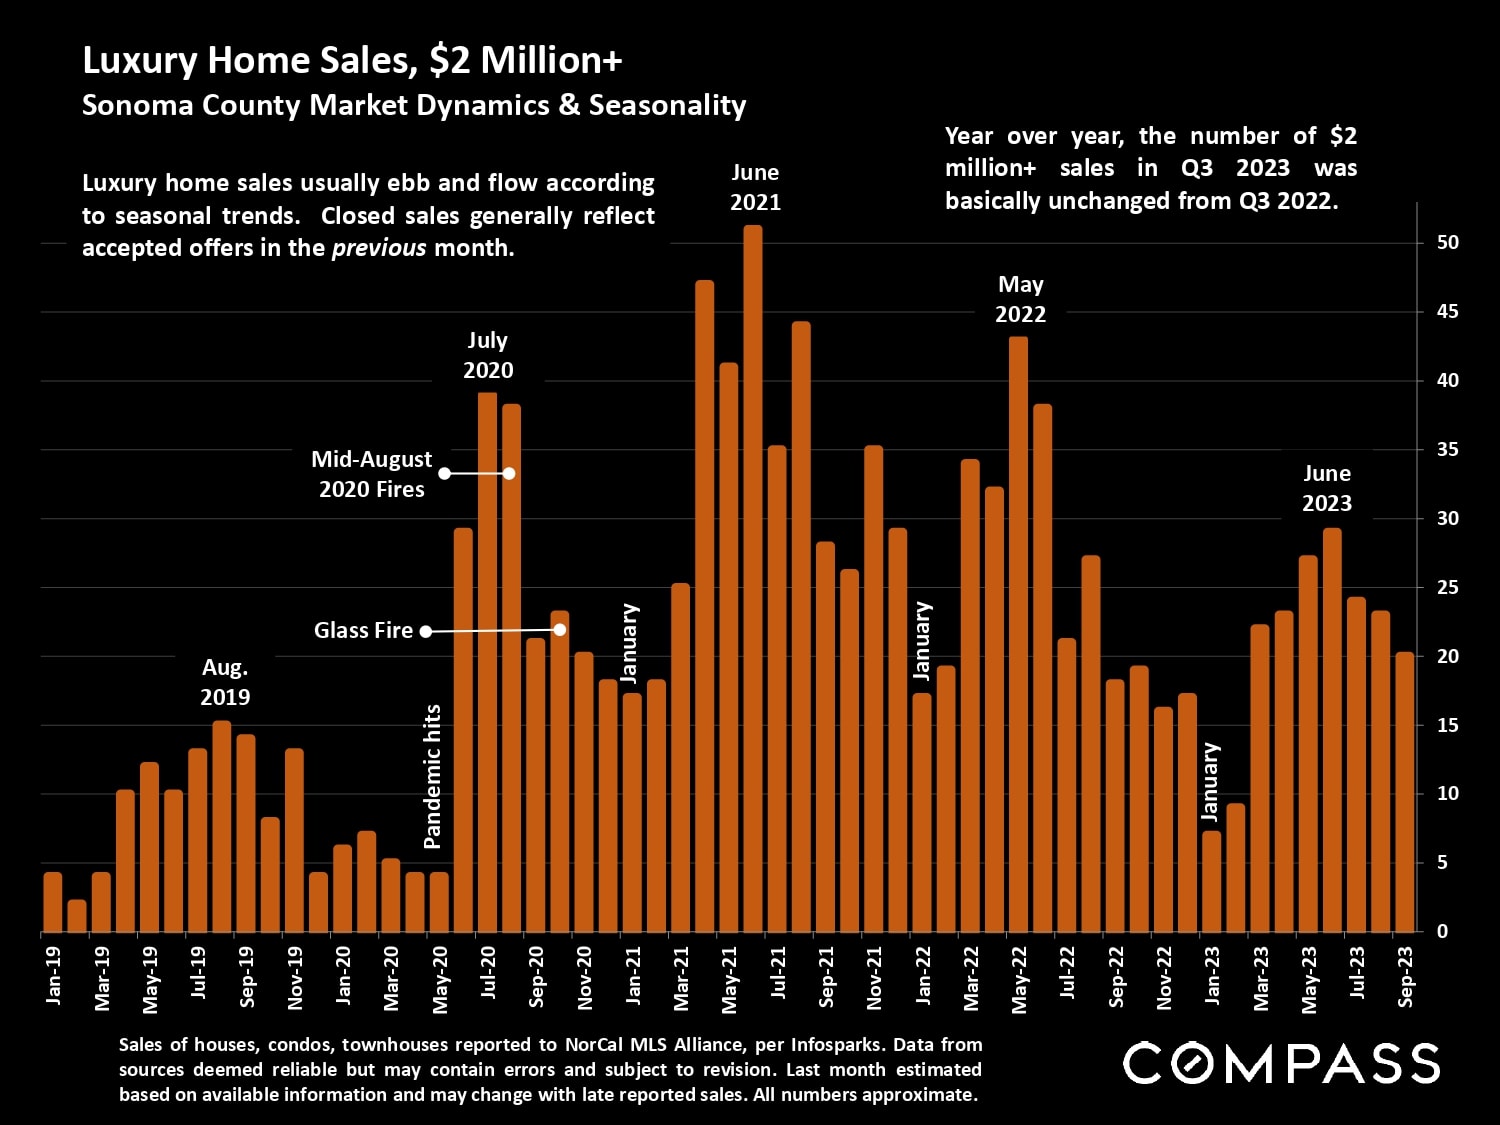
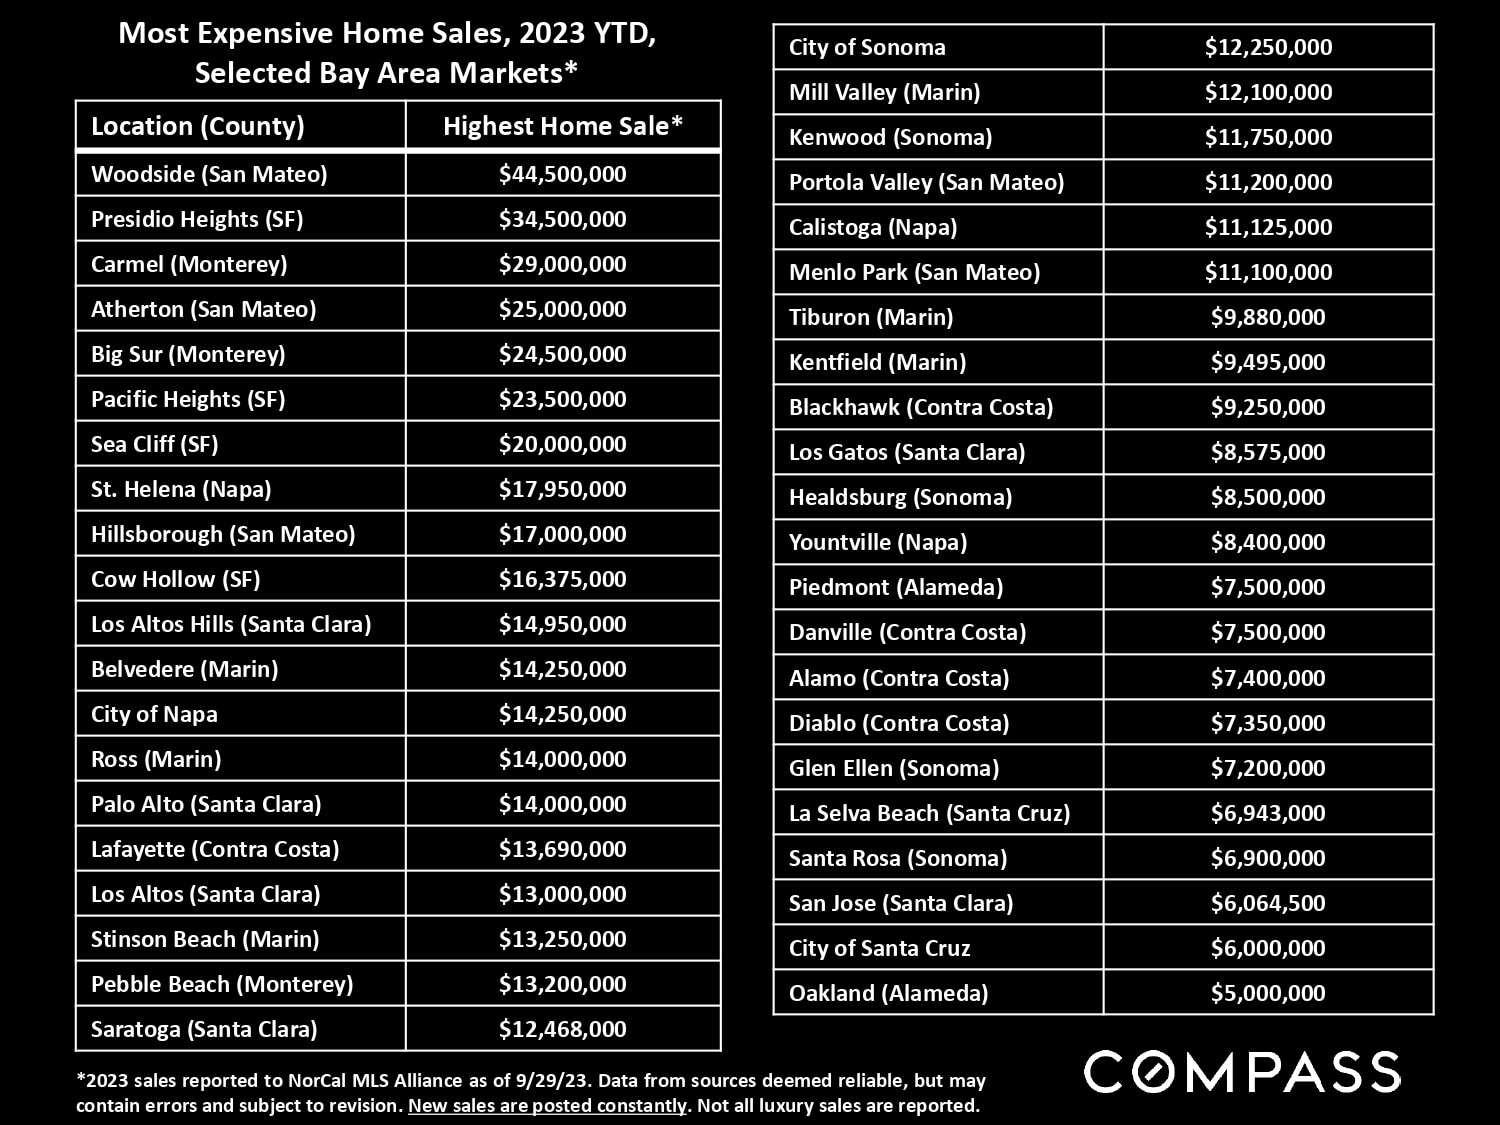
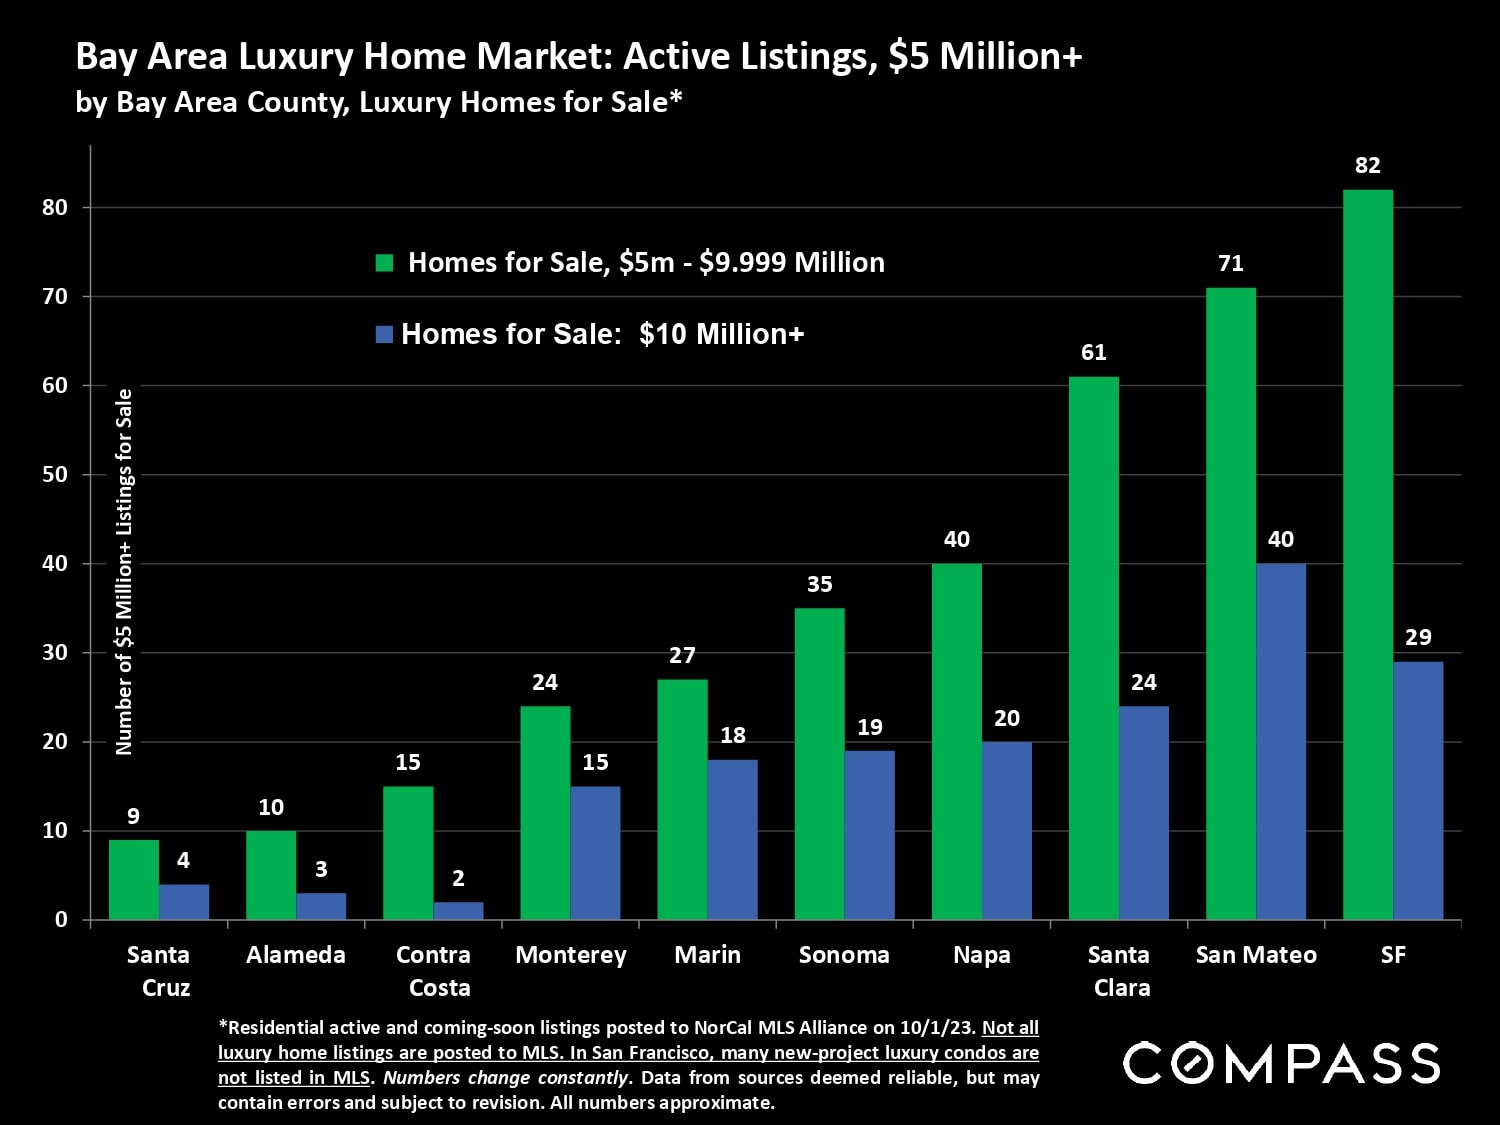
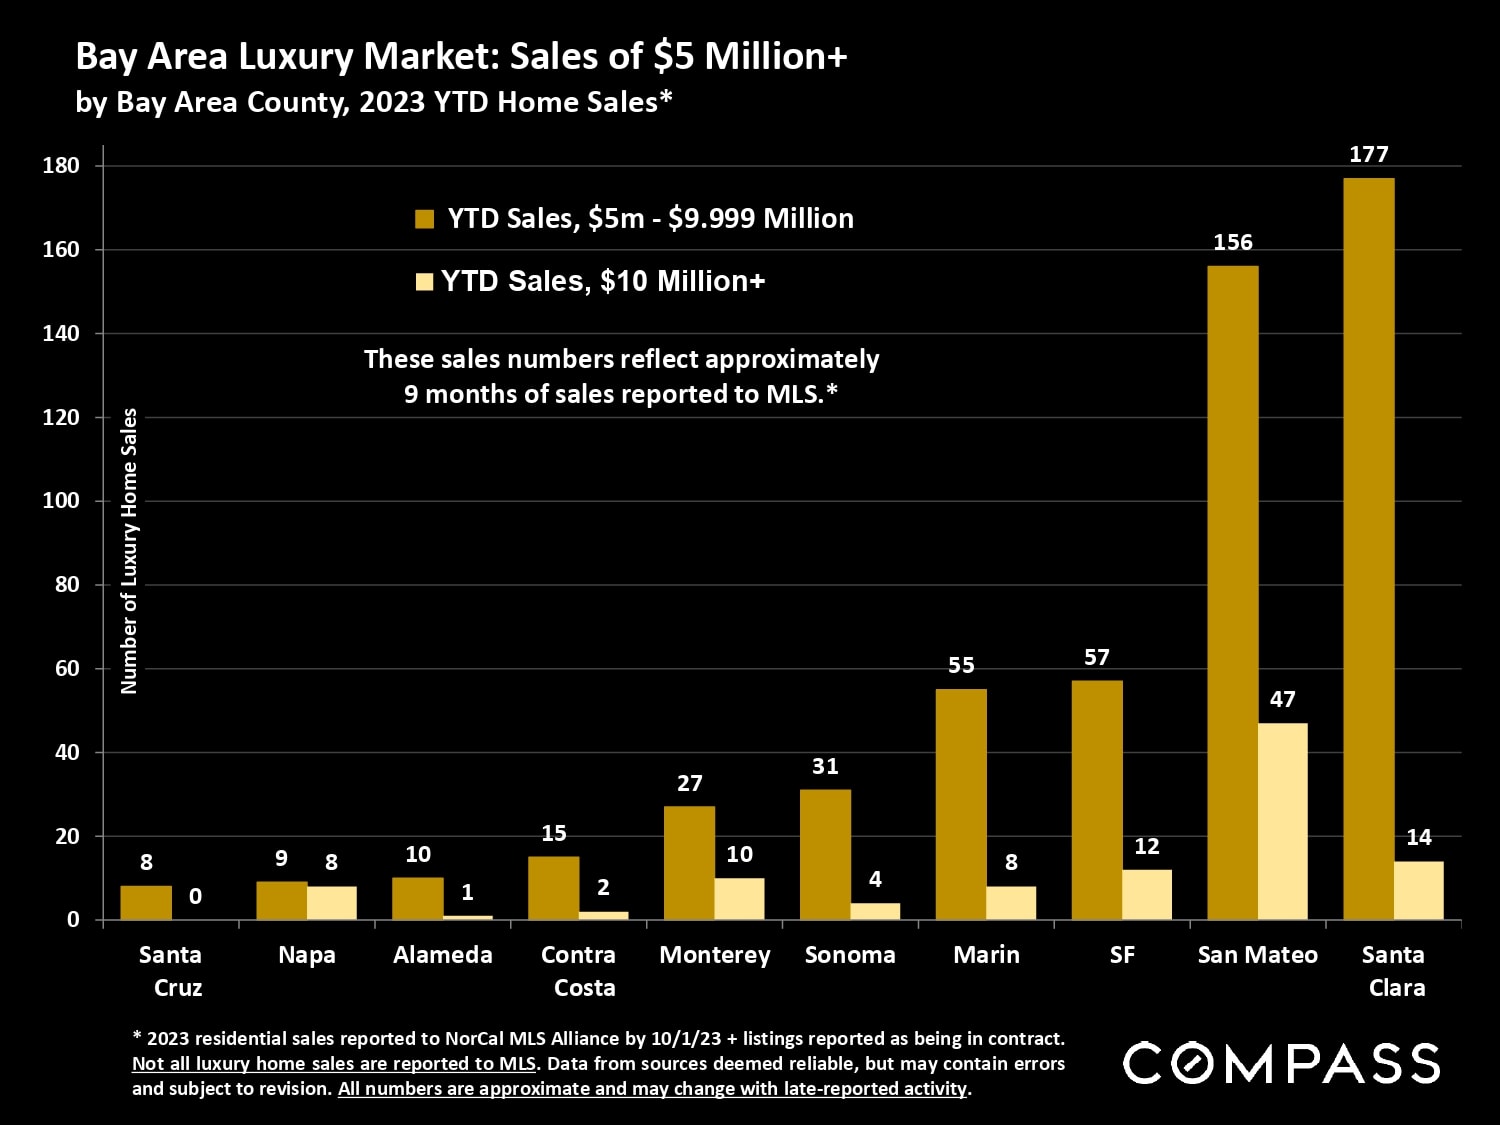
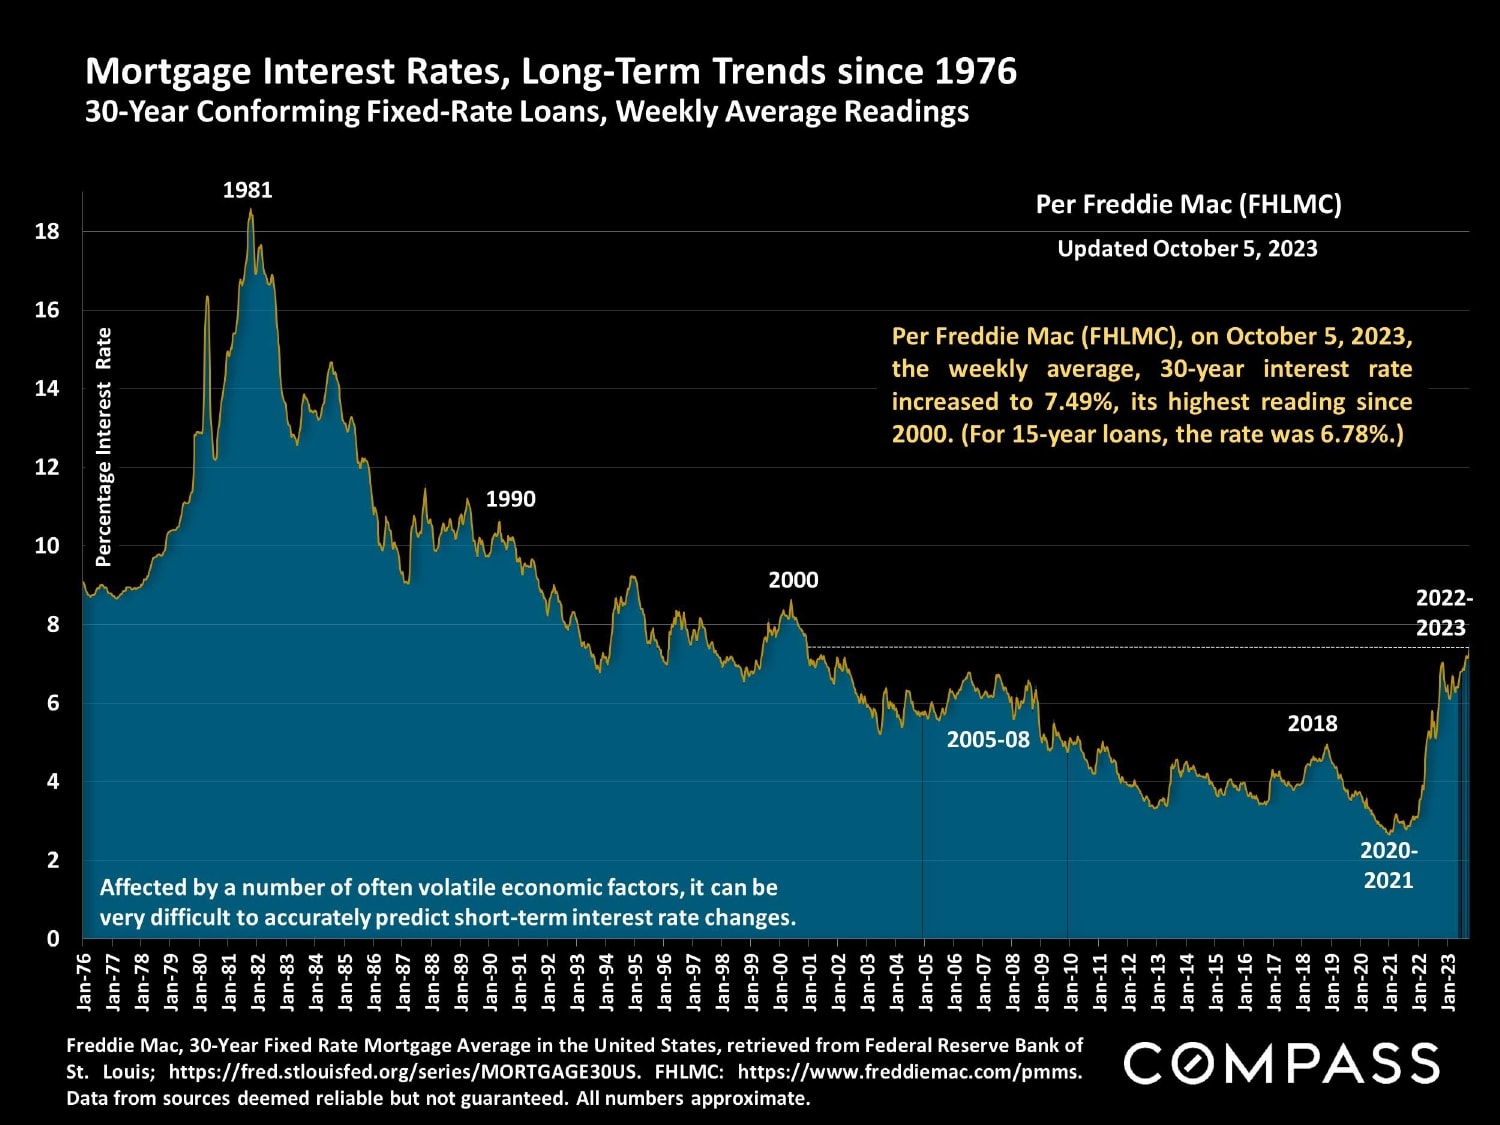
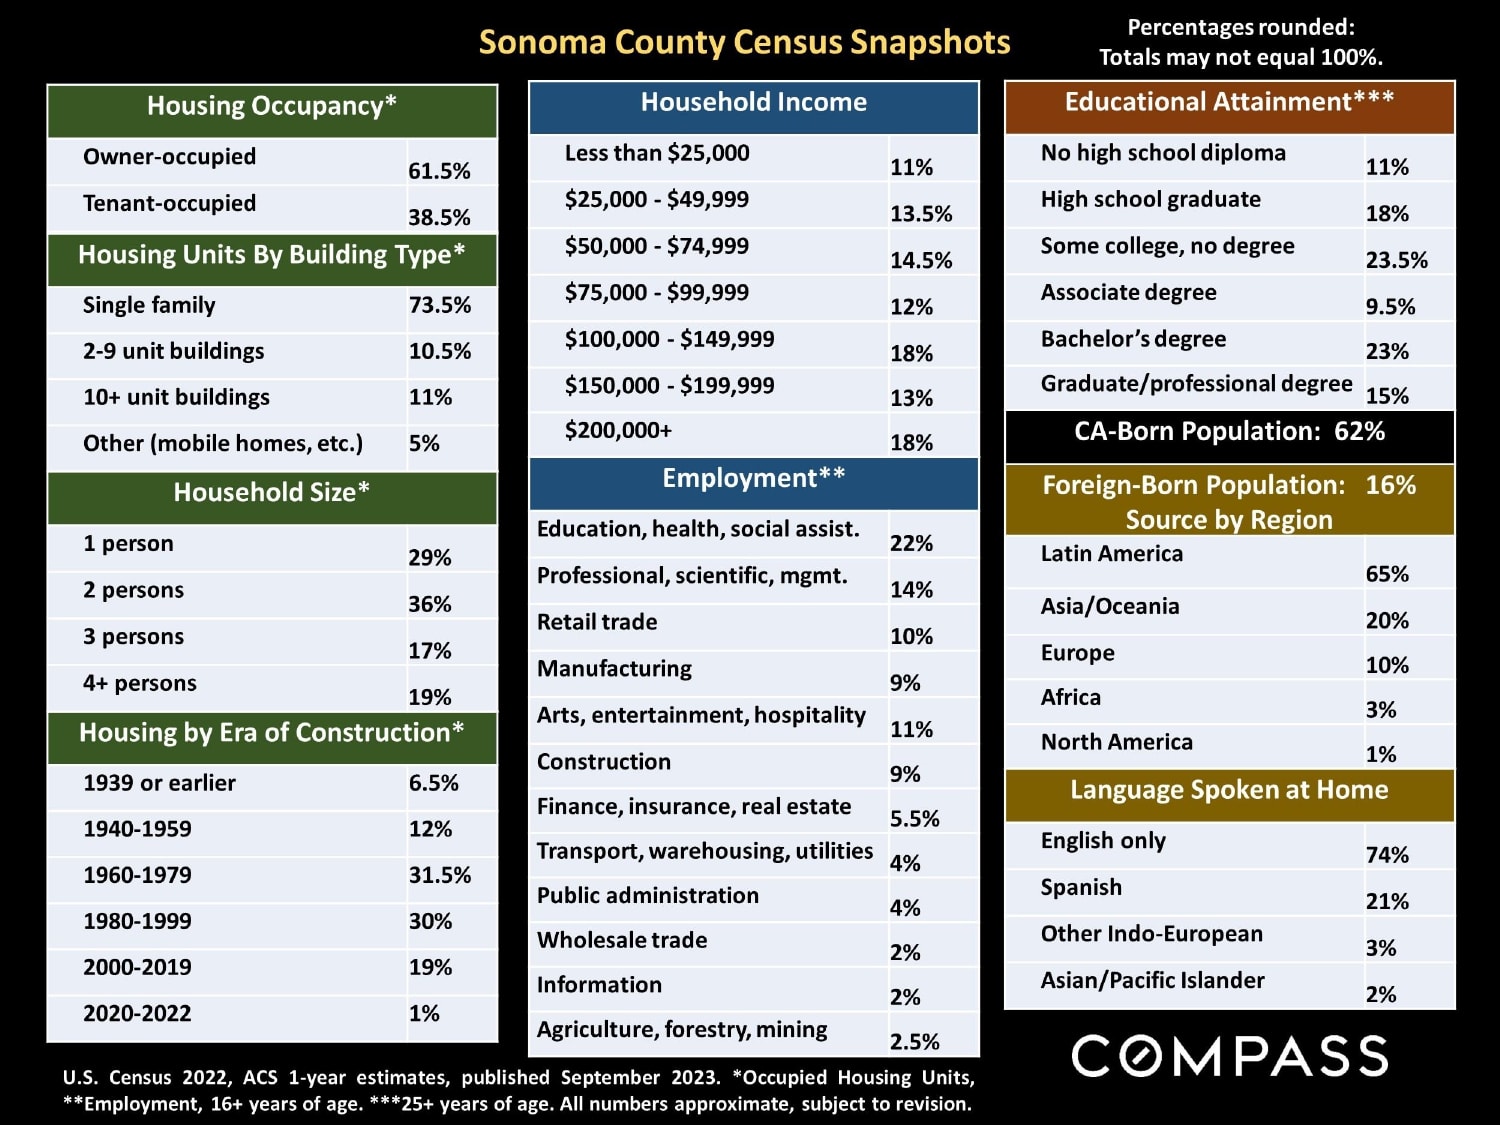
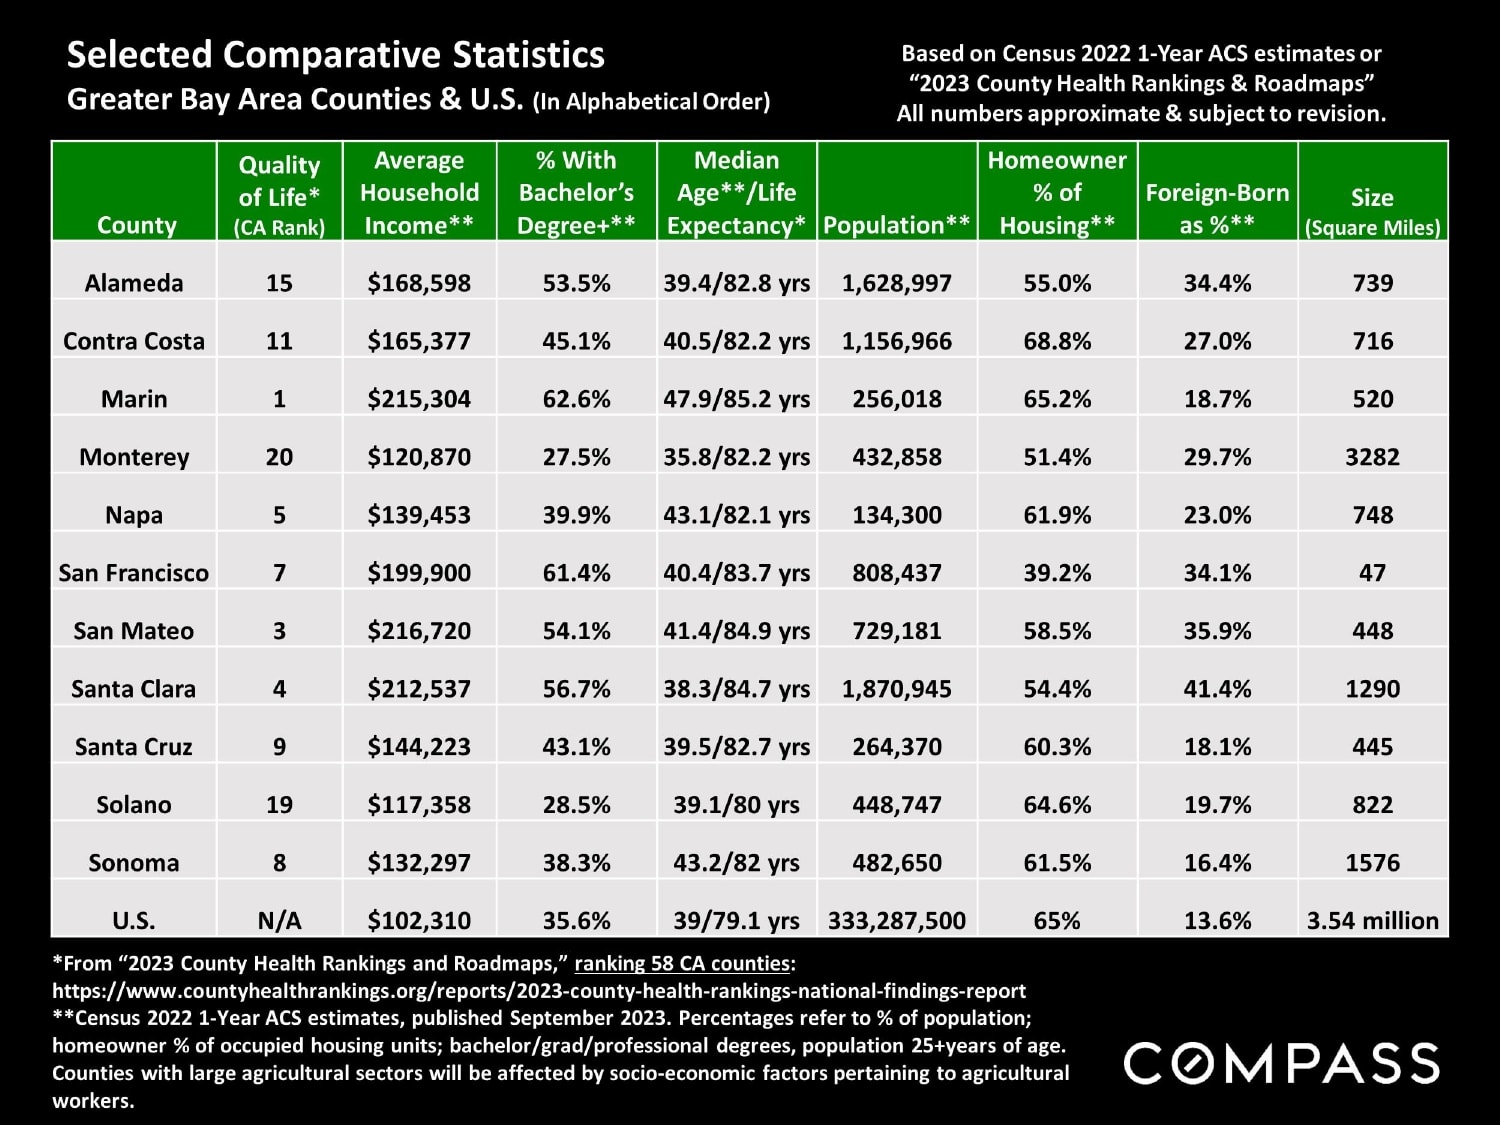
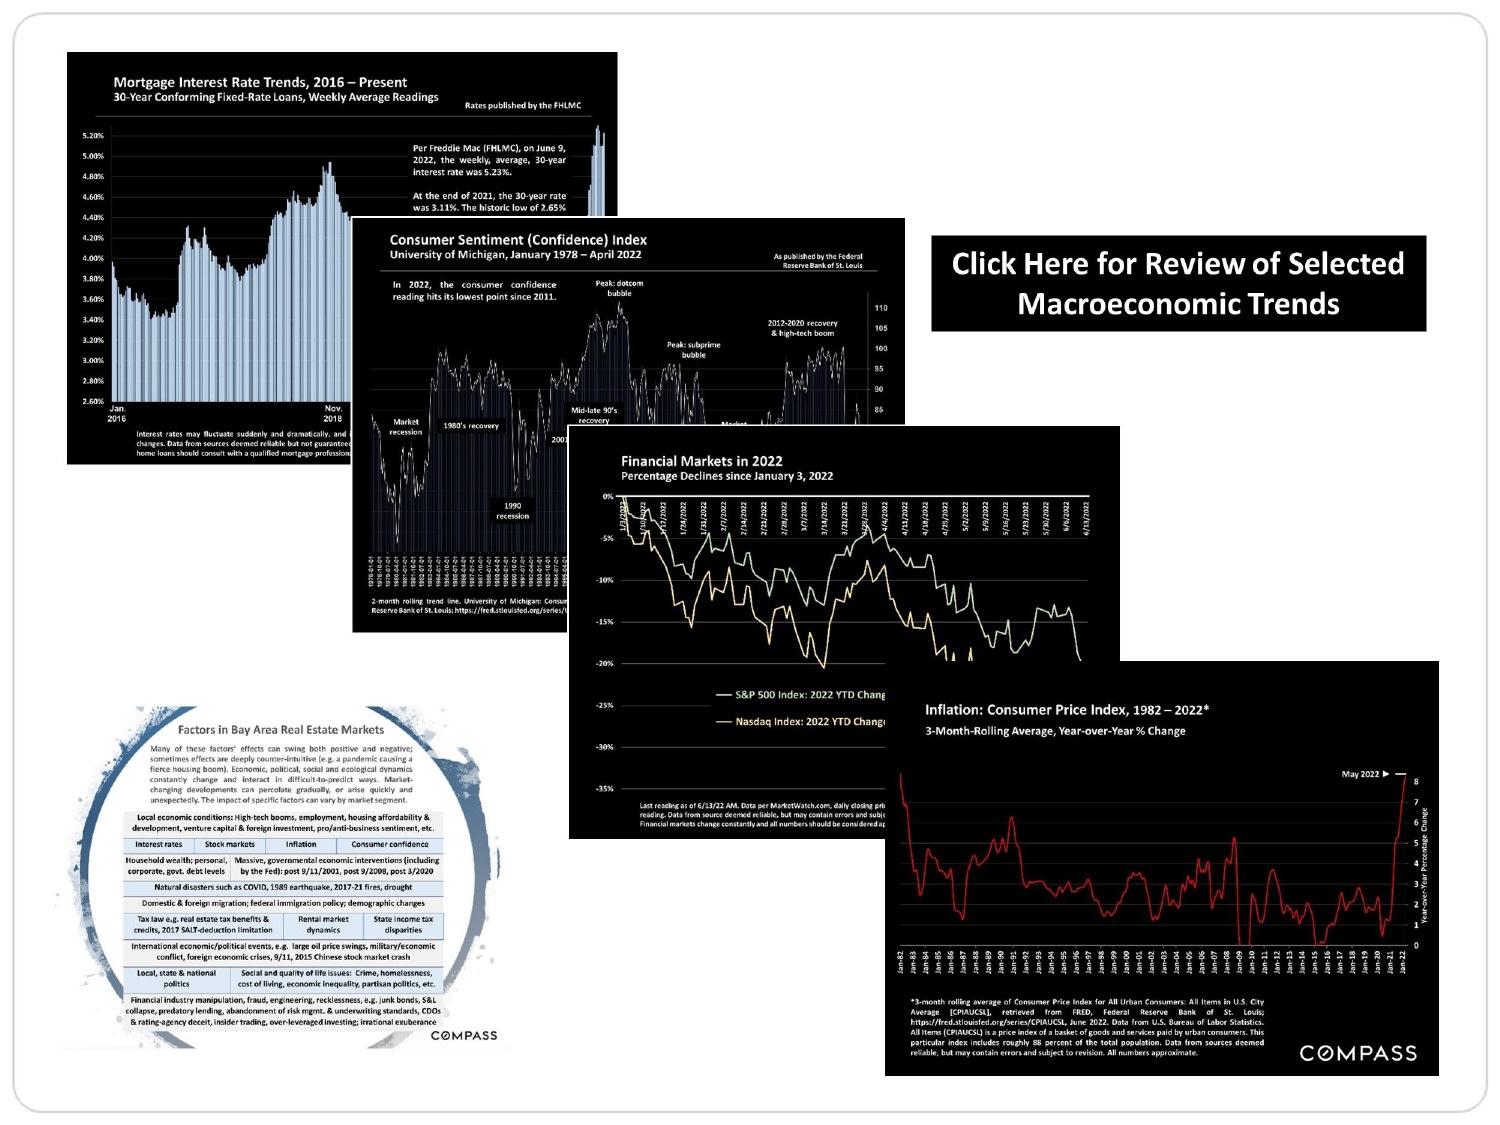
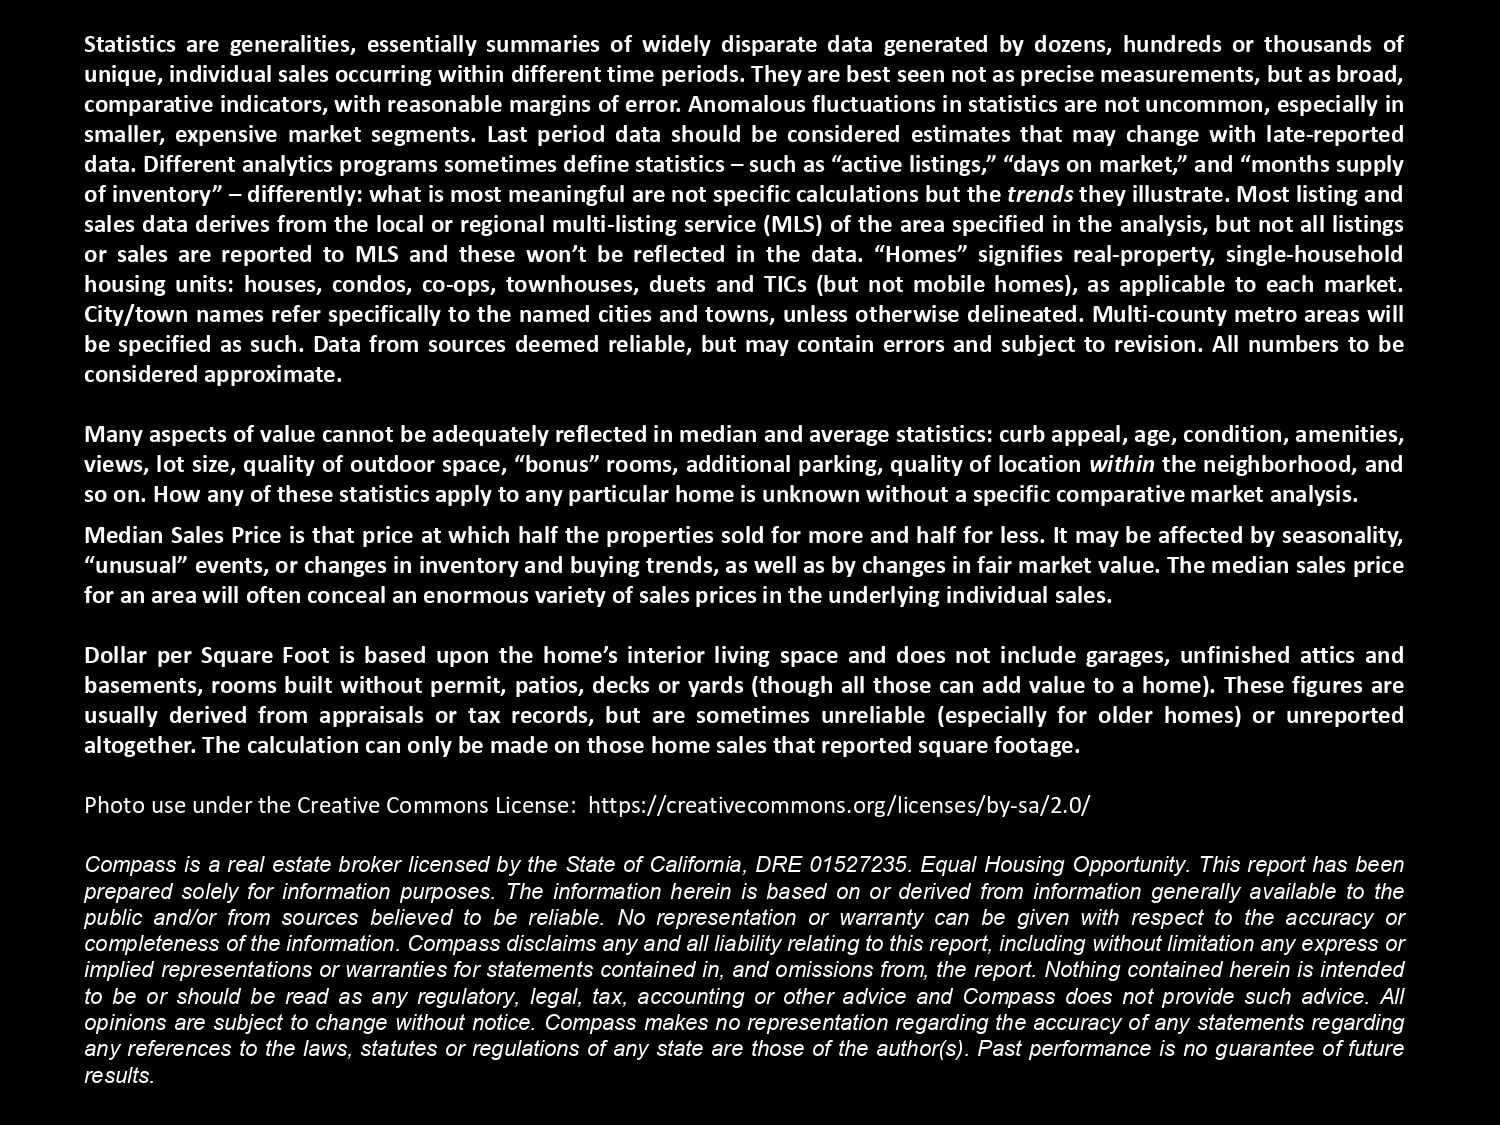
Sonoma County October 2023 real estate report cover with a weathered waterfront building and calm bay. Sonoma County Q3 2023 housing update with home sales and prices, followed by the CAR’s 2024 California market forecast. Chart of Sonoma County median home sale prices by quarter, rising from $316,500 in 2012 to $848,500 in Q3 2023. Chart of Sonoma County median home values per square foot, 2005–2023, with recession and pandemic annotations. Chart shows Sonoma County home prices rising about 325% since 1995, compared with household income at about 135%. Sonoma County residential market table comparing supply, demand, and sales metrics across eight price segments. Bar chart comparing quarterly median home prices in four Sonoma County markets from Q3 2020 to Q3 2023. Sonoma County quarterly median home prices chart for five markets, Q3 2020 through Q3 2023. Chart of Q3 2023 three-bedroom house prices by Bay Area county; Sonoma is $825,000, between Napa and Contra Costa. Infographic comparing 2023 sales of large, expensive homes across Bay Area counties, with Sonoma County highlighted. Chart of luxury home sales by Sonoma and Napa County community, divided into three price ranges. Sonoma County monthly new-listing chart, December 2019–September 2023, with September comparisons highlighted. Chart of Sonoma County active listings from January 2019 to September 2023, with seasonal trends and pandemic-era annotations. Sonoma County accepted-offer activity chart, January 2018–September 2023, with seasonal peaks and a pandemic annotation. Sonoma County average days on market chart, January 2020–September 2023, with seasonal and pandemic annotations. Sonoma County absorption-rate chart, with monthly listing offer percentages from December 2018 through September 2023. Bar chart of Sonoma County active-listing price reductions from 2018 to 2023, with seasonal trends and key dates annotated. Sonoma County monthly home sales chart, showing sales volume from January 2019 to September 2023. Bar chart of Sonoma County luxury home sales from 2019 to 2023, annotated with fire dates and monthly milestones. Table of the most expensive reported home sales in selected Bay Area markets in 2023, led by Woodside at $44.5 million. Bar chart comparing $5 million-plus active home listings by Bay Area county; Sonoma shows 35 lower-range and 19 $10 million-plus listings. Bar chart of Bay Area luxury home sales by county, including Sonoma County’s 31 sales under $10 million and 4 above. Bar chart of Bay Area luxury home sales by county, including Sonoma County’s 31 sales under $10 million and 4 above. Chart of U.S. 30-year mortgage rates since 1976, with a sharp rise to 7.49% in October 2023. Sonoma County census infographic showing housing, income, employment, education, birthplace, and language statistics. Comparative statistics table for Bay Area counties and the U.S., covering income, population, housing, and demographics. Macroeconomic charts show mortgage rates, consumer confidence, financial market declines, inflation, and Bay Area real estate factors. Real estate market report notes on interpreting statistics, median sales price, price per square foot, and disclaimers.


WORK WITH US

We offer the highest level of service and expertise to our clients. Our team has built a reputation for consistently representing the finest real estate in San Francisco and Napa Valley. Results driven and dedicated to your success, whether buying, selling, renting or investing. Contact us today for a private consultation.

Contact Us