Stanford Circle Cities: September 2022

Stanford Circle Cities September 2022 real estate report cover featuring a wooded trail.
September 2022 Bay Area market update discussing buyer activity, listings, home prices, interest rates, and the autumn selling season.
Stanford Circle Cities chart compares monthly listings accepting offers in 2021 and 2022, with August figures of 164 and 133.
Bar chart of Stanford Circle median home sale prices, June 2020–August 2022, peaking at $4.34 million in May 2022.
Bar chart of Stanford Circle home price appreciation rates, March 2020–August 2022, peaking at 35%.
Chart of Stanford Circle home sales closing over list price, with monthly percentages from 2018 to 2022 and a March 2022 peak.
Bar chart shows Stanford Circle Cities home sale prices fell to 96.5% of original list price in August 2022.
Line chart comparing 2021 and 2022 new listings in Stanford Circle Cities, with 2022 listings down 28% in August.
Bar chart of Stanford Circle region new listings from June 2018 to August 2022, showing seasonal peaks and winter declines.
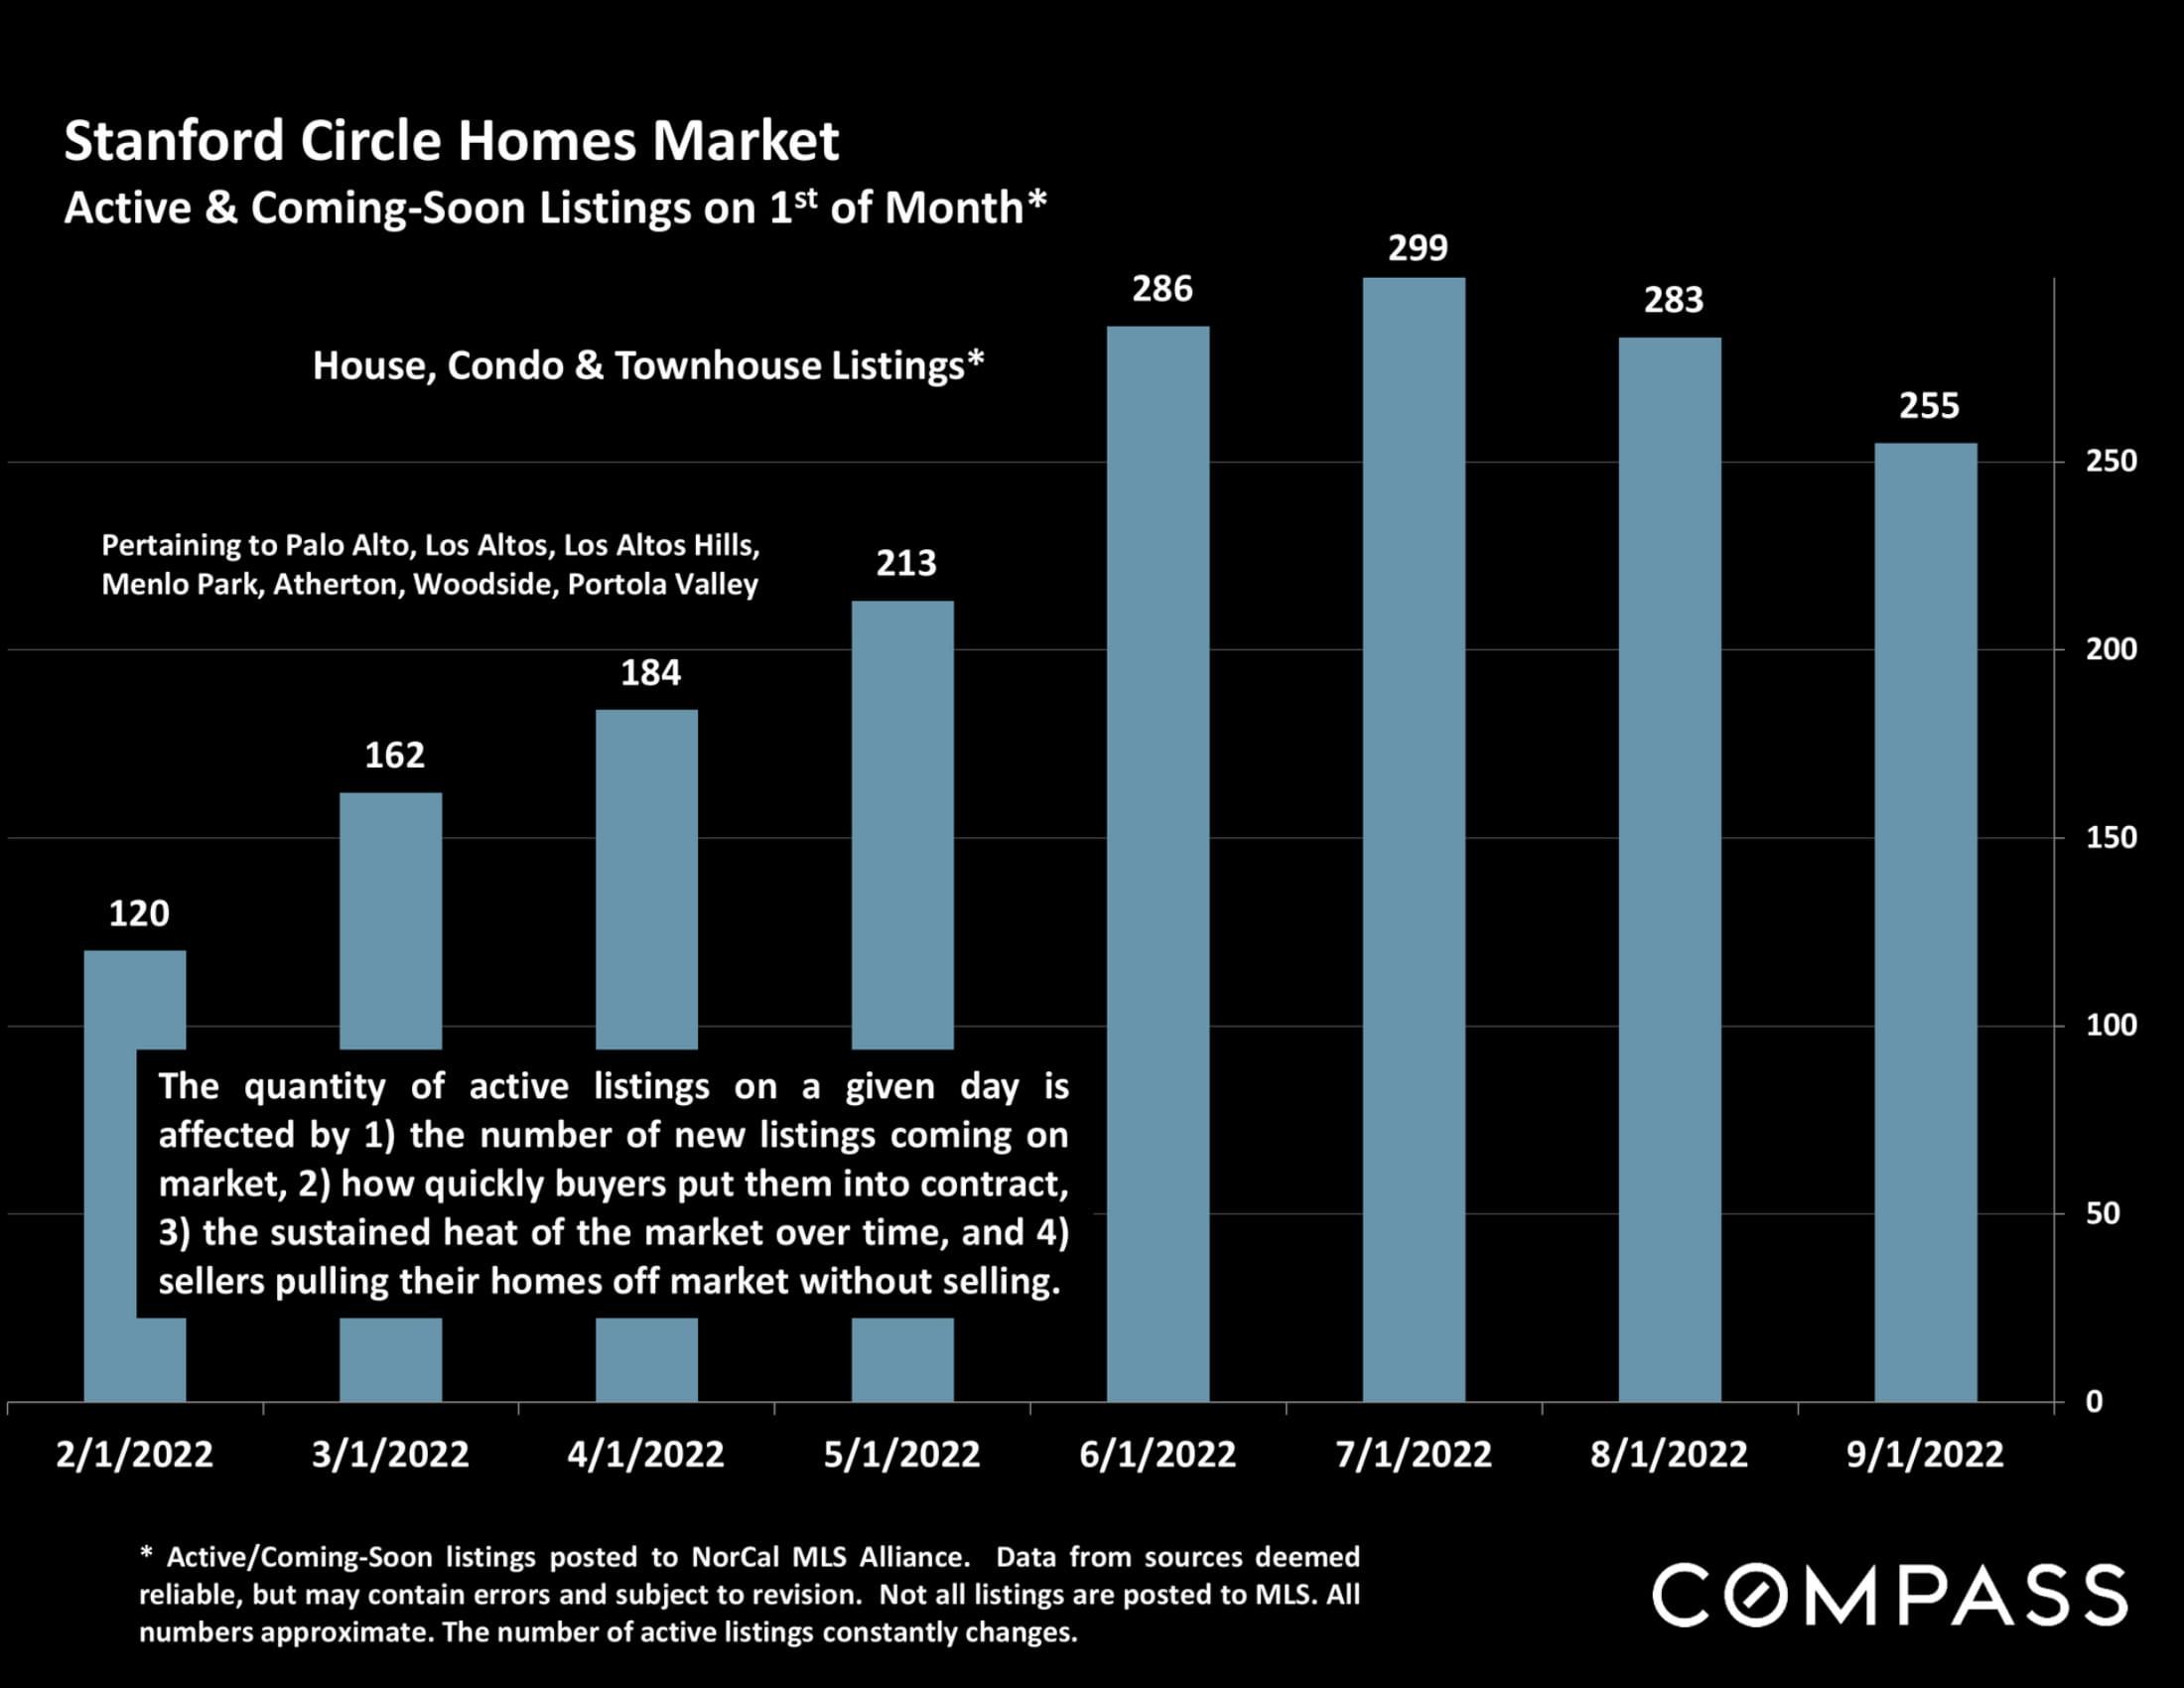
Bar chart of Stanford Circle home listings, rising from 120 in February 2022 to 299 in July, then falling to 255 in September.
Line chart of Stanford Circle listing activity from January 2020 to August 2022, peaking in May 2021.
Line chart compares 2021 and 2022 listings going into contract, with 2022 falling to 25% in July before rebounding.
Stanford Circle monthly home sales chart compares 2021 and 2022, showing sales declining to 116 in August 2022.
Bar chart of Stanford Circle monthly home sales, August 2018–August 2022, with seasonal trends and pandemic-era changes.
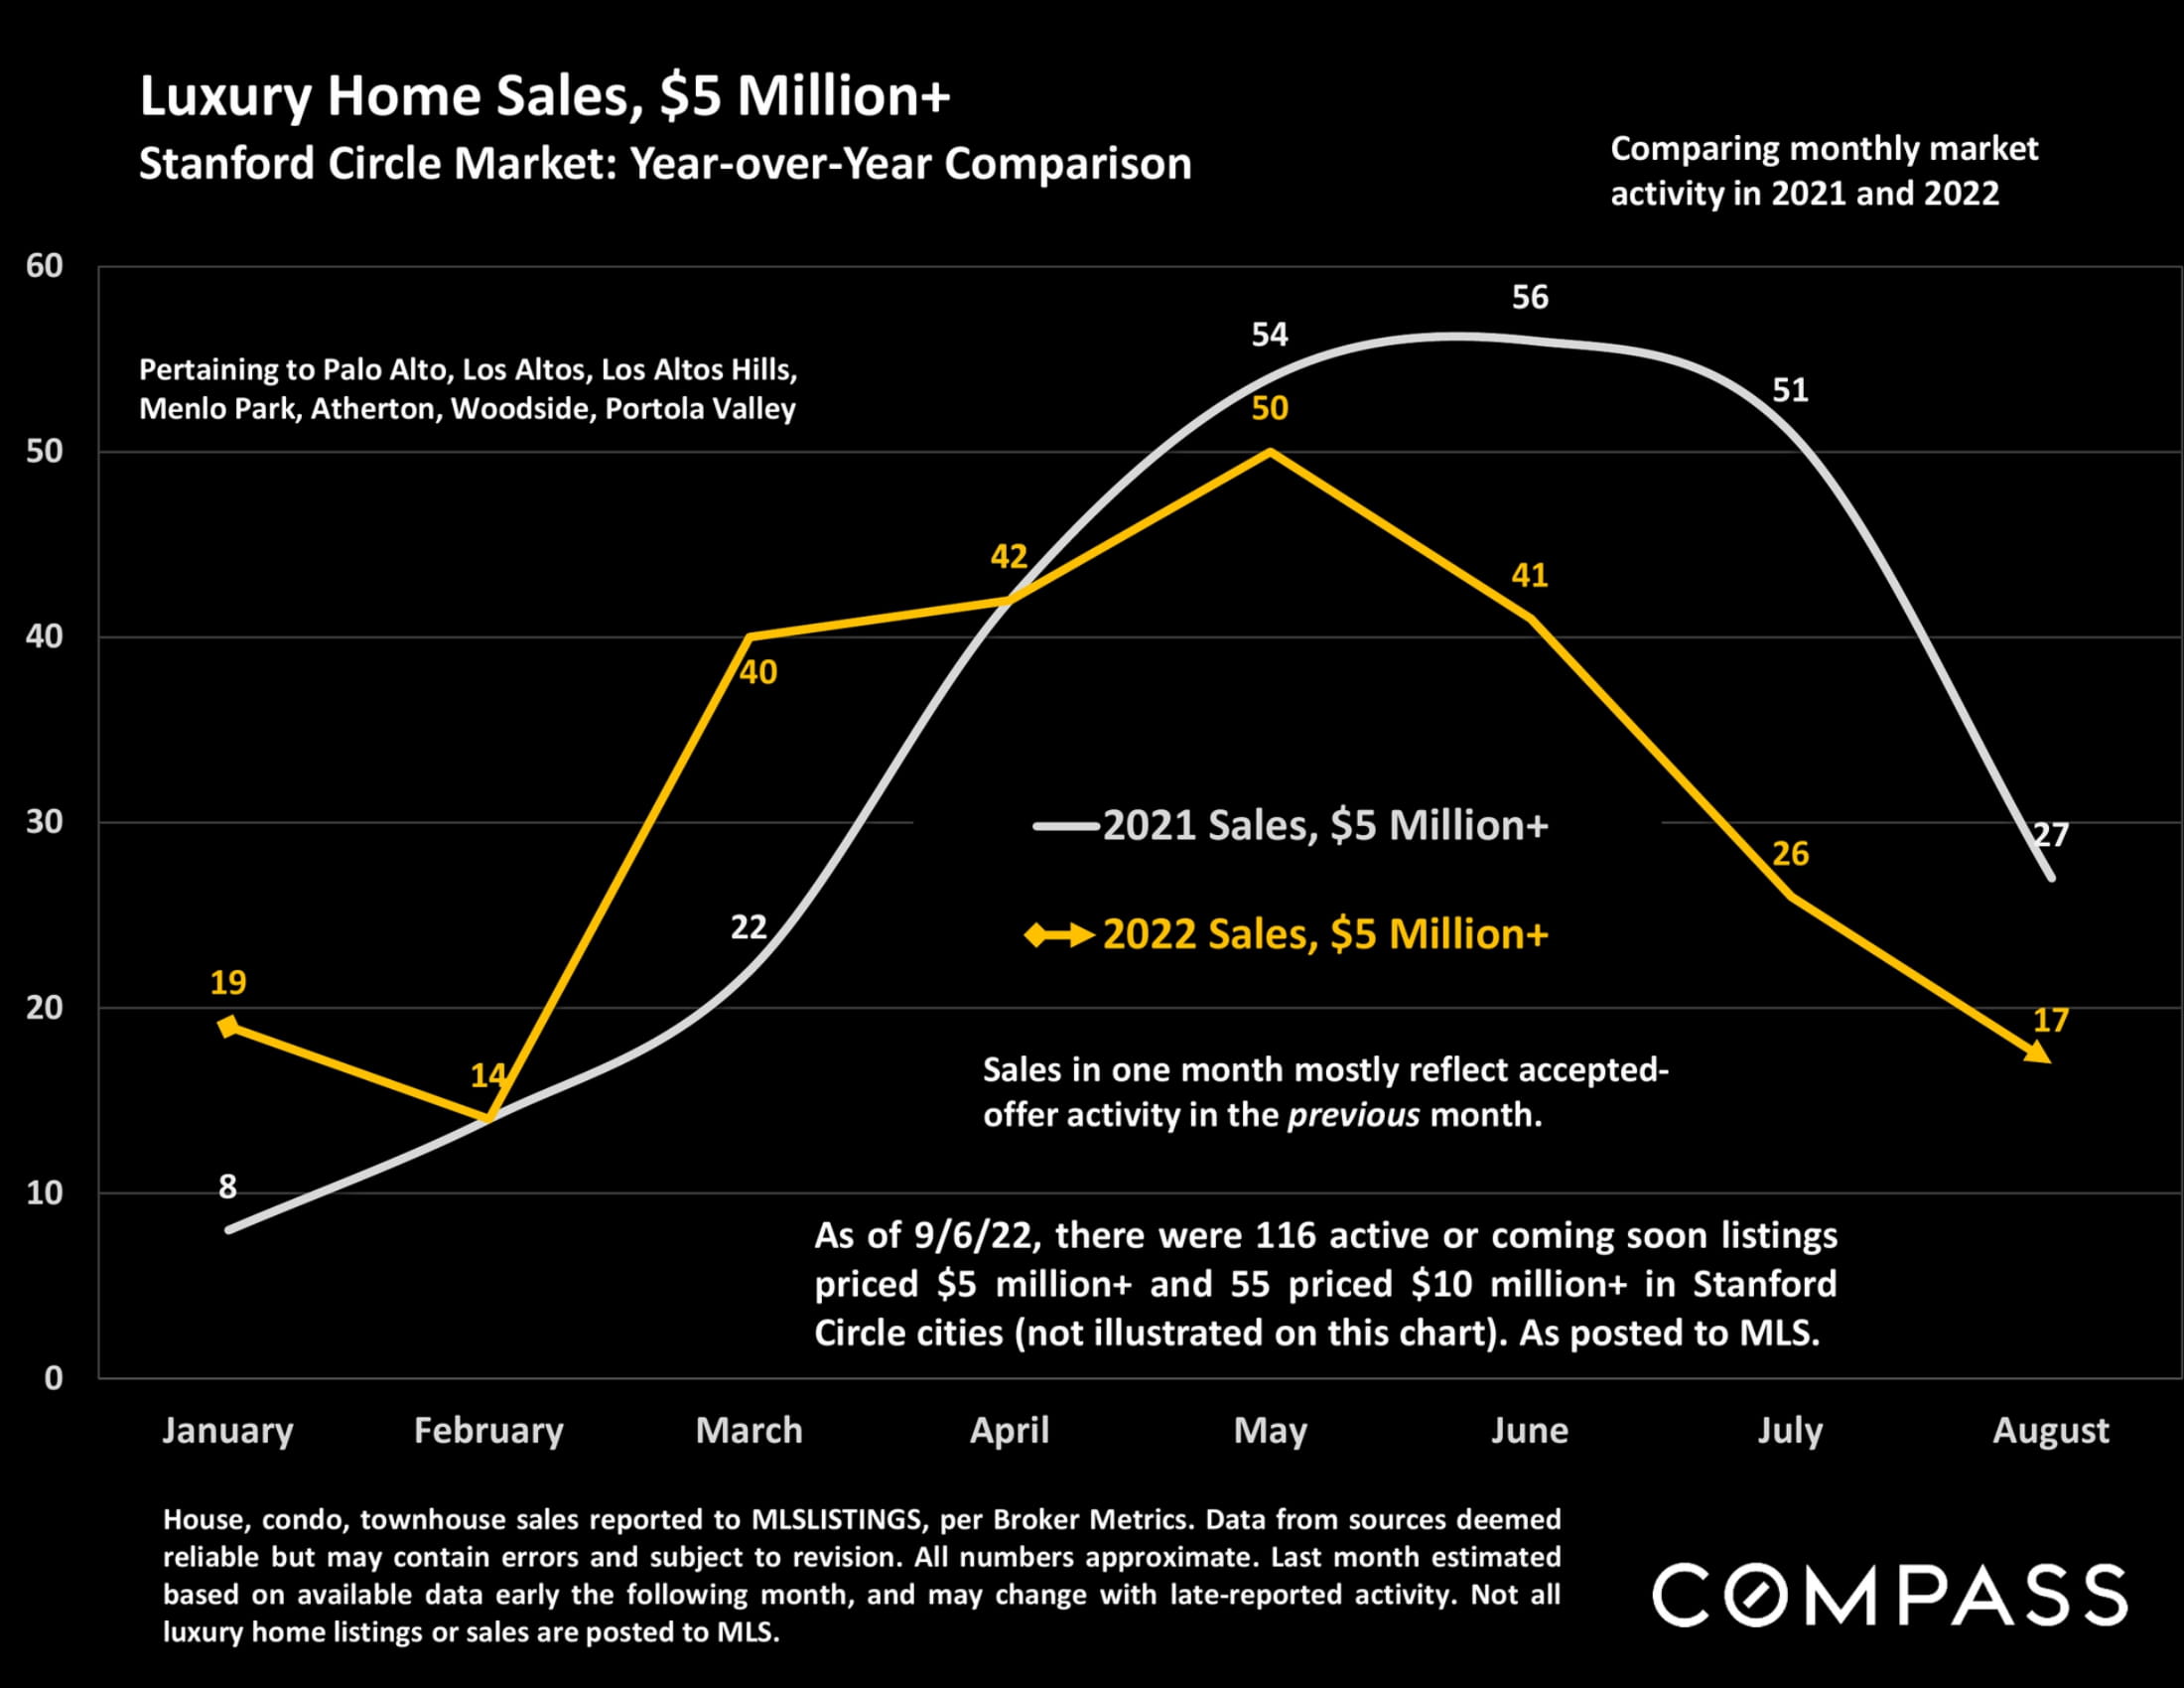
Line chart comparing 2021 and 2022 monthly sales of $5 million-plus homes in Stanford Circle cities.
Chart of monthly Stanford Circle luxury home sales from August 2018 to August 2022, with teal bars and seasonal annotations.
Bay Area large-home sales comparison by county, with median prices, home sizes, lot sizes and days on market.
San Francisco Bay Area luxury home market report with an ornate garden gate and Compass branding.
Economic charts on mortgage rates, consumer sentiment, market declines, and inflation, alongside Bay Area real estate market factors.
San Francisco Bay Area real estate survey promotion with the Golden Gate Bridge and a link to the full report.
Real estate market statistic definitions and Compass report disclaimers.


WORK WITH US

We offer the highest level of service and expertise to our clients. Our team has built a reputation for consistently representing the finest real estate in San Francisco and Napa Valley. Results driven and dedicated to your success, whether buying, selling, renting or investing. Contact us today for a private consultation.

Contact Us