Stanford Circle Real Estate February 2025 Report

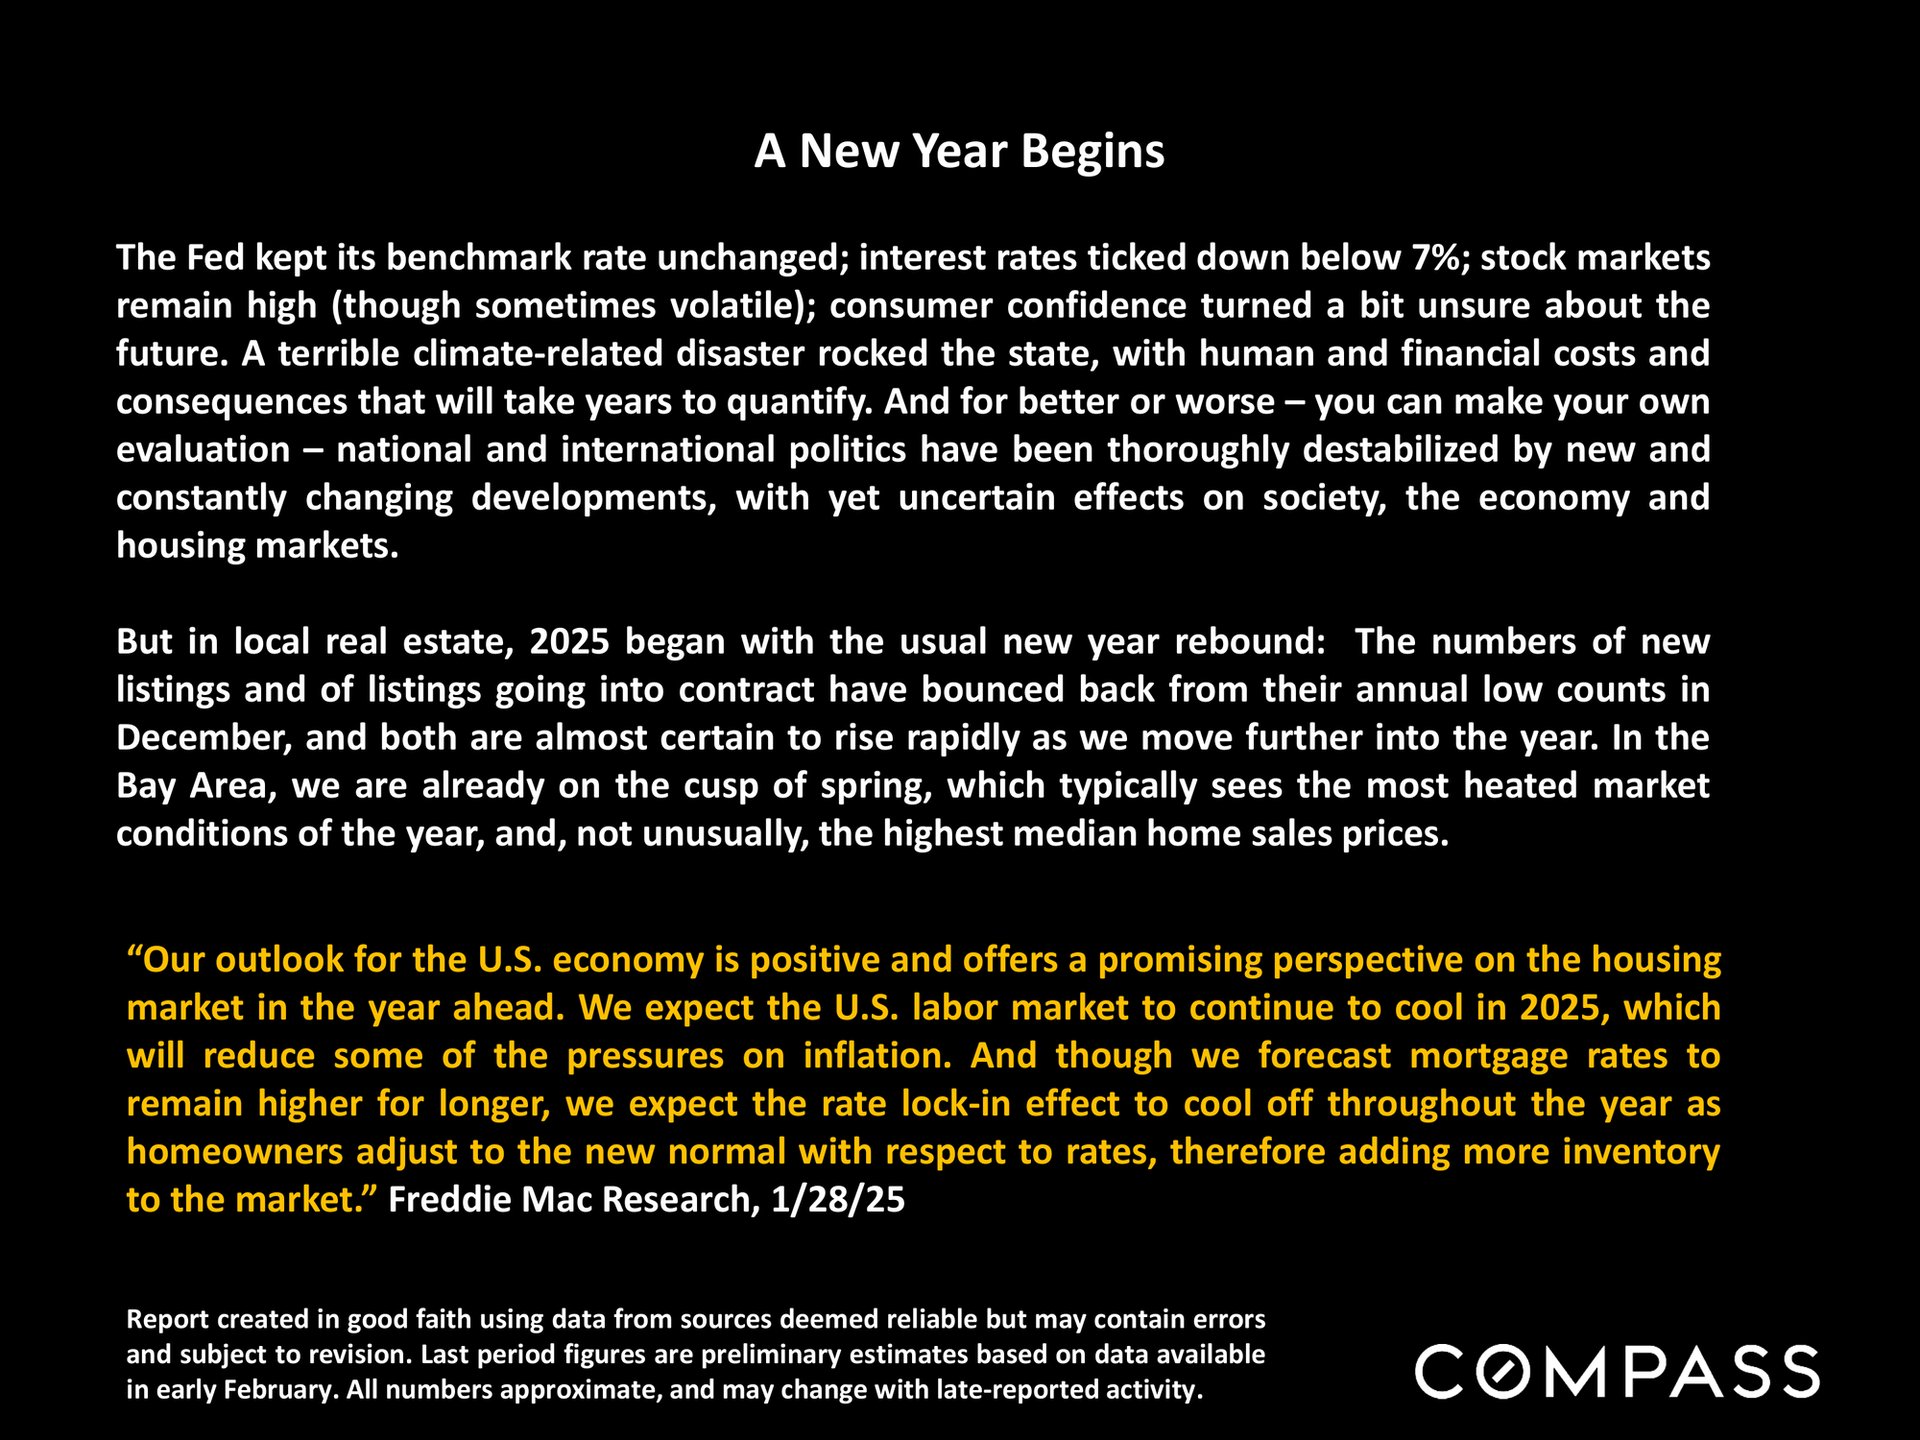
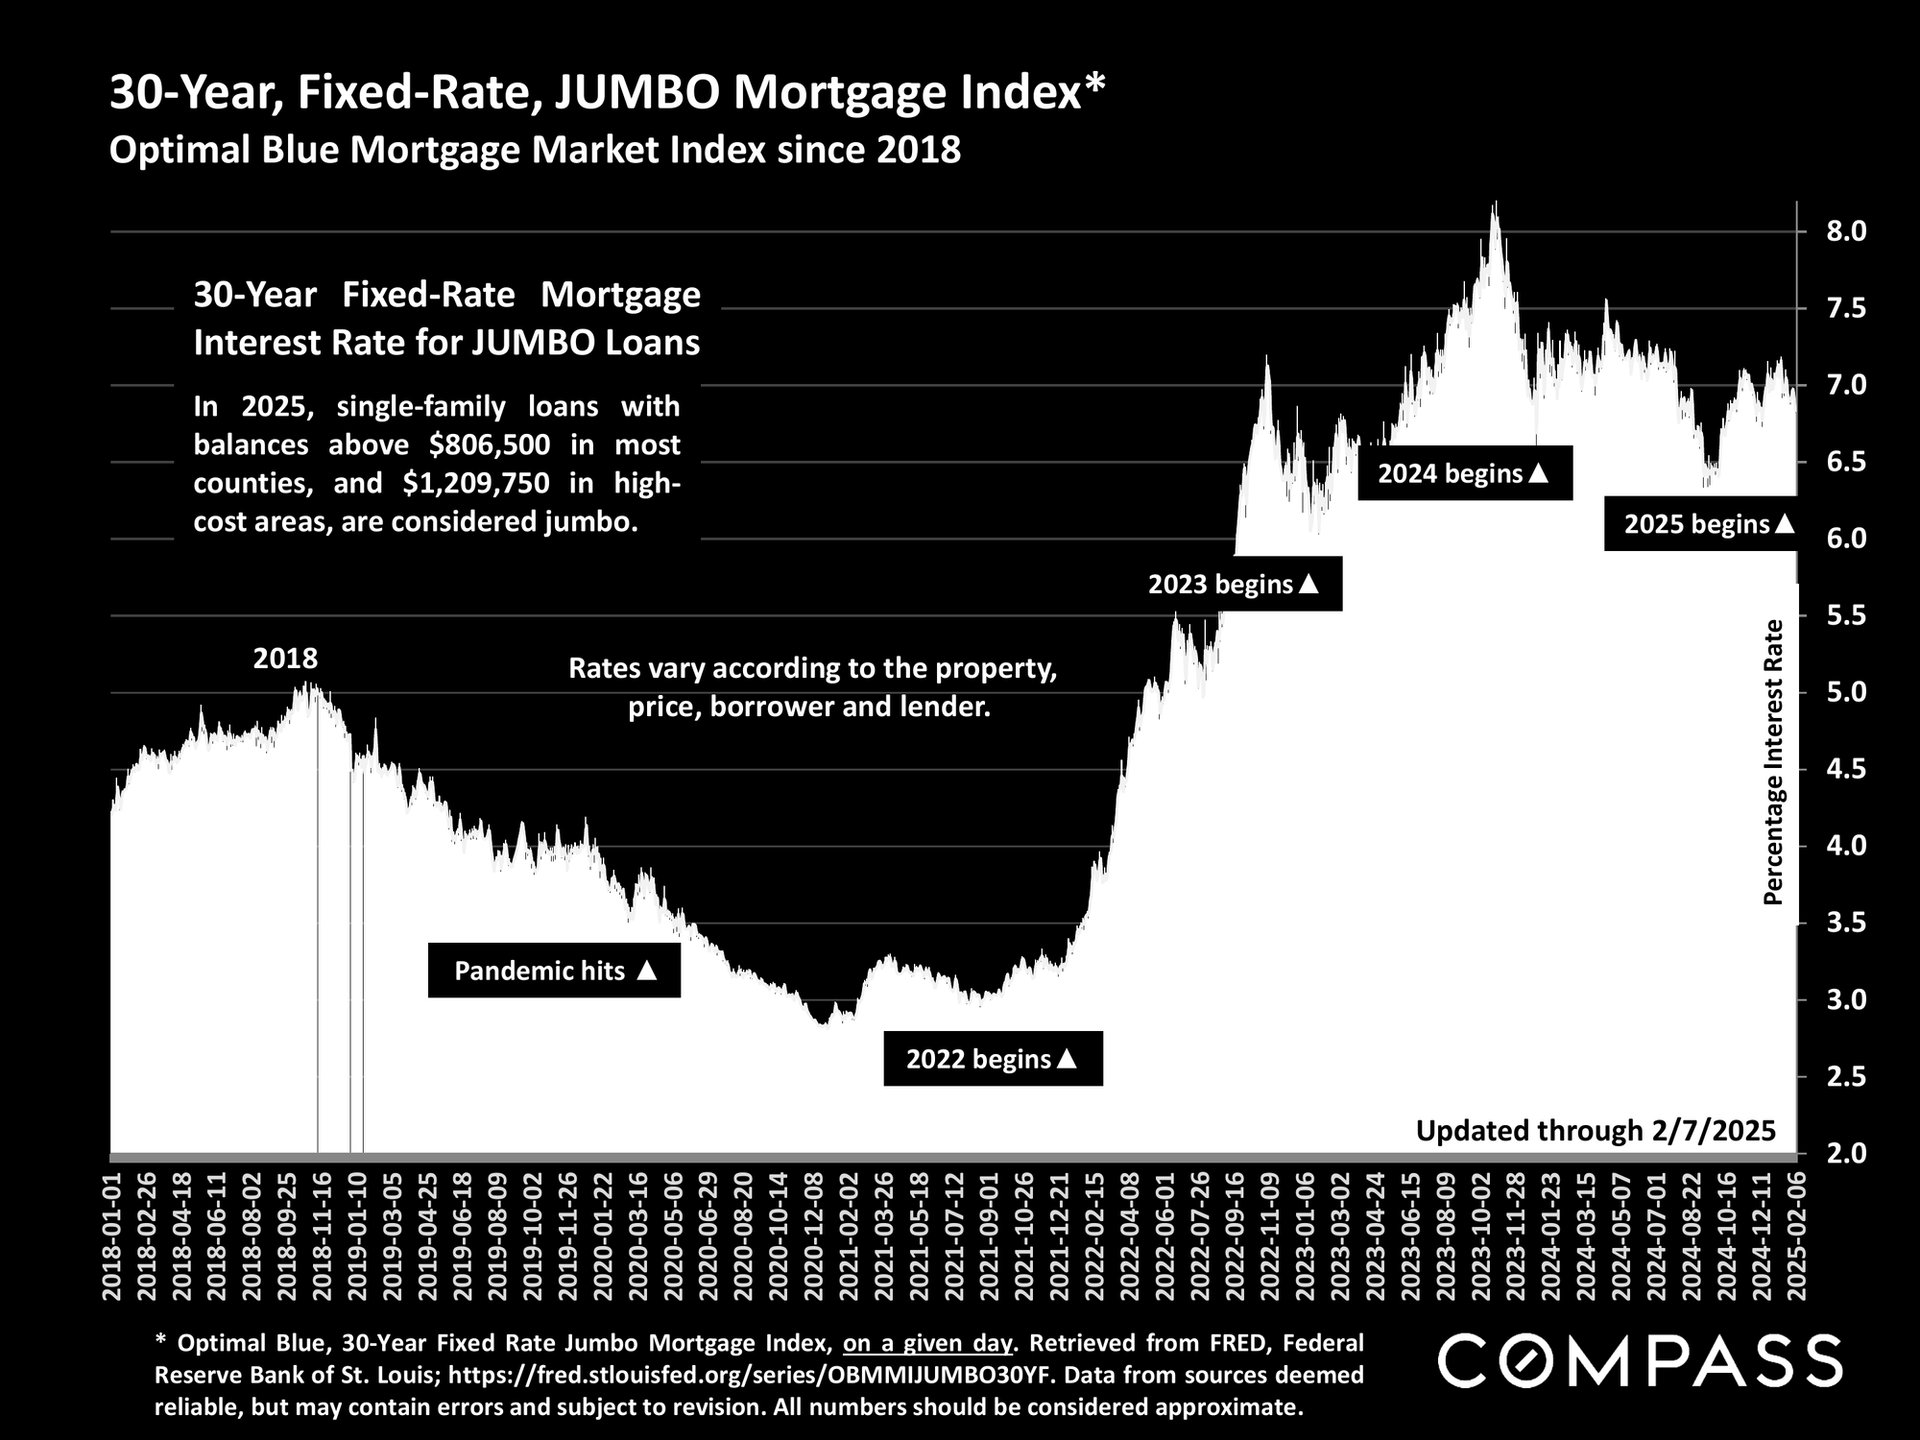
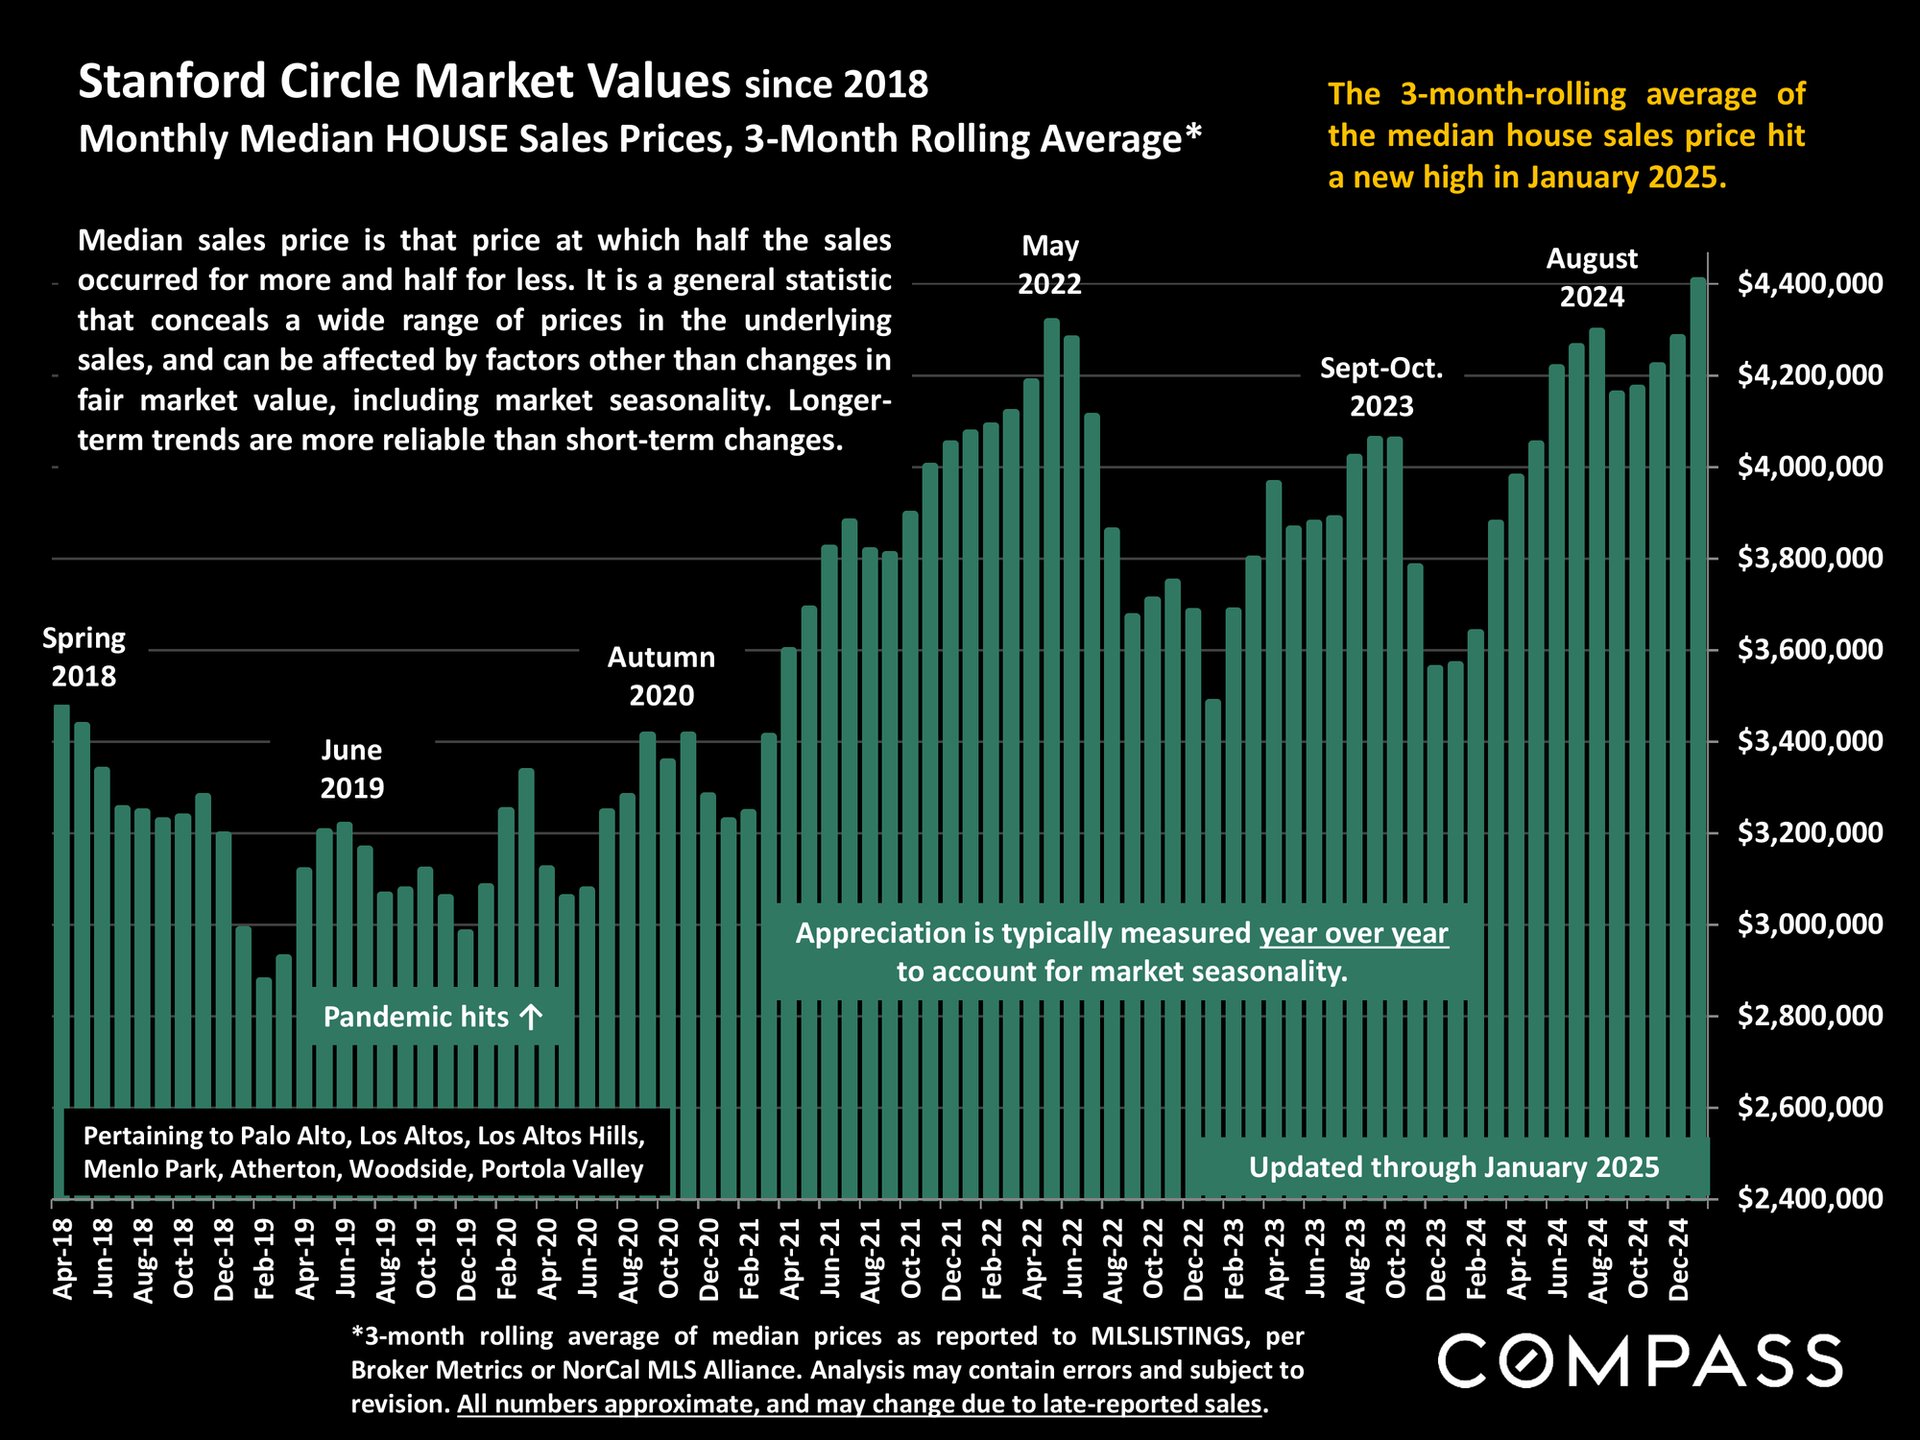
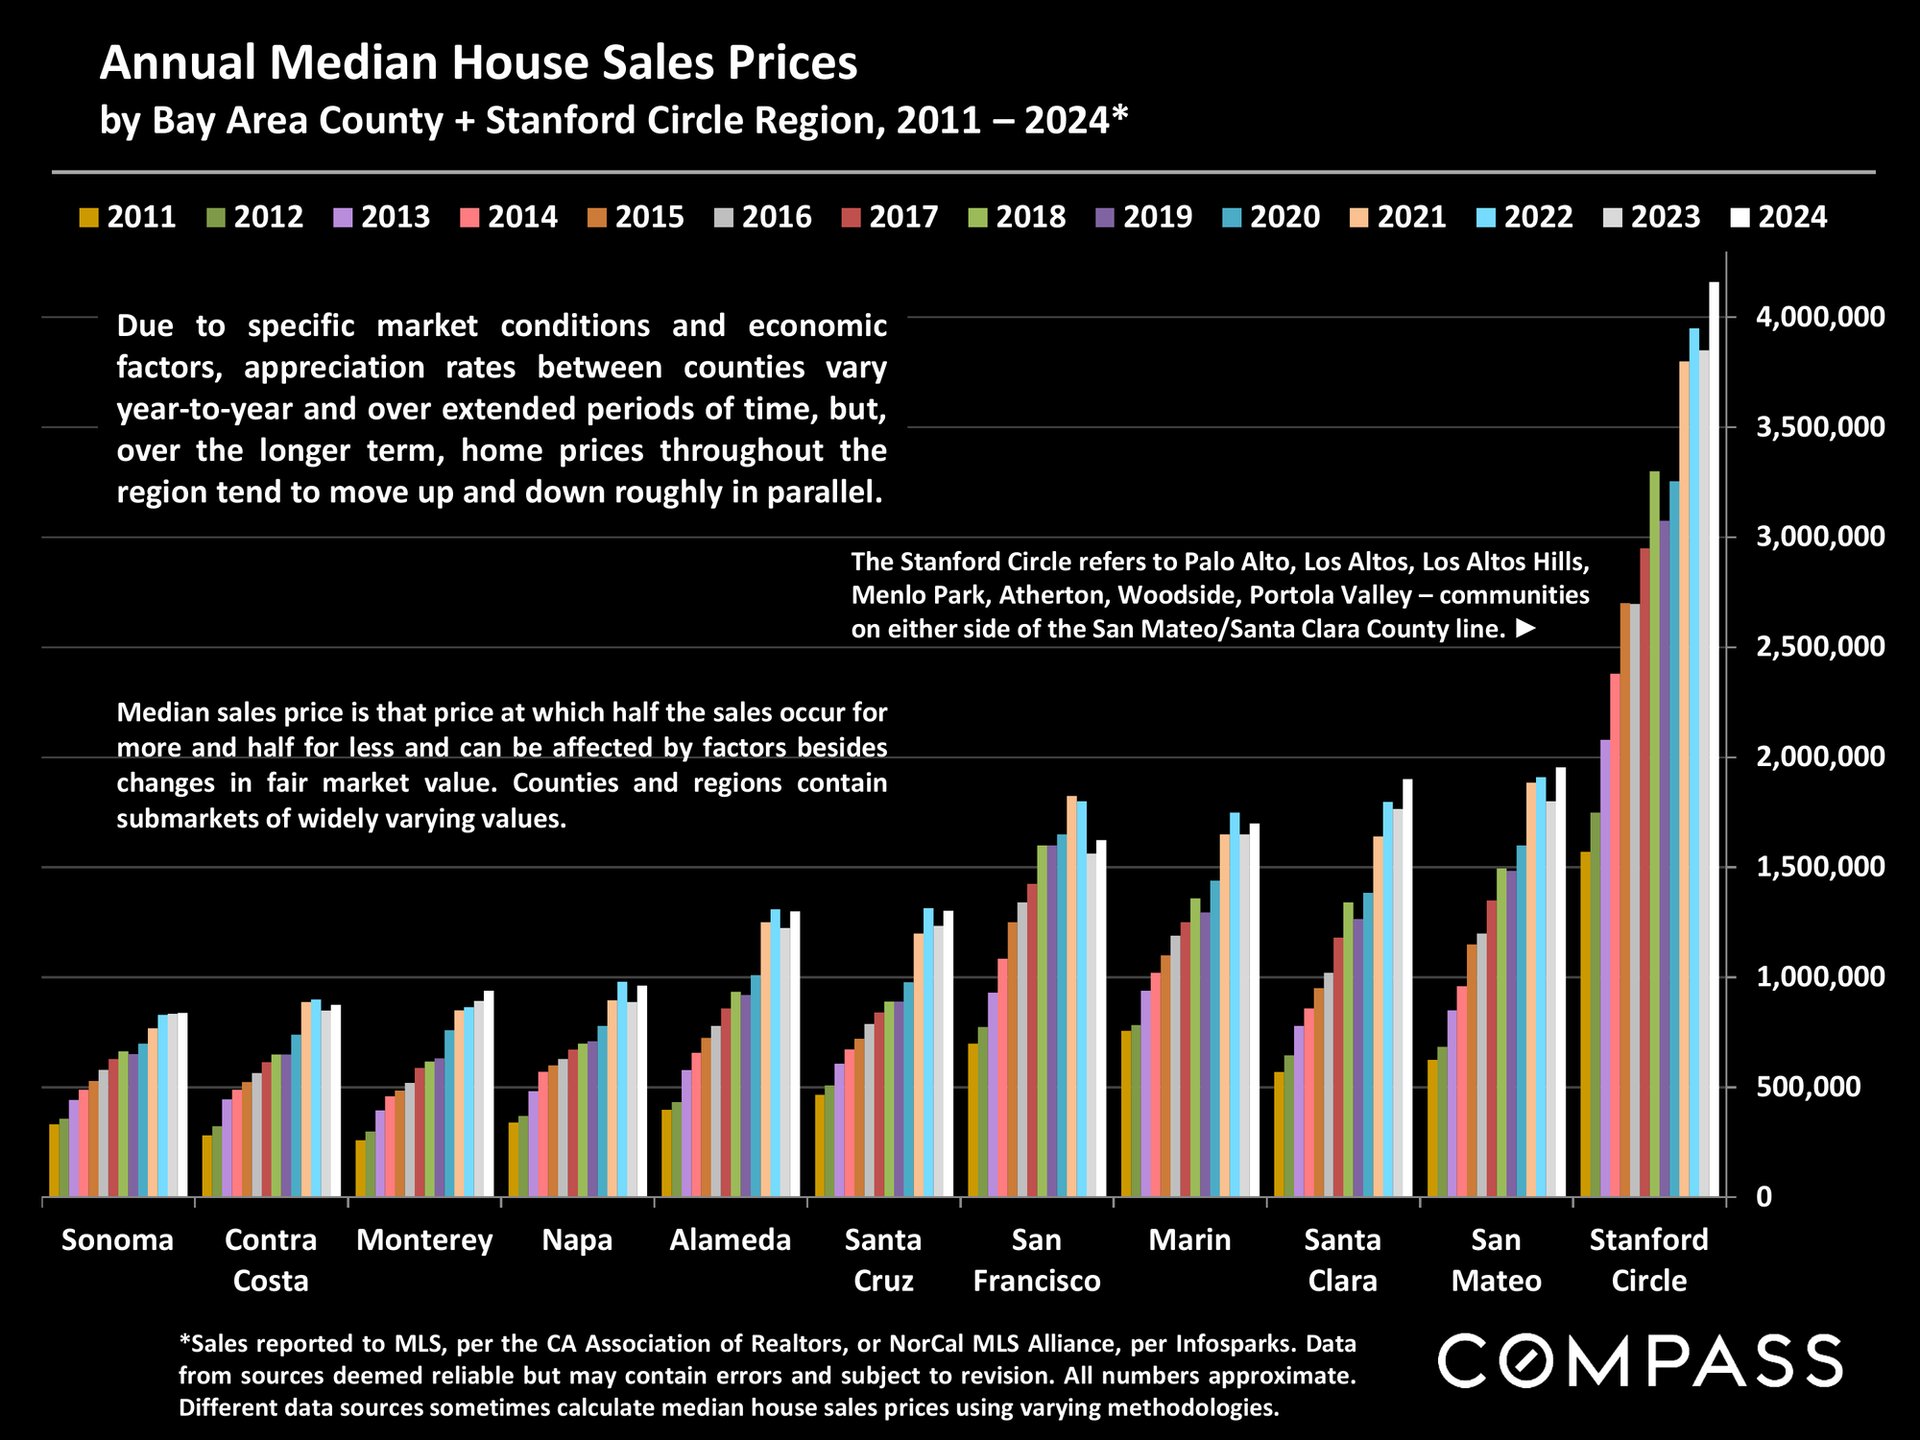
Stanford Circle Real Estate February 2025 Report, with data through January.Real estate report discussing the 2025 economic outlook, Bay Area listings, and housing market trends.Chart of jumbo mortgage rates from 2018 to February 2025, with a sharp rise beginning in 2022.Stanford Circle home sale price chart, with three-month median averages reaching a new high in January 2025.Chart of annual median home prices by Bay Area county and Stanford Circle, 2011–2024.
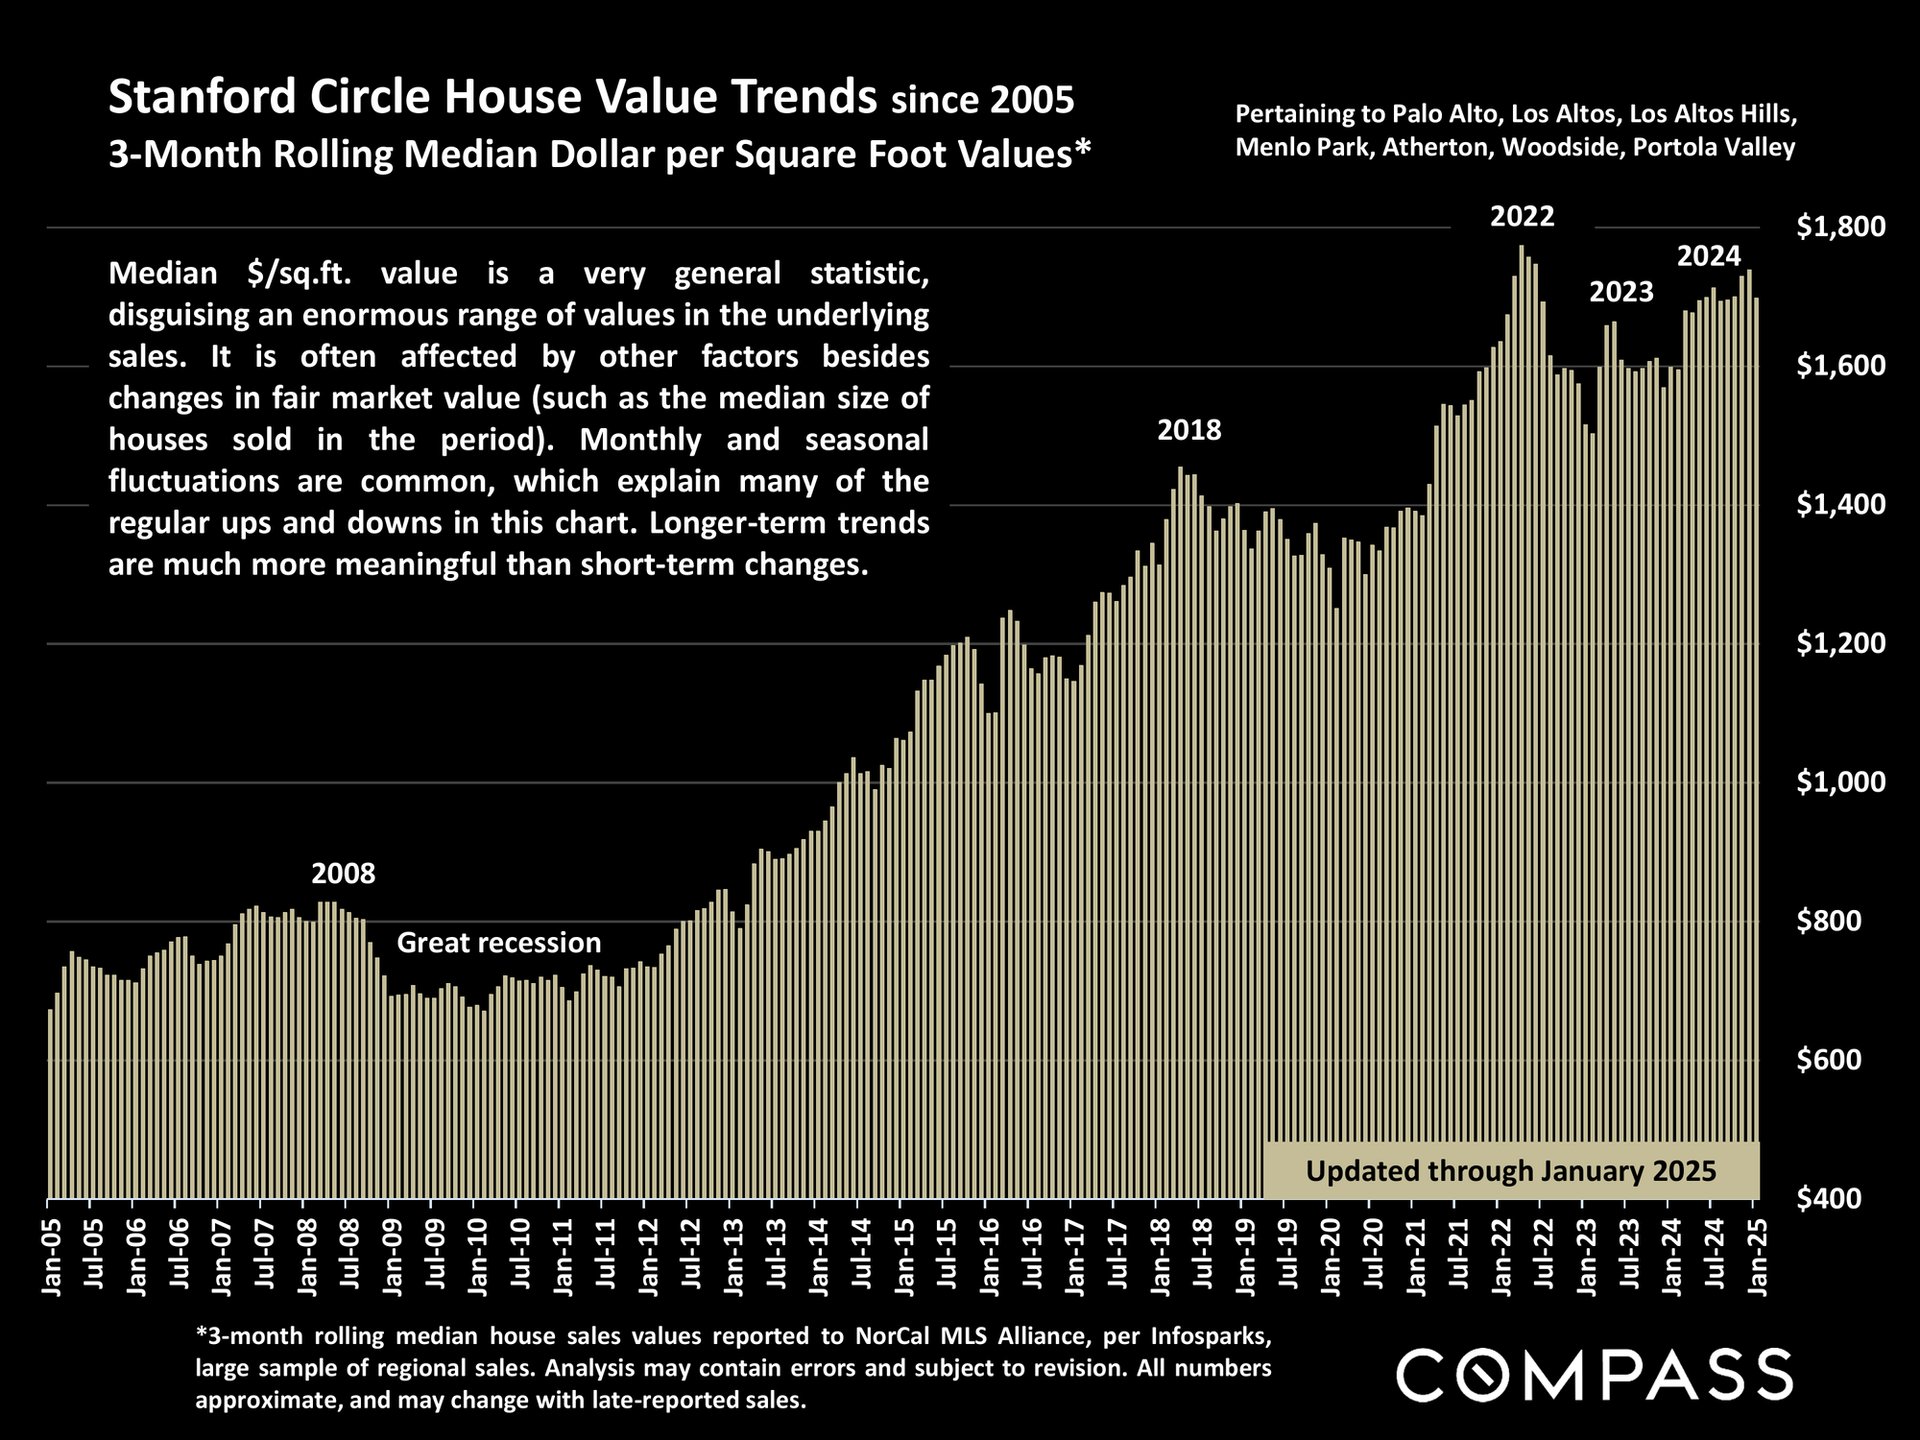
Stanford Circle home value chart, with three-month median price per square foot through January 2025.
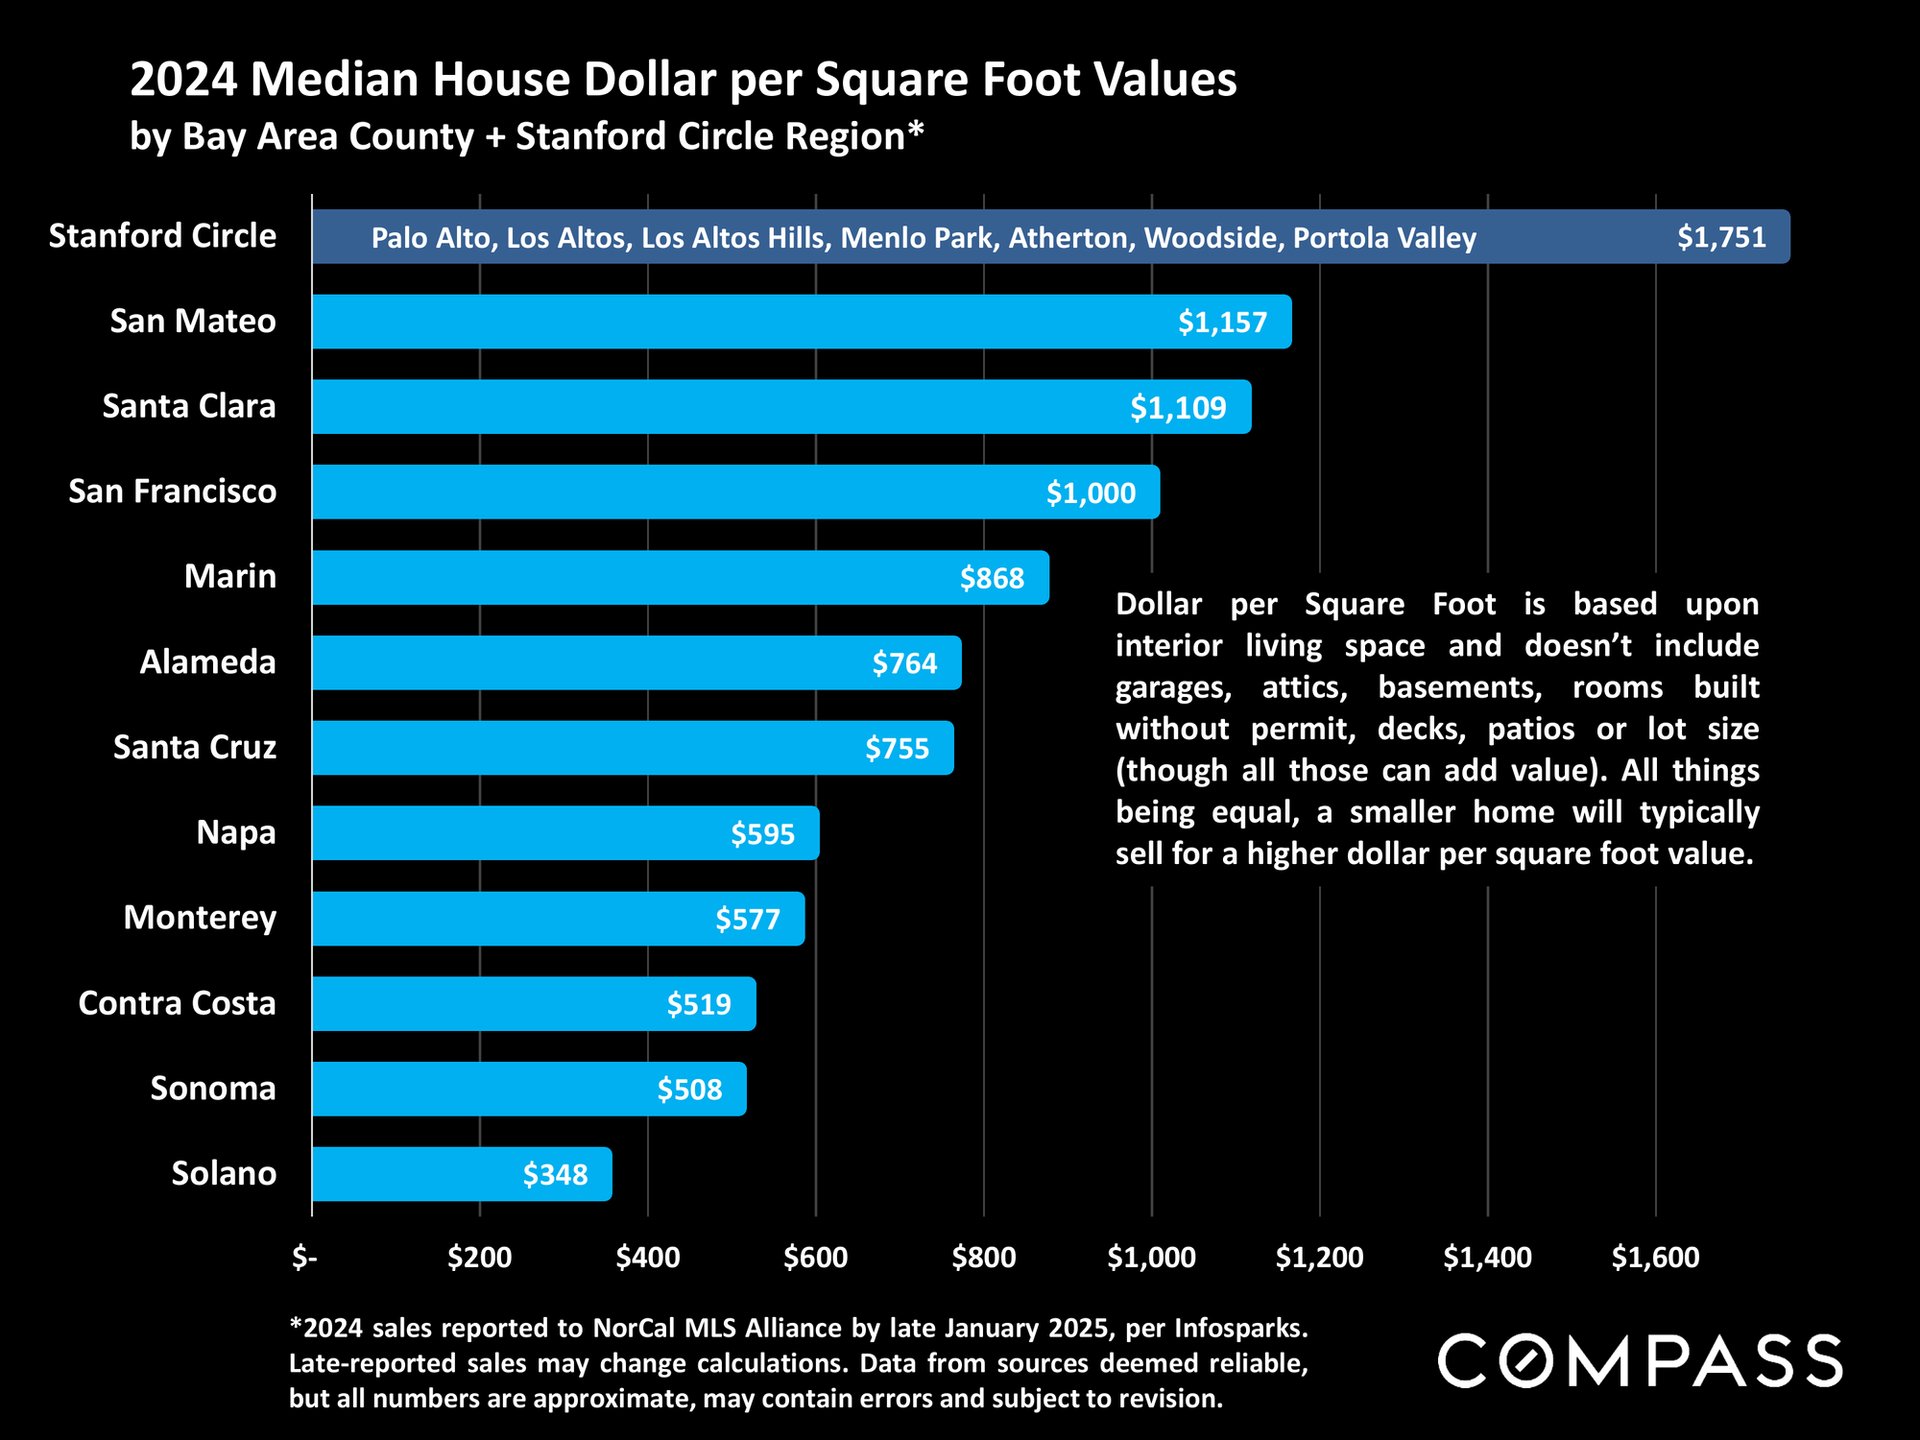
Chart of 2024 median house prices per square foot, led by Stanford Circle at $1,751 and Solano at $348.
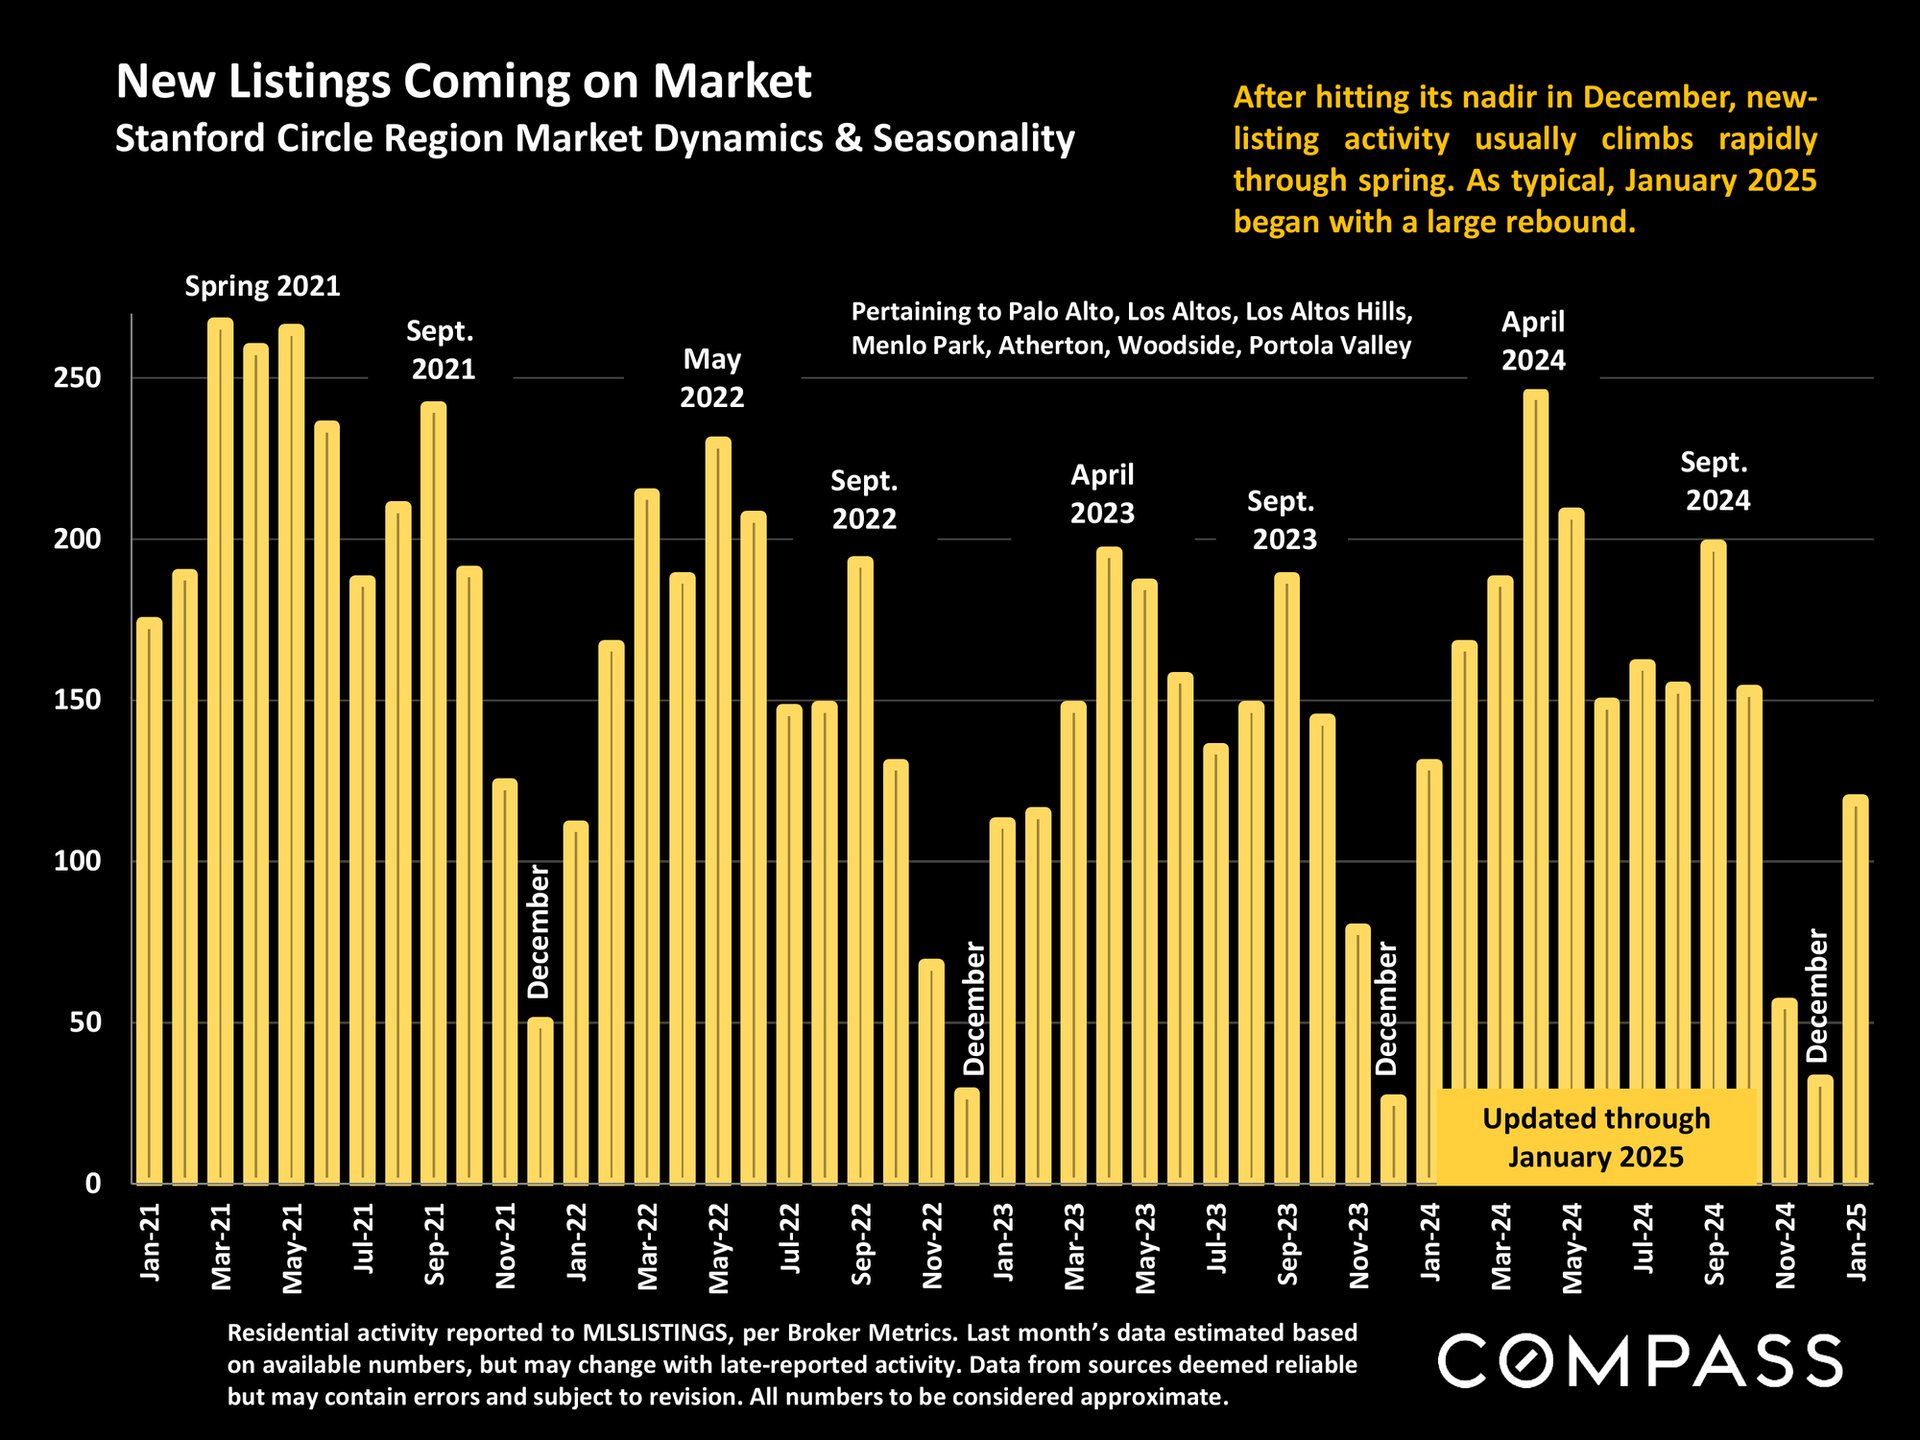
Bar chart of Stanford Circle new listings from 2021 to January 2025, showing seasonal peaks and a January rebound.
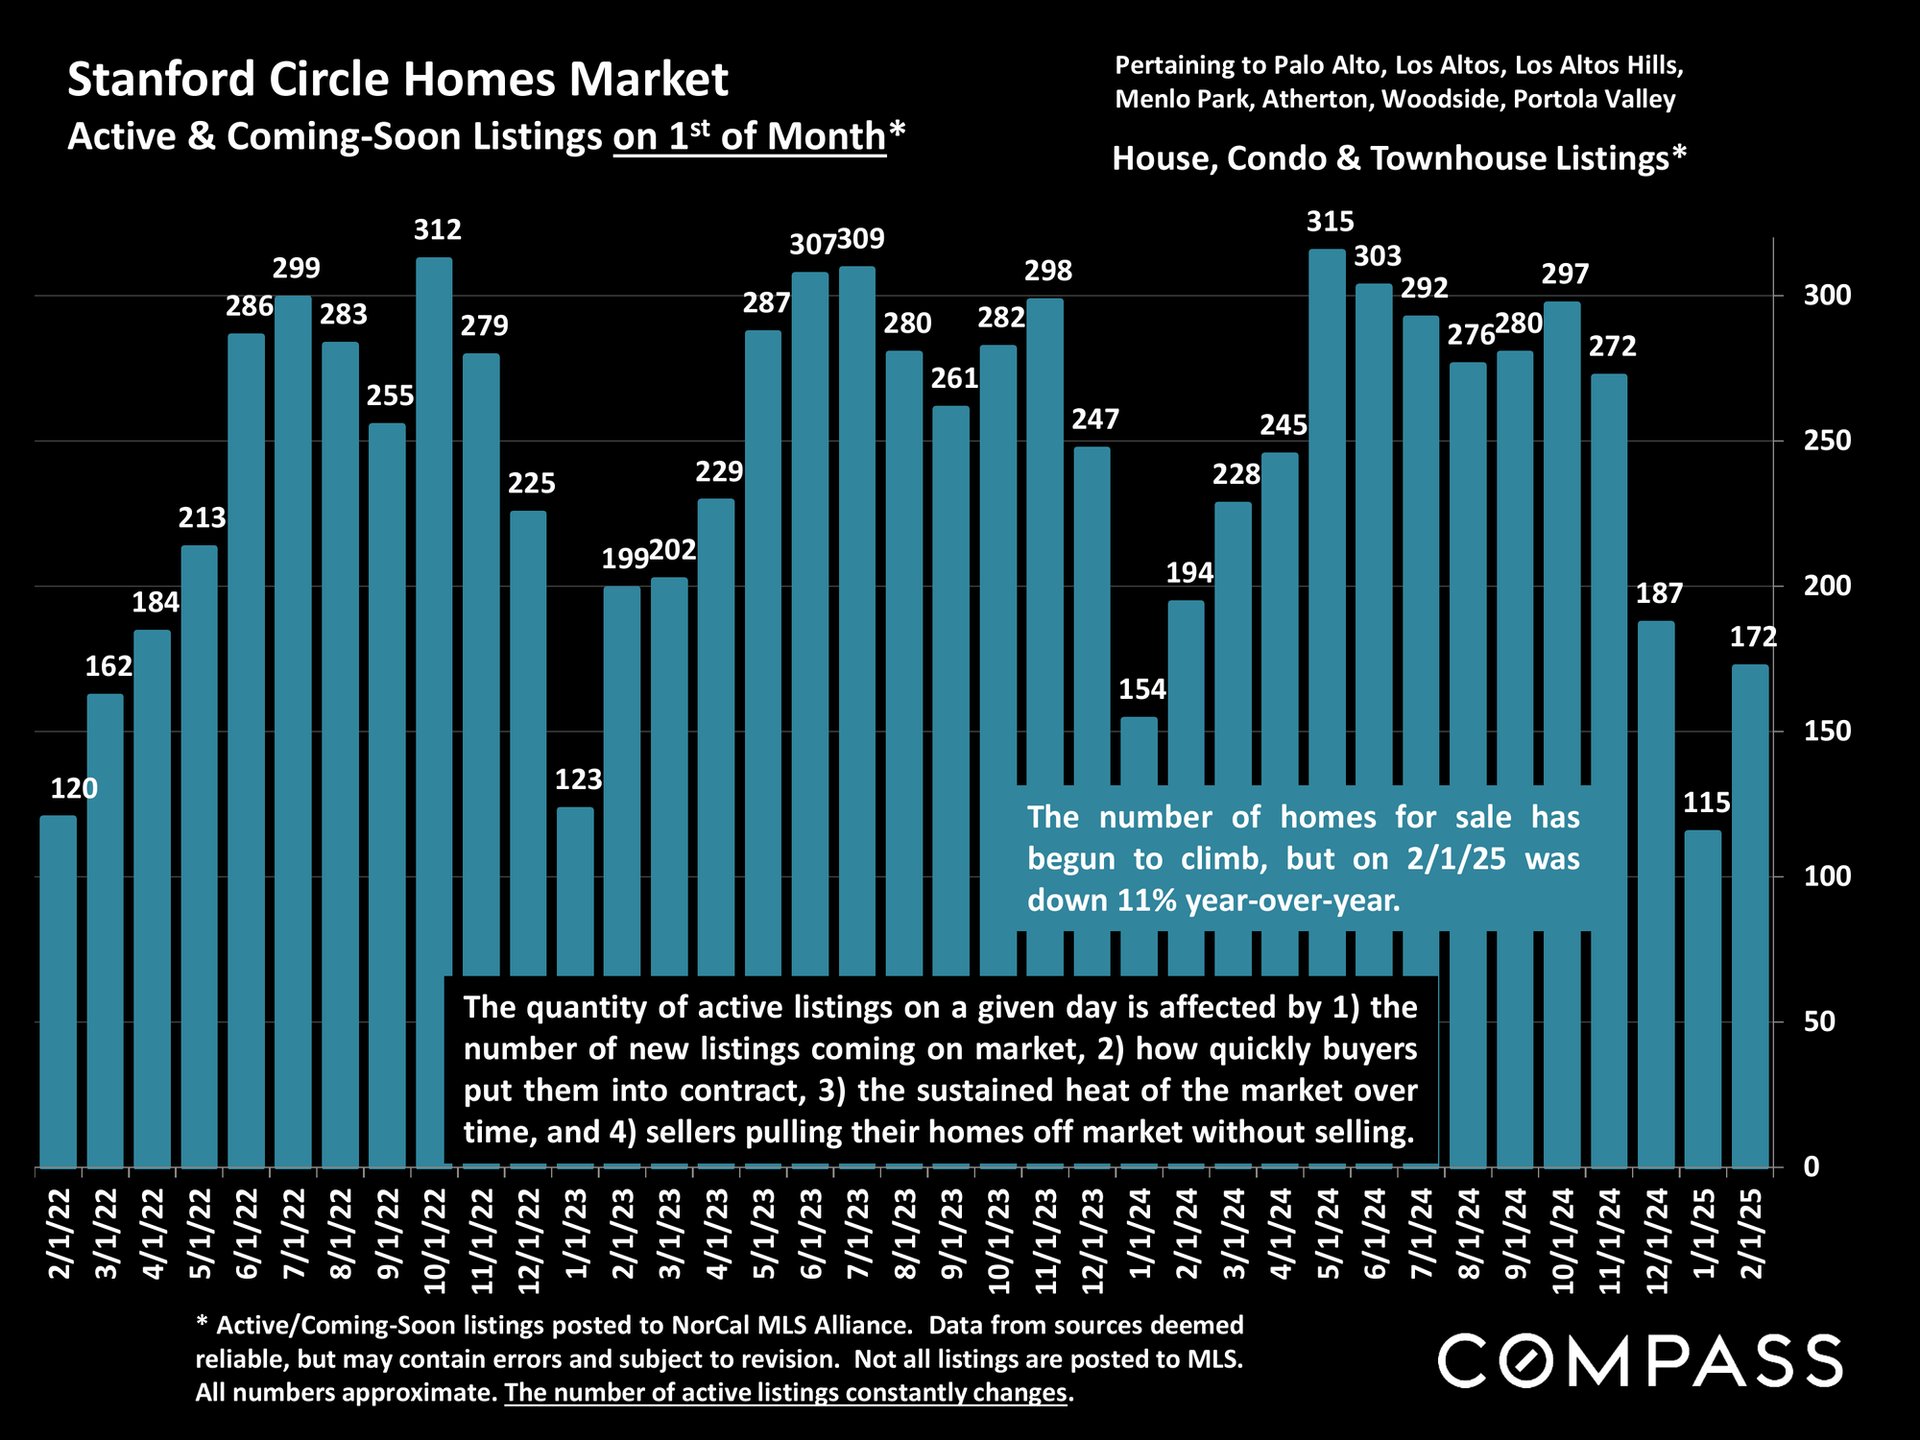
Chart of Stanford Circle home listings from February 2022 to February 2025; listings were down 11% year over year.
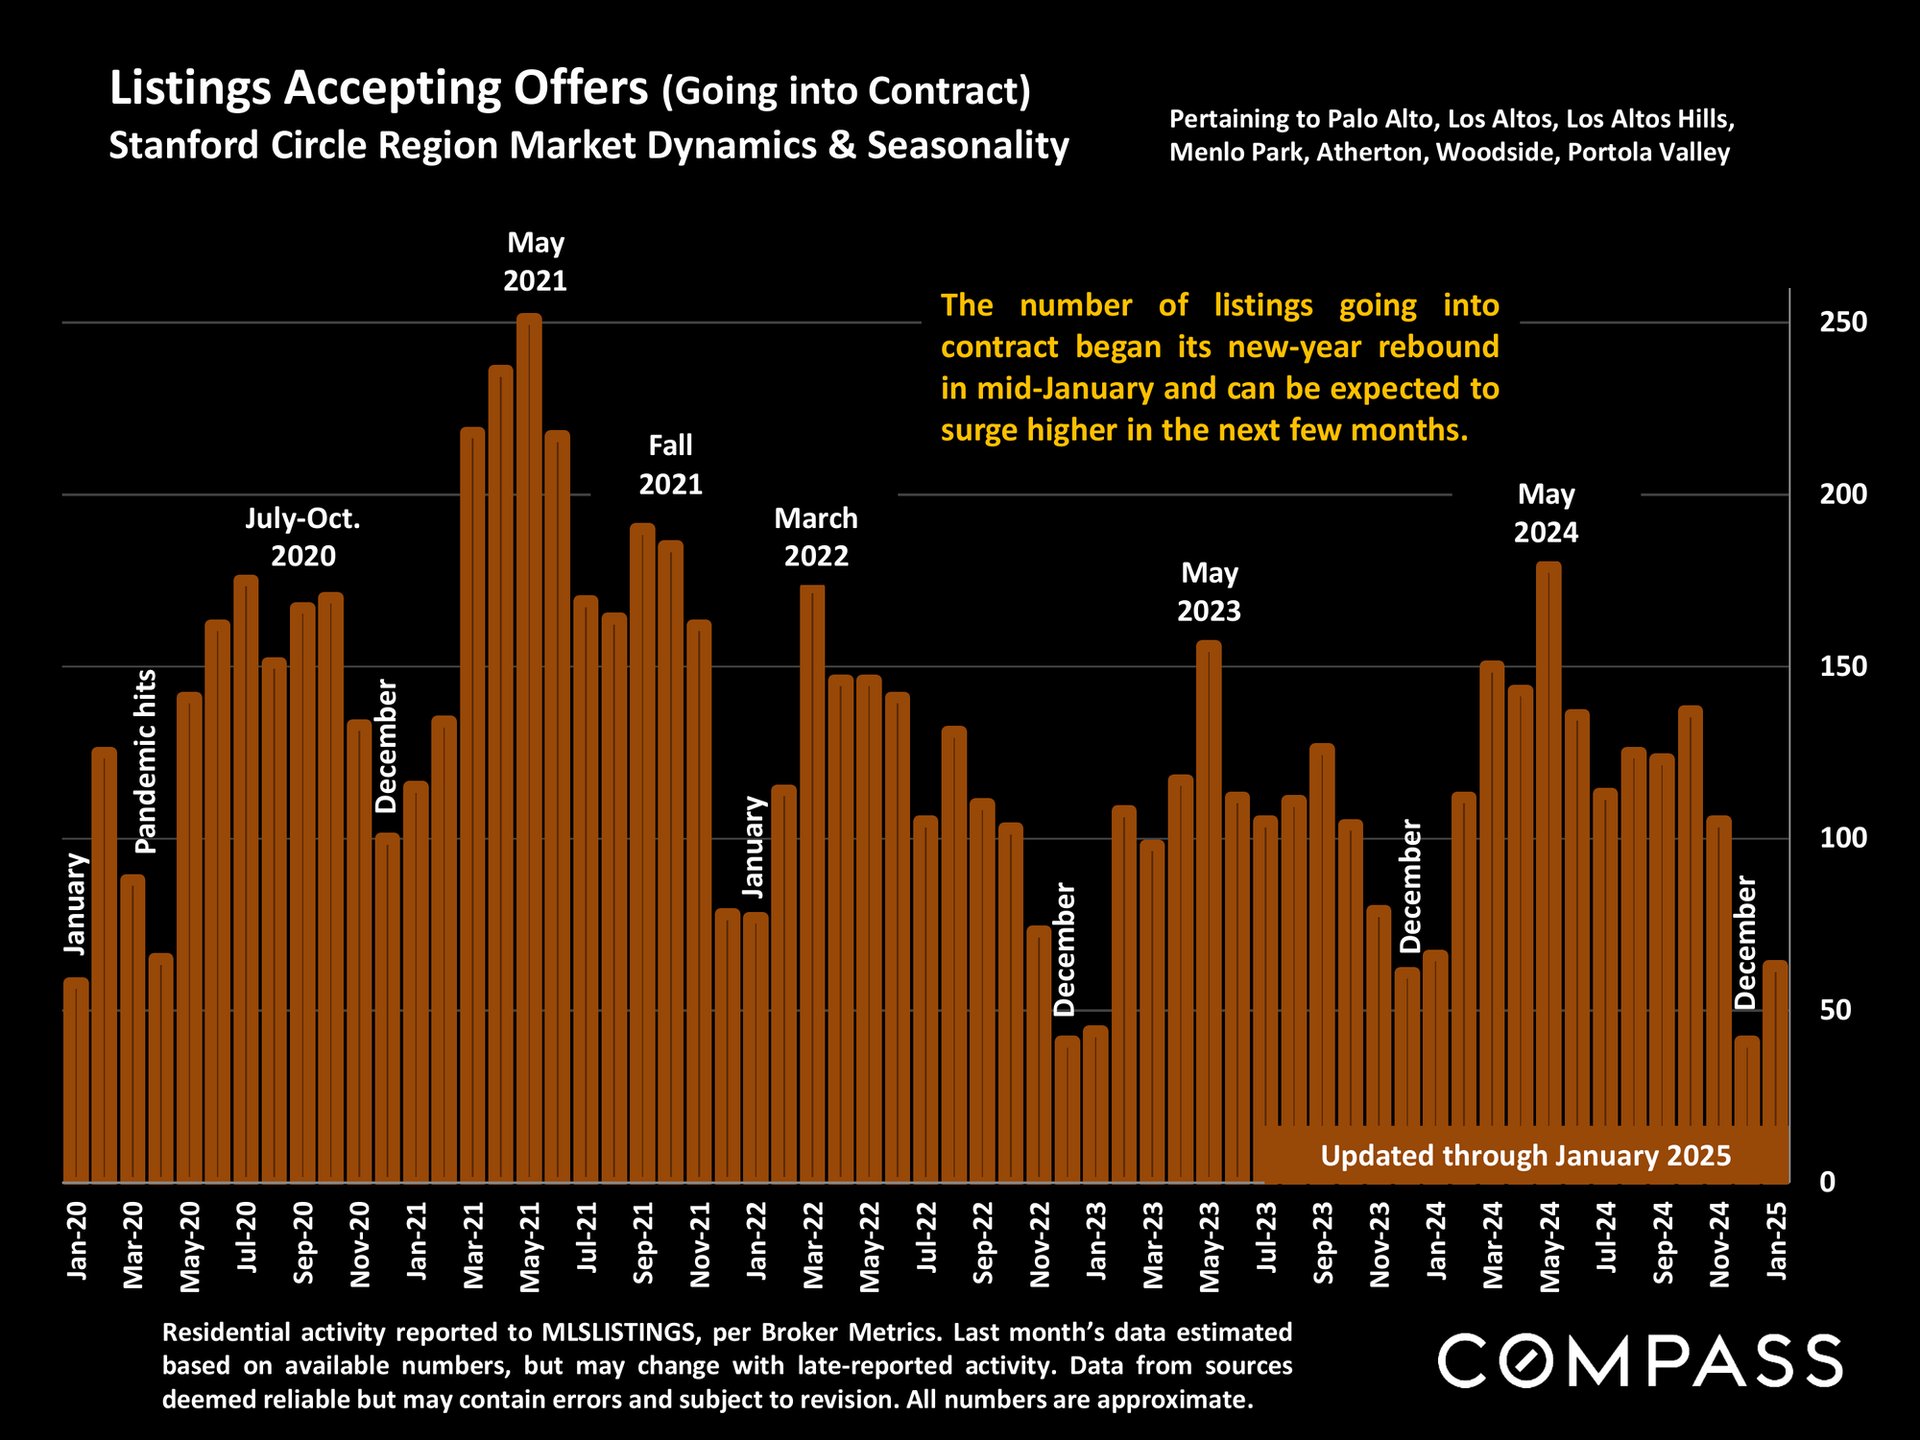
Stanford Circle regional listings going into contract, charted from 2020 through January 2025.
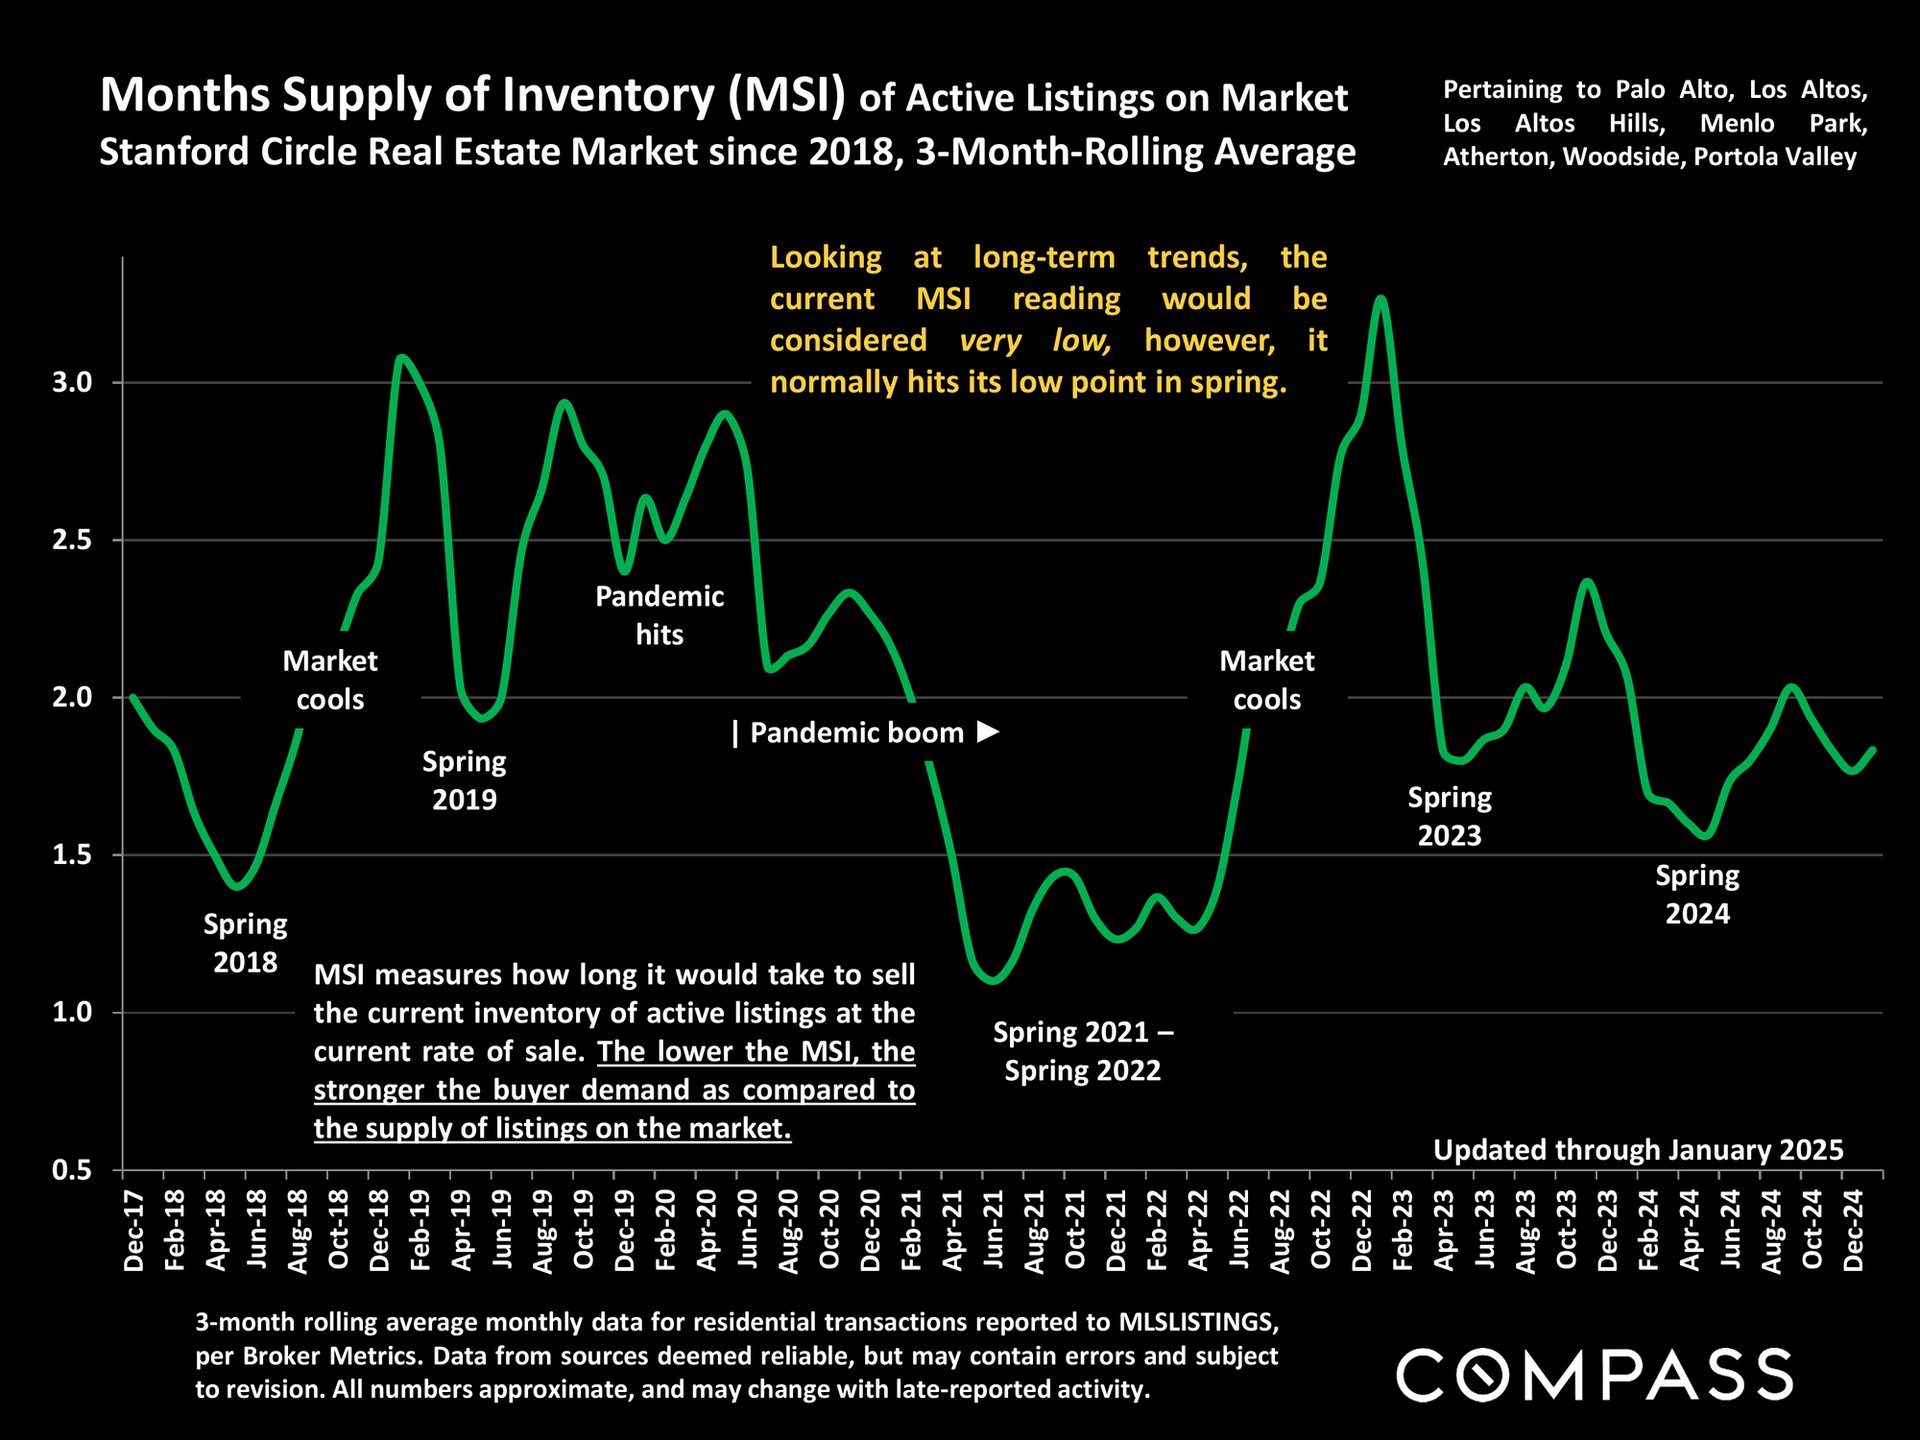
Chart of Stanford Circle active-listing supply, with a green trend line and annotations from 2017 to 2024.
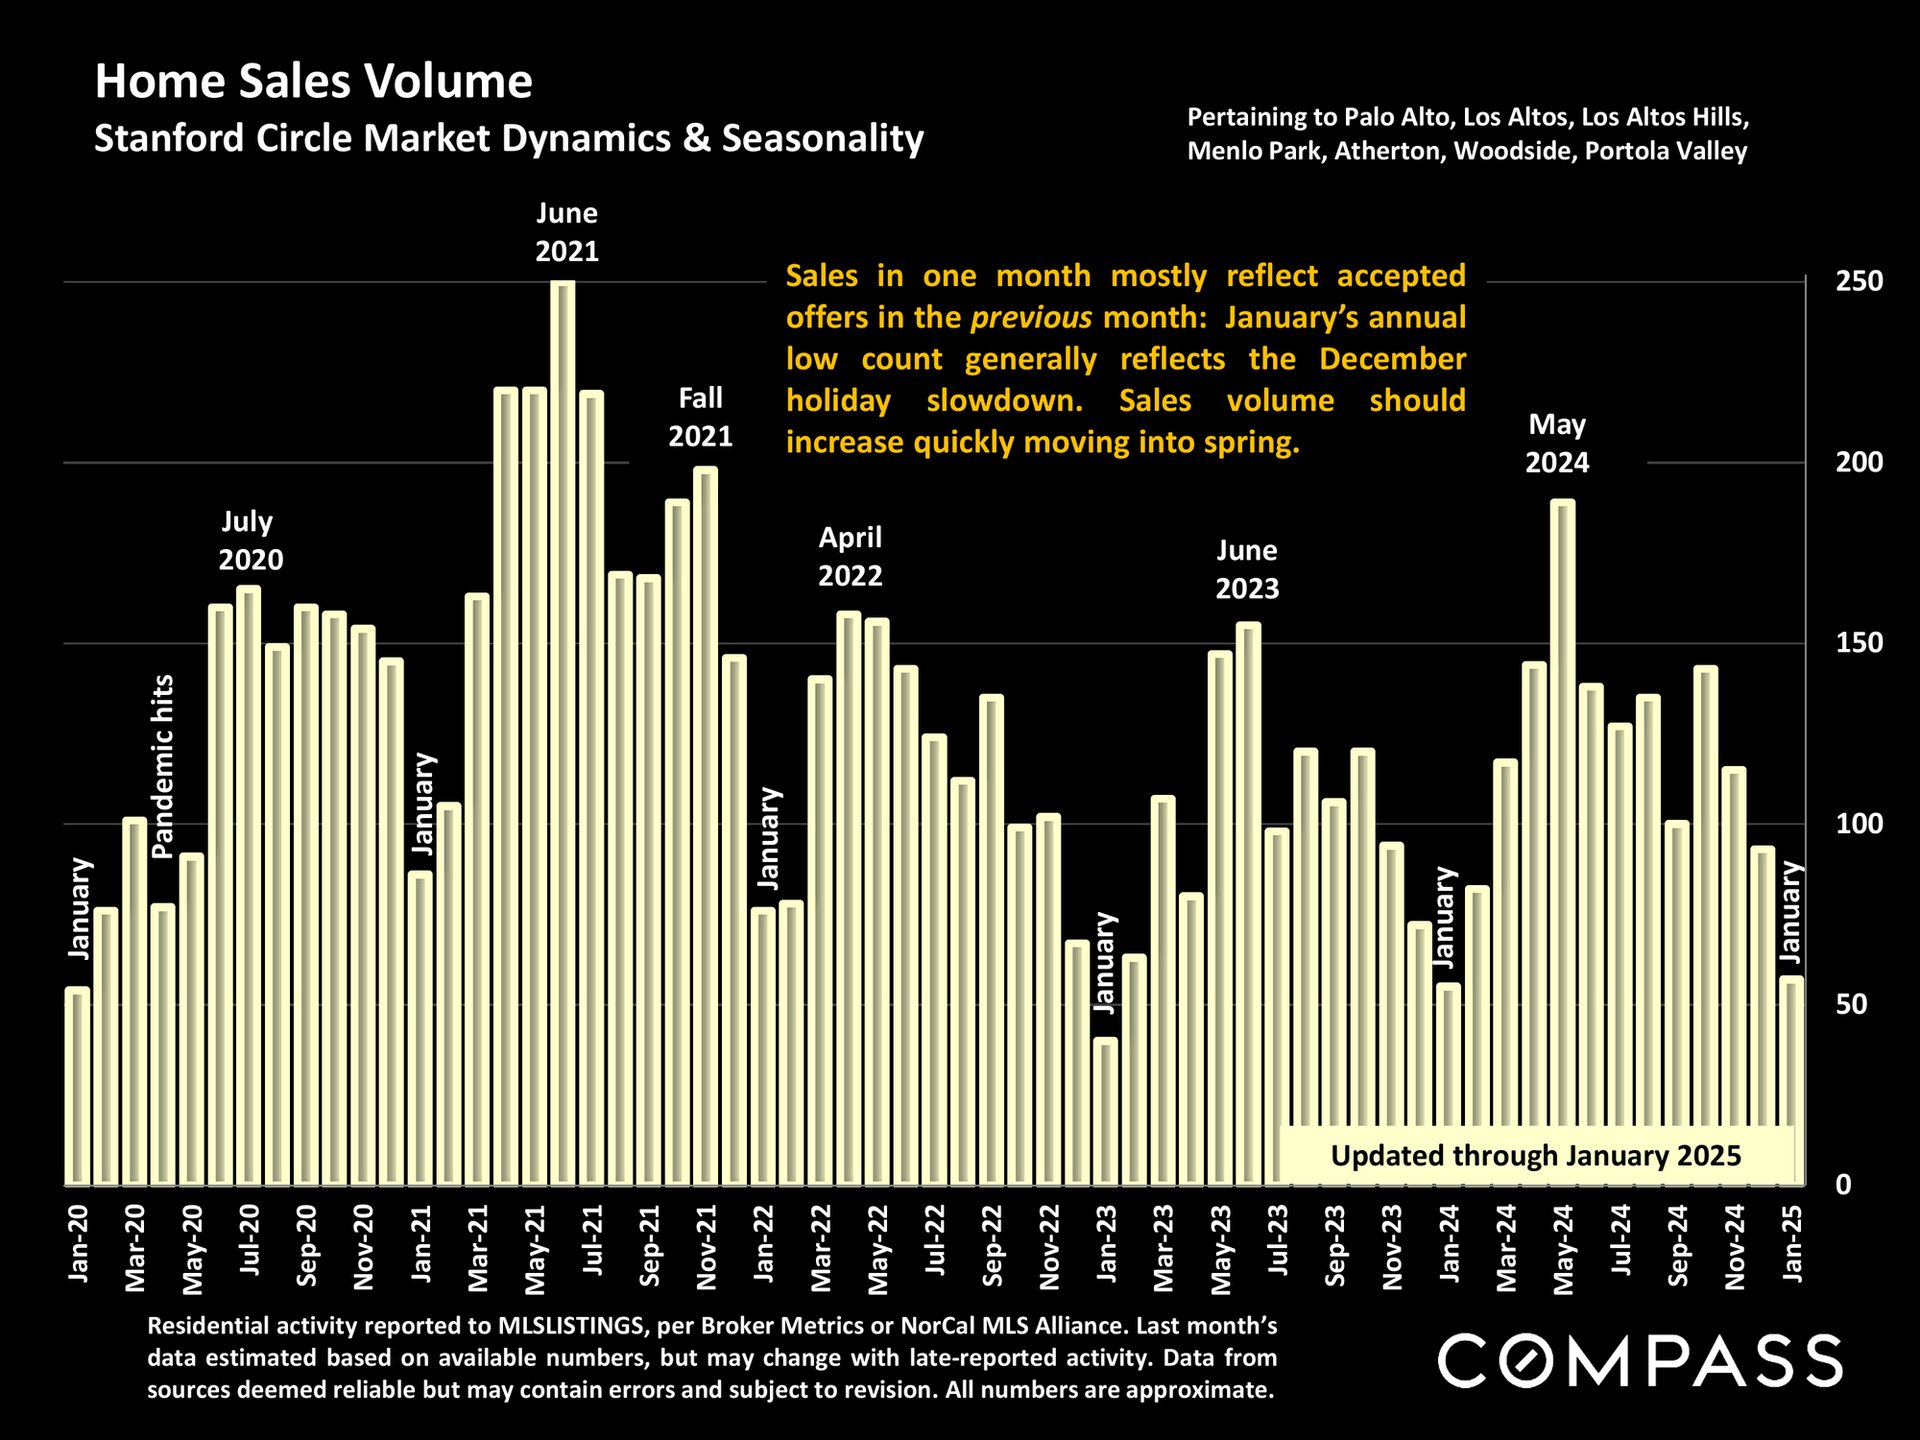
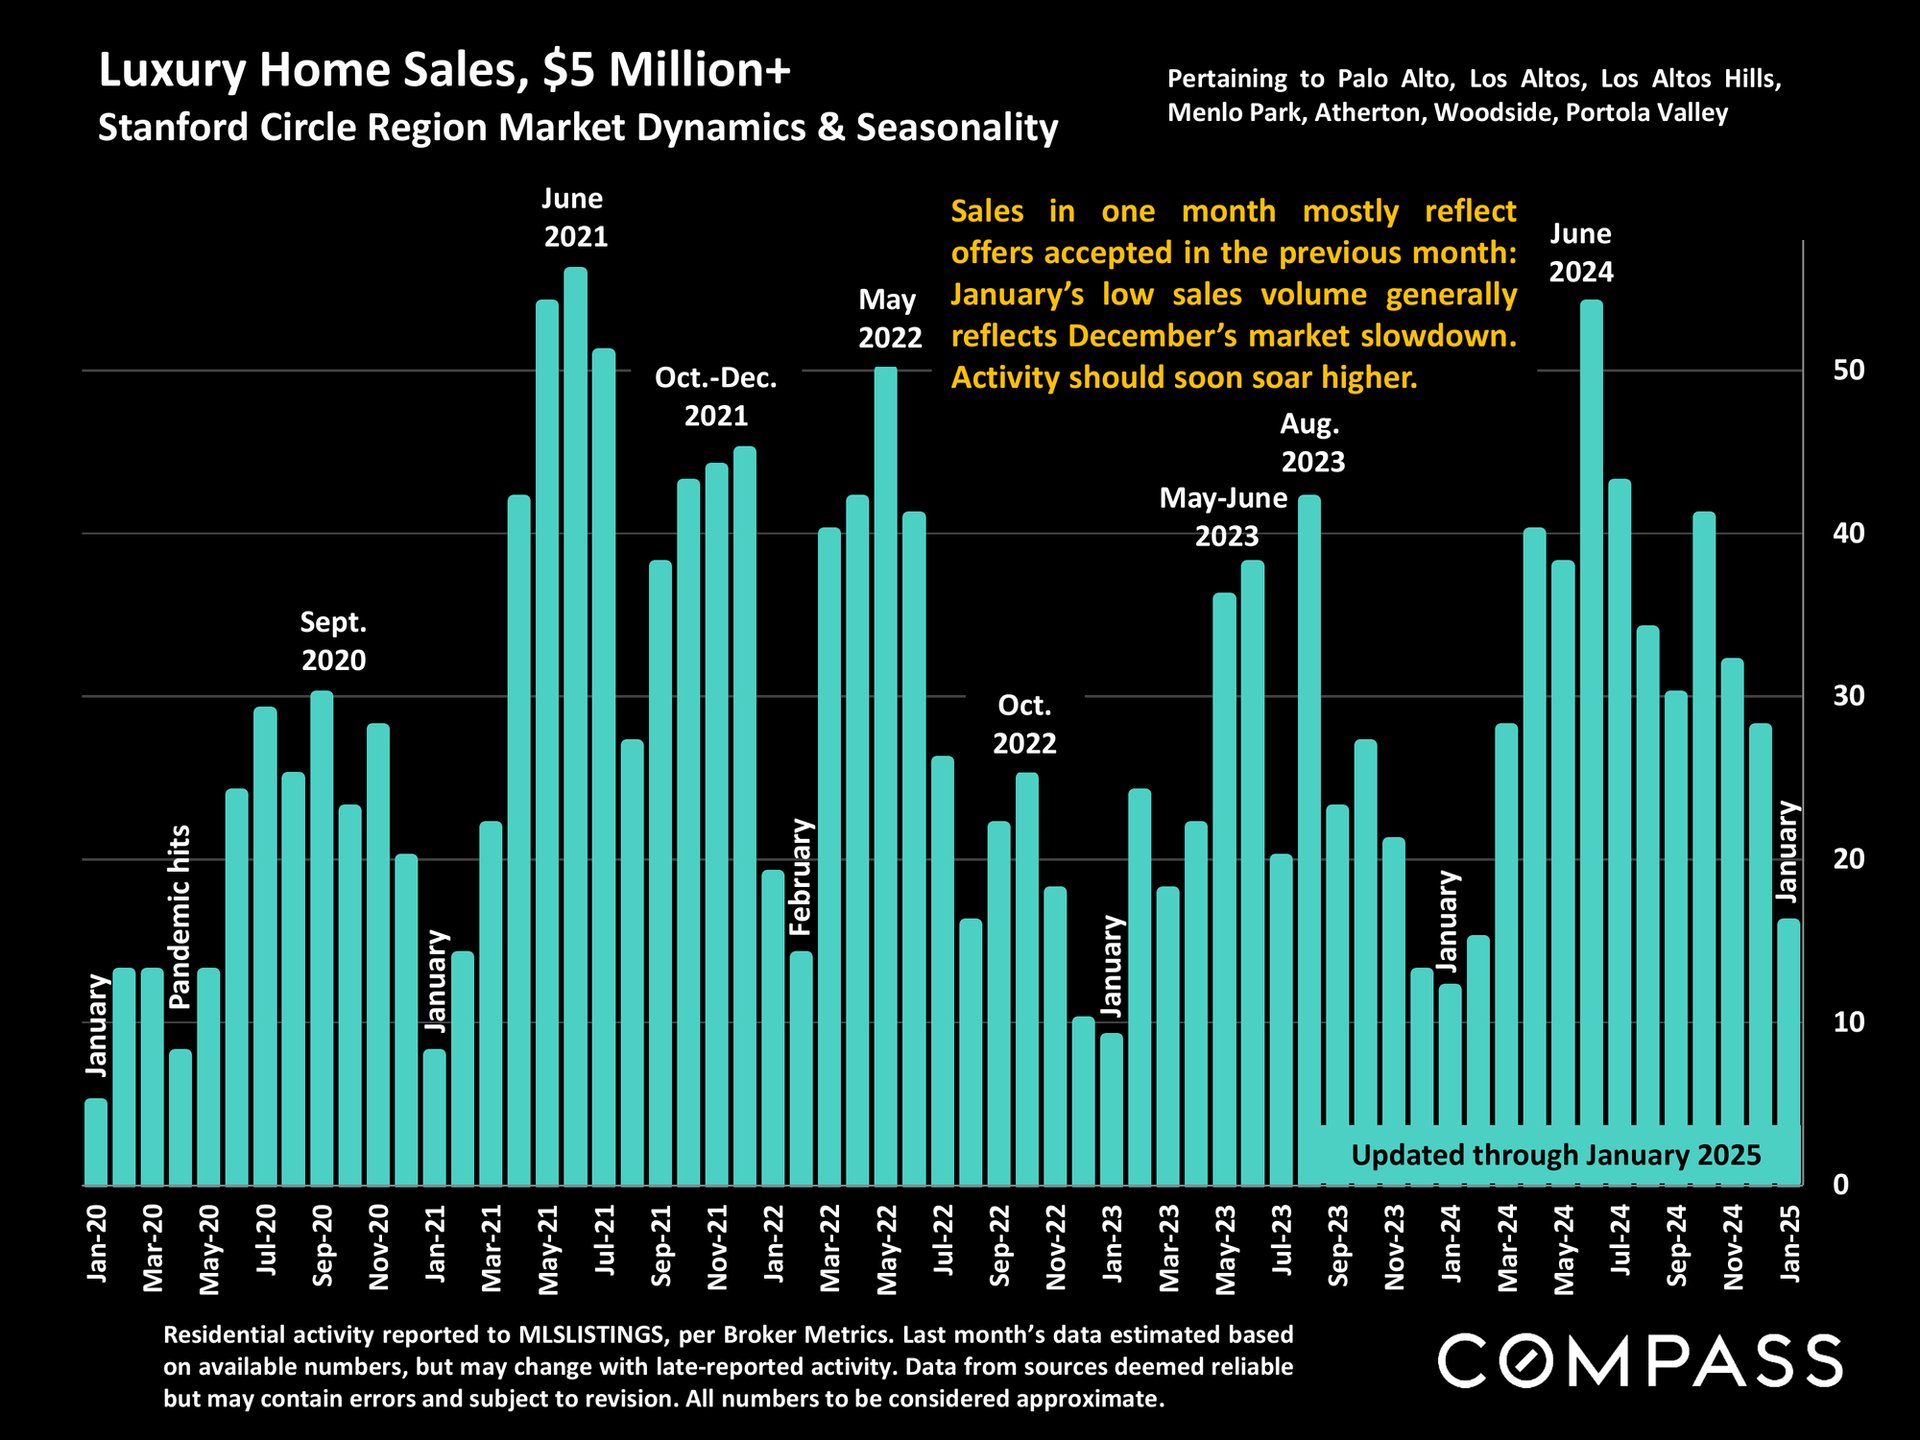
Bar chart of Stanford Circle monthly home sales, January 2020–January 2025, highlighting seasonal peaks and a June 2021 high.Chart of monthly $5 million-plus home sales activity in the Stanford Circle region, January 2020–January 2025.
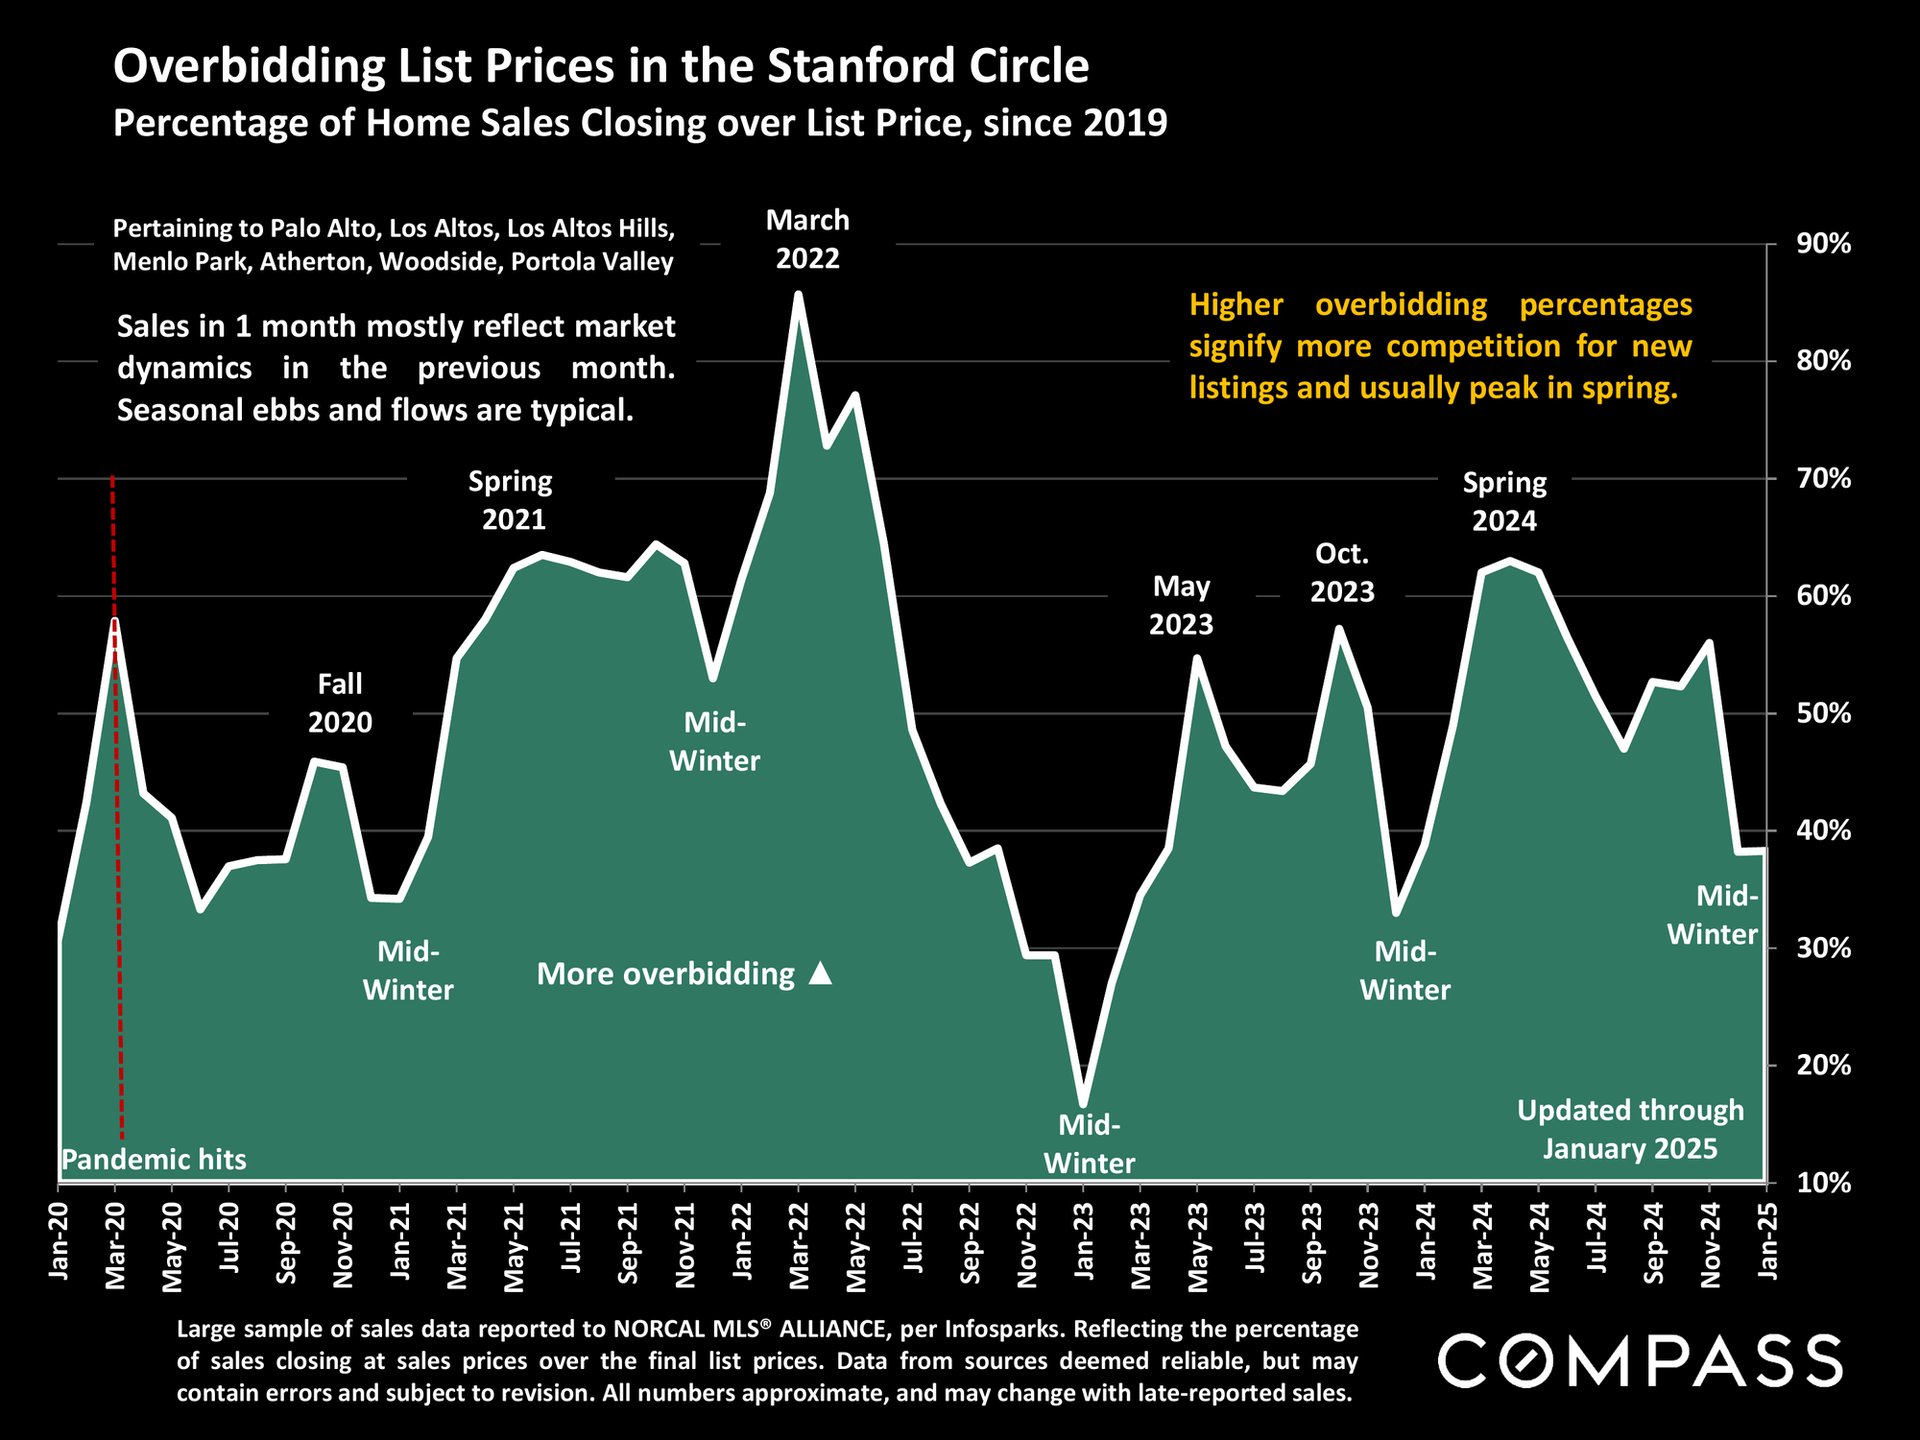
Stanford Circle chart of home sales closing over list price, peaking in March 2022 and updated through January 2025.
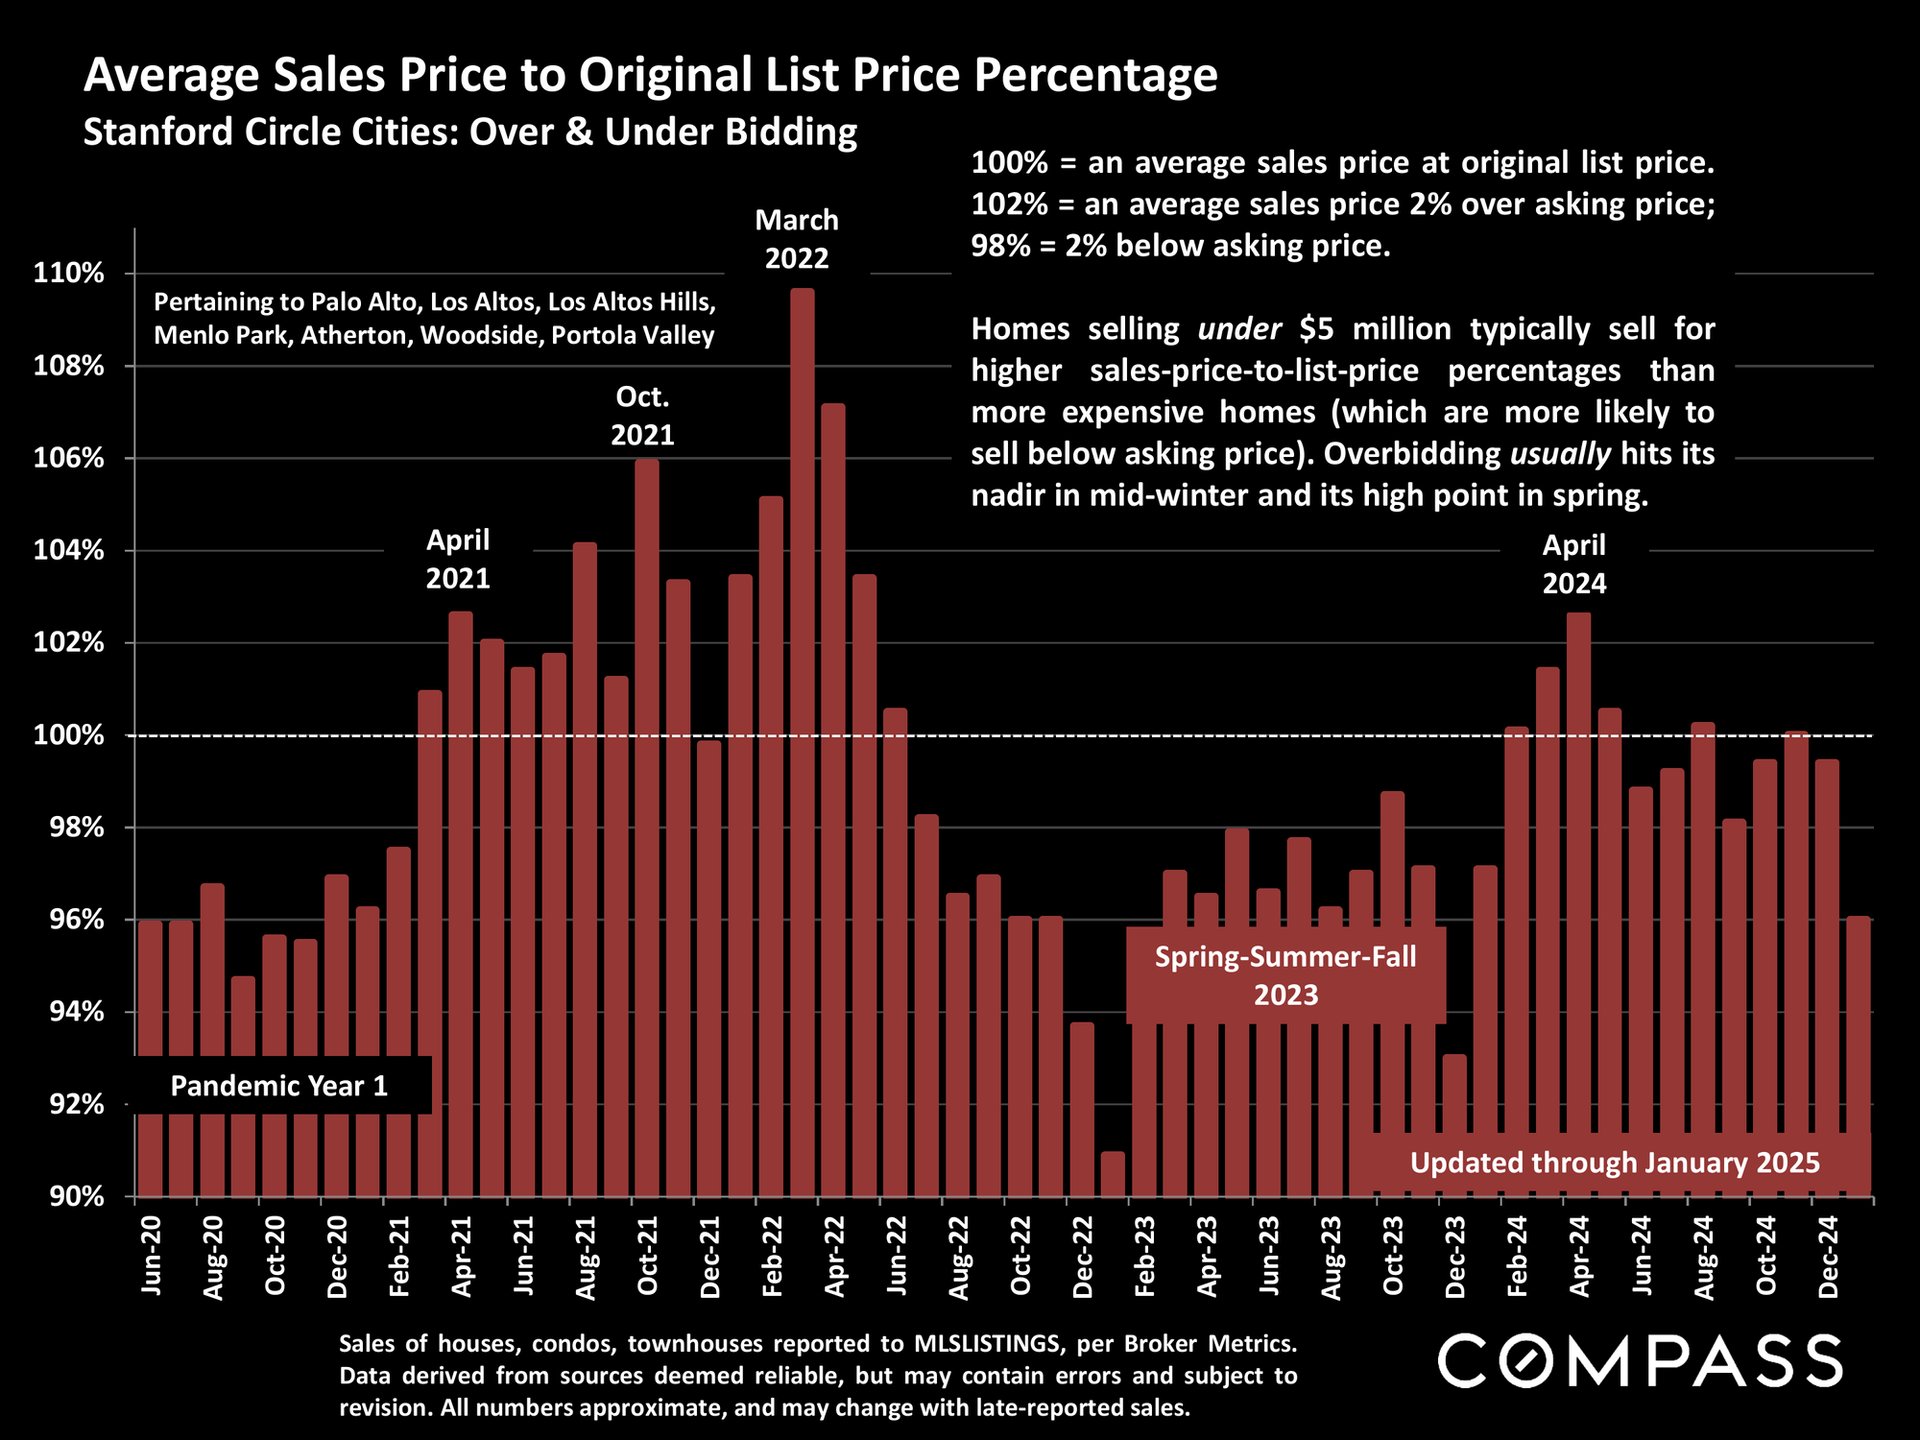
Chart of Stanford Circle home sale prices versus original list prices, June 2020–December 2024; peak overbidding was in March 2022.
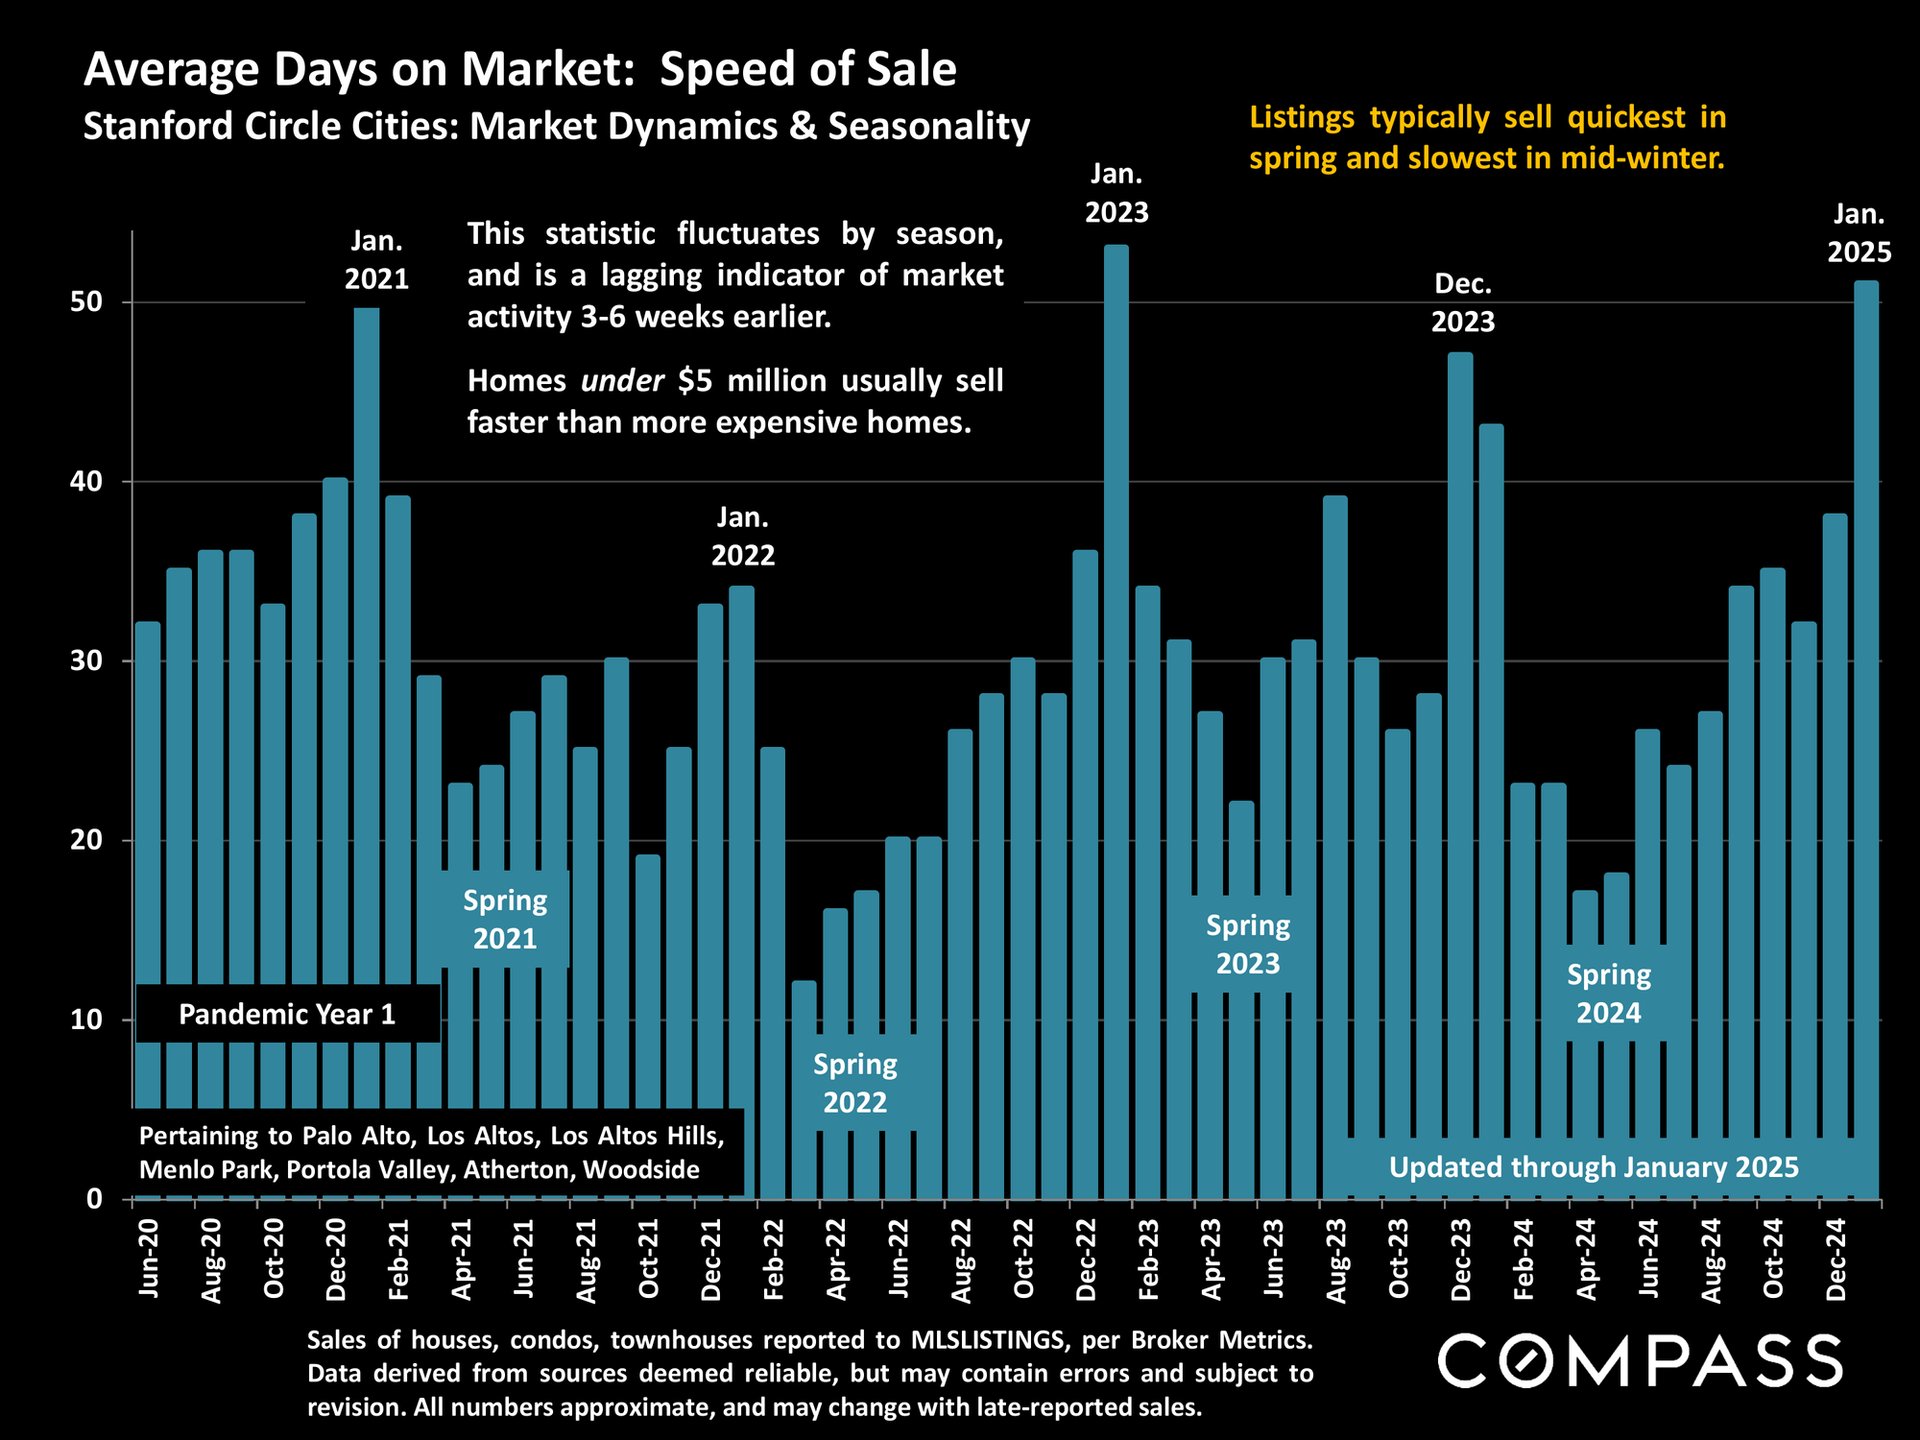
Bar chart of monthly days on market in Stanford Circle cities, June 2020 to January 2025, with seasonal trends.
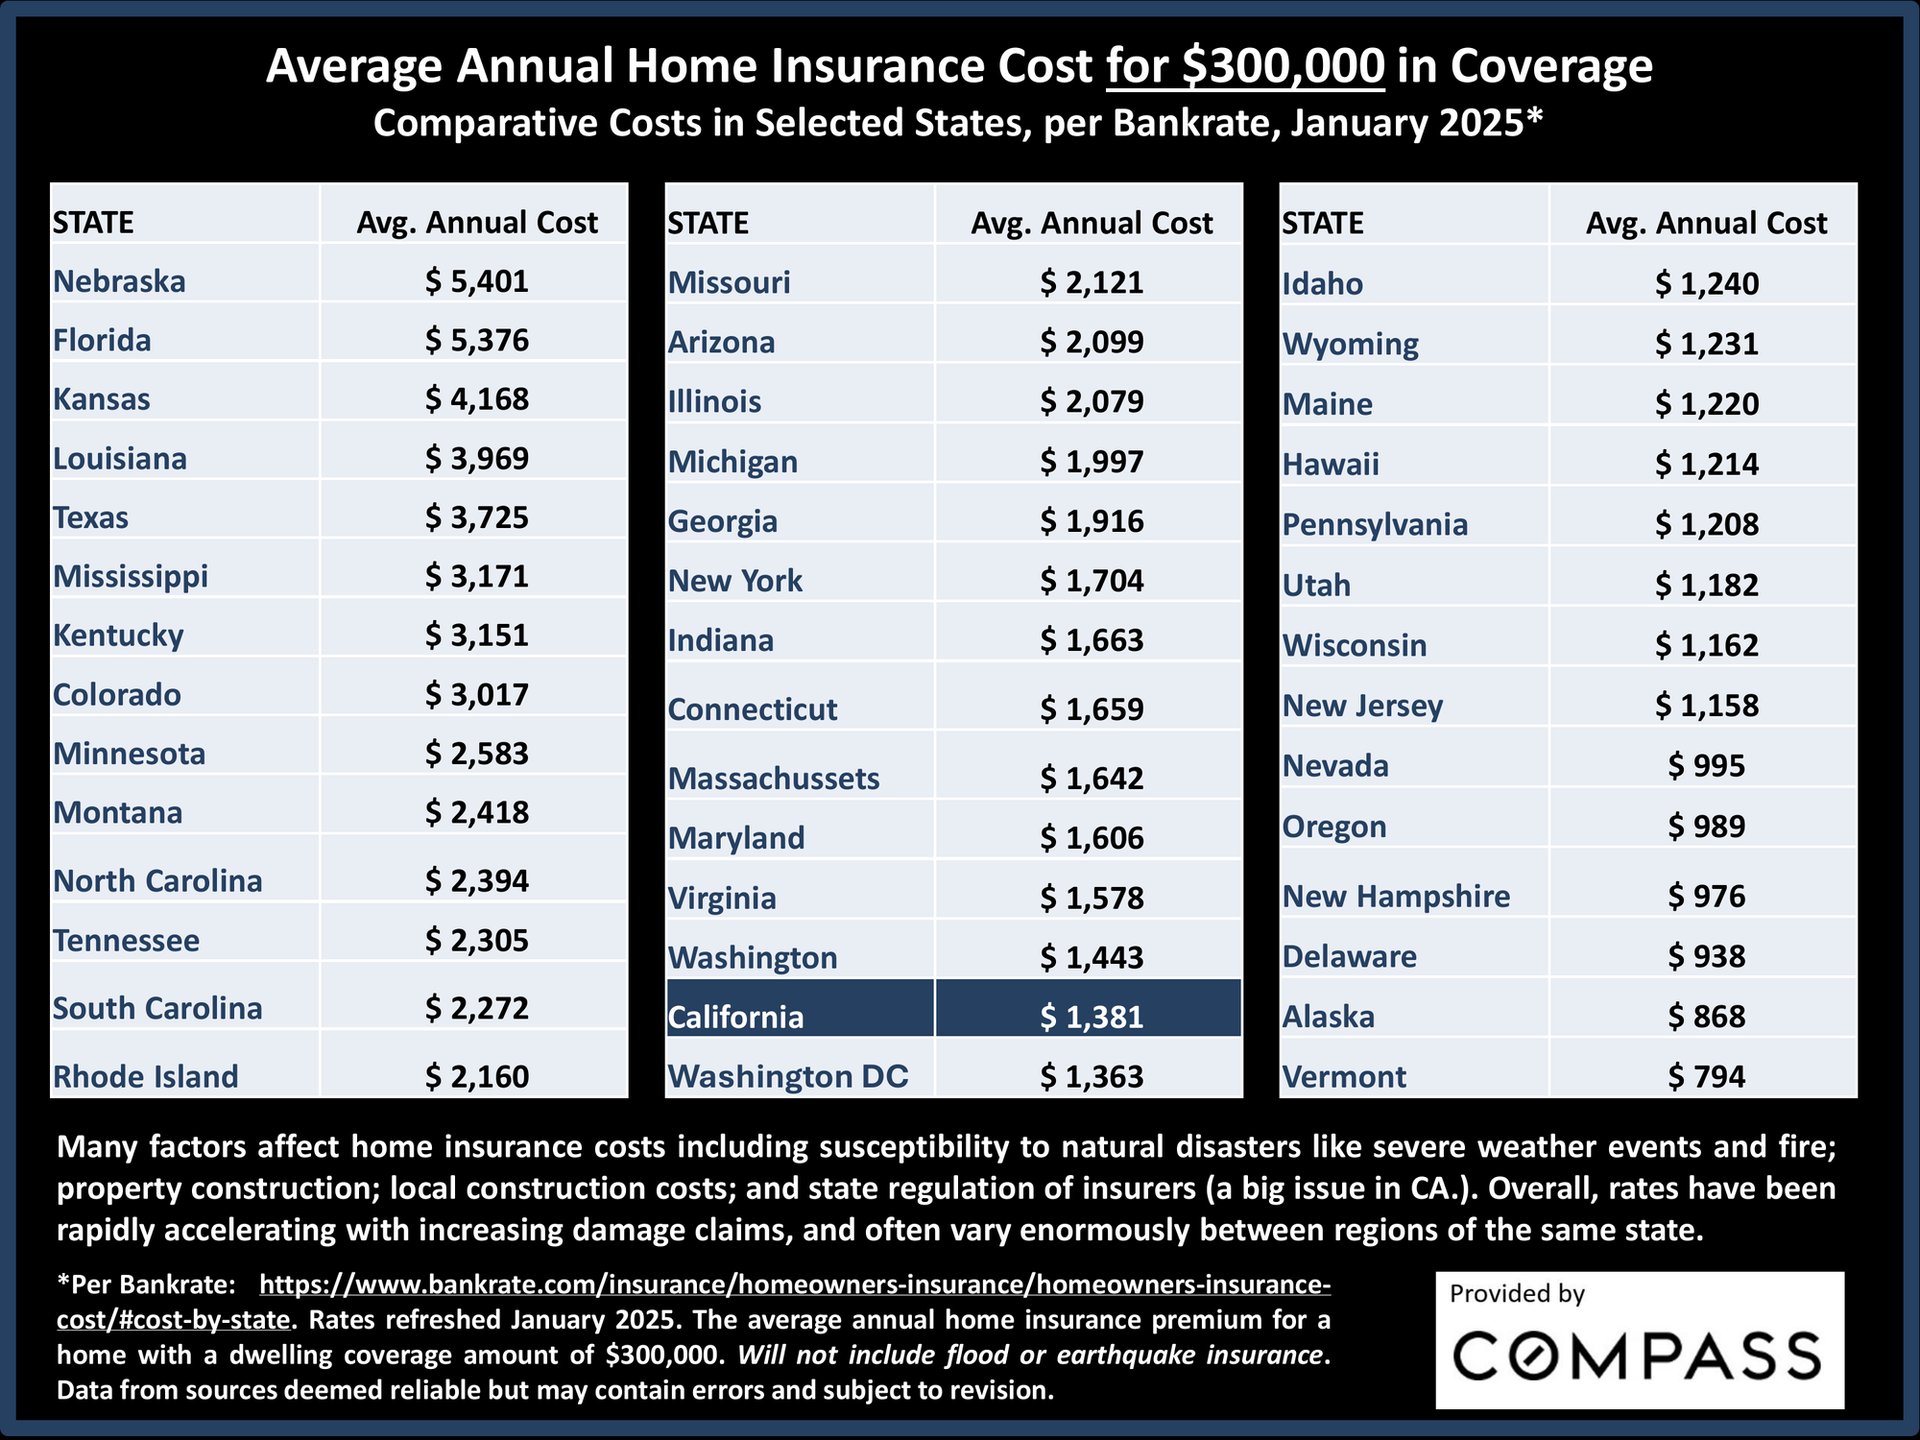
Infographic comparing annual home insurance costs by state, with California highlighted at $1,381.
Bar chart of Stanford Circle cities’ median home prices, rising from $725,000 in 1998 to $4.16 million in 2024.
Chart of Stanford Circle annual median house price appreciation, showing 1999–2024 changes and major market booms and crashes.
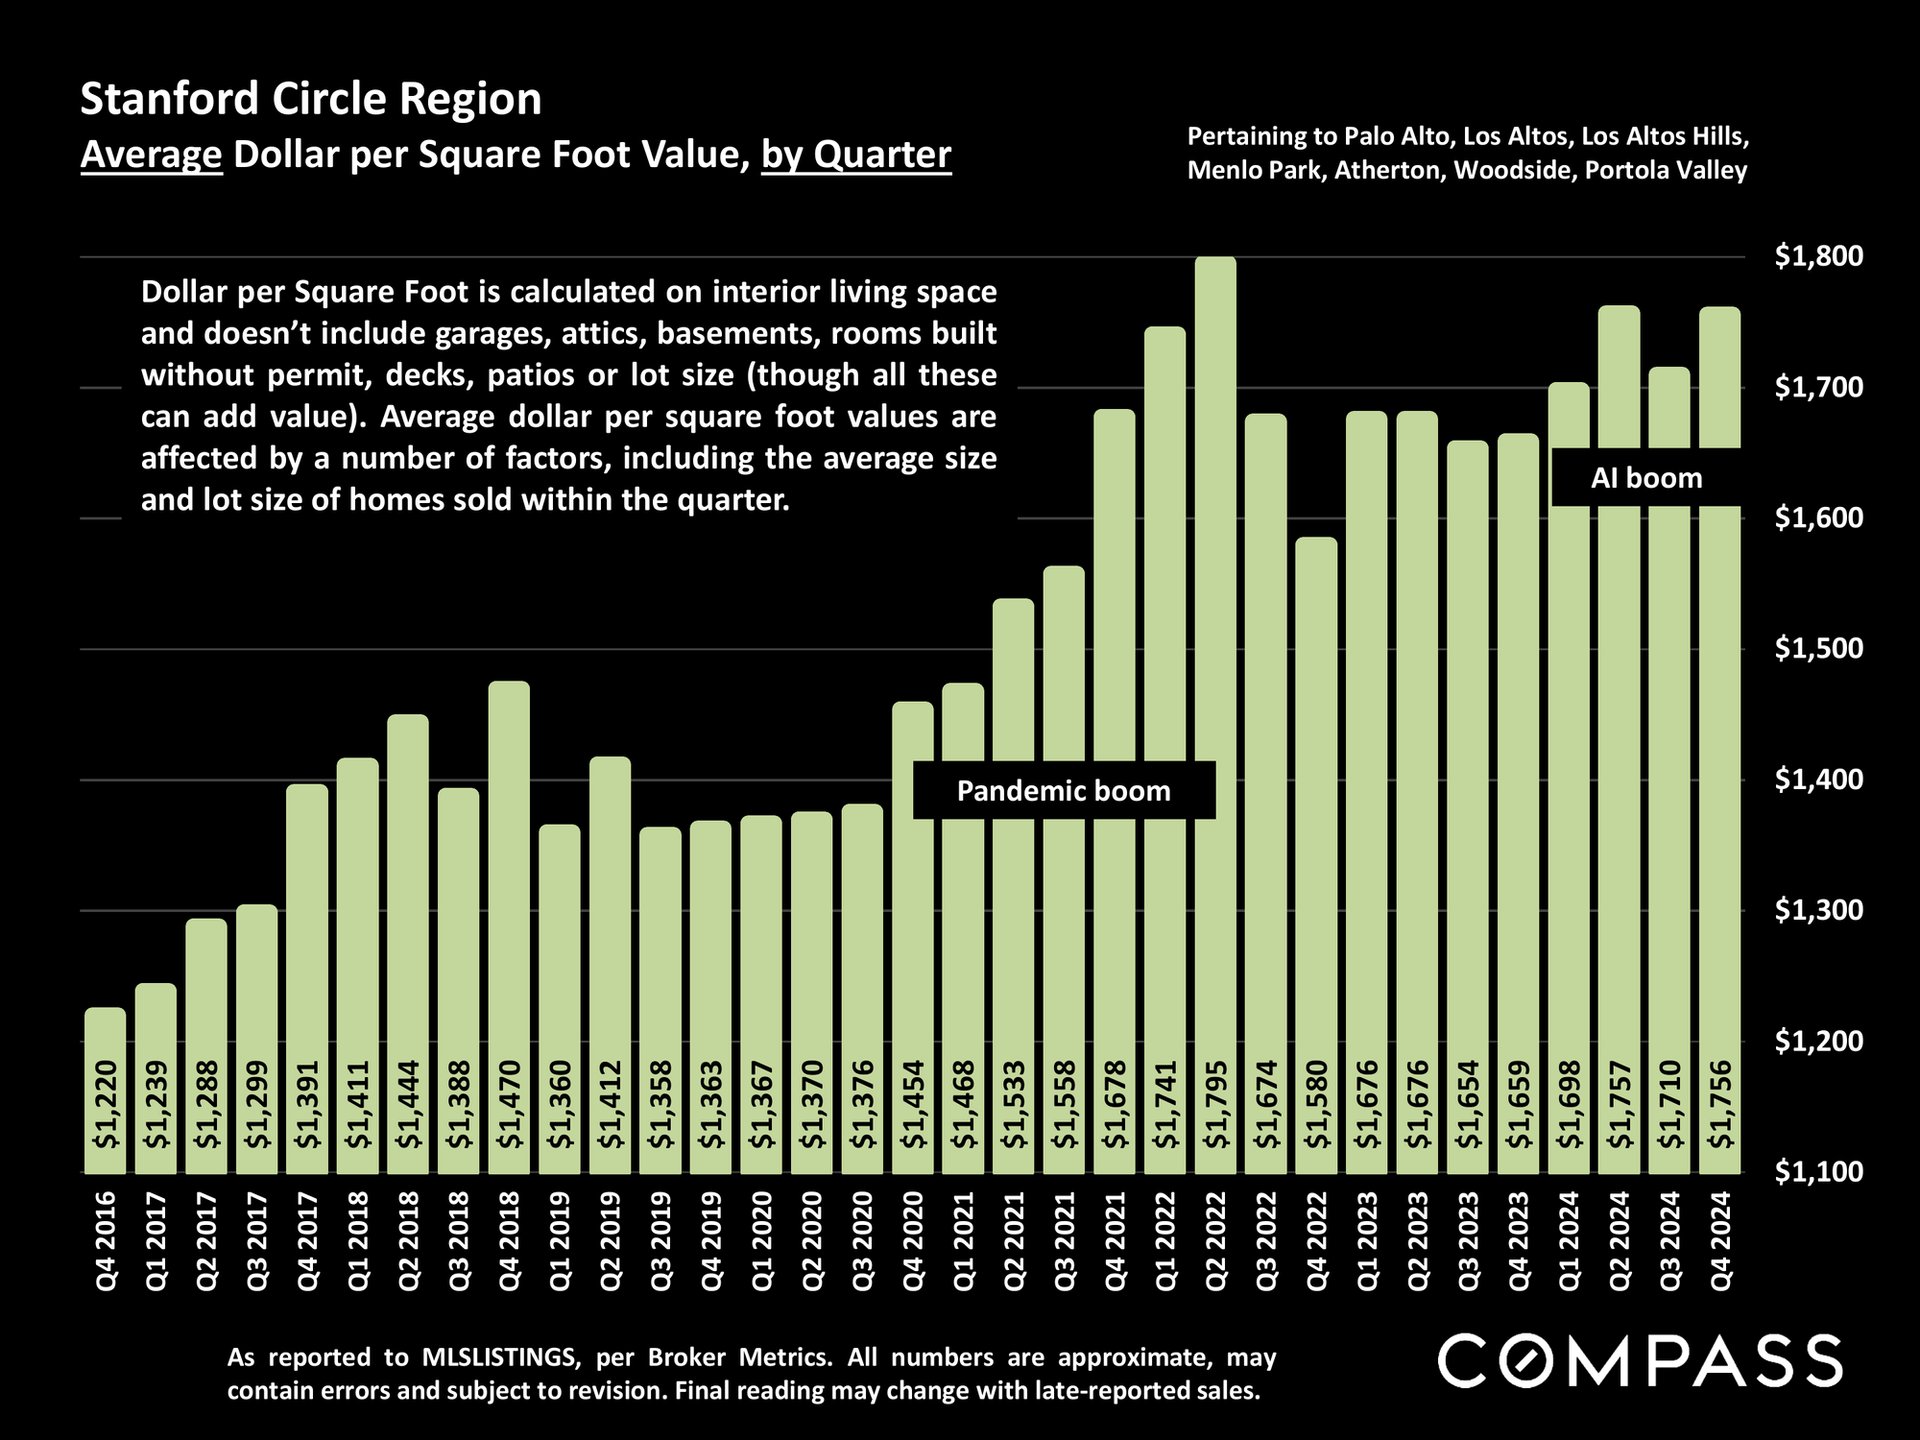
Stanford Circle quarterly average price per square foot chart, showing values from Q4 2016 to Q4 2024.
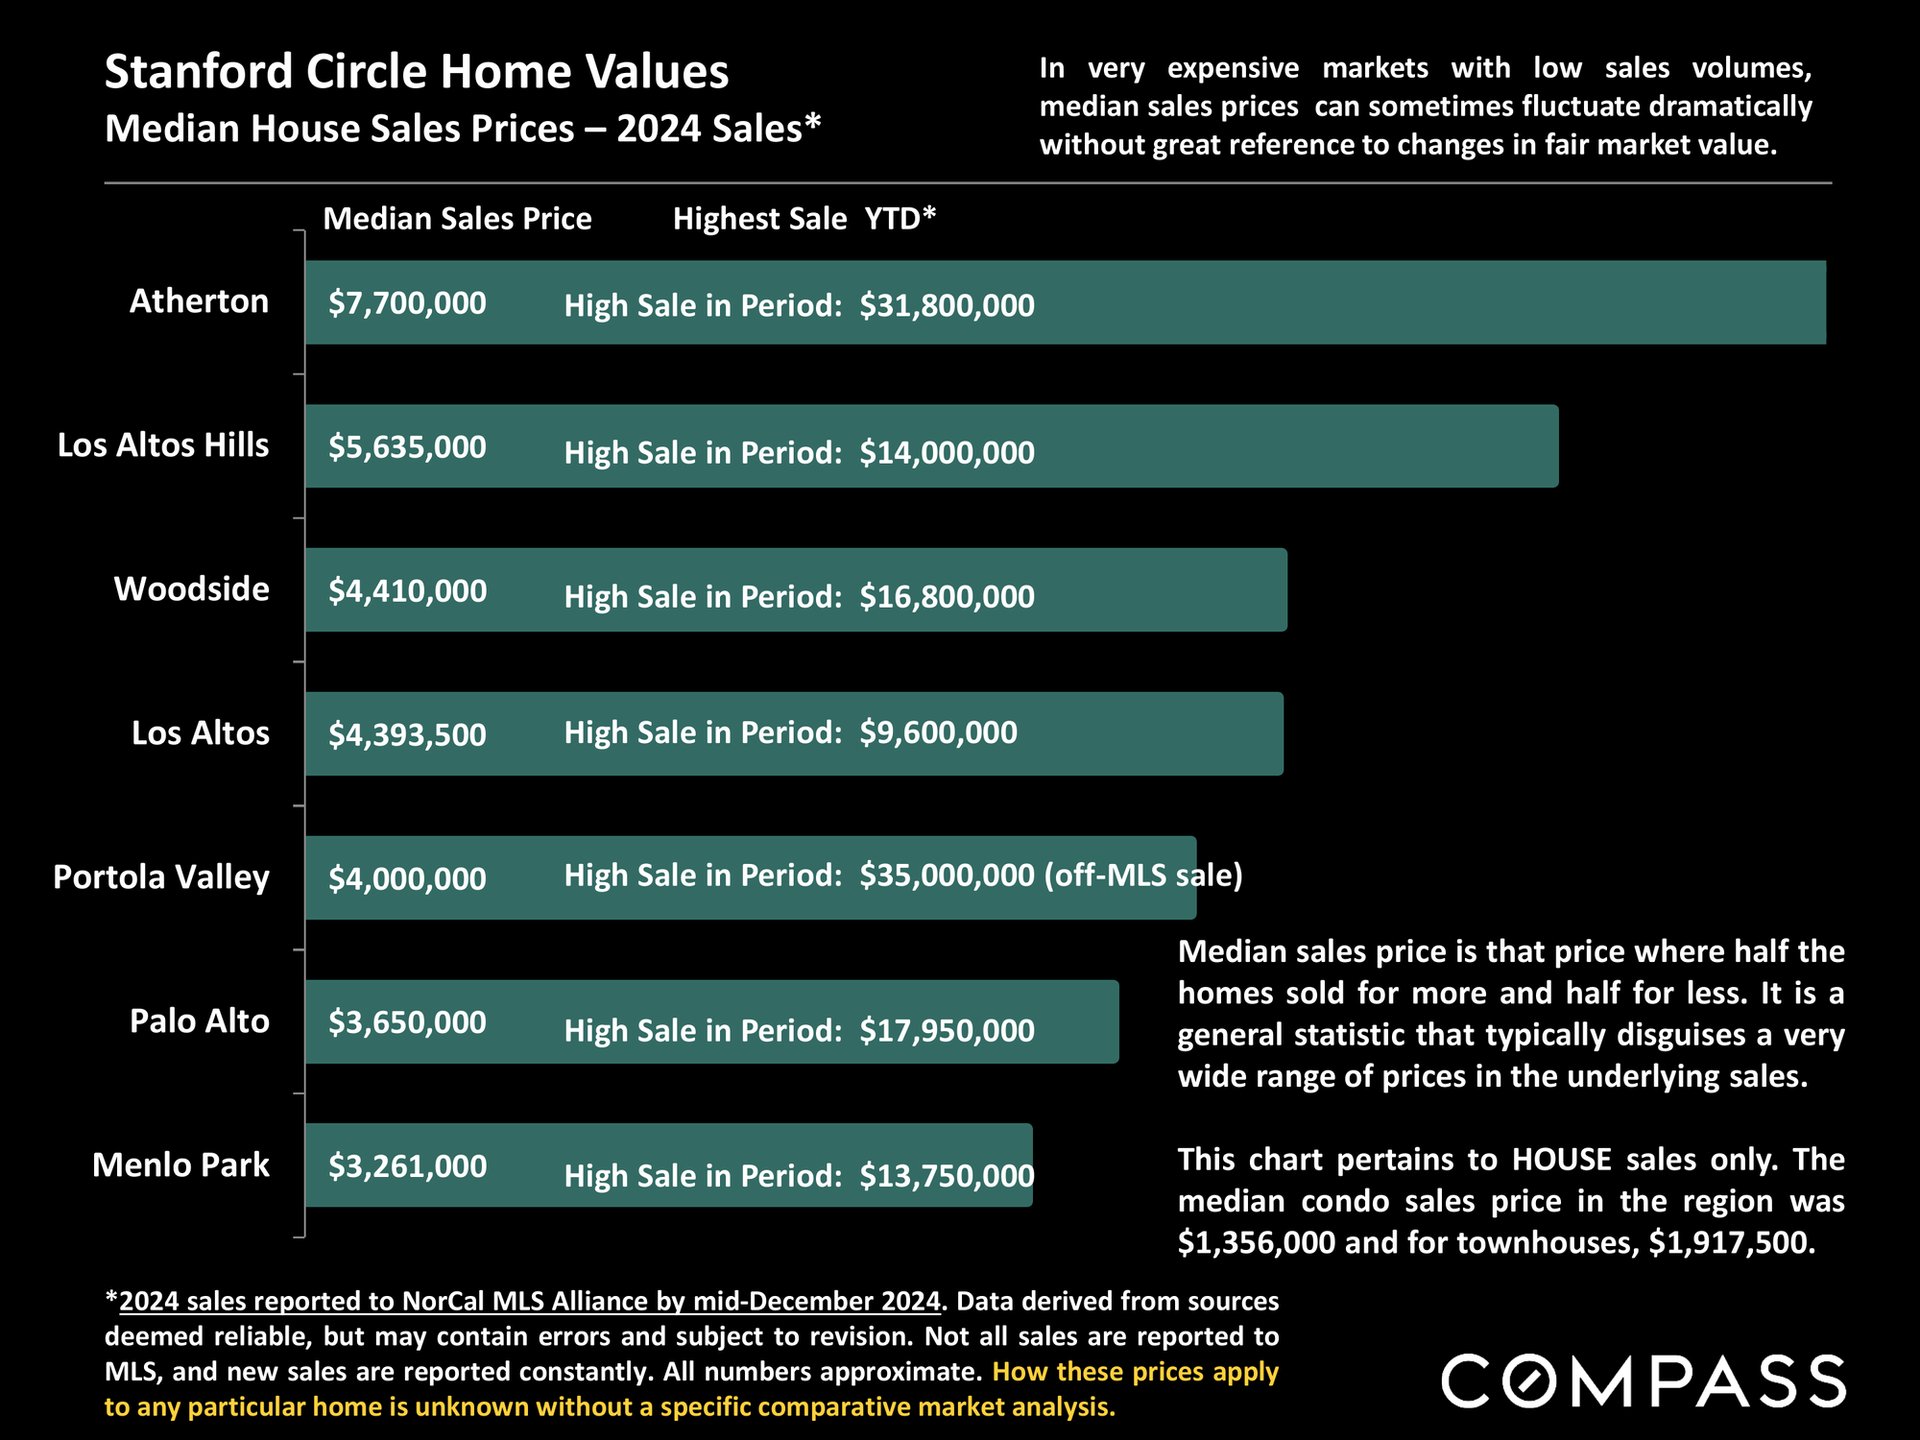
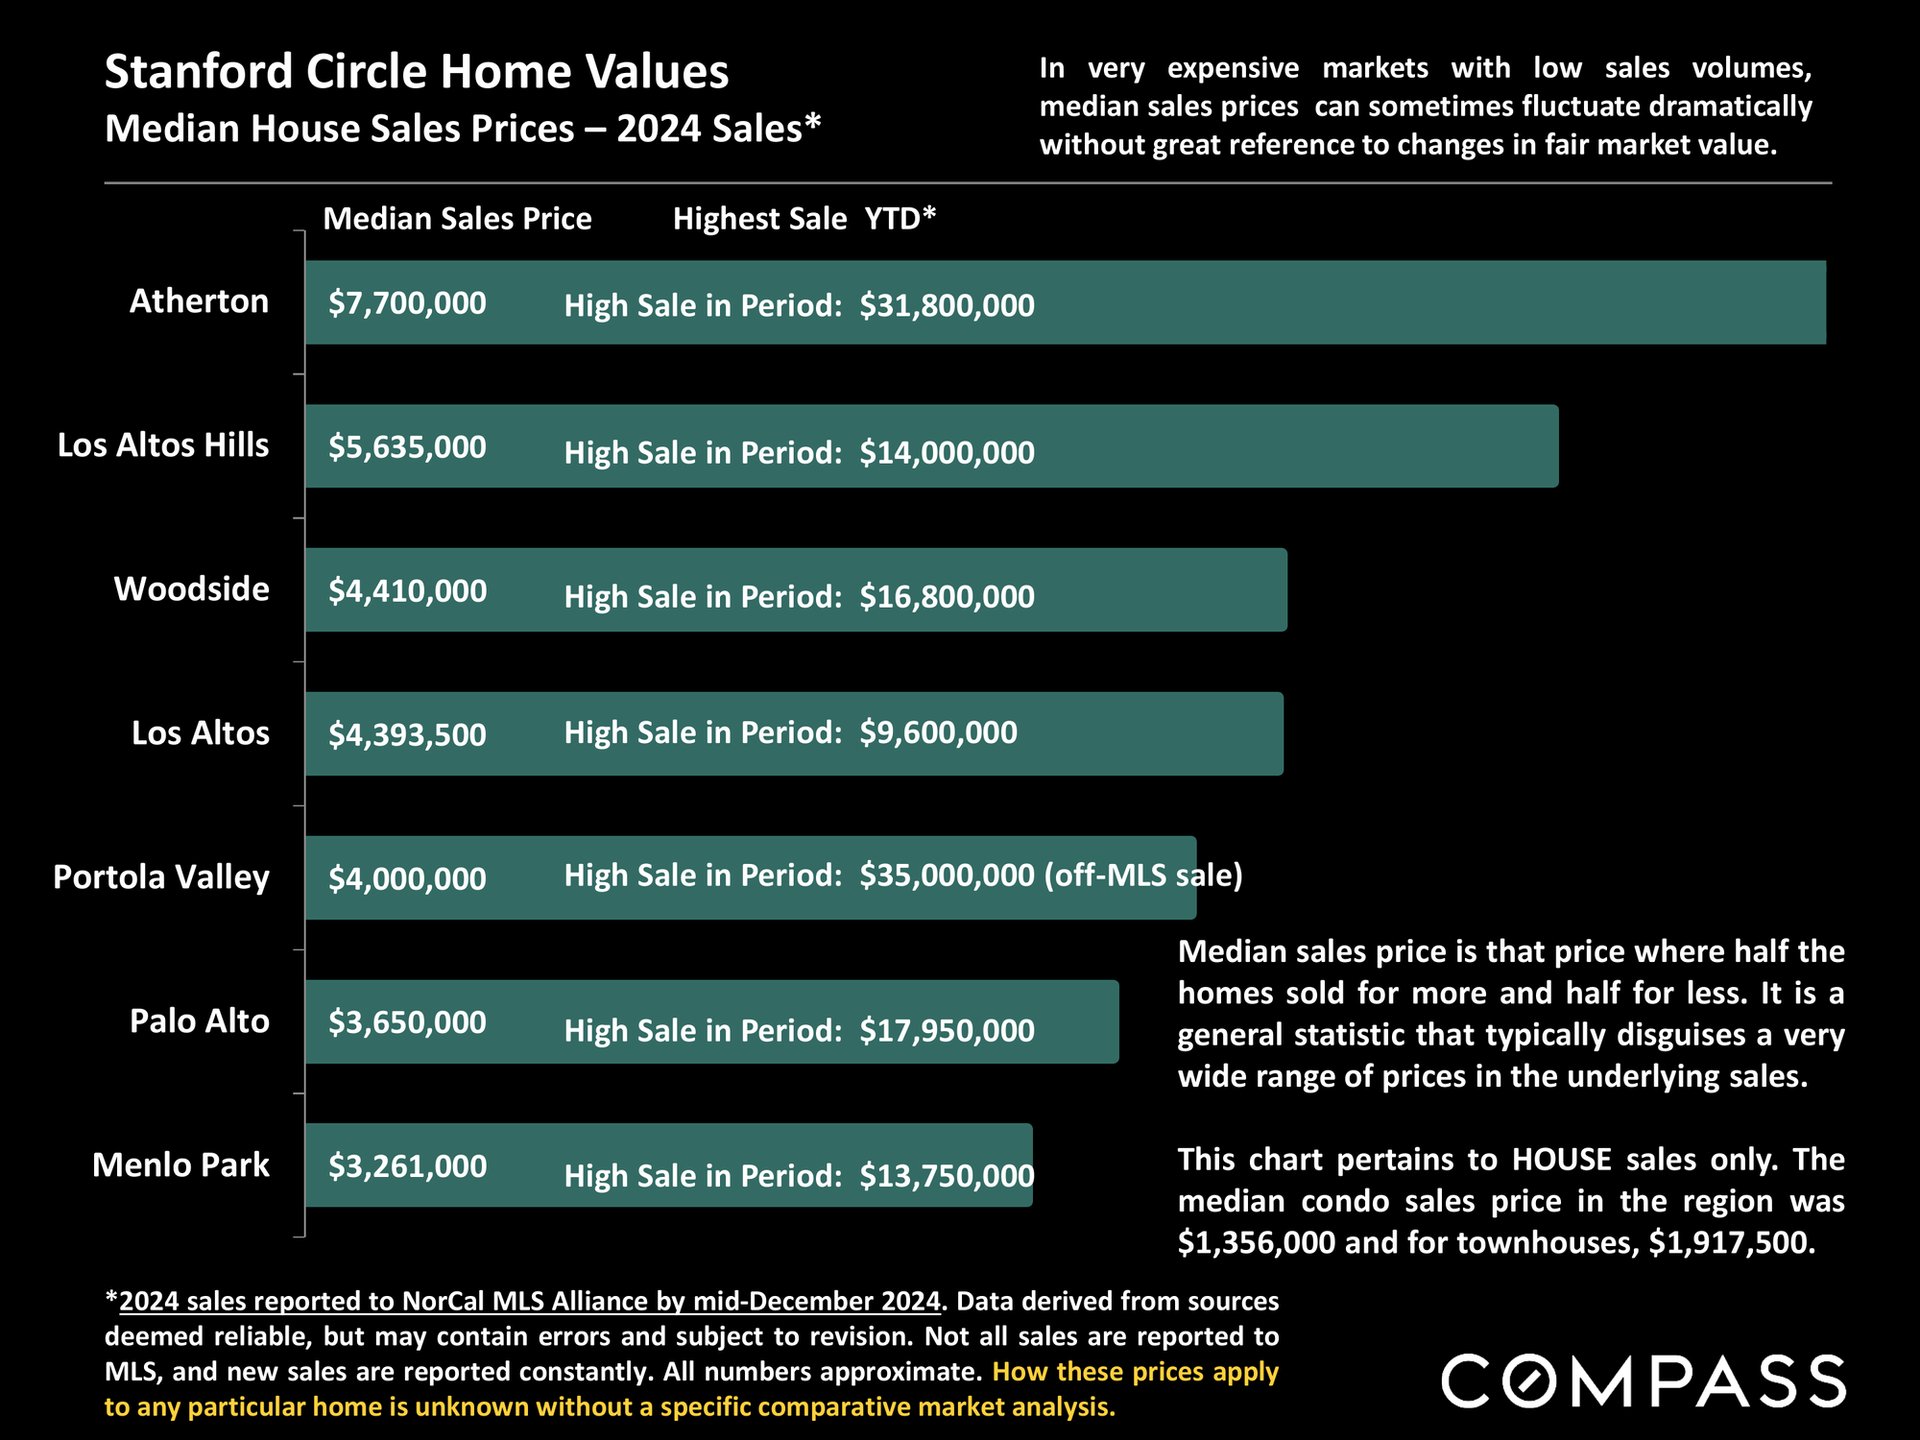
Stanford Circle 2024 home values chart compares median house prices and highest sales across seven local communities.
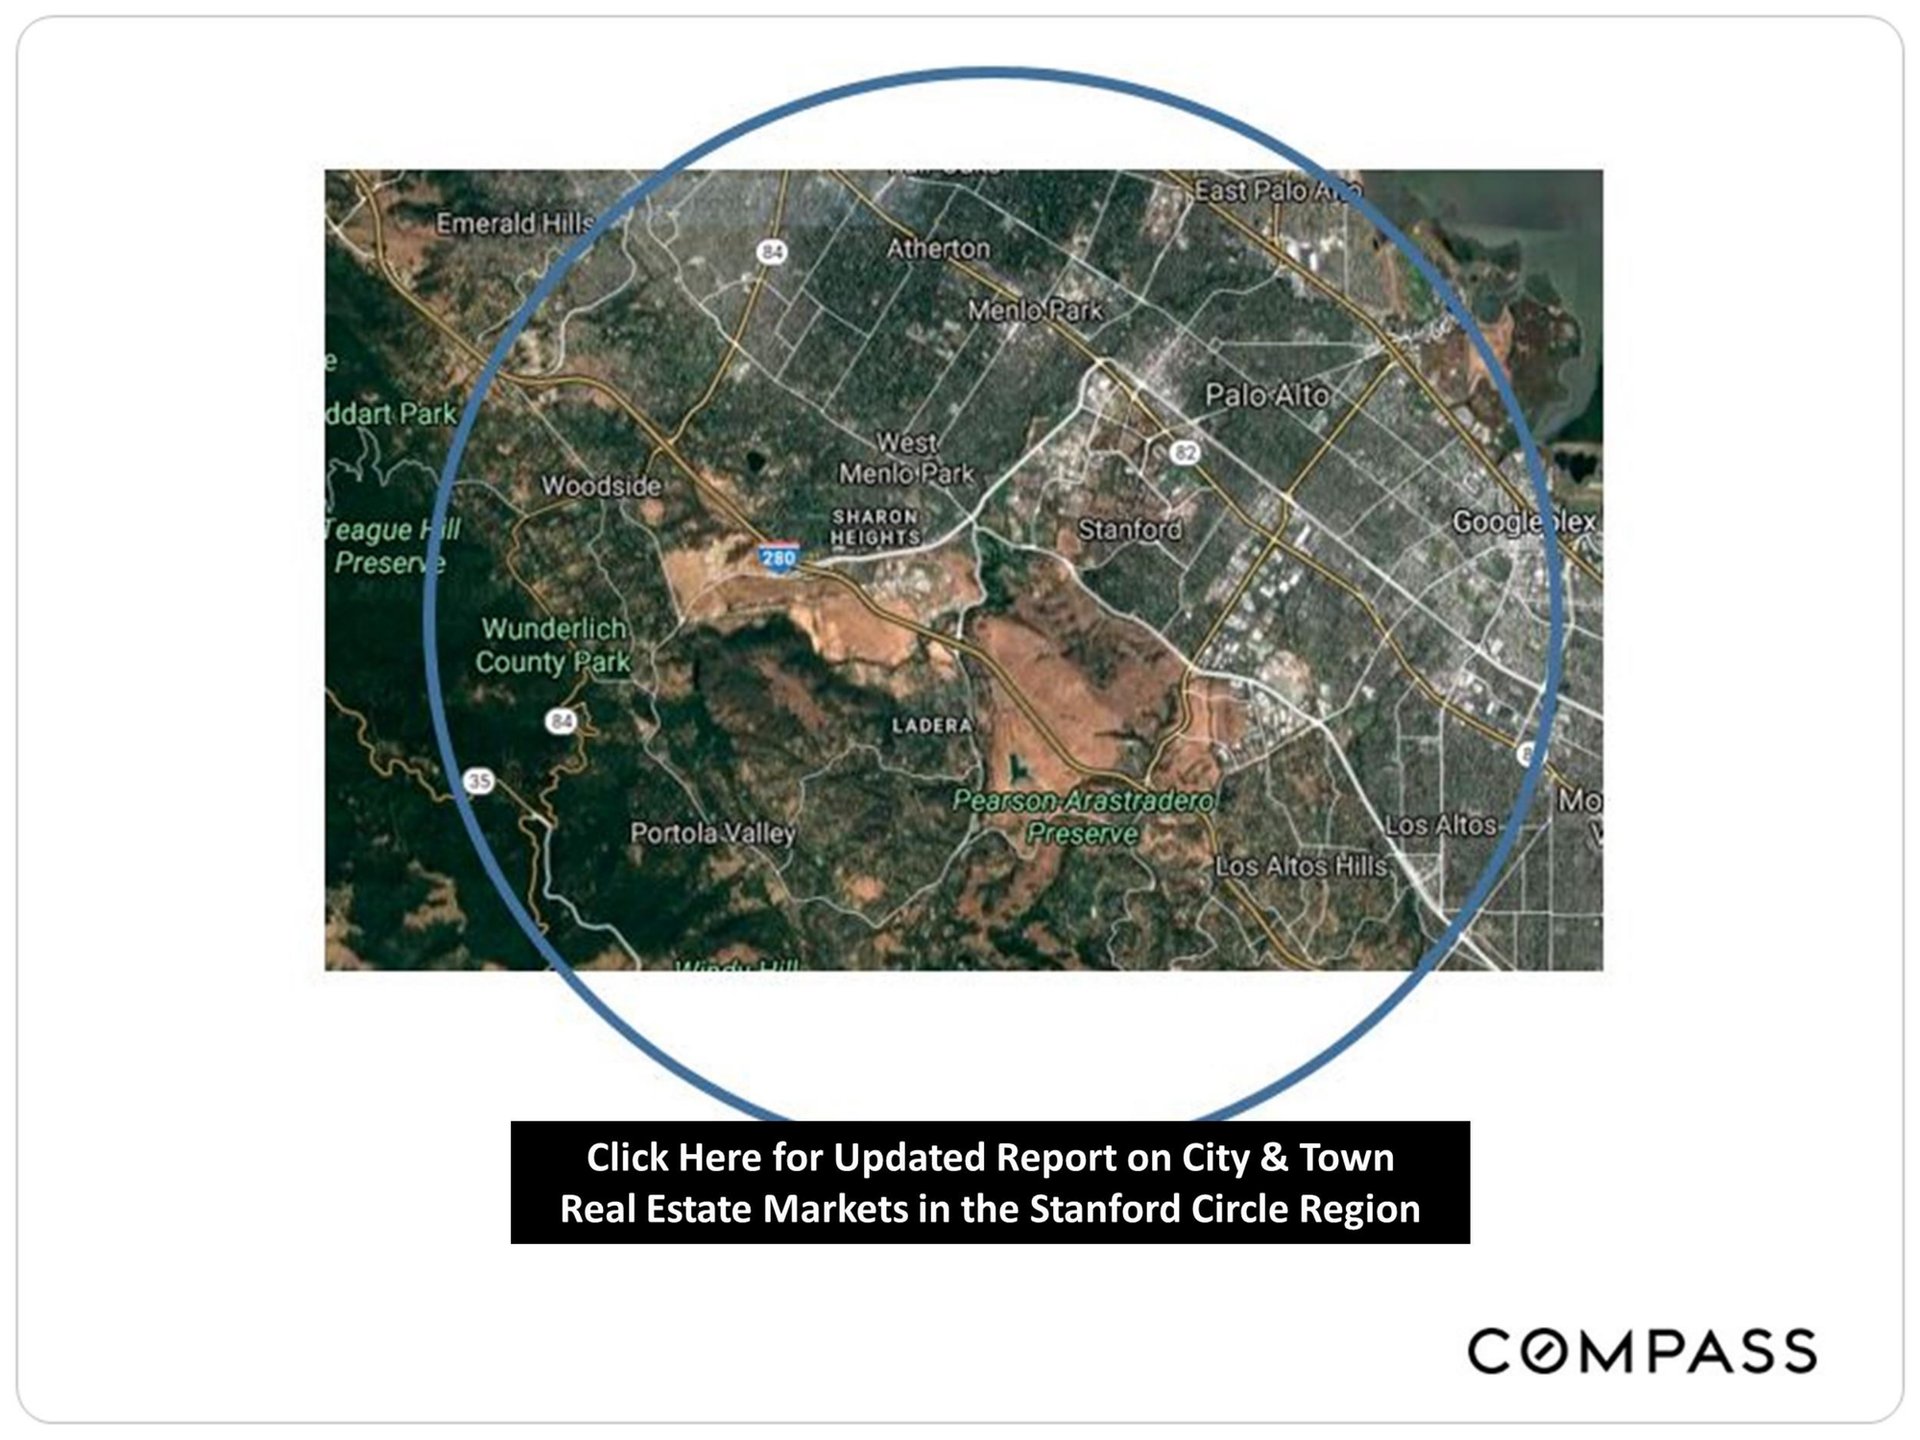
Map of the Stanford Circle region, outlined in blue, with a link to an updated real estate market report.
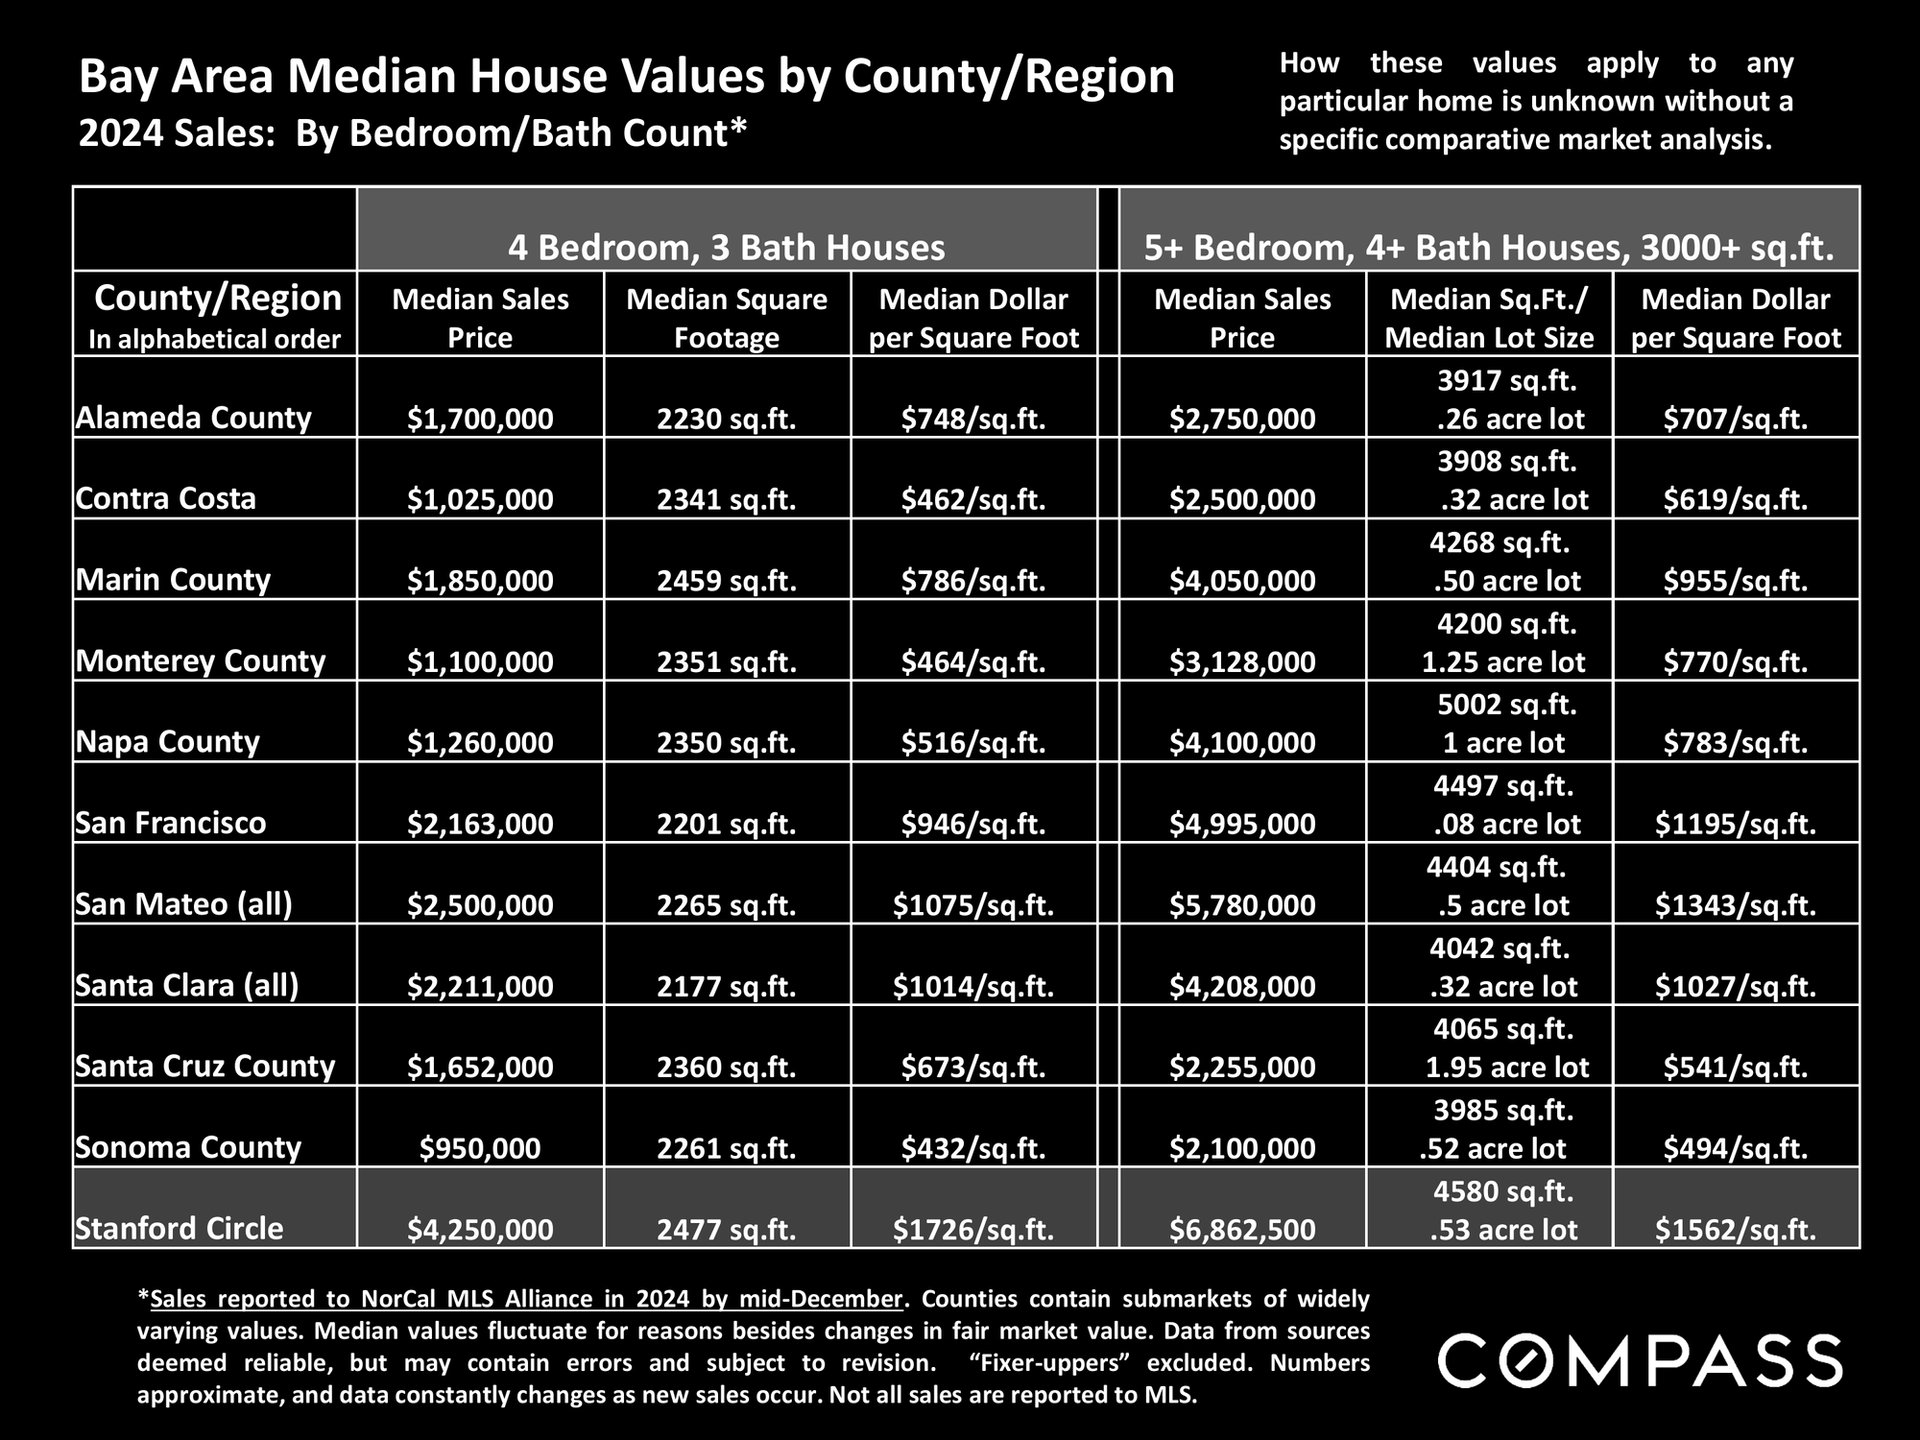
Chart of 2024 Bay Area home values by county, bedroom and bath count, with Stanford Circle highlighted.
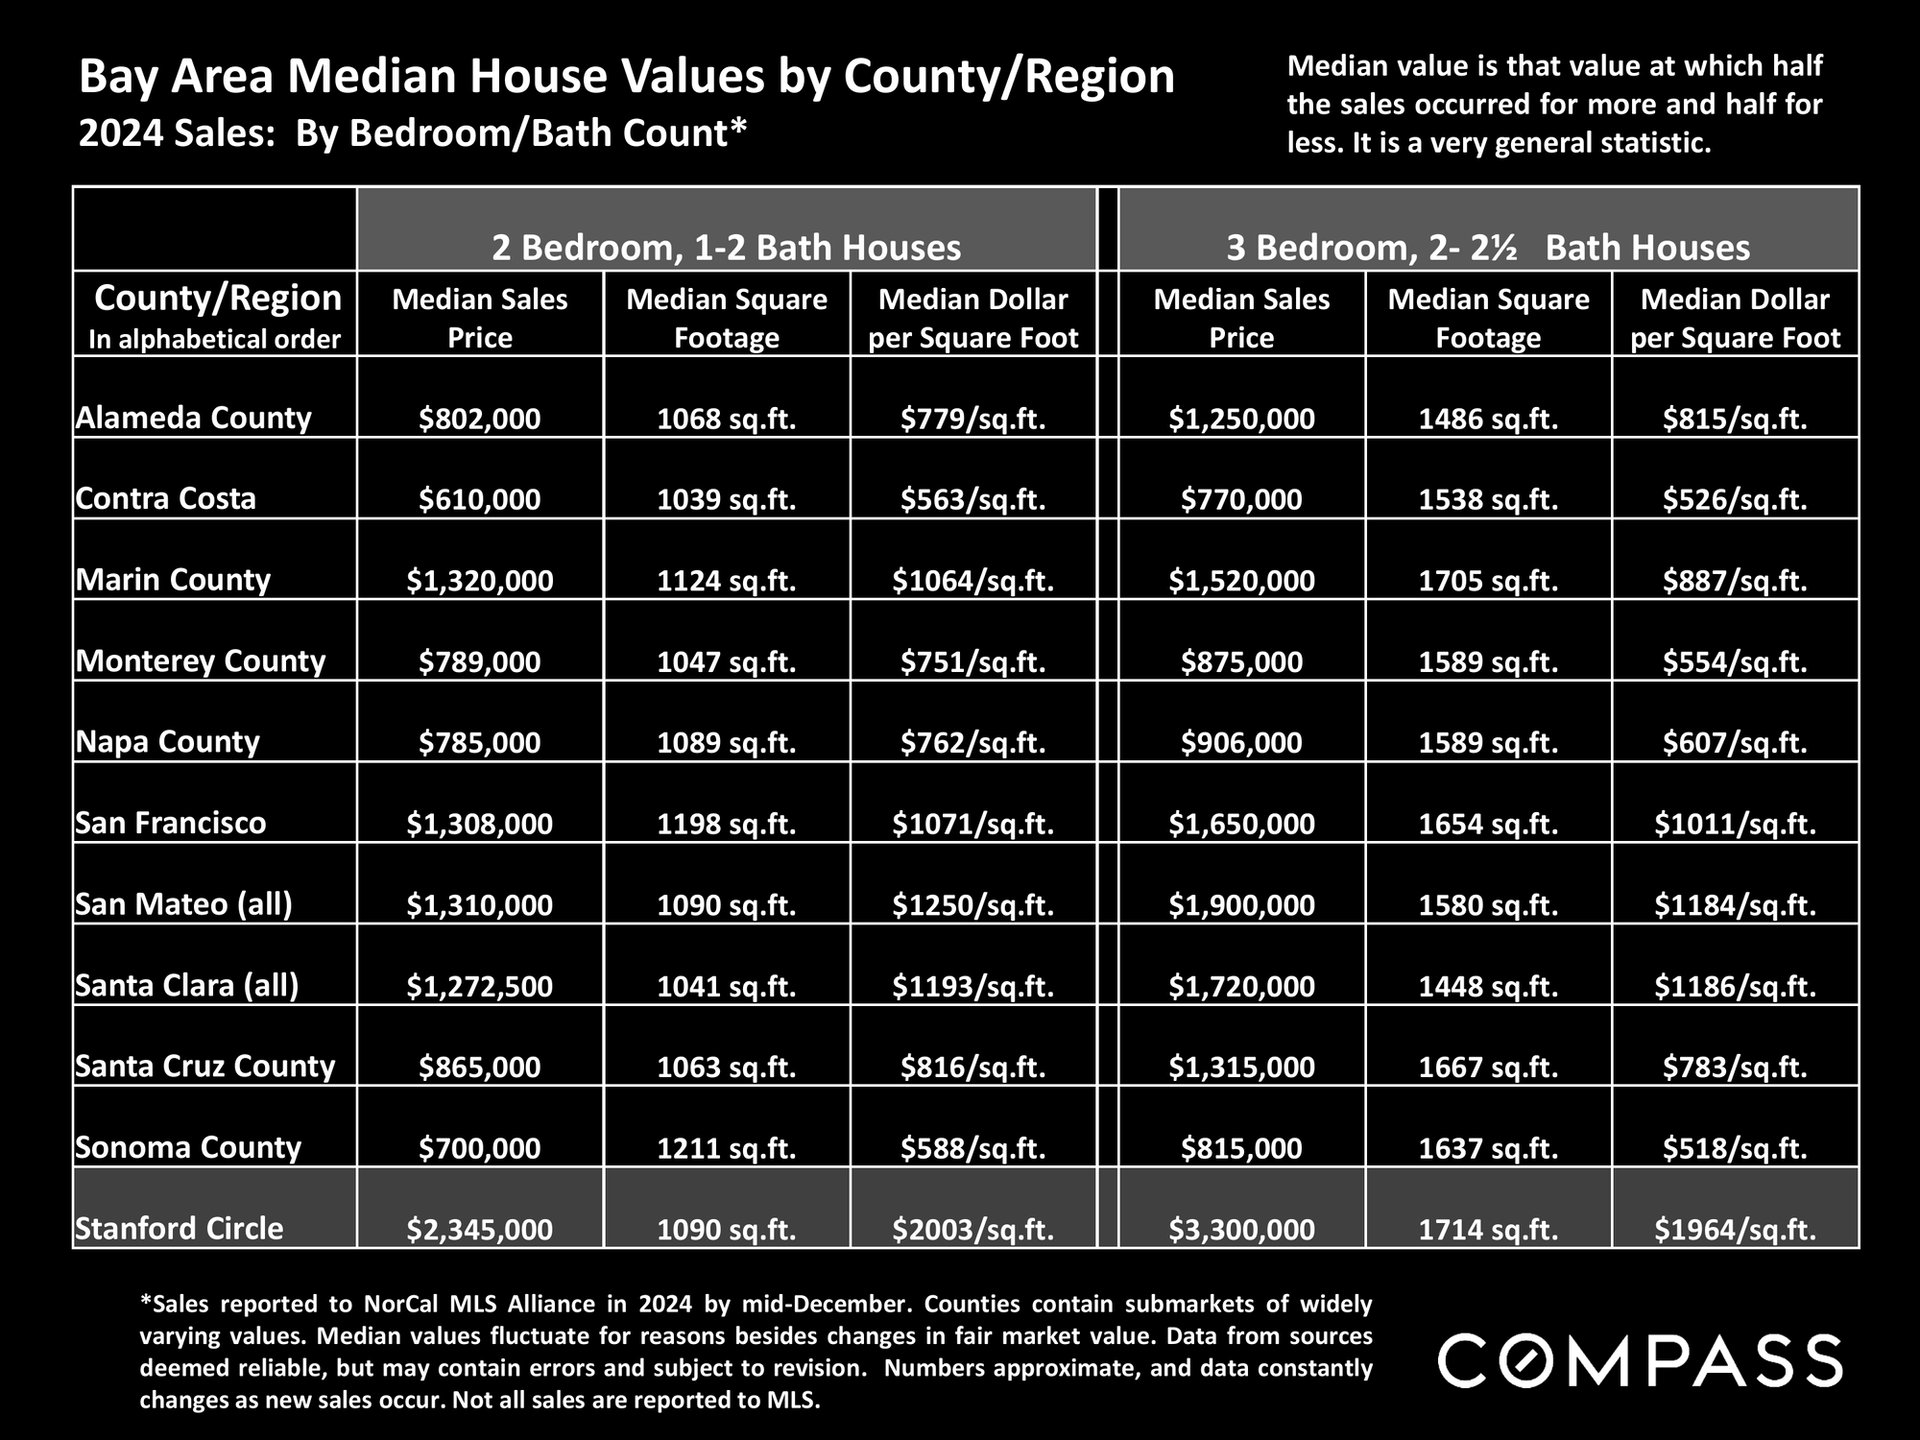
Bay Area 2024 median home values table by county and bedroom count, with Stanford Circle highlighted.
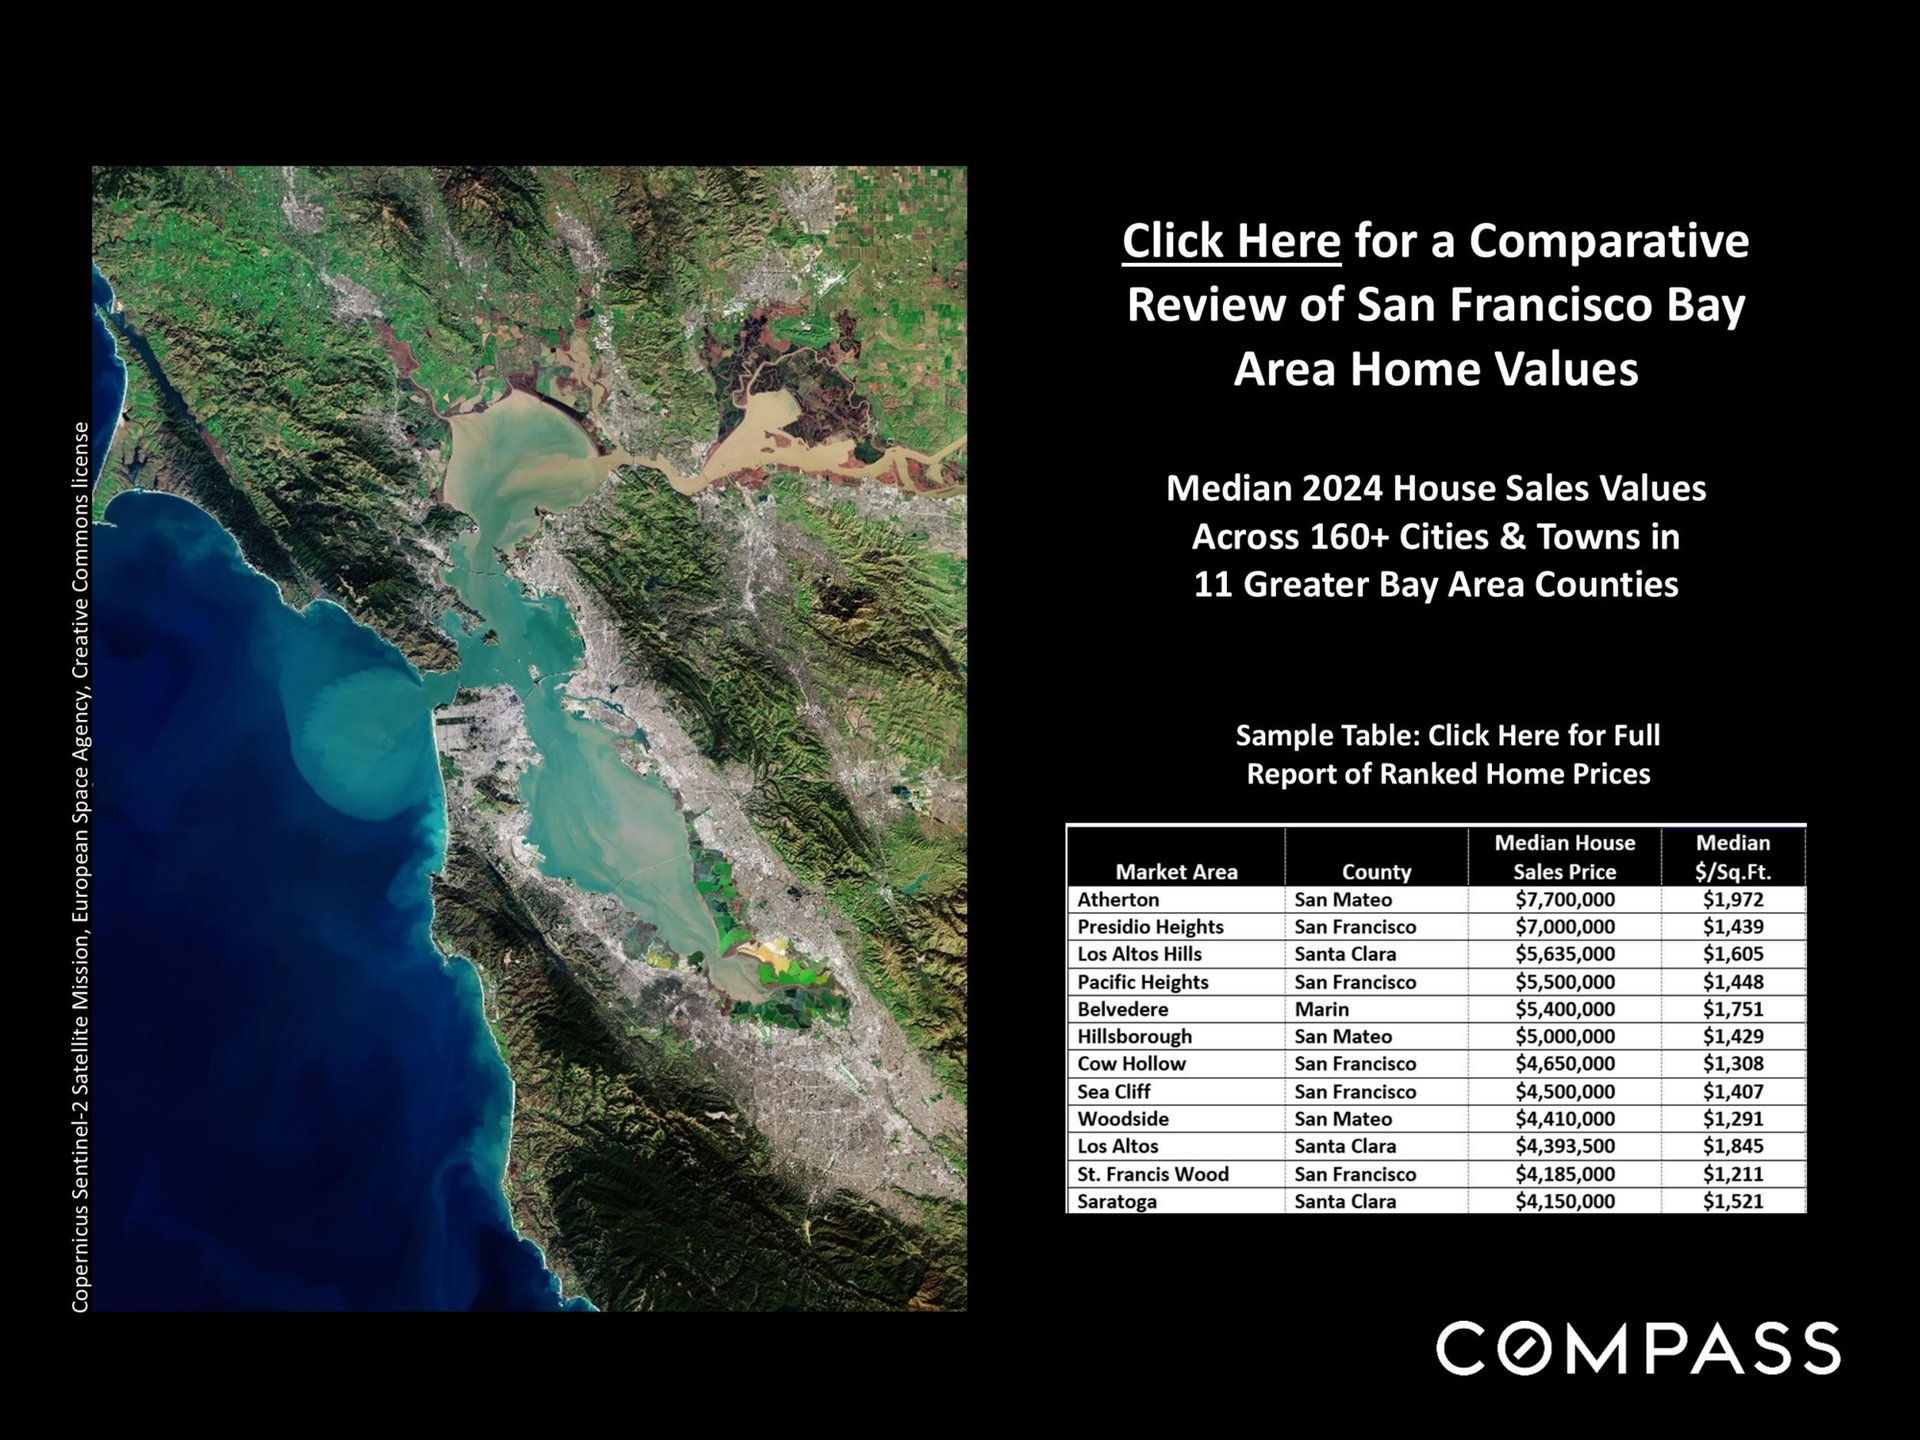
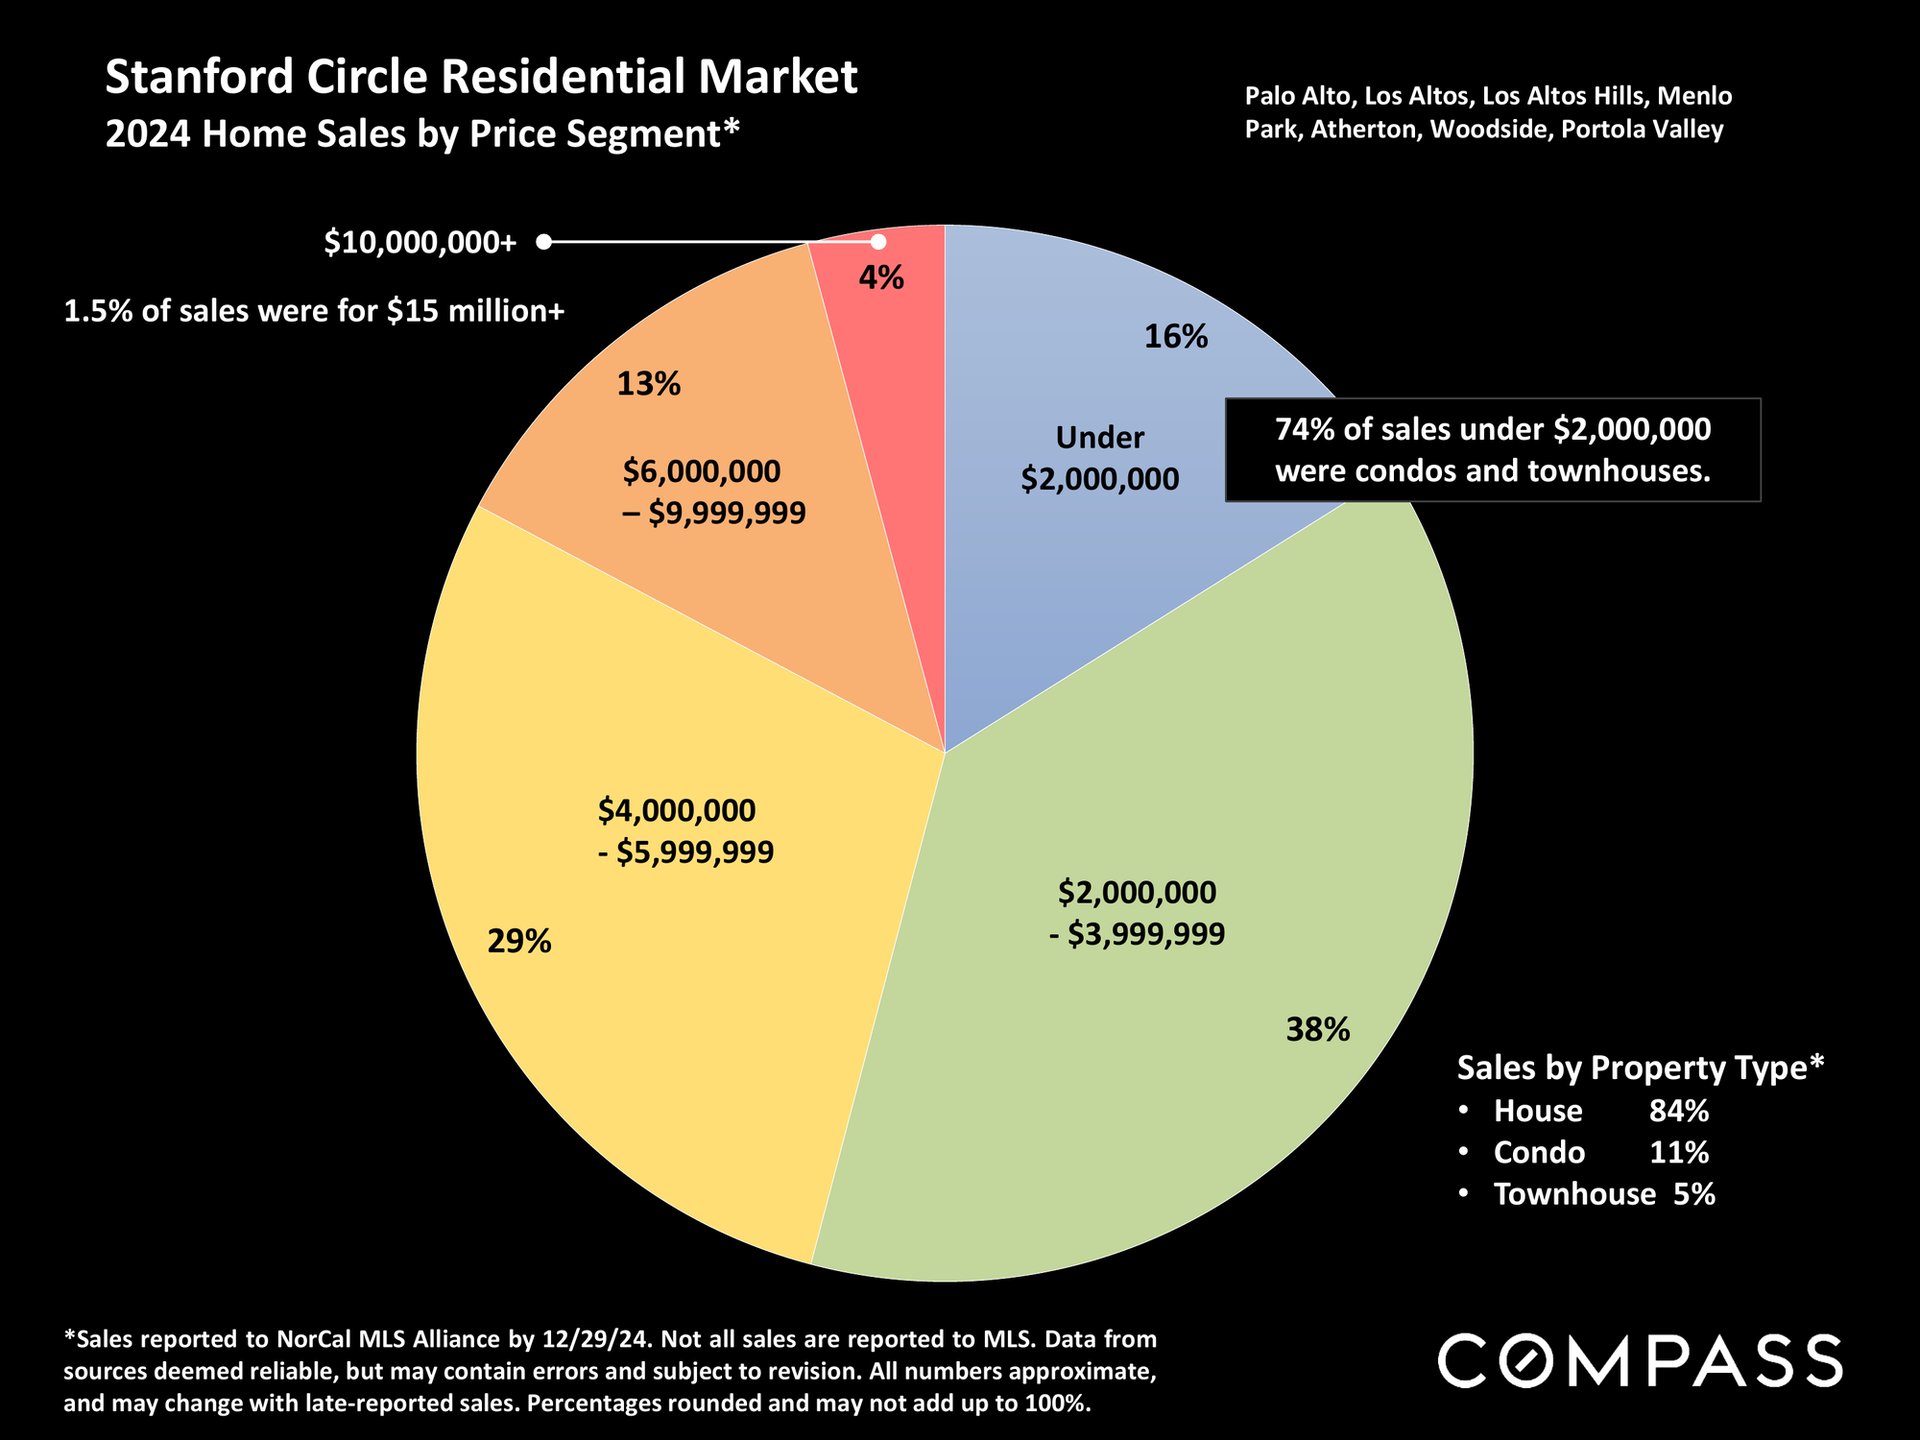
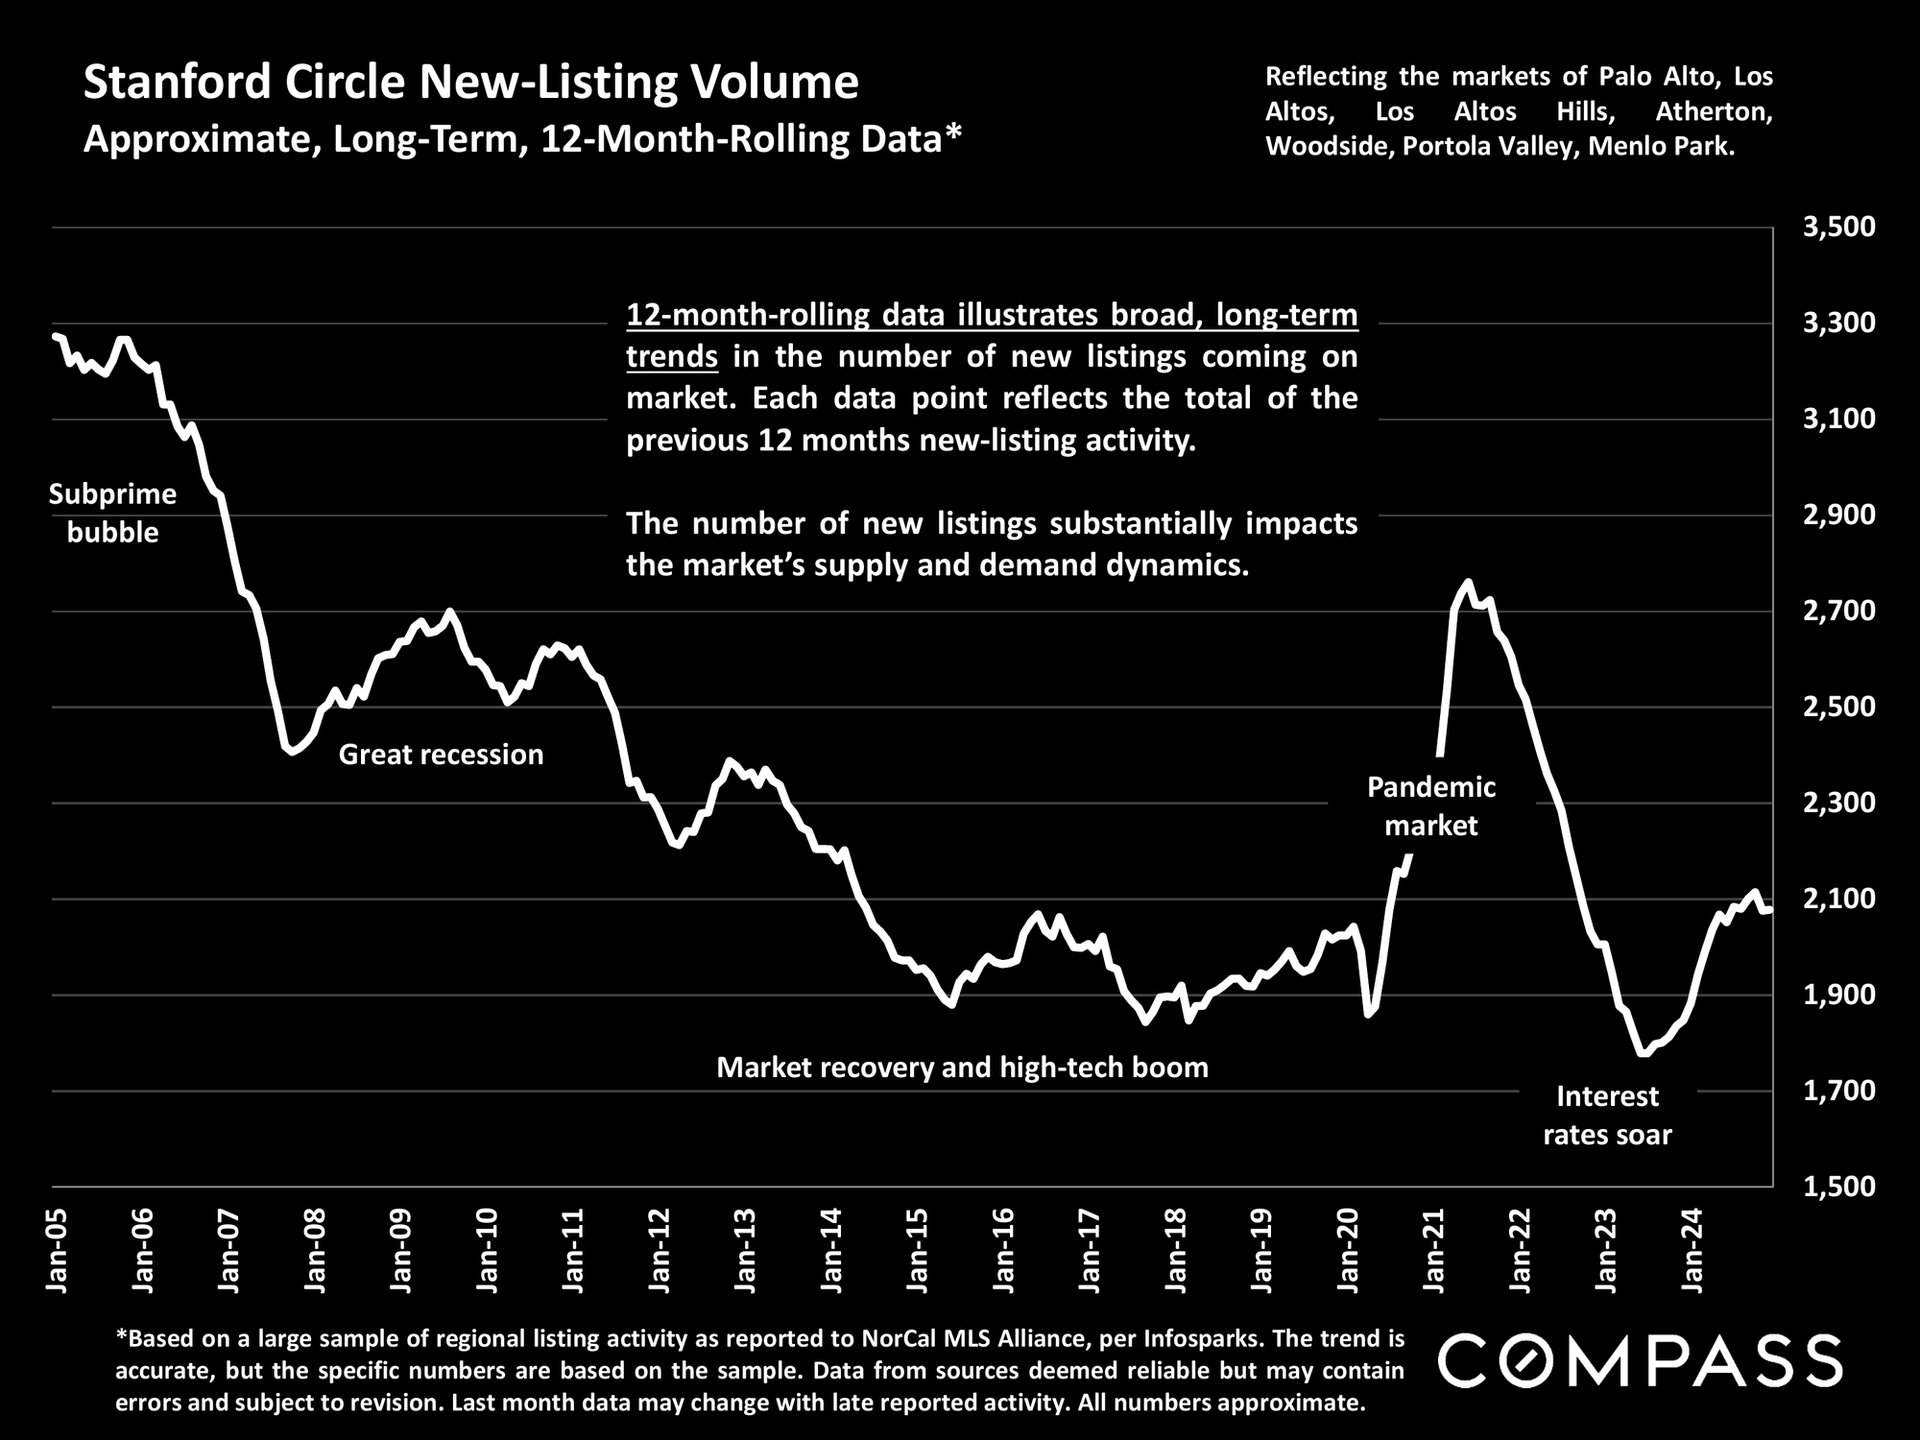
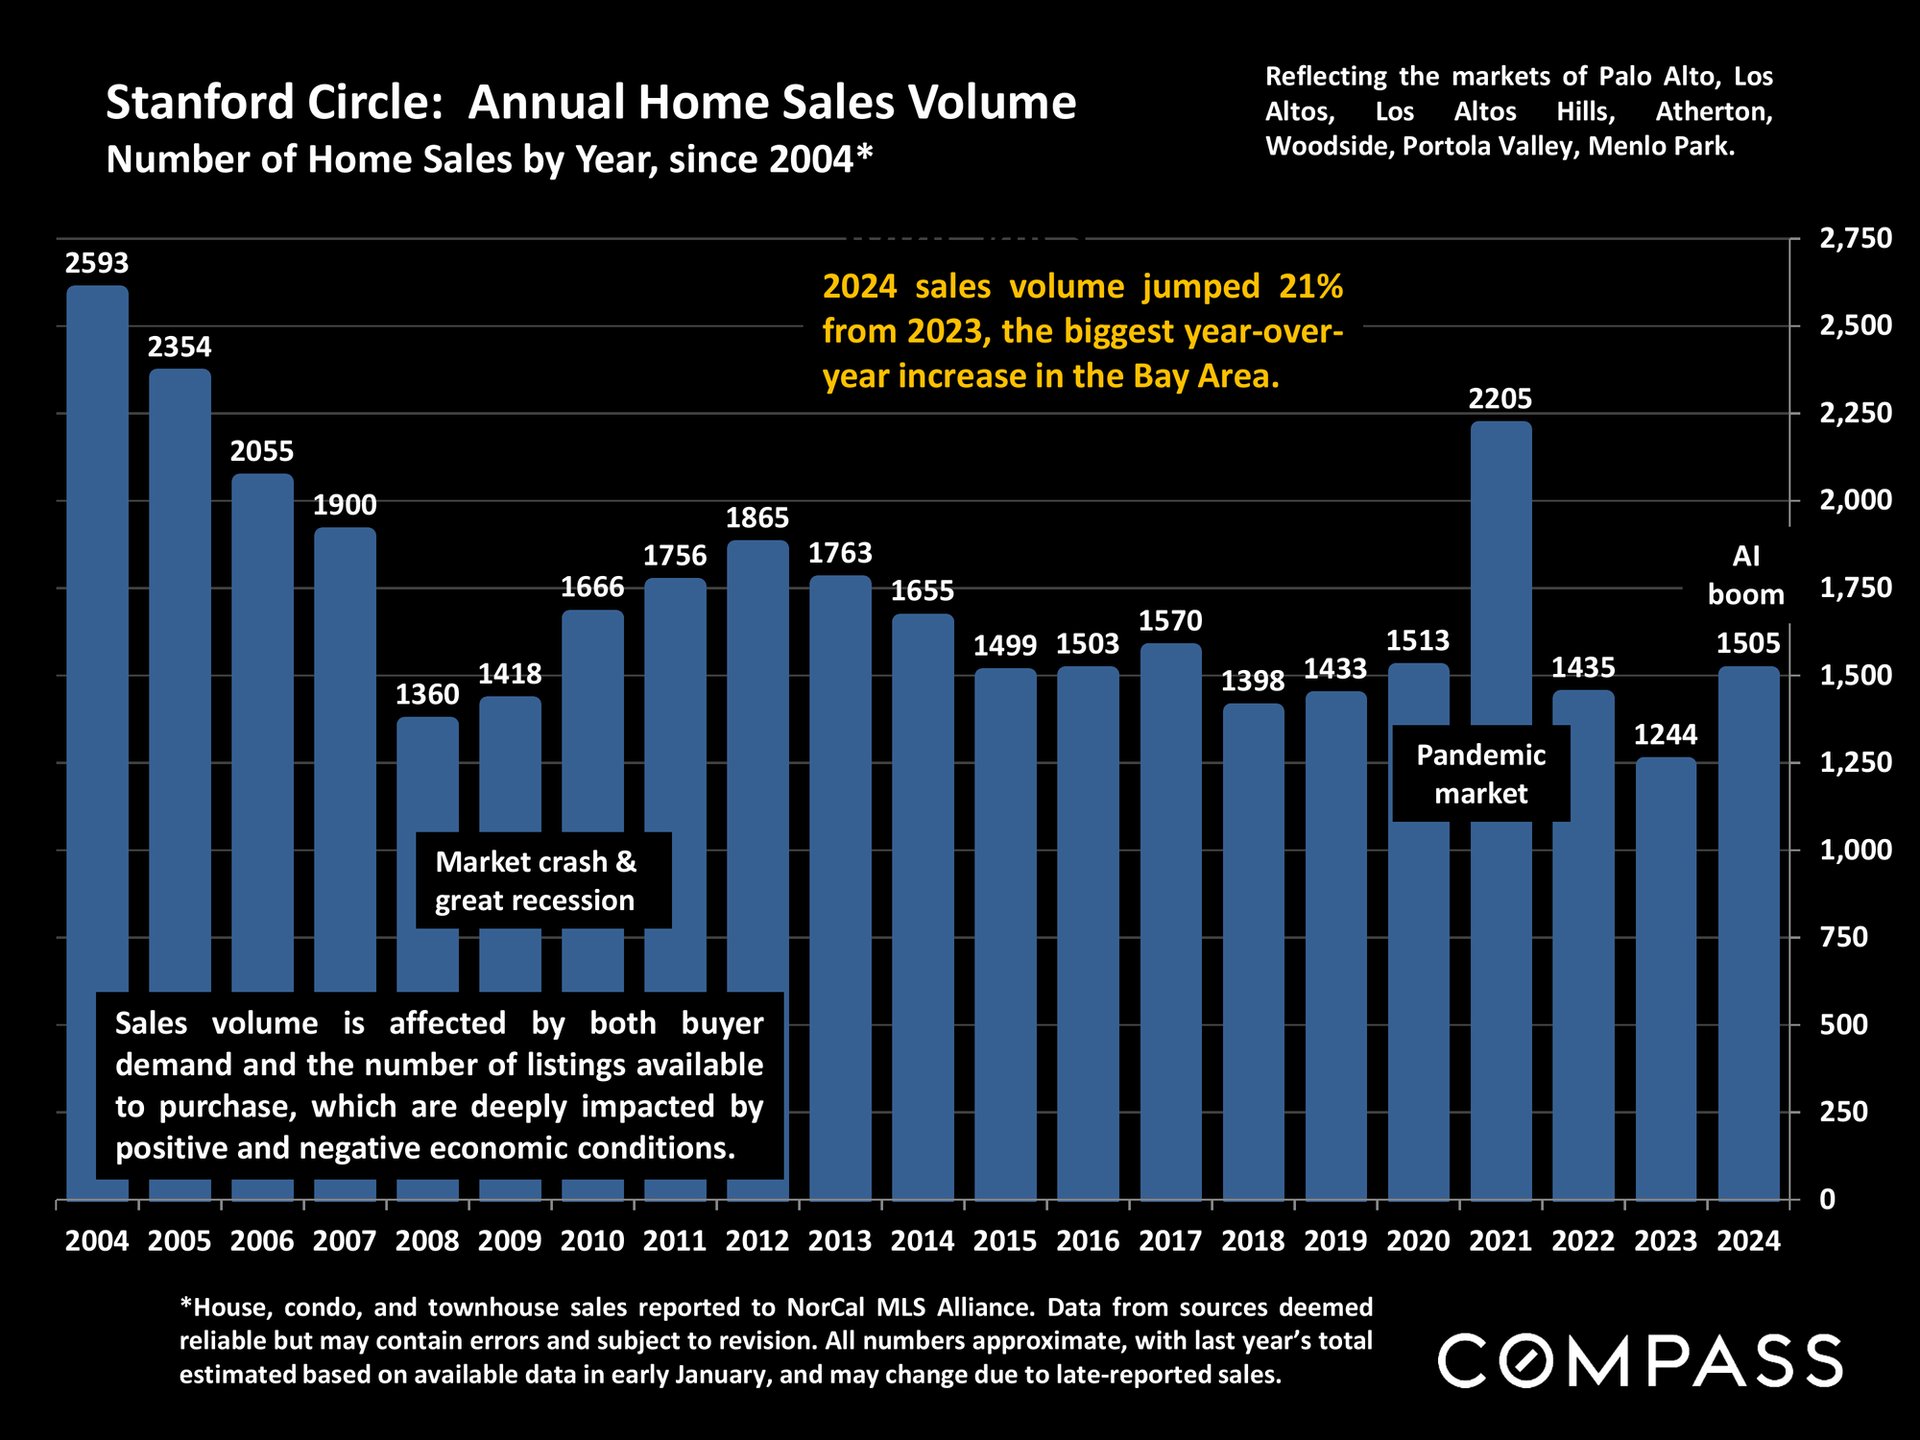
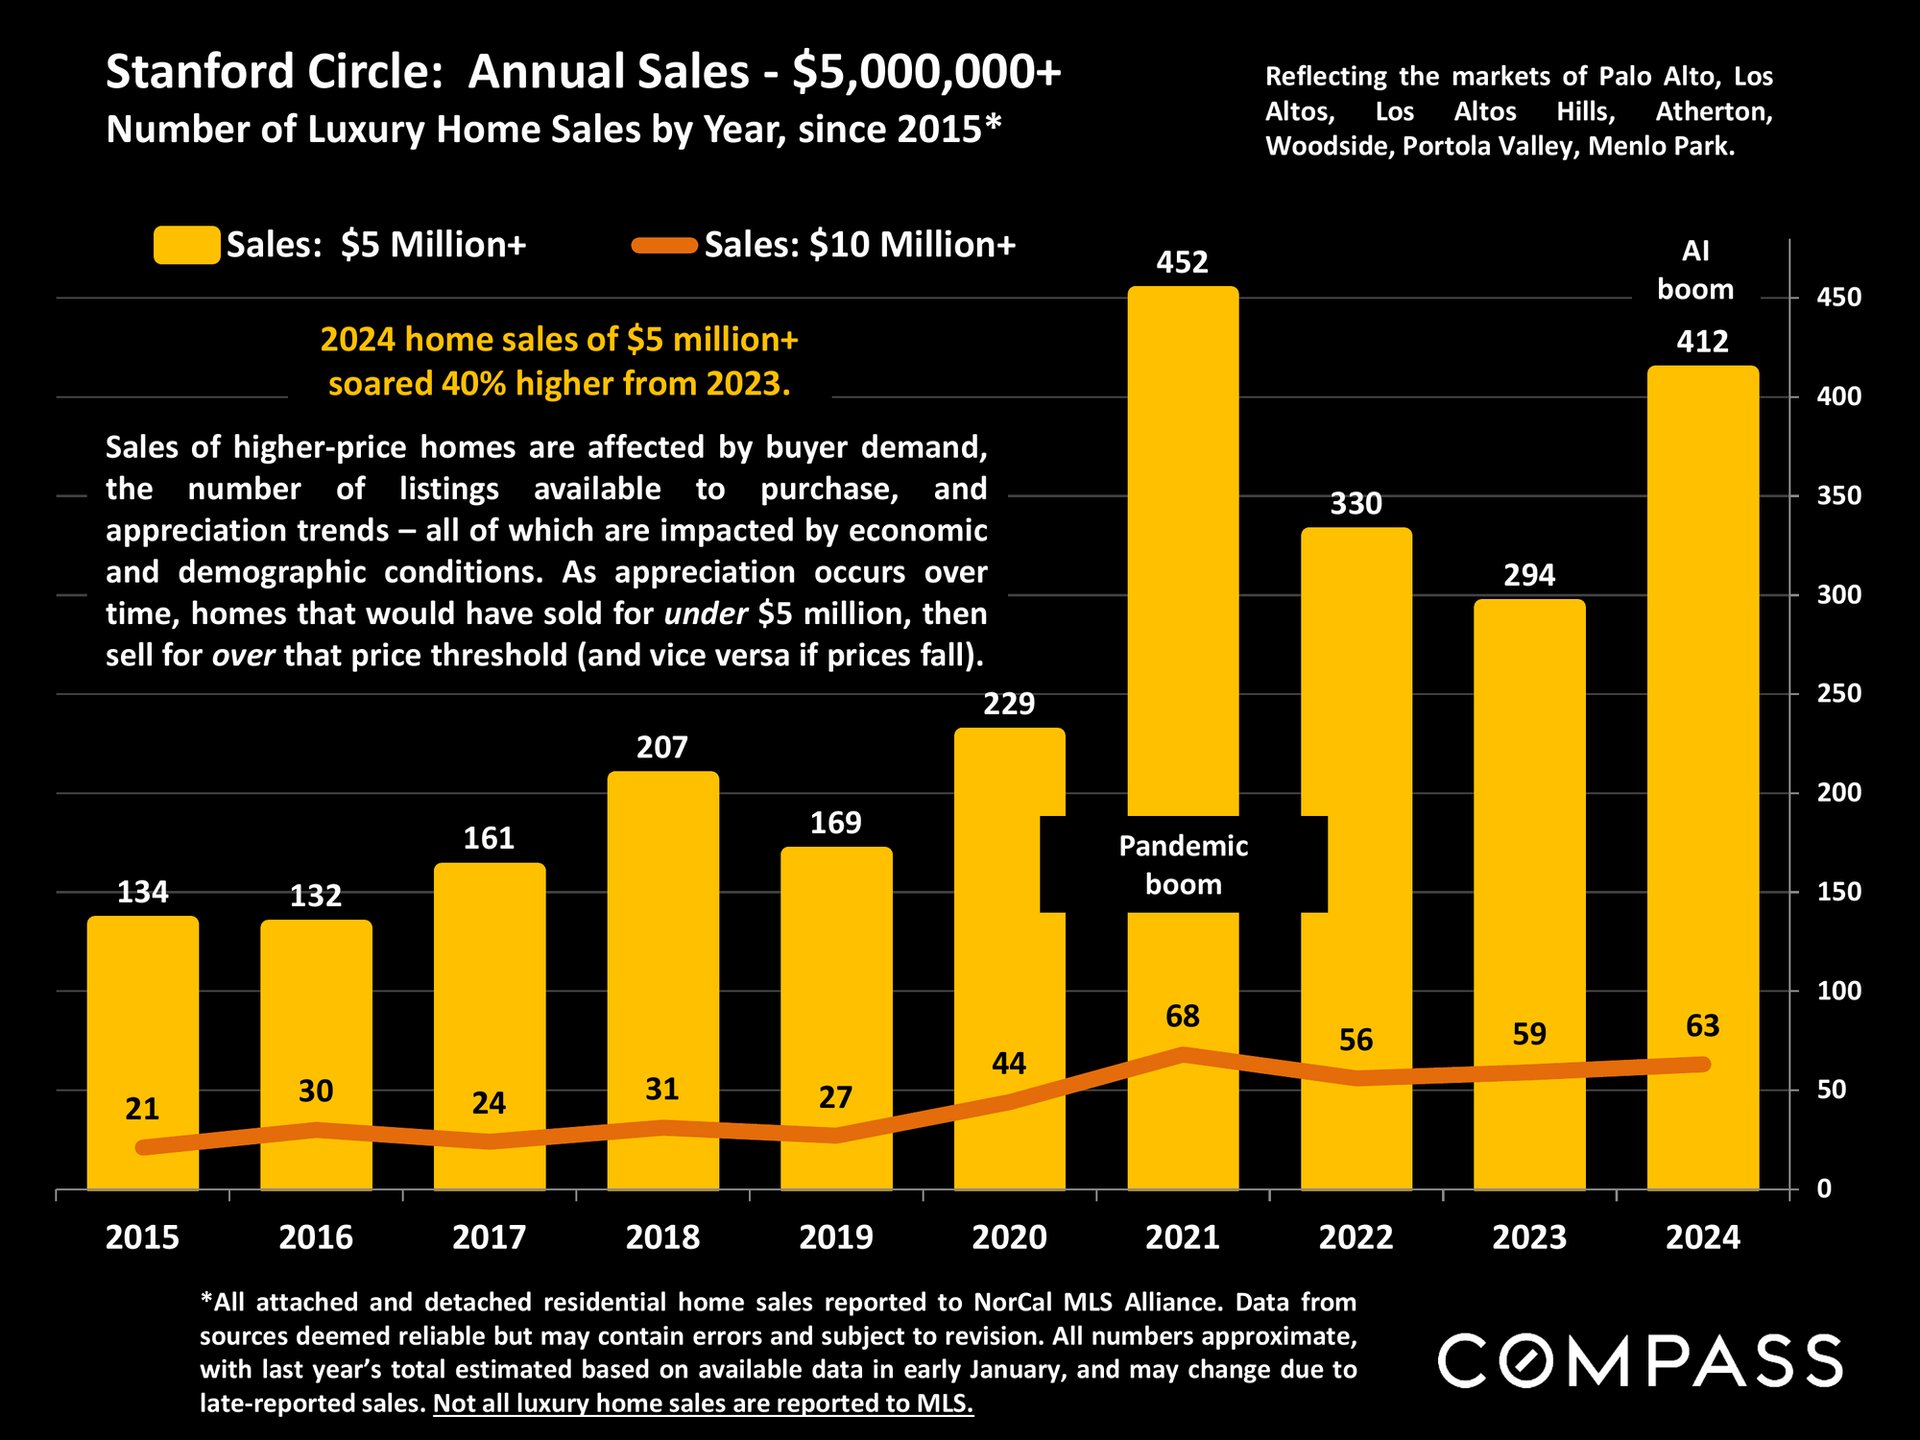
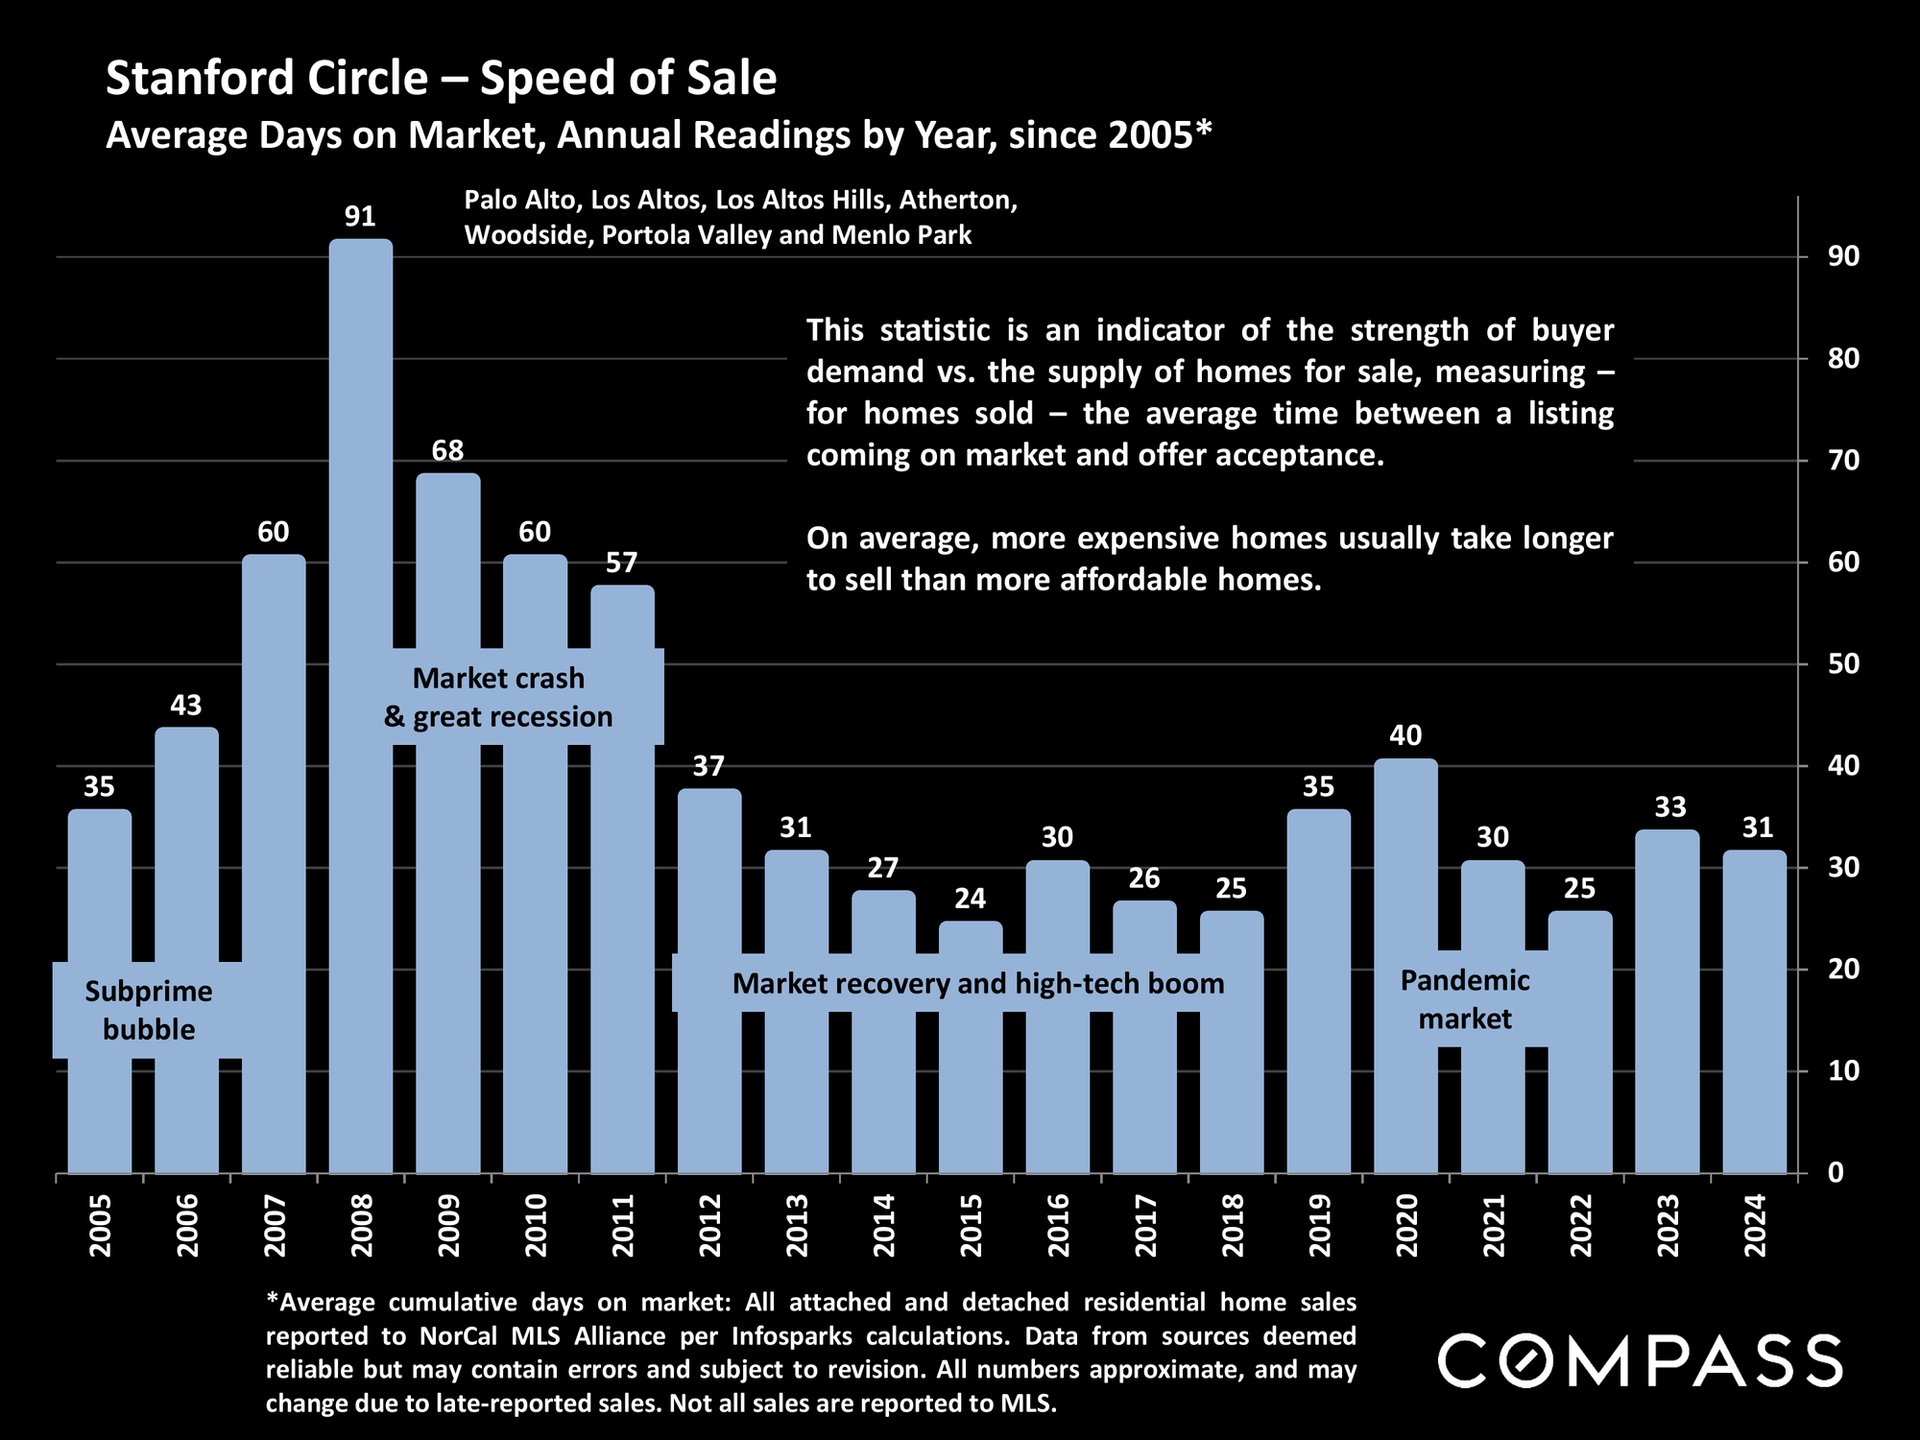
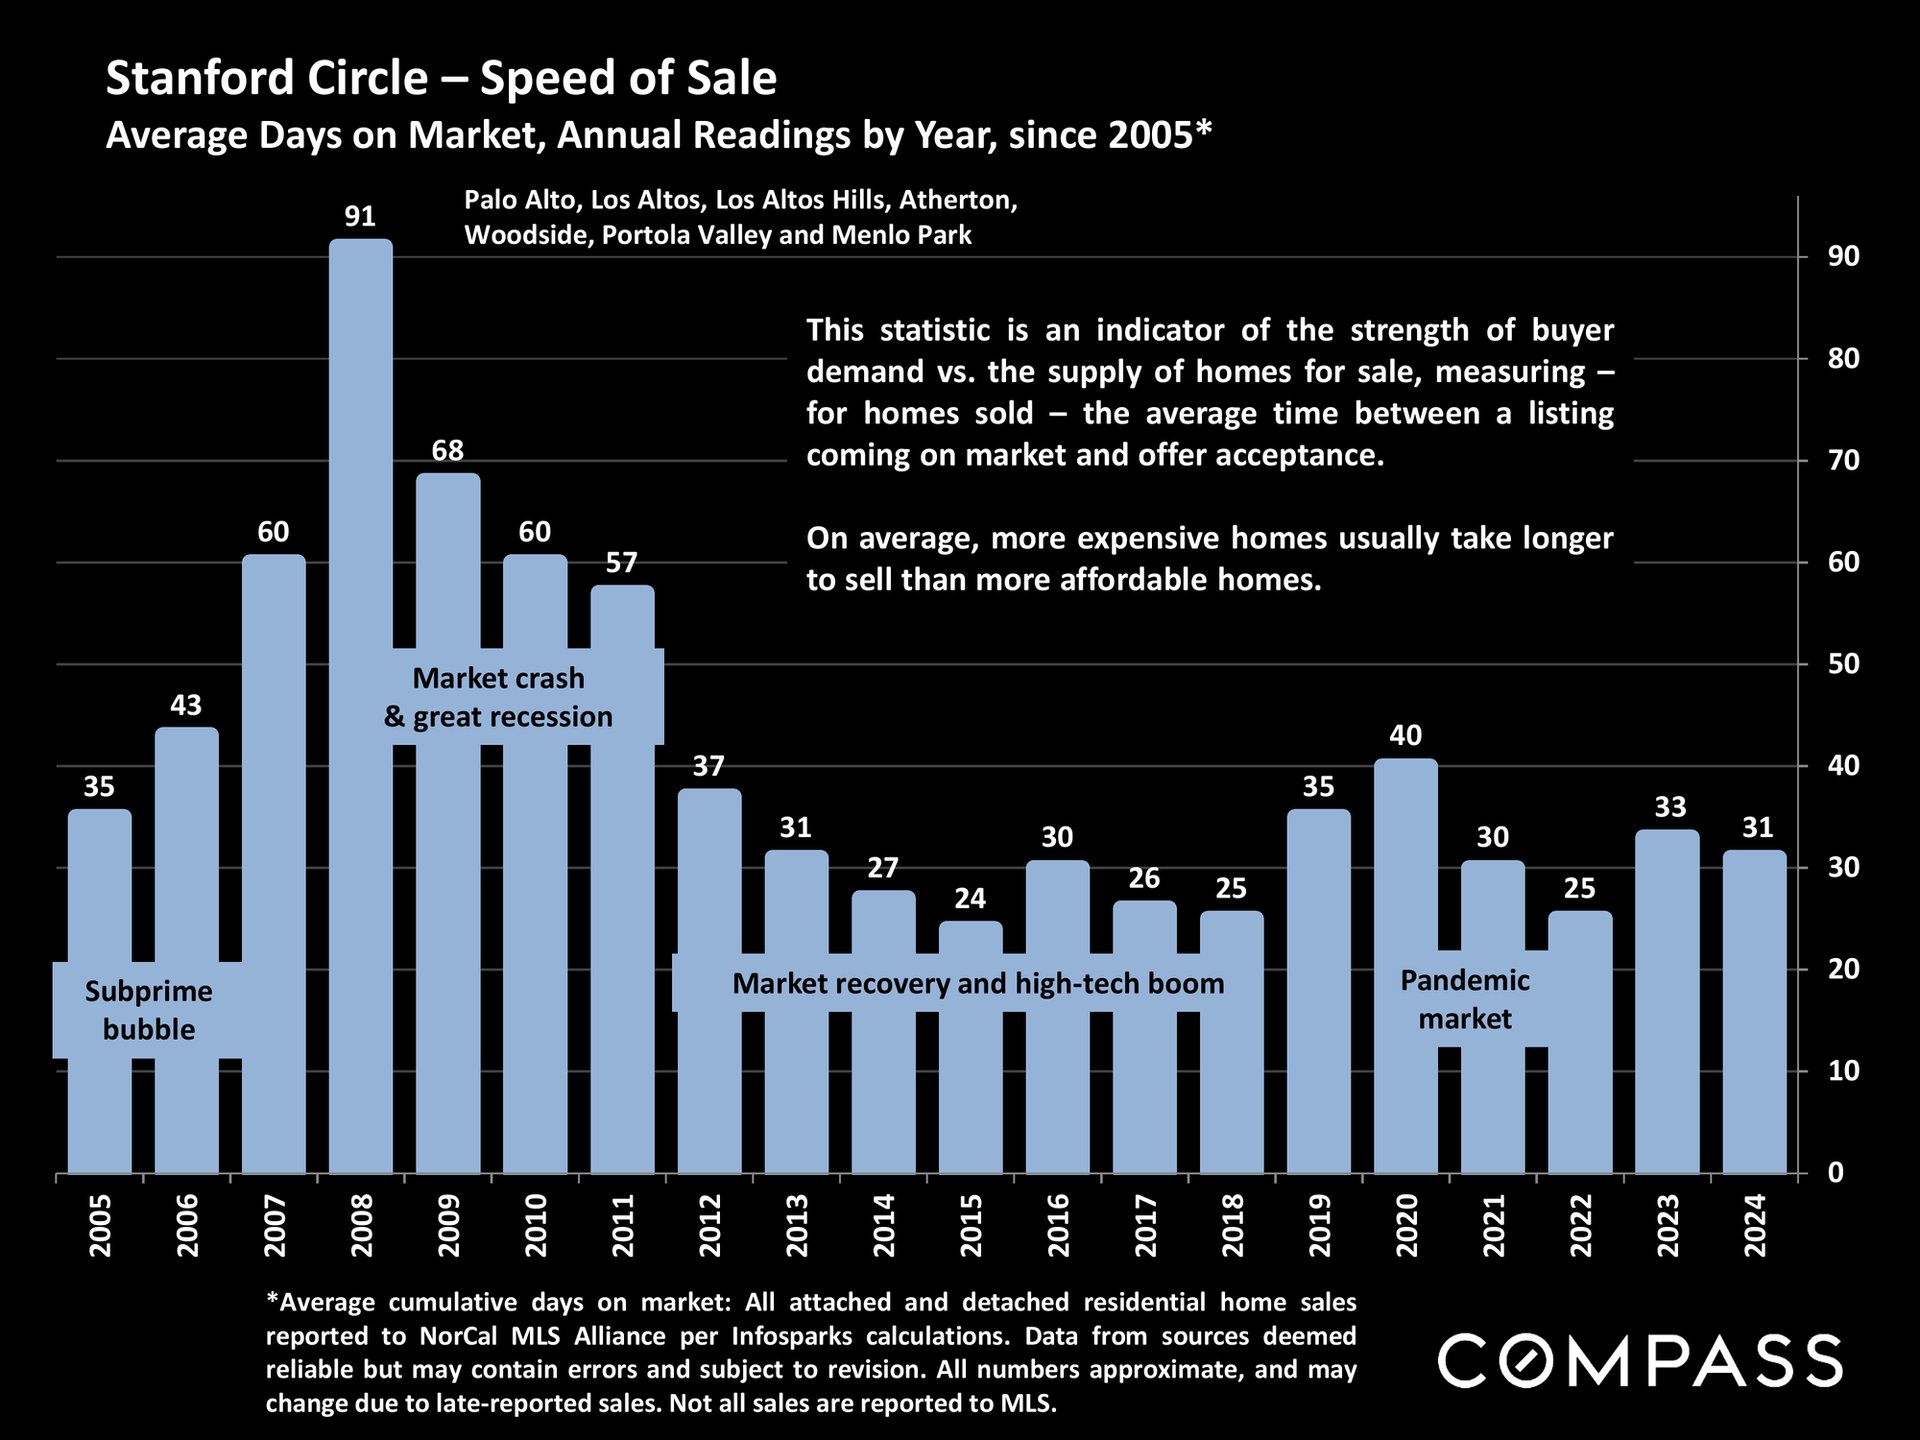
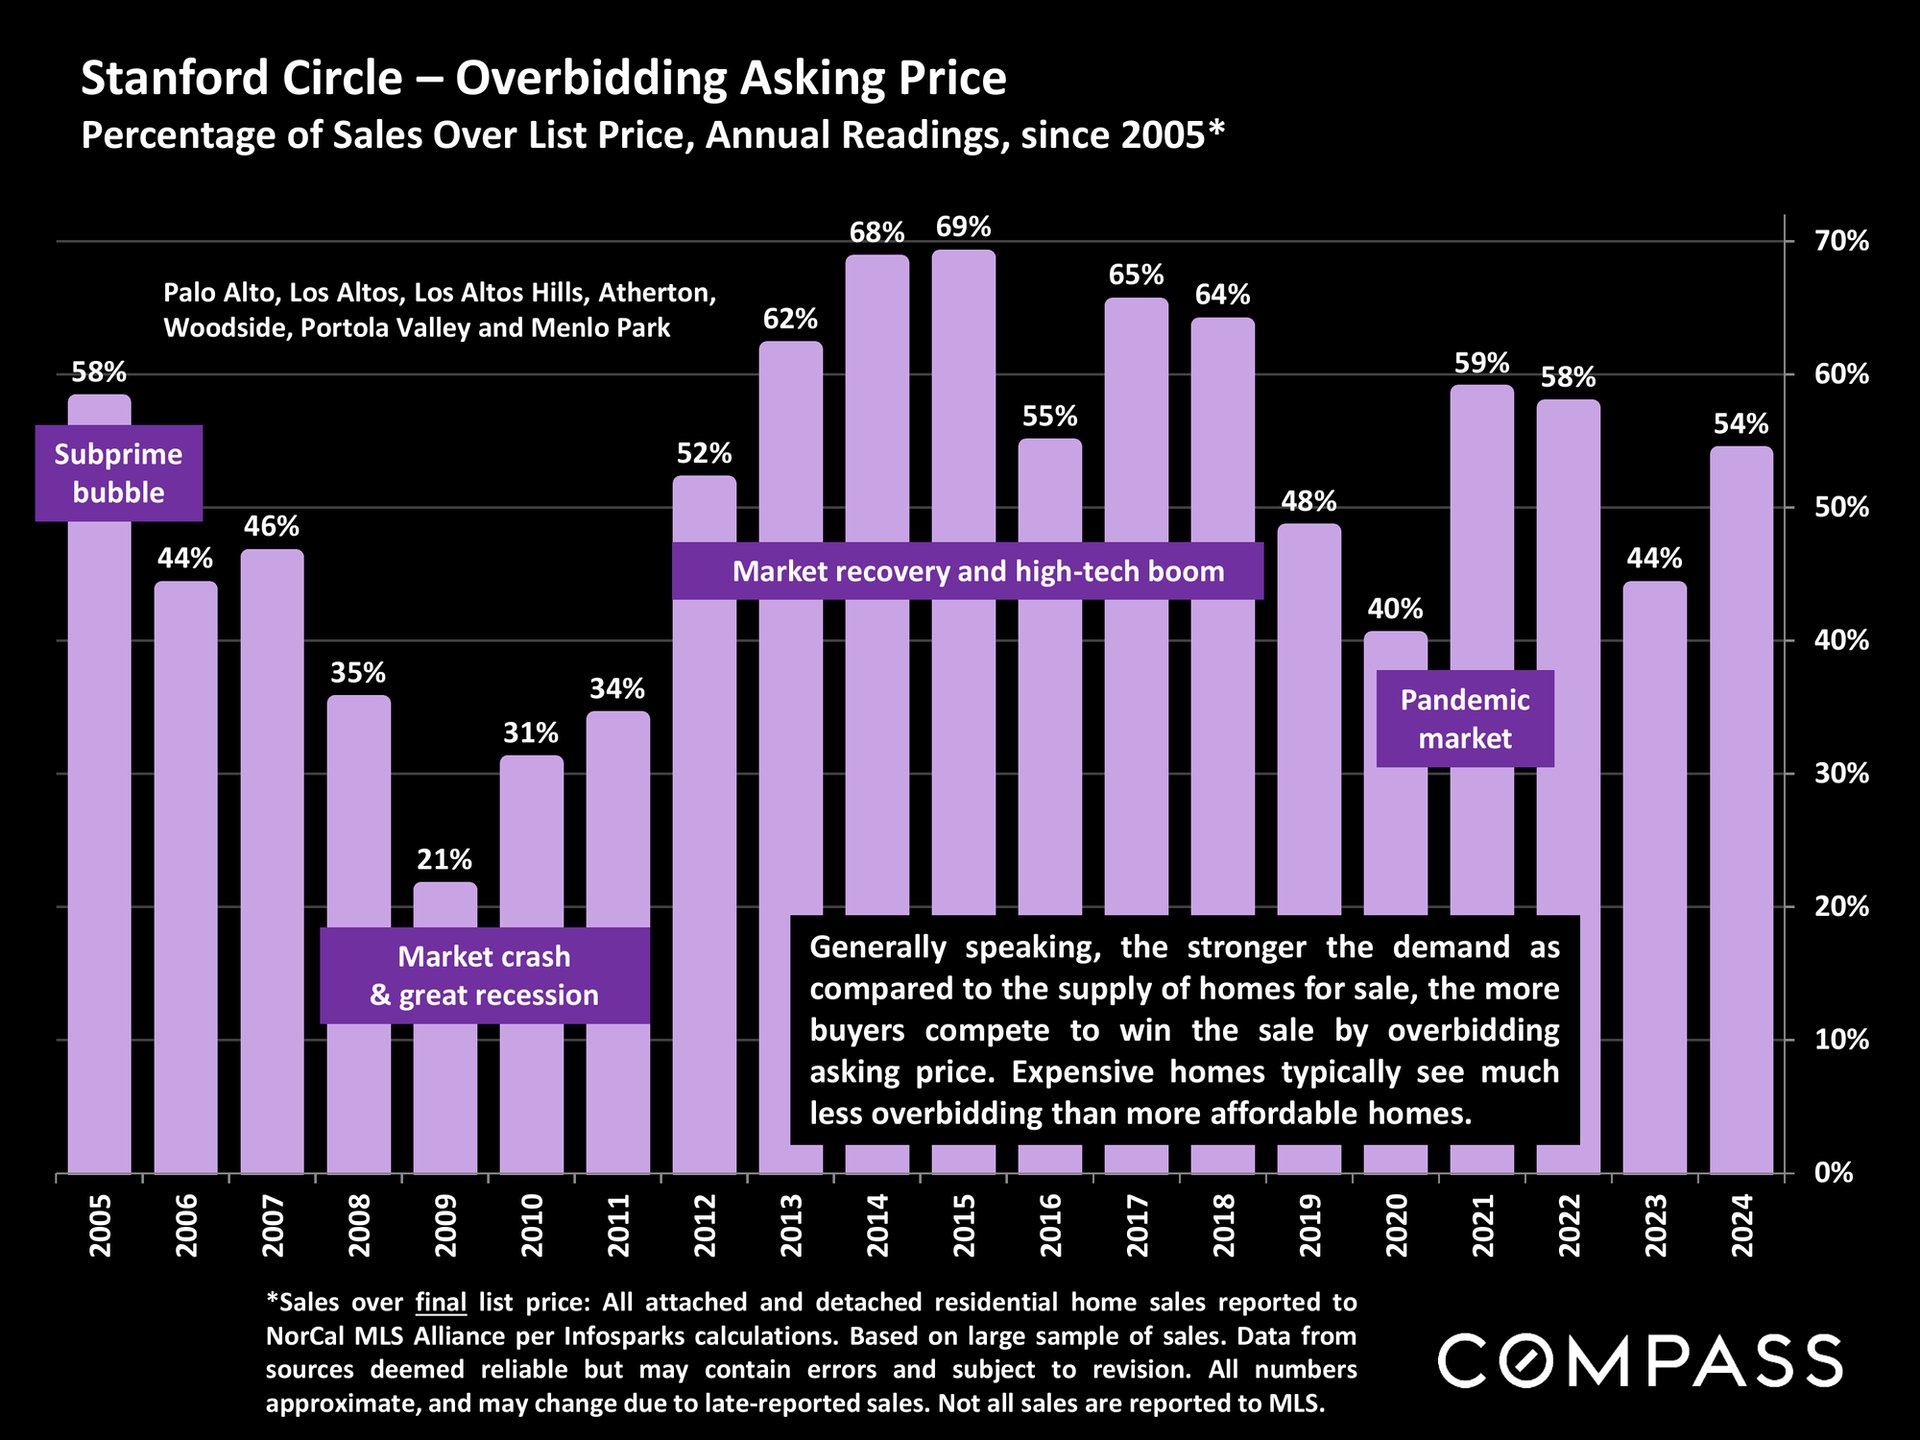
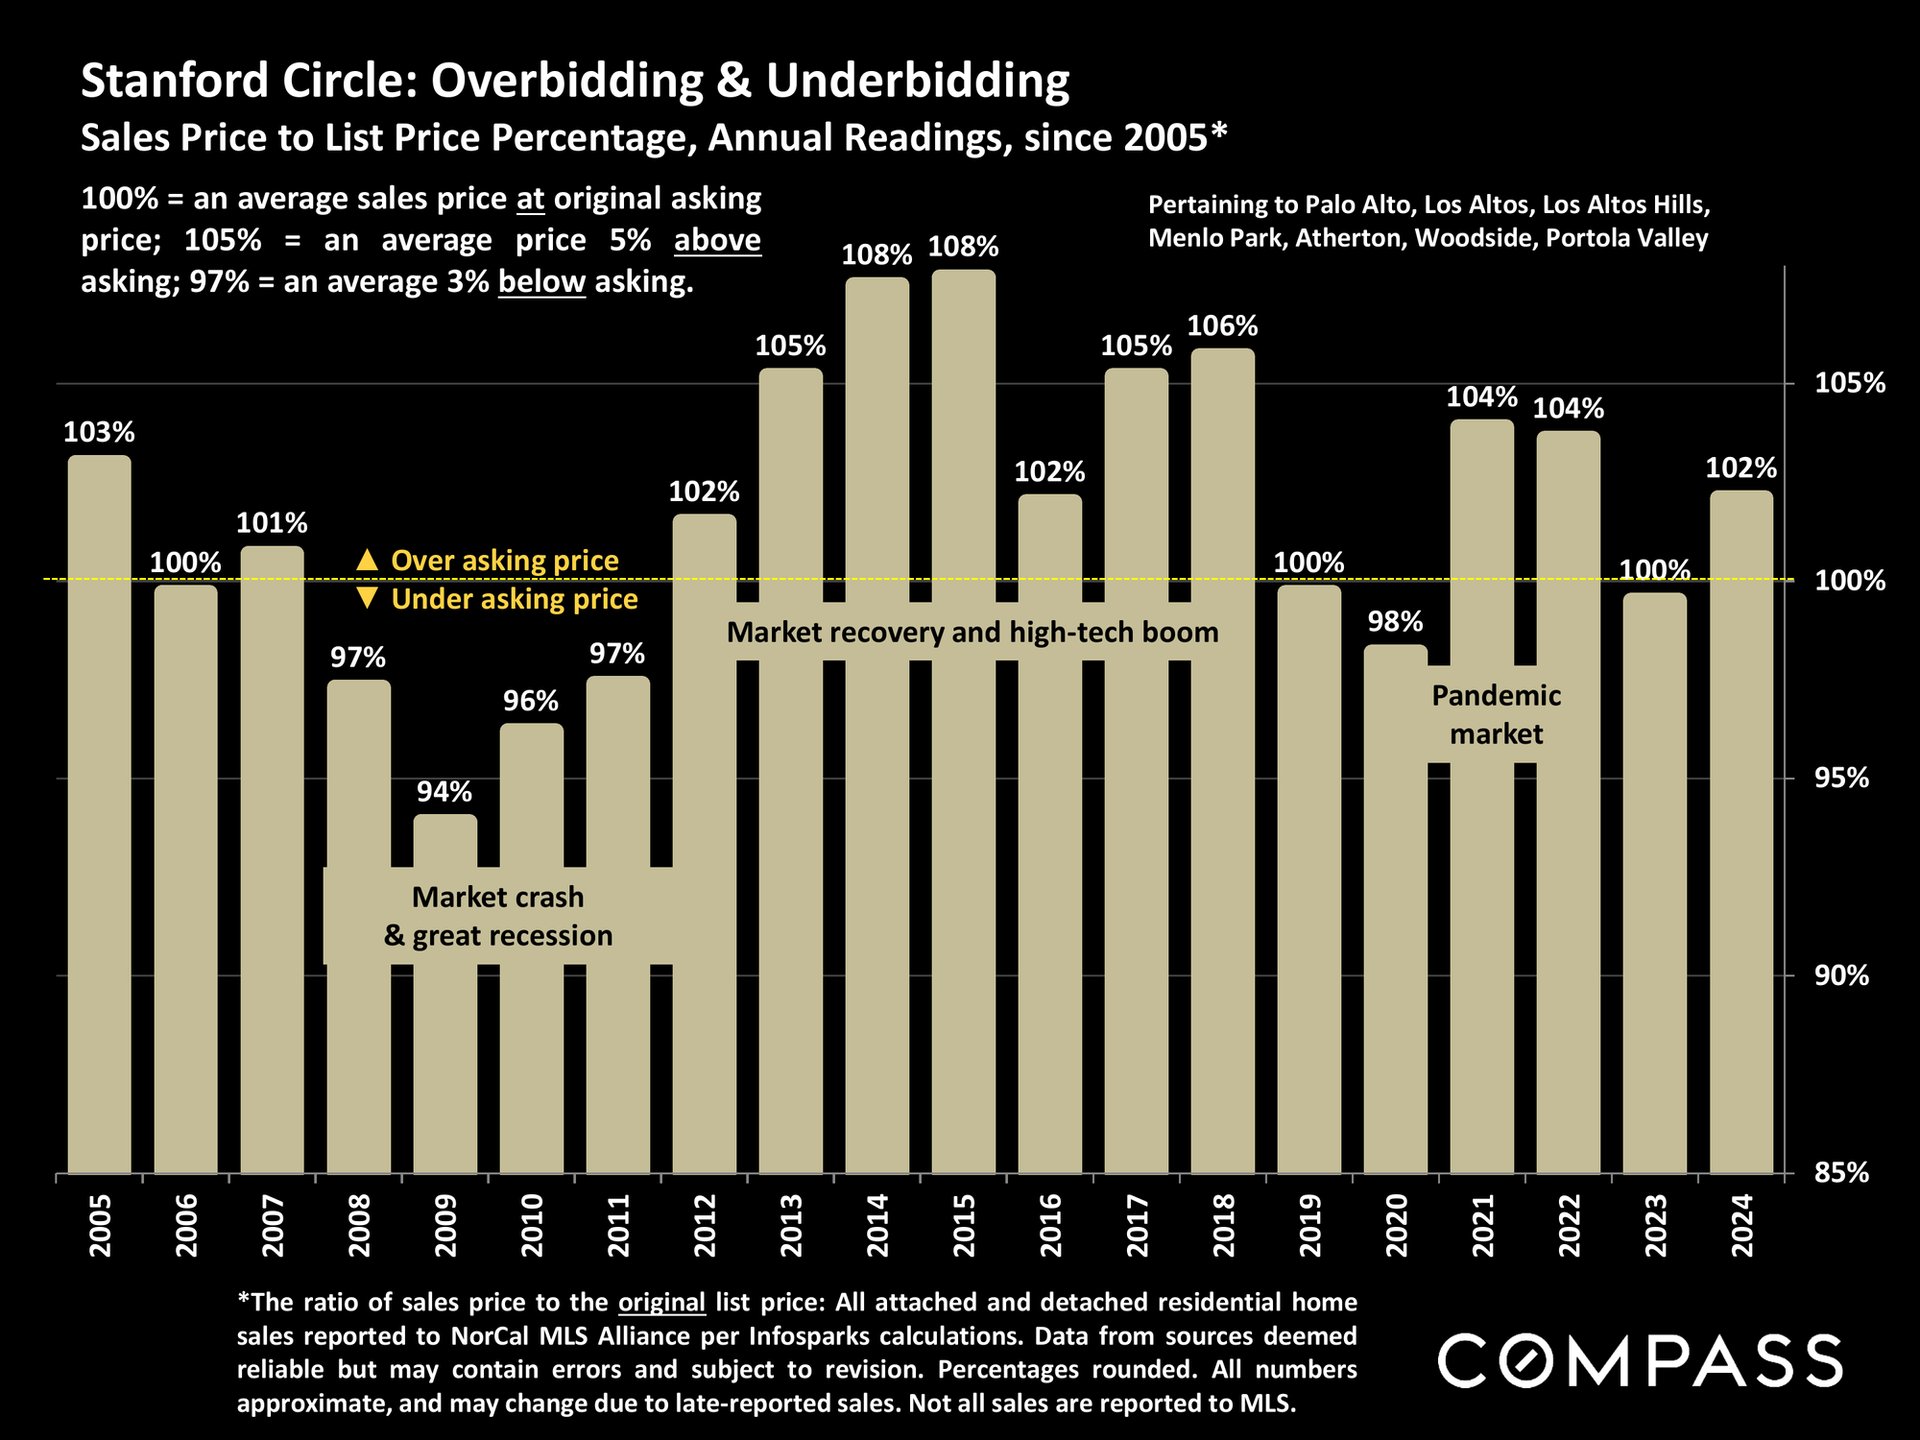
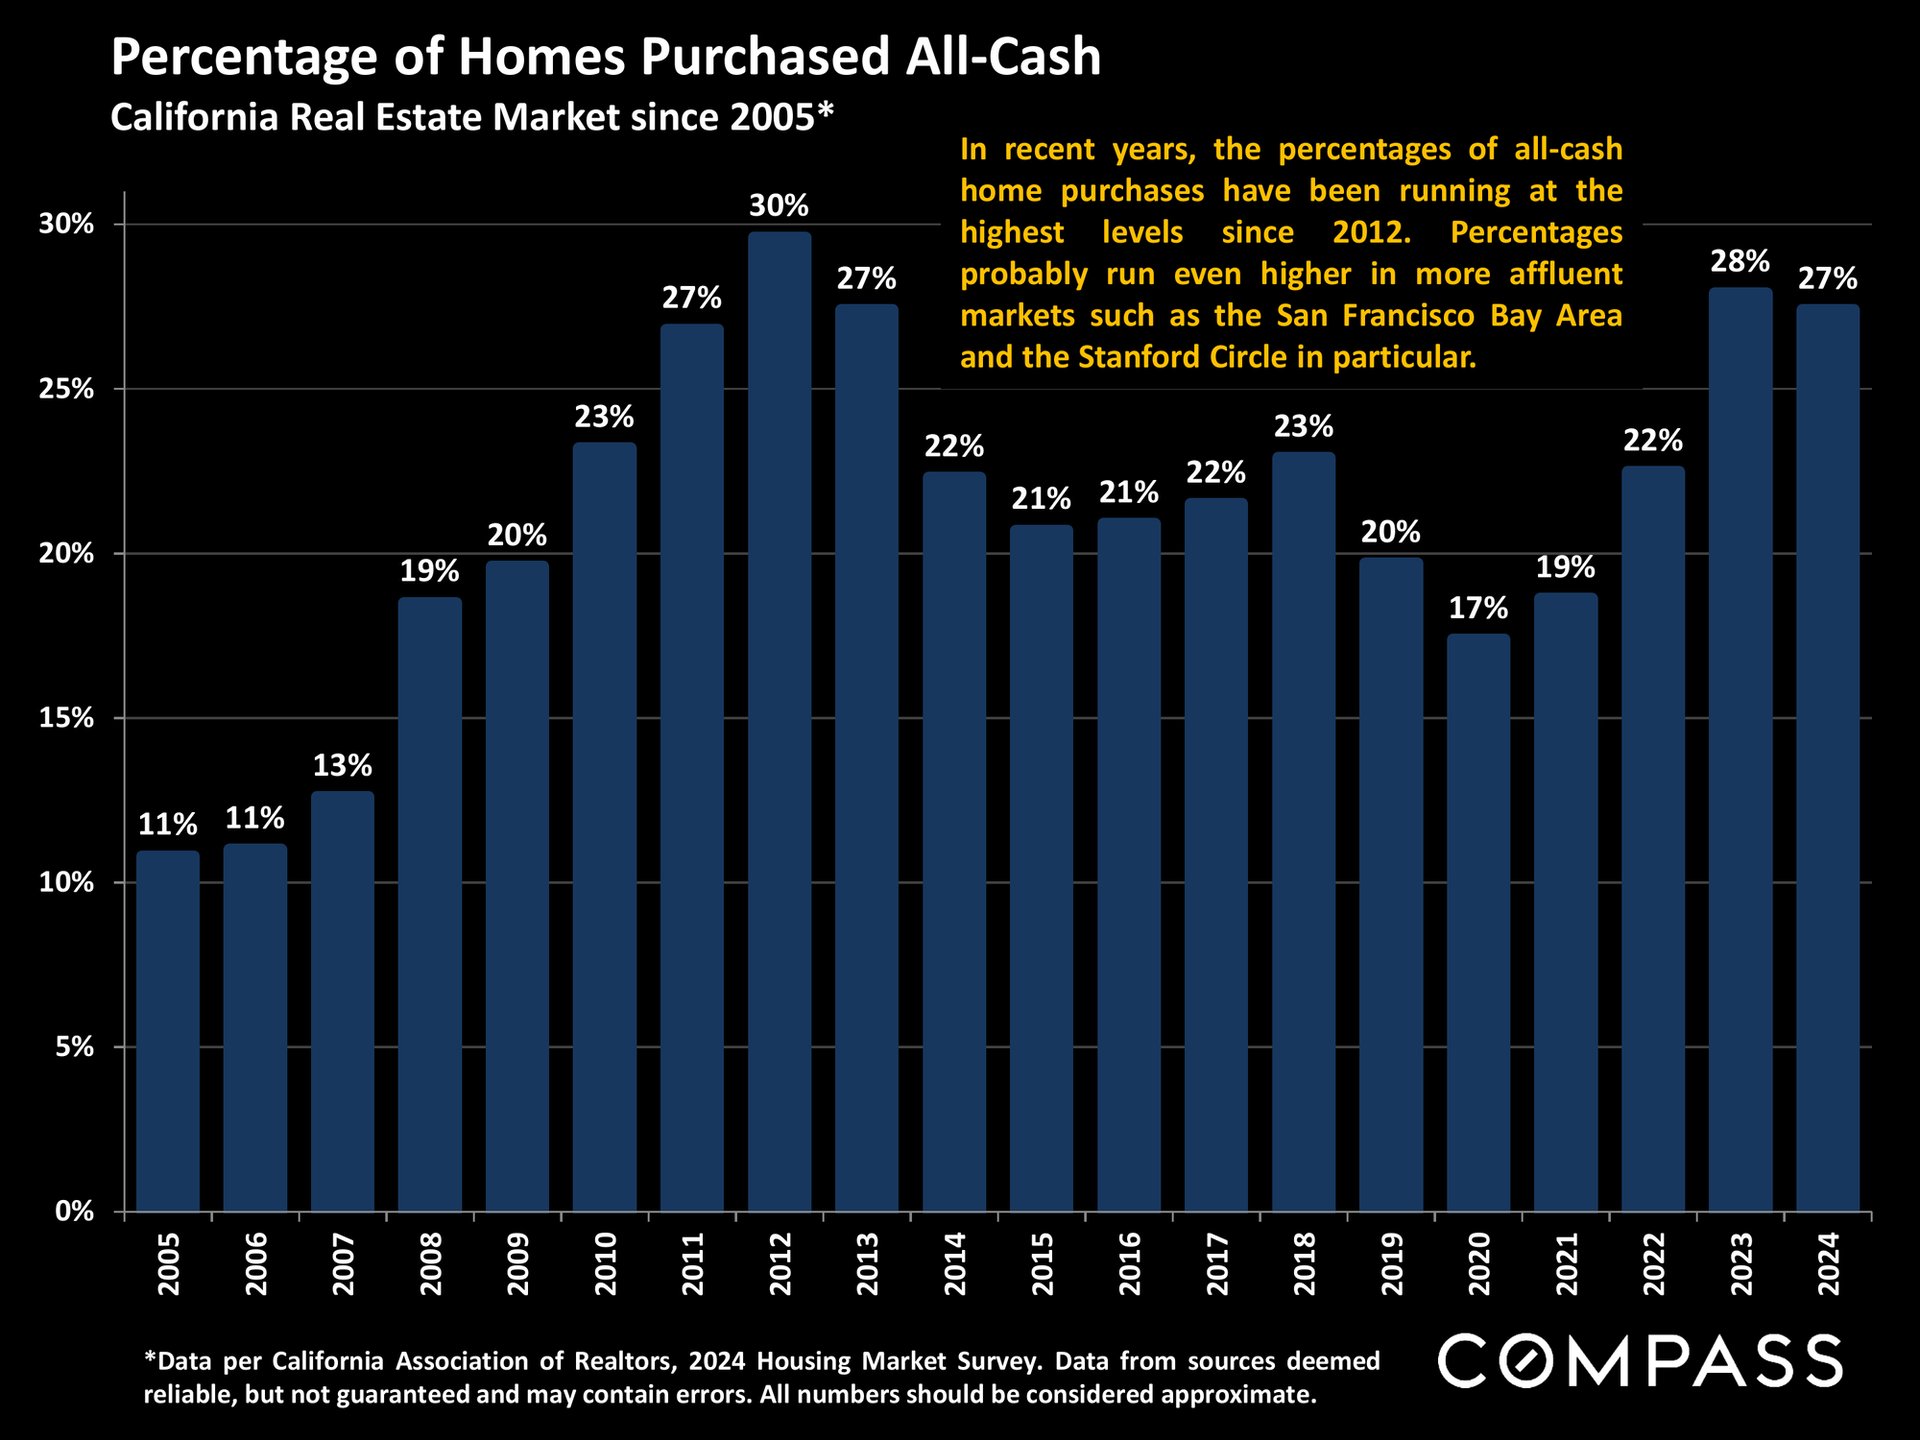
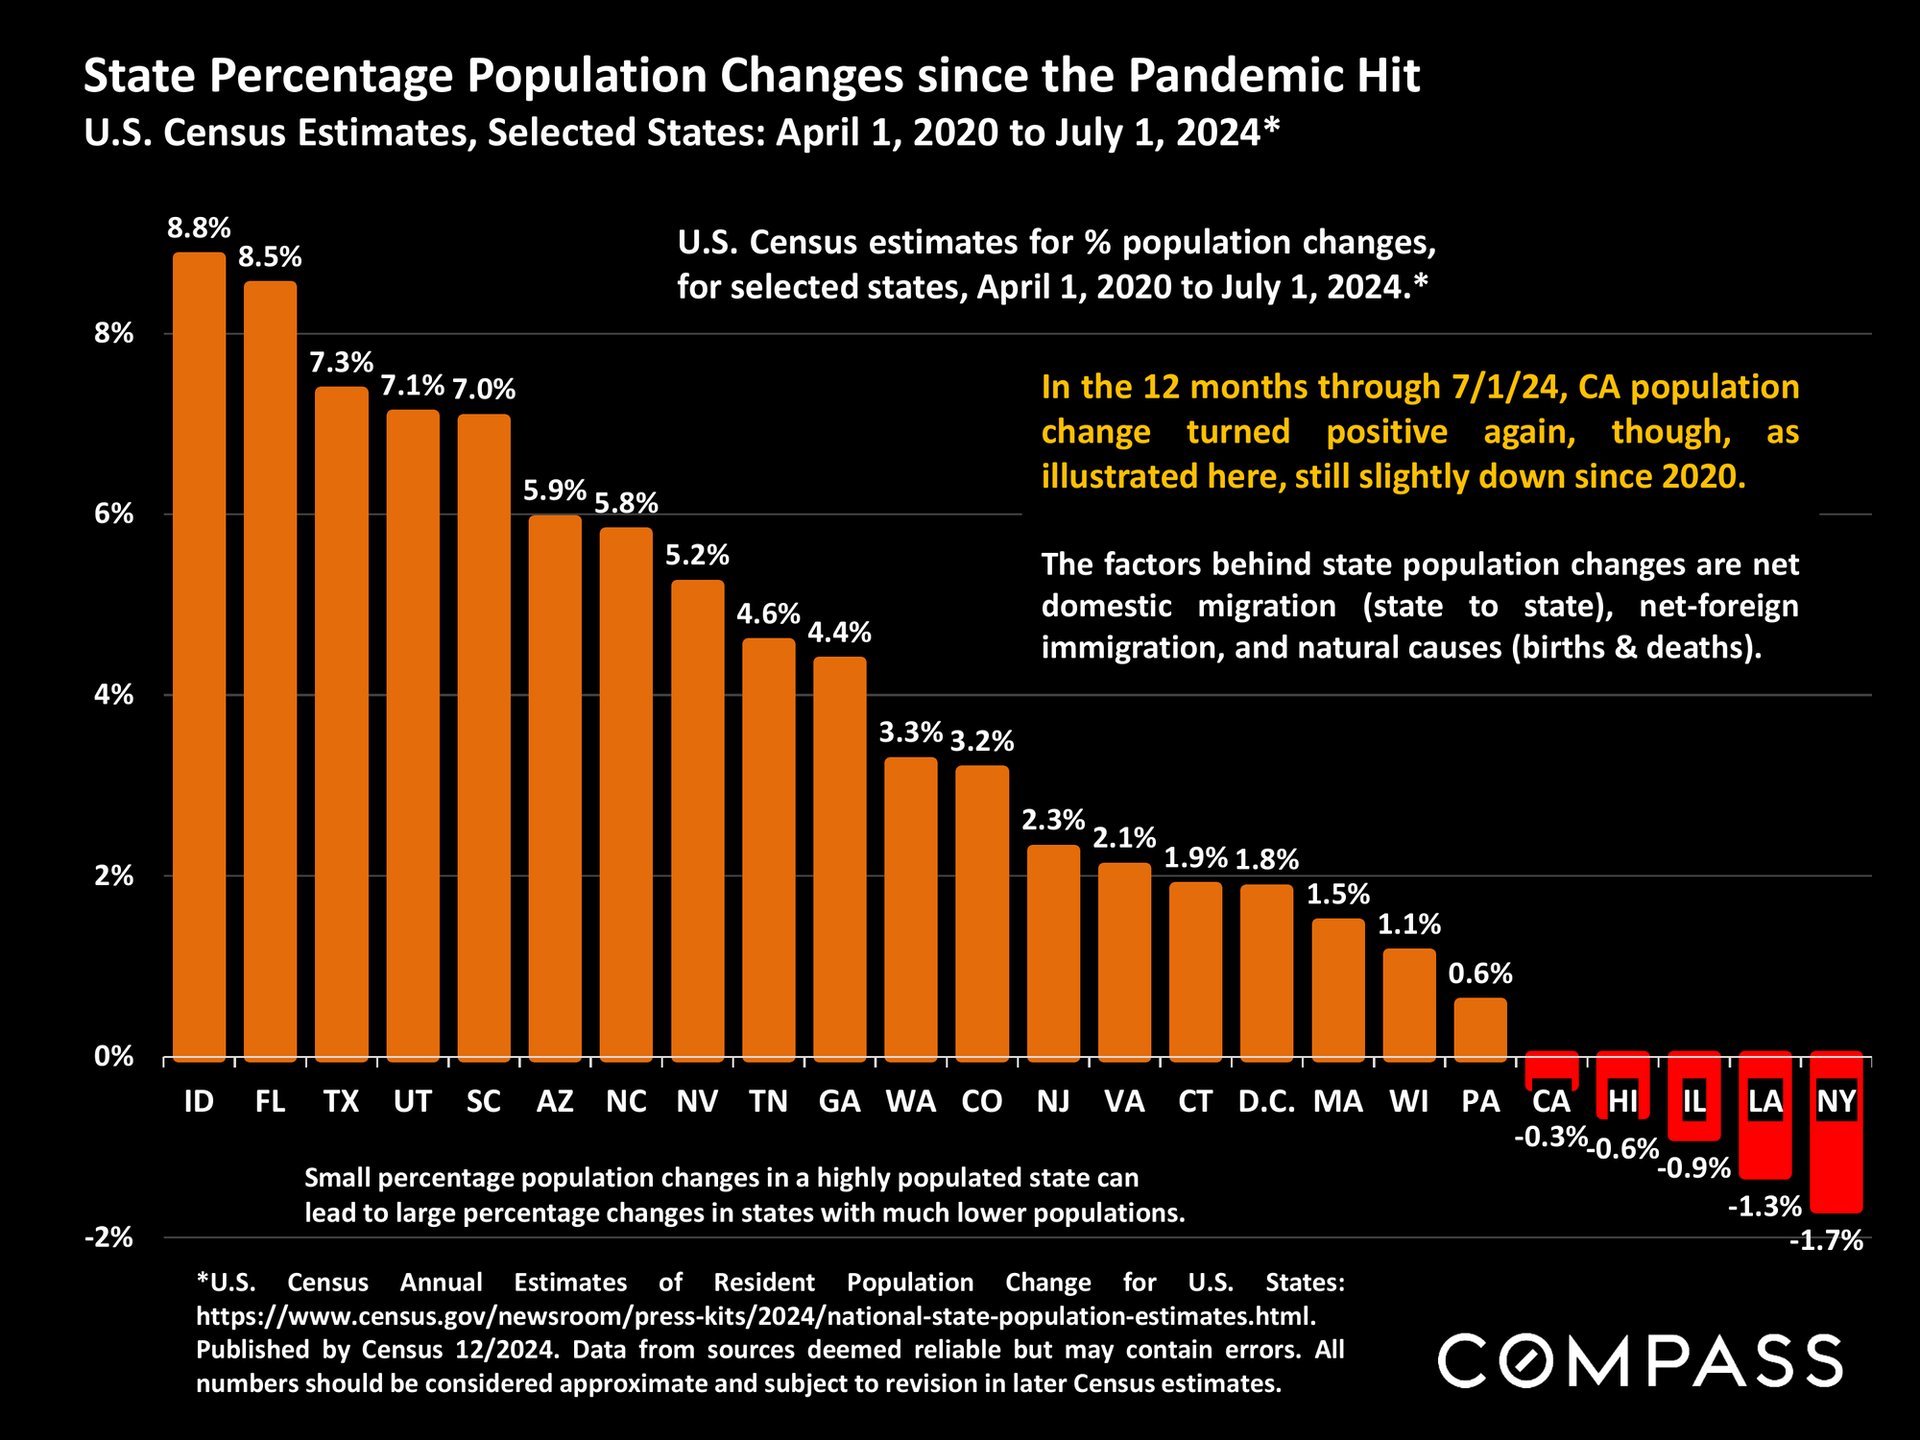
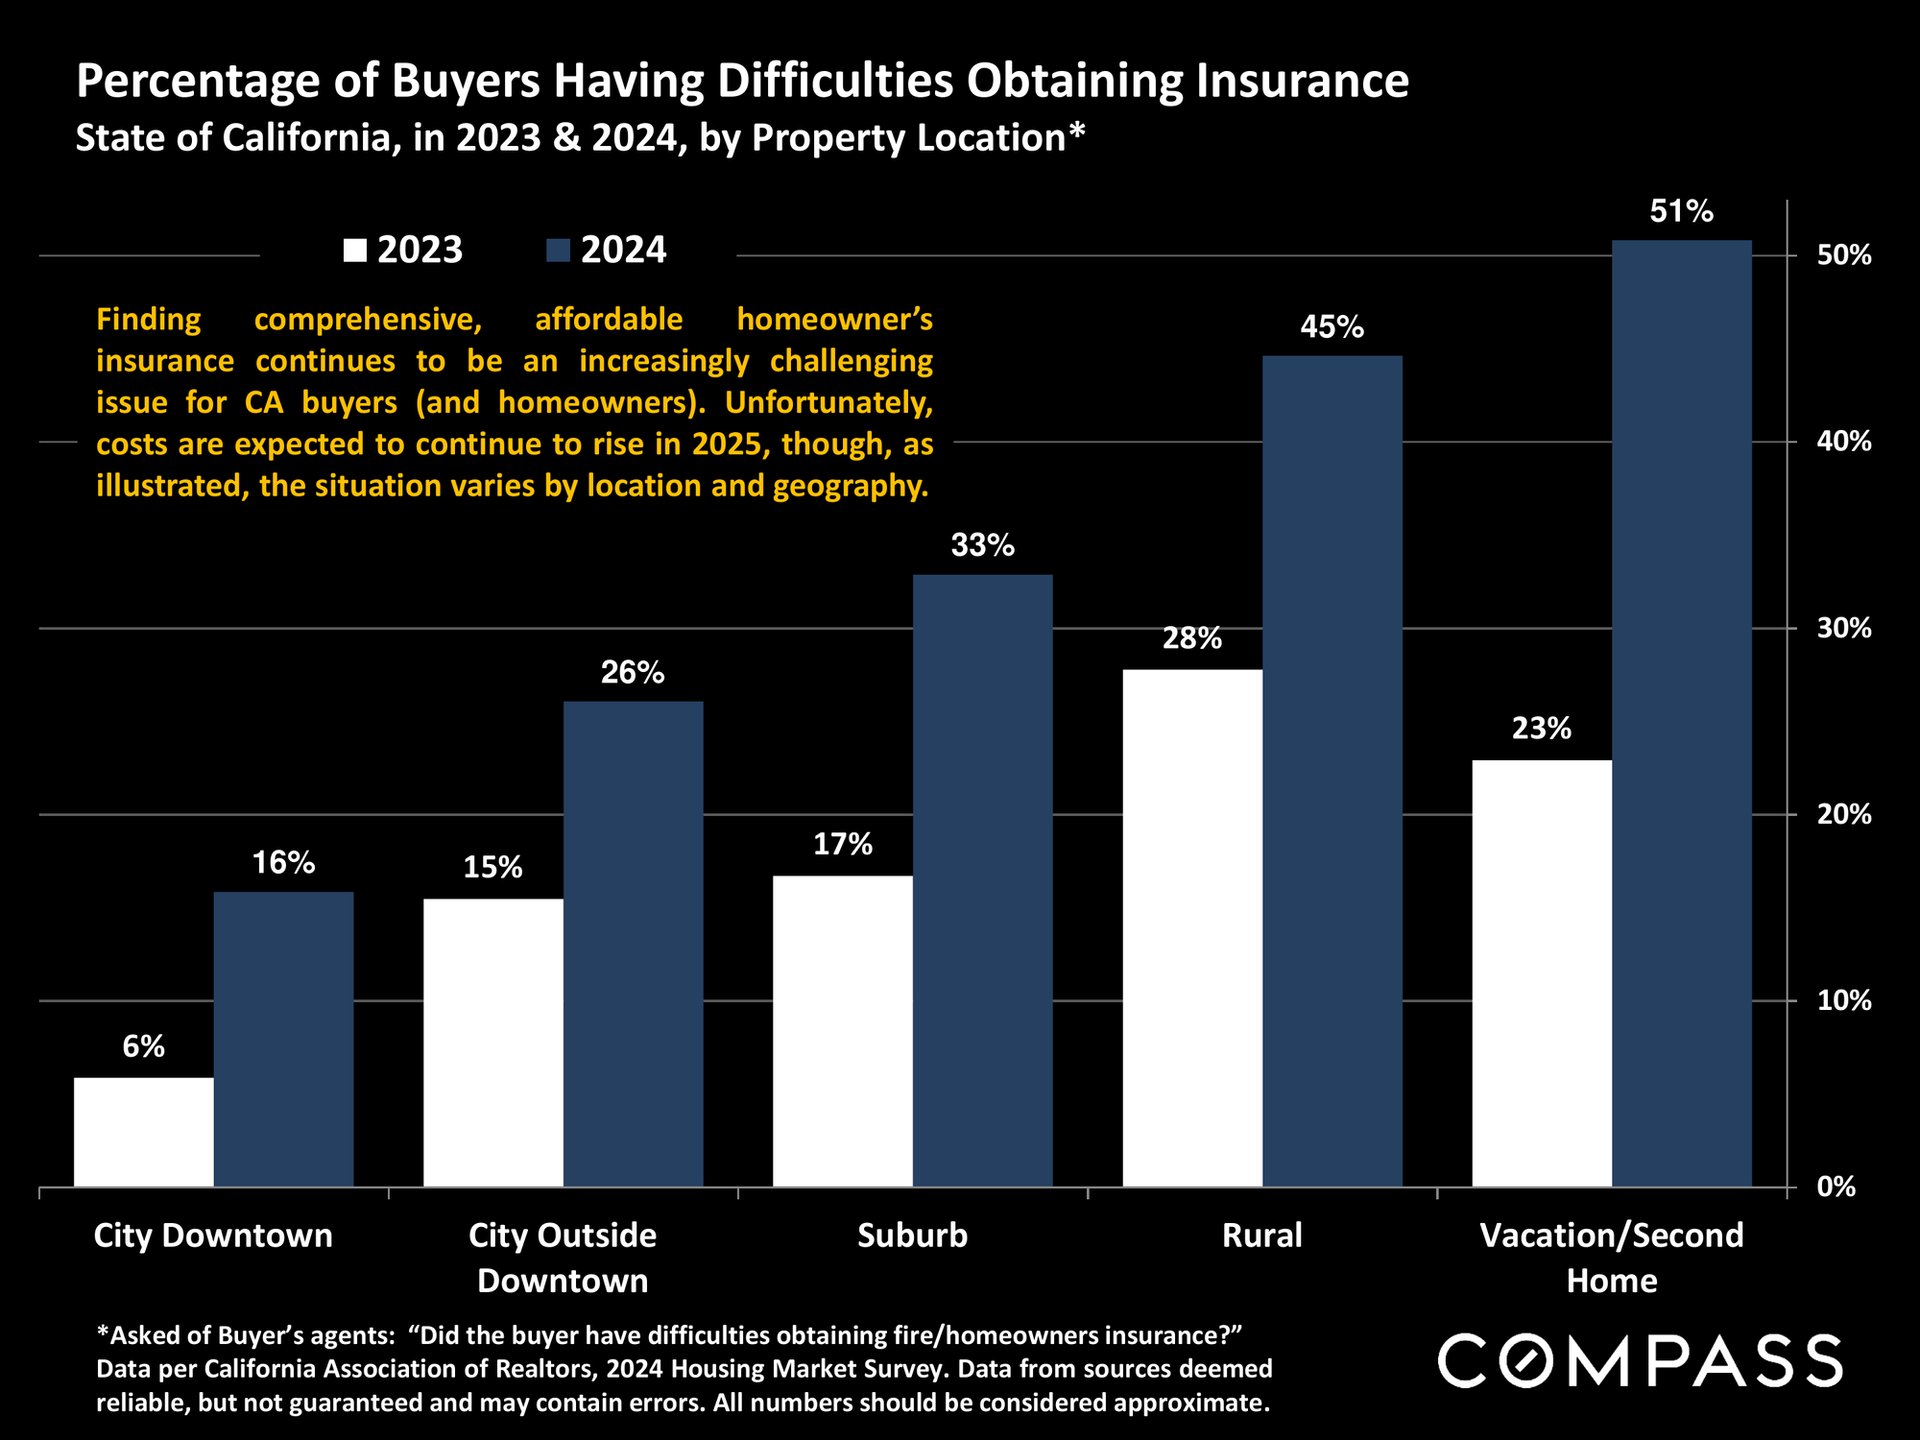
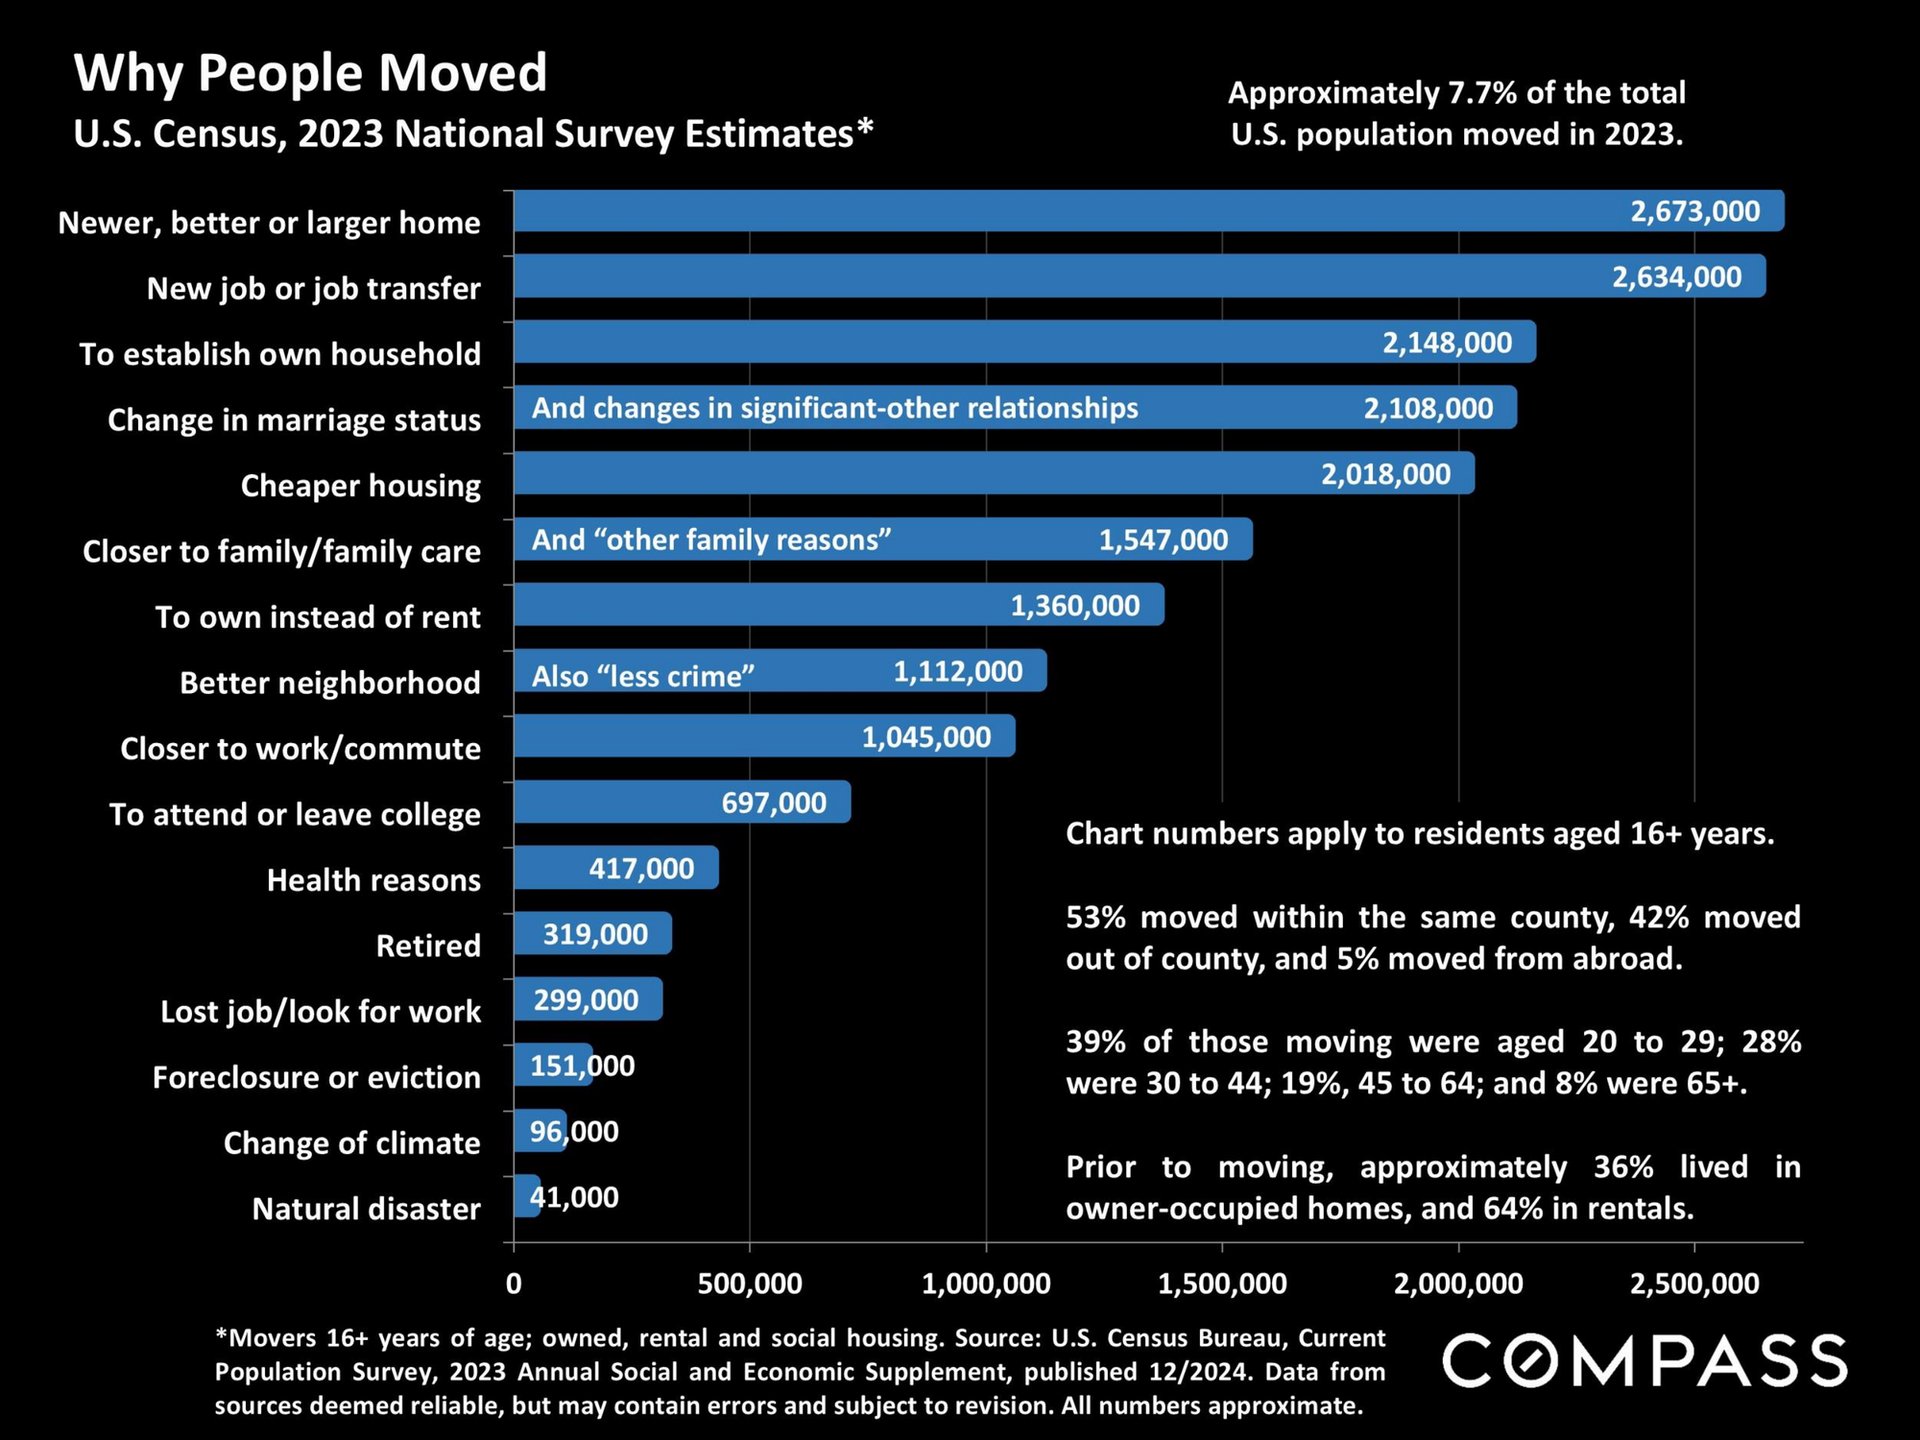
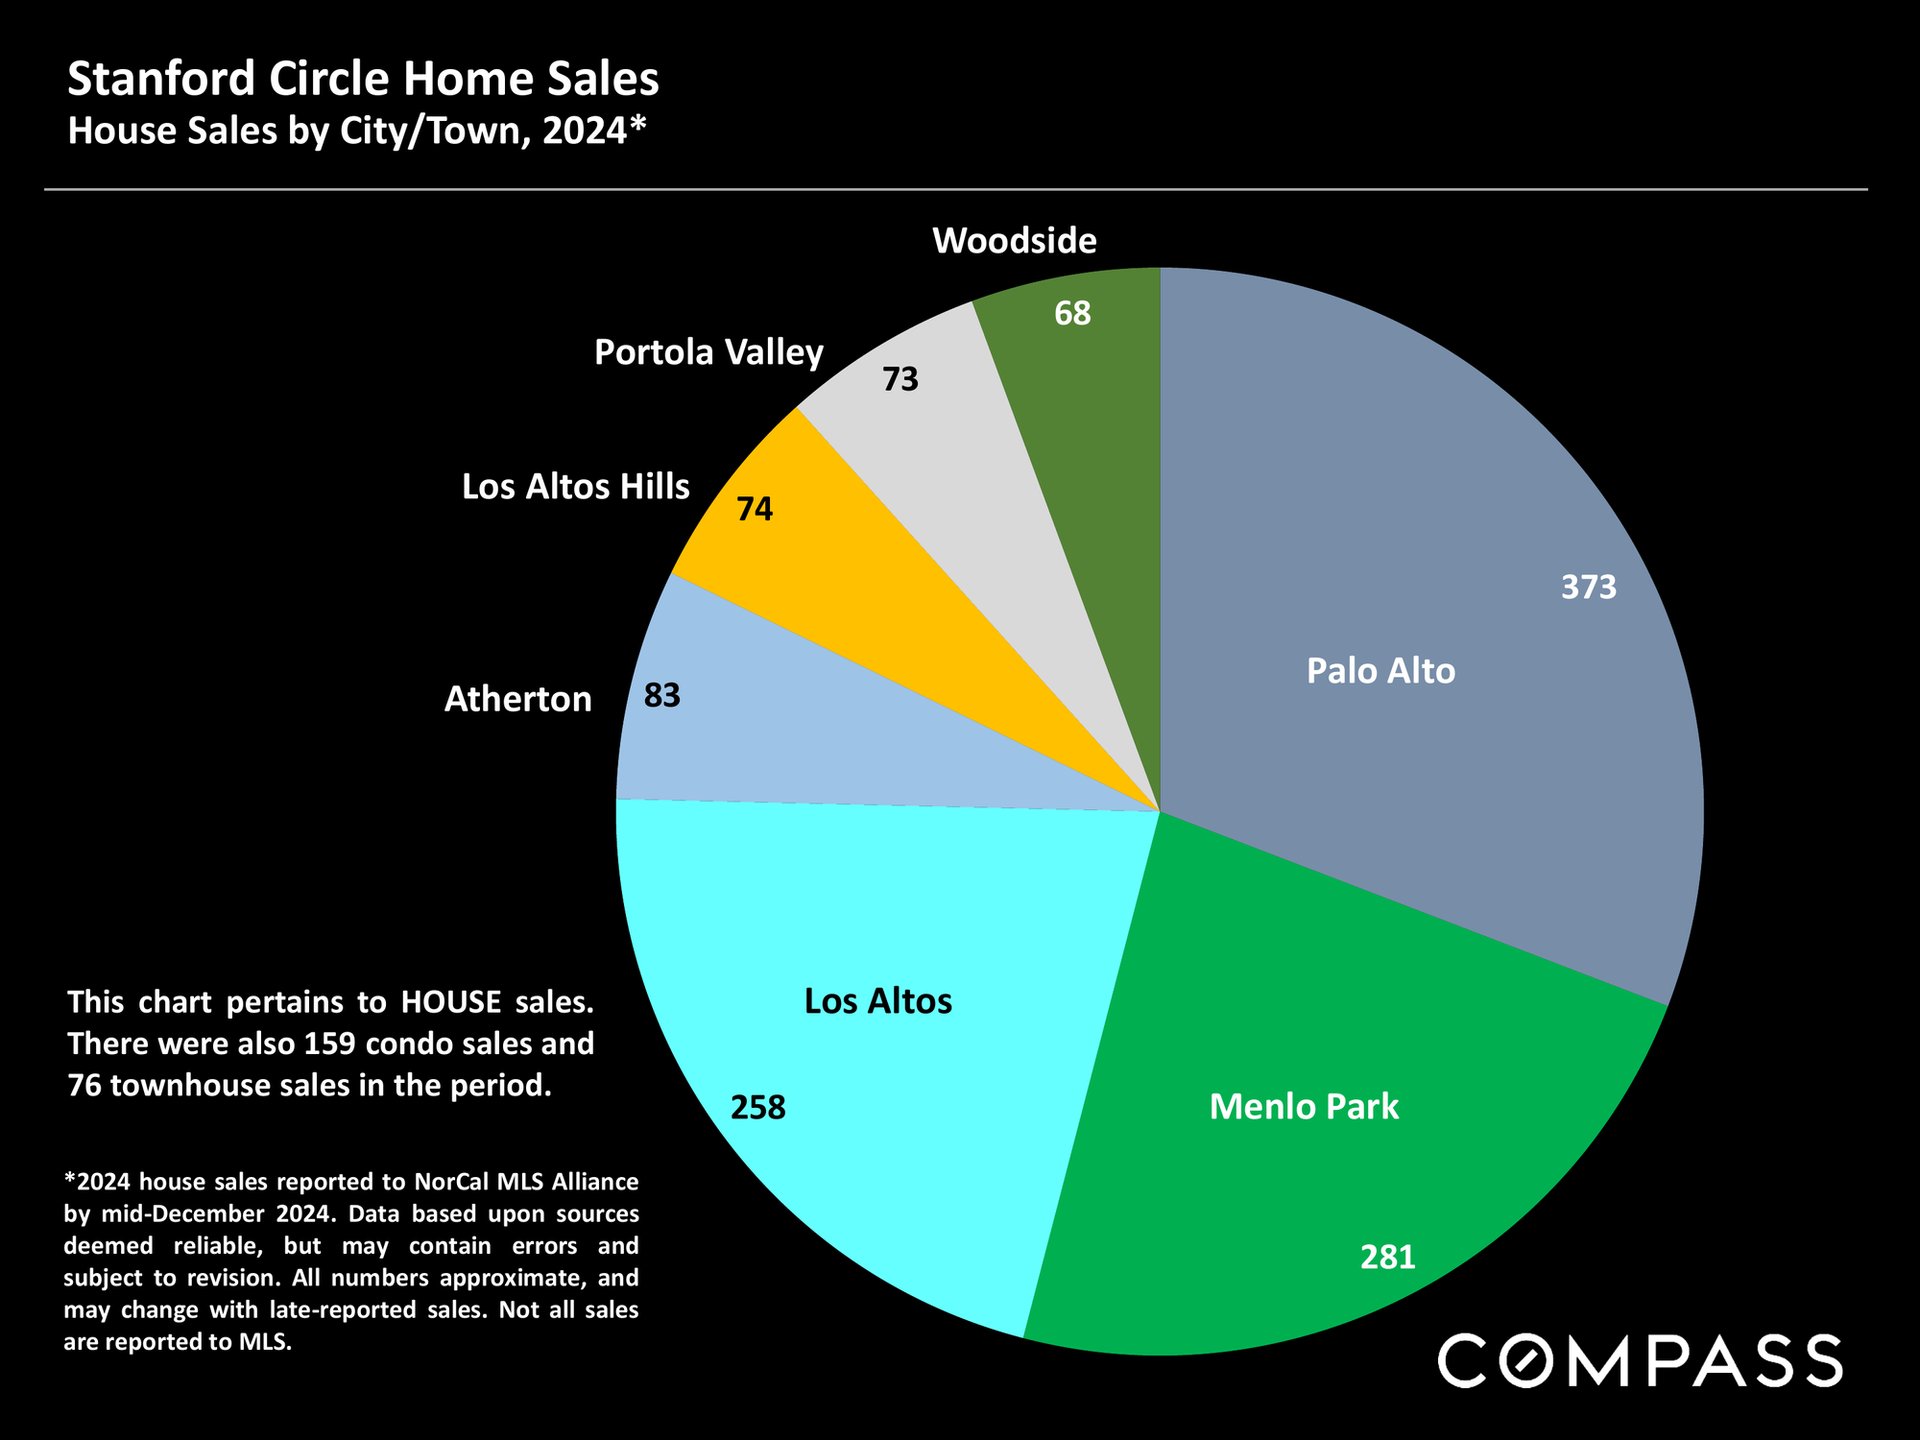
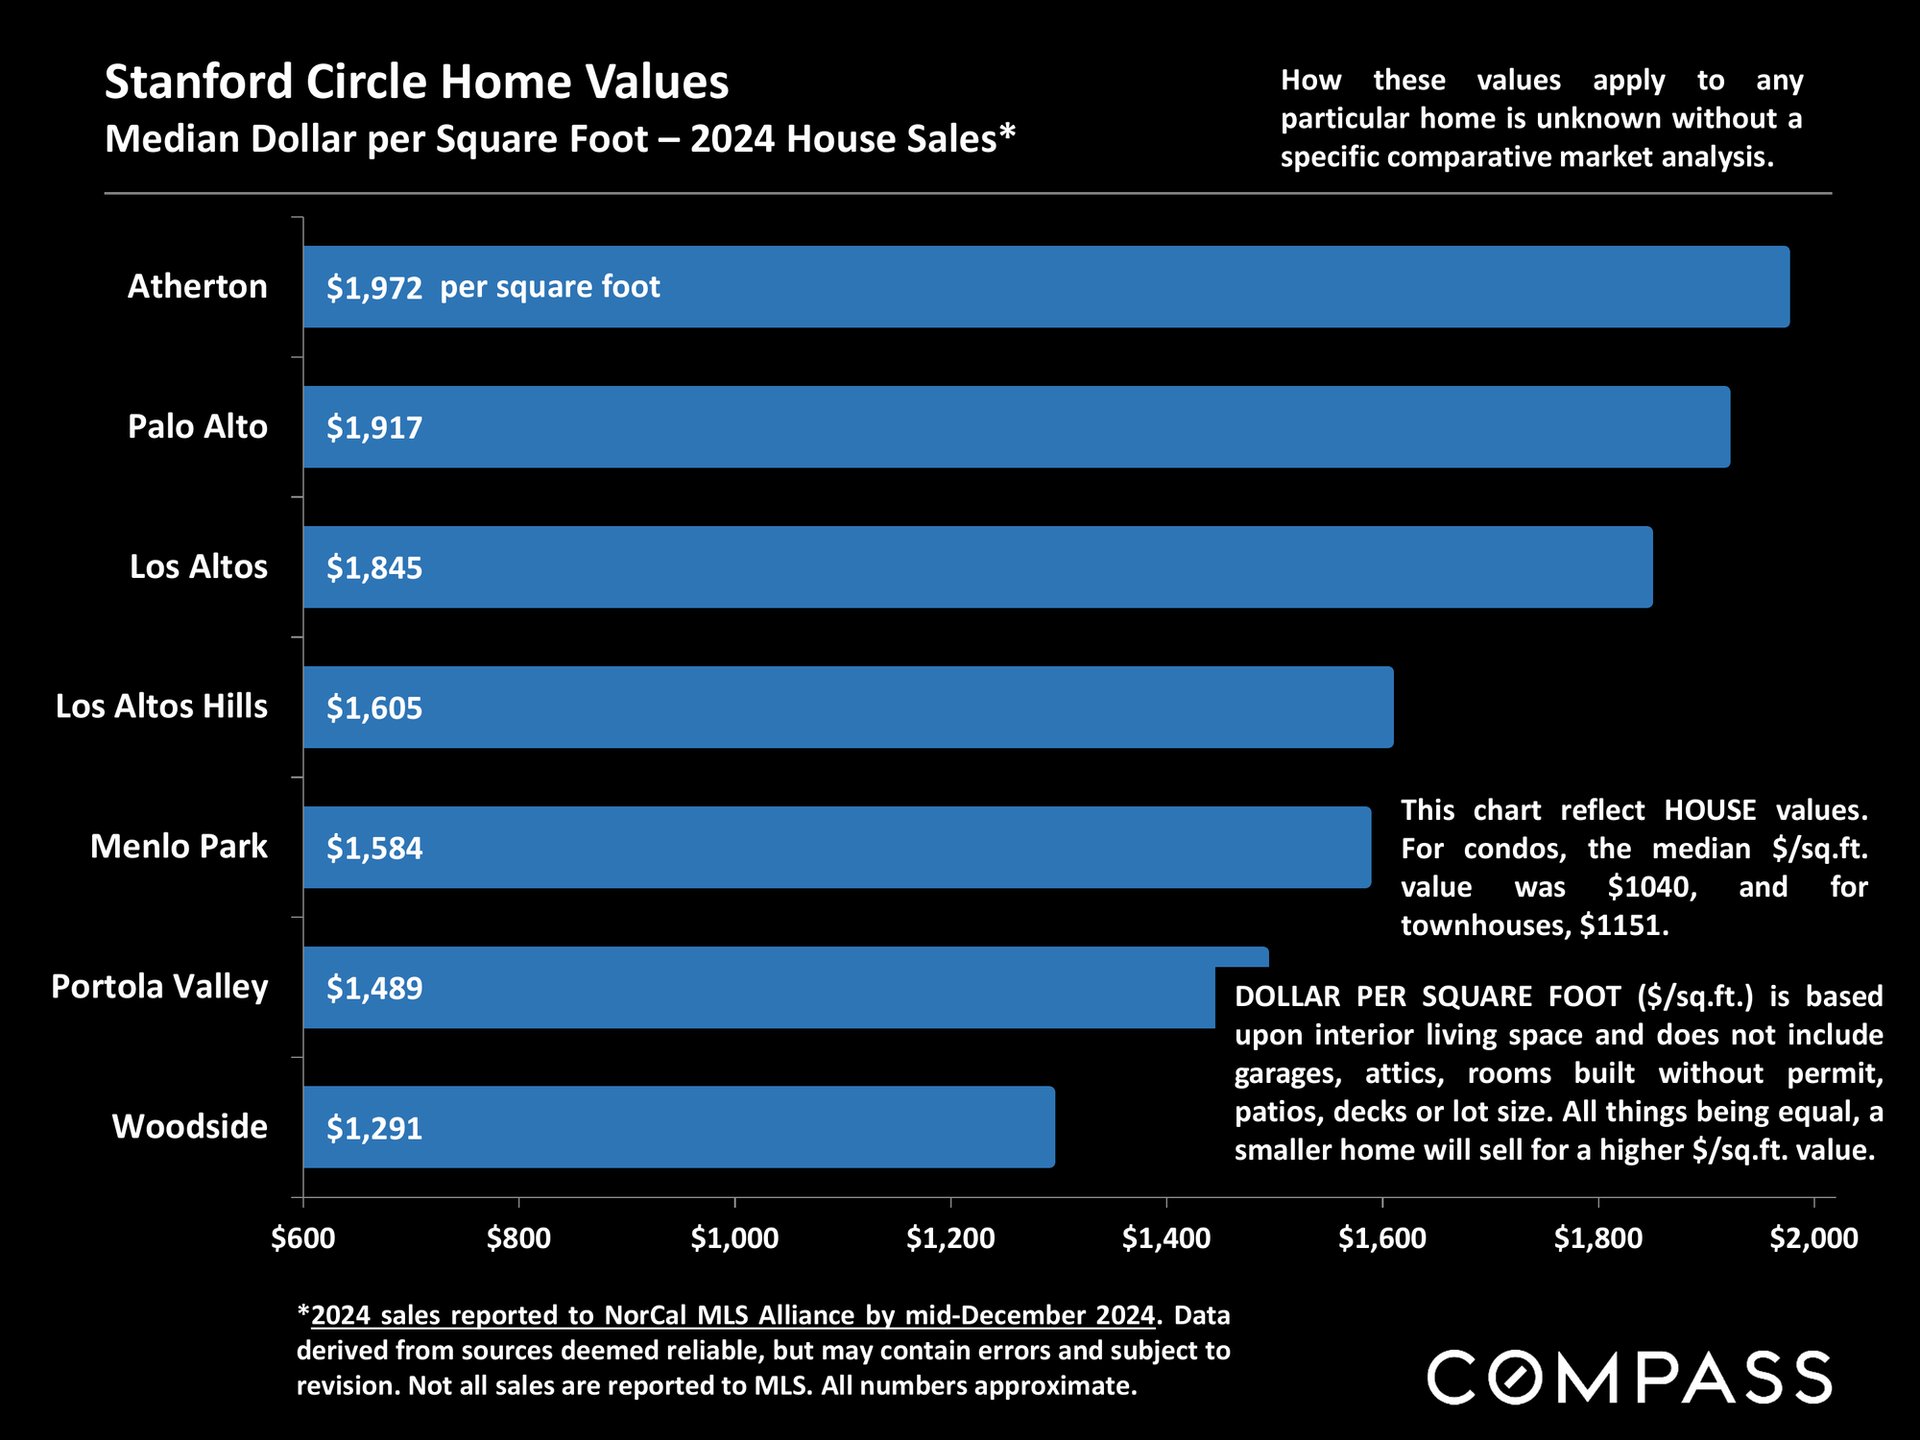
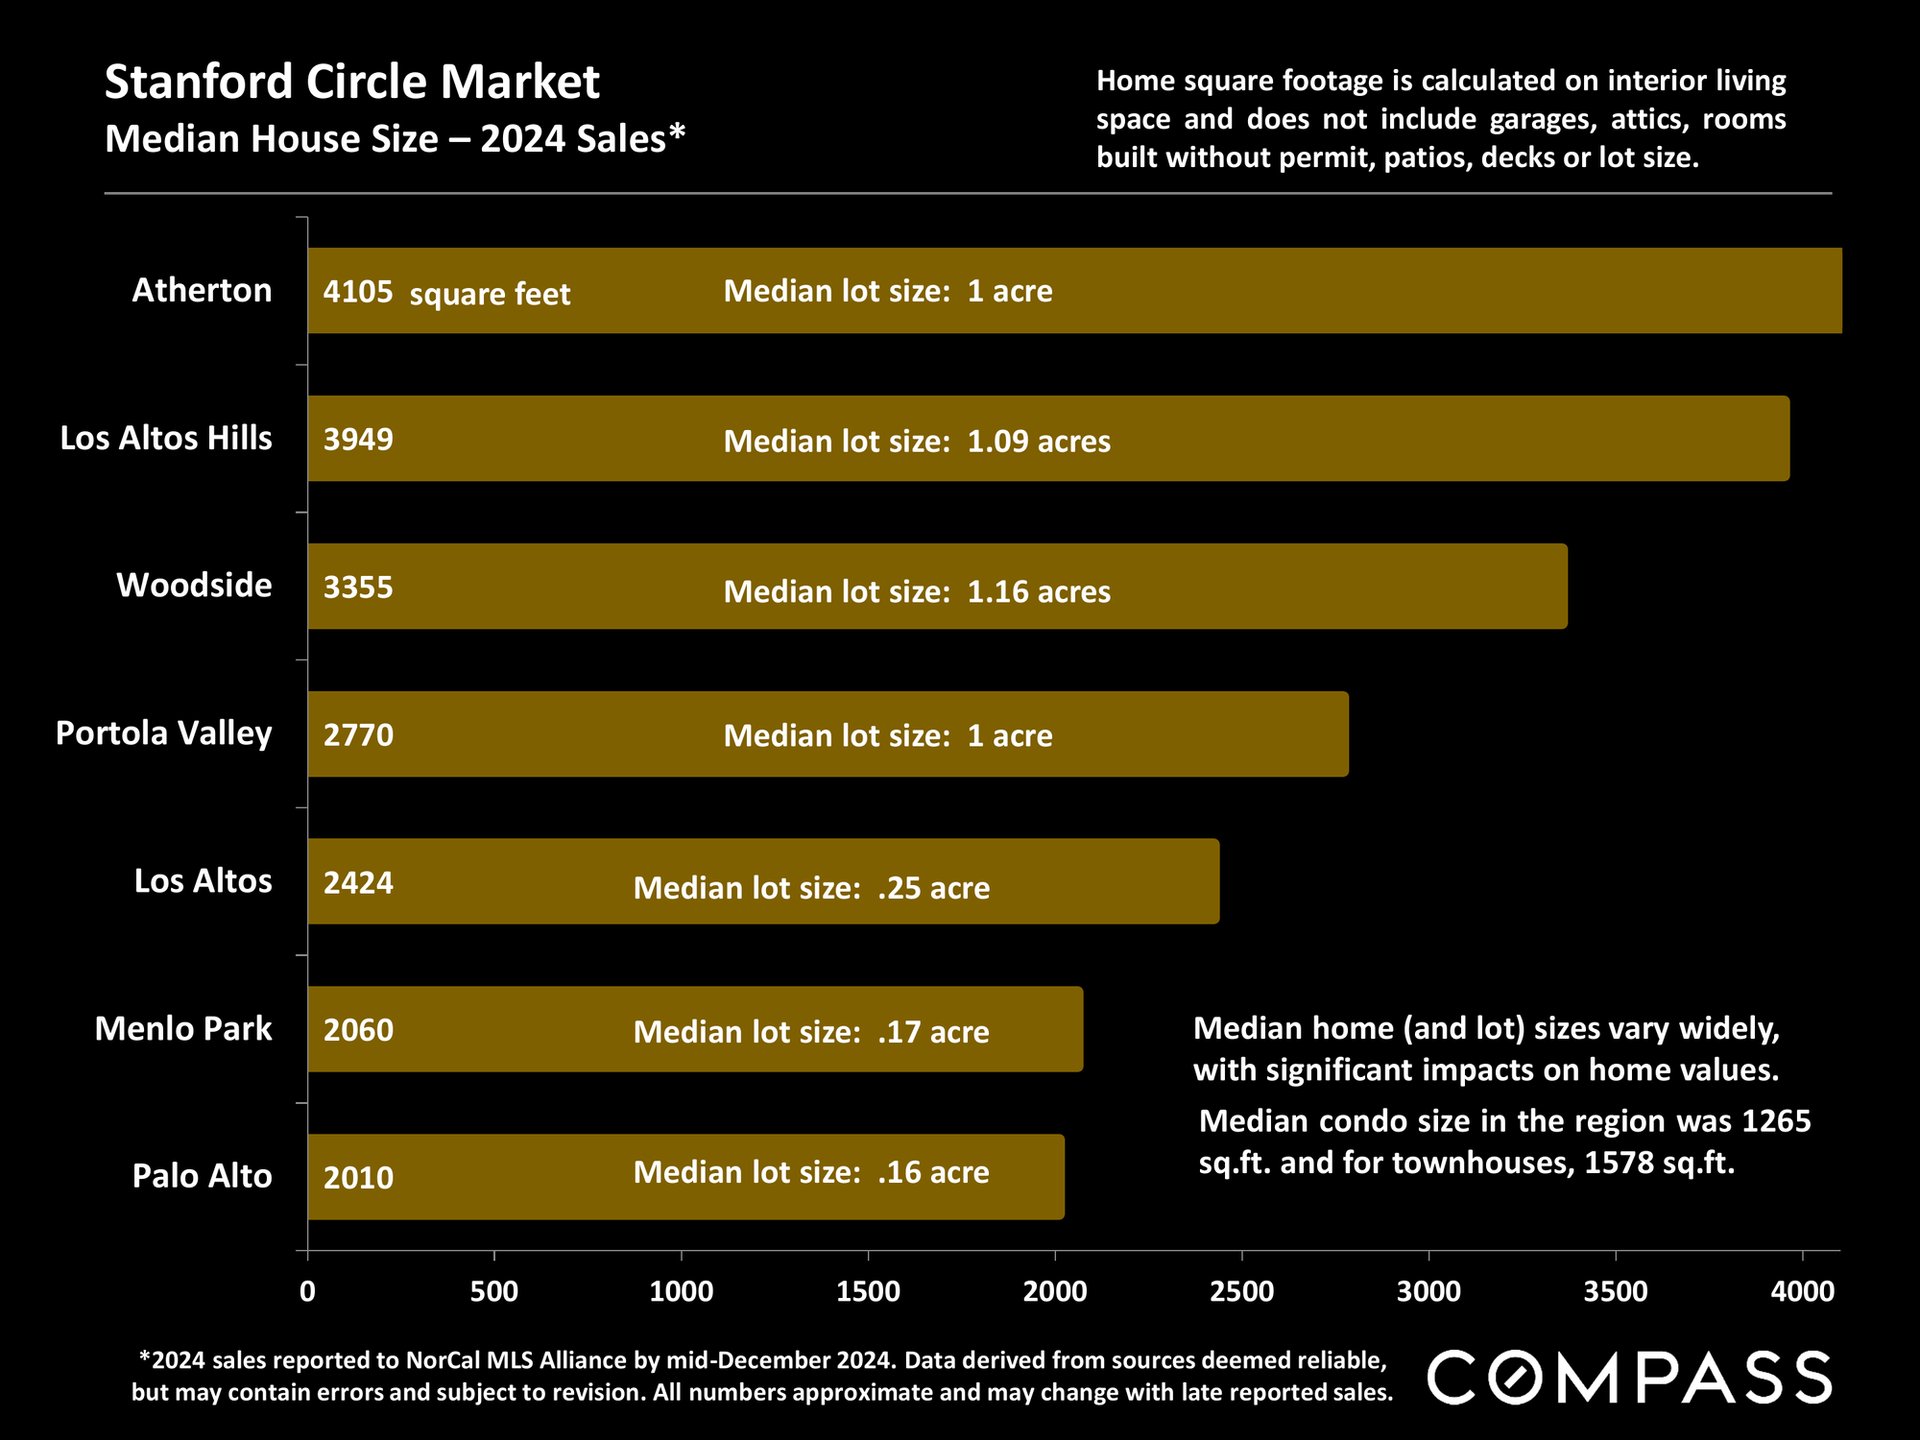
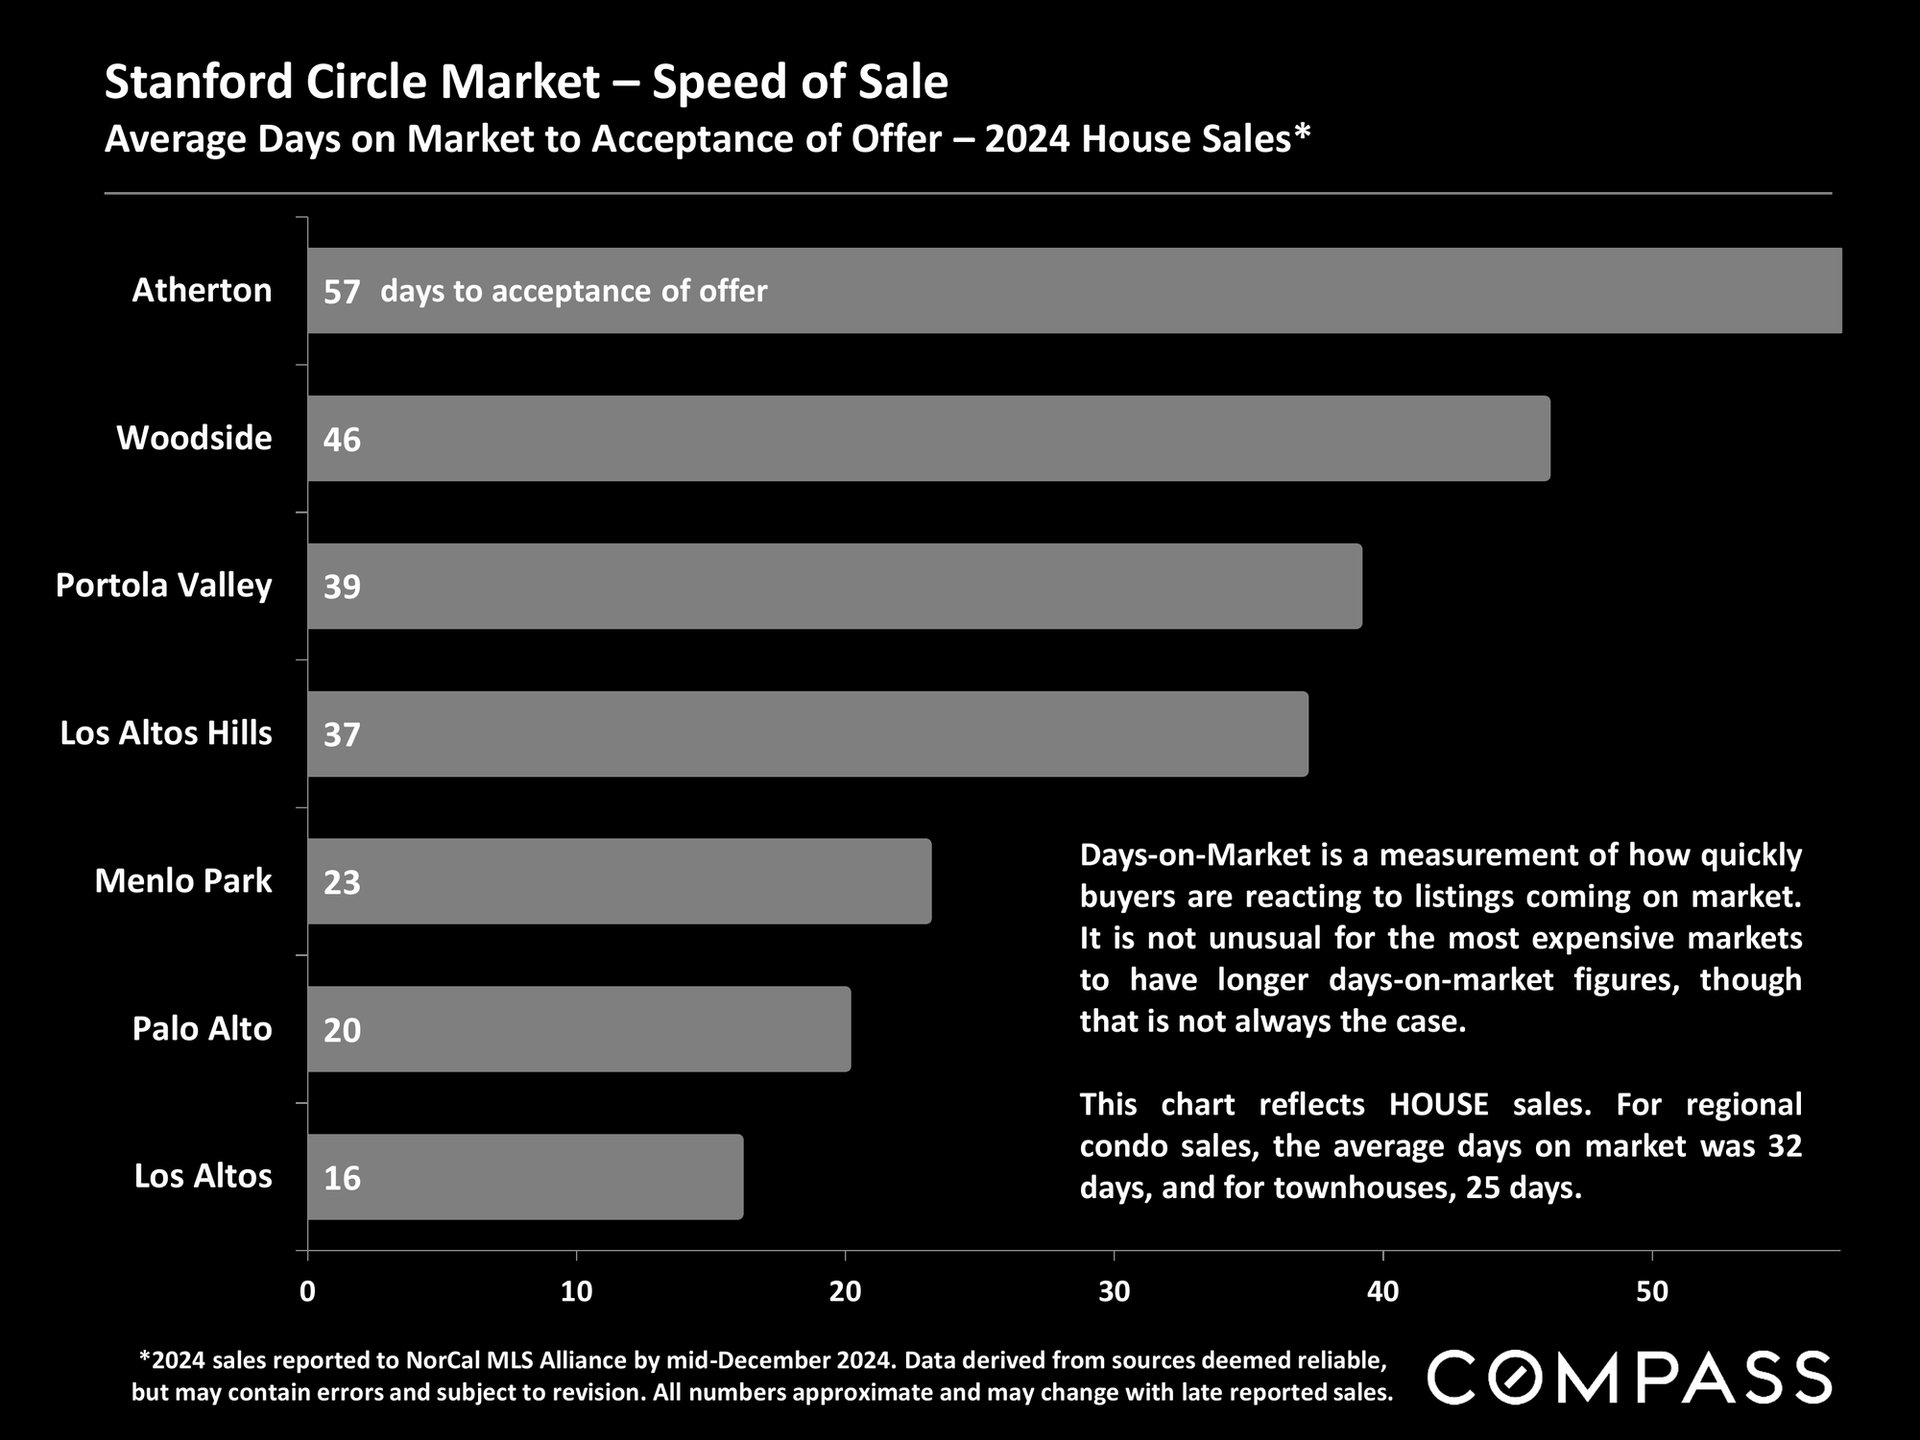
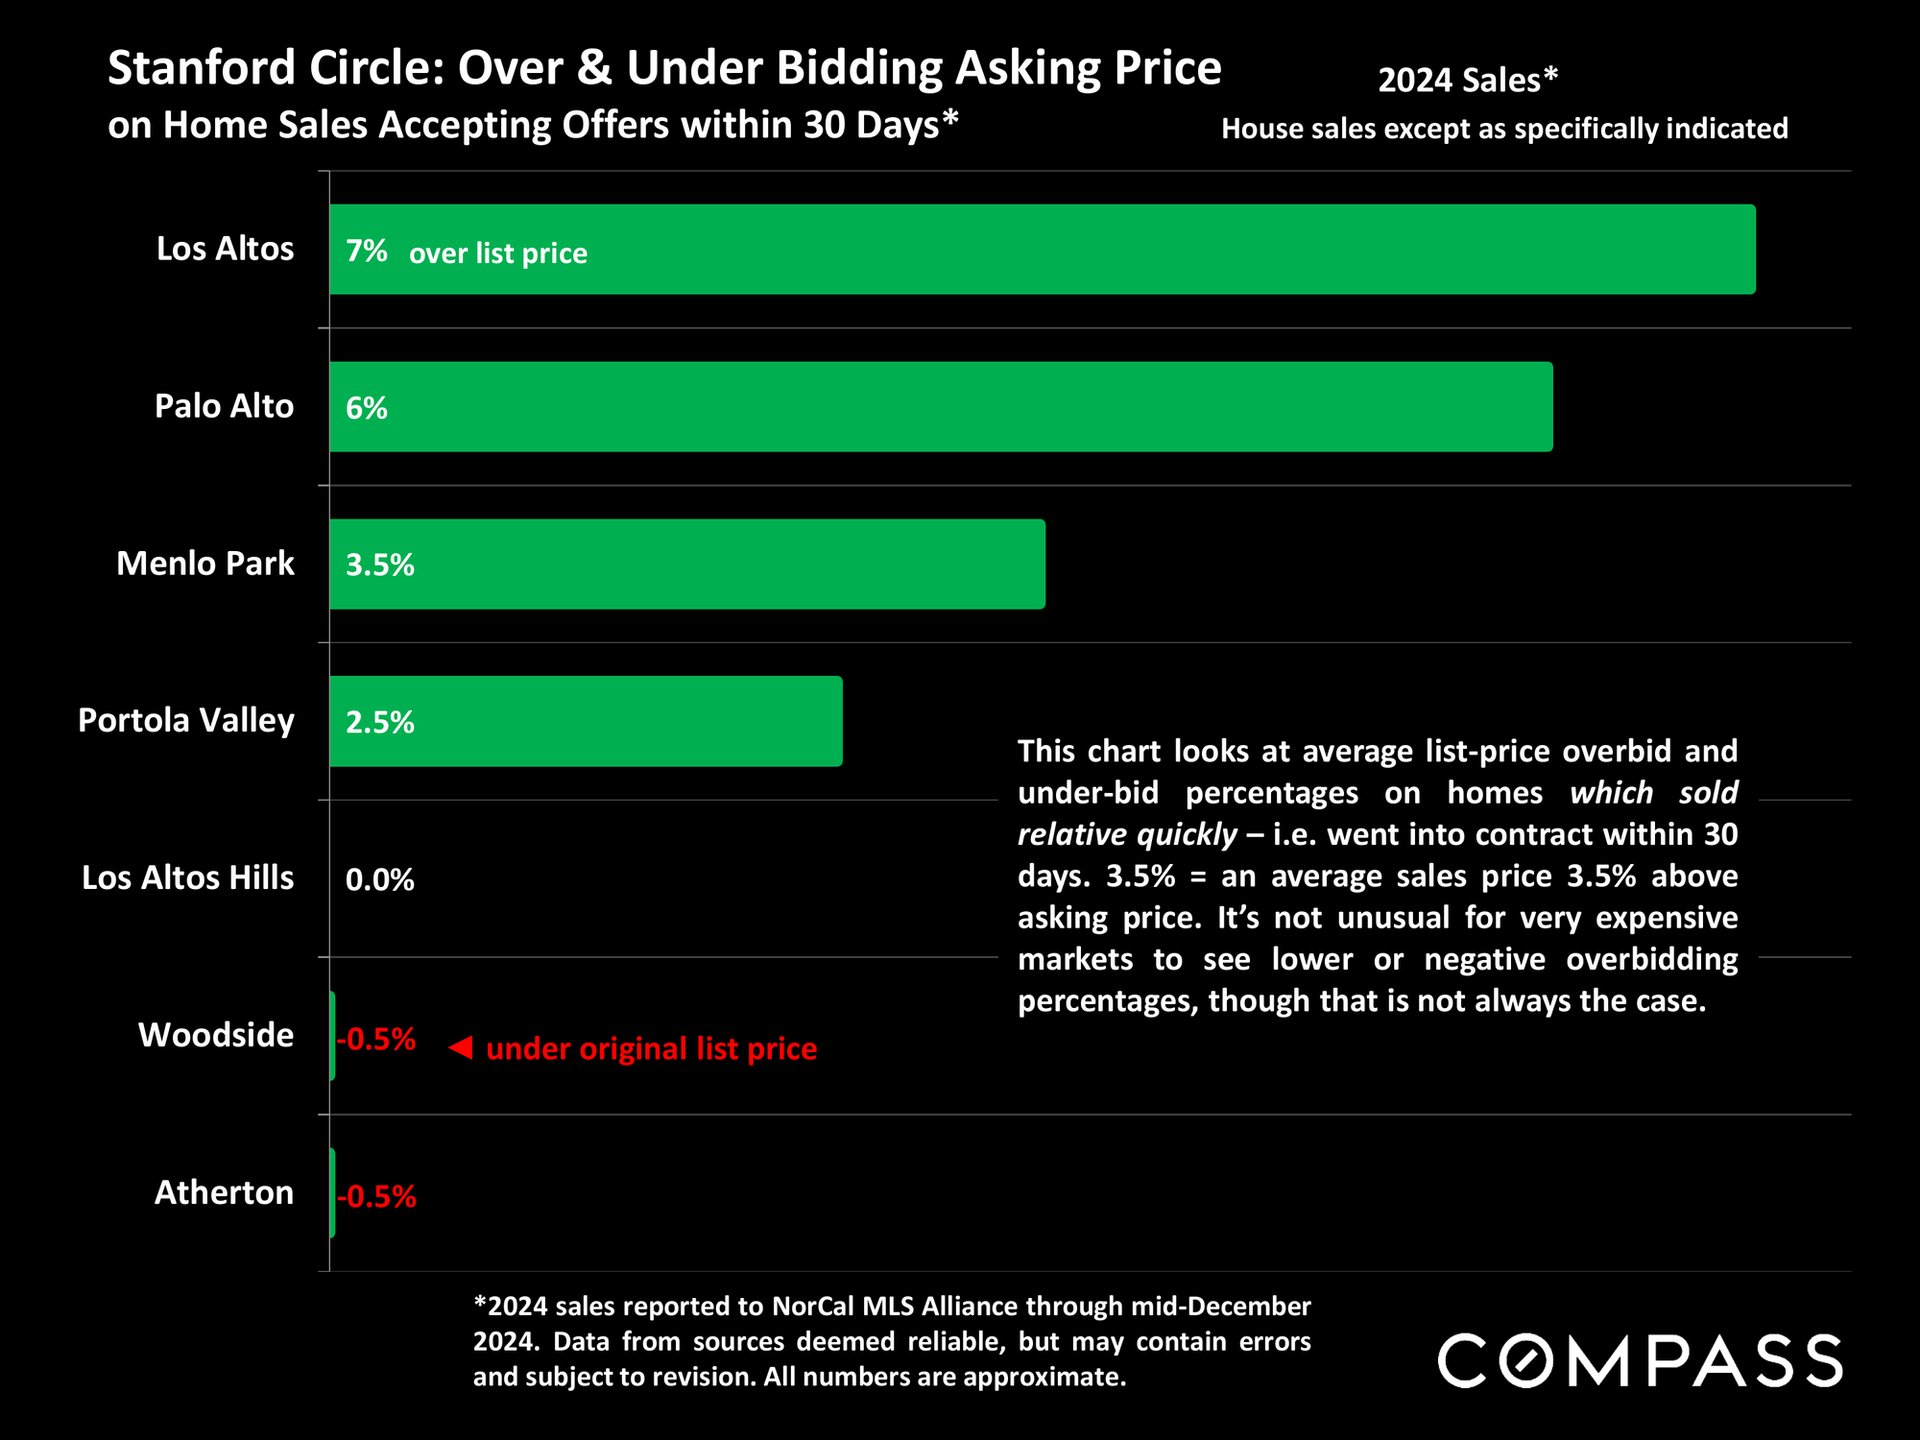
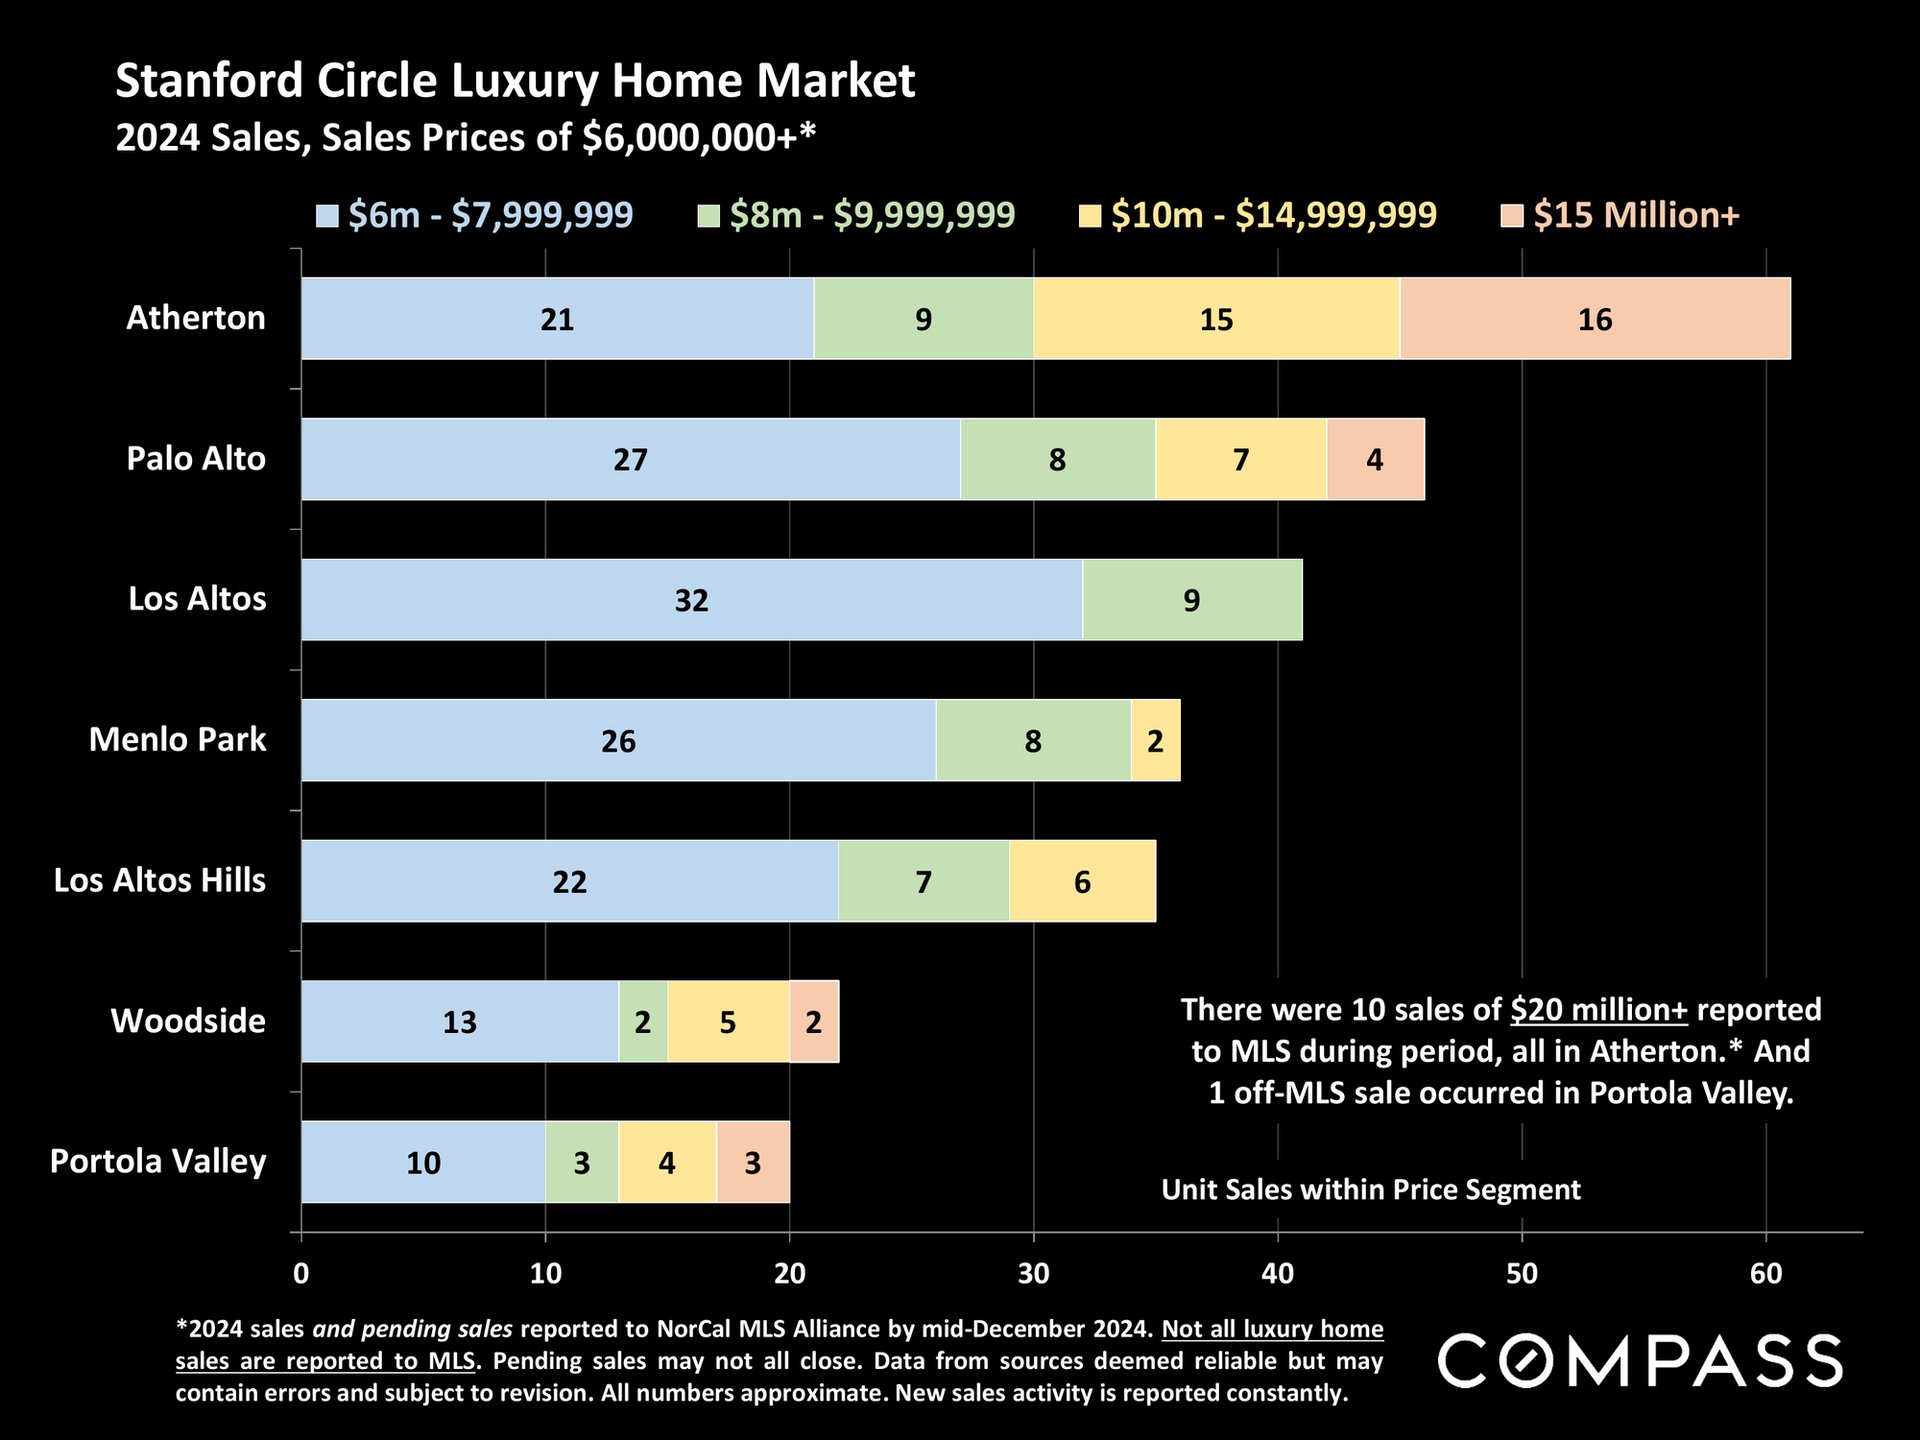
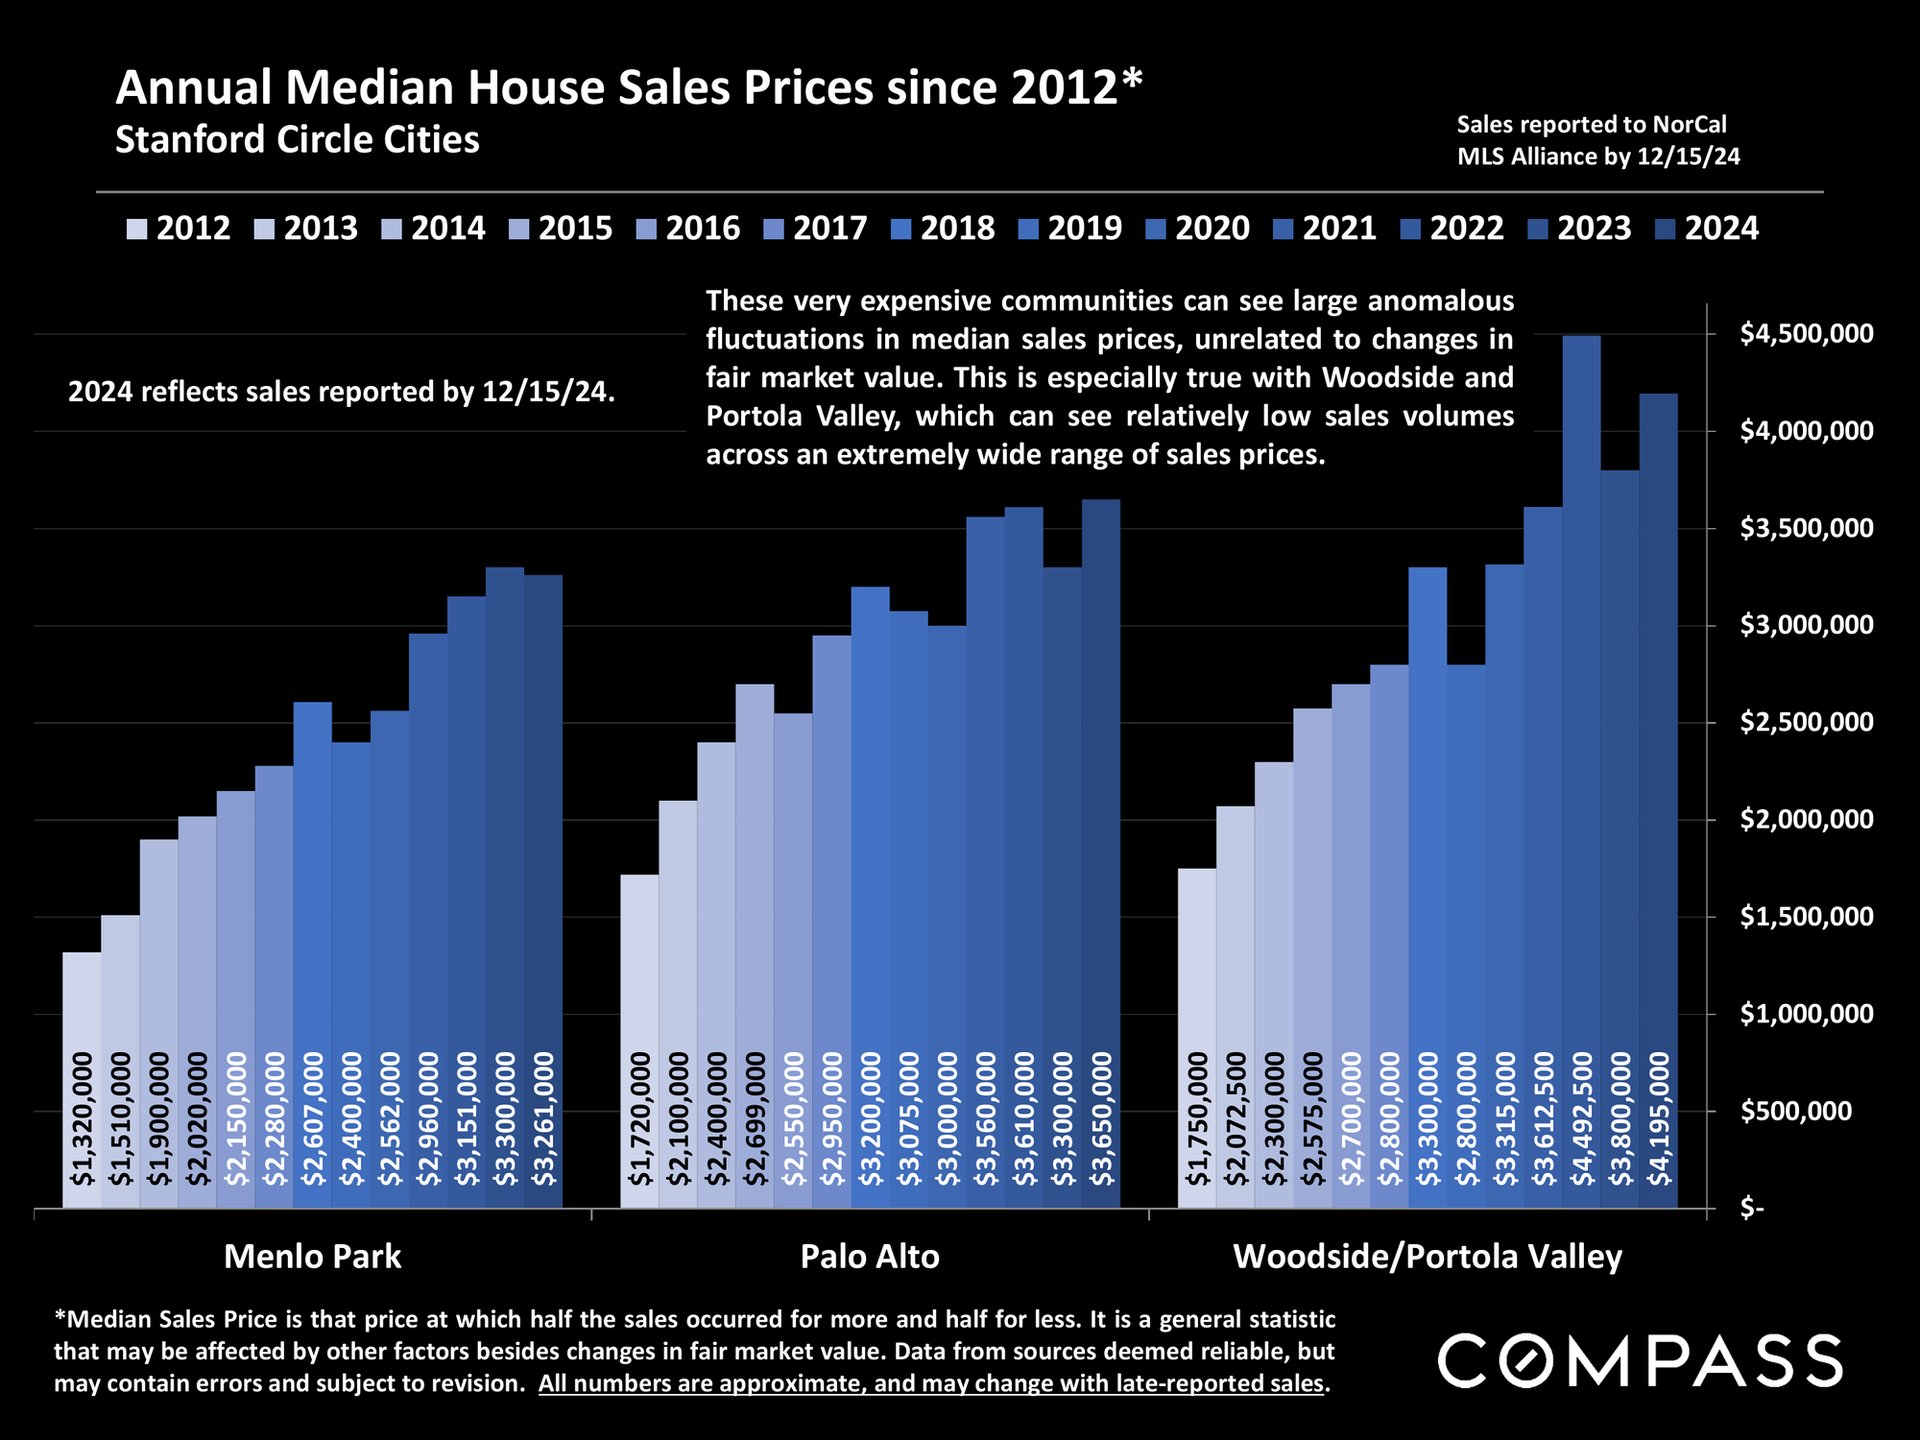
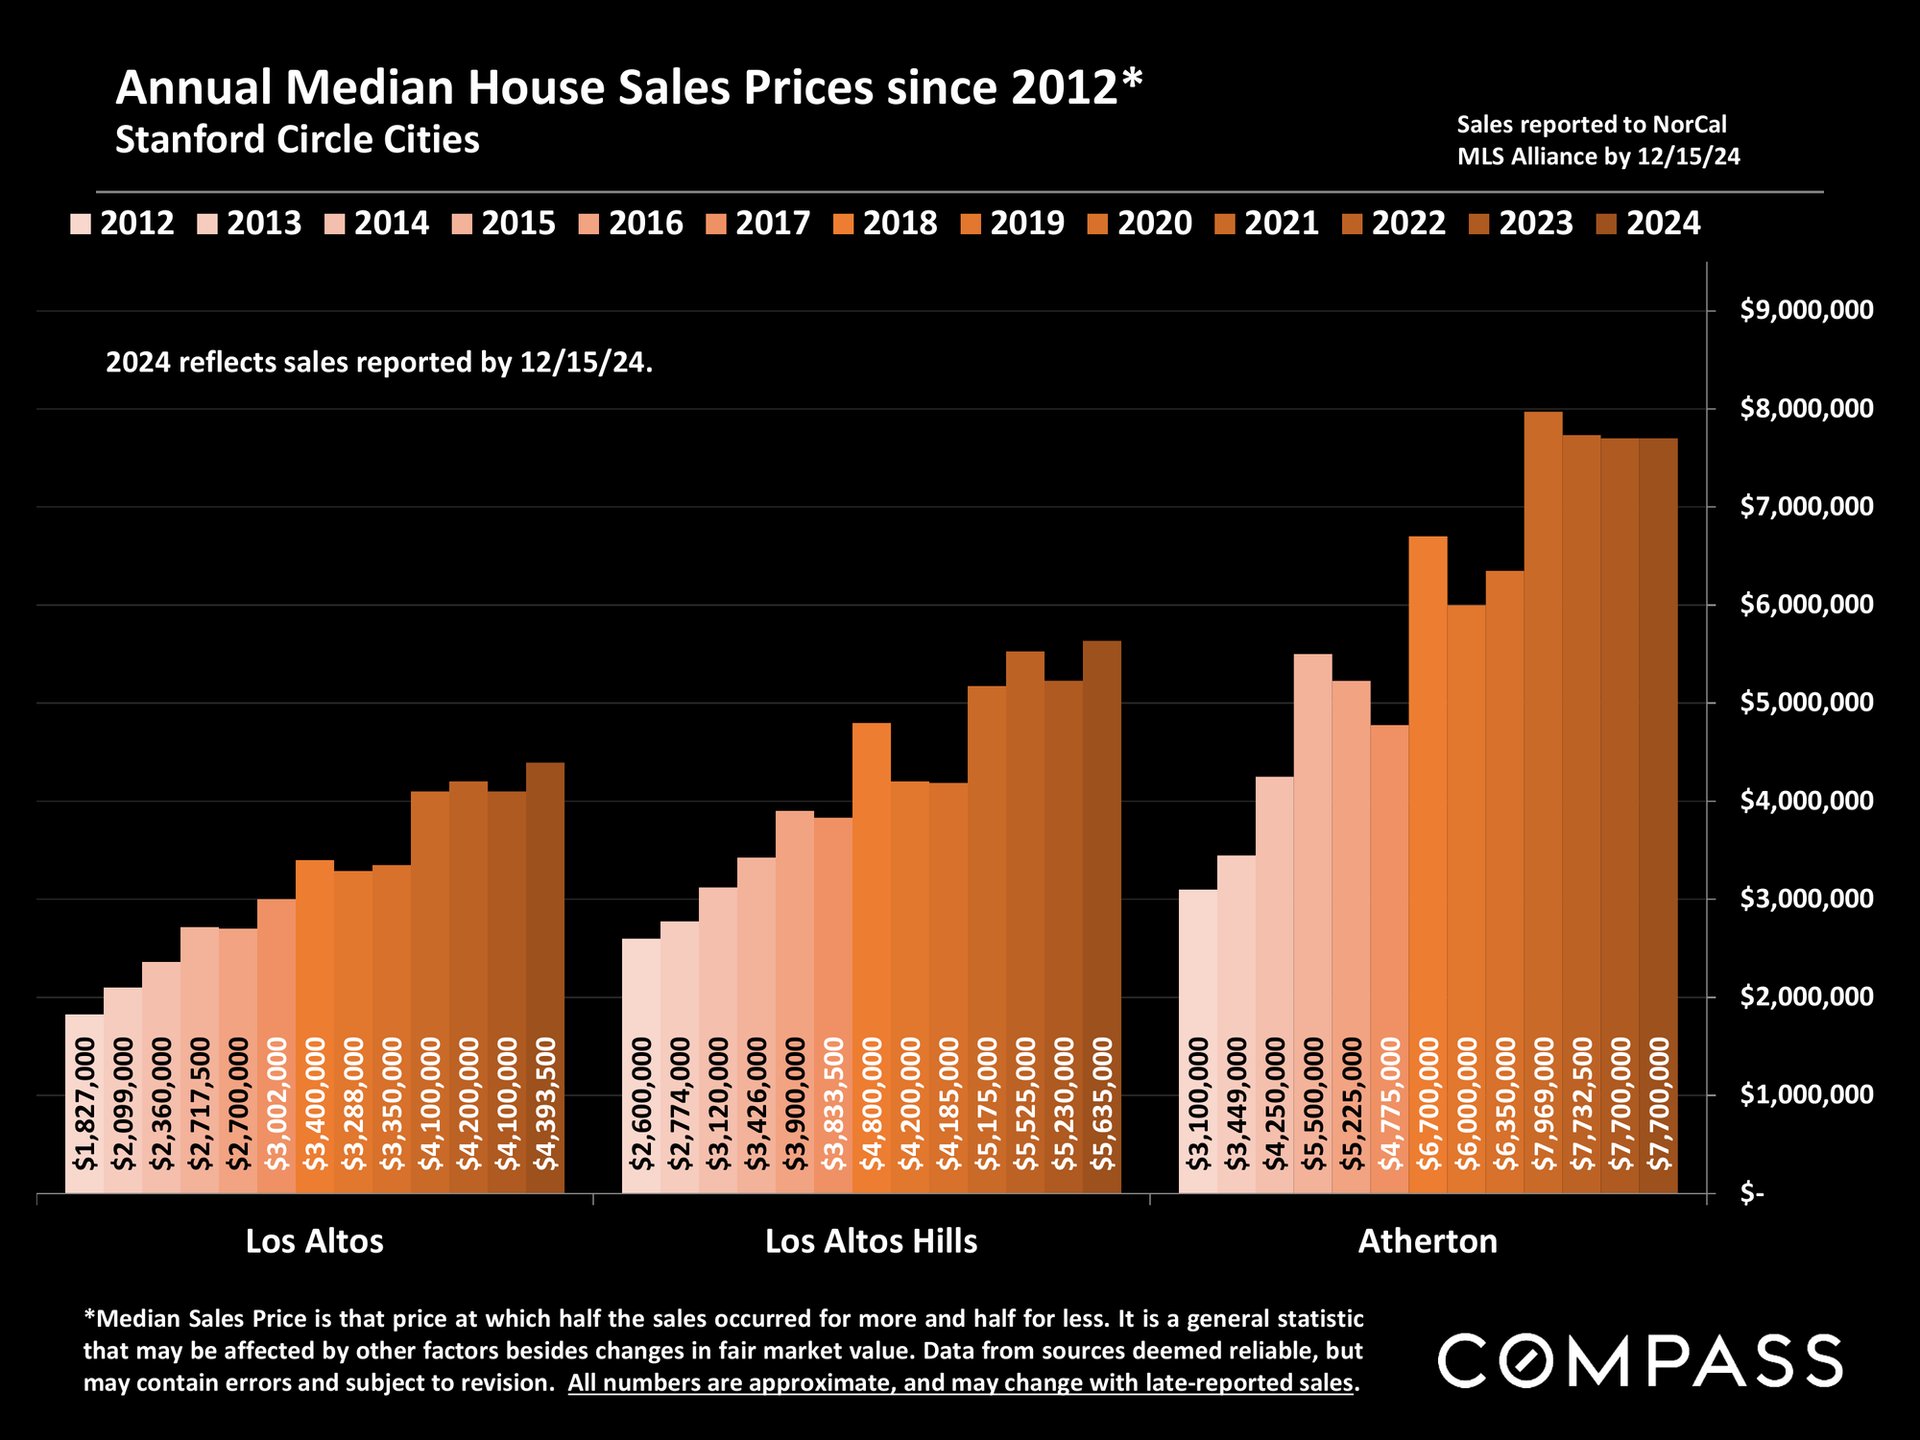
San Francisco Bay Area home values infographic with satellite map and sample ranked 2024 home-price table.Pie chart of 2024 Stanford Circle home sales by price segment, with 38% between $2 million and $3,999,999.Chart showing Stanford Circle’s 12-month rolling new listings, declining overall from 2005 to 2024 with a pandemic-era spike.Stanford Circle home sales chart, 2004–2024, highlighting the 21% increase in 2024.Chart of Stanford Circle luxury home sales from 2015–2024, with $5 million-plus sales rising 40% in 2024.Bar chart of Stanford Circle average days on market from 2005 to 2024, with a 2024 value of 31 days.Chart of Stanford Circle average days on market, with annual readings from 2005 to 2024.Chart of Stanford Circle sales over list price, with annual percentages from 2005 to 2024 and market-period annotations.Stanford Circle chart of annual sale-to-list price percentages, 2005–2024; 2024 averaged 102%.Bar chart of California all-cash home purchases, peaking at 30% in 2012 and reaching 27% in 2024.Infographic comparing population changes across selected U.S. states from 2020 to 2024, with orange and red bars.Chart shows insurance difficulties rising from 2023 to 2024, highest for vacation or second homes at 51%.Bar chart of 2023 U.S. moving reasons; a better or larger home and a new job lead the estimates.Explanatory notes on real estate statistics, metric definitions, photo licensing, and Compass disclaimers.Stanford Circle real estate market report cover with an aerial view of homes, wooded hills, and green fields.Pie chart of 2024 Stanford Circle house sales: Palo Alto leads with 373, followed by Menlo Park with 281.Chart of 2024 Stanford Circle area median house prices and highest sales, led by Atherton at $7.7 million.Bar chart of 2024 median house prices per square foot in Stanford Circle communities, led by Atherton at $1,972.Chart comparing 2024 median house sizes and lot sizes in seven Stanford Circle communities.Stanford Circle home-sale speed chart: Atherton averages 57 days on market, while Los Altos averages 16.Chart of 2024 home sale prices versus list prices: Los Altos 7% over, Palo Alto 6%, Woodside and Atherton 0.5% under.Chart comparing 2024 luxury home sales by price range across seven Stanford-area cities.Bar chart comparing annual median home sale prices in three Stanford Circle areas from 2012 to 2024.Bar chart comparing annual median home sale prices in Los Altos, Los Altos Hills, and Atherton from 2012 to 2024.


WORK WITH US

We offer the highest level of service and expertise to our clients. Our team has built a reputation for consistently representing the finest real estate in San Francisco and Napa Valley. Results driven and dedicated to your success, whether buying, selling, renting or investing. Contact us today for a private consultation.

Contact Us