San Francisco 2-4 Unit Apartment Building Market Report 2025

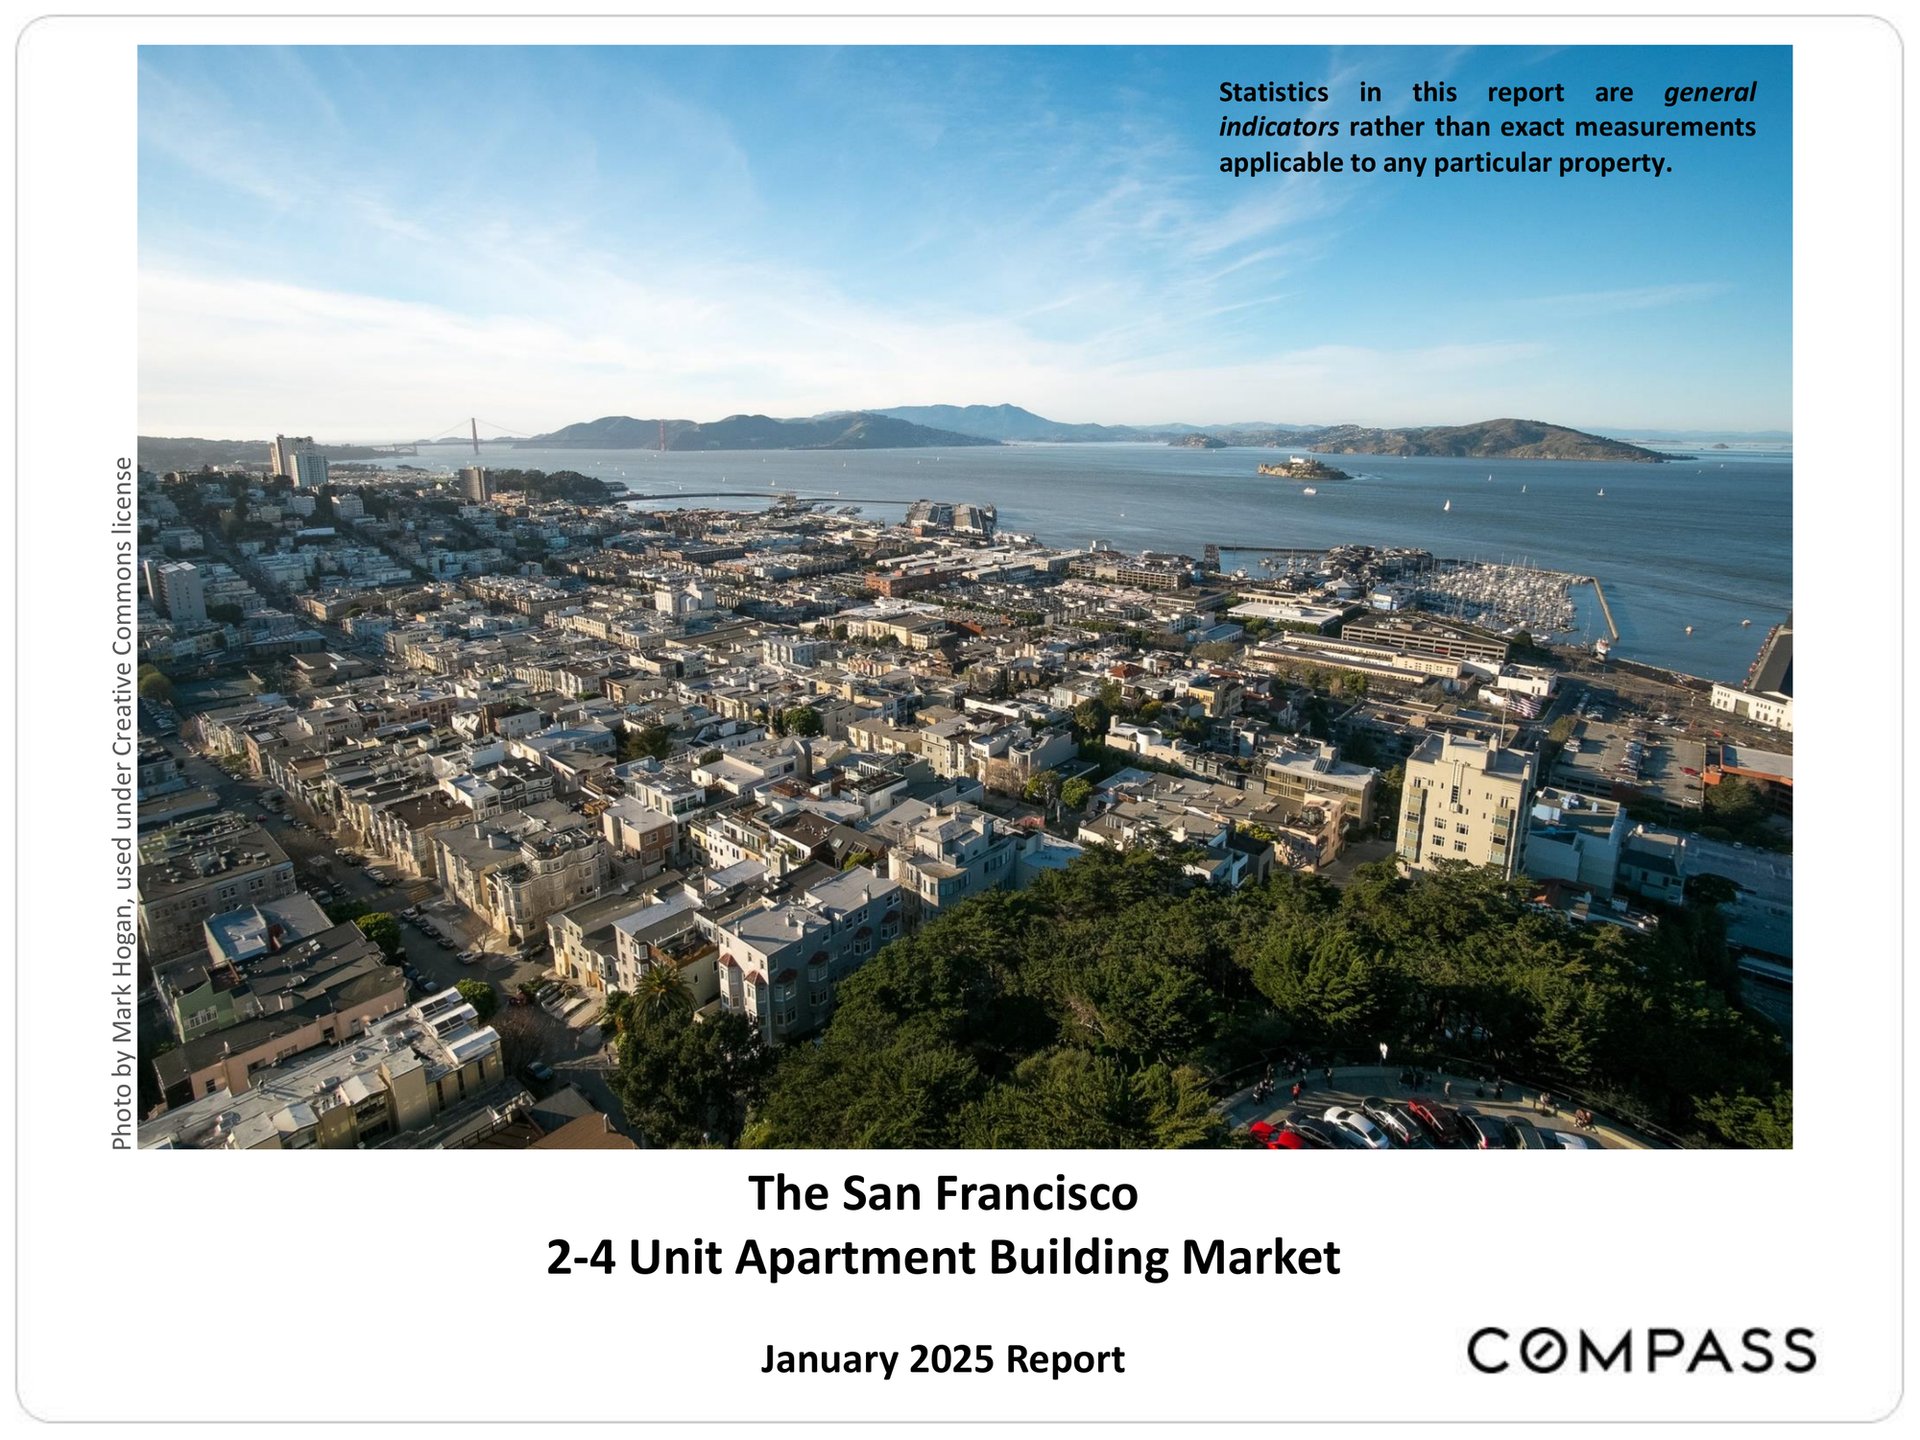
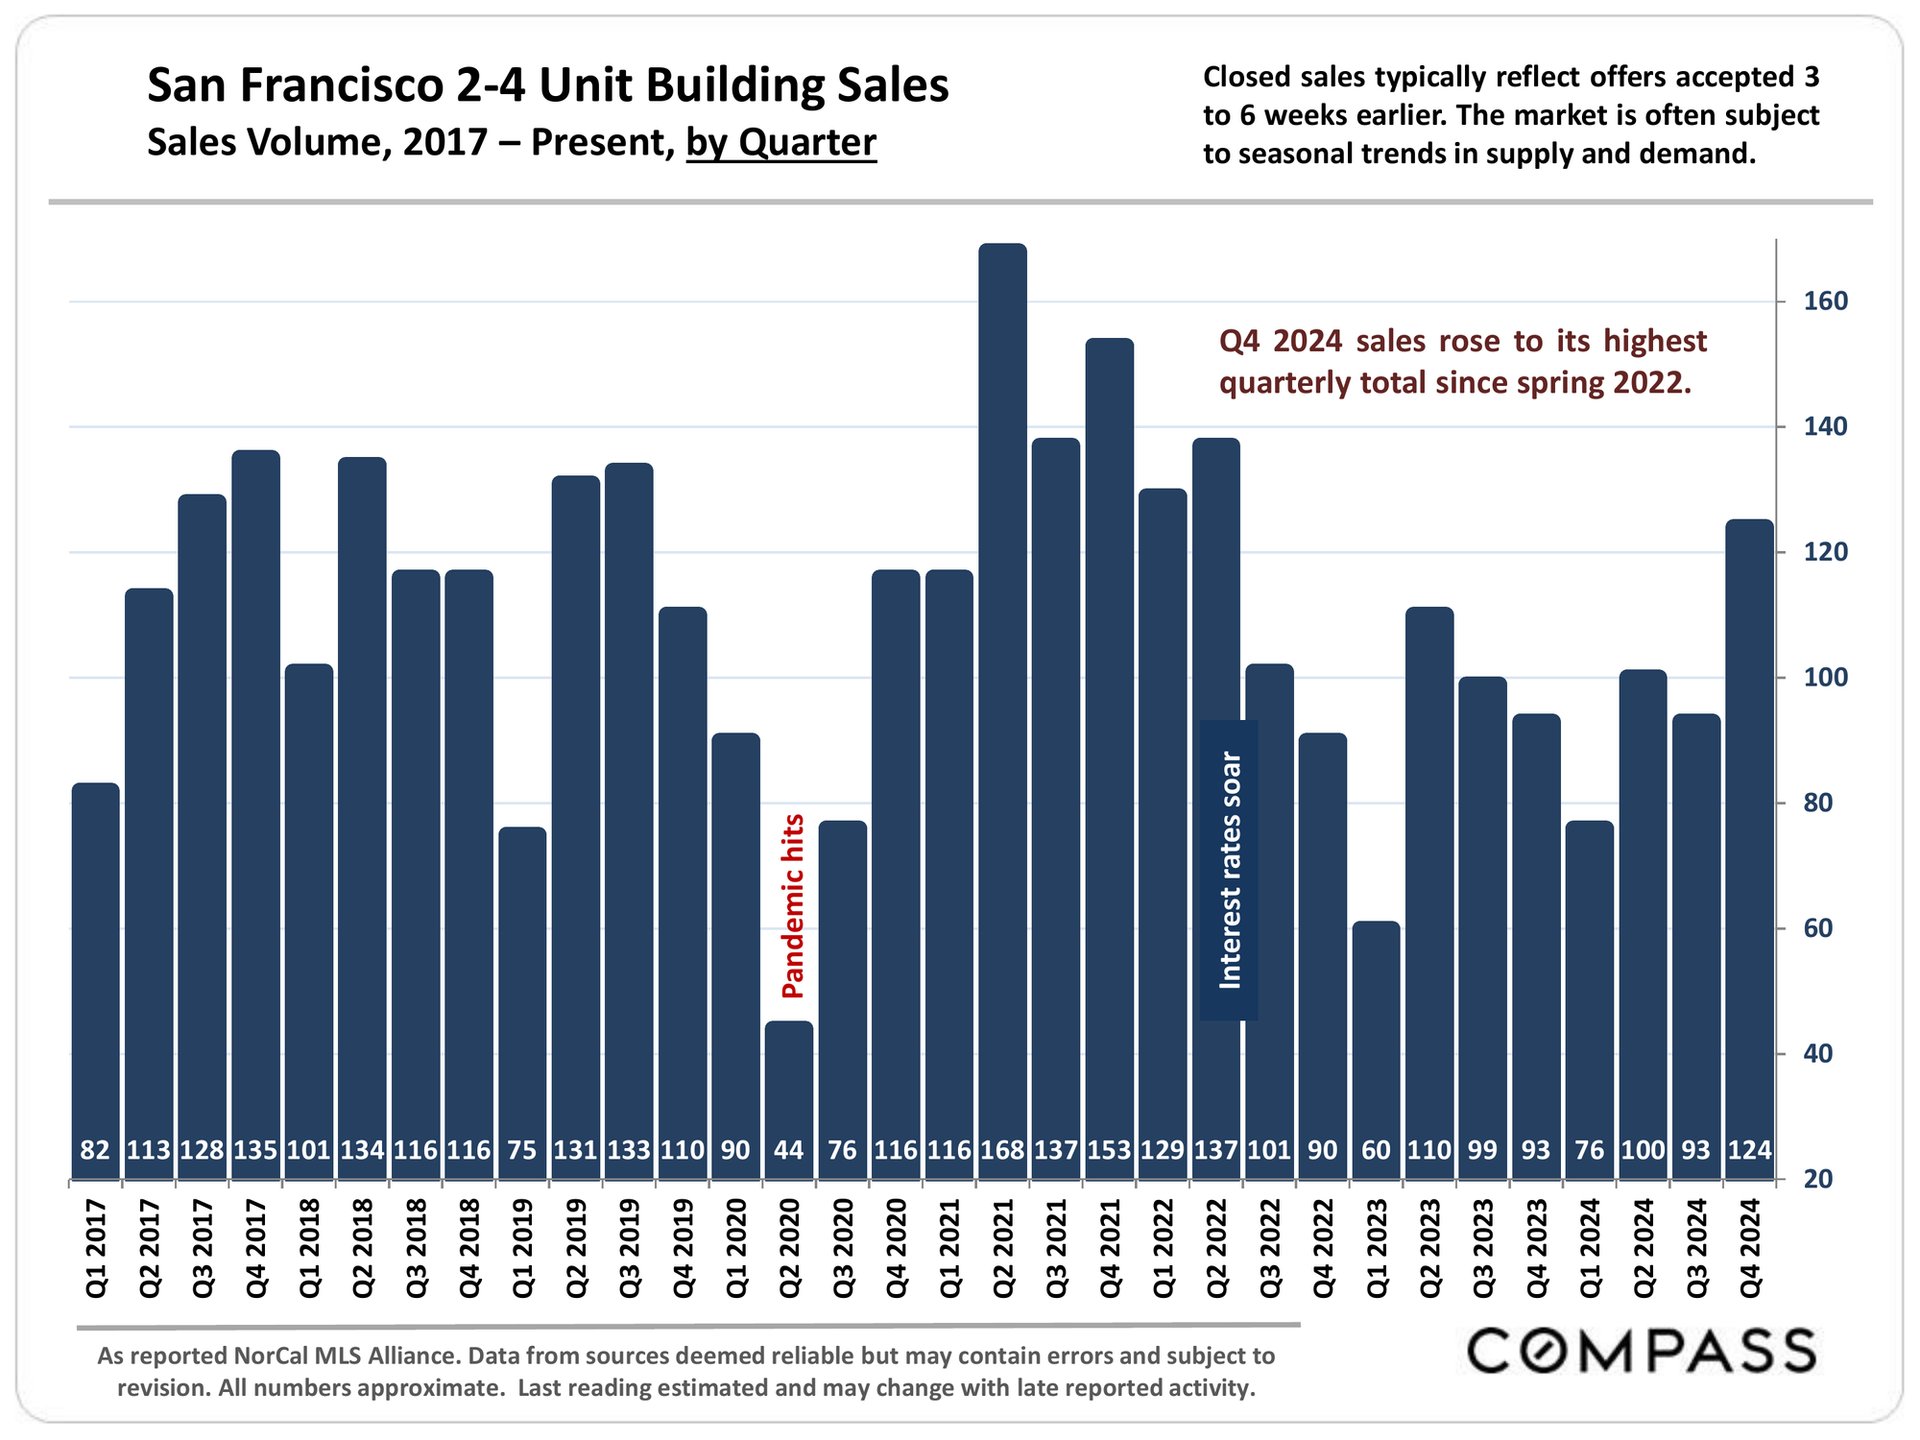
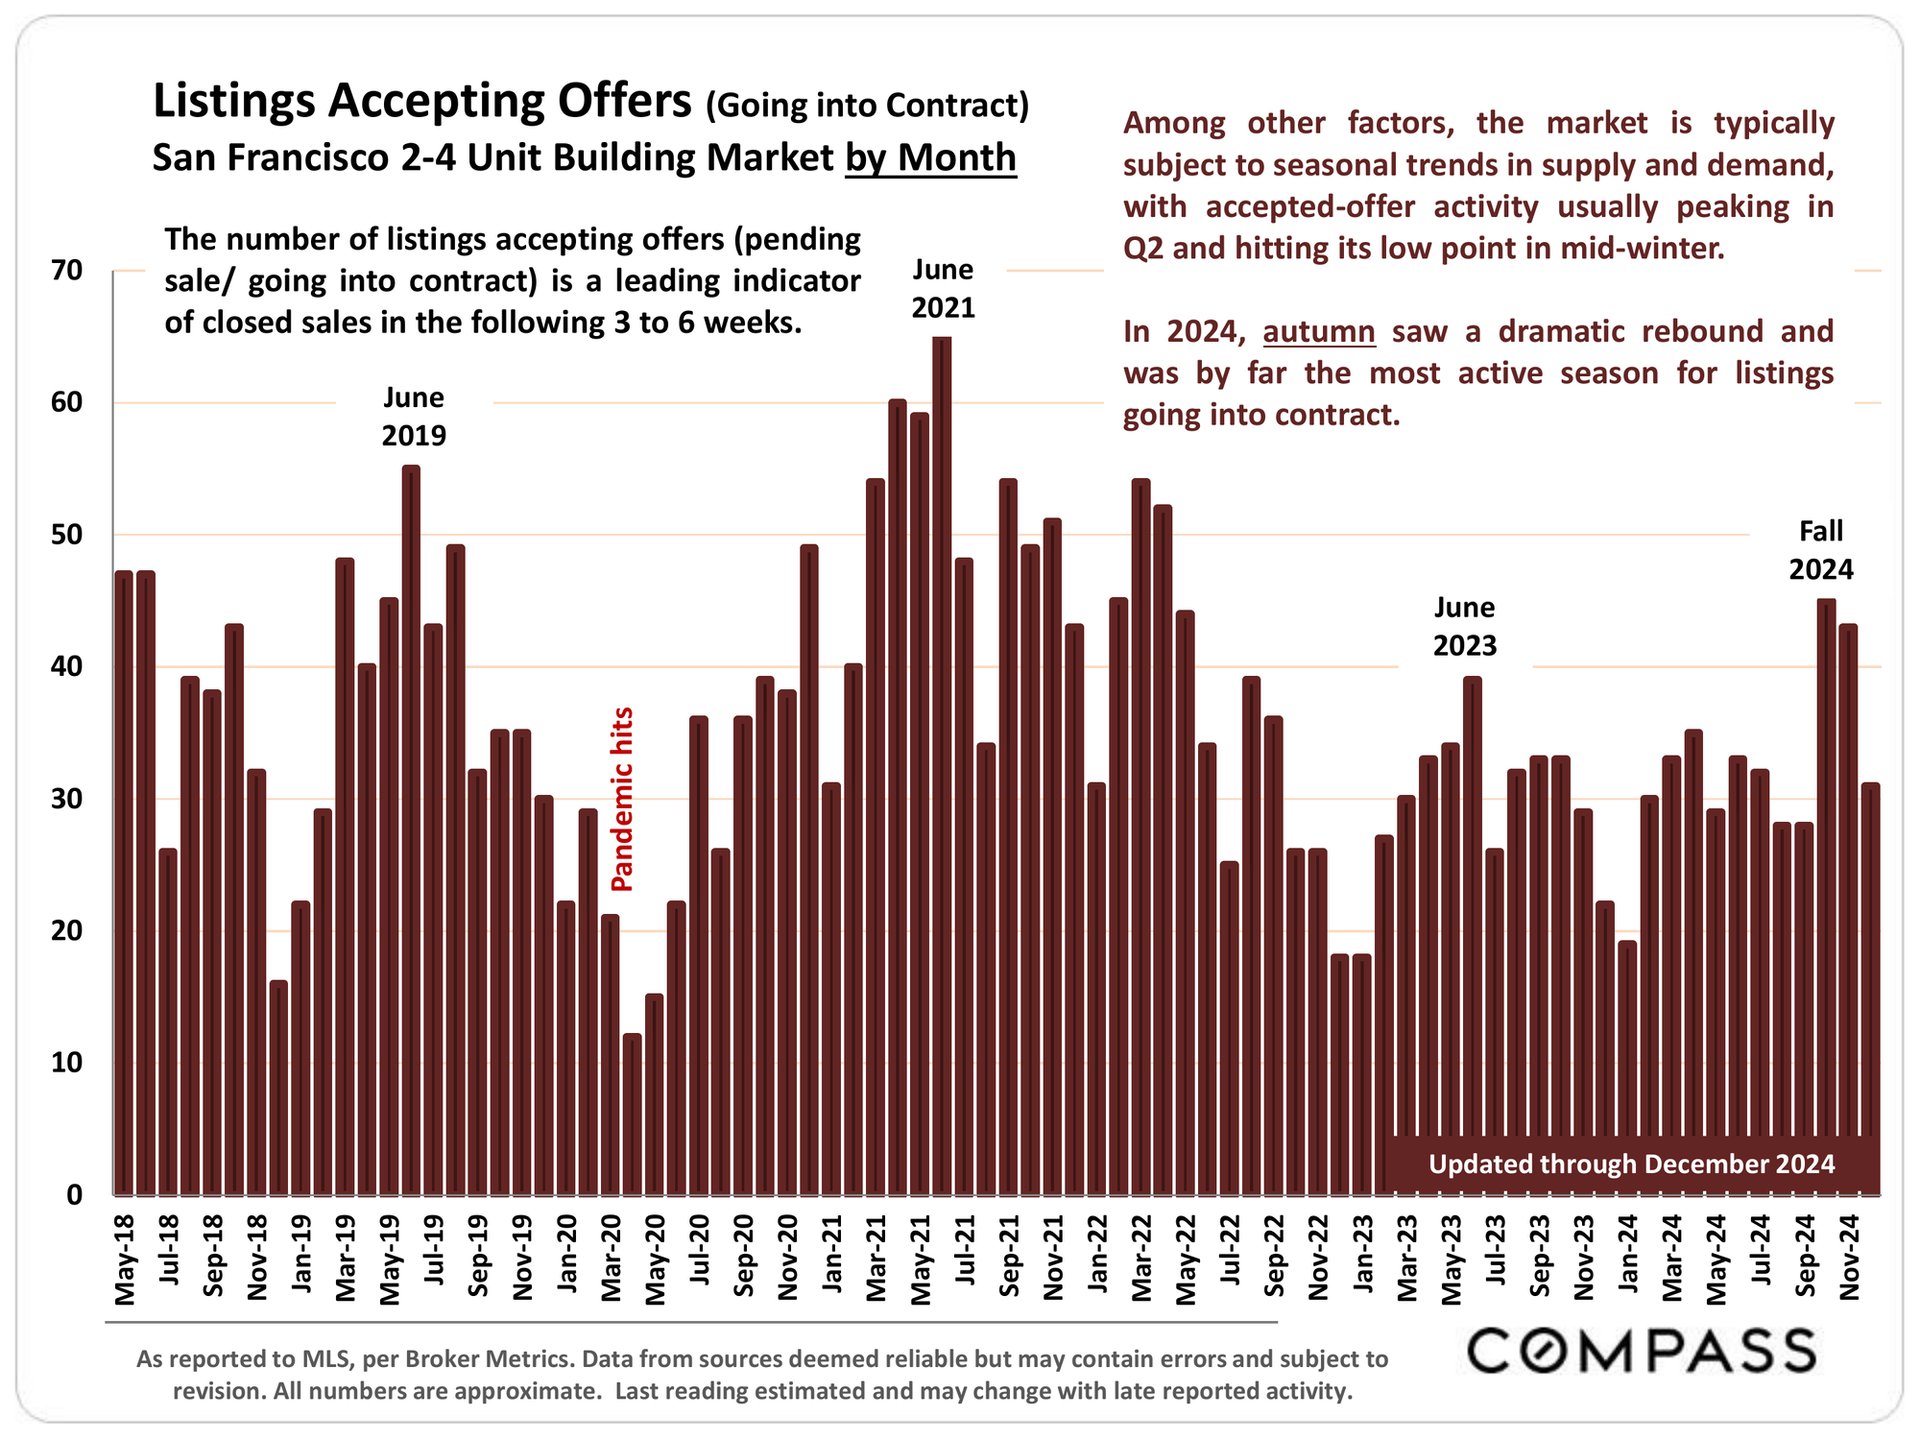
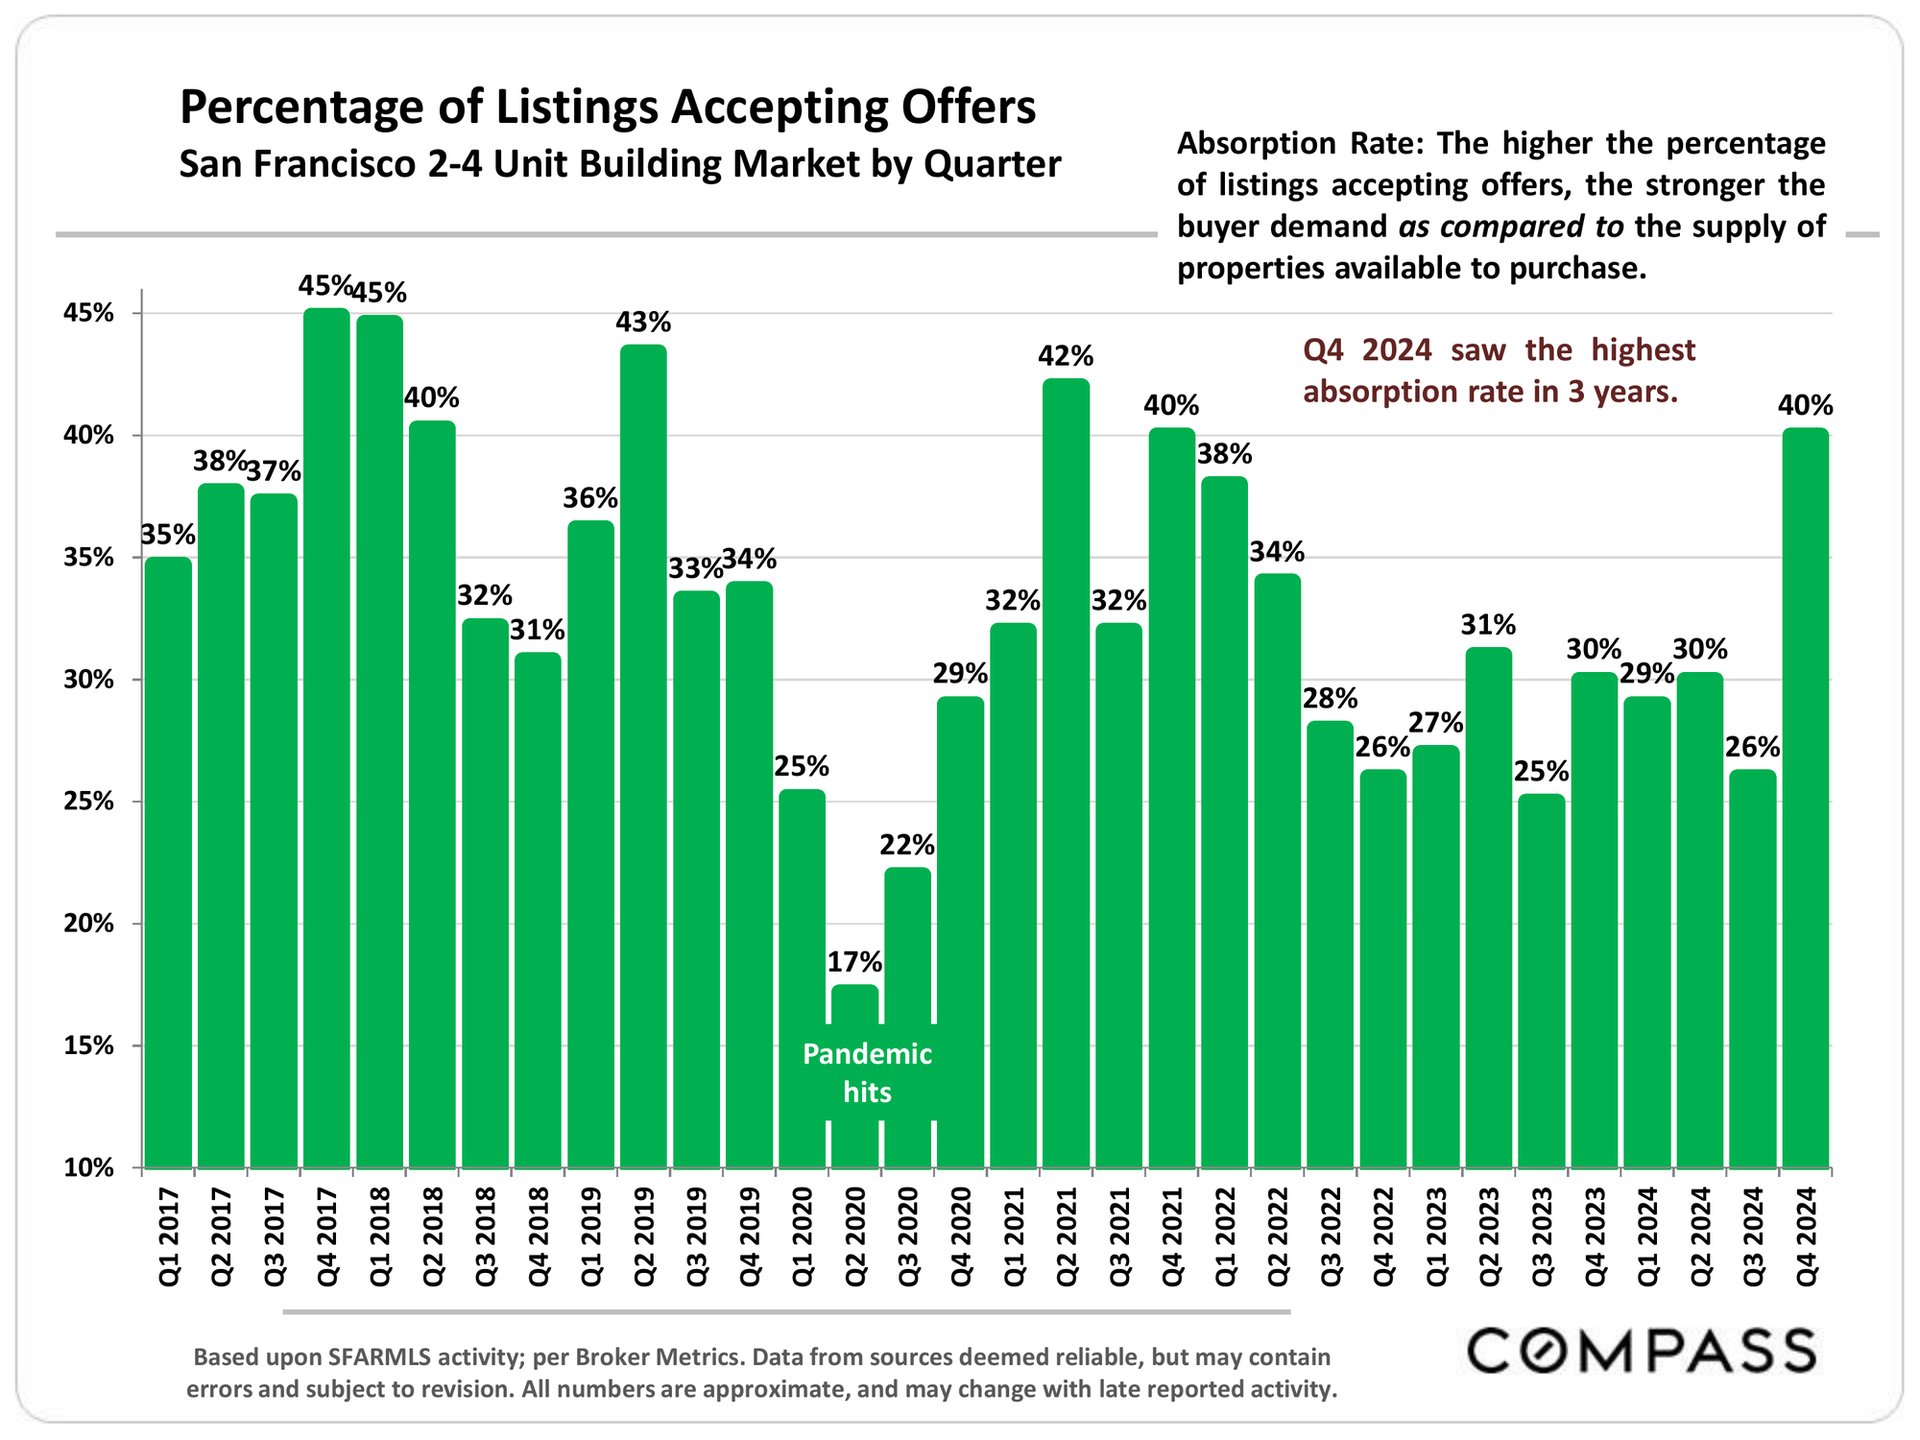
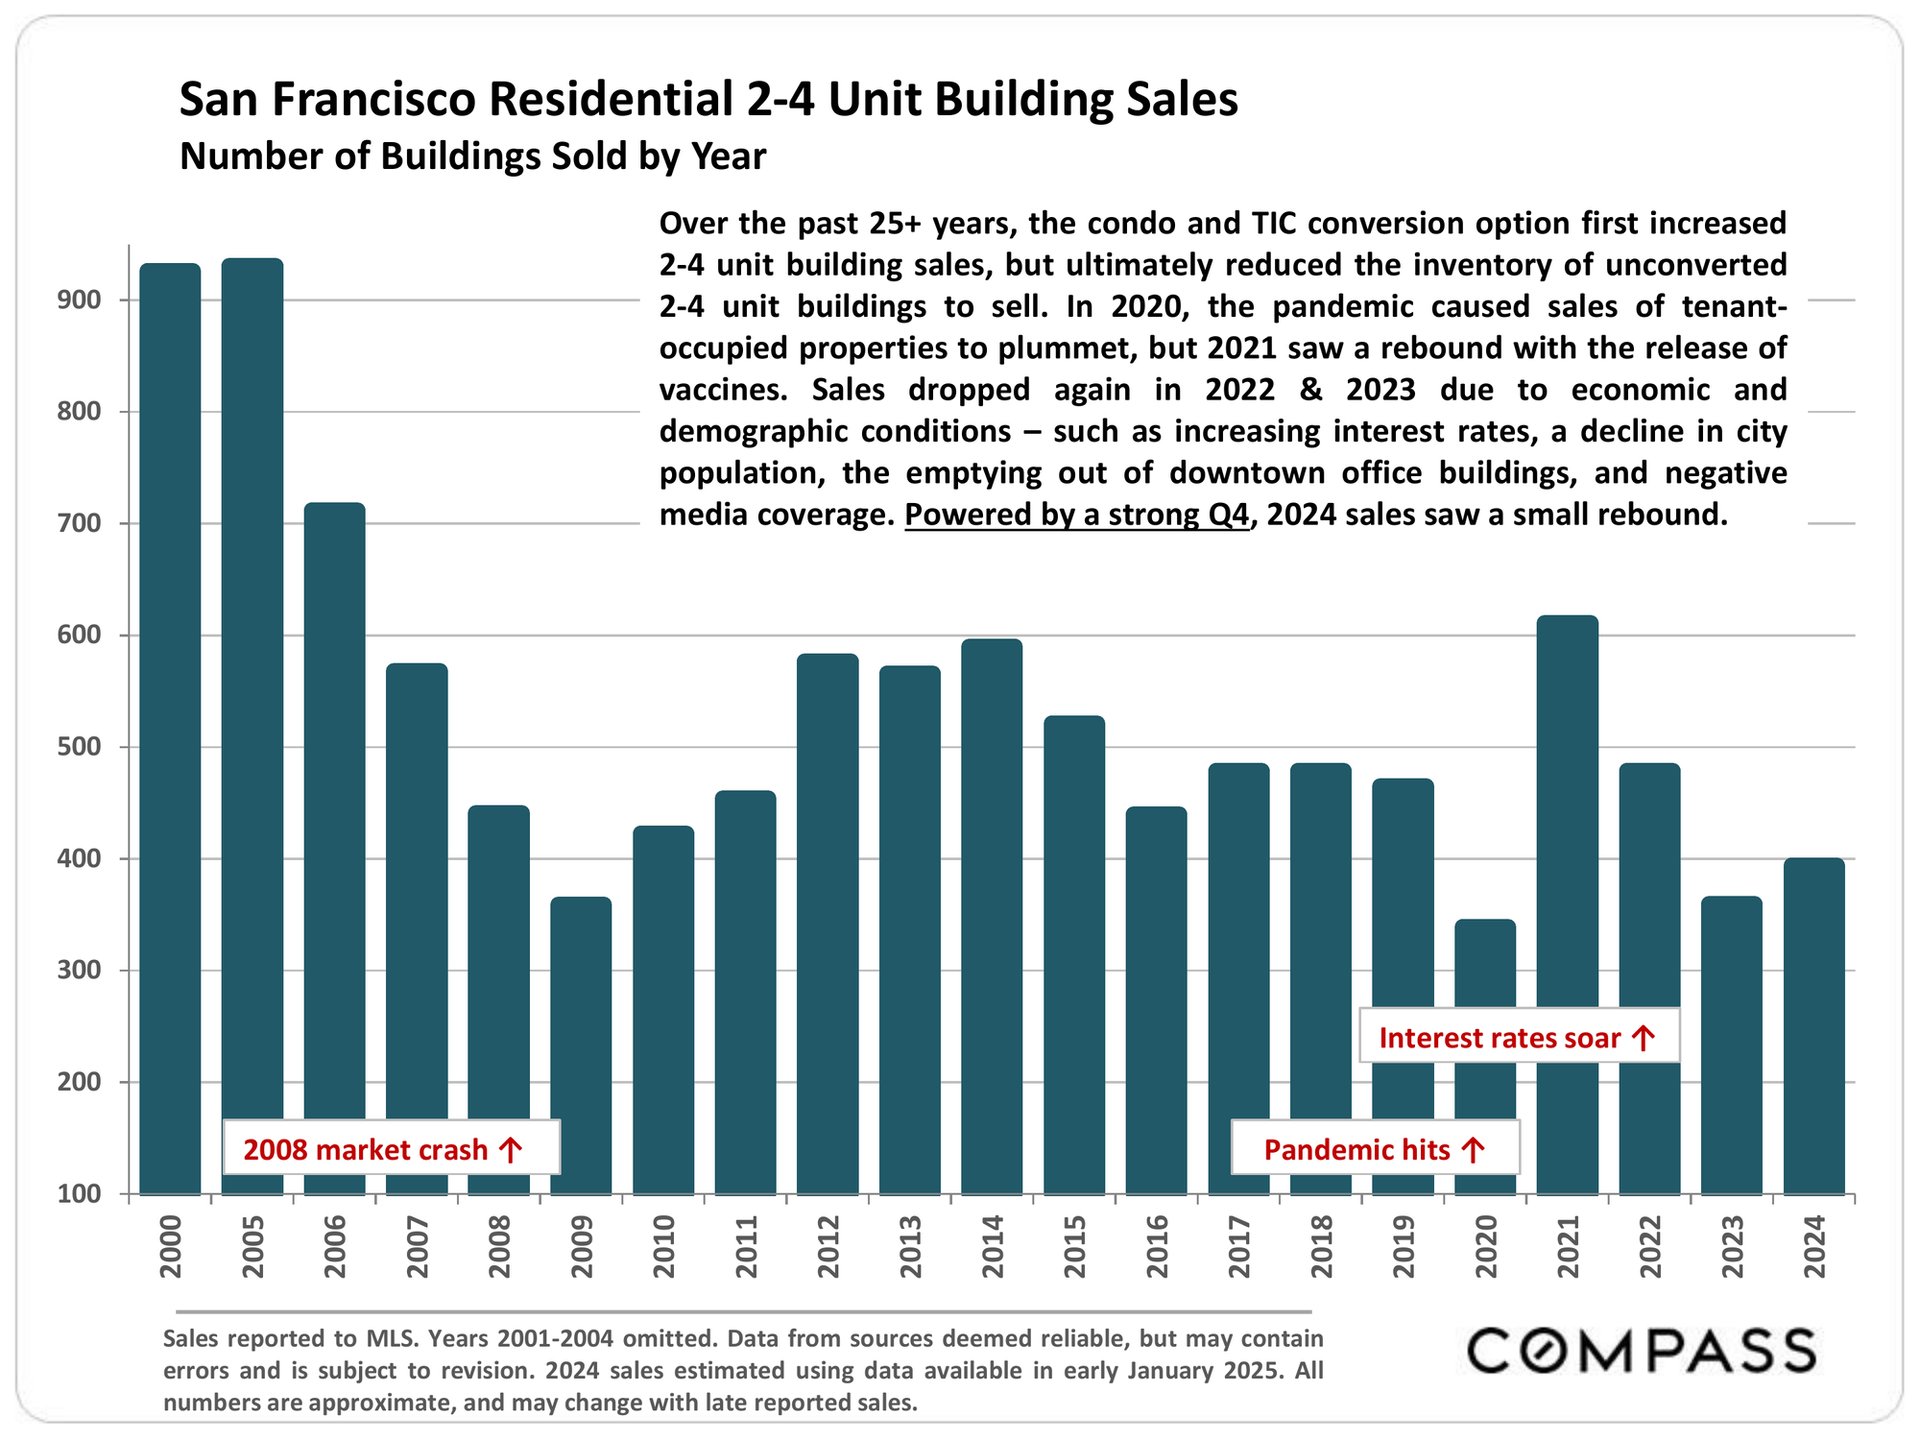
January 2025 San Francisco 2–4 Unit Apartment Building Market report cover with an aerial view of the city and bay.Quarterly San Francisco 2–4 unit building sales chart, 2017–2024, with a Q4 2024 rebound to 124 sales.Bar chart of San Francisco 2–4 unit buildings accepting offers monthly from 2018 through 2024.Chart of San Francisco 2–4 unit building listings accepting offers by quarter, with a 40% rate in Q4 2024.Bar chart of San Francisco 2–4 unit building sales, with a sharp 2021 rebound after the pandemic-era low.
 
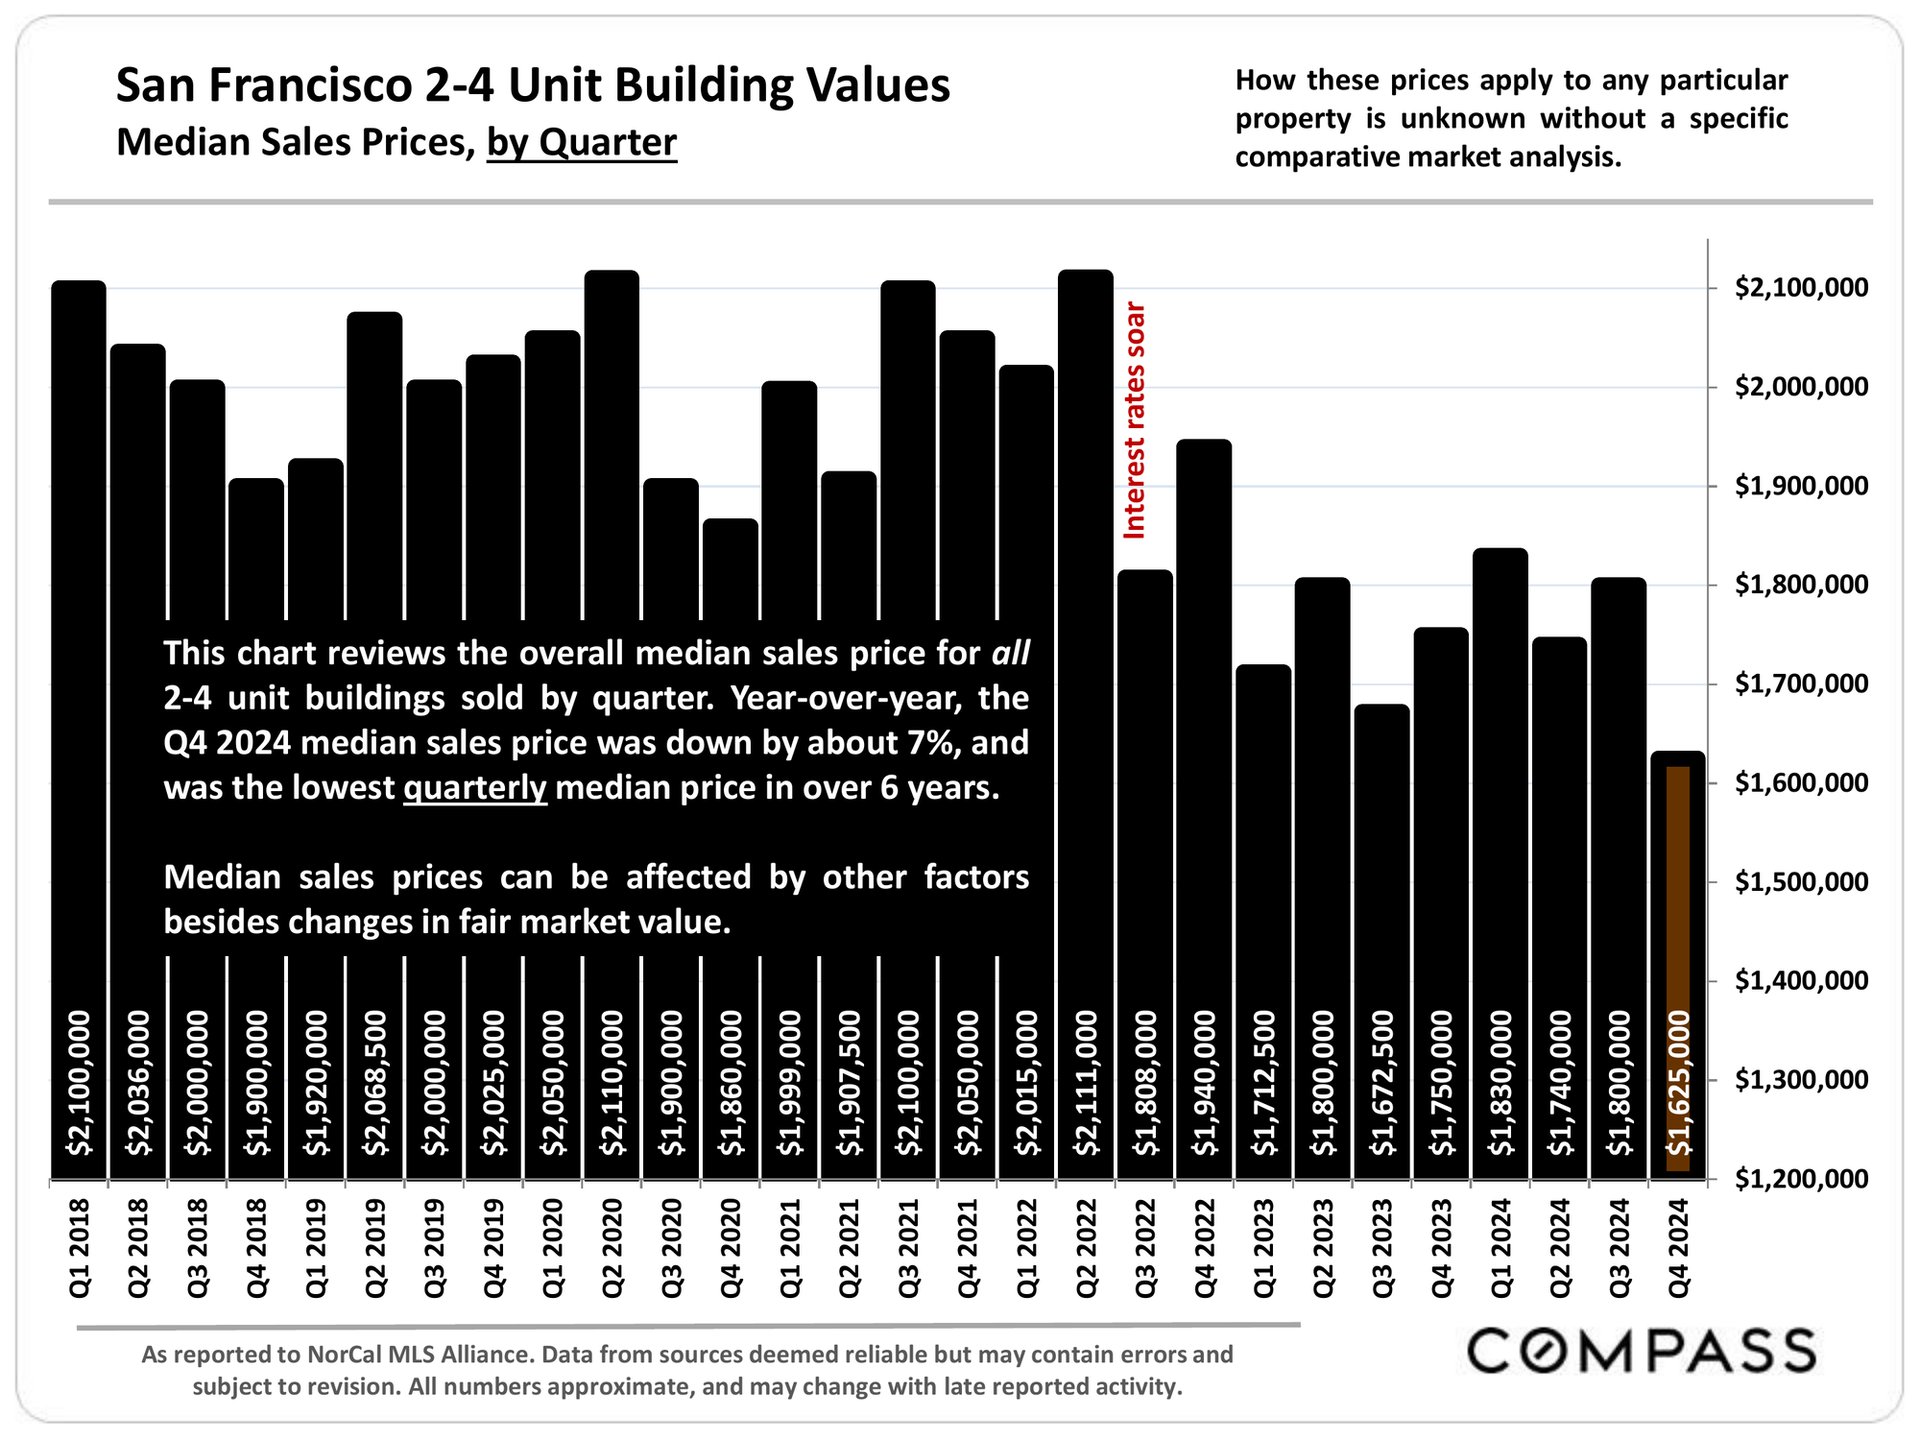
Chart of San Francisco 2–4 unit building median sale prices by quarter, 2018–2024; Q4 2024 is $1.625 million.
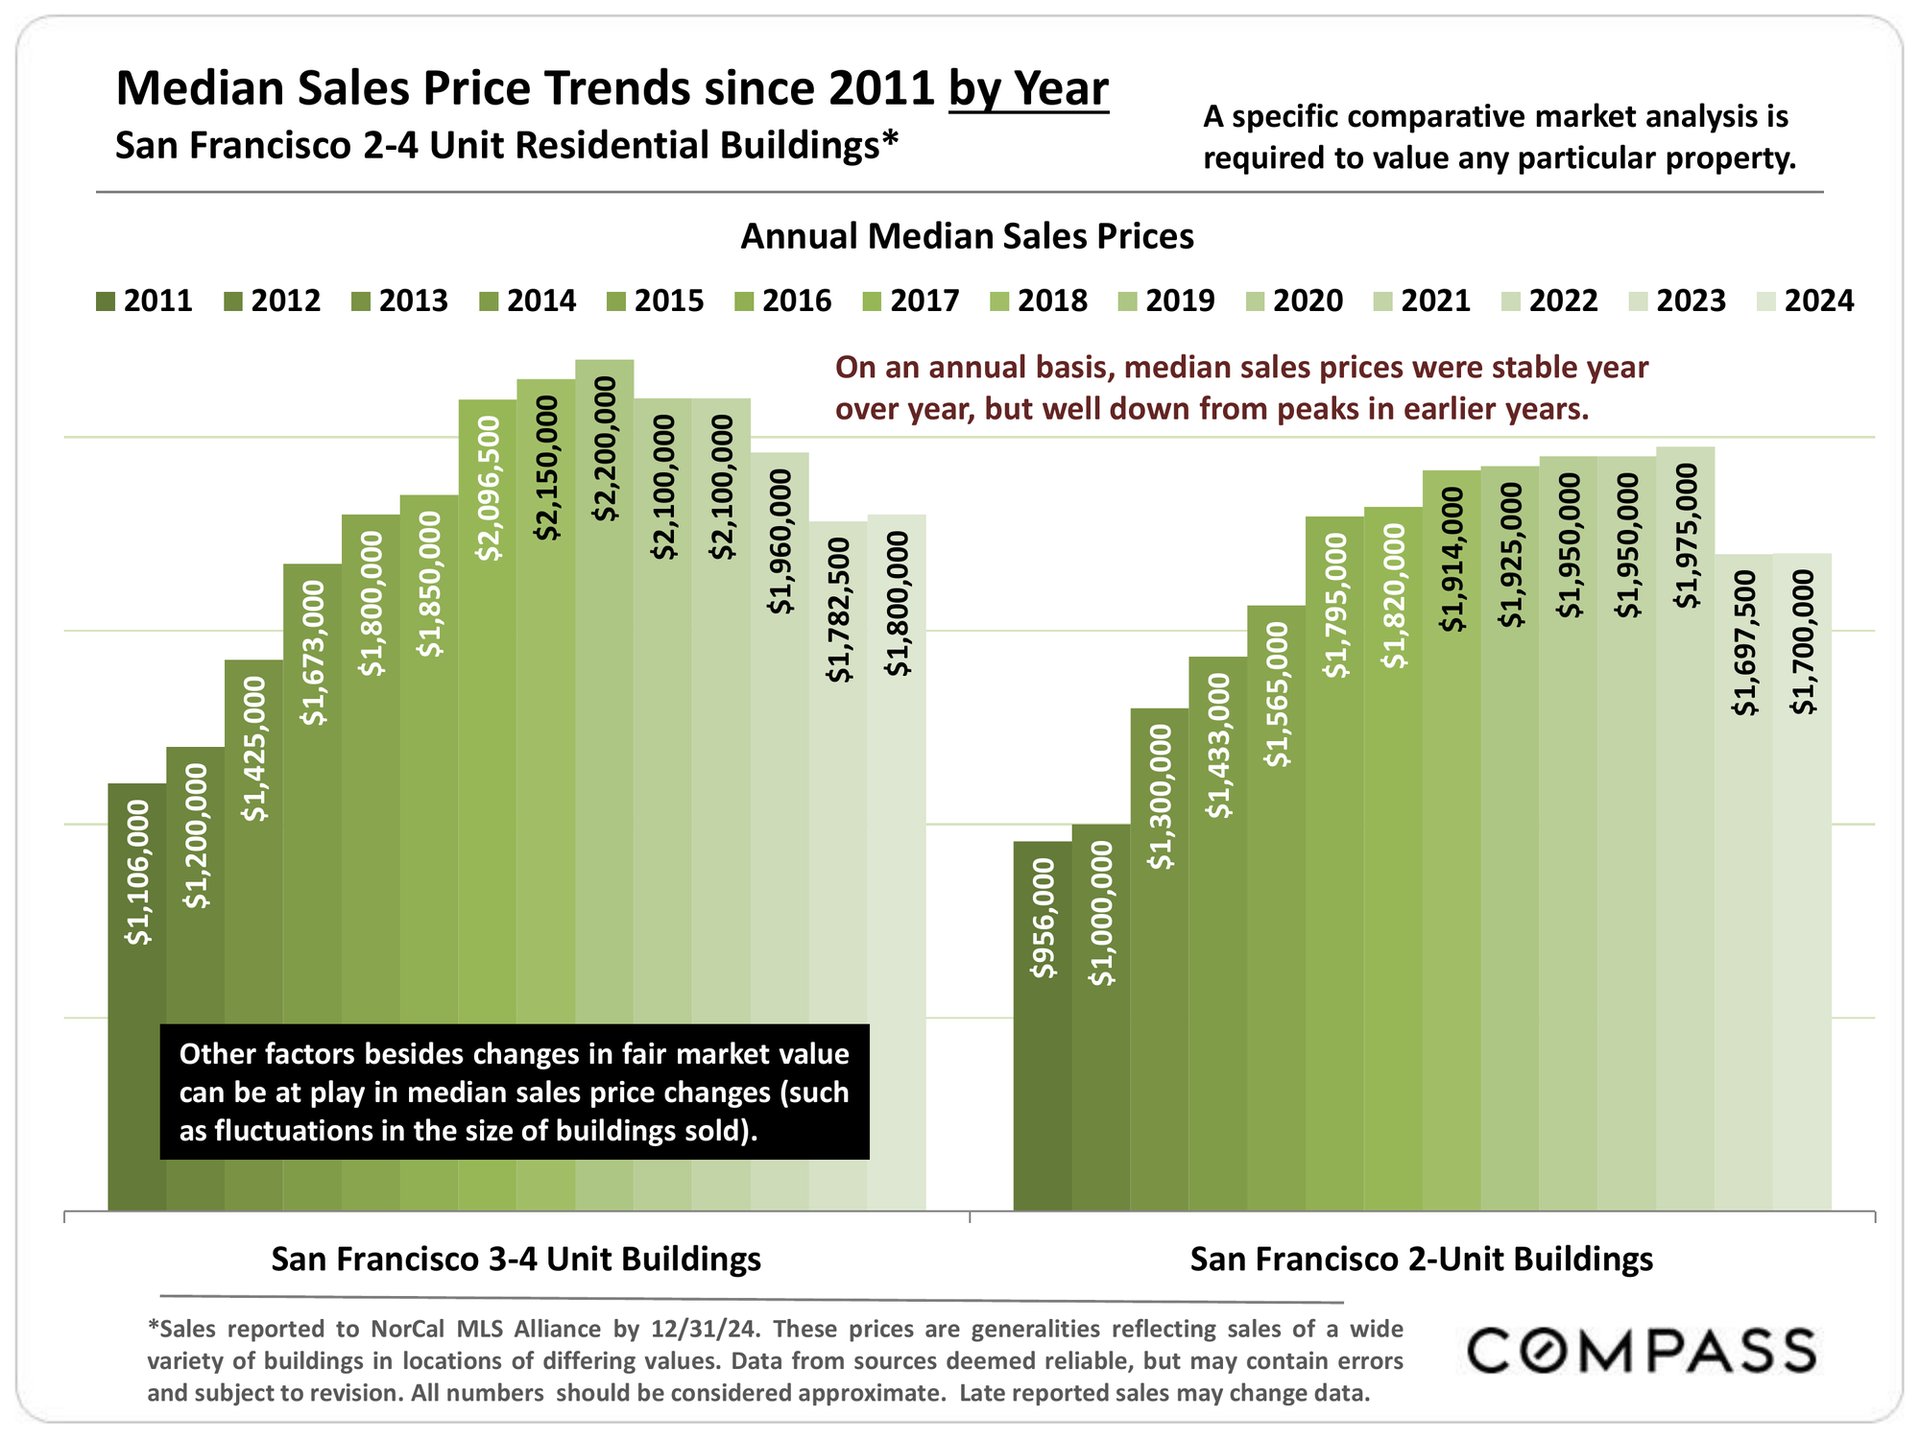
Bar chart comparing annual median sale prices for San Francisco 3–4-unit and 2-unit buildings, 2011–2024.
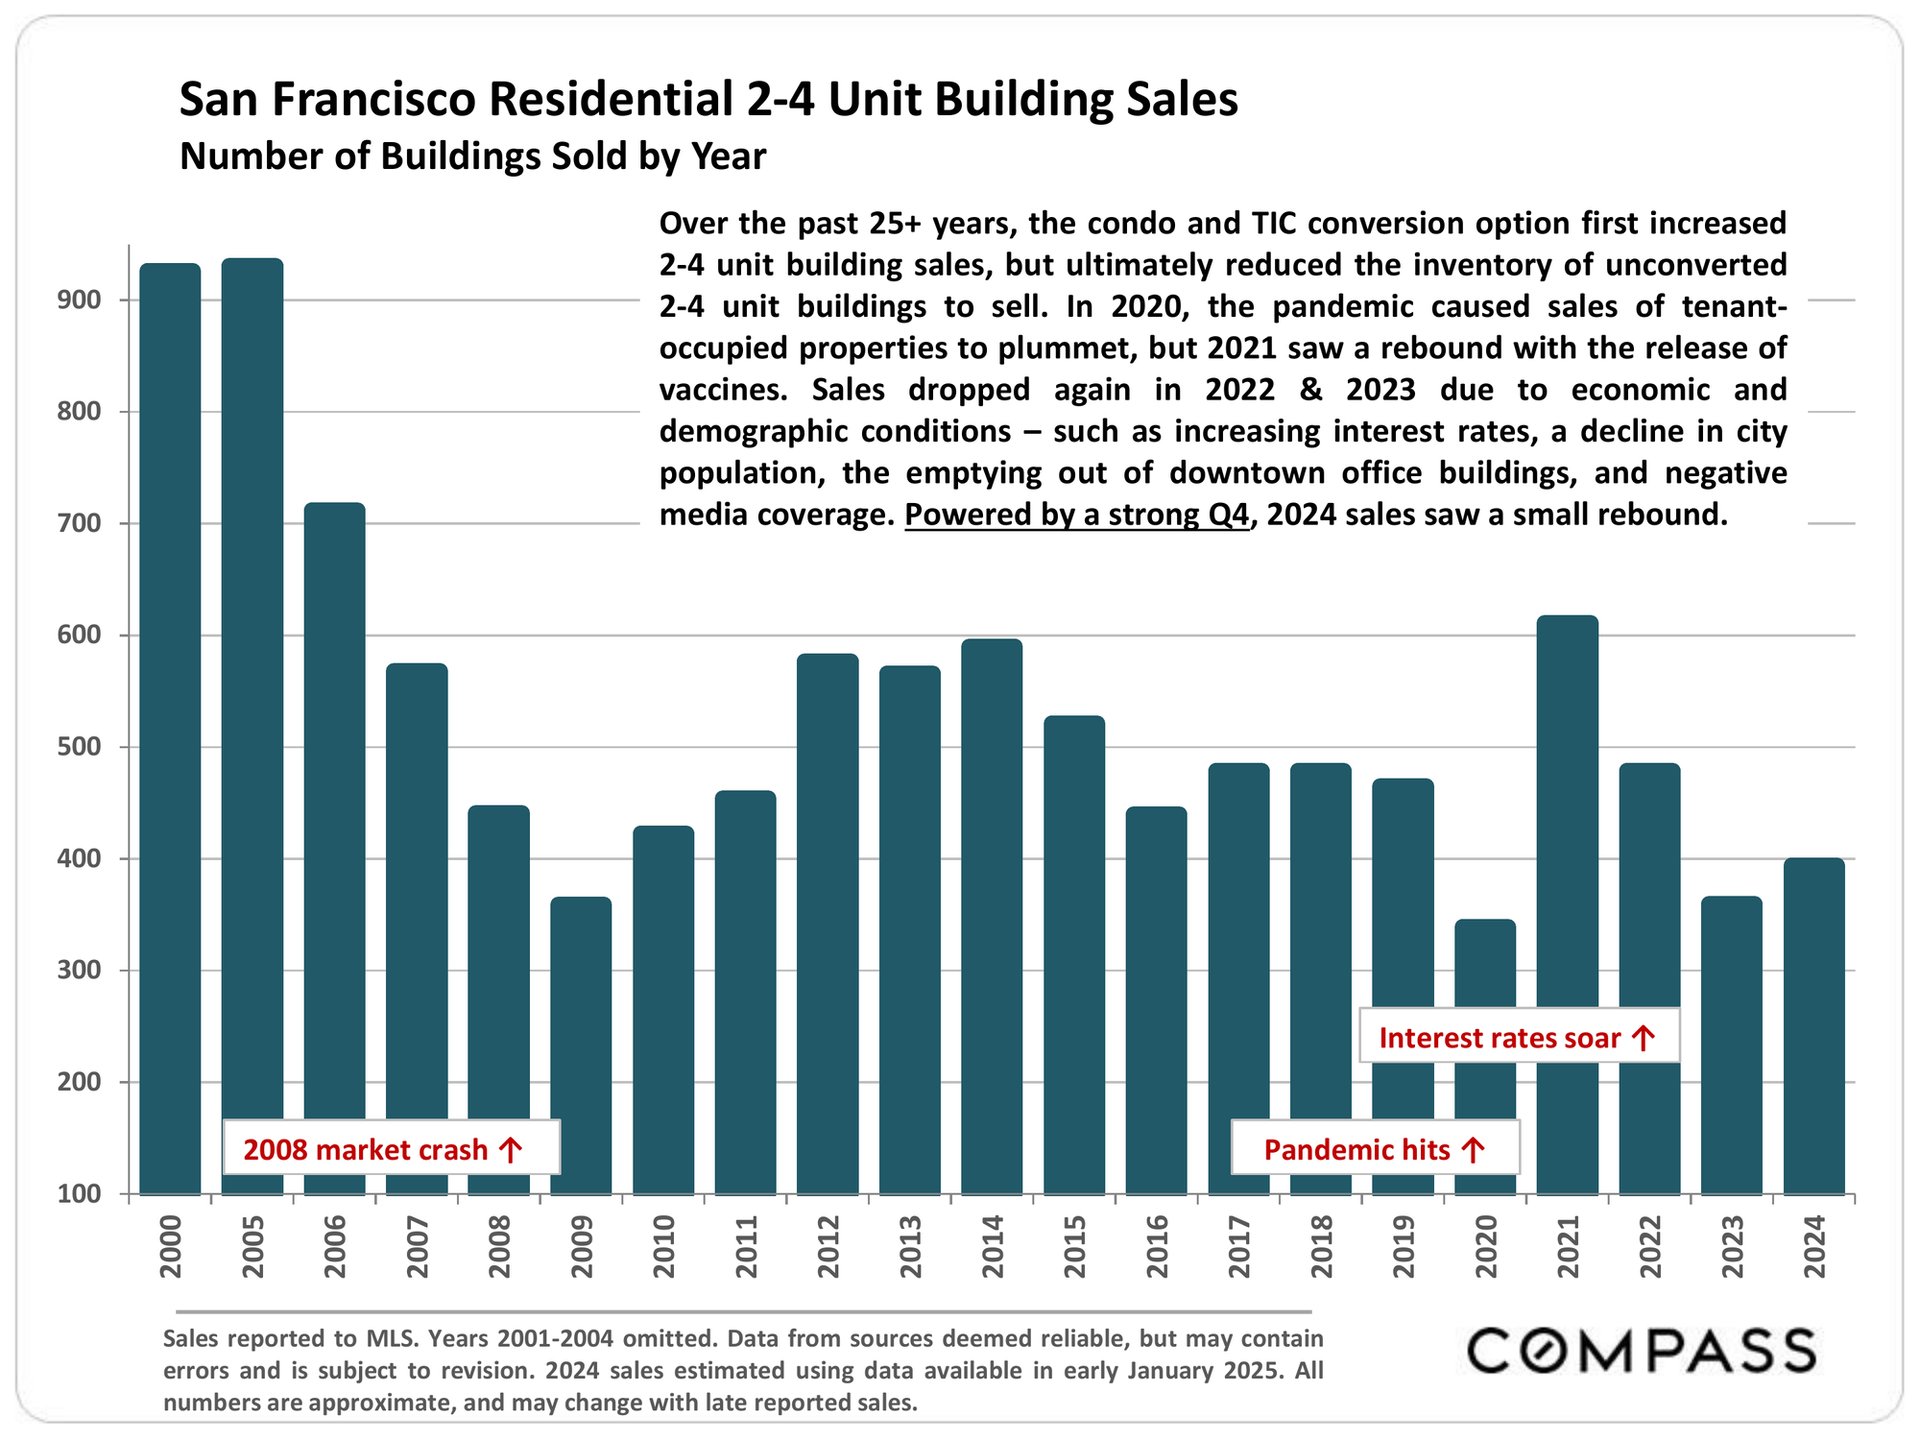
Chart of San Francisco 2–4 unit building sales by year, with a 2021 rebound and small recovery in 2024.
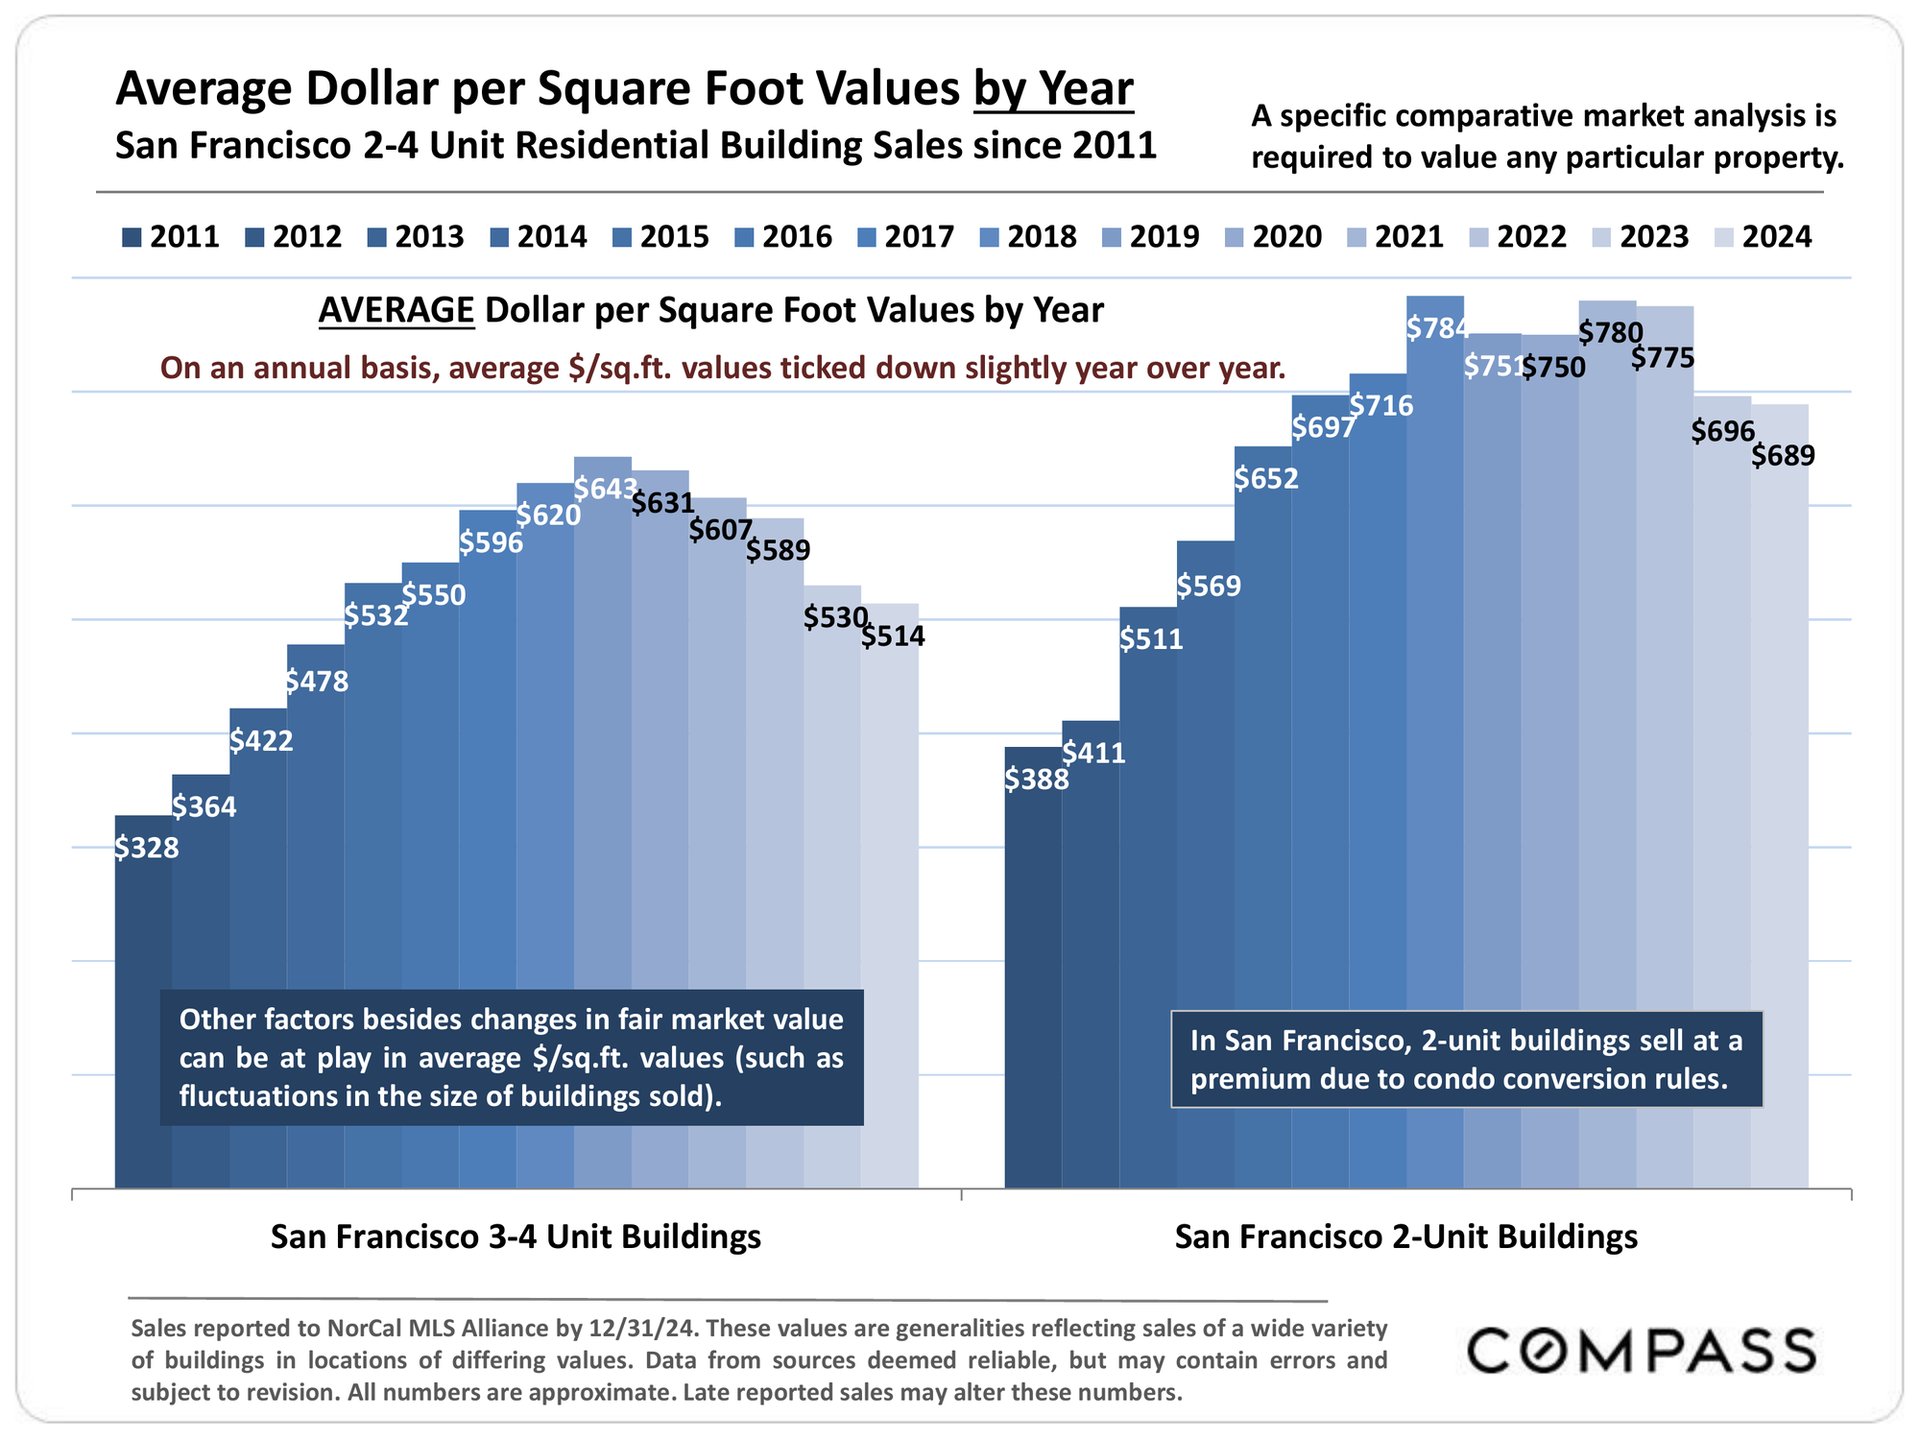
Chart compares average price per square foot for San Francisco 2-unit and 3–4-unit buildings, 2011–2024.
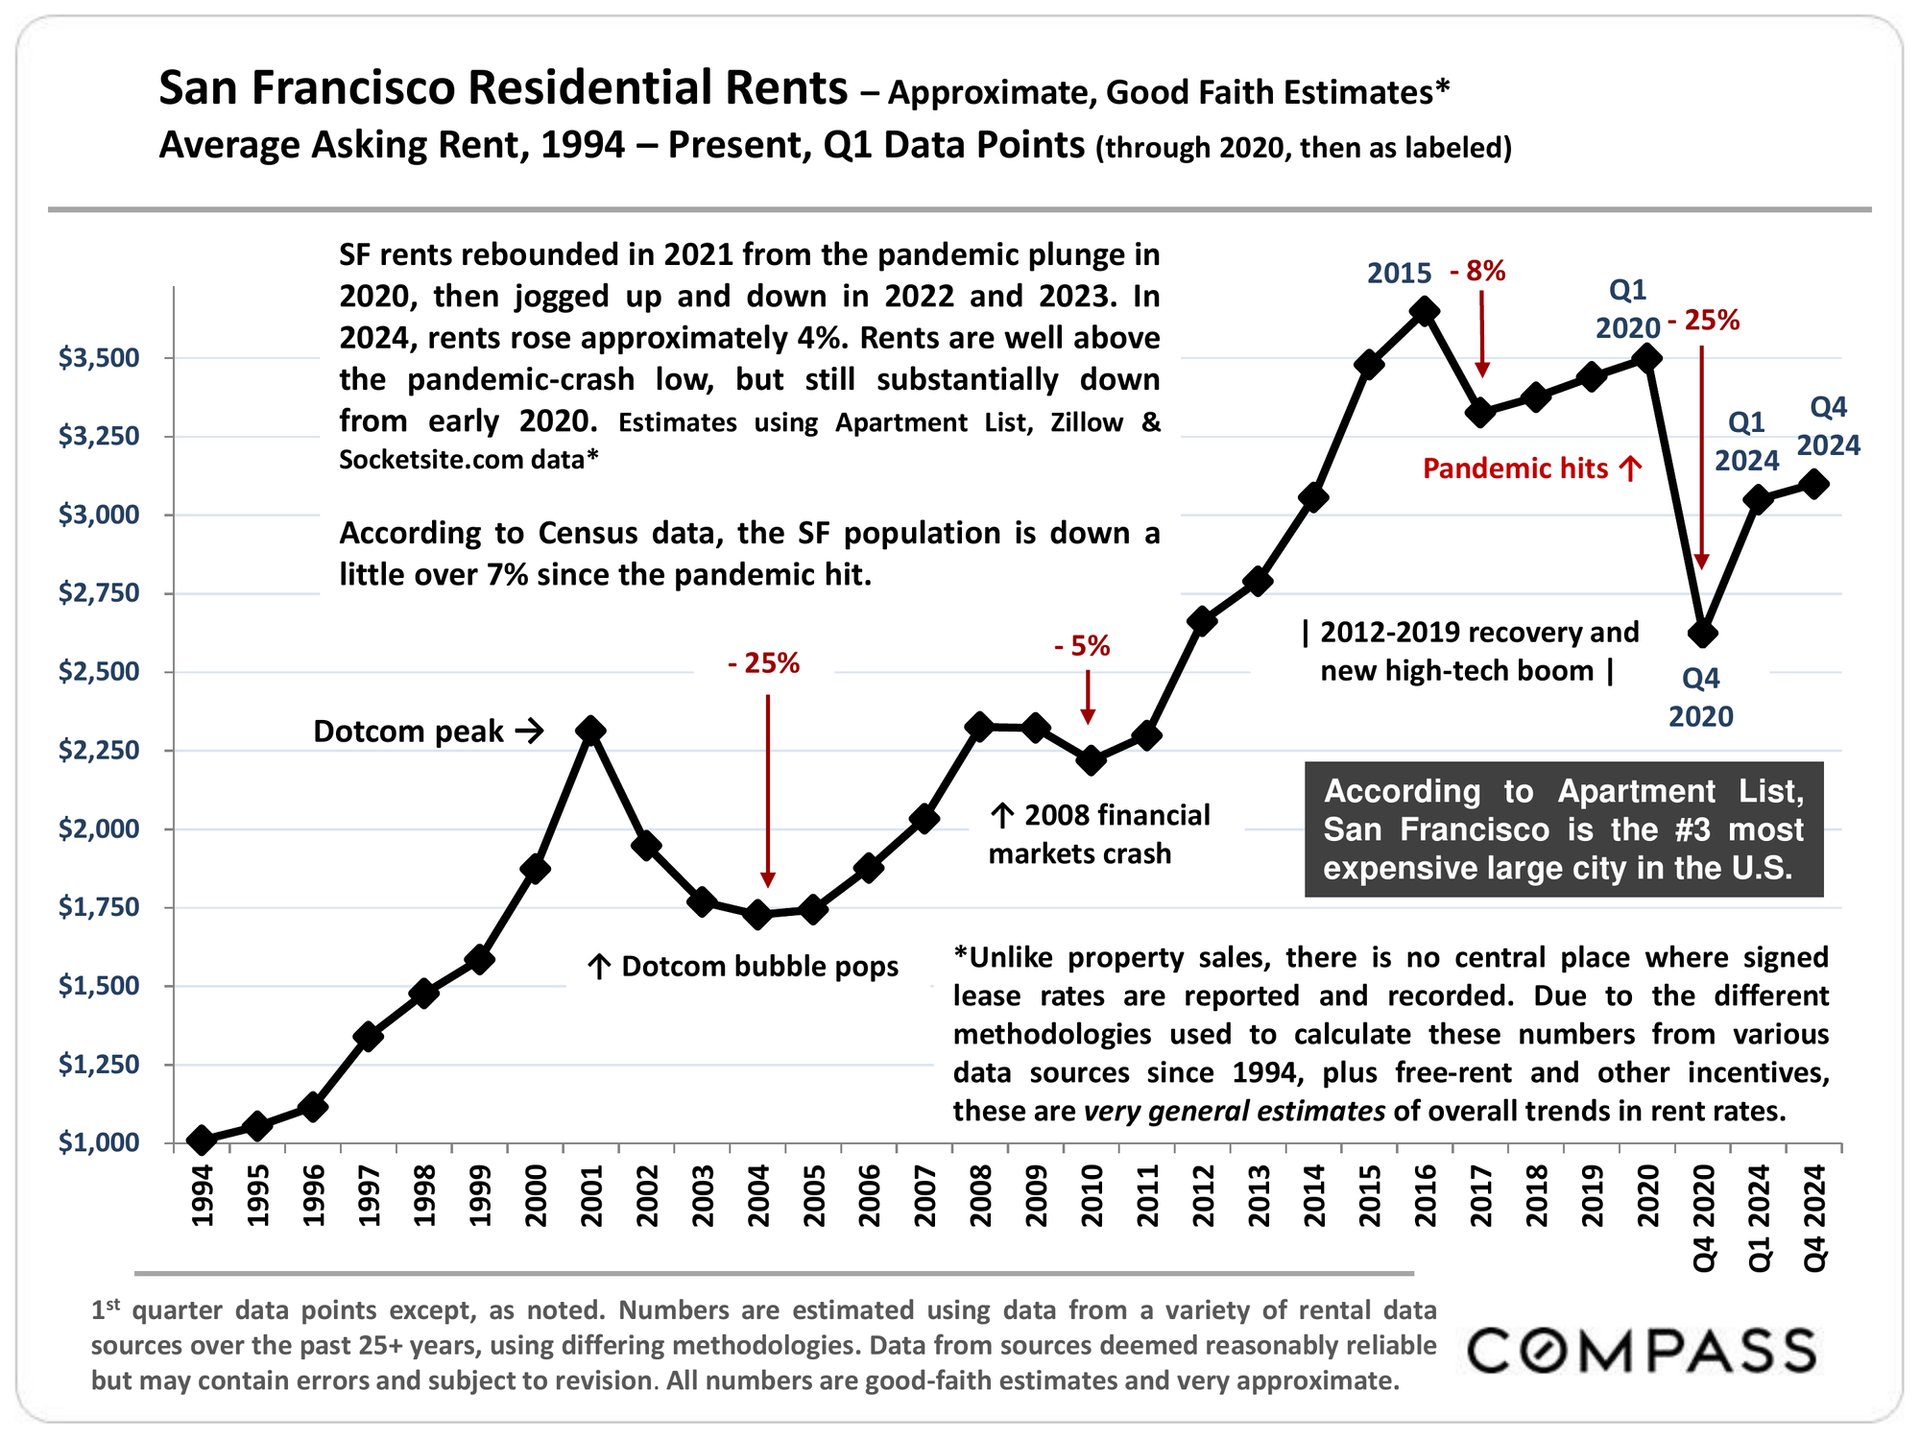
Chart of estimated San Francisco asking rents from 1994 to 2024, showing dot-com and pandemic-era shifts.
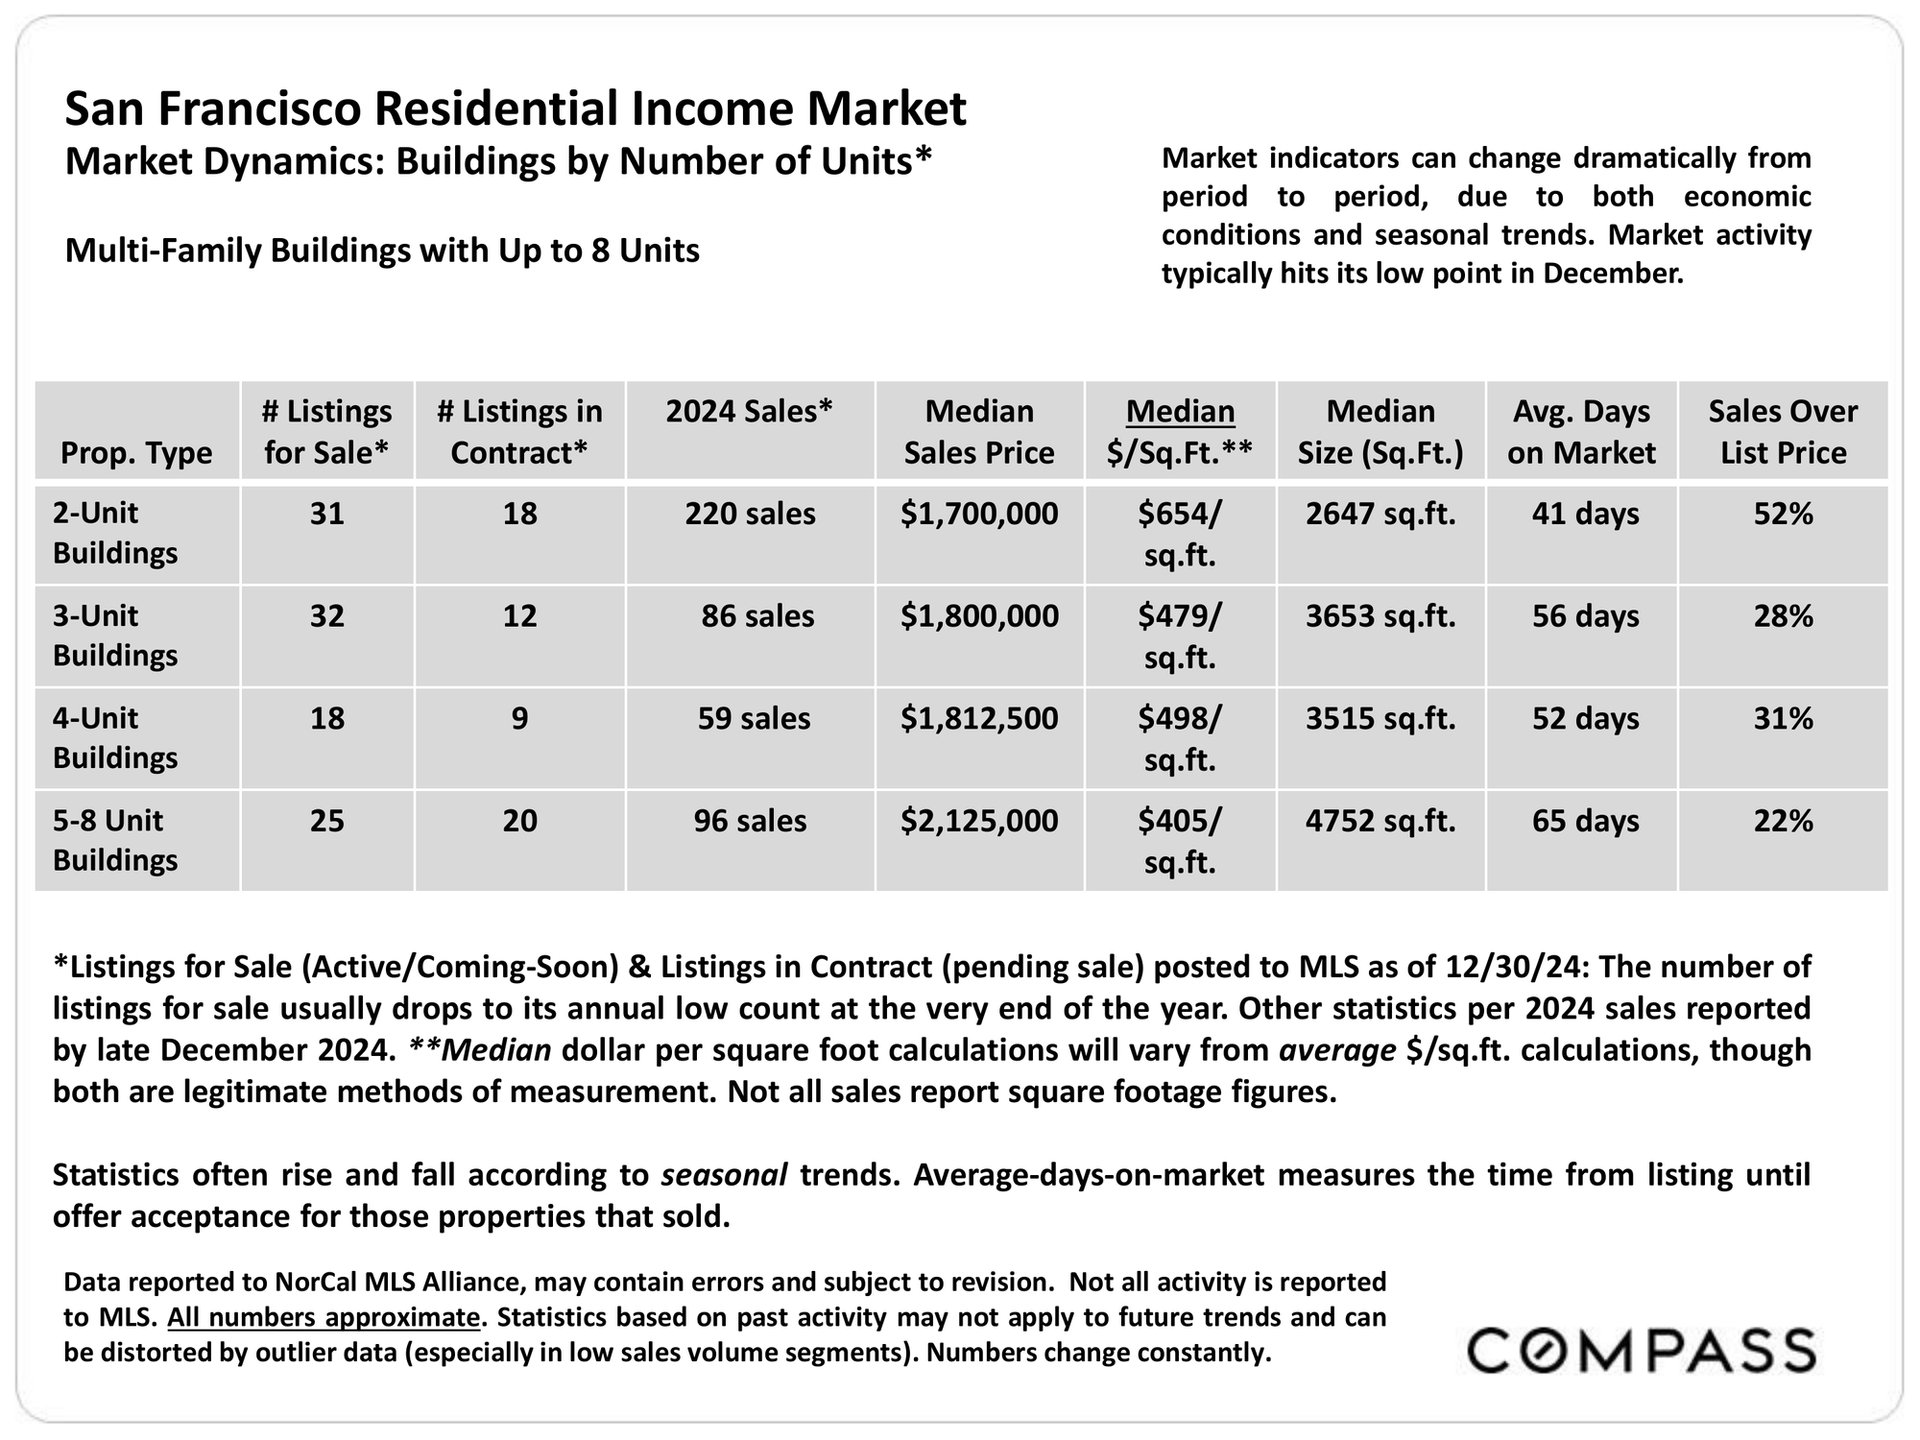
San Francisco multifamily market table comparing listings, 2024 sales, prices, sizes, market time, and over-list sales by building unit count.
Table comparing San Francisco 2-, 3-, and 4-unit residential building values by realtor district.
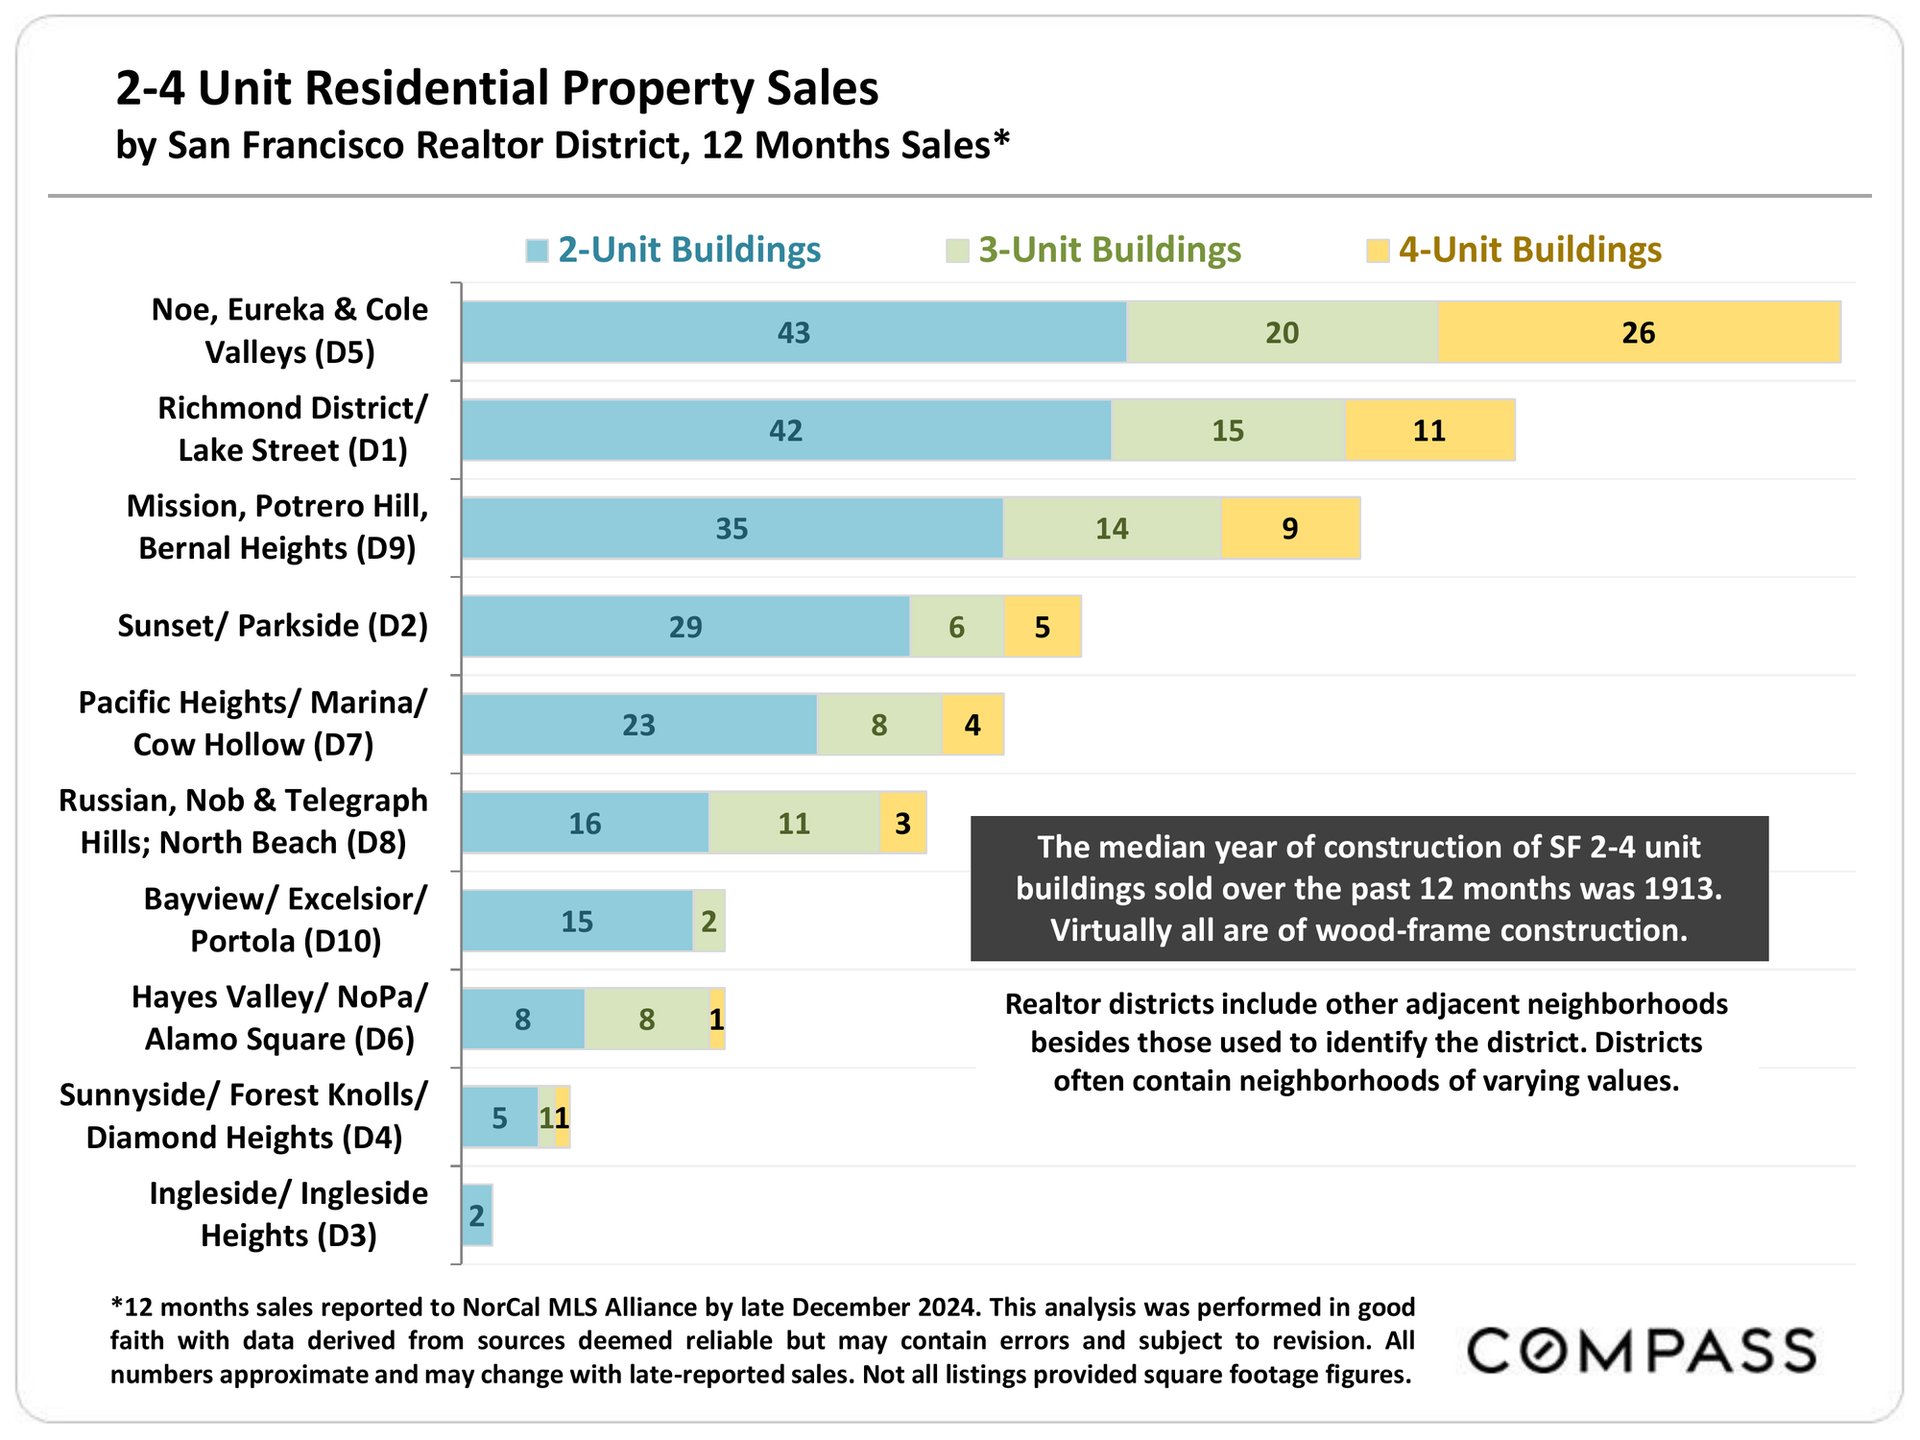
Chart of San Francisco 2–4 unit property sales by realtor district, with Noe, Eureka and Cole Valleys leading.
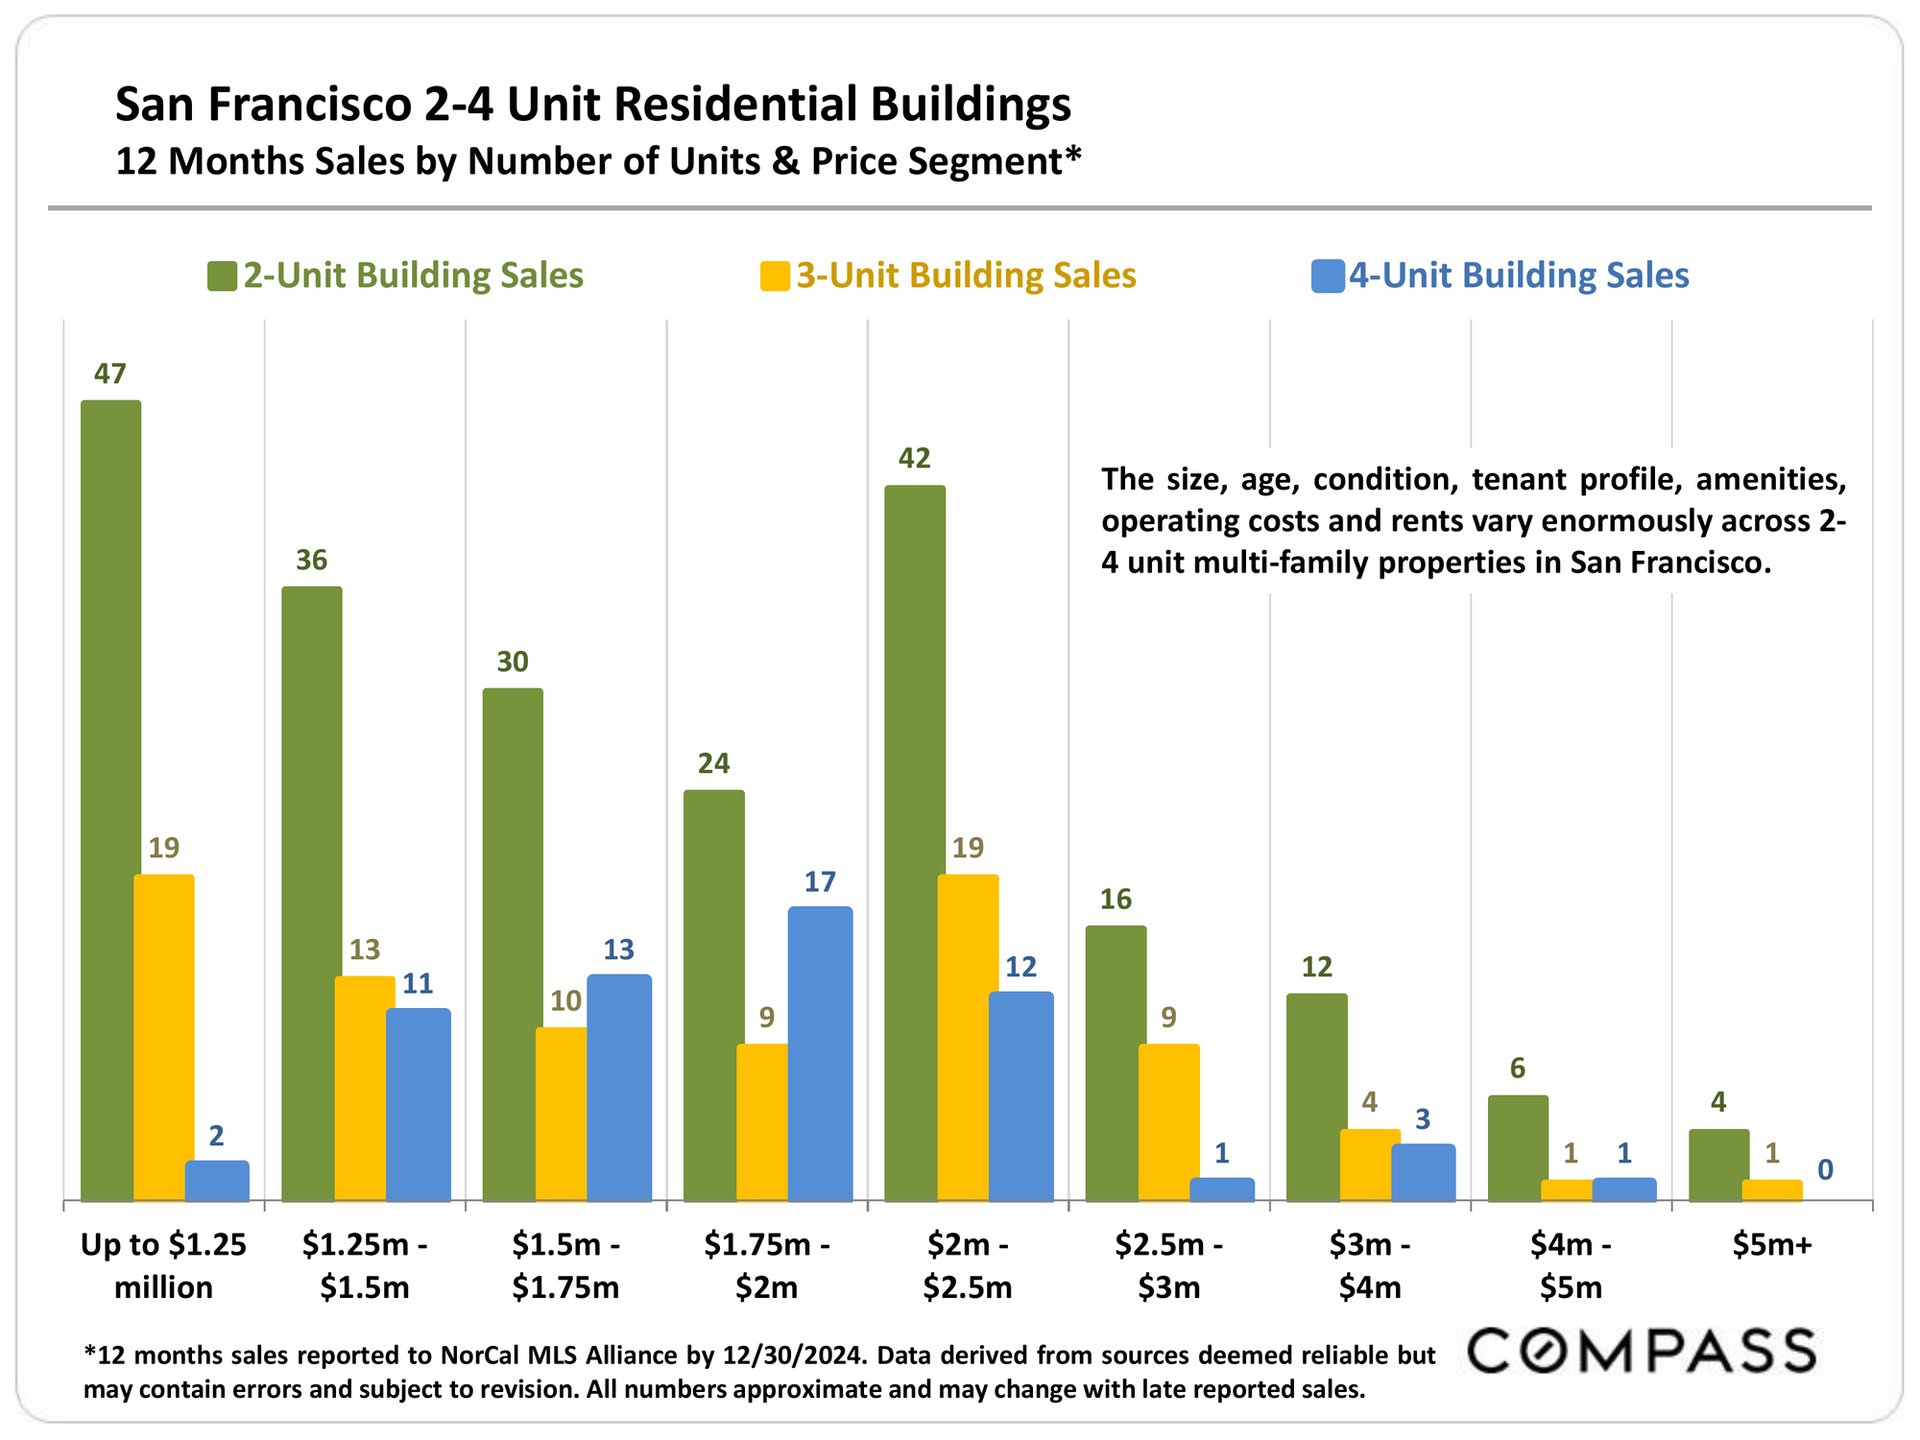
Chart comparing San Francisco 2-, 3-, and 4-unit building sales across nine price ranges.
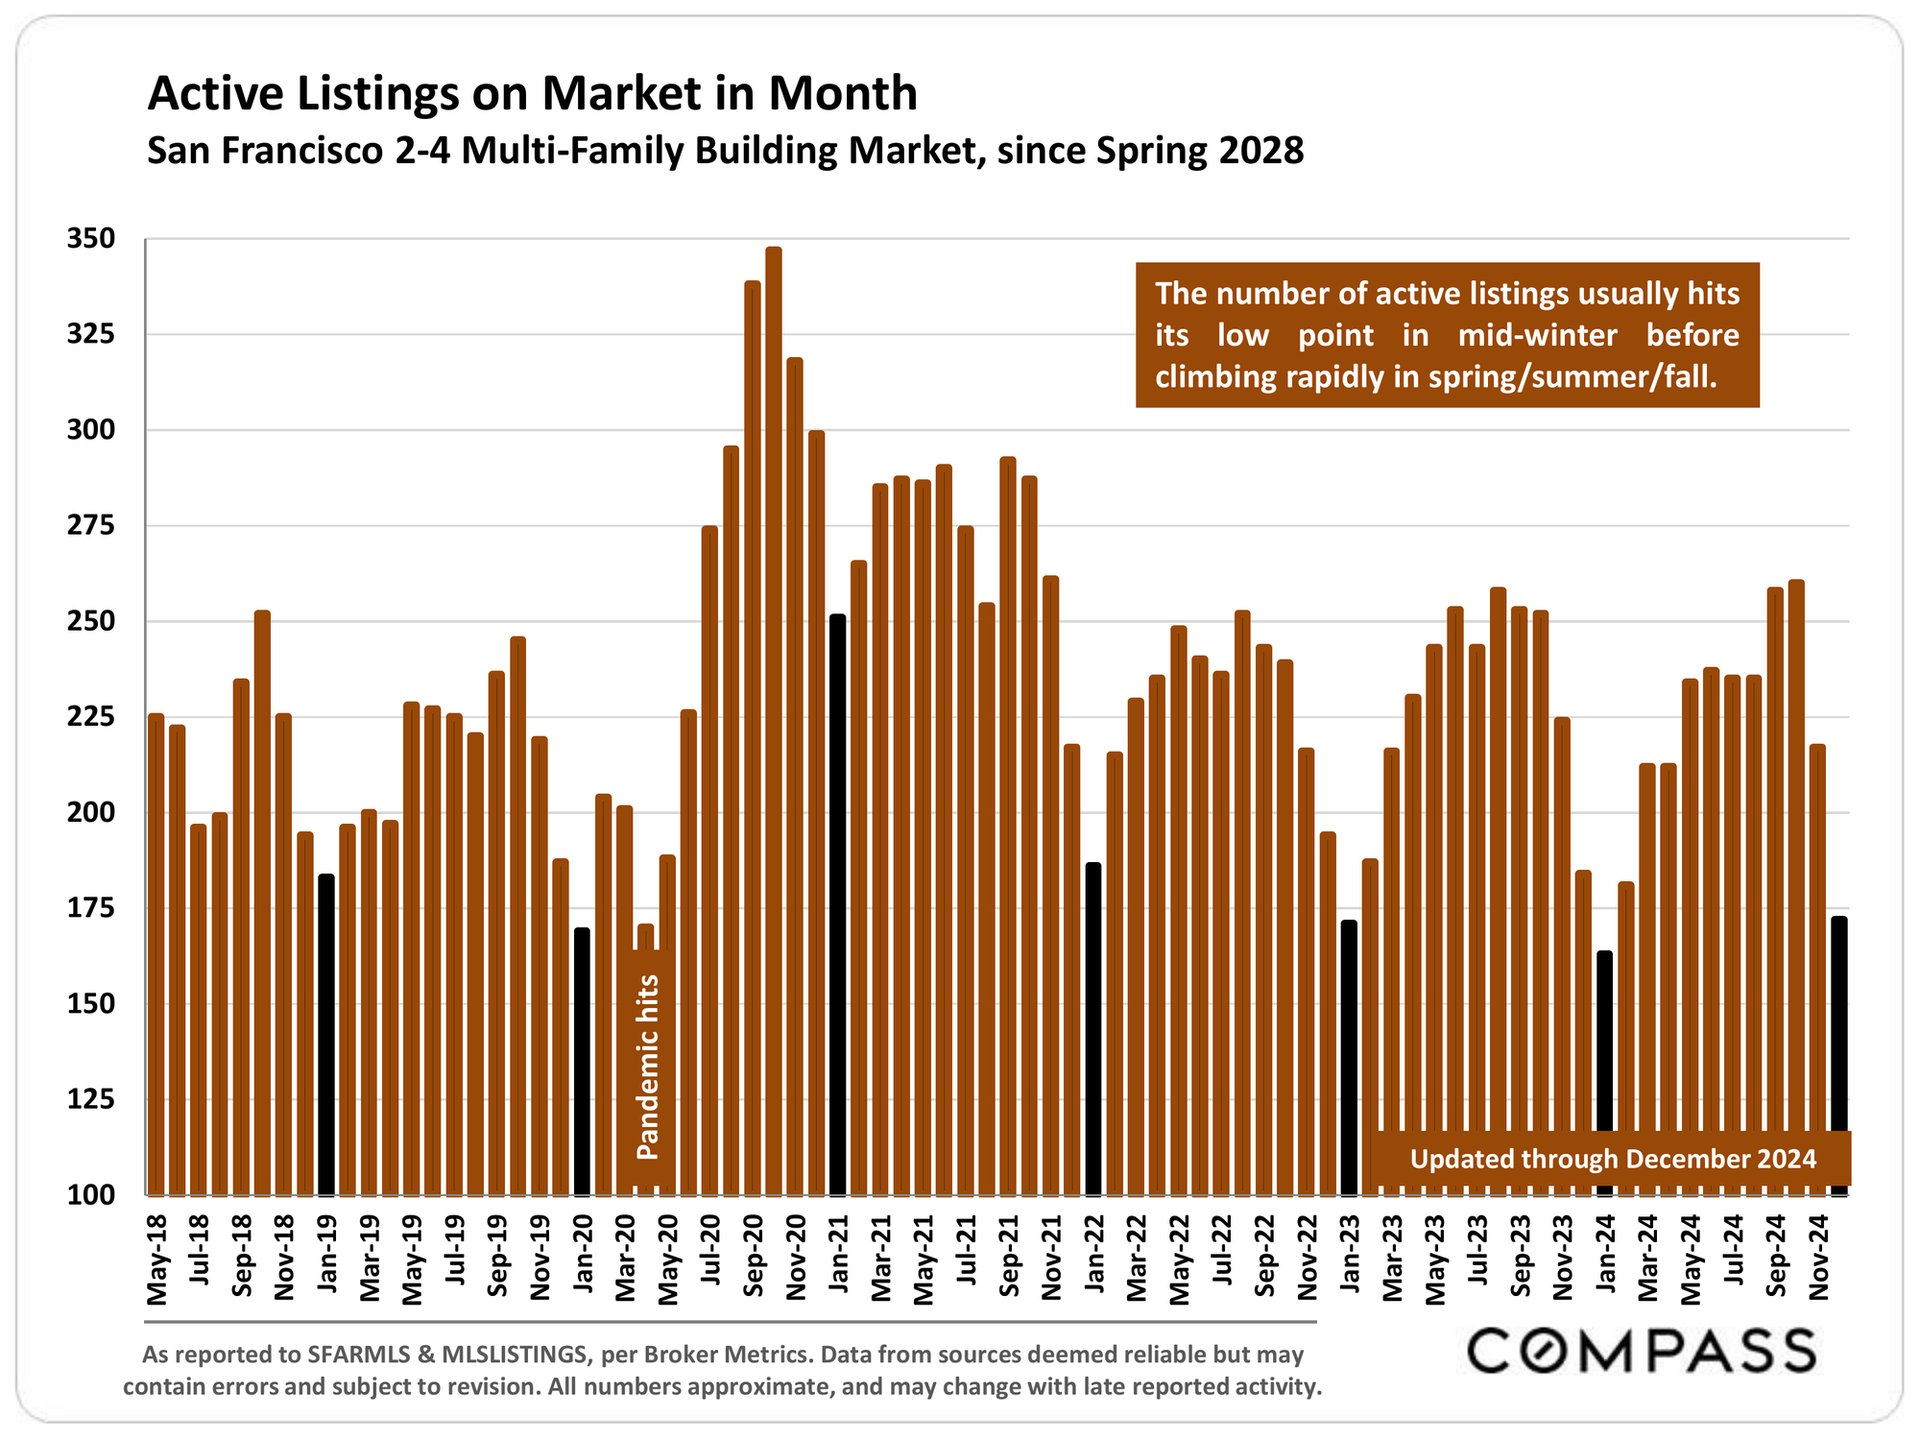
Bar chart of San Francisco 2–4 unit building listings, peaking in 2020 and updated through December 2024.
Chart of San Francisco 2–4 unit building sale prices versus list prices by quarter, 2015–2024, with discounts prevalent since mid-2022.
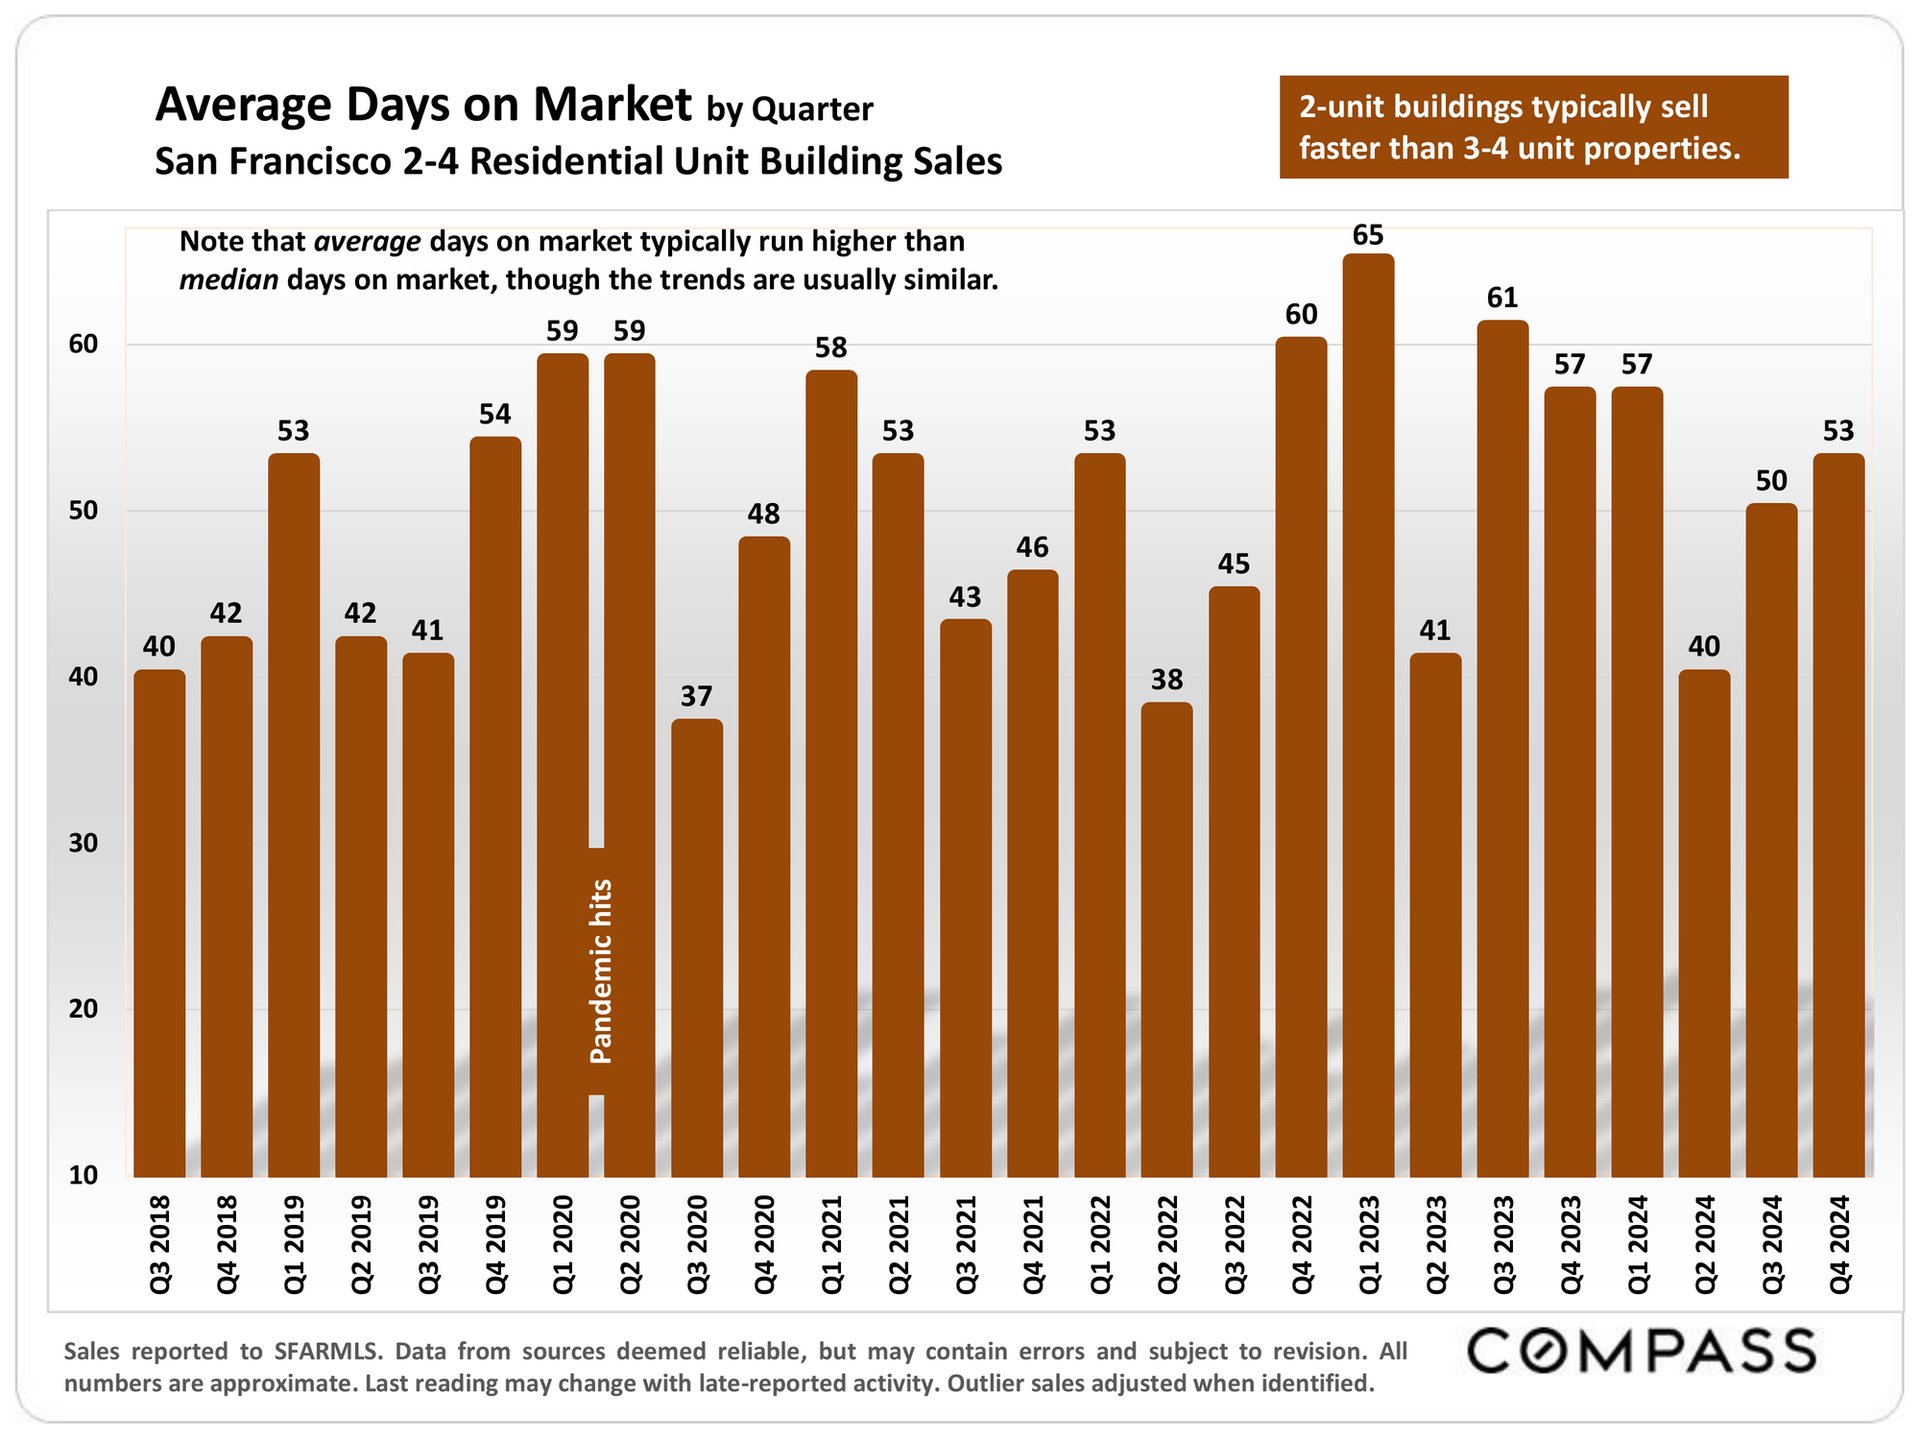
Bar chart of San Francisco 2–4 unit building days on market, quarterly from 2018 to 2024.
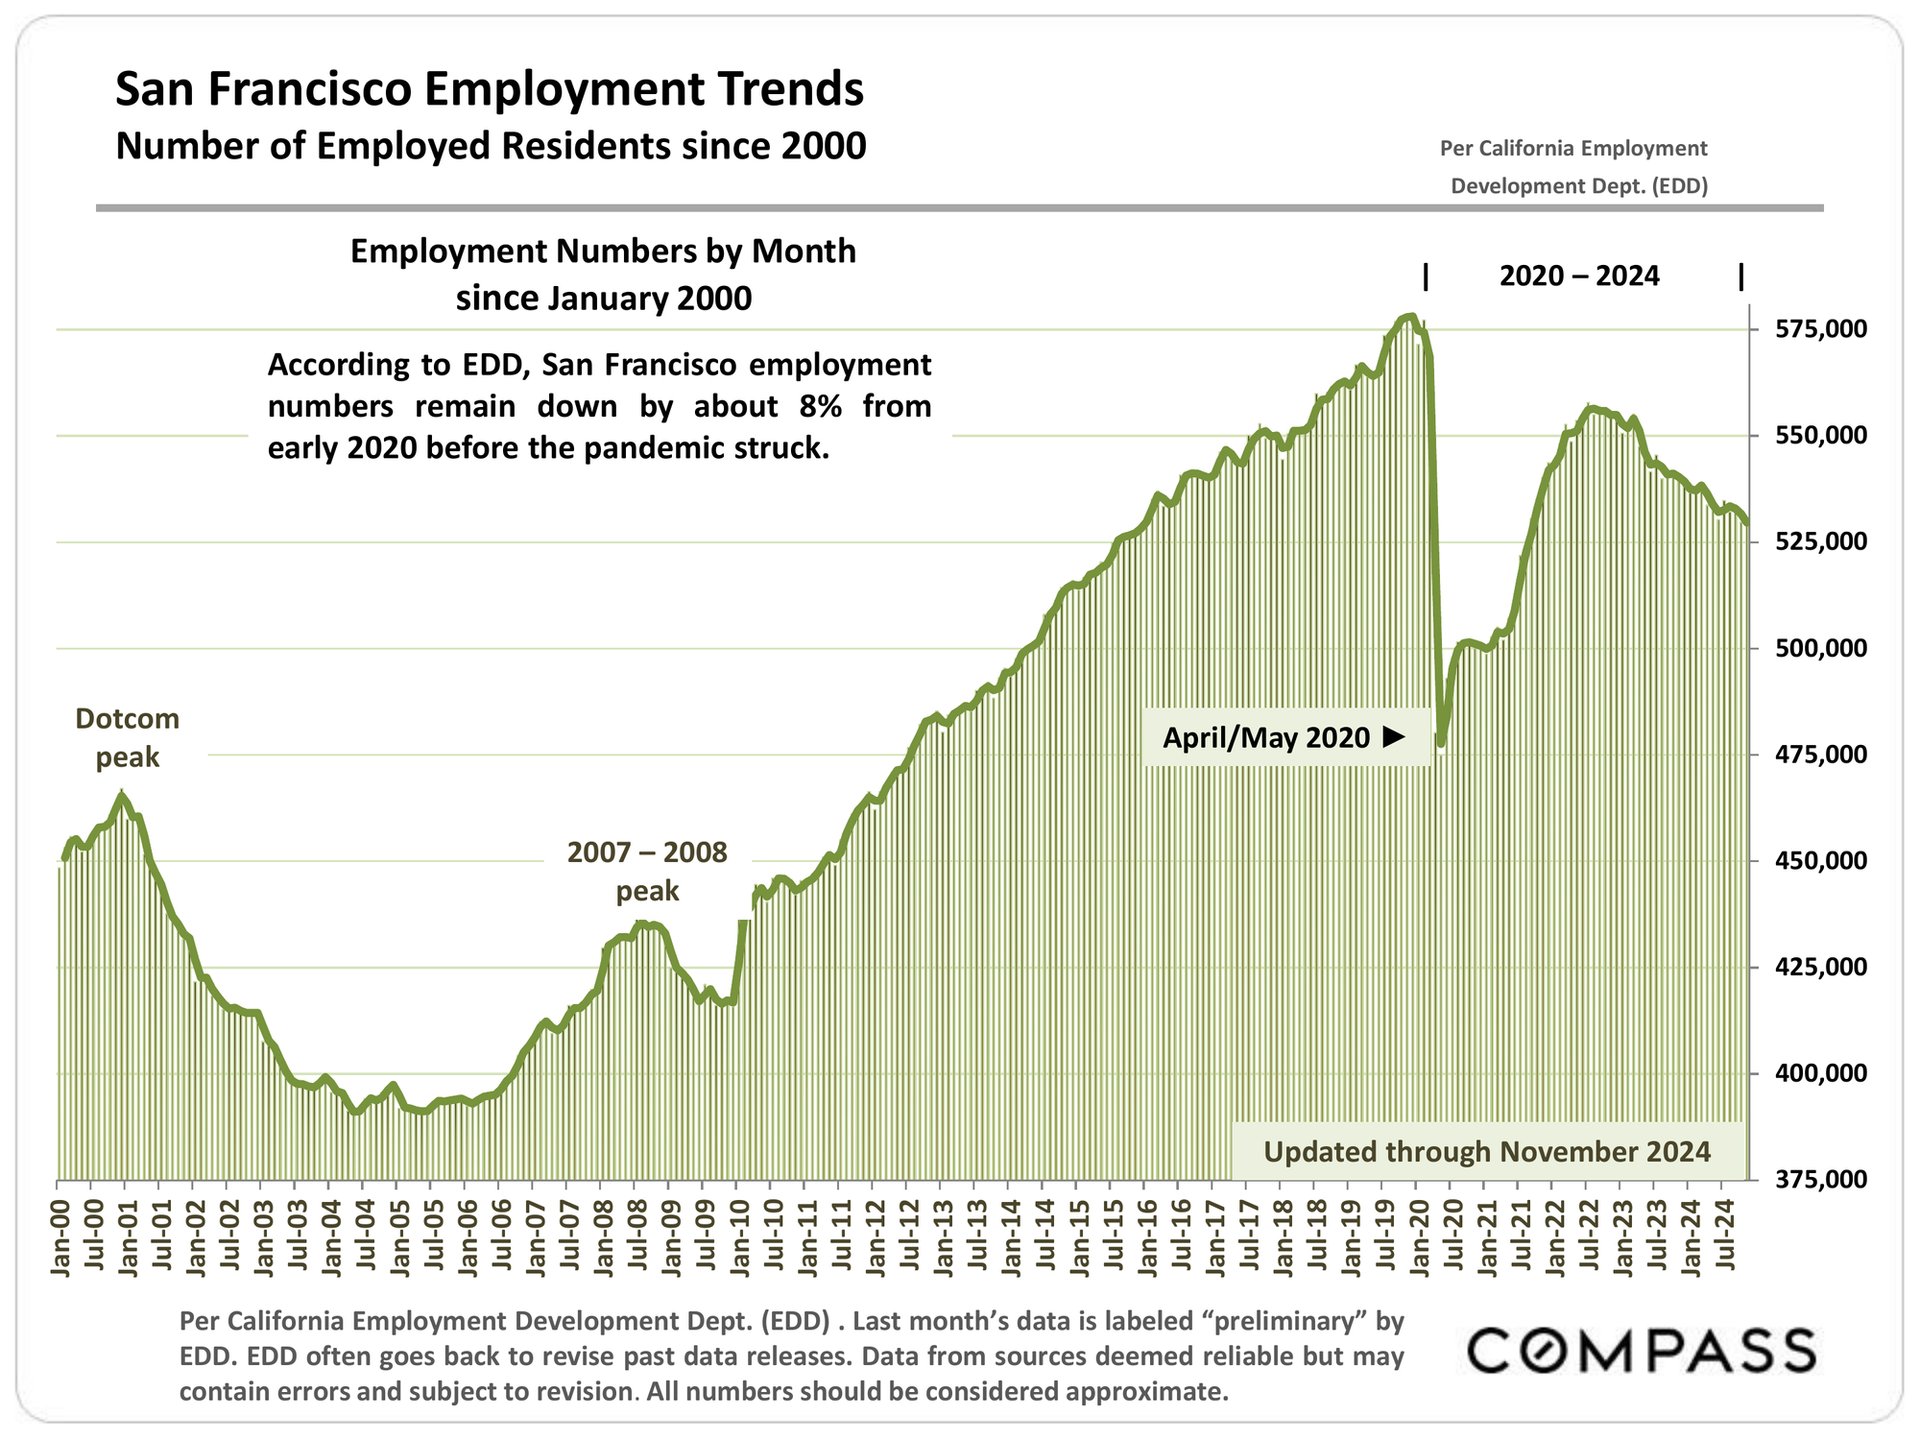
Chart of San Francisco employment from 2000 to 2024, showing a sharp 2020 drop and partial recovery.
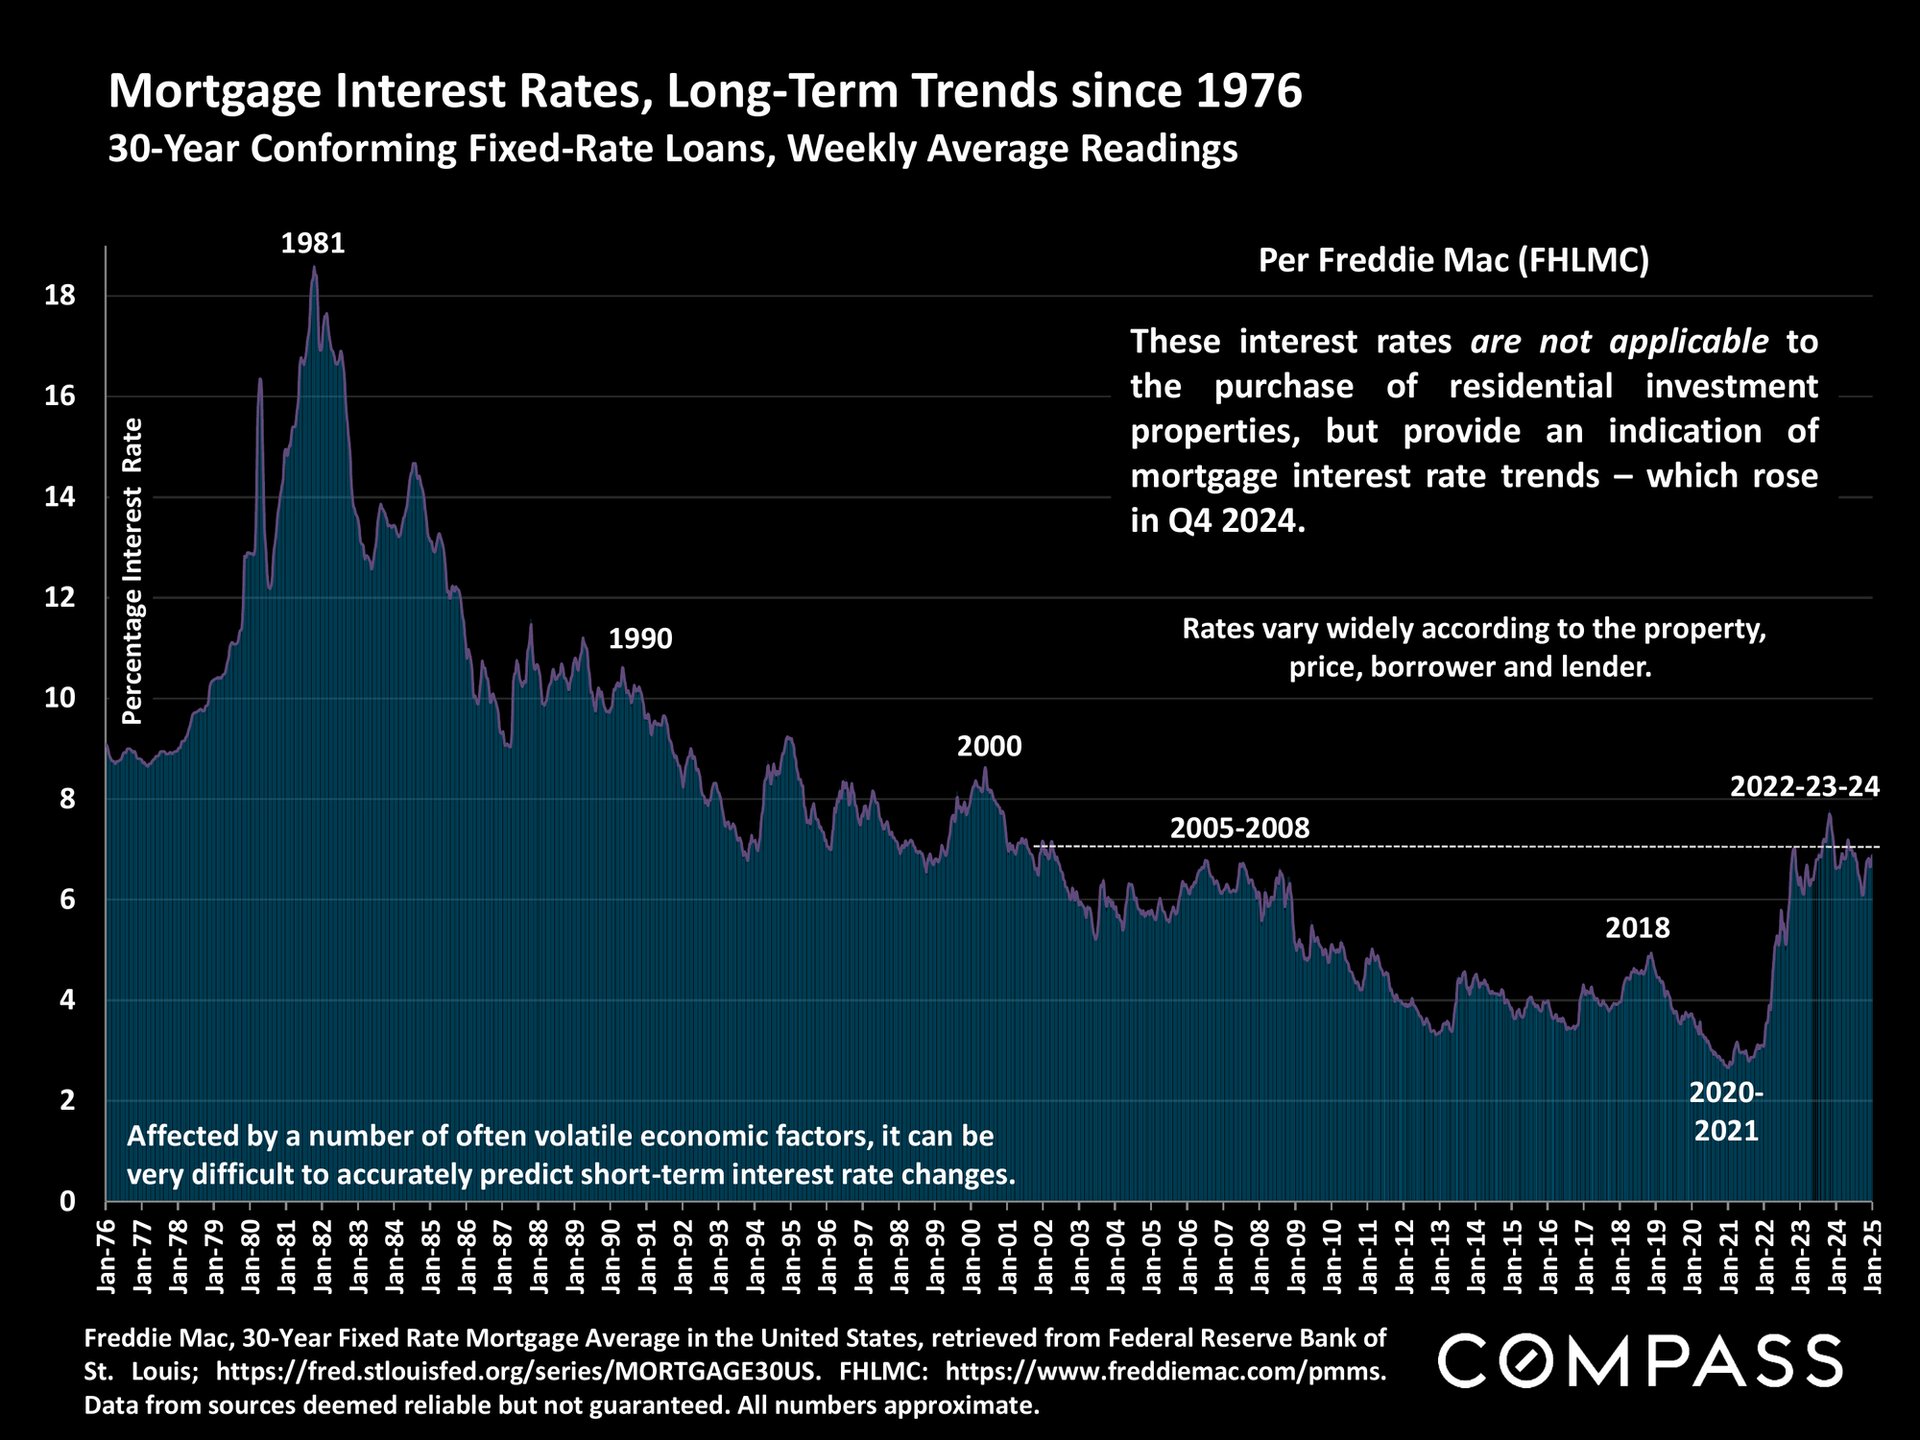
Chart of U.S. 30-year fixed mortgage rates from 1976 to 2025, peaking in 1981 and rising sharply after 2021.
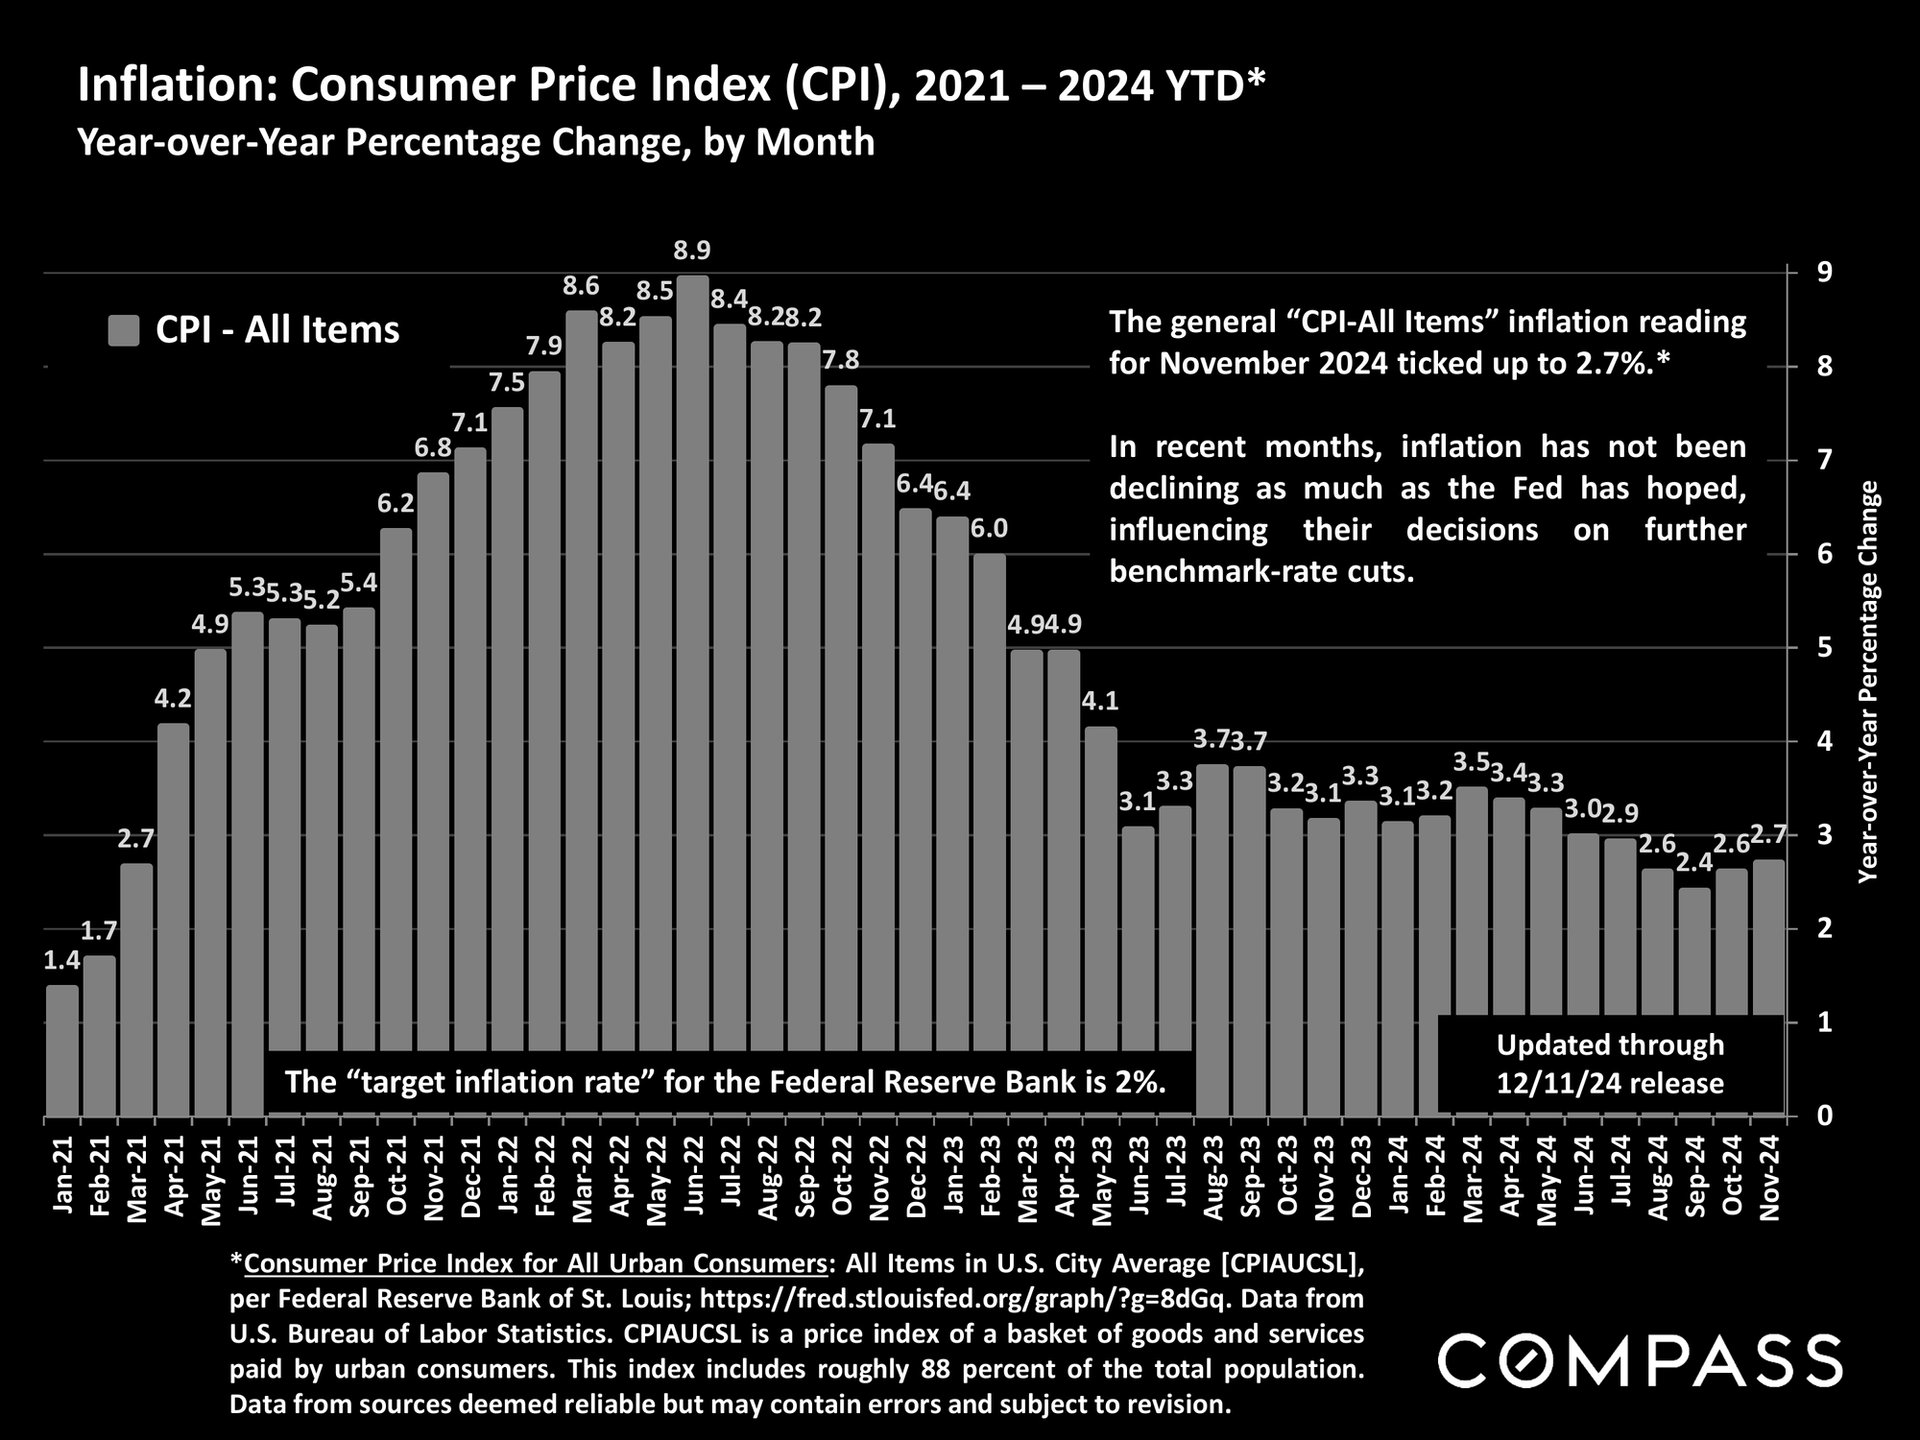
U.S. CPI inflation by month, peaking at 8.9% in June 2022 and reaching 2.7% in November 2024.
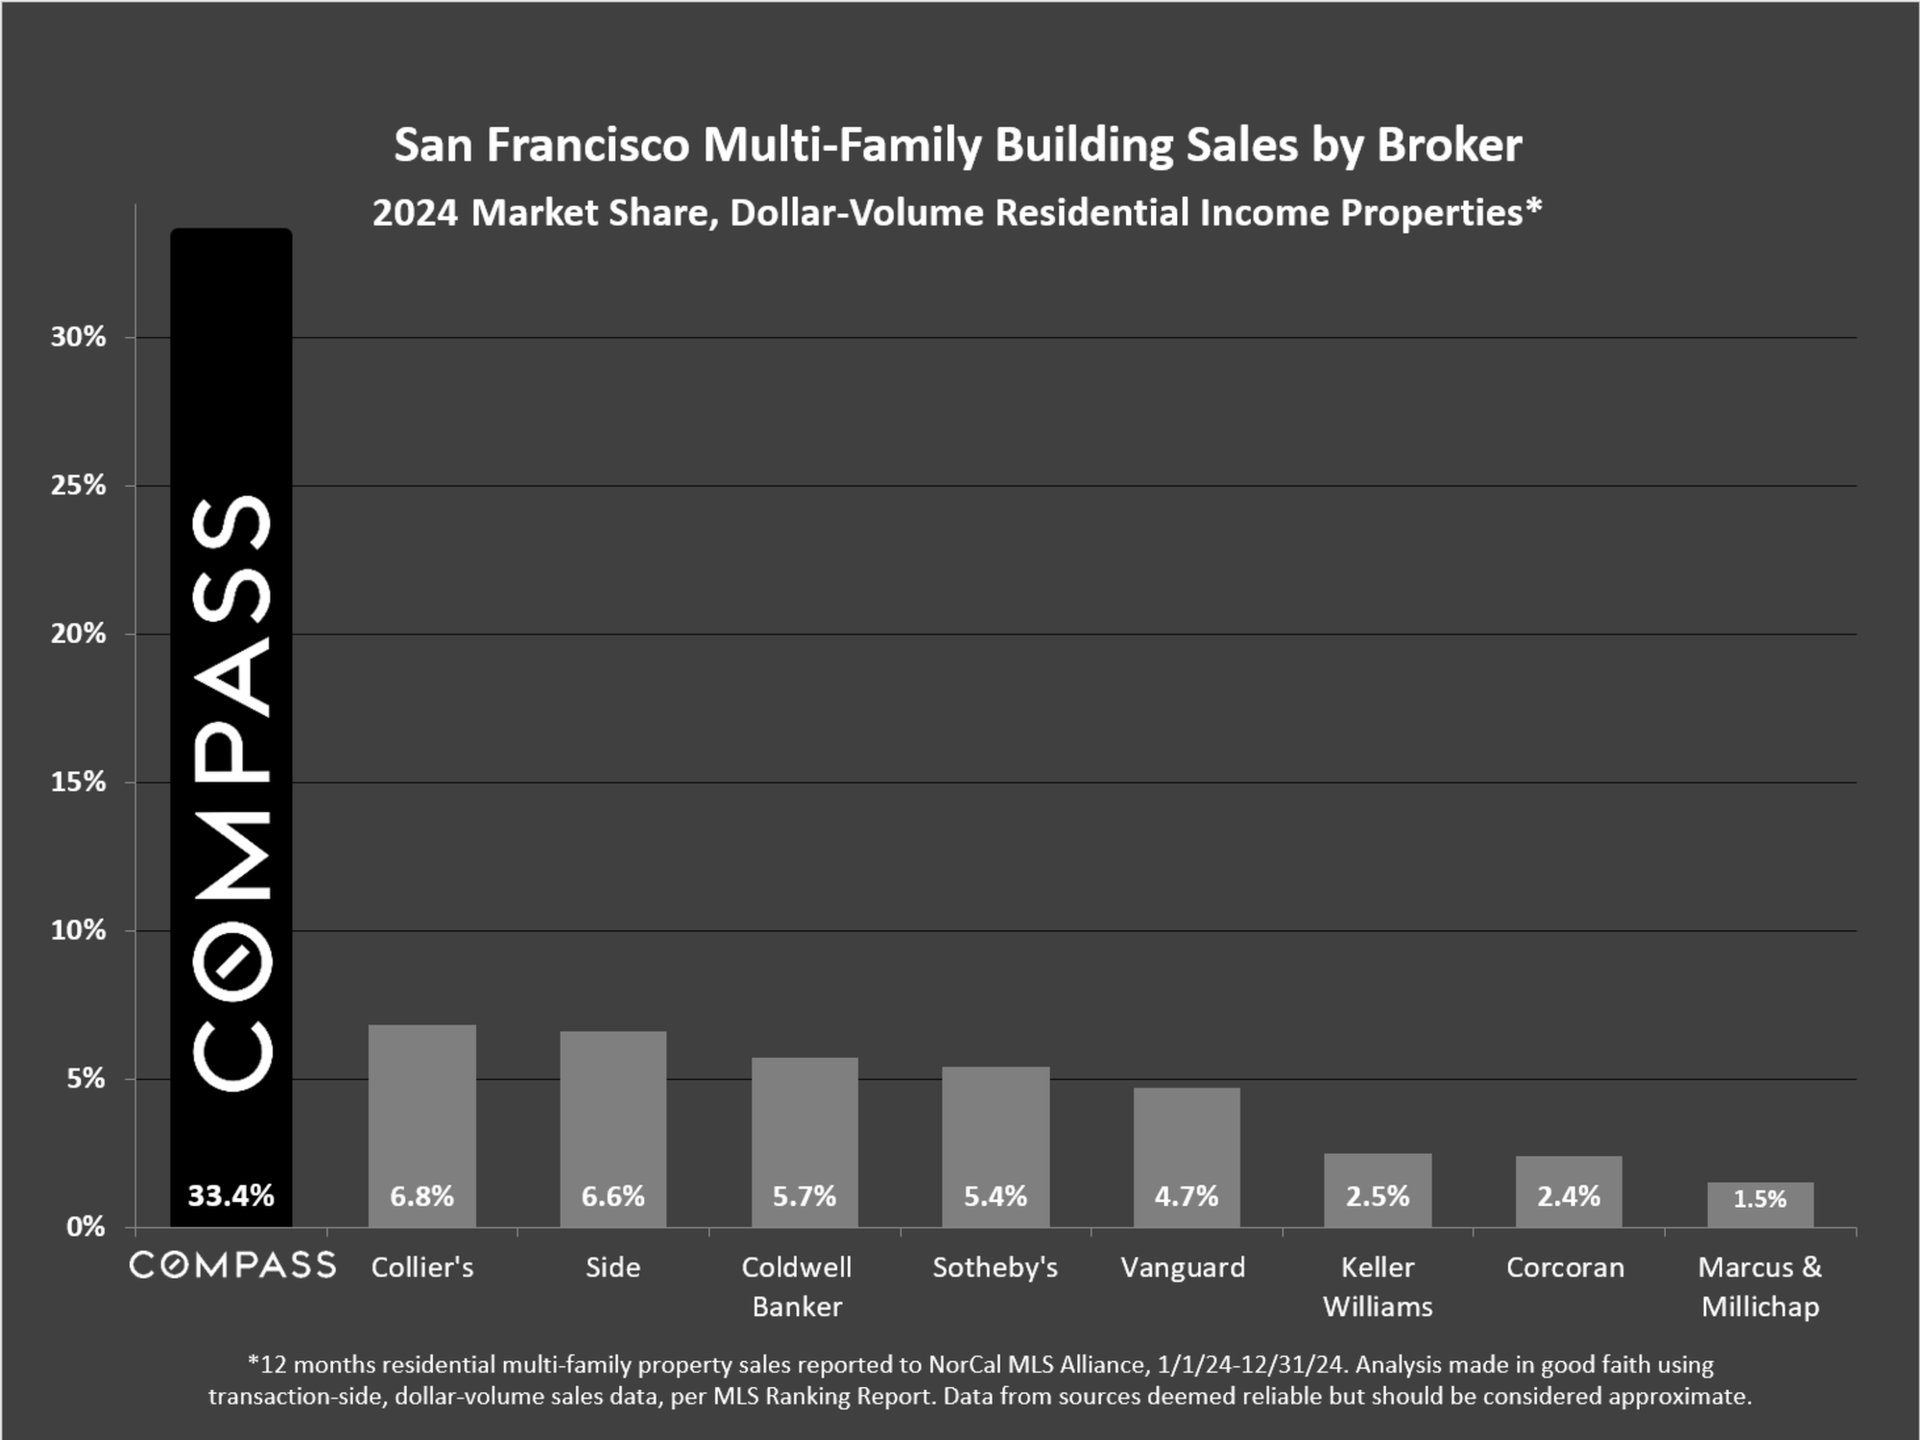
Bar chart of 2024 San Francisco multifamily sales by broker; Compass leads with 33.4% market share.
Bay Area market reports page with a Compass reports link and regional report cards.
Compass report disclaimer covering sales statistics, data limitations, and legal terms.


WORK WITH US

We offer the highest level of service and expertise to our clients. Our team has built a reputation for consistently representing the finest real estate in San Francisco and Napa Valley. Results driven and dedicated to your success, whether buying, selling, renting or investing. Contact us today for a private consultation.

Contact Us